Preprint
Article

Integrated Multi-Omics Analyses Reveal That Autophagy Mediated Cellular Metabolism Is Required for the Initiation of Pollen Germination

Altmetrics

Downloads

88

Views

29

Comments

0

A peer-reviewed article of this preprint also exists.

Submitted:

01 September 2023

Posted:

05 September 2023

You are already at the latest version

Alerts
Abstract
Autophagy is an evolutionarily conserved mechanism for degrading and recycling different cellular components in both normal development and stress conditions. Our recent research demonstrated that autophagy-mediated compartmental cytoplasmic deletion is essential for pollen germination. However, how autophagy regulates pollen germination to ensure its fertility remains largely unknown. Here, we applied multi-omic analyses to investigate the downstream pathways of autophagy in the process of pollen germination. Although ATG2 and ATG5 play similar roles in regulating pollen germination, high-throughput transcriptomic analysis reveals that silencing ATG5 has greater impact on the transcriptome than silencing ATG2. Cross-comparisons of transcriptome and proteome analysis reveal that gene expression at mRNA level and protein level are differentially affected by autophagy. Furthermore, high-throughput metabolomics analysis demonstrates that pathways related amino acid metabolism and aminoacyl-tRNA biosynthesis can be affected by both ATG2 and ATG5 silencing. Collectively, our multi-omic analyses reveal a central role of autophagy in cellular metabolism, which is critical for the initiation of pollen germination and the guarantee of pollen fertility.
Keywords: 
Subject: Biology and Life Sciences  -   Plant Sciences

1. Introduction

Autophagy is an evolutionarily conserved mechanism for degrading cellular components to recycle nutrients or clear unwanted materials in eukaryotes. Macroautophagy (referred to hereafter as autophagy) is the major and best-studied type of autophagy, during which cellular materials was engulfed and the sequestered double membrane-bound autophagosomes, which are then delivered to the lysosome or vacuole for degradation by proteases and hydrolases. As in yeast and mammal, plant autophagy is tightly controlled by numerous autophagy-related (ATG) proteins, which were classified into five functional complexes including regulation complex, ATG9 complex, ubiquitin-like ATG12 and ATG5 conjugation pathway, Phosphoinositide-3-kinase (PI3K) complex and Ubiquitin-like ATG8 and PE conjugation pathway [1]. Recent researches demonstrated that various organelles including peroxisomes[2], chloroplasts [3] and various macromolecular components such as starch [4] and lipids [5], could be degraded through autophagy, which is critical for plant growth and development in both stress and normal conditions.
However, the molecular and metabolic pathways of autophagy in these physiological processes are still largely unknown. Omics studies have been performed to investigate the role of autophagy on cellular metabolism using Arabidopsis atg mutants grown under normal and nutrient starvation conditions, indicating central role of autophagy on catabolism and lipid metabolism. Metabolomics studies revealed that the levels of free amino acids and secondary metabolites were significantly alternated. Altered lipid levels were also revealed in atg mutants through lipidomic analyses [5]. The role of autophagy on lipid metabolism was also supported by proteomic analysis. Proteomic analysis revealed increased protein levels of peroxisome and ER proteins were involved in long chain fatty acid synthesis and β-oxidation increased in atg5 mutants [6]. Multi-omics studies on maize atg12 mutants grown under nitrogen-rich and -deficient conditions further confirmed that the impact of autophagy on cellular metabolism. The levels of metabolites related to lipid/fatty acid metabolism and secondary metabolites associated with flavonoids, anthocyanins and antioxidants were significantly changed in atg12 mutant. Several cellular organelles including peroxisomes, Golgi bodies, ER, ribosomes and protein complexes such as proteasome were targeted for autophagic clearance [7].
Our recent study revealed that autophagy-mediated compartmental cytoplasm clearance is critical for pollen germination We found that autophagic activities is dramatically increased during the initial stage of pollen germination, and inhibition of autophagy blocked pollen germination and cytoplasmic deletion in germination aperture, unveiling a novel compartmentalized autophagy controlling in male fertility via cytoplasmic clearance. Lipidomic analyses revealed that the profiles of stored and signaling lipids were alternated in autophagy-deficient pollen [8]. However, downstream pathways of autophagy in regulating pollen germination are still waiting to be elucidated. To gain insight into the overview of the effects of autophagy on the regulation of pollen germination in tobacco, we undertook a comprehensive metabolomics, proteomic and transcriptomic analyses of ATG2 and ATG5- silenced pollen, which allow us to reveal connections between autophagy and downstream pathways. When combined the results from the metabolomics, lipidomics, transcriptomics and proteomics, we found that pathways related to amino acid and lipid catabolic processes during the initiation stages of pollen were strongly influenced by autophagy, that is critical for promoting pollen germination and guaranteeing pollen fertility.

2. Results

2.1. Global impact of silencing of ATG2 and ATG5 on pollen transcriptome

More than 30 ATG genes have been identified in different plants [9,10,11], these ATG genes could be divided into several functional groups. Our recent studies demonstrated that silencing of ATG2 or ATG5, which are in different ATG function complexes and execute distinct roles in autophagosome formation, could lead to the defects in pollen germination [8]. To examine how autophagy impacts pollen germination, we first investigate the impact of silencing of ATG2 and ATG5 on pollen transcriptome. Pollen from wild type (WT), ATG2- and ATG5- silenced plants were collected for RNA sequencing (RNA-seq). Three independent biological replicates for each genotype were performed. Thus, we constructed 9 RNA-Seq libraries and generated over 20 million read pairs for each library. After RNA-seq quality assessment, the clean reads of each sample were then mapped onto the tobacco genome and reference transcripts (Ntab-TN90 reference Annotation Release 100), and then 38,000–43,000 genes (fragments per kilobase of transcript per million mapped reads [FPKM] > 0) were detected in different samples (Figure 1A and Table S1). Overall, the detected genes from the same genotype but different biological repeats were highly correlated (r ≥ 0.98; Figure S1), indicating that our transcriptome data are of high quality and reliable for subsequent analysis.
To compare the transcriptome of WT, ATG2- and ATG5- silenced pollen, RNA-seq data were subjected to principal component analysis (PCA). The results revealed that PC1 could be used to efficiently separate ATG5 group from WT and ATG2 group, but not separate ATG2 from WT. Whereas ATG2 group was able to be distinguished from WT when using both PC1 and PC2 (Figure 1B). To further access the impact of silencing of ATG2 and ATG5 on the pollen transcriptome, pairwise correlations were analyzed. Consistent with PCA analysis results, the transcriptome of ATG2-silenced pollen was clustered with WT, but away from the ATG5, suggesting that silencing of ATG5 has strong influences on the pollen transcriptome than silencing of ATG2 (Figure 1C).

2.2. Different impact of silencing of ATG2 and ATG5 on pollen transcriptome

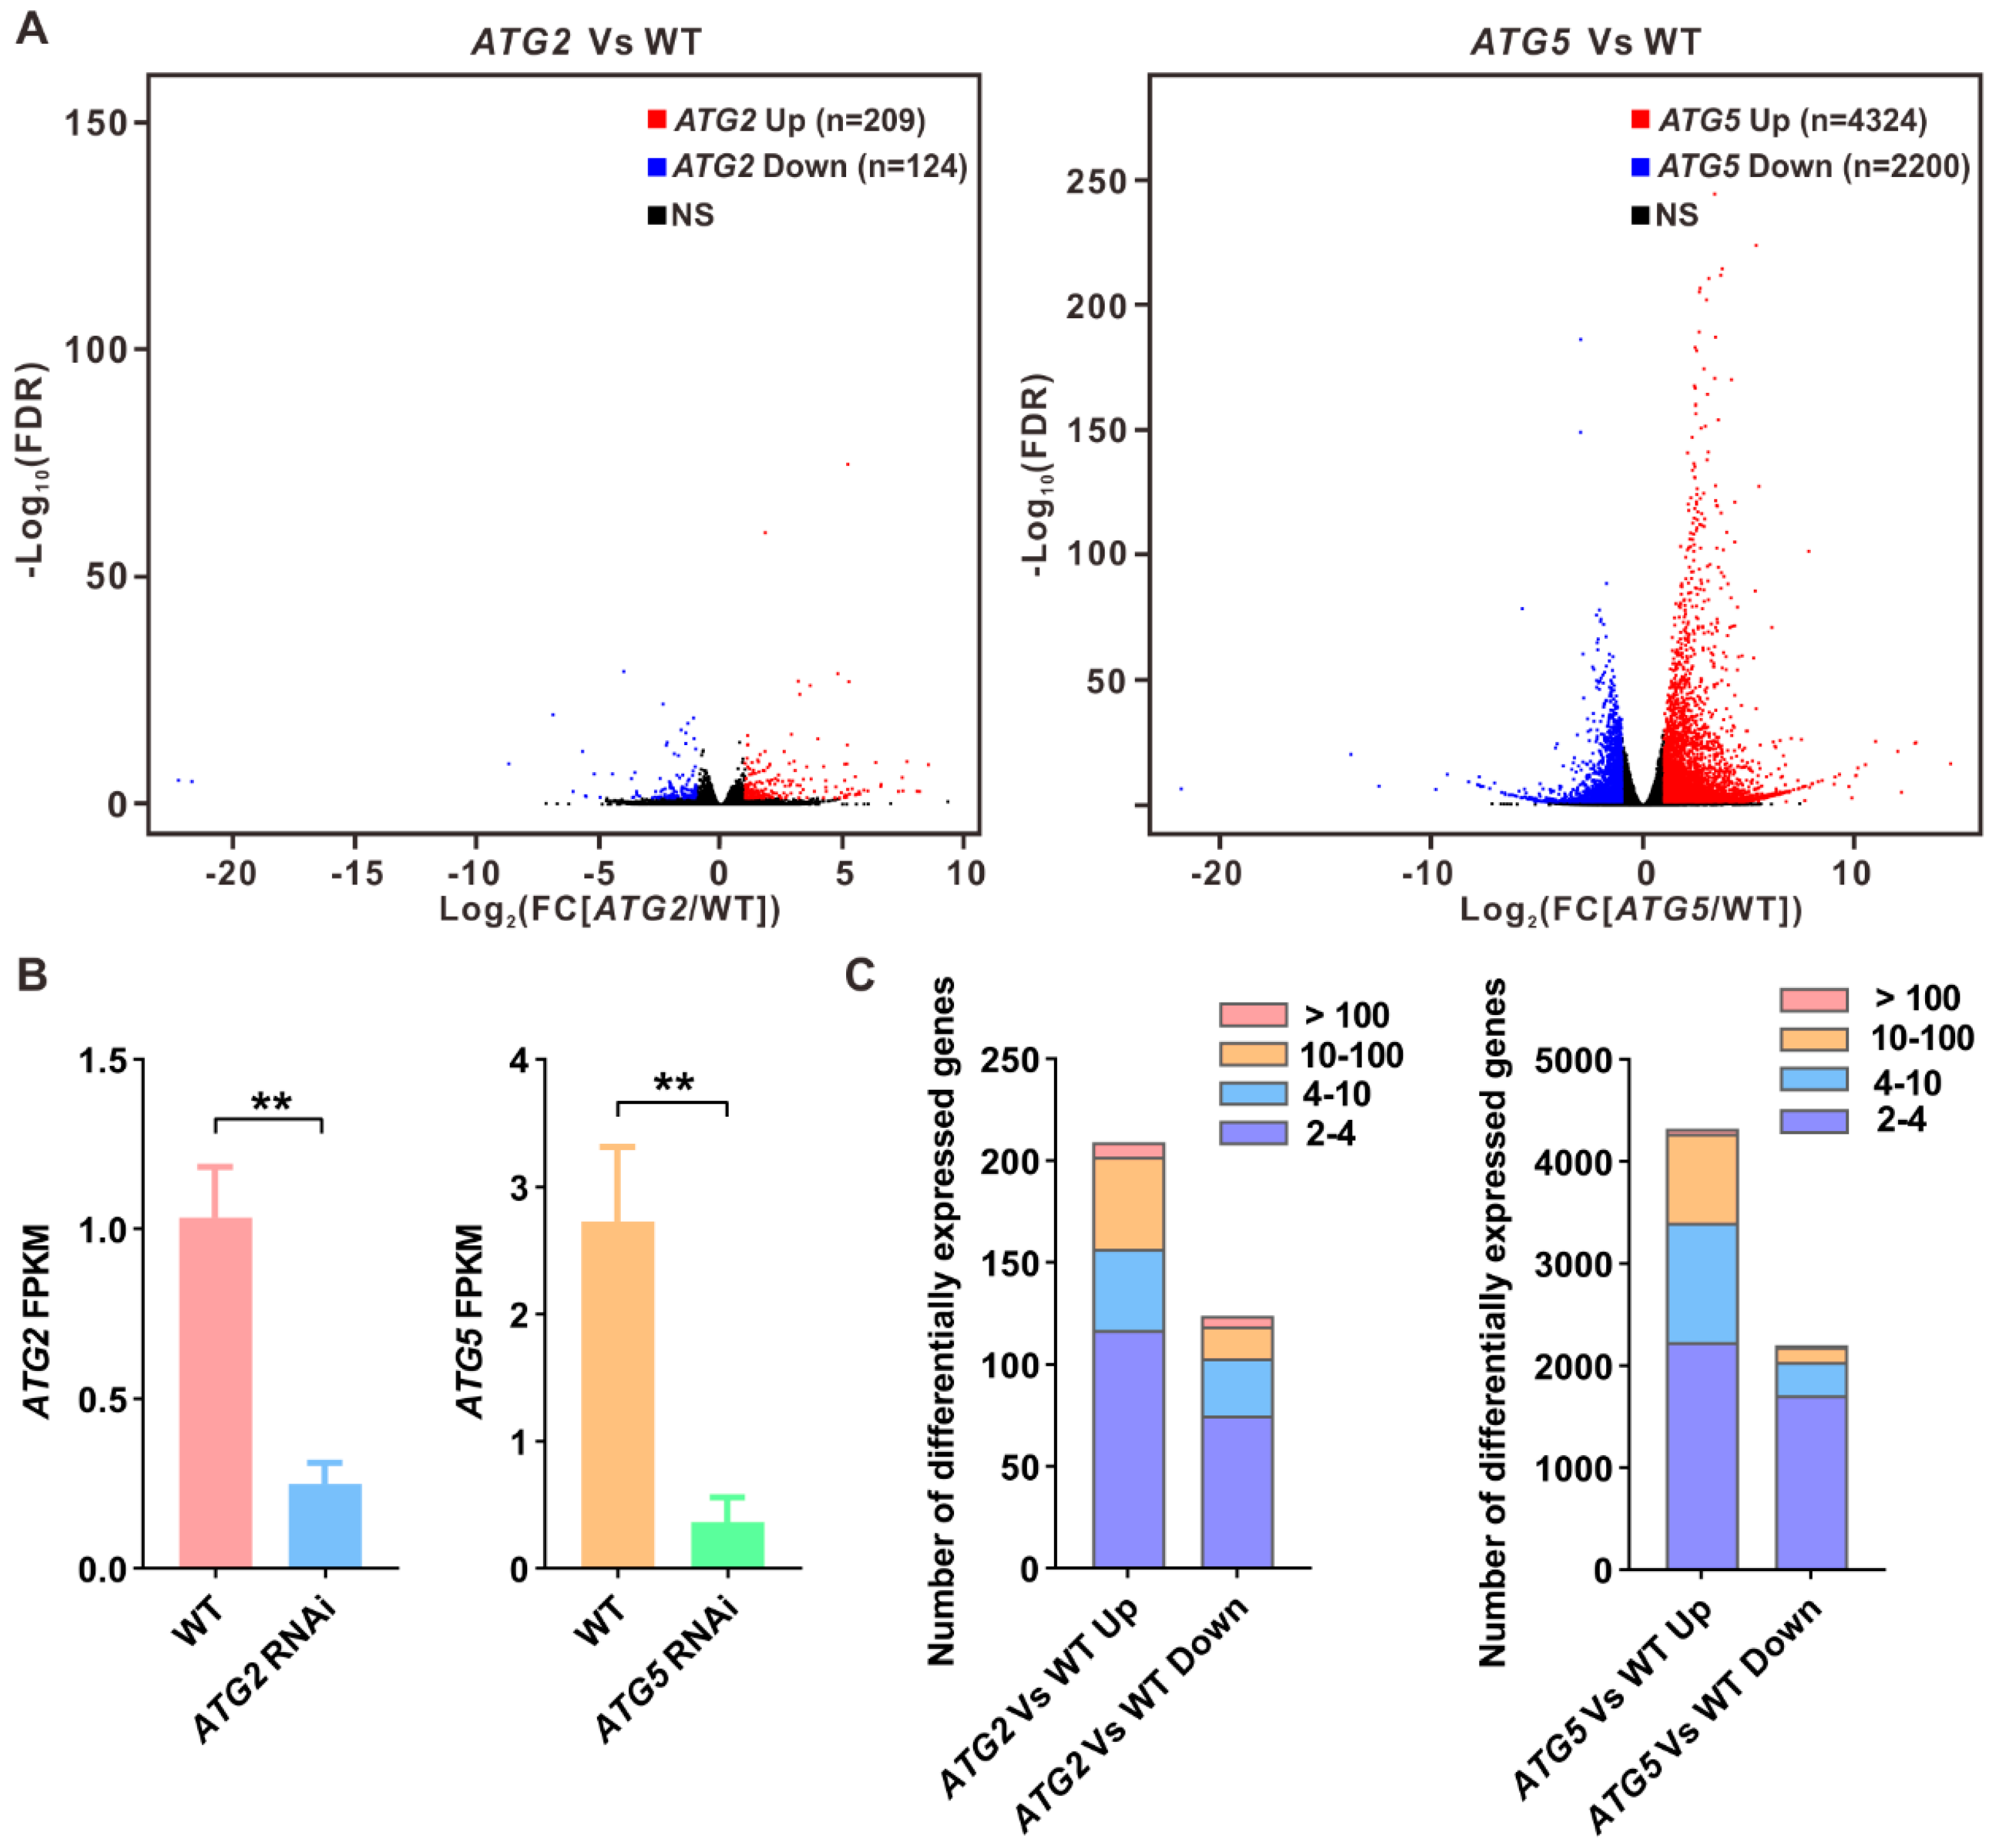
Both PCA and pairwise correlation analysis results revealed that silencing of ATG2 and ATG5 has distinct impact on pollen transcriptome (Figure 1B,C). To further compare the different impact of silencing of ATG2 and ATG5 on the pollen transcriptome, differently expressed genes between ATG2-silenced and WT pollen or between ATG5-silenced and WT pollen were identified, respectively (Figure 2A). To confirm the high reliability of RNA-seq data, the expression levels of ATG2 and ATG5 were firstly analyzed according to the RNA-seq data. The results revealed that the expression levels of ATG2 and ATG5 are significantly downregulated in their respective silencing lines, confirming our previous results (Figure 2B). Next, we found that 209 genes were significantly upregulated (fold change [FC][ATG2/WT] > 2, false discovery rate [FDR] < 0.05) and 124 genes were significantly downregulated (FC[ATG2/WT] < 0.5, FDR < 0.05) in ATG2-silenced pollen when compared with the WT (Figure 2A, C and Supplementary Data 1). Consistent with PCA results, the number of differently expressed genes between ATG5-silenced and WT pollen was significantly larger than that between ATG2-silenced and WT pollen. We found that 4324 genes were significantly upregulated (FC[ATG5/WT] > 2, FDR < 0.05), and 2098 genes were significantly downregulated in ATG5-silenced pollen compared with the WT (FC[ATG5/WT] < 0.5, FDR < 0.05) (Figure 2A,C and Supplementary Data 1). All these data suggest that silencing of ATG5 has greater impact on the transcriptome than ATG2.

2.3. The levels of transcripts linked to metabolic process changed in ATG2- and ATG5-silenced pollen

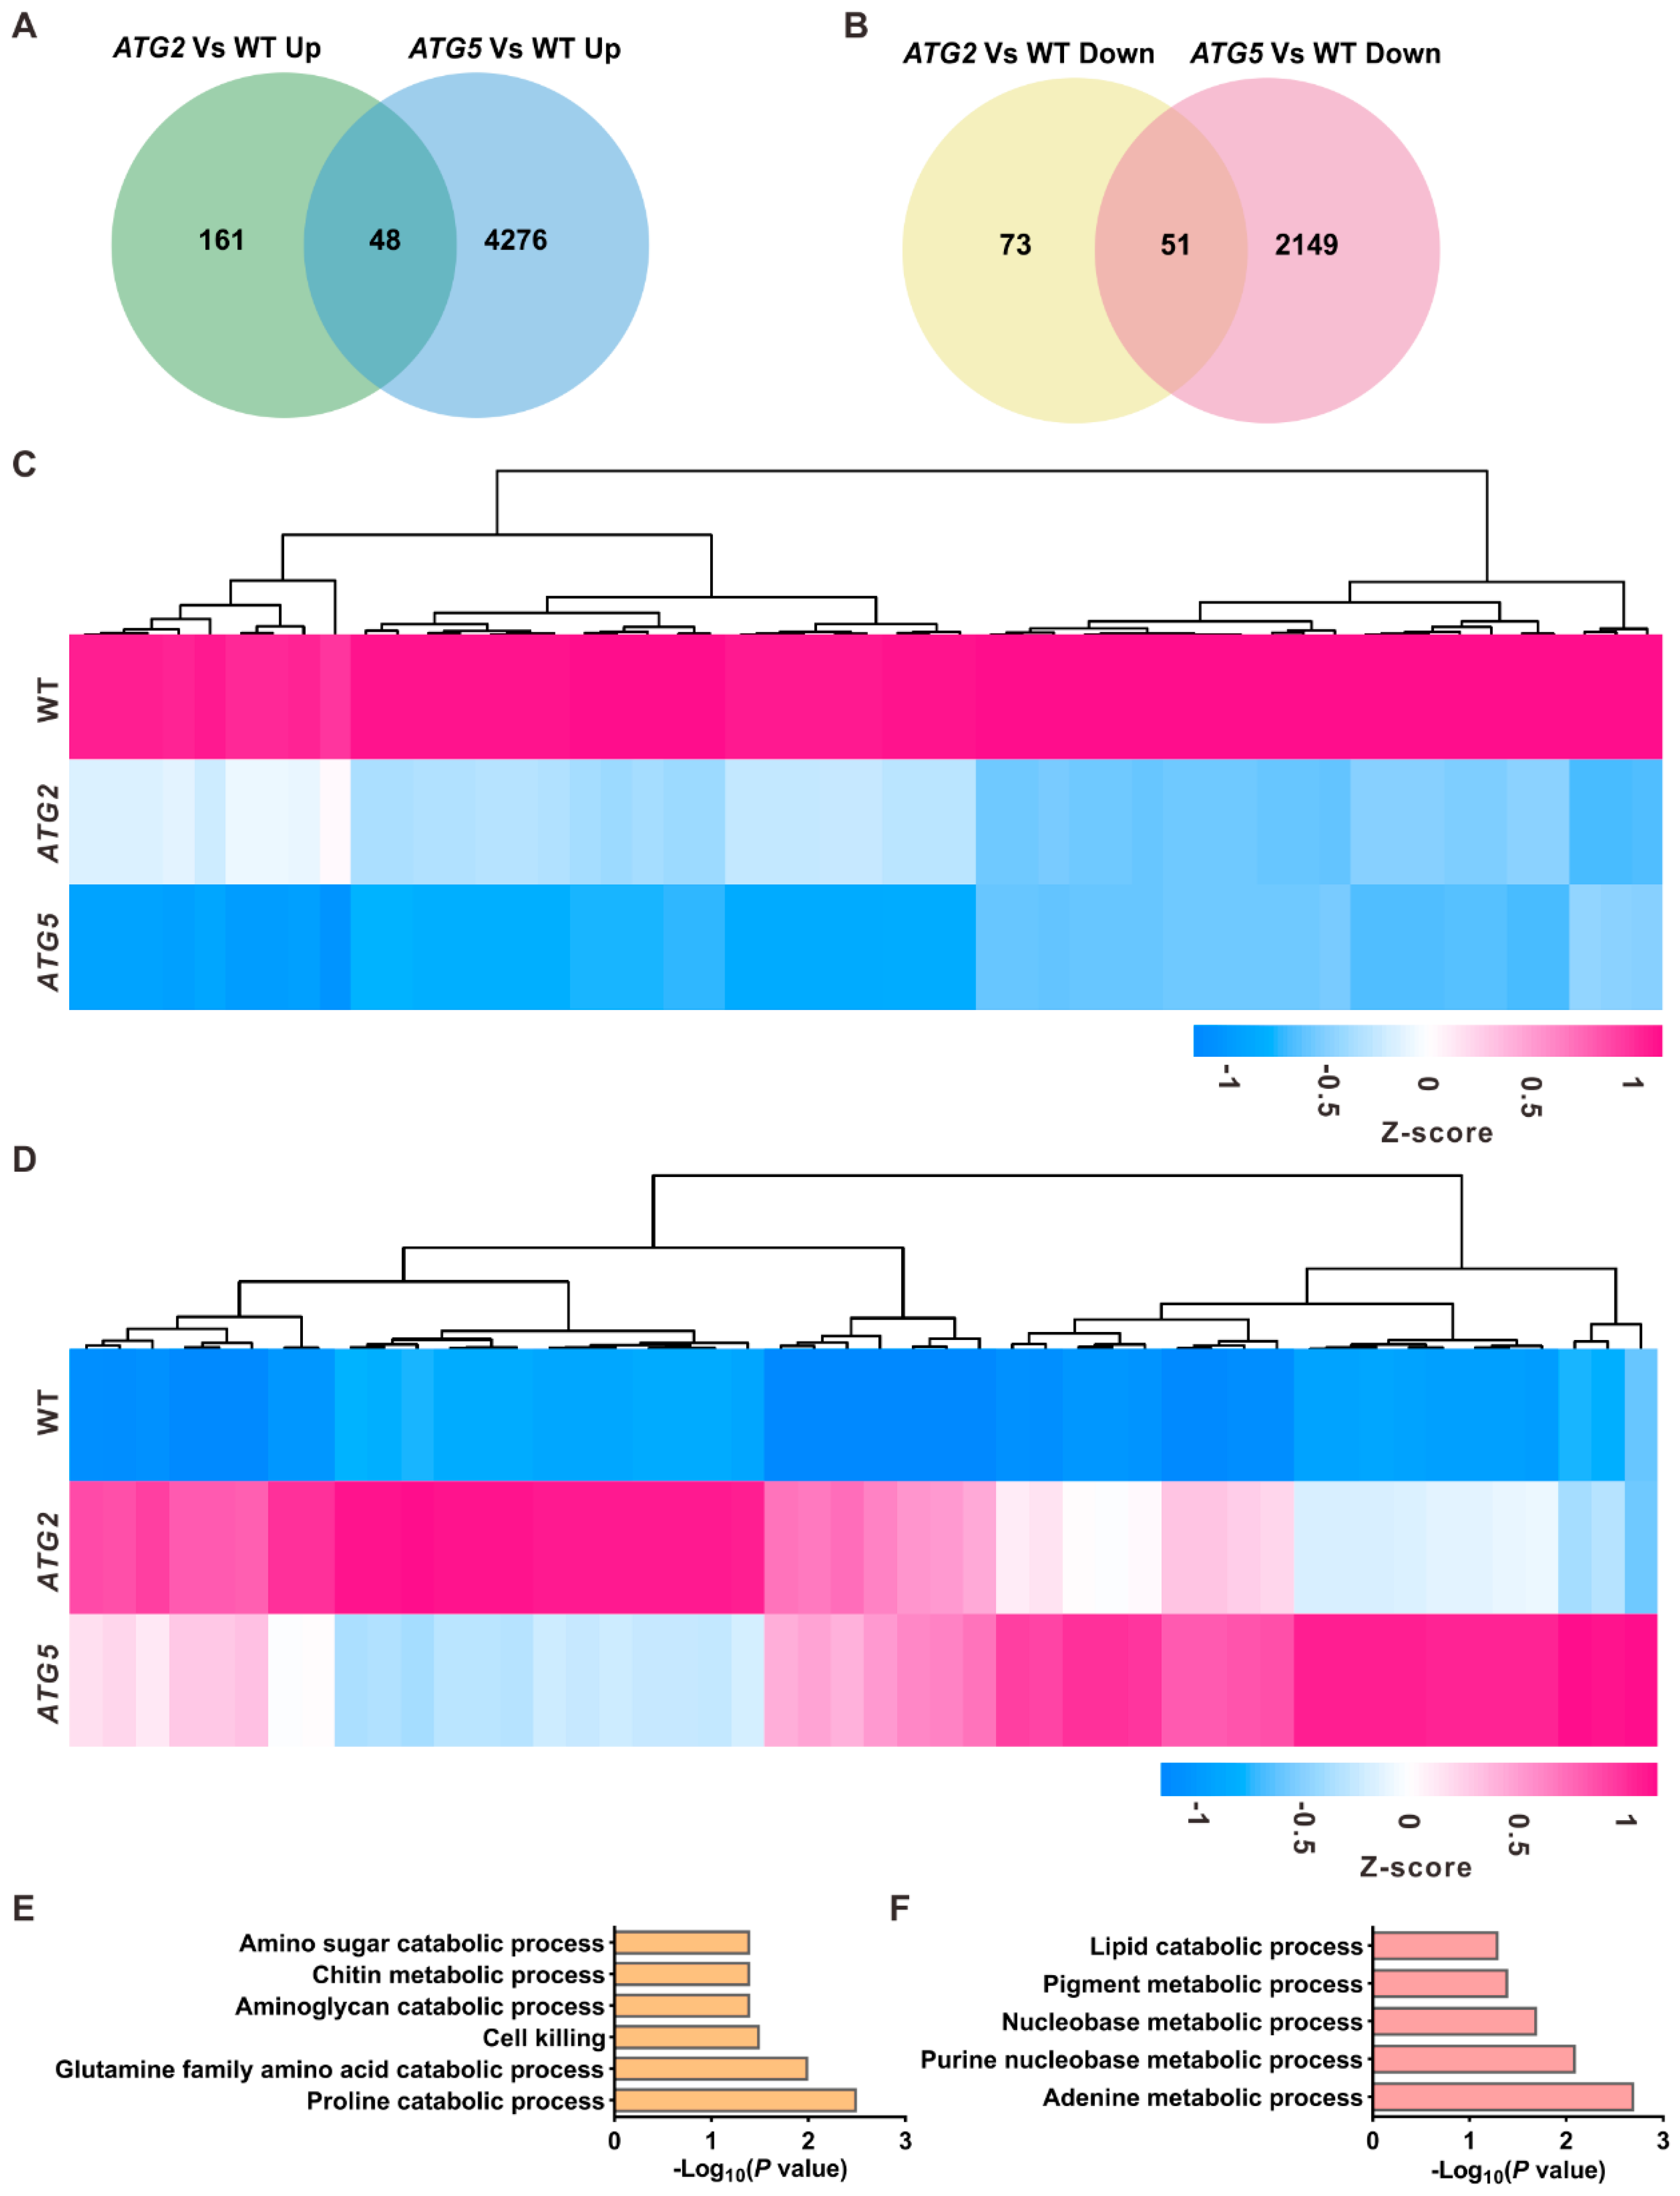
Although different impacts of silencing of ATG2 and ATG5 on pollen transcriptome, they have similar effect on pollen germination. Either silencing of ATG2 or ATG5 blocked the pollen germination [8], which give us an opportunity to investigate downstream pathways of autophagy responsible for the initiation of pollen germination at transcriptional level. Consistent with the similar defects in pollen germination of ATG2- and ATG5- silenced pollen, a substantial of differentially regulated genes are overlapped between ATG2/WT and ATG5/WT (Figure 3A,B). We next focus on the detailed roles of these common differentially regulated genes in the process of pollen germination. Gene Ontology (GO) analysis was performed for the common downregulated and common upregulated genes in ATG-silenced pollen, respectively. GO biological process enrichment analysis at revealed that different molecular pathways were enriched in downregulated and upregulated genes. Downregulated genes in ATG-silenced pollen were mainly enriched in metabolic processes such as proline catabolic process (P = 3. 3 × 10⁻³) and glutamine family amino acid catabolic process (P = 2.1 × 10⁻³), whereas upregulated genes were enriched in adenine metabolic process (P = 2. 1 × 10⁻³) and lipid catabolic process (P = 4. 9 × 10⁻²). These data suggested that amino acid and lipid catabolic processes are potential pathways downstream of autophagy in pollen germination.

2.4. The expressions at mRNA level and protein level are differentially affected by autophagy

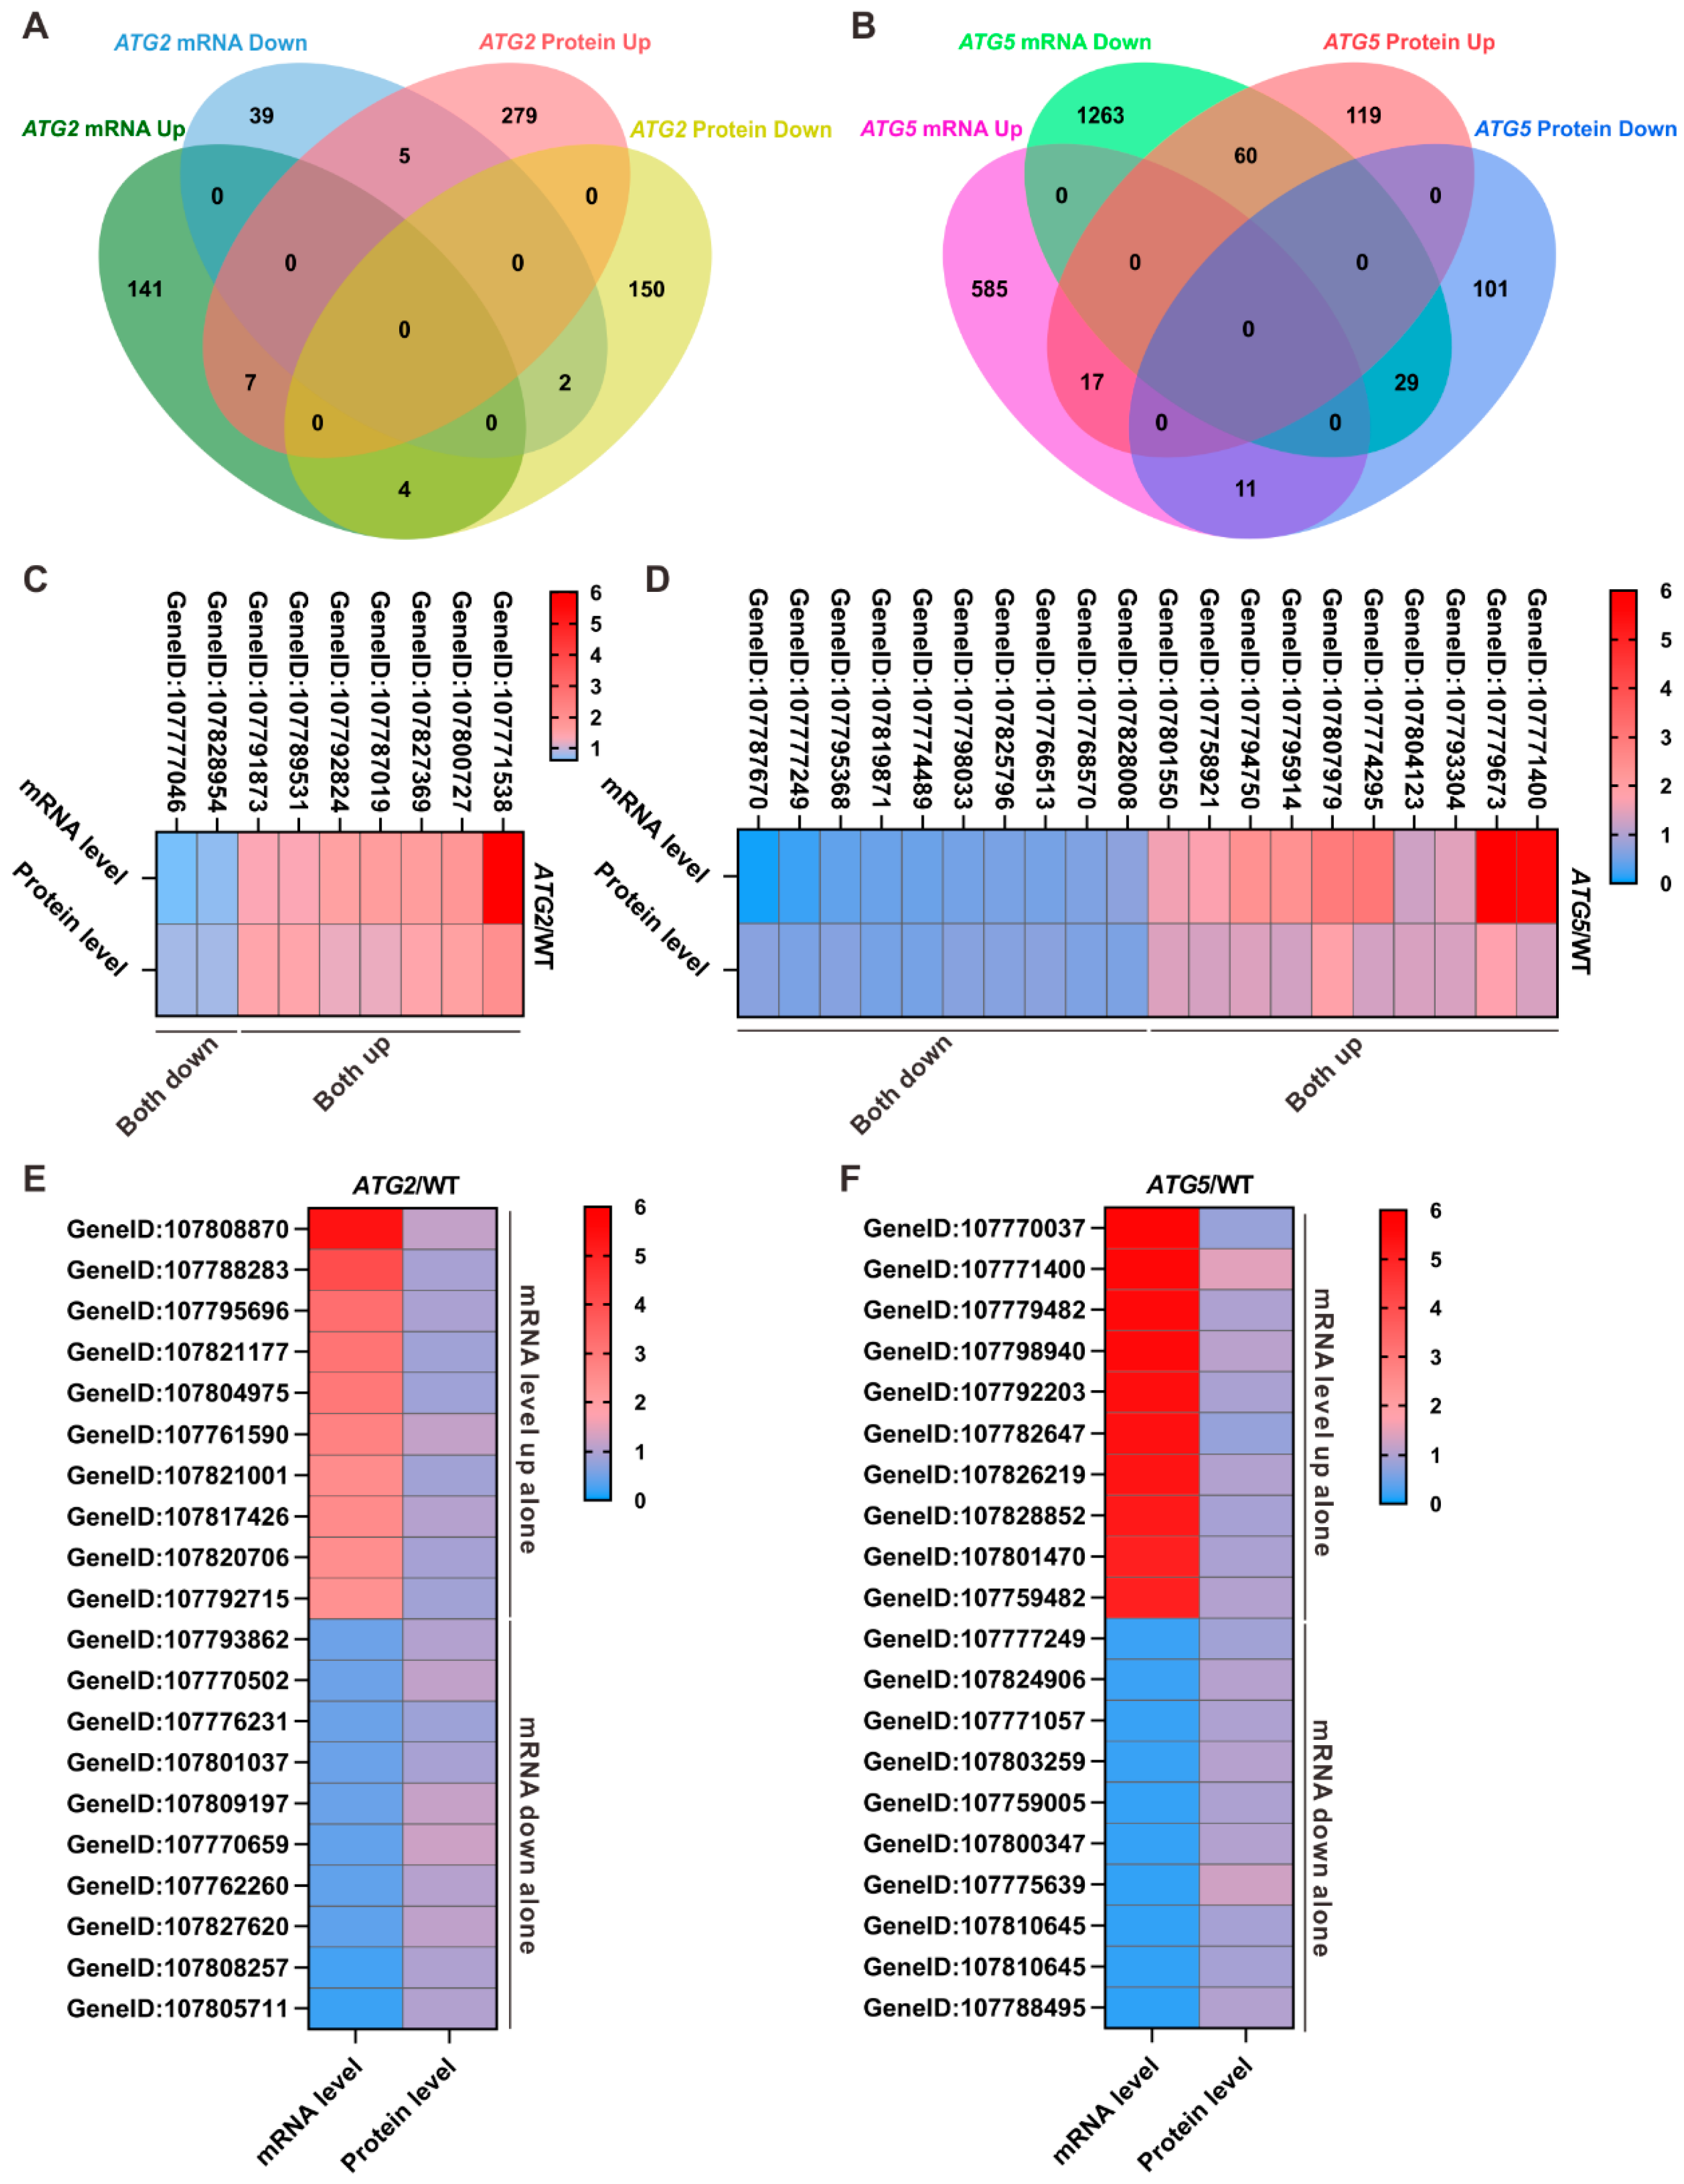
Our recent proteomic analysis revealed that silencing of ATG genes has a dramatic impact on the proteome [8]. To correlate the changes at mRNA level and protein level, we first generate a data set that contains common detected genes in proteome and transcriptome data (Supplementary Data 2). Based on this dataset, we compared differentially expressed proteins and differentially expressed genes in ATG-silenced pollen. Of the 7834 genes, we found that 627 genes show expression differences at mRNA and/or protein levels in ATG2-silenced pollen, and 2185 genes display changes at mRNA and/or protein levels in ATG5-silenced pollen. Surprisingly, only a small proportion of genes show similar changes at protein and mRNA levels. Only 9 genes in ATG2-silenced pollen and 46 genes in ATG5-silenced pollen show consistent change trend at both protein and mRNA levels. In contrast, majority of genes display distinct change trend at protein and mRNA levels in ATG-silenced pollen. In ATG2-silenced pollen, we found that 180 genes display only changes at mRNA level but not at protein level, and 429 genes show only changes at protein level but not at mRNA level. Similarly, 1848 genes display only changes at mRNA level but not at protein level in ATG5-silenced pollen, and 220 genes show only changes in protein level. Taken together, all these data suggested that genes downstream of autophagy are differentially regulated at mRNA and protein level.

2.5. Down-regulation of ATGs leads to the decrease of metabolic level in pollen

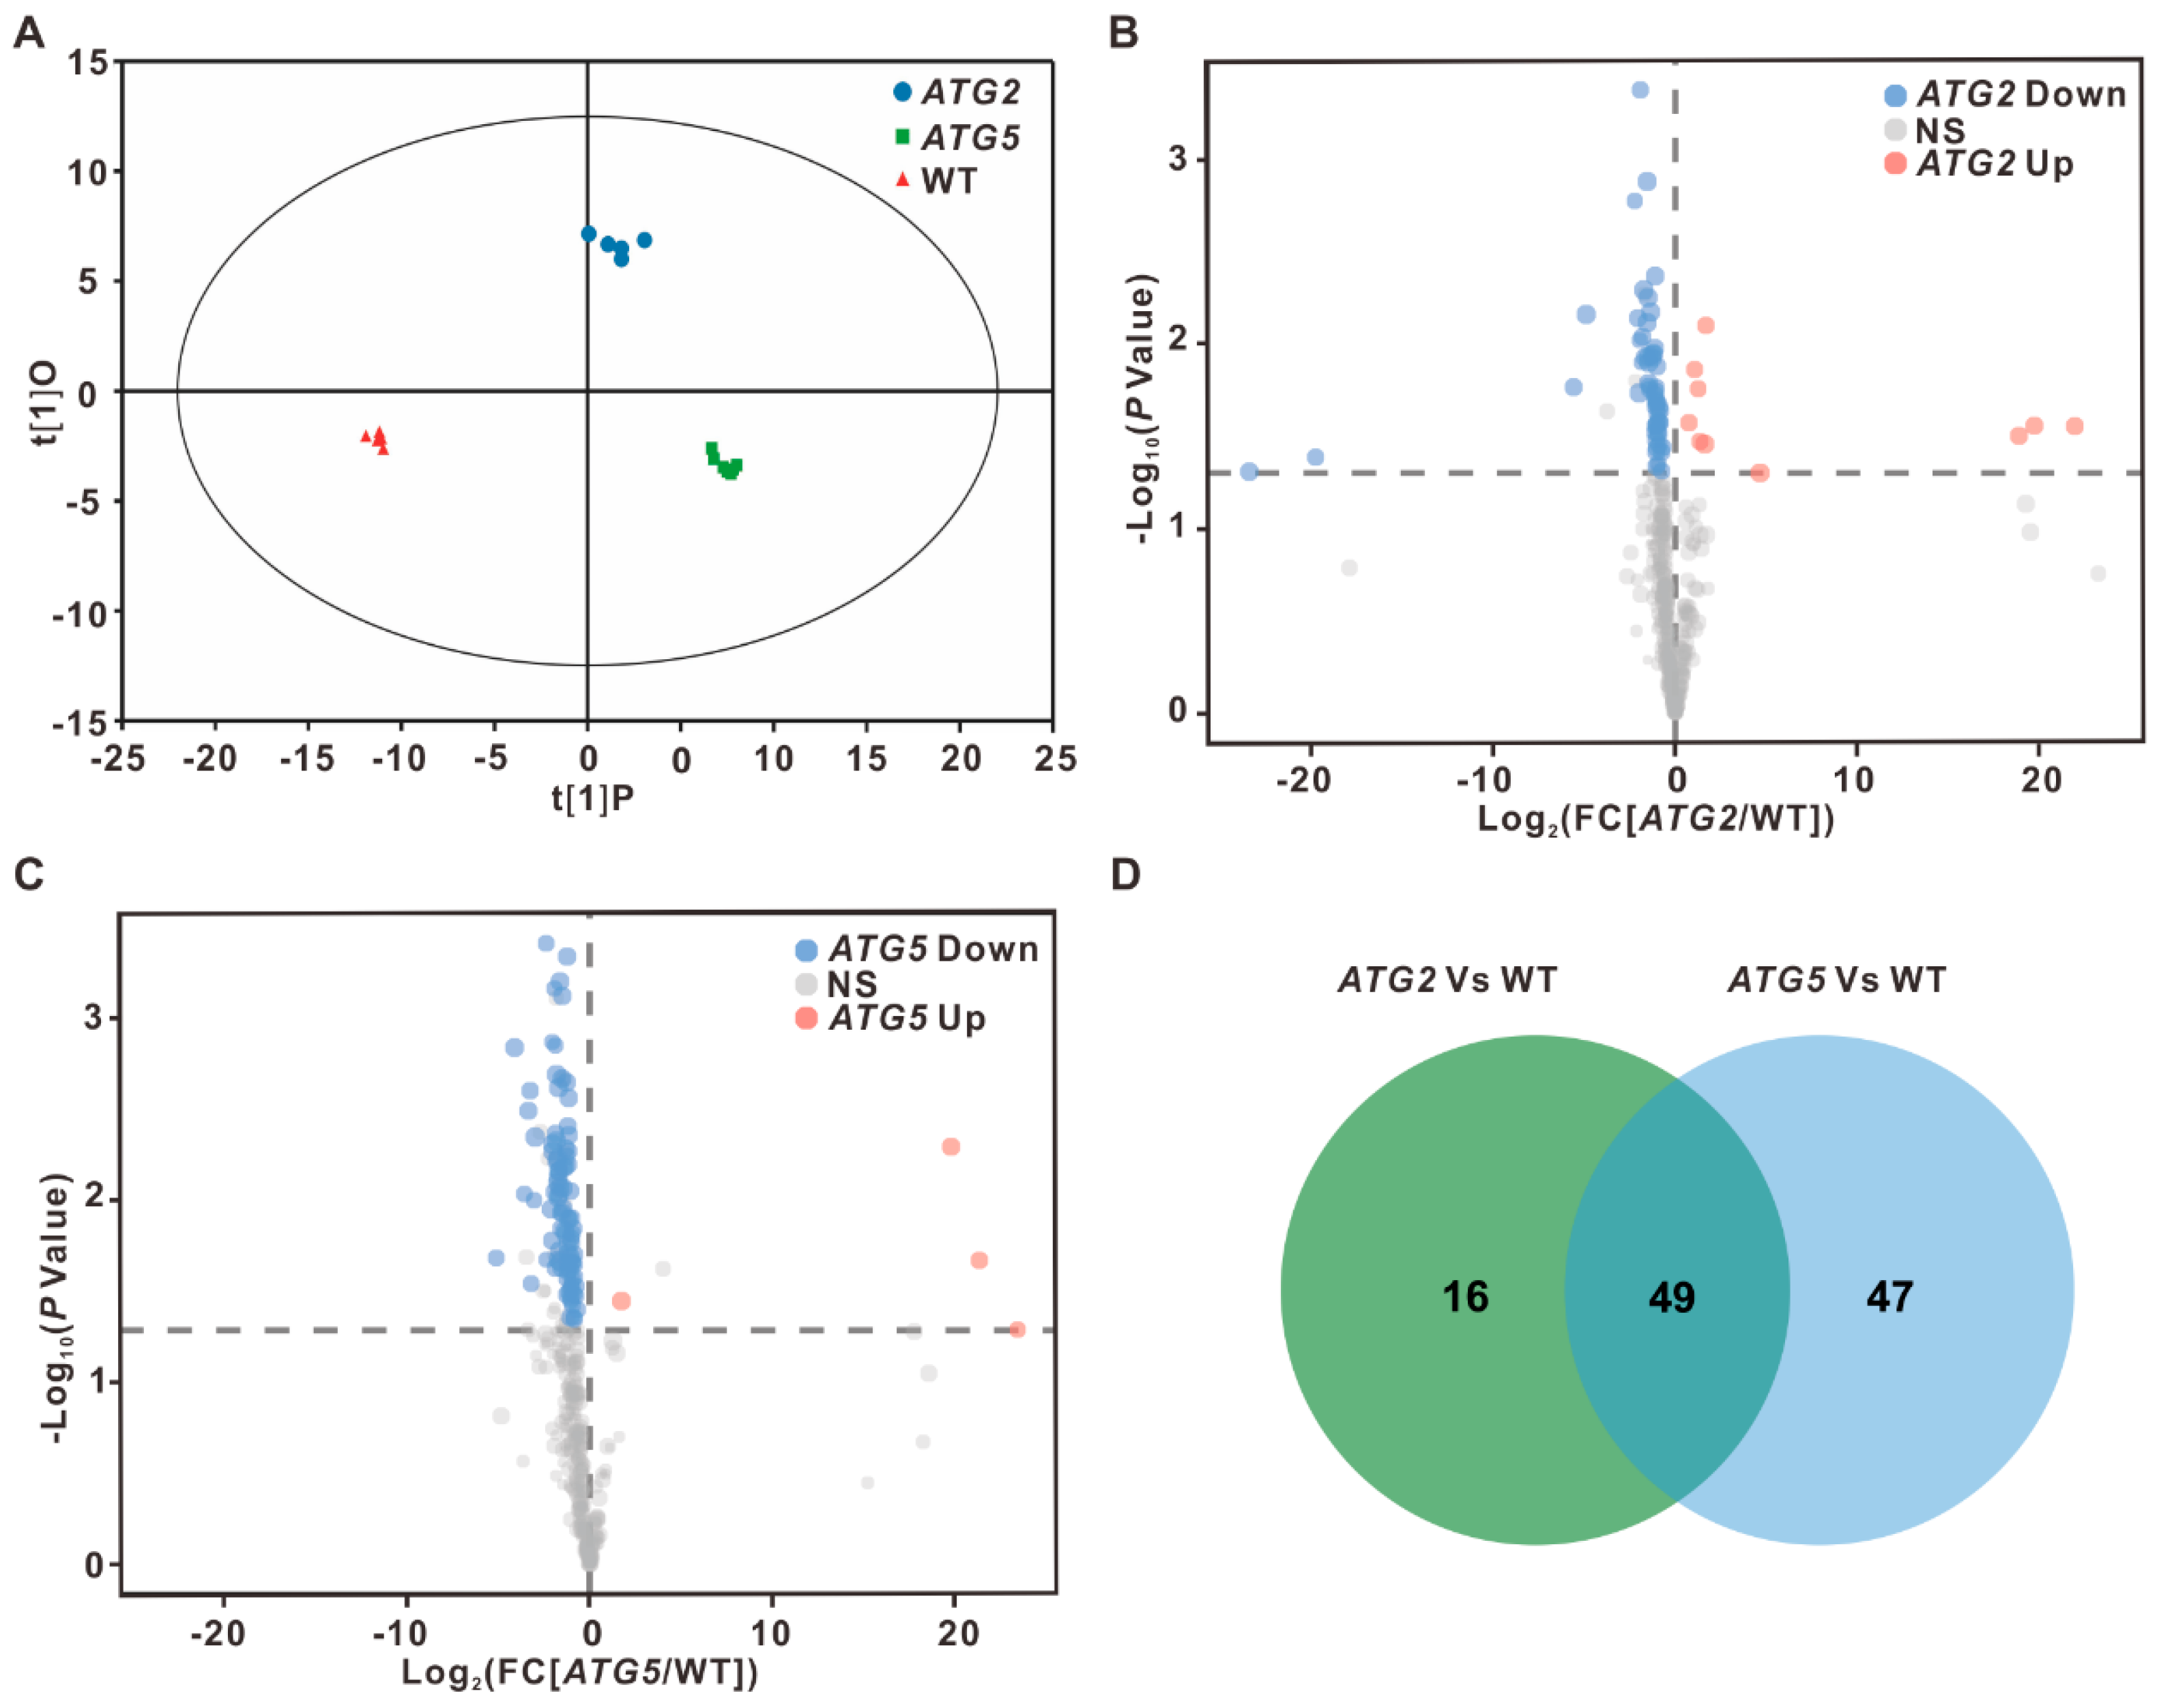
Autophagy has been linked to nutrient recycling under starvation conditions [12,13,14]. However, the influence of autophagy on central metabolism under normal developmental conditions are still largely unknown. Comparative transcriptome analysis revealed the expression levels of numerous genes related to several metabolic processes were significant changed in ATG-silencing pollen. To further assess how autophagy impacts on pollen metabolism, we therefore perform comprehensive metabolite profiling to investigate the metabolic contents of ATG-silencing pollen compared with the WT pollen using GC-TOF MS, which allowed for the quantitative analysis of primary metabolites. Combined the analysis results from 6-8 independent biological replicates, the contents of 374 metabolites were quantified in WT, ATG2- and ATG5- silenced pollen. Orthogonal projections to latent structures-discriminant analysis (OPLS-DA) displayed a good separation between the WT and ATG RNAi lines, suggesting that silencing of either ATG gene leads to the changes in concentrations of metabolites compared with the WT (Figure 5A).
To further investigate the influence of silencing of ATG genes on pollen metabolome, the metabolites with different levels between ATG2 and WT or between ATG5 and WT were screened. We found that the contents of 10 metabolites increased significantly in ATG2-silenced pollen when compared with the WT, and the contents of 55 metabolites decreased significantly. Consistent with transcriptome analysis results, stronger metabolic changes were observed in ATG5-silenced pollen. We observed significant increase of 4 metabolites and significant decrease of 92 metabolites in ATG5-silenced pollen compared with the WT (Figure 5B,C and Supplementary Data 3).

2.6. Metabolic pathways impacted by autophagy

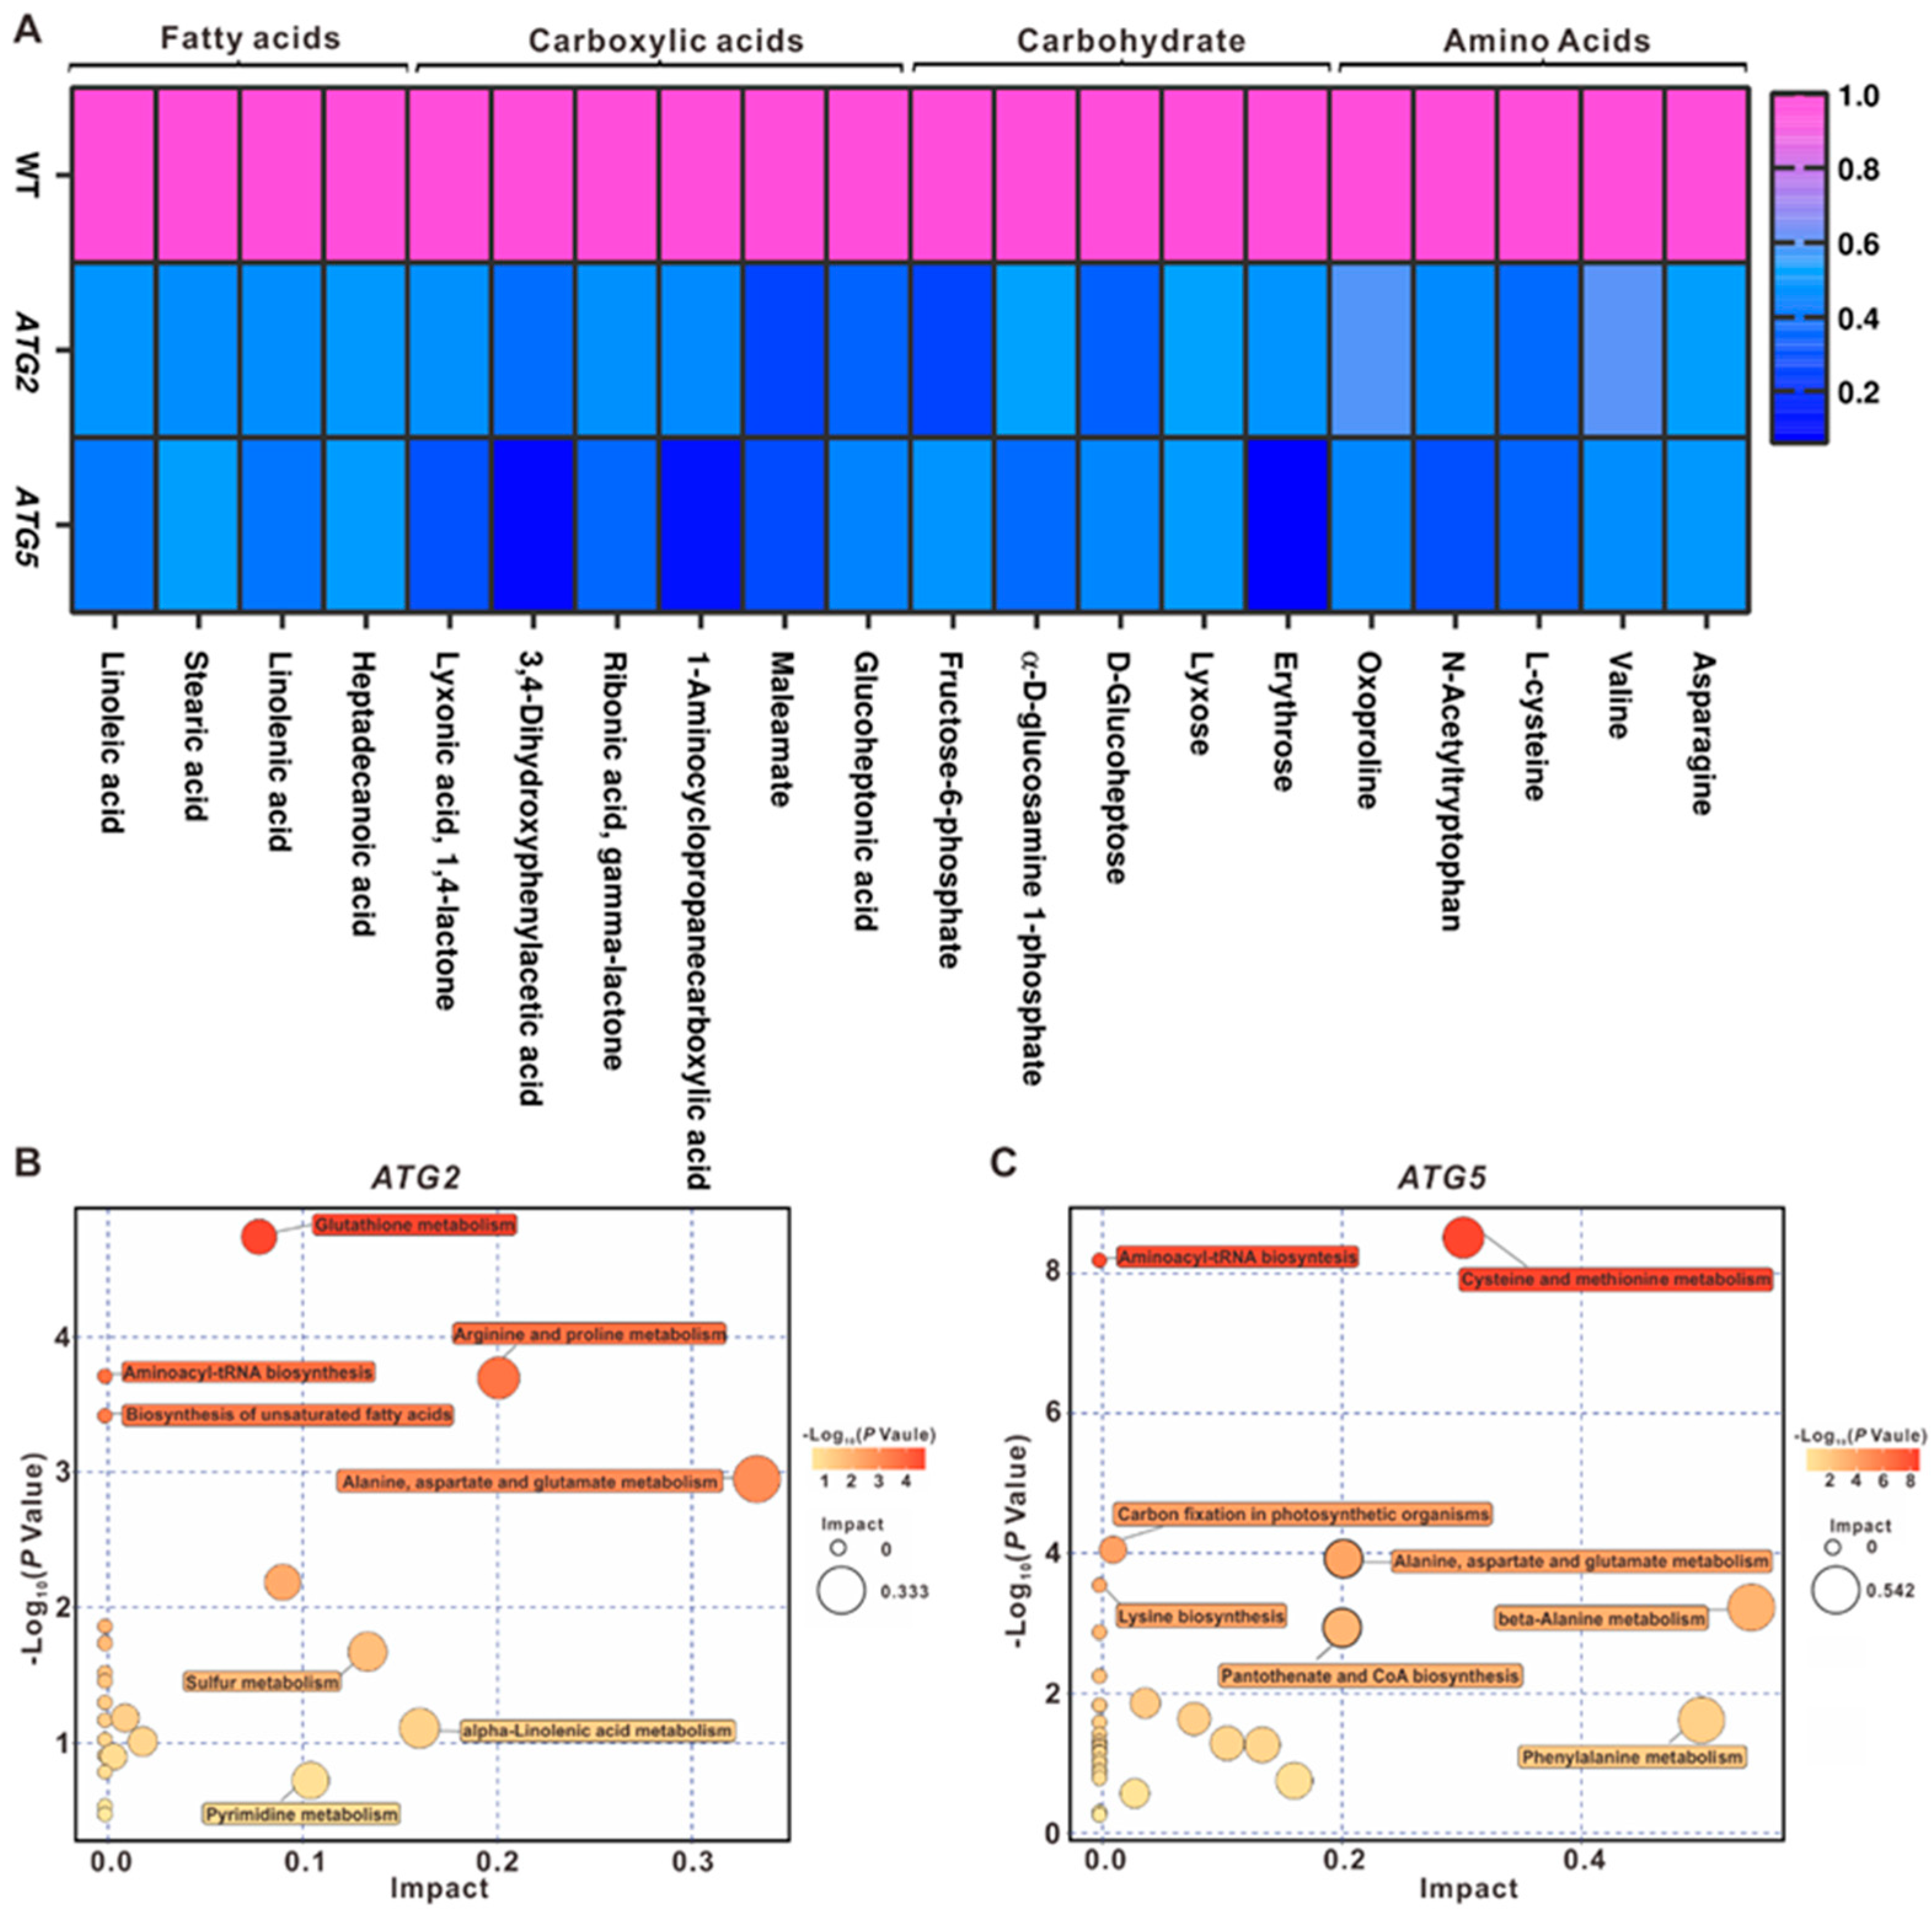
To define the metabolic pathways regulated by ATG2 and ATG5, the common metabolites regulated by both ATG2 and ATG5 were identified. There was a statistically significant overlap with metabolites downregulated in ATG2 and ATG5- silencing pollen (Figure 5D). A significant decrease in free amino acid levels was observed in ATG2- and ATG5- silencing pollen compared with the WT. When compared with the ATG2-silenced pollen, the levels of more free amino acids were decreased in ATG5-silenced pollen (Figure 6A). The level of valine was decreased significantly (Figure 6C), which were shown to function as electron donors for the tricarboxylic acid (TCA) cycle and mitochondria electron transport chain under carbon starvation [15]. In addition, reduced steady state levels of other organic compounds such as carbohydrates, fatty acids and carboxylic acids were also observed in ATG-silencing pollen (Figure 6B,C). These results revealed that downregulation of either ATG gene will lead to the reduced central metabolic level of pollen, suggesting conserved roles of autophagy on central metabolism under normal developmental as that in stress conditions [5].
When the metabolites significantly impacted in ATG2- and ATG5- silenced pollen were grouped according to their metabolic pathways, dramatic impacted metabolic pathways in autophagy-deficient pollen were discovered. Although majority of metabolic pathways were differentially enriched in ATG2- and ATG5- silenced pollen (Figure 6B,C), there are two common impacted pathways including alanine, aspartate and glutamate metabolism and Aminoacyl-tRNA biosynthesis in both ATG2- and ATG5- silenced pollen, suggesting direct connections between autophagy and these two pathways.

3. Discussion

3.1. Differential regulation of downstream genes of autophagy at mRNA and protein levels

Comparative proteomic and transcriptomic analysis results reveal a striking characteristic that numerous of genes display differential abundances at mRNA and protein levels in ATG-silenced pollen. Hundreds of differentially expressed genes were identified in ATG2-silenced pollen. However, only 18 of them displayed the similar changing trend at protein level. Consistent with this result, only a few differentially expressed genes are commonly regulated at both mRNA and protein levels. All these data suggest the defects in autophagy has distinct impact on cellular mRNA and cellular protein levels. Consistent with the results, the changes in the levels of most proteins in Arabidopsis atg5 mutants are not correlated to the changes in mRNA level. It is proposed that the genes may be regulated at mRNA level (mRNA synthesis and degradation), protein level (protein synthesis and degradation) and autophagy itself or a combination of these processes [6]. There are growing evidences supporting that autophagy play important roles in both RNA decay and protein degradation [16,17]. Our present comparative proteomic and transcriptomic analysis results indicate that based on only RNA or protein analysis may not sufficient for an accurate analysis of the pathways downstream the autophagy and for a detailed linkage of autophagy with specific cellular events.

3.2. Autophagy-dependent cellular metabolism is critical for promoting pollen germination

Both transcriptomic and metabolomic analyses of pollen grains and pollen tube at different developmental stages support the ideas that mature pollen already contains most transcripts involved in different metabolic pathways for pollen germination and dramatic metabolic changes occur during the process to orchestrate pollen tube emergence [18,19]. These studies show that most metabolites attributed to the carbohydrate and energy pathways, such as carbohydrate metabolism, TCA cycle, pyruvate utilization and glycolysis, occur in relatively high level in mature pollen grains compared with other tissues. Furthermore, metabolic pathways related to starch and fatty acid degradation are also activated in the initial stage of pollen germination [19]. These findings indicated that pollen germination and tube growth is a high energy-consumption process, and high metabolic activity is likely required for the initiation of pollen germination. Metabolite profiling analysis of male gametophytes at different developmental stages also supports this speculation [20]. The level of storage components, such as sucrose and TAGs, were shown to reach the peak in the mature pollen in the process of male gametophyte development and decreased as pollen germinated, suggesting that metabolites derived from these storage molecules could be recycled to support pollen germination [20]. Our integrated multi-omics analyses results reveals that autophagy in collaboration with several metabolic pathways plays critical roles in recycling storage components of mature pollen in the initial stage of pollen germination. Comparison of the transcriptomes and metabolomes of WT and autophagy-suppressed pollen showed that the transcript and metabolite levels in metabolic pathways, such as amino metabolism, were significantly downregulated, suggesting that autophagy-dependent metabolic regulation is critical for pollen germination. Our findings provide evidence for that during pollen germination, autophagy, in addition to mediating selective cytoplasm deletion, regulates the activity of these known critical metabolic processes.

3.3. Differences and similarities between tobacco and Arabidopsis atg5 transcriptomes

At present, no transcriptome data of autophagy-deficient pollen is available in Arabidopsis and other model plants, which did not allow us compare the conservation the differences of the transcriptome of autophagy-deficient pollen from different plants. However, transcriptome analyses have been performed in Arabidopsis atg5 rosettes under stress conditions [21], which give us an opportunity to compare the similarities and differences in the impact of autophagy on cellular transcriptome. In Arabidopsis, transcriptomic analysis of atg5 mutant under low nitrate condition revealed the pathways for glutathione, methionine, raffinose, galacturonate, and anthocyanin are distributed [21]. However, our present analysis revealed downregulated genes in ATG5-silenced pollen were enriched in the pathways related to translation, proton transport, ribosome assembly, whereas upregulated genes in ATG5-silenced pollen were enriched in RNA splicing, response to monosaccharide, protein complex biogenesis (Figure S3). There are two potential reasons for the differential downstream pathways of ATG5 in tobacco and Arabidopsis. The first is the different tissues were used for transcriptome analysis. The rosettes of Arabidopsis atg5 mutants were collected under low nitrate stress conditions, whereas pollen from ATG5-silenced plants under normal conditions were collected for transcriptome analysis. The second is the pathways downstream of ATG5 is indeed not conserved in different plants. Our recent research revealed that autophagy-mediated cytoplasmic clearance is required for tobacco pollen germination, whereas Arabidopsis atg5 mutant displayed normal pollen germination as WT plants [8]. Therefore, whether the role of autophagy and its regulatory pathways are conserved in different plants are worthy to be investigated in the future studies through more detailed analysis.

4. Materials and Methods

4.1. Plant materials

N. tabacum L. cv. Petite Havana SR1, ATG2- and ATG5- silenced plants [8] were grown under 12 h of daylight at 25 ± 2 °C in a glasshouse.

4.2. RNA isolation and RNA-seq

Total RNA from pollen were extracted using MiniBEST Plant RNA Extration Kit (TaKaRa). mRNA was purified from the total RNA using Dynabeads® mRNA Purification Kit. Sequencing libraries were then generated using MGIEasy RNA Library Prep Kit according to the reference guide, and sequenced on the MGIseq2000 platform.

4.3. RNA-seq data analysis

Reads contained adaptors and low-quality reads were removed by SOAPnuke [22]. The clean reads were then mapped to the tobacco genome and reference transcript sequences (Ntab-TN90 reference Annotation Release 100) using the HISAT2 [23] and Bowtie 2 [24], respectively. The expression level of each in the transcriptome as quantified as fragments per kilobase of transcript per million mapped reads (FPKM) using RSEM [25]. Differentially expressed genes between WT and ATG-silenced groups were identified using DESeq2 [26].

4.4. GO analysis

GO analysis was performed using the public database. Enrichment P-value for each GO term was calculated using a hypergeometric test.

4.5. KEGG analysis

Annotated pathway informations for tobacco were downloaded from the KEGG database. Statistical significance of enriched KEGG pathways was calculated using a hypergeometric test.

4.6. High-throughput analysis of primary metabolites in pollen using GC-TOF/MS

Metabolite extraction for GC-TOF/MS was performed by a method described previously with minor modifications [27]. Pollen from the WT, ATG2 RNAi and ATG5 RNAi plants were collected for high-throughput metabolomics analysis, respectively. Pollen (30 mg for each sample) collected from plants were immediately frozen in liquid nitrogen, and homogenized using a pestle in a 2-ml tube precooled with liquid nitrogen. Then each sample was extracted with 0.4 ml extraction liquid (Vmethanol : VH2O = 3 : 1), and 20 μl of adonitol (1 mg/ml stock in dH2O) as internal standard to the sample. Sample extraction, derivatization, and injection were performed as described previously [27]. GC-TOF/MS analysis was performed using an Agilent 7890 gas chromatograph system coupled with a Pegasus HT time-of-flight mass spectrometer. The system utilized a DB-5MS capillary column coated with 5% diphenyl cross-linked with 95% dimethylpolysiloxane (30 m × 250 μm inner diameter, 0.25 μm film thickness; J&W Scientific, Folsom, CA, USA). Metabolites were identified in comparison to a commercial EI-MS library (Kind et al., 2009) with Chroma TOF 4.3X software of LECO Corporation and LECO-Fiehn Rtx5 database. The RI (retention time index) method was used in the peak identification, and the RI tolerance was 5000. Remove metabolic features detected in <50% of QC samples [28]. The resulted three-dimensional data involving the peak number, sample name, and normalized peak area were fed to SIMCA14.1 software package for orthogonal projections to latent structures-discriminate analysis (OPLS-DA). First principal component of VIP (variable importance in the projection) values (VIP >1) in combination with Student’s t test (P < 0.05) were introduced to identify differentially expressed metabolites between the WT and ATGs-silencing pollen.

Supplementary Materials

The following supporting information can be downloaded at the website of this paper posted on Preprints.org. Figure S1. The transcripts from three independent biological replicates are highly correlated; Figure S2. Heat map showing genes which are differentially regulated at mRNA and protein levels; Figure S3. GO and KEGG analysis of differentially expressed genes identified in ATG5-silenced pollen; Table S1. Statistic data of each RNA-seq sample; Supplementary Data 1. Differentially expressed genes between ATG2-silenced and WT pollen or ATG5-silenced and WT pollen; Supplementary Data 2. Gene list used for the comparison of the mRNA and protein levels in ATG-silenced pollen; Supplementary Data 3. Metabolites with different abundances between WT and ATG2-silenced pollen or between WT and ATG5-silenced pollen.

Author Contributions

GHY and XMZ designed the experiments; XMZ, QUZ, YLZ, and SSD performed the experiments; XMZ, QUZ, YLZ, and SSD analyzed the data; GHY and XMZ wrote the manuscript. All authors discussed the results and approved the manuscript before submission.

Funding

This work was supported by National Natural Science Foundation of China (32170346; 32270364), the Major Project of Hubei Hongshan Laboratory (2022hszd017), and the Fundamental Research Funds for the Central Universities (CPT22031).

Data Availability Statement

RNA-seq data of WT, ATG2- and ATG5- silenced pollen have been uploaded to the NCBI Gene Expression Omnibus (GEO) under accession GSE158922.

Acknowledgments

We thank Prof. Meng-xiang Sun (Wuhan University) for giving ATG-silenced seeds.

Conflicts of Interest

The authors declare no conflict of interest.

References

  1. Han, S.; Yu, B.; Wang, Y.; Liu, Y. , Role of plant autophagy in stress response. Protein & cell 2011, 2, 784–791. [Google Scholar]
  2. Kim, J.; Lee, H.; Lee, H. N.; Kim, S. H.; Shin, K. D.; Chung, T. , Autophagy-related proteins are required for degradation of peroxisomes in Arabidopsis hypocotyls during seedling growth. Plant Cell 2013, 25, 4956–4966. [Google Scholar] [CrossRef] [PubMed]
  3. Wada, S.; Ishida, H.; Izumi, M.; Yoshimoto, K.; Ohsumi, Y.; Mae, T.; Makino, A. , Autophagy plays a role in chloroplast degradation during senescence in individually darkened leaves. Plant Physiol 2009, 149, 885–893. [Google Scholar] [CrossRef] [PubMed]
  4. Wang, Y.; Yu, B.; Zhao, J.; Guo, J.; Li, Y.; Han, S.; Huang, L.; Du, Y.; Hong, Y.; Tang, D.; Liu, Y. , Autophagy contributes to leaf starch degradation. Plant Cell 2013, 25, 1383–1399. [Google Scholar] [CrossRef] [PubMed]
  5. Avin-Wittenberg, T.; Bajdzienko, K.; Wittenberg, G.; Alseekh, S.; Tohge, T.; Bock, R.; Giavalisco, P.; Fernie, A. R. , Global analysis of the role of autophagy in cellular metabolism and energy homeostasis in Arabidopsis seedlings under carbon starvation. Plant Cell 2015, 27, 306–322. [Google Scholar] [CrossRef]
  6. Have, M.; Luo, J.; Tellier, F.; Balliau, T.; Cueff, G.; Chardon, F.; Zivy, M.; Rajjou, L.; Cacas, J. L.; Masclaux-Daubresse, C. , Proteomic and lipidomic analyses of the Arabidopsis atg5 autophagy mutant reveal major changes in endoplasmic reticulum and peroxisome metabolisms and in lipid composition. New Phytol 2019, 223, 1461–1477. [Google Scholar] [CrossRef]
  7. McLoughlin, F.; Augustine, R. C.; Marshall, R. S.; Li, F.; Kirkpatrick, L. D.; Otegui, M. S.; Vierstra, R. D. , Maize multi-omics reveal roles for autophagic recycling in proteome remodelling and lipid turnover. Nat Plants 2018, 4, 1056–1070. [Google Scholar] [CrossRef]
  8. Zhao, P.; Zhou, X. M.; Zhao, L. L.; Cheung, A. Y.; Sun, M. X. , Autophagy-mediated compartmental cytoplasmic deletion is essential for tobacco pollen germination and male fertility. Autophagy 2020, 1–13. [Google Scholar] [CrossRef]
  9. Meijer, W. H.; van der Klei, I. J.; Veenhuis, M.; Kiel, J. A. , ATG genes involved in non-selective autophagy are conserved from yeast to man, but the selective Cvt and pexophagy pathways also require organism-specific genes. Autophagy 2007, 3, 106–116. [Google Scholar] [CrossRef]
  10. Xia, K.; Liu, T.; Ouyang, J.; Wang, R.; Fan, T.; Zhang, M. , Genome-wide identification, classification, and expression analysis of autophagy-associated gene homologues in rice (Oryza sativa L.). DNA Res 2011, 18, 363–377. [Google Scholar] [CrossRef]
  11. Zhou, X. M.; Zhao, P.; Wang, W.; Zou, J.; Cheng, T. H.; Peng, X. B.; Sun, M. X. , A comprehensive, genome-wide analysis of autophagy-related genes identified in tobacco suggests a central role of autophagy in plant response to various environmental cues. DNA Res 2015, 22, 245–257. [Google Scholar] [CrossRef] [PubMed]
  12. Doelling, J. H.; Walker, J. M.; Friedman, E. M.; Thompson, A. R.; Vierstra, R. D. , The APG8/12-activating enzyme APG7 is required for proper nutrient recycling and senescence in Arabidopsis thaliana. J Biol Chem 2002, 277, 33105–33114. [Google Scholar] [CrossRef] [PubMed]
  13. Thompson, A. R.; Doelling, J. H.; Suttangkakul, A.; Vierstra, R. D. , Autophagic nutrient recycling in Arabidopsis directed by the ATG8 and ATG12 conjugation pathways. Plant Physiol 2005, 138, 2097–2110. [Google Scholar] [CrossRef] [PubMed]
  14. Xiong, Y.; Contento, A. L.; Bassham, D. C. , AtATG18a is required for the formation of autophagosomes during nutrient stress and senescence in Arabidopsis thaliana. Plant J 2005, 42, 535–546. [Google Scholar] [CrossRef] [PubMed]
  15. Zhang, M.; Fan, J.; Taylor, D. C.; Ohlrogge, J. B. , DGAT1 and PDAT1 acyltransferases have overlapping functions in Arabidopsis triacylglycerol biosynthesis and are essential for normal pollen and seed development. Plant Cell 2009, 21, 3885–3901. [Google Scholar] [CrossRef]
  16. Abildgaard, M. H.; Brynjolfsdottir, S. H.; Frankel, L. B. , The Autophagy-RNA Interplay: Degradation and Beyond. Trends Biochem Sci 2020, 45, 845–857. [Google Scholar] [CrossRef]
  17. Varshavsky, A. , The Ubiquitin System, Autophagy, and Regulated Protein Degradation. Annu Rev Biochem 2017, 86, 123–128. [Google Scholar] [CrossRef] [PubMed]
  18. Wang, Y.; Zhang, W. Z.; Song, L. F.; Zou, J. J.; Su, Z.; Wu, W. H. , Transcriptome Analyses Show Changes in Gene Expression to Accompany Pollen Germination and Tube Growth in Arabidopsis. Plant Physiol 2008, 148, 1201–1211. [Google Scholar] [CrossRef]
  19. Obermeyer, G.; Fragner, L.; Lang, V.; Weckwerth, W. , Dynamic adaption of metabolic pathways during germination and growth of lily pollen tubes after inhibition of the electron transport chain. Plant Physiol 2013, 162, 1822–1833. [Google Scholar] [CrossRef]
  20. Rotsch, A. H.; Kopka, J.; Feussner, I.; Ischebeck, T. , Central metabolite and sterol profiling divides tobacco male gametophyte development and pollen tube growth into eight metabolic phases. Plant J 2017, 92, 129–146. [Google Scholar] [CrossRef]
  21. Masclaux-Daubresse, C.; Clement, G.; Anne, P.; Routaboul, J. M.; Guiboileau, A.; Soulay, F.; Shirasu, K.; Yoshimoto, K. , Stitching together the Multiple Dimensions of Autophagy Using Metabolomics and Transcriptomics Reveals Impacts on Metabolism, Development, and Plant Responses to the Environment in Arabidopsis. Plant Cell 2014, 26, 1857–1877. [Google Scholar] [CrossRef] [PubMed]
  22. Chen, Y.; Chen, Y.; Shi, C.; Huang, Z.; Zhang, Y.; Li, S.; Li, Y.; Ye, J.; Yu, C.; Li, Z.; Zhang, X.; Wang, J.; Yang, H.; Fang, L.; Chen, Q. , SOAPnuke: a MapReduce acceleration-supported software for integrated quality control and preprocessing of high-throughput sequencing data. Gigascience 2018, 7, 1–6. [Google Scholar] [CrossRef] [PubMed]
  23. Kim, D.; Langmead, B.; Salzberg, S. L. , HISAT: a fast spliced aligner with low memory requirements. Nat Methods 2015, 12, 357–360. [Google Scholar] [CrossRef] [PubMed]
  24. Langmead, B. Aligning short sequencing reads with Bowtie. Curr Protoc Bioinformatics 2010, 11, 117. [Google Scholar] [CrossRef]
  25. Li, B.; Dewey, C. N. , RSEM: accurate transcript quantification from RNA-Seq data with or without a reference genome. Bmc Bioinformatics 2011, 12. [Google Scholar] [CrossRef]
  26. Love, M. I.; Huber, W.; Anders, S. , Moderated estimation of fold change and dispersion for RNA-seq data with DESeq2. Genome Biol 2014, 15, 550. [Google Scholar] [CrossRef]
  27. Guo, R.; Shi, L.; Yang, C.; Yan, C.; Zhong, X.; Liu, Q.; Xia, X.; Li, H. , Comparison of Ionomic and Metabolites Response under Alkali Stress in Old and Young Leaves of Cotton (Gossypium hirsutum L.) Seedlings. Frontiers in plant science 2016, 7, 1785. [Google Scholar] [CrossRef]
  28. Dunn, W. B.; Broadhurst, D.; Begley, P.; Zelena, E.; Francis-McIntyre, S.; Anderson, N.; Brown, M.; Knowles, J. D.; Halsall, A.; Haselden, J. N.; Nicholls, A. W.; Wilson, I. D.; Kell, D. B.; Goodacre, R.; Human Serum Metabolome, C. , Procedures for large-scale metabolic profiling of serum and plasma using gas chromatography and liquid chromatography coupled to mass spectrometry. Nature protocols 2011, 6, 1060–1083. [Google Scholar] [CrossRef]
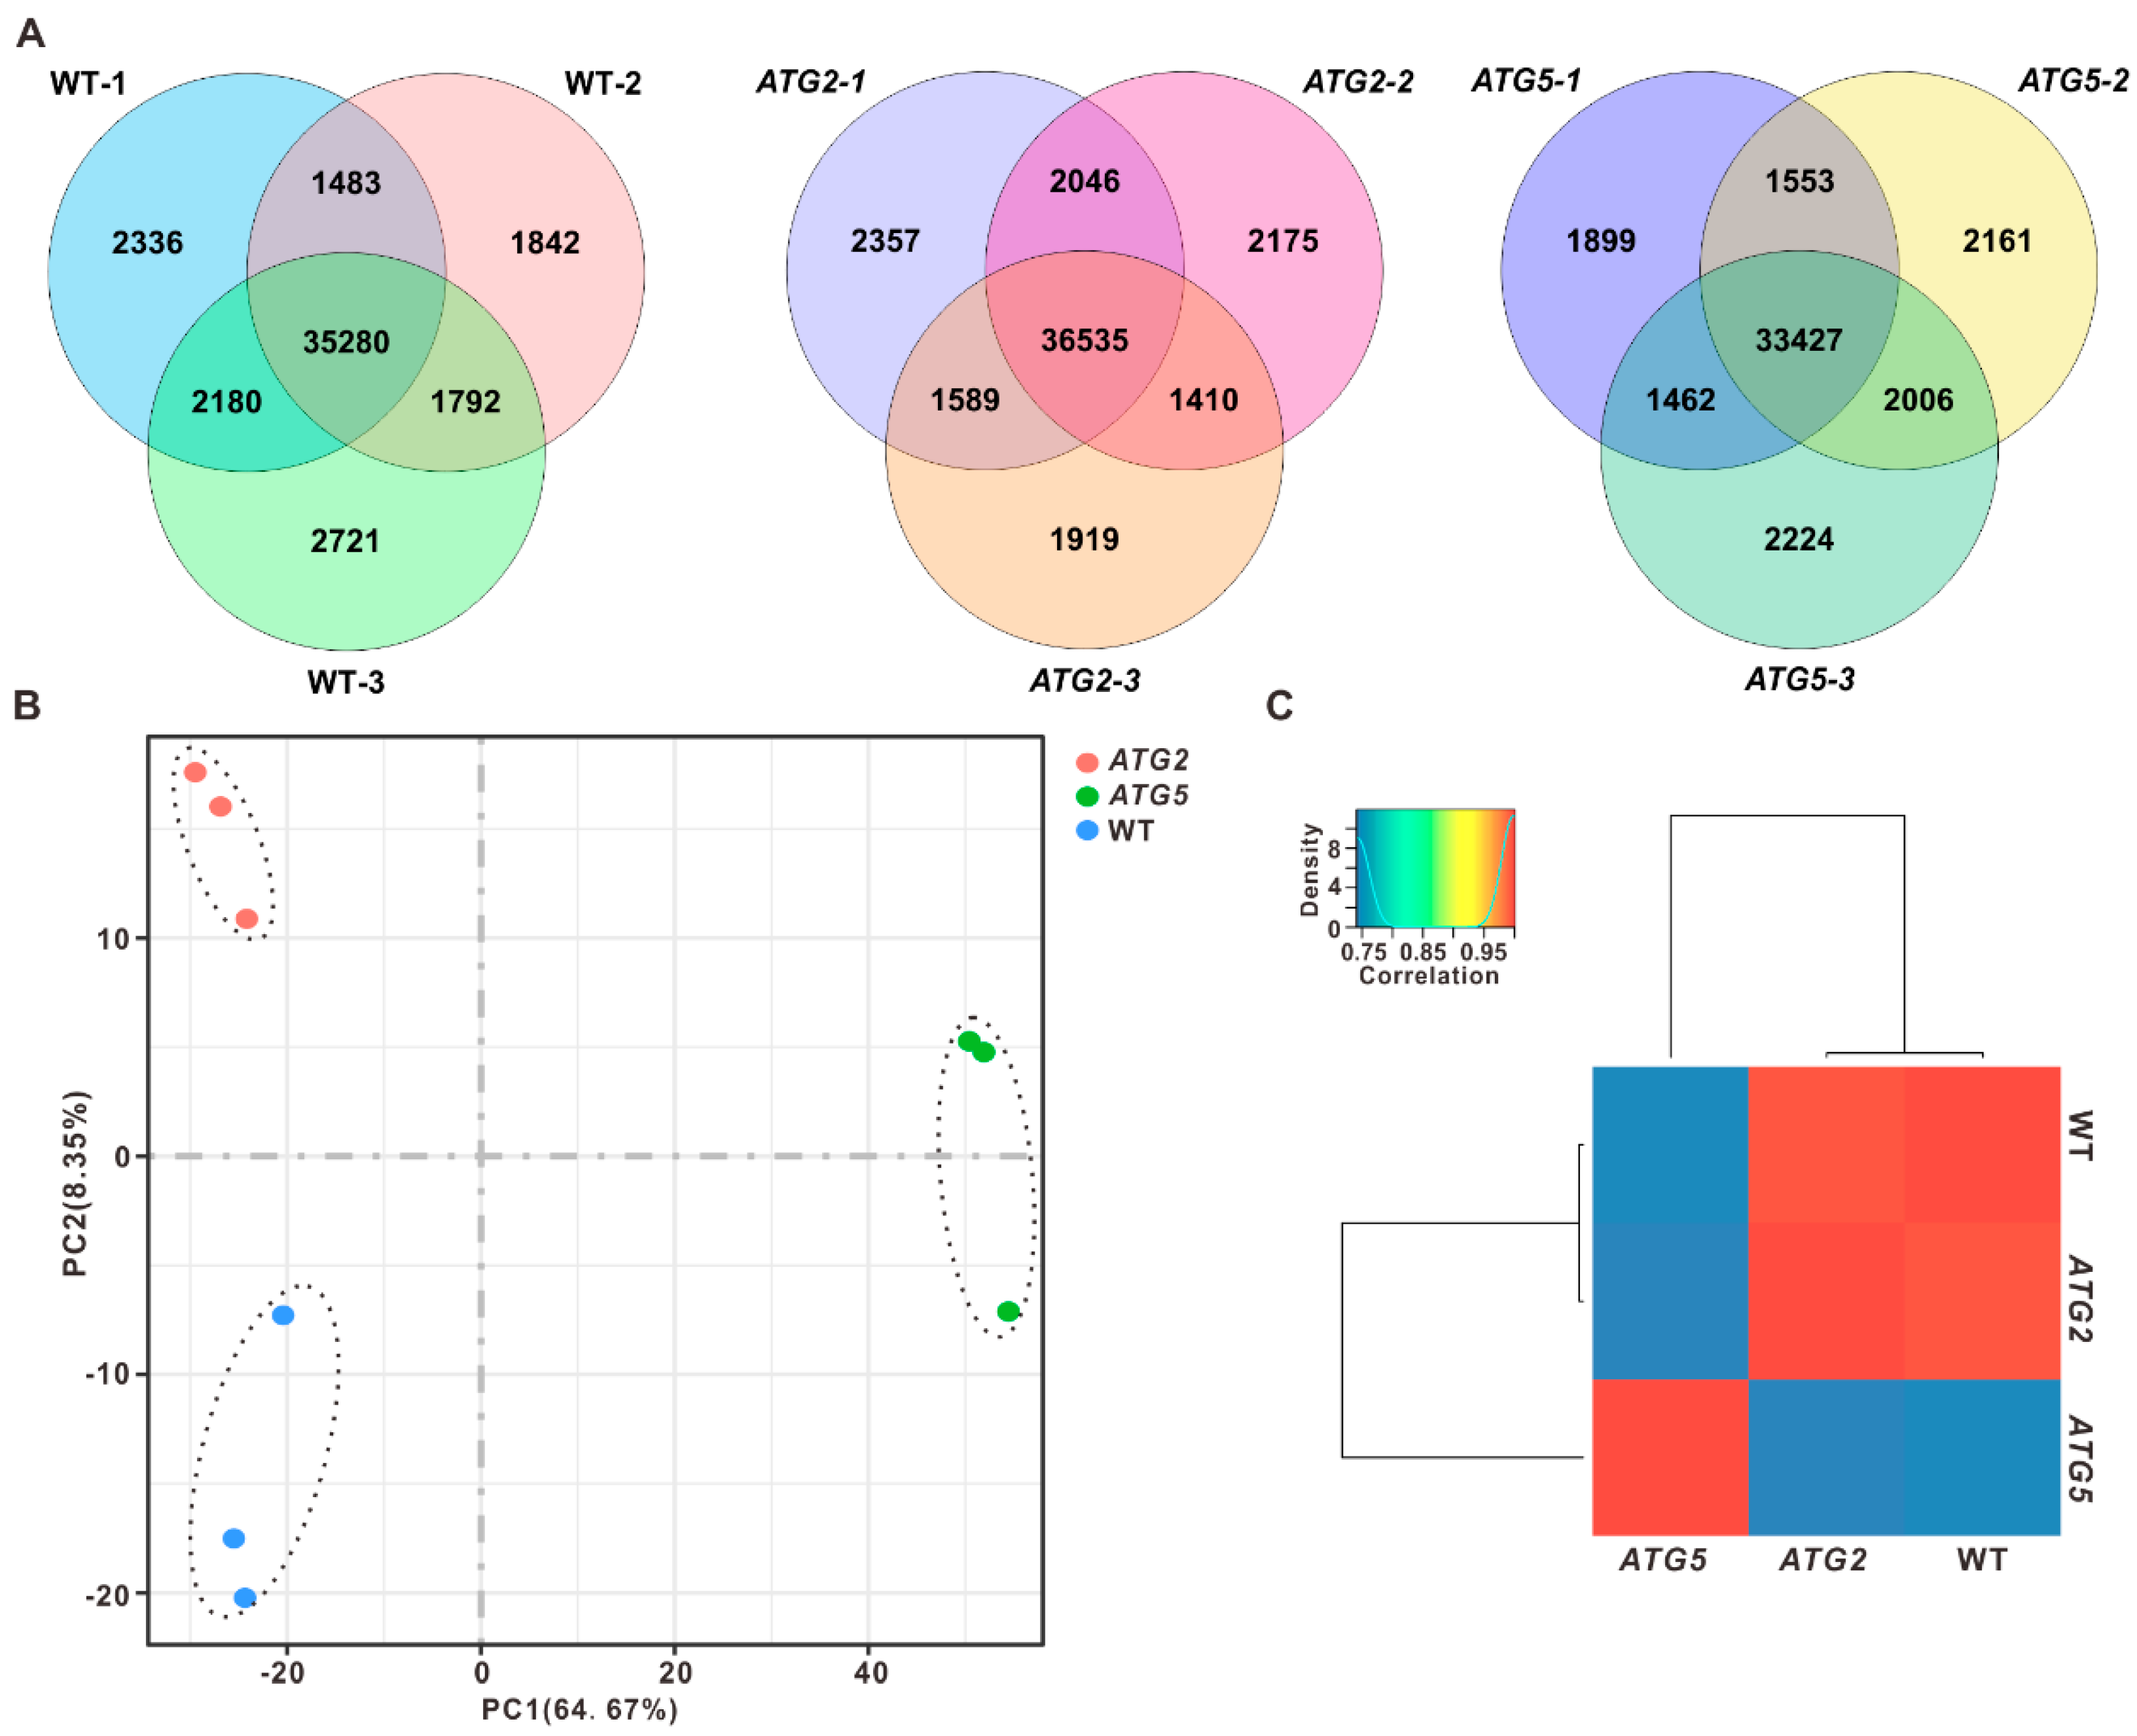
Figure 1. Global transcriptome analysis of WT, ATG2-silenced and ATG5-silenced pollen. (A). Overlap analysis of detected genes in three independent biological replicates. (B). Principal component analysis of the transcriptomes of WT, ATG2-silenced and ATG5-silenced pollen. (C). Clustering analysis the transcriptome of WT, ATG2-silenced and ATG5-silenced pollen according to the Pearson’s correlation efficient.
Preprints 83920 g001
Figure 2. Identification of differentially expressed genes between WT and ATG-silenced pollen. (A). Volcano plots display differentially expressed genes between ATG2-silenced and WT pollen or ATG5-silenced and WT pollen. Red dots indicated upregulated genes, and blue dots indicate downregulated genes. (B). FPKM values of ATG2 and ATG5 in WT and their respective RNAi line. (C). Number of differentially expressed genes between ATG2-silenced and WT pollen or ATG5-silenced and WT pollen. Fold changes are indicated with the distinct colors.
Preprints 83920 g002
Figure 3. Identification of downstream pathways of autophagy in the process of pollen germination. (A, B). Overlap analysis of upregulated genes (A) and downregulated genes (B) between ATG2/WT and ATG5/WT. (C, D). Heat map showing the expression levels of the common downregulated (C) and common upregulated genes (D) in ATG2-silenced and ATG5-silenced pollen. (E, F). GO enrichment analysis of the commonly downregulated (E) and upregulated genes (F) in ATG2- and ATG5- silenced pollen.
Preprints 83920 g003
Figure 4. Comparisons between differentially regulated transcripts and proteins in ATG2- and ATG5-silenced pollen. (A, B). Overlap analysis of differentially regulated transcripts and proteins in ATG2- (A) and ATG5- silenced (B) pollen. (C, D). Heat map showing differentially expressed genes which display consistent change trend at mRNA and protein levels in ATG2- (C) and ATG5- silenced (D) pollen. (E, F). Heat map showing genes which are differentially regulated at mRNA and protein levels in ATG2- (E) and ATG5- silenced (F) pollen.
Preprints 83920 g004
Figure 5. Silencing ATGs results in the decreased metabolite levels in pollen. (A). OPLS-DA of metabolite levels. The ellipse represents the Hotelling T2 with 95% confidence. (B, C). Volcano plots showing metabolites with different abundances between WT and ATG-silenced pollen. Blue dots indicated downregulated metabolites in ATG-silenced pollen, while pink dots indicated upregulated metabolites in ATG-silenced pollen. (t-test, P < 0.05). (D). Venn diagrams showing overlaps of metabolites with significantly different contents in ATG-silenced pollen.
Preprints 83920 g005
Figure 6. Downregulation of ATG has significant impact on downstream metabolic pathways. (A). Heat map representation of the relative metabolite contents. (B, C). Metabolic pathways regulated by ATG2 (B) or ATG5 (C).
Preprints 83920 g006
Disclaimer/Publisher’s Note: The statements, opinions and data contained in all publications are solely those of the individual author(s) and contributor(s) and not of MDPI and/or the editor(s). MDPI and/or the editor(s) disclaim responsibility for any injury to people or property resulting from any ideas, methods, instructions or products referred to in the content.
Copyright: This open access article is published under a Creative Commons CC BY 4.0 license, which permit the free download, distribution, and reuse, provided that the author and preprint are cited in any reuse.
Prerpints.org logo

Preprints.org is a free preprint server supported by MDPI in Basel, Switzerland.

Subscribe

© 2024 MDPI (Basel, Switzerland) unless otherwise stated