1. Introduction
As an archipelago country, the Indonesia seas that located in the equator has complex and unique characteristics. Several factors that lead to its dynamics such as the monsoon patterns, bathymetry, and the ocean circulation. These dynamics resulting from the interaction between two ocean including the Indian and the Pacific Ocean and two continents including Asia and Australia (Guo & F, 2023; Katavouta et al., 2022; Scroxton et al., 2022). As consequences, these circulations transport various materials, such as nutrients support the life of marine biota and coastal ecosystems (Taufiqurrahman et al., 2020; Xie et al., 2019). However, other harm materials such as heavy metals and marine debris also transported pose a serious threat in Indonesian waters that come from rivers, including those from other countries around Indonesian waters (Adyasari et al., 2021; Purba et al., 2021). The need of monitoring instrument and system is key strategy to maintain the ocean such as prediction and mitigation.
Monitoring related to the ocean condition is highly necessary and recently become a major issue in the scientific community worldwide. Various efforts and methods have been attempted to develop innovative technologies for monitoring marine dynamics and its contents (Marcelli et al., 2014a). The availability of data collected and inventoried from high-precision technologies will be the basis for understanding physical and biological marine processes, especially in the climate change era (Levin et al., 2019; Liu et al., 2017; Roemmich et al., 2009). However, the method in ocean monitoring is mainly still being carried out conventionally through direct methods. The challenge of this method is expensive, limited agencies focusing on marine observation, and the overall complexity of natural ocean characteristics (Gerin, Zennaro, Rainone, Pietrosemoli, Poulain, et al., 2018). To solve this problem, in the past few decades, the revolution in ocean-observing technology has been rising, enabling oceanographic measurement capabilities to produce new and effective ways to observe and monitor the ocean (Wilson et al., 1996). Recently, several low-cost marine instrument have been developed to get a massive data with cheaper cost of production. (Gerin, Zennaro, Rainone, Pietrosemoli, Crise, et al., 2018) built a drifter for developing countries, while (Marcelli et al., 2014b) developed a portable water quality sensors and have tested in open seas.
Therefore, a first design monitoring instrument called NOBEL-BOX Instrument was developed by integrating IoT (Internet of Things) and the low-cost instrumentation concept. This instrument is designed to be a cost-effective solution, offering a budget-friendly option for accurate measurements. The goals of this project are to make small sizes that can be installed on various ships, reduce operational cost, and no need for high human resources to operate. This approach has already been implemented in European countries, especially for installation on ferries, with a cost of around 50,000 Euros (Kuznetsov et al., 2019; Peterson, 2019). Furthermore, this instrument has been able to produce data that can map several phenomena, such as upwelling (Irion, 1998; Langis, 2015), water quality monitoring (Gunia et al., 2022) and carbon sink analysis (Macovei et al., 2021). In Indonesia, the concept of a low-cost instrument to monitor the ocean have been successful with RHEA and ARHEA instrument (Purba et al., 2019; Zenyda et al., 2021). With a proven track record of delivering accurate technical data, this new instrument represents a significant advancement in covering Indonesian seas for the ocean monitoring system. As a result, this instrument offers a valuable tool for decision-makers in Indonesian Marine management (Purba et al., 2023). In general, NOBEL-BOX was designed to measure multiple parameters, including sea-atmosphere temperature, salinity, dissolved oxygen, TDS, and pH, in real time and near-time using the modified Arduino UNO microcontroller system. These parameters collectively offer valuable insights into the state of marine environments, enabling researchers to study climate change, ocean circulation, water quality, ecosystem health, and the impact of human activities on the world’s oceans.
This first design instrument is intended to be cost-effective and can be used on various types of ships, such as fishing boats, cargo ships, and ferries to facilitate measurements without requiring specific research vessels. In Indonesia, there are around 572.000 of fishing vessel and 63.000 commercial ships through Indonesian Seas. The prototype development has to be a compact shape, man-portable, and is able to act as a survey platform capable of providing high-quality data in marine operations. Considering these requirements, the following design needs are obtained the size of the vessel is made as small as possible to allow mobilization and deployment by one or two personnel, low-cost, good charge/discharge capability and battery capacity, and mission duration, where the ability to carry out a mission for five years.
It is a high number of sea transportation and with this instrument is expected that will be able to embedded and operate in all water conditions in Indonesia and provide accurate technical data to determine fishing zones, assess water pollution levels, determine supporting parameters for marine spatial zoning, and monitor water quality throughout Indonesia. The data results from NOBEL can be excellent information related to defence, fisheries, and marine mitigation and regulation for the government and support SDG (Sustainable Development Goals) 14, life below water.
2. Materials and Methods
2.1. System Description
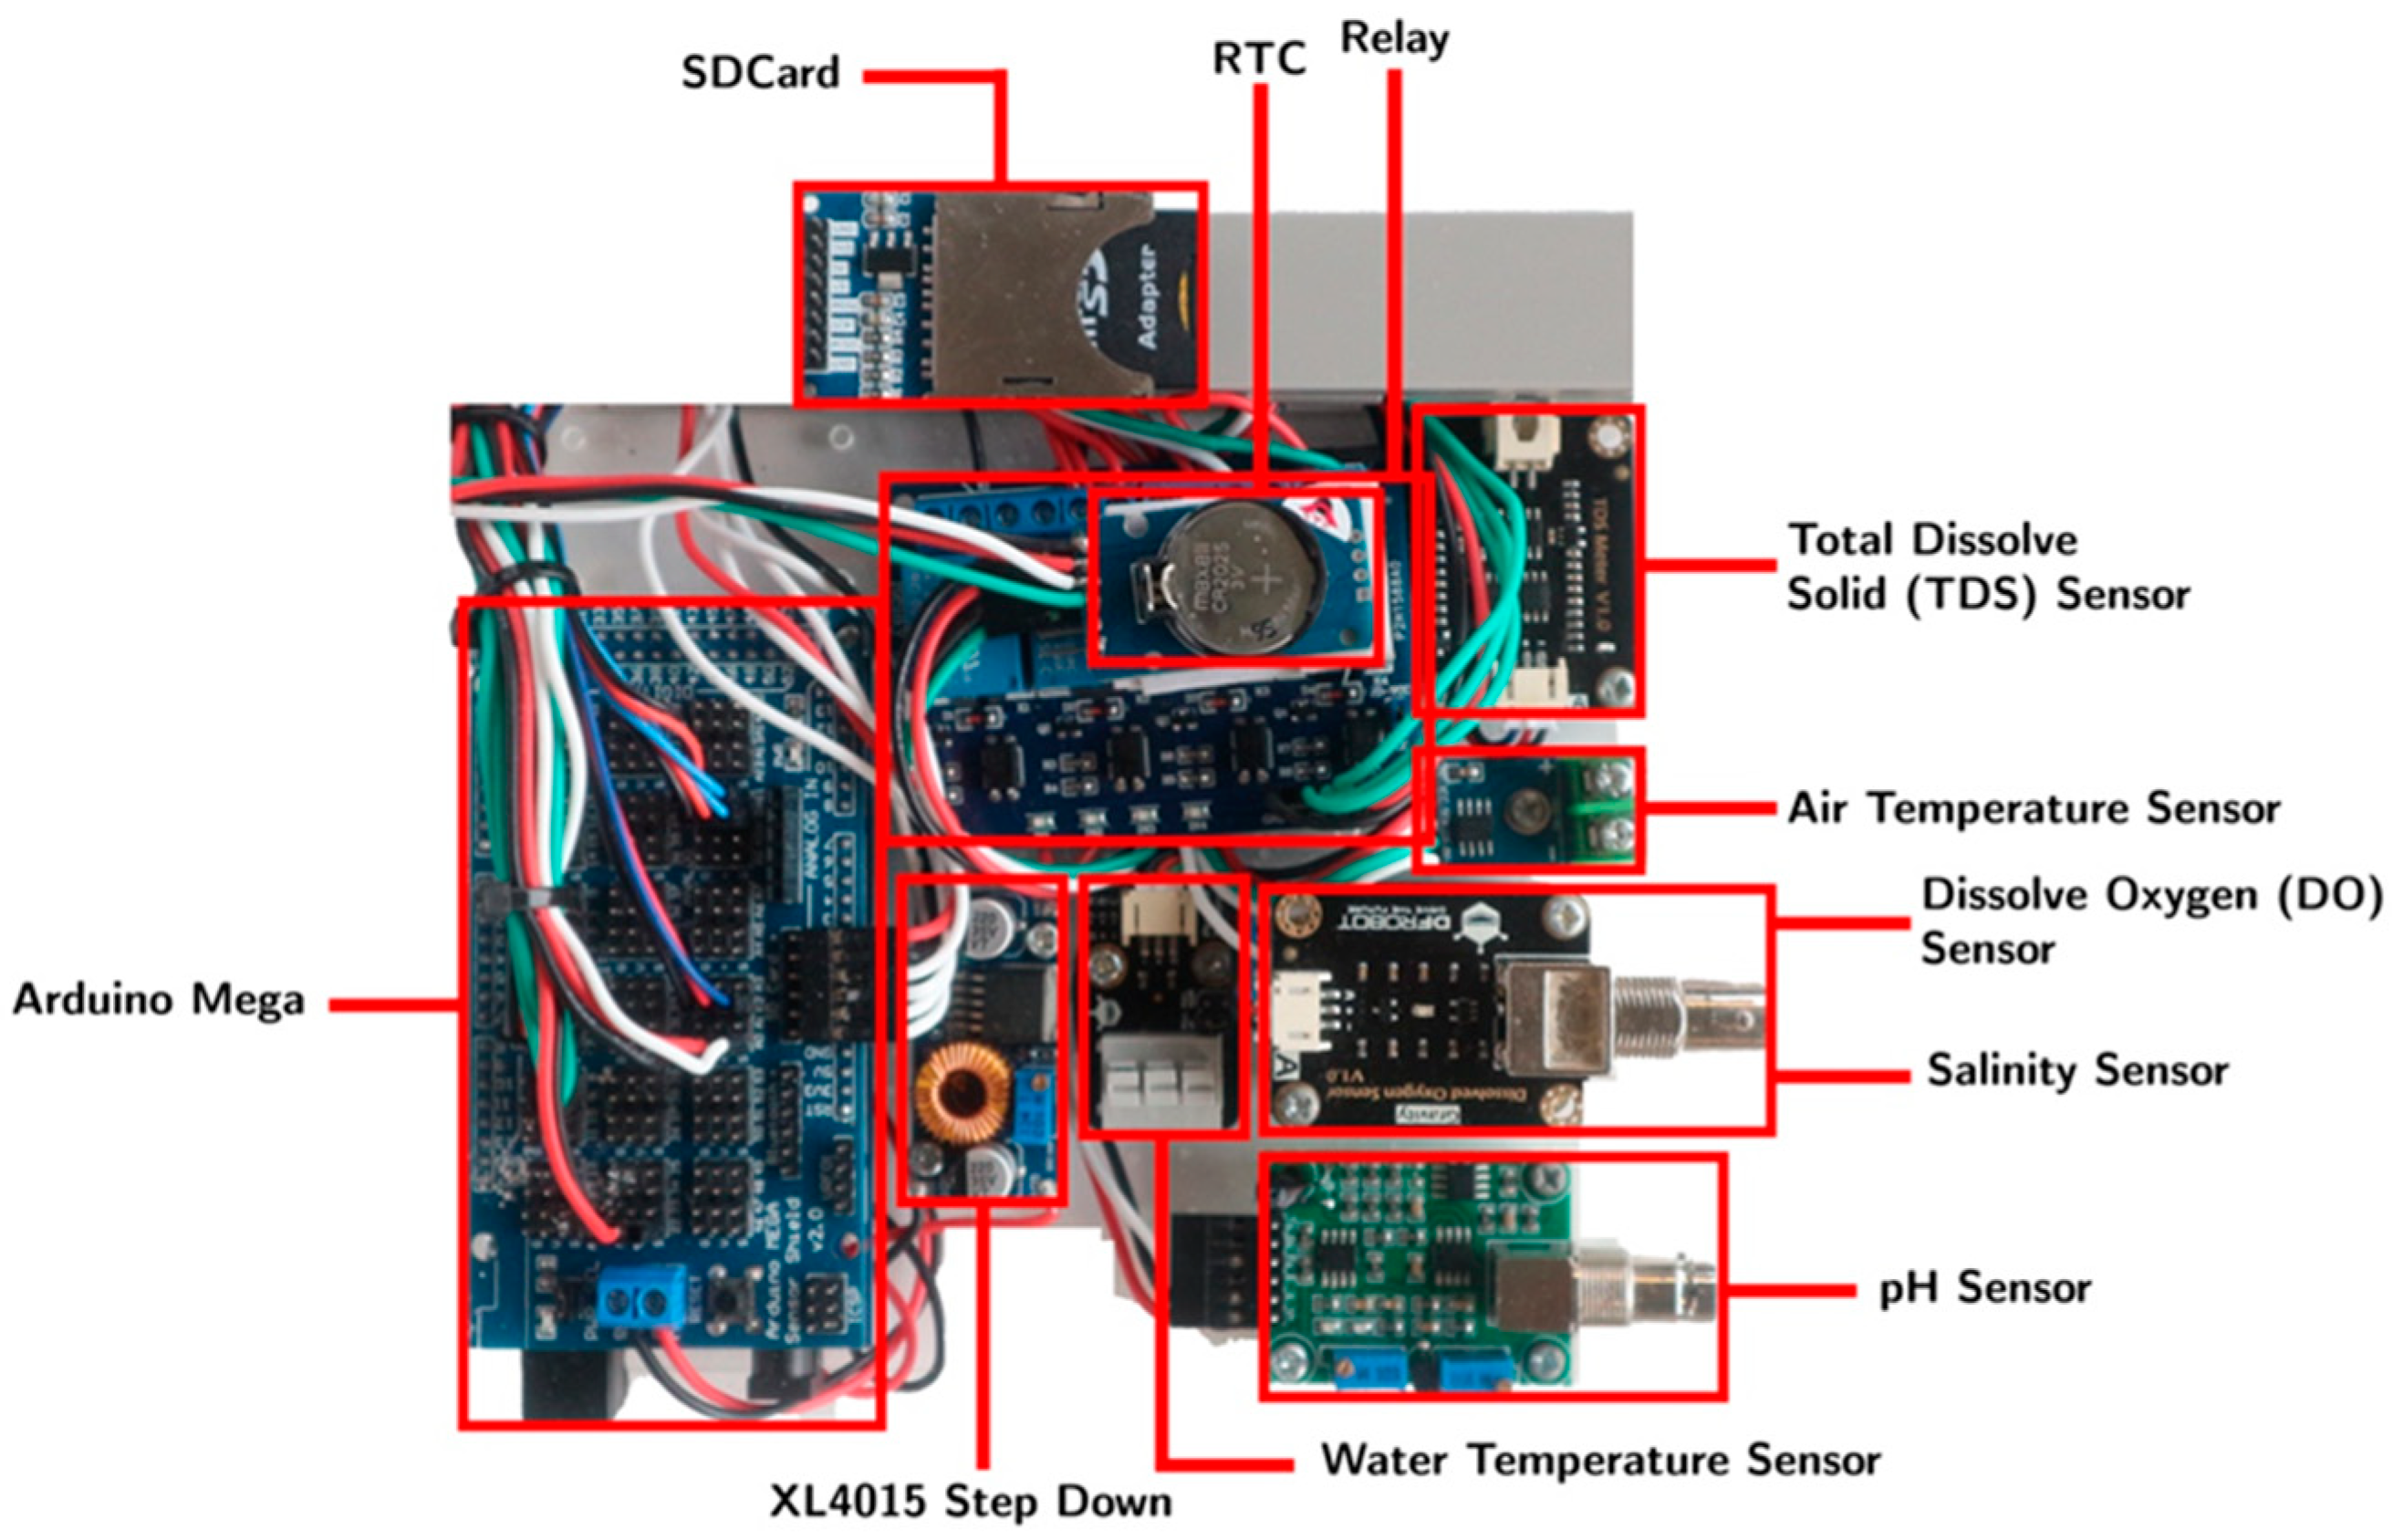
The principle of NOBEL-BOX is to combine several probes including seawater temperature, air temperature, pH, salinity, TDS, and dissolved oxygen. These probes are connected to a microcontroller. A pump system has been added to facilitate the supply of seawater samples measured by this instrument. In general, this instrument is shaped like a box with dimensions of 30 x 40 x 20 cm with a total weight, including when all components have been assembled in the housing of around 15 kg. With this weight and dimension, it is hope that this instrument can be placed on various ships including small wooden ship. Furthermore, the measurement data is stored on a micro-SD card that can be transferred to a desired server using Mobile Communications (GSM) system. The instrument system operation device uses Arduino Uno R3 and Arduino Mega 2560 microcontrollers (
Figure 1).
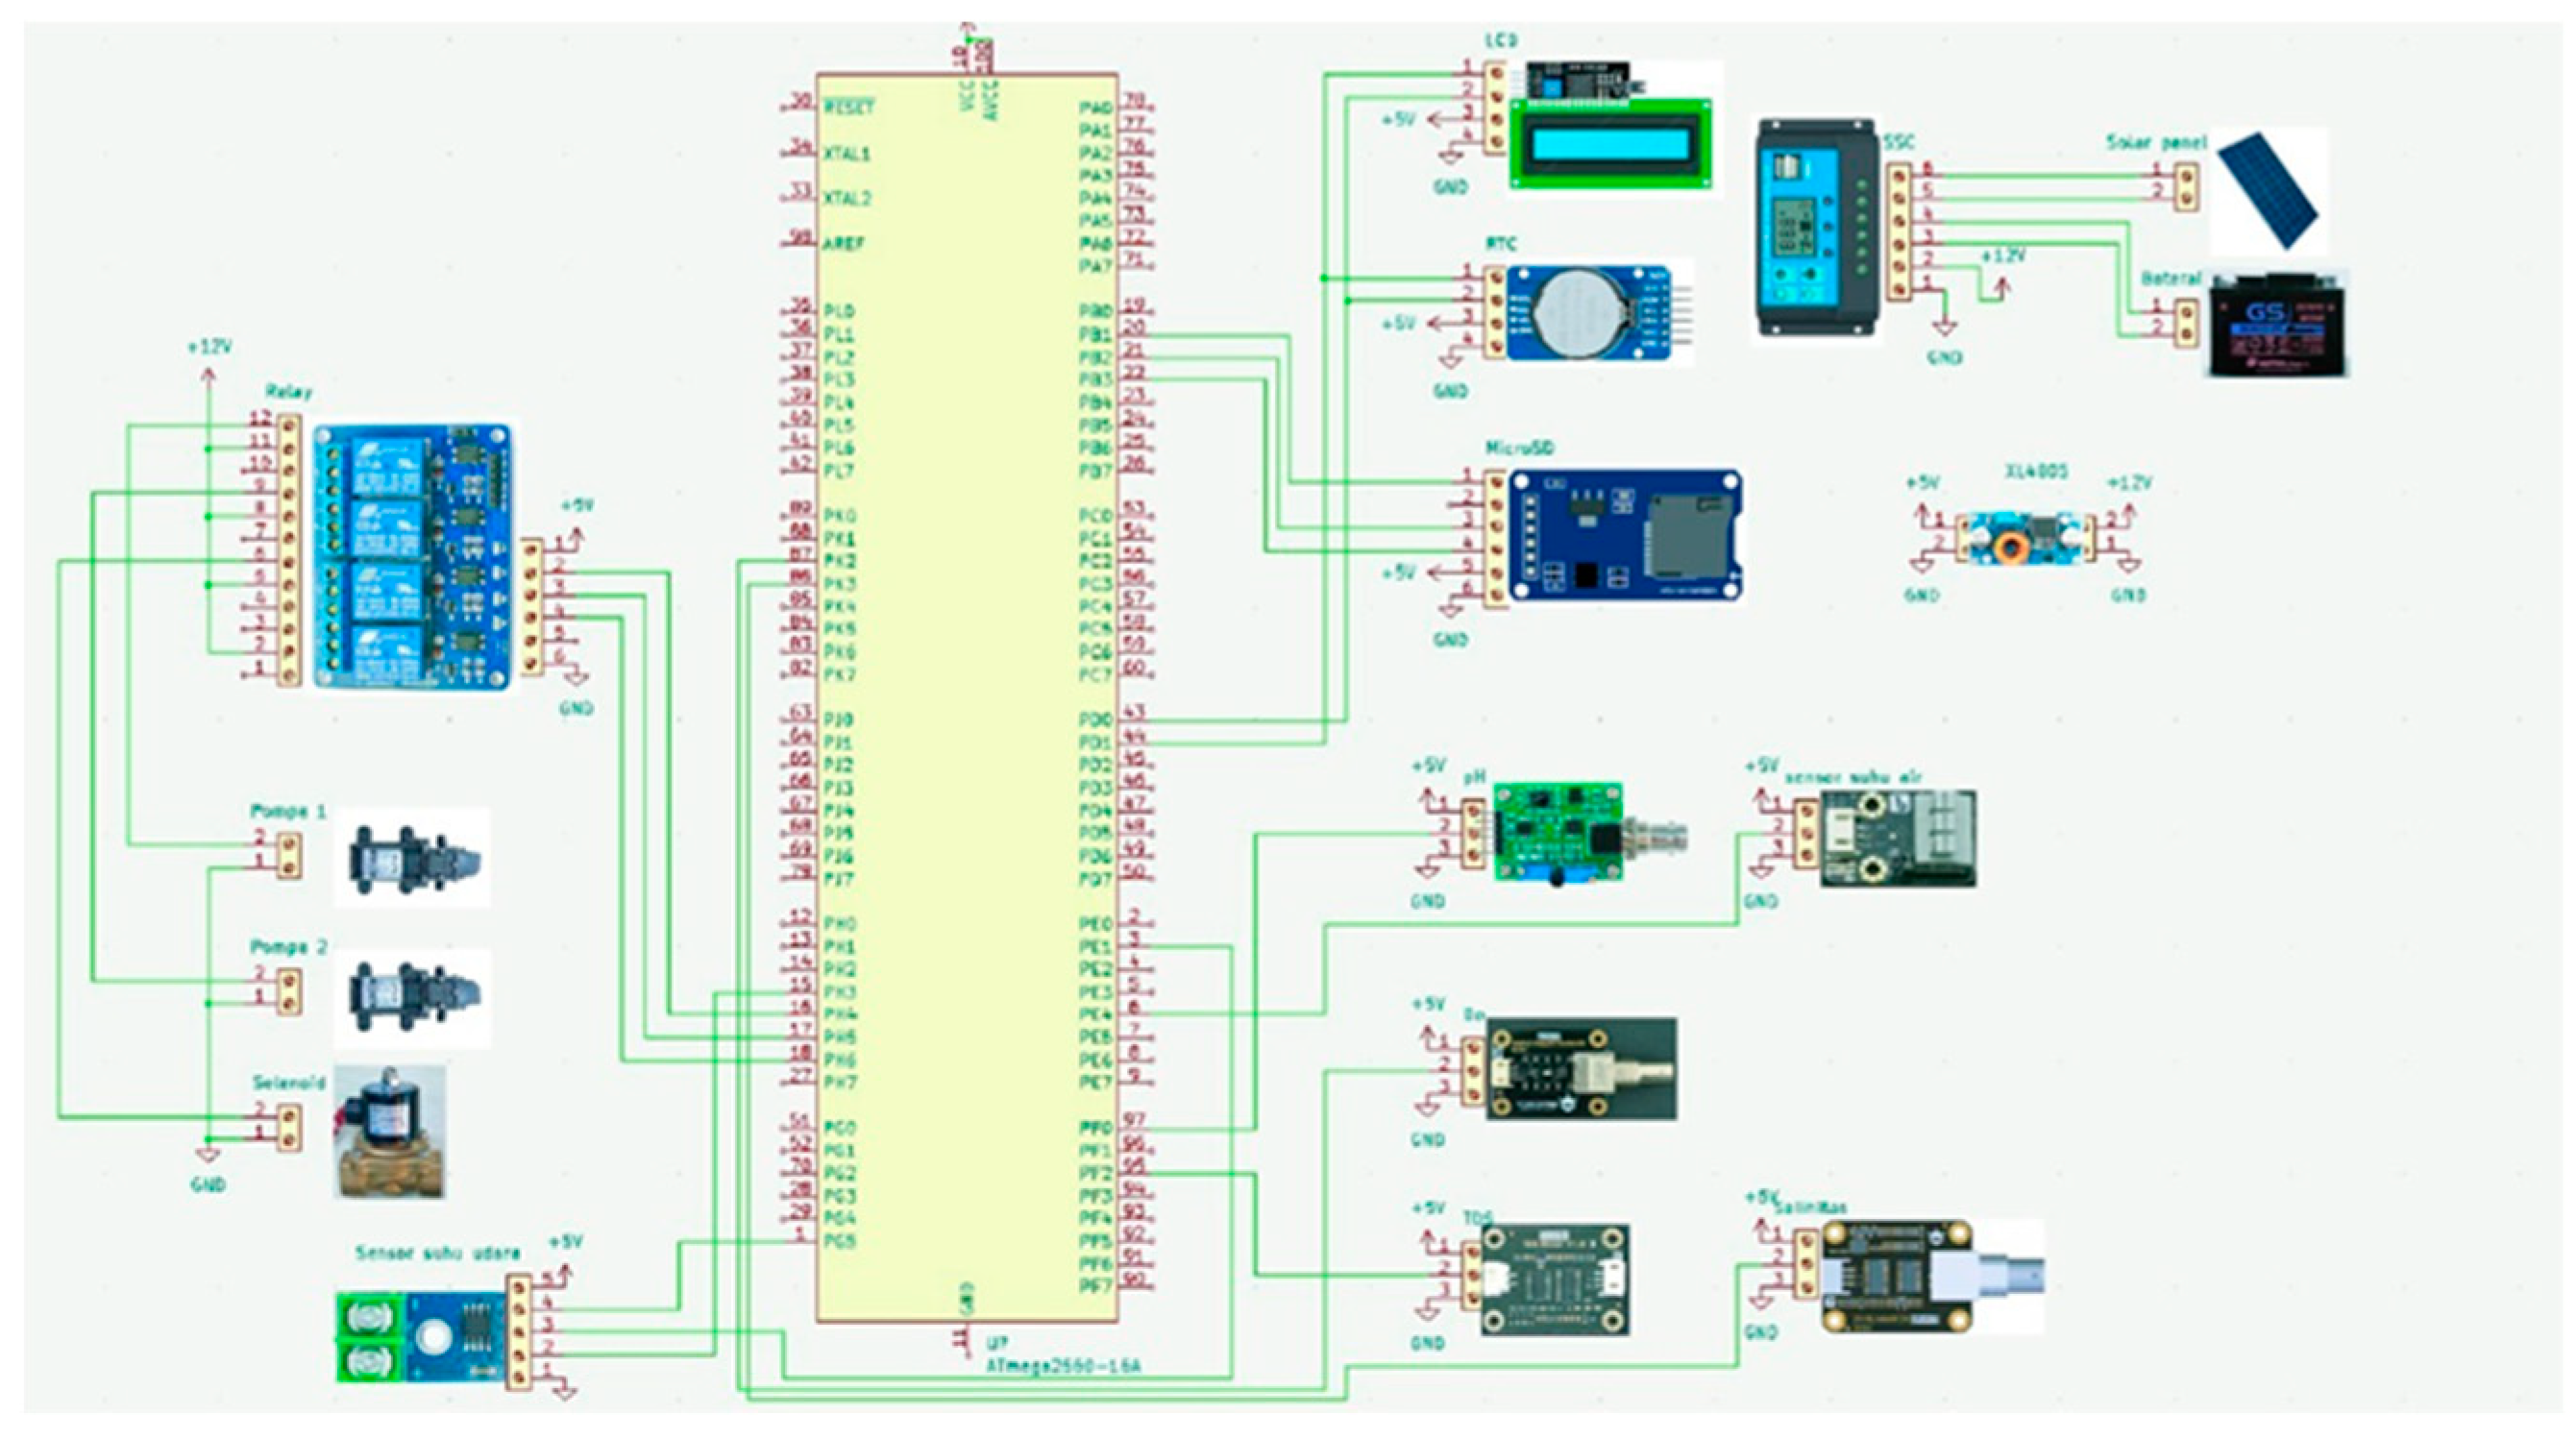
The microcontroller is assembled through the Arduino Mega 2560 CPU Board (Appiani, 2022) as the central system, equipped with other components such as the XL4015 Step Down (XLSEMI, n.d.) to reduce the voltage, a Solid State Relay (Technology, 2015) to automate the water pump, sample measurement, and solenoid automation regularly, DS3231 RTC (Maxim Integrated, 2015) to display real-time clock, a MicroSD Module (EBay, 2013), and an SD Card to store data. It also has modules measuring seawater, such as TDS, pH, water temperature, atmospheric temperature, salinity, and dissolved oxygen. It has an LCD (Hitachi, 2015) to display real-time measurement data and clocks (
Figure 2).
An ACCU/battery is used to power the instrument. Other components including a seawater pump and a freshwater water pump to clean the sensors after sampling is attached in the housing. The NOBEL-BOX is equipped with a small shelf to facilitate replacing the ACCU when it is no longer usable and making it easier to remove the microcontroller in case of a short circuit. The seawater tank with a built-in sensor is not permanently attached. Still, it is designed to be easily replaceable, with a hole equipped with rubber to prevent water leakage and make it easy to remove for sensor maintenance. The clean water tank is designed to be easily filled, with a pipe extending upward to allow for filling without opening the box. Furthermore, to maximize usage, a non-conductive separator must be placed between the sensors or limit the sensor’s range, as the sensor emits electrical energy that needs to be separated to obtain accurate sensor values without interference from other sensors. The characteristic of sensors can be found in
Table 1.
2.2. Operations Instructions
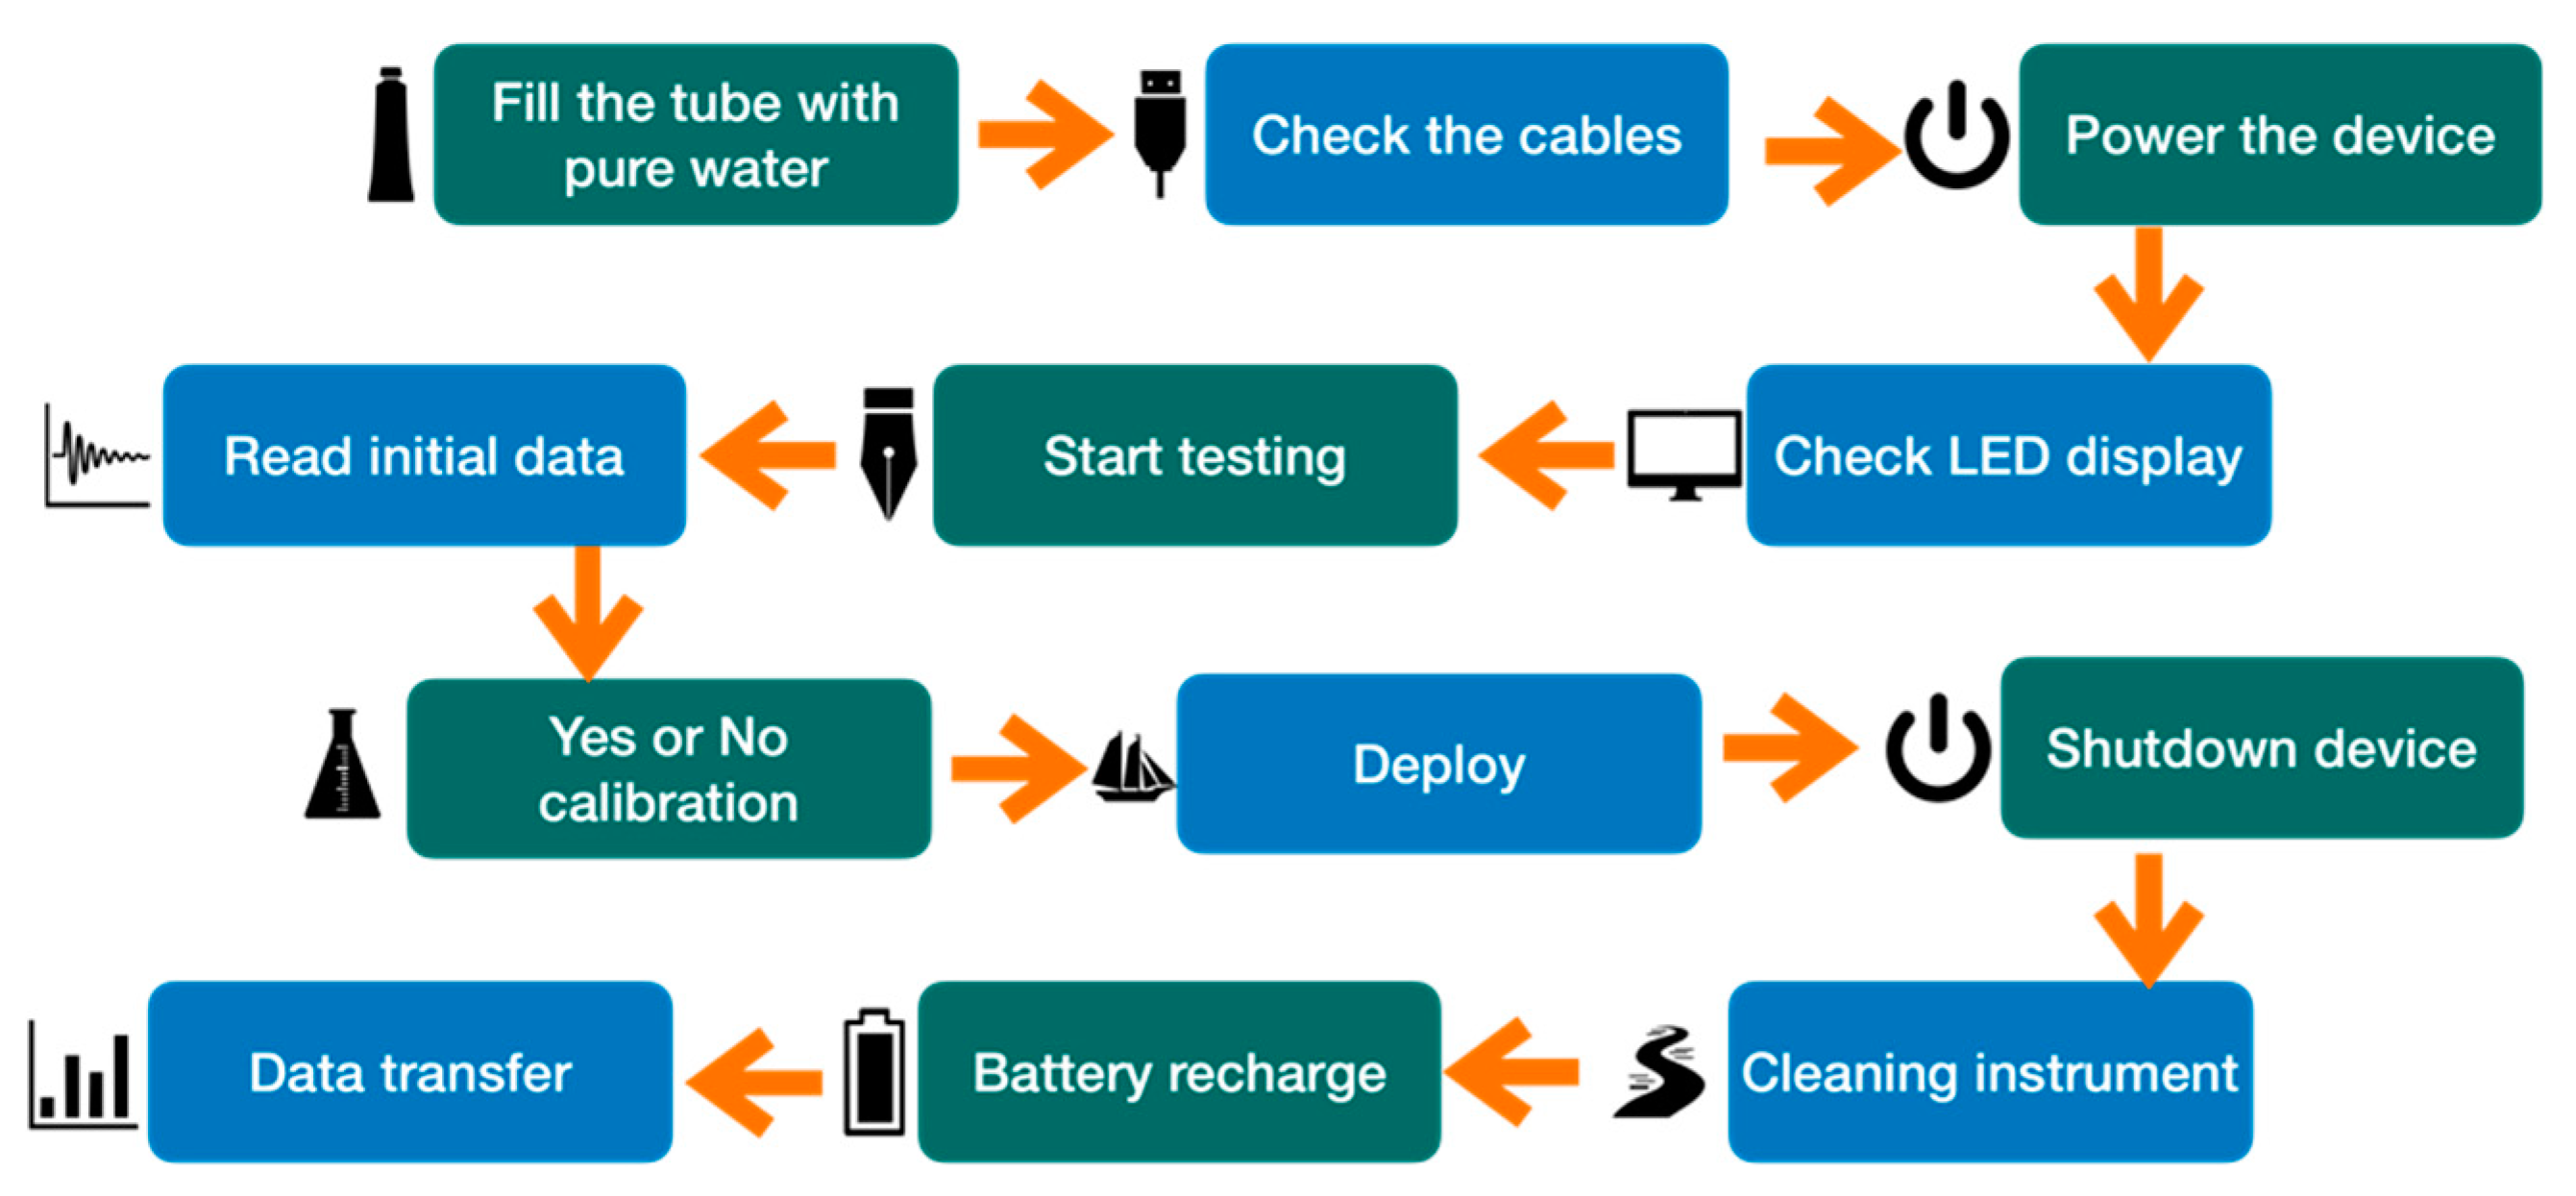
Before being installed on the vessel, inspections of the data storage, battery capacity, and LED must be conducted. During field testing, this instrument stores data in a memory card and can transmit data via a GSM signal to adjust to data conditions and needs. The stored data is in .csv format and can be opened with various simple applications that can be visualized. In concept, NOBEL-BOX is designed to be placed on all types of vessels and in all water characteristics to generate accurate data in complex water environments. The step-by-step guide can be seen in
Figure 3.
In the field trial, the NOBEL-BOX can be set to measure depending on the purpose of monitoring. In this project, after the system is turned on, it will cycle to measure water quality every ten minutes. The seawater sample measurement is taken after the measurement tube is filled with the sample. The system will turn on and prepare for three minutes. Then it will pump seawater for 3.5 seconds. After that, the sensor will measure the water that has been collected in the seawater tank for two minutes. Then the solenoid will open to dispose of the measured seawater sample. After that, for 3.5 seconds, the clean water pump will turn on to clean the remaining seawater, flushing any seawater that clings to the tube and sensor. The clean water will be stored for one minute before the solenoid opens to dispose of the water, and the cycle starts again. It is important to note that if water leakage occurs and causes the pump or microcontroller to short circuit, attention should be paid to the wave height and water that can enter the box.
3. Results
3.1. Final Design
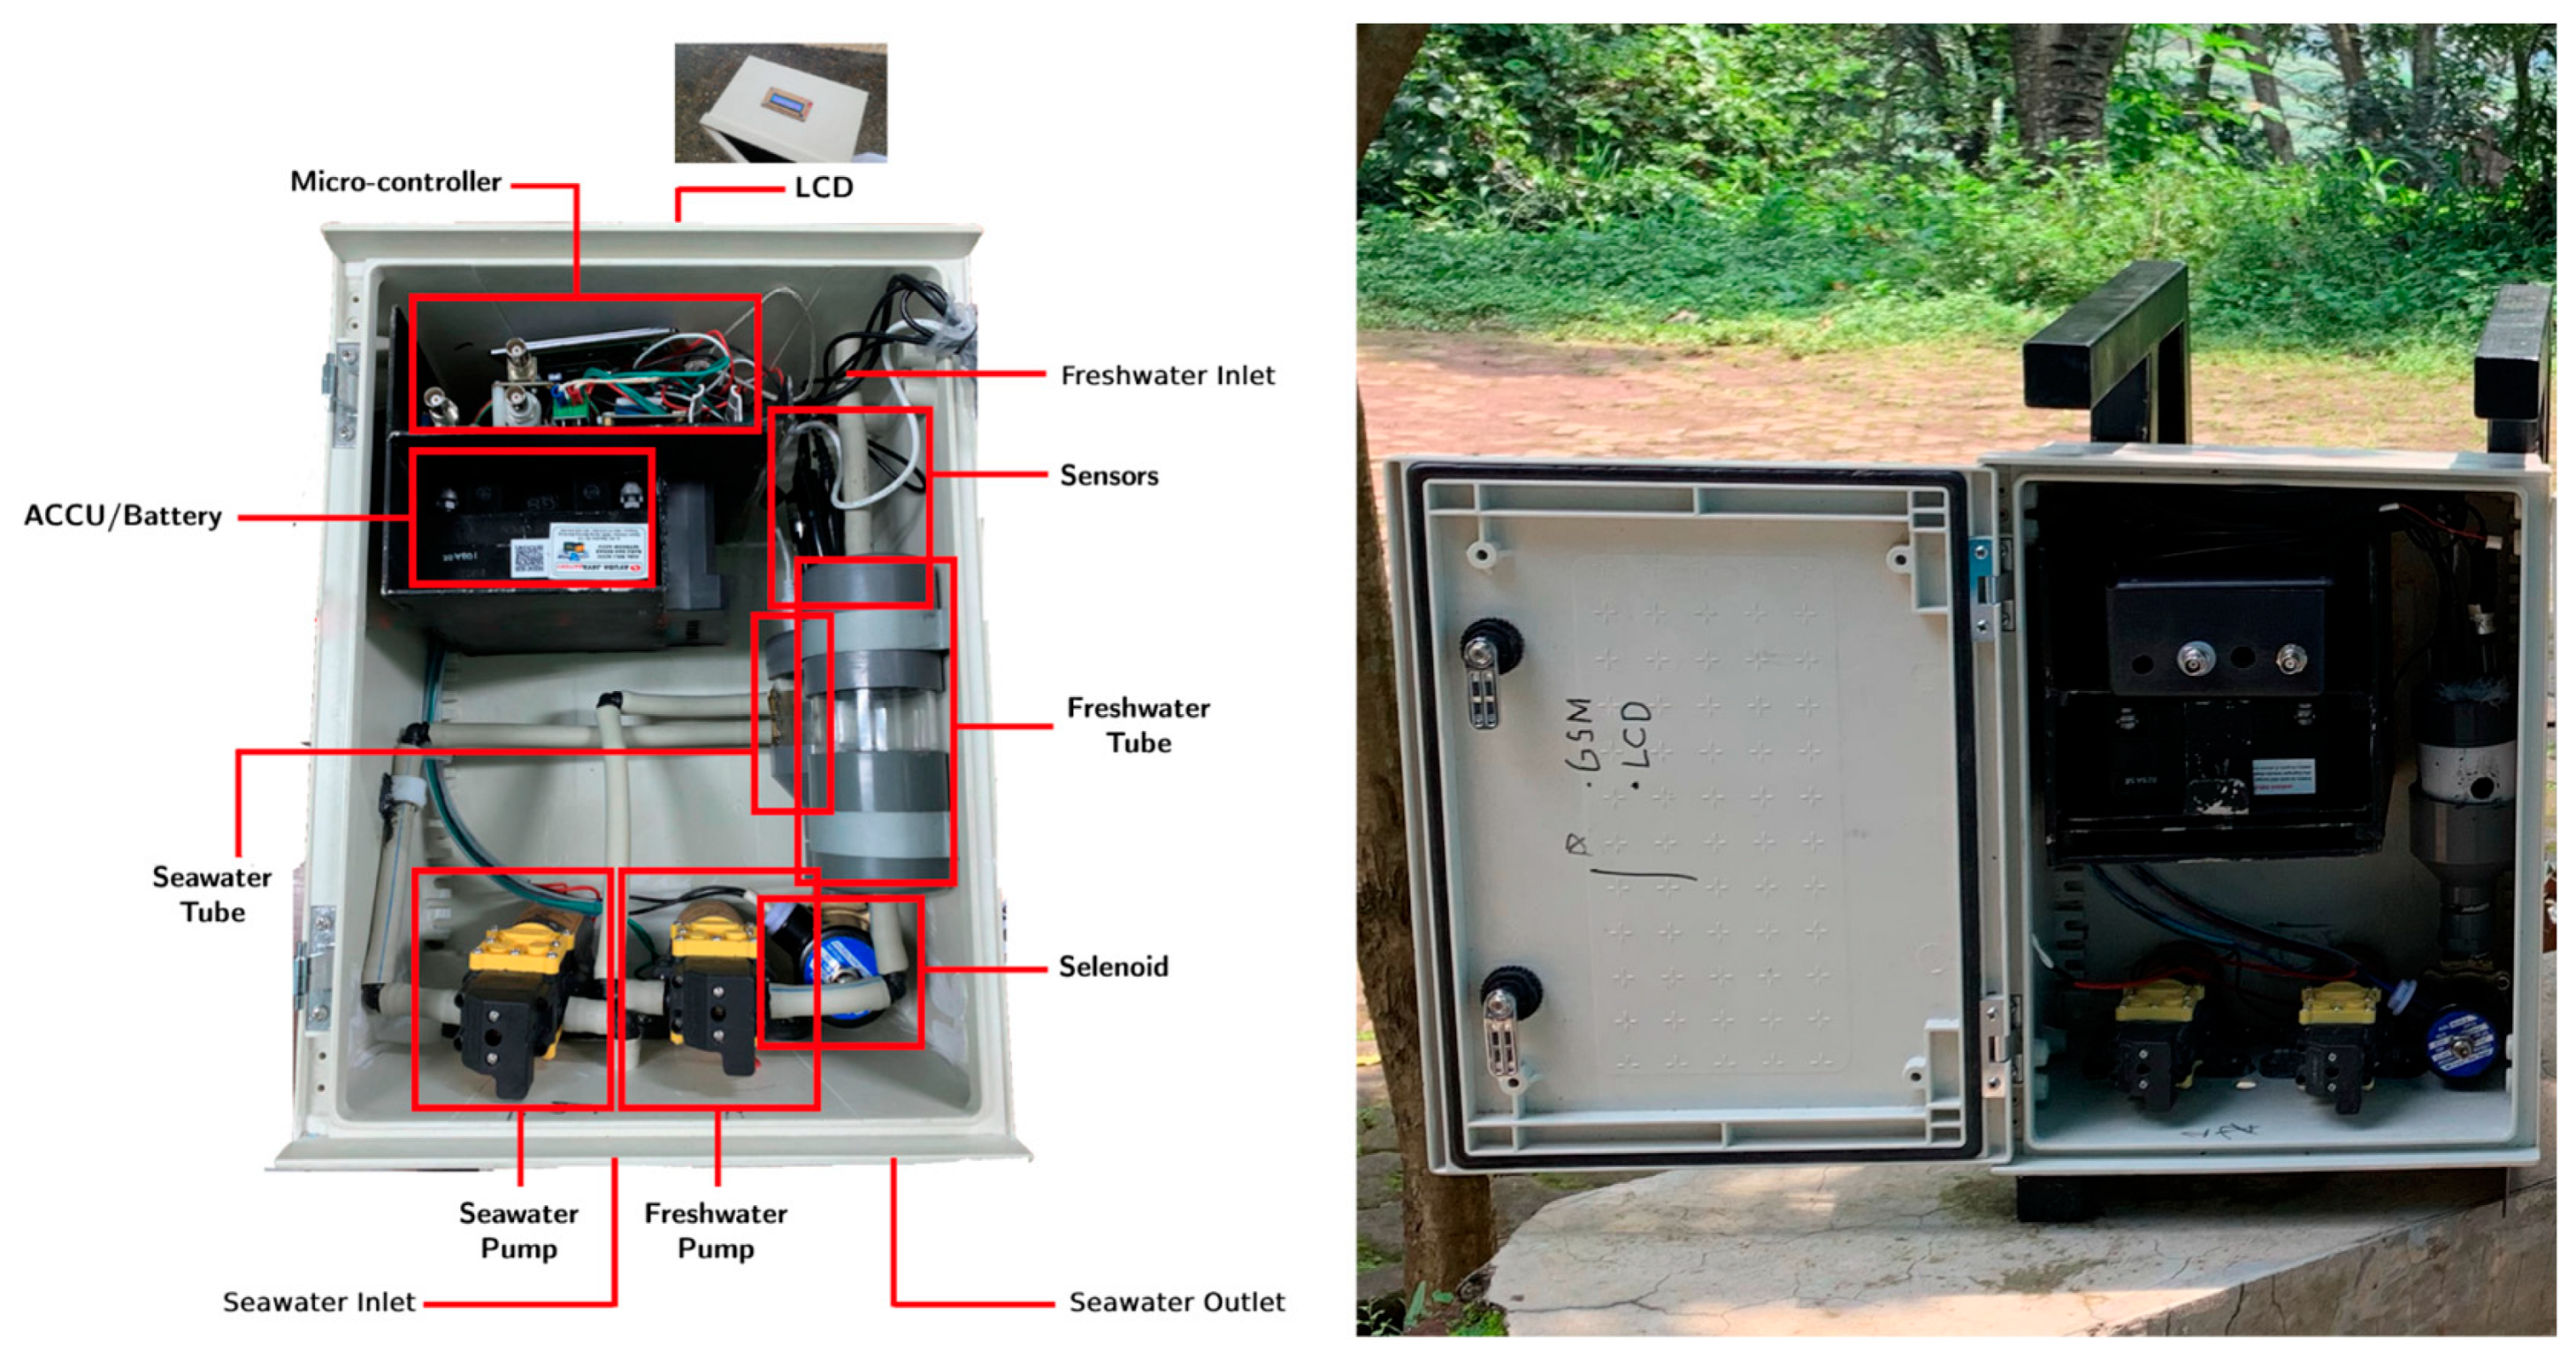
The final design of the NOBEL-BOX takes the form of a compact and practical box shape. The box is found from online market. This box-like structure is complemented by a support frame at the back, ensuring durability and stability during installation and operation (
Figure 4). The integrated frame not only adds robustness to the design but also contributes to its adaptability for placement on various vessels, including smaller ships.
This box is made of fiber material and is resistant to water splashes. On the inside, there are rubber partitions to prevent water from entering the housing. Subsequently, the placement of the solenoid, freshwater tube, and seawater sensors tube is on the right side, while the microcontroller and battery are positioned on the upper left side. Below, there are pumps for seawater and freshwater. The freshwater pump serves the purpose of cleaning the sensors after measurements are taken. In other sections, there are cables and pipes. Freshwater is introduced from the top, while a pipe is present to draw seawater located on the lower right side. At the back, there’s a supporting frame designed to adjust the positioning of the NOBEL-BOX according to the ship’s conditions, enabling easy installation. Furthermore, during maintenance, the supporting frame can be detached from the main housing, facilitating transportation. This supporting frame can be replaced or adjusted in shape to suit the ship’s conditions.
3.2. Testing
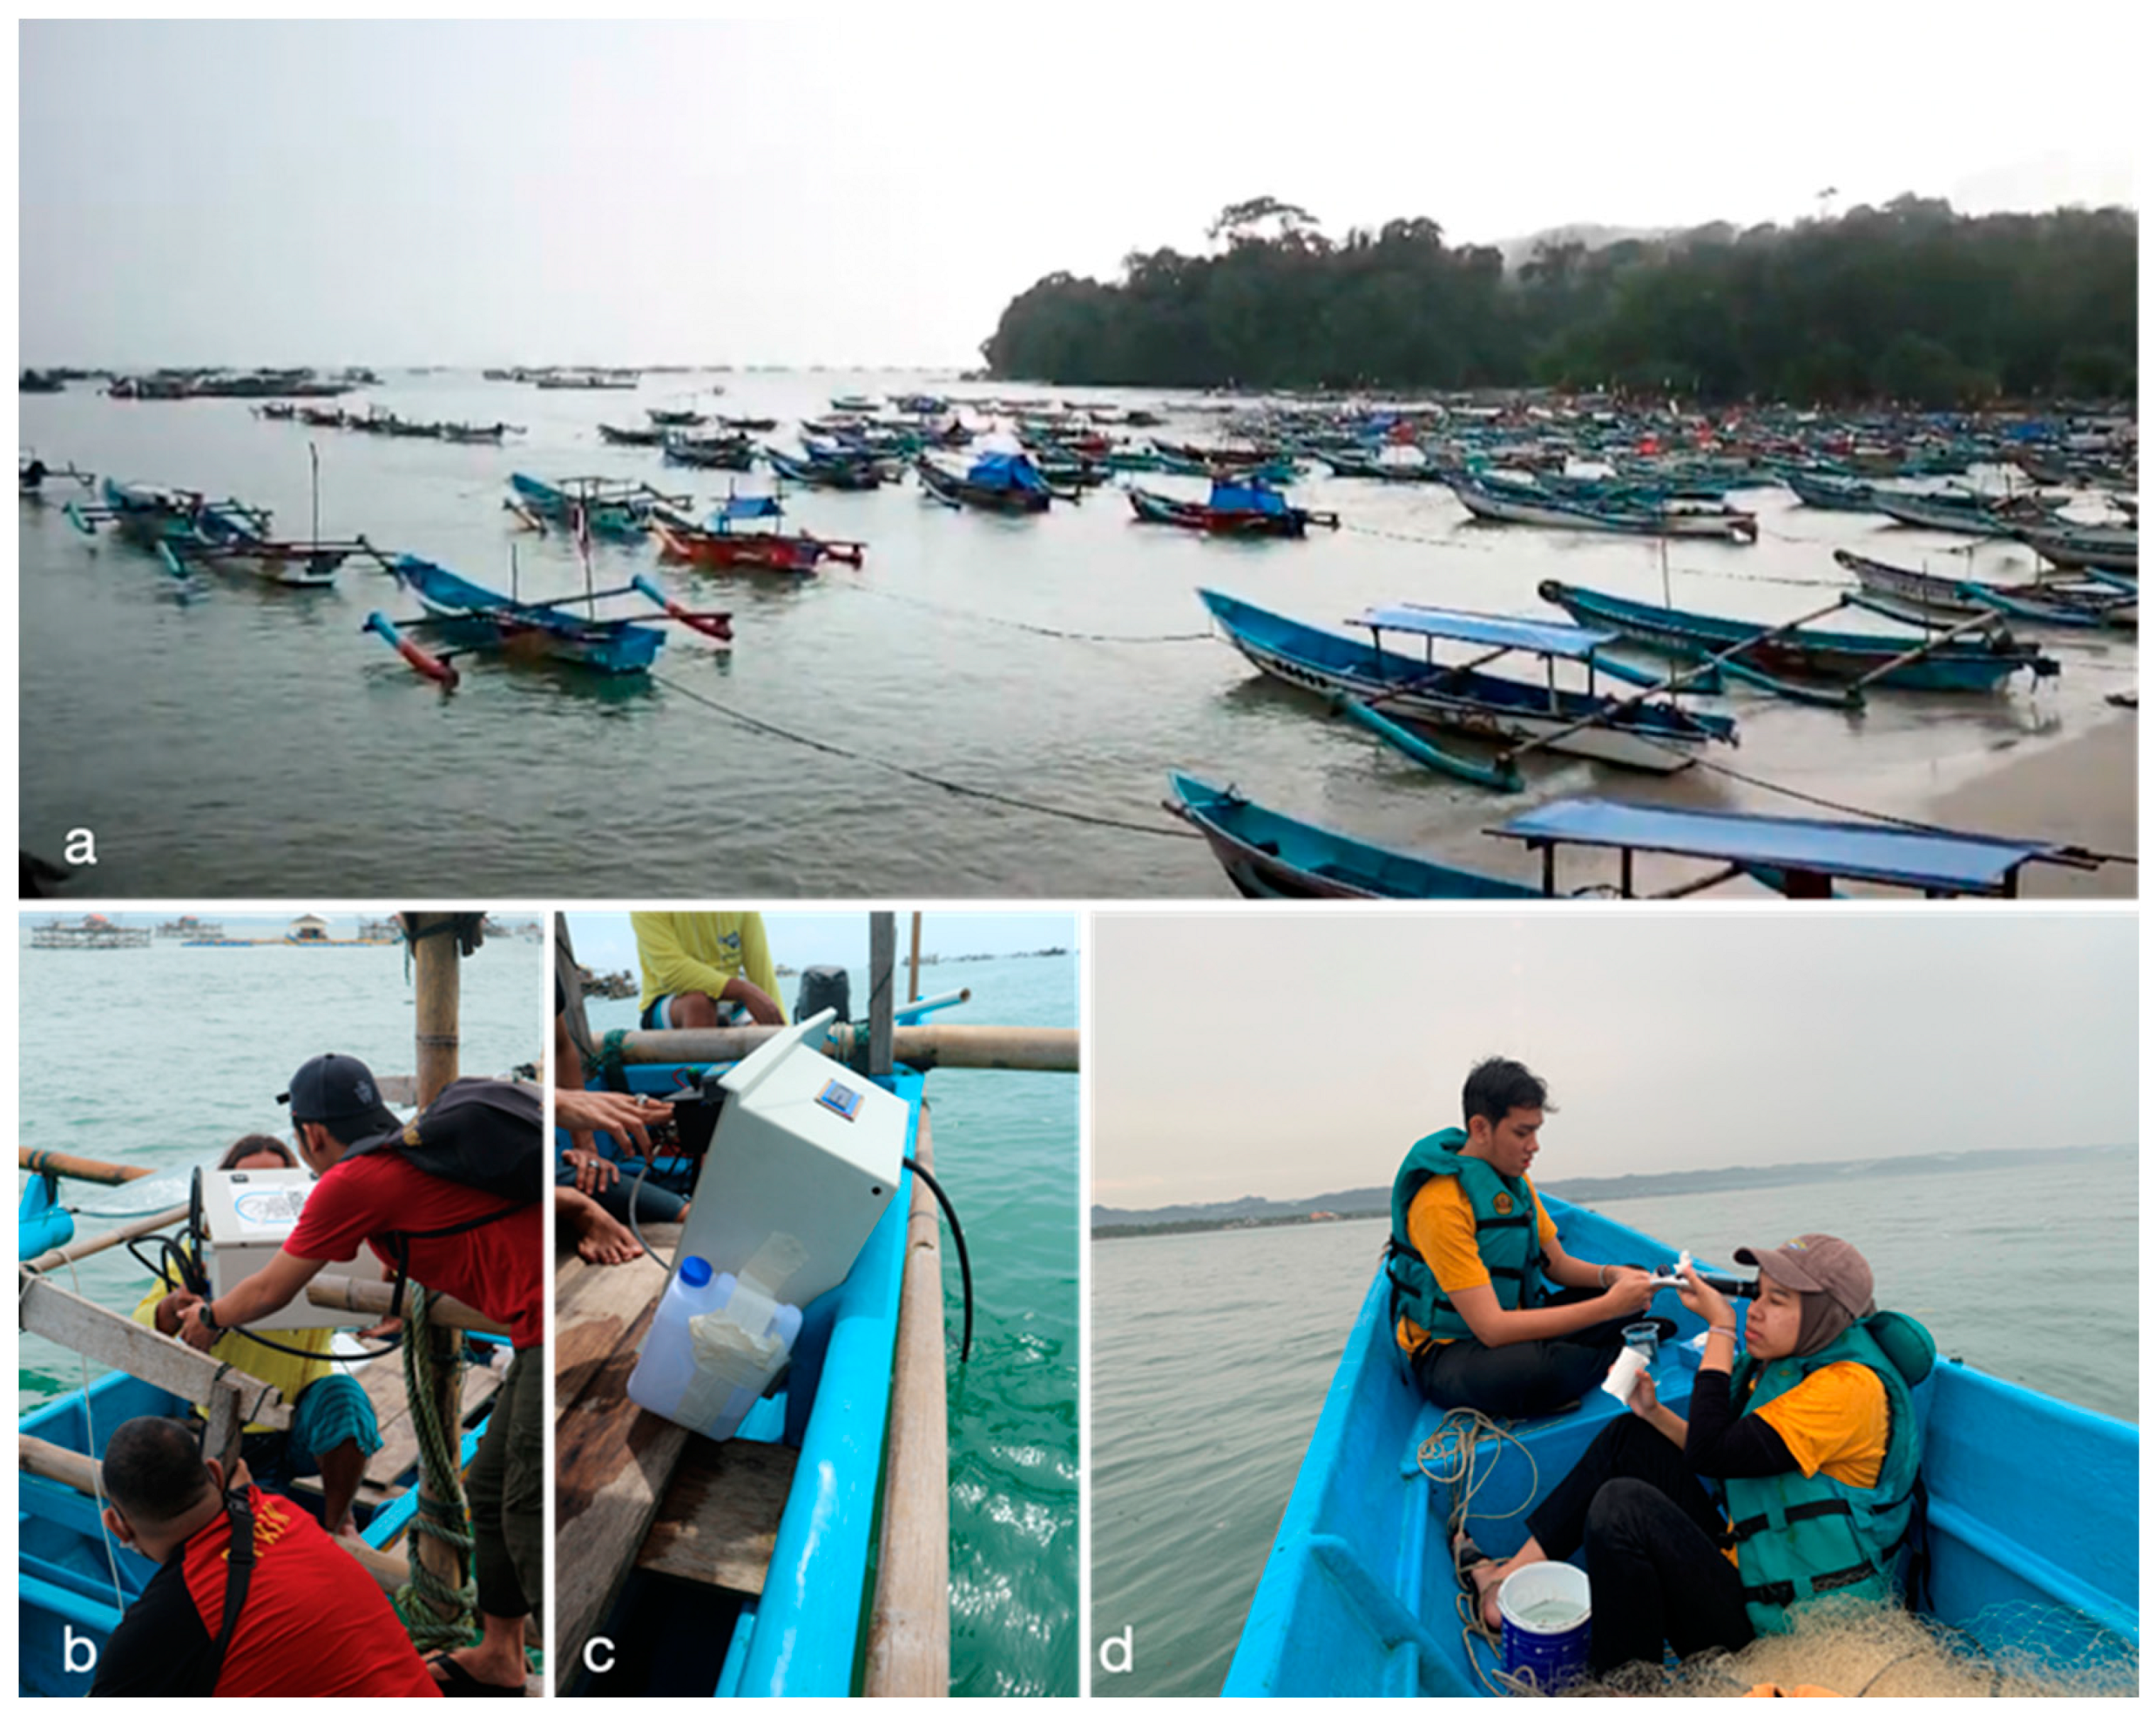
NOBEL-BOX has been tested in the freshwater ponds, laboratory, and in the East Coast of Pananjung Village, Pangandaraan District, West Java. In the freshwater ponds area, tests were conducted to assess the instrument’s capabilities in performing its functions. Subsequently, in the laboratory, tests were carried out by examining the data generated through sensor responses to changes in water conditions. This was achieved by mixing seawater with freshwater at various volume differences. Final test (sea trial) was conducted in Pangandaraan Bay that located in southern of west Java. This area is characterized by a Marine Protected Area (MPA), tourism and fisheries activities around the bay. The waters directly face the Indian Ocean, which has strong ocean currents and high waves (
Figure 5).
The NOBEL-BOX instrument was tested for two days (December 6 to 7, 2022) under cloudy and light rainy weather conditions. The instrument was mounted on a 5 GT wooden fishing boat, and measurements were taken along the west coast of Pangandaraan at pre-determined stations. The primary objective of the test was to thoroughly evaluate the performance and functionality of the sensors integrated into the device. Throughout the course of this assessment, a distinct configuration was adopted: the length of the seawater pump-pipe was precisely set at 2 meters, while the device’s placement relative to the surface of the water was consistently maintained at a depth of 0.5 meters.
3.3. Data Analysis
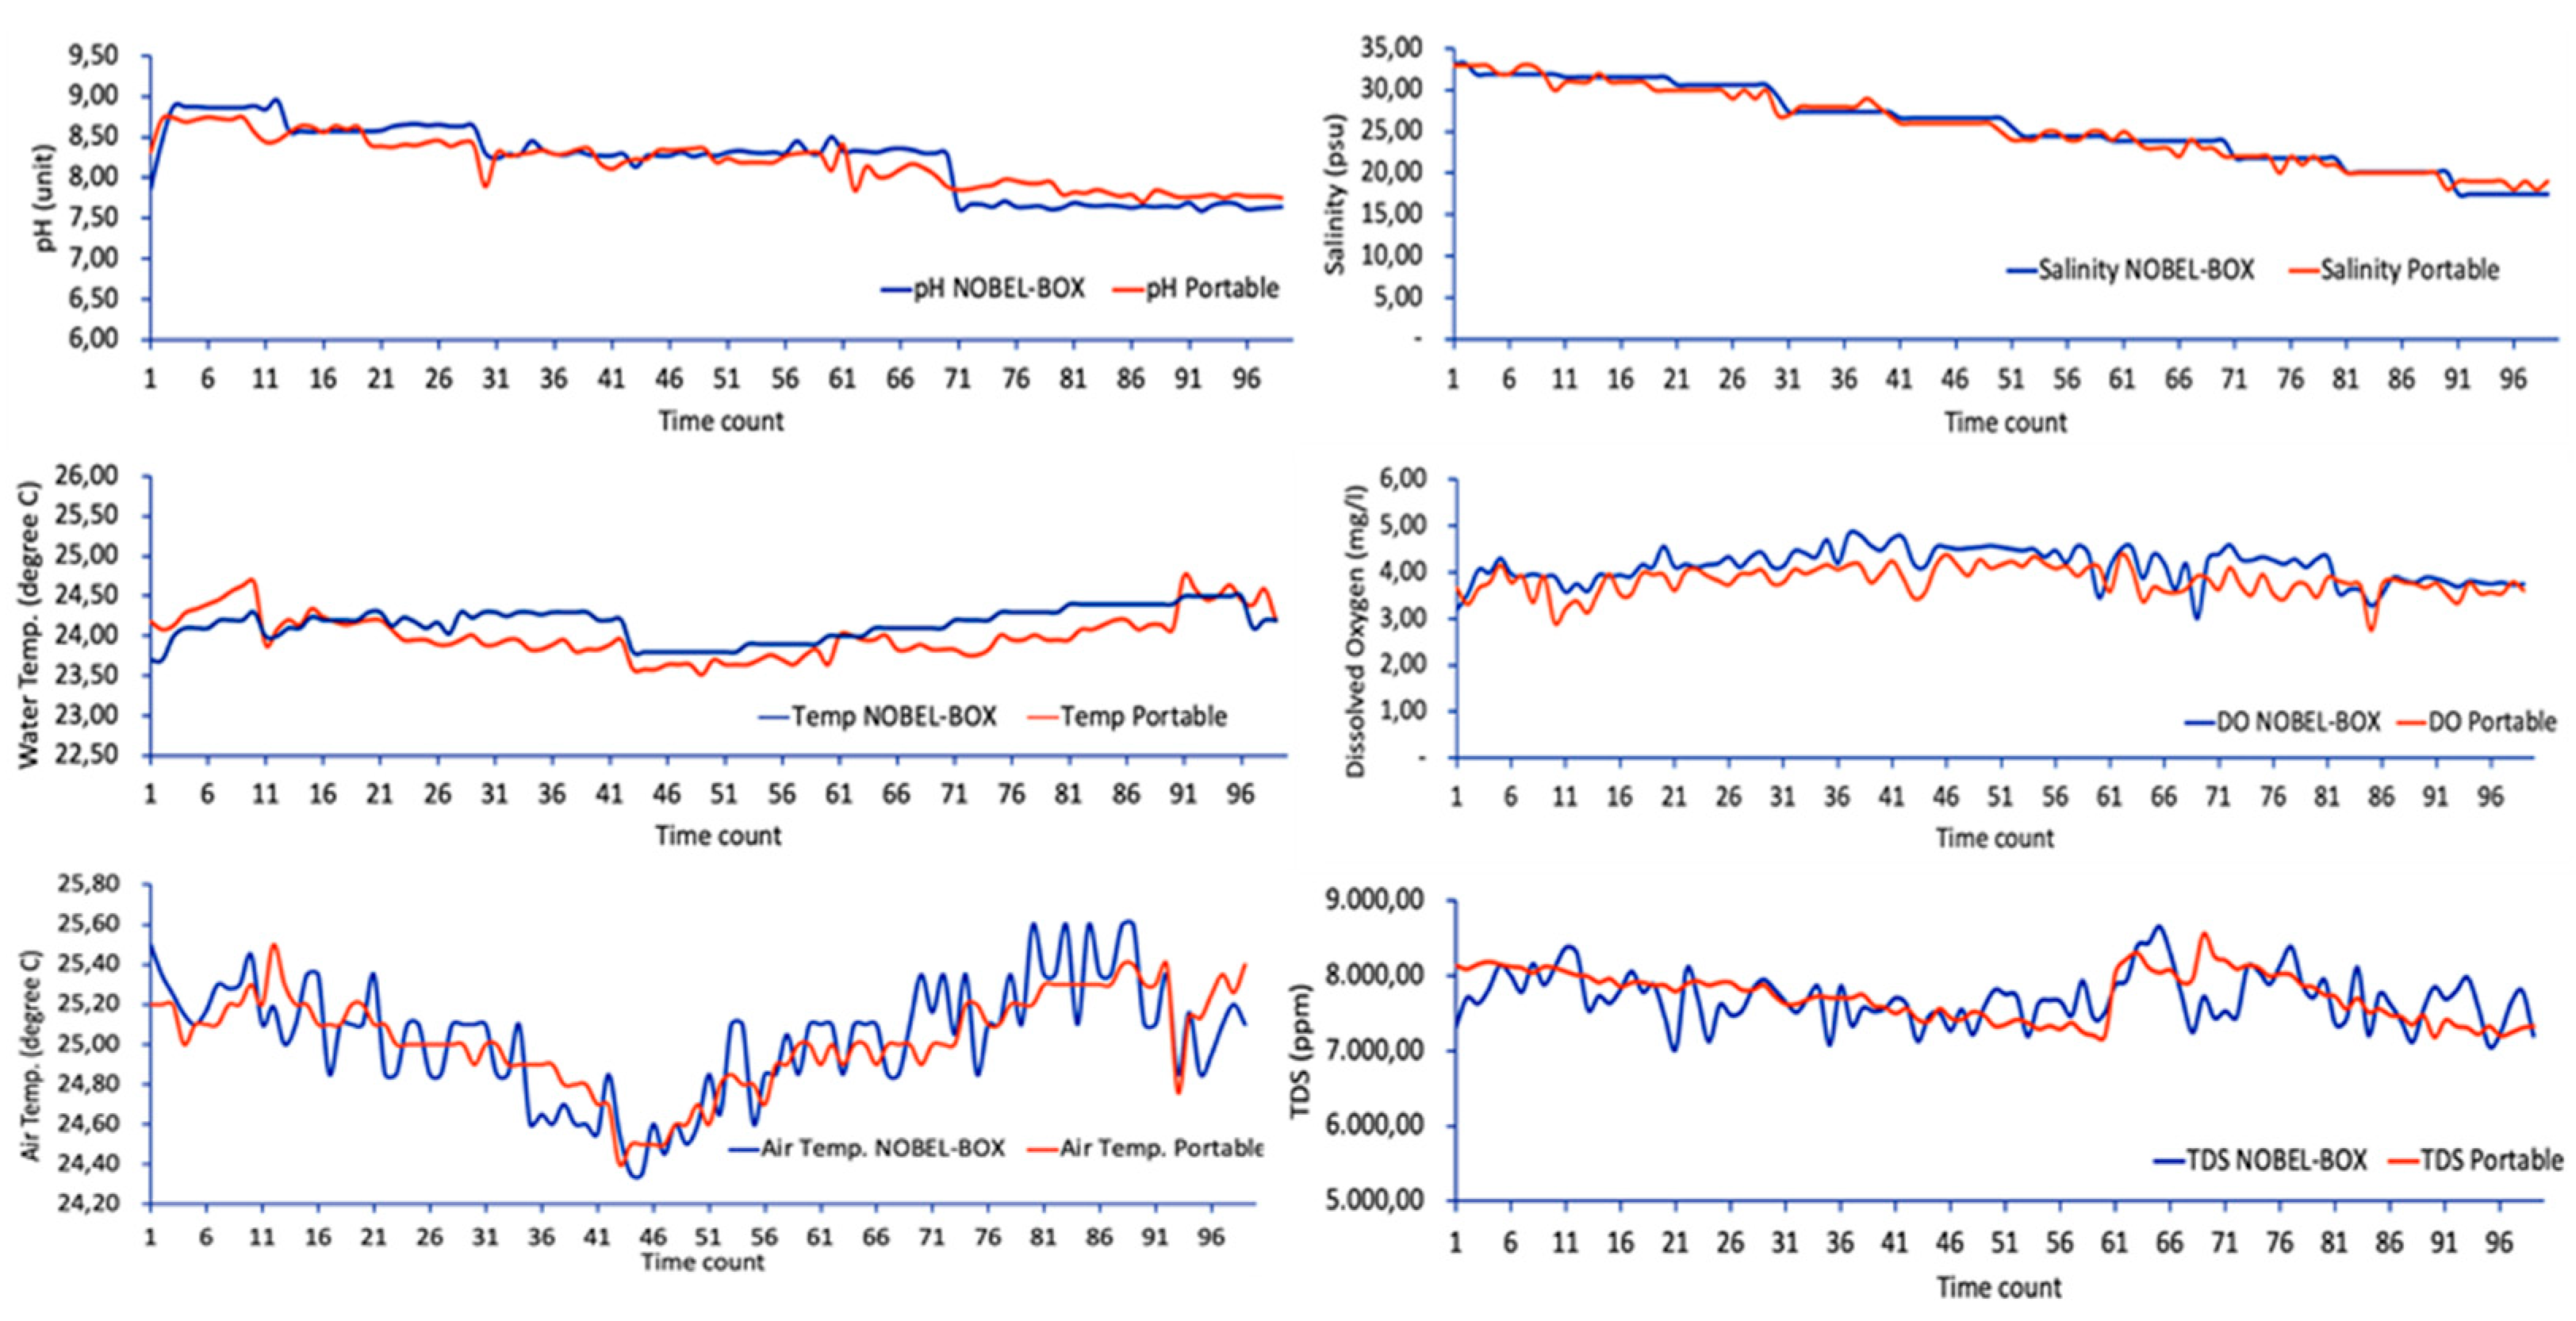
The data obtained can be processed using M.S. Excel or Ocean Data View (ODV) software to be presented as graphs to observe temporal or spatial data (Firing et al., 2012). During the trial, both in freshwater tanks and in the ocean, the sensors installed in the NOBEL-BOX were compared with data from other portable sensors. For salinity, an Atago hand refractometer was used; for Dissolved Oxygen, a YSI Pro20 Dissolved Oxygen Meter Pro 20, and temperature and pH using a HOBO Bluetooth Low Energy and Temperature Logger. These kinds of instruments have been widely used for measurement ocean condition and studying complex ecosystem (Judge et al., 2018; Siriwardana et al., 2019; Vinson et al., 2016). The testing process involved data validation and testing of the instrument in both laboratory and field environments (
Figure 6: Table 4).
4. Discussion
In the experiments conducted both in controlled pool conditions and out in the sea, all components functioned without any issues, and the installed sensors successfully generated data (
Figure 1,
Figure 2, and
Figure 3). To this point, the sensors have shown promising results in capturing the measured oceanographic parameters, such as temperature, salinity, dissolved oxygen (DO), and pH (
Table 2). During the sea trial, despite the presence of waves that caused the ship to sway, the instrument remained undamaged and fully operational. Furthermore, based on the design concept that was acquired directly from an online market, it appears that all the components can fit neatly into the housing, including the cables and other things (
Figure 4). However, during the evaluation process, attention was drawn to the arrangement of the cables and pipes, which need to be more organized at the rear. Furthermore, the weight of the NOBEL-BOX instrument is now suitable, as it can be lifted by a single person. It is important due to the fit with the man-portable instrument concept (
Figure 5b). In addition, the use of biodegradable materials, among those available on the market today, is also an important factor to consider; it lessens the environmental impact that any leakage into the sea would have and thus makes it more environmentally friendly.
Selecting the optimal location for the instrument placement is vital to ensure the integrity of the data it collects. The optimal positioning of this instrument is alongside the vessel (
Figure 5c). Placing the instrument at the rear of the ship could result in the seawater being stirred by the ship’s propellers, leading to compromised data accuracy due to turbulence. If the instrument were to be placed directly behind the ship, the measurements it takes could be influenced by these disturbances, leading to inaccuracies in the collected data. By positioning the instrument alongside the ship, it remains in a relatively undisturbed flow of water. This minimizes the potential for mixing and turbulence, allowing the sensors to capture a more representative and precise snapshot of the seawater conditions. Consequently, the data collected would be more reliable and reflective of the actual environmental parameters.
The battery installed in this instrument has the ability to charge or discharge with sufficient battery capacity, allowing it to carry out its mission for up to five years with calibration every year. The battery embedded in the NOBEL-BOX has the ability to monitor battery voltage. It can be directly observed with a battery indicator scale ranging from 0 (low battery) to 4 (full battery) bars. The battery consumption depend on the data collection time and length of the seawater pump. In the sea trial, the length of the pipe measures approximately two meters (
Figure 5c). It’s important to note that as the length of the pipe increases, a corresponding effect emerges: the duration for which the battery remains operational also increases. This correlation between pipe length and battery lifespan is attributed to the intricacies of the system’s energy consumption. As a result, the battery is able to power the instrument for an extended period before necessitating recharging or replacement. This further underscores the importance of tailoring the instrument’s configuration to meet the specific demands of its application environment.
5. Conclusions
It can be concluded that NOBEL-BOX is a necessary marine instrument due to its efficiency and economic benefits. Therefore, the development of the prototype is designed to be compact in size, man-portable, and act as a survey platform capable of providing high-quality data in marine operations. While this first design instrument does not possess waterproof and buoyancy features, several assessments will be a top priority in the subsequent development stages. The incorporation of water resistance and buoyancy capabilities will be addressed through rigorous testing and adherence to international standards to ensure the device’s suitability for marine applications.
The data generated by this instrument allows for monitoring from semi-enclosed waters to open ocean. Regarding the Indonesian seas as archipelagic countries, this instrument has benefit to observe external factors that may disturb the ecosystem and biota. The NOBEL-BOX instrument is a cost-effective solution for mapping marine conditions in a specific area. It provides accurate and real-time data for effective marine management. The design process involved the creation of a compact and portable device that can be easily installed and used on all types of vessels. This research presents a valuable contribution to oceanography, providing a cost-effective solution for real-time monitoring of marine conditions.
Author Contributions
Noir P. Purba: Conceptualization, Methodology, Original draft preparation. Ibnu Faizal: Data processing, funding acquisition, field test. Lantun P. Dewanti: Field test, original draft preparation. Marine K. Martasuganda: Draft preparation. Ajeng Wulandari: Field test, data processing. Rd. Salsa D. Kusuma: Field test. Muhammad H. Ilmi: Laboratory and field test, data processing, data visualization. Choerunissa Febriani: Collecting and visualizing data. Raffy R. Alfarez: Field test, manuscript layouting. Fickry Argeta: Laboratory test. Jati S. Wicaksana: Laboratory testing and micro-controller design.
Funding
This research was funded by Matching Fund Kedaireka 2022 Grants with grant number with grant number 399/PKS/D.D4/PPK.01.APTV/VIII/2022 and 853/UN6.WR3/PKS/2022.
Institutional Review Board Statement
Not applicable
Informed Consent Statement
Not applicable
Data Availability Statement
The data that support the findings of this study are available on request from the corresponding author.
Acknowledgments
We thank Universitas Padjadjaran (Directorate of Innovation and Corporation) for their invaluable support throughout this research. This work was supported by the Ministry of Education, Culture, Research, and Technology for funding through the Matching Fund 2022 program.
Conflicts of Interest
The authors declare no conflict of interest.
References
- Y. Guo and L. F, “Wang, Destinations and pathways of the Indonesian Throughflow water in the Indian Ocean,” Journal of Climate, pp. 1–39, 2023. [CrossRef]
- A. Katavouta, J. A. Polton, J. D. Harle, and J. T. Holt, “Effect of Tides on the Indonesian Seas Circulation and Their Role on the Volume, Heat and Salt Transports of the Indonesian Throughflow,” Journal of Geophysical Research: Oceans, vol. 127, no. 8, pp. 1–29, 2022. [CrossRef]
- N. Scroxton et al., “Antiphase response of the Indonesian–Australian monsoon to millennial-scale events of the last glacial period,” Scientific Reports, vol. 12, no. 1, pp. 1–12, 2022. [CrossRef]
- T. Xie, R. Newton, P. Schlosser, C. Du, and M. Dai, “Long-Term Mean Mass, Heat and Nutrient Flux Through the Indonesian Seas, Based on the Tritium Inventory in the Pacific and Indian Oceans,” Journal of Geophysical Research: Oceans, vol. 124, no. 6, pp. 3859–3875, 2019. [CrossRef]
- E. Taufiqurrahman, A. J. Wahyudi, and Y. Masumoto, “The Indonesian throughflow and its impact on biogeochemistry in the Indonesian Seas,” ASEAN Journal on Science and Technology for Development, vol. 37, no. 1, pp. 29–35, 2020. [CrossRef]
- D. Adyasari, M. A. Pratama, N. A. Teguh, A. Sabdaningsih, M. A. Kusumaningtyas, and N. Dimova, “Anthropogenic impact on Indonesian coastal water and ecosystems: Current status and future opportunities,” Marine Pollution Bulletin, vol. 171, no. June, 2021. [CrossRef]
- N. P. Purba et al., “Marine Debris Pathway Across Indonesian Boundary Seas,” Journal of Ecological Engineering, vol. 22, no. 3, pp. 82–98, 2021. [CrossRef]
- M. Marcelli, V. Piermattei, A. Madonia, and U. Mainardi, “Design and application of new low-cost instruments for marine environmental research,” Sensors (Switzerland), vol. 14, no. 12, pp. 23348–23364, 2014. [CrossRef]
- D. Roemmich et al., “The Argo Program: Observing the global ocean with profiling floats,” Oceanography, vol. 22, pp. 34–43, 2009. [CrossRef]
- Y. Liu, M. Qiu, C. Liu, and Z. Guo, “Big data challenges in ocean observation: a survey,” Personal and Ubiquitous Computing, vol. 21, no. 1, pp. 55–65, 2017. [CrossRef]
- L. A. Levin et al., “Global Observing Needs in the Deep Ocean,” Frontiers in Marine Science, vol. 6, no. May, pp. 1–32, 2019. [CrossRef]
- R. Gerin, M. Zennaro, M. Rainone, E. Pietrosemoli, P.-M. Poulain, and A. Crise, “On the design of a sustainable ocean drifter for developing countries,” EAI Endorsed Transactions on Internet of Things, vol. 4, no. 13, p. 155483, 2018. [CrossRef]
- T. C. Wilson, J. A. T. C. Wilson, J. A. Barth, S. D. Pierce, P. M. Kosro, and B. W. Waldorf, “Lagrangian drifter with inexpensive wide area differential GPS positioning,” Oceans Conference Record (IEEE), vol. 2, pp. 851–856, 1996. [CrossRef]
- A. S. Kuznetsov, Y. I. Shapovalov, and R. O. Shapovalov, “Results of monitoring the surface fields dynamics in the black sea waters using a ferry box system,” Physical Oceanography, vol. 26, no. 4, pp. 341–349, 2019. [CrossRef]
- W. Peterson, Innovative sensor carriers for cost-effective global ocean sampling Challenges and Innovations in Ocean In Situ Sensors: Measuring Inner Ocean Processes and Health in the Digital Age. 2019. [CrossRef]
- R. Irion, “Ocean scientists find life, warmth in the seas,” Science, vol. 279, no. 5355, pp. 1302–1303, 1998. [CrossRef]
- D. P. Langis, “Arduino Based Oceanographic Instruments: An Implementation Strategy for Low-Cost Sensors,” California State Maritime Academy, 2015.
- M. Gunia et al., “Data fusion system for monitoring water quality: Application to chlorophyll-a in Baltic sea coast,” Environmental Modelling and Software, vol. 155, no. February, p. 105465, 2022. [CrossRef]
- V. A. Macovei, W. Petersen, H. Brix, and Y. G. Voynova, “Reduced Ocean Carbon Sink in the South and Central North Sea (2014–2018) Revealed From FerryBox Observations,” Geophysical Research Letters, vol. 48, no. 11, pp. 1–11, 2021. [CrossRef]
- K. S. Zenyda, Subiyanto, I. Faizal, N. Prayogo, and N. P. Purba, “Evaluation of a New Integrated Marine Instruments: RHEA (Drifter GPS Oceanography Coverage Area),” IOP Conference Series: Earth and Environmental Science, vol. 925, no. 1, 2021. [CrossRef]
- N. P. Purba, I. Faizal, P. G. Mulyani, N. Prayogo, T. Prasetyo, and A. M. A. Khan, “Performance of lagriangan drifter oceanography coverage area (RHEA): second phase,” International Journal of Oceans and Oceanography, vol. 13, no. 2, pp. 353–361, 2019.
- N. P. Purba et al., “Development of autonomous multi-sensor ocean monitoring instrument designed for complex archipelagic waters,” International Journal of Environmental Science and Technology, pp. 1–10, 2023. [CrossRef]
- A. Appiani, “Arduino ® MEGA 2560 Rev3 Features. Arduino ® MEGA 2560,” Lex Russica, vol. 4, no. 4, pp. 1–18, 2022.
- XLSEMI, “Datasheet Buck DC to DC XL4013,” 2015, pp. 1–10.
- H. Technology, “User Guide—4 Channel 5V Optical Isolated Relay Module,” Occupational Health & Safety, vol. 74, no. 2, p. 24, 2015.
- Maxim Integrated, “DS3231 RTC General Description,” Data Sheet, p. 20, 2015.
- EBay, “Micro SD Card Card Adapter Reader Module for Arduino,” Data Sheet, pp. 1–2, 2013.
- Hitachi, “HD44780U (LCD-II),” vol. 3304, no. January, pp. 1–19, 2015.
- E. Firing, J. M. Hummon, and T. K. Chereskin, “Improving the quality and accessibility of current profile measurements in the southern ocean,” Oceanography, vol. 25, no. 3, pp. 164–165, 2012. [CrossRef]
- R. Judge, F. Choi, and B. Helmuth, “Recent advances in data logging for intertidal ecology,” Front Ecol Evol, vol. 6, no. DEC, Dec. 2018. [CrossRef]
- C. Siriwardana, A. T. Cooray, S. S. Liyanage, and S. M. P. A. Koliyabandara, “Seasonal and Spatial Variation of Dissolved Oxygen and Nutrients in Padaviya Reservoir, Sri Lanka,” J Chem, vol. 2019, 2019. [CrossRef]
- N. S. Vinson et al., “Correlation between water quality and seagrass distribution along intertidal zone in Sarangani Province, Philippines,” vol. 30, no. 5, pp. 30–35, 2016. Available online: http://www.innspub.net.
|
Disclaimer/Publisher’s Note: The statements, opinions and data contained in all publications are solely those of the individual author(s) and contributor(s) and not of MDPI and/or the editor(s). MDPI and/or the editor(s) disclaim responsibility for any injury to people or property resulting from any ideas, methods, instructions or products referred to in the content. |
© 2023 by the authors. Licensee MDPI, Basel, Switzerland. This article is an open access article distributed under the terms and conditions of the Creative Commons Attribution (CC BY) license (https://creativecommons.org/licenses/by/4.0/).
