
You are currently viewing a beta version of our website. If you spot anything unusual, kindly let us know.
Preprint
Review
The Behaviour of Polymeric Pipes in Drinking Water Distribution System. Comparison with Other Pipe Materials
Altmetrics
Downloads
135
Views
50
Comments
0
A peer-reviewed article of this preprint also exists.

This version is not peer-reviewed
Abstract
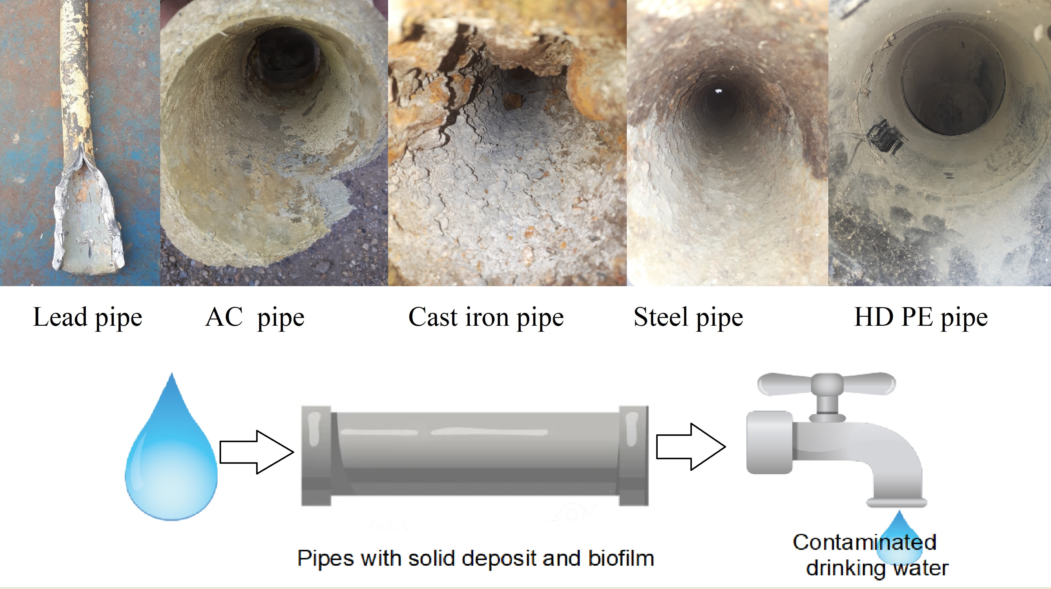
The inner walls of drinking water distribution system (DWDS) are expected to be clean to ensure a safe quality of drinking water. In reality, complex physical, chemical and biological processes take place when water comes into contact with the pipe surface. This paper describes the impact of leaching different compounds from the water supply pipes into the drinking water and subsequent risks. Among these compounds there are heavy metals. It is necessary to prevent these metals to get into the DWDS. Those compounds are susceptible to impact the quality of the water delivered to population either by leaching dangerous chemicals into the water or by enhancing the development of microorganism growth on the pipe surface. The corrosion process of different pipes materials, scale formation mechanisms and the impact of bacteria formed in corrosion layers are discussed. Water treatment processes and the pipe materials also affect the water composition. Pipes materials act differently in the flowing and stagnation conditions. Also, they age differently (e.g metal based pipes are subjected to corrosion while polymer based pipes have a decreased mechanical resistance) and are susceptible to enhance bacterial film formation. This review helps to clarify what are the possible sources of compounds responsible for drinking water quality degradation. Also, it gives guidance on the measures that are needed to maintain a stable and safe drinking water quality.
Keywords:
Subject: Environmental and Earth Sciences - Water Science and Technology
1. Introduction
Water is essential for life development throughout the world, all plants and animals need the water. Its quality (expressed by chemical, physical and biological characteristics) influences the population health. Drinking water quality varies from a place to another and is affected by the water source, the treatment that water underwent and the pipe distribution system.
Water in contact with the pipe material can cause components leaching, pipe corrosion in time or promote microorganism growth on the inner pipe surface. The first two mechanisms lead to chemical contamination of water whilst microorganism multiplication deteriorate the biological stability of water (development of pathogens, deterioration of taste, odour colour). Water quality at tap and the problems that arise are specific to each water distribution system. The 2021 EU Directive regarding the quality of drinking water are stricter regarding the presence of toxic chemical compounds [1].
Microorganism growth inside the pipes depends on several factors such as availability of nutrients, concentration of disinfectant, water temperature and pH, existence of biofilm or corrosion layer on the pipe inner surface.
The biological stability of drinking water is defined as the capacity of water to maintain the same microbiological characteristics from the treatment plant to the consumption point. The presence of bacterial communities during the water treatment step is carefully checked. However, the distribution system can contribute to the developing of microorganisms in the biofilm and corrosion layers formed on the pipes inner walls [2]. The adhesion of microorganisms is influenced by several factors: (i) pipe characteristics (such as material, roughness), (ii) water physical-chemical parameters (pH, temperature, load in organic compounds, existence of minerals) and (iii) characteristics of microorganisms (ability to produce extracellular polymeric substance, cell hydrophobicity and motility) [3,4,5,6,7].
Among the first materials used for the water distribution systems (concrete and lead), lead was extensively employed. Lead exposure has severe consequences (affecting mental and physical development), with symptoms that don’t appear until dangerous amounts have accumulated in the human body [8]. Adverse health effects have been observed also in prenatal stage [9] Because of that, during the last decades it was decided the replacement of lead plumbing by other materials such iron, galvanized steel, PVC, and copper [10,11,12,13,14]. Each of these materials has advantages and disadvantages that will be further discussed.
Aluminium can be leached from the cement-based pipes. Constant exposure to this ion can lead to an important risk of cognitive decline, dementia, and Alzheimer’s disease [15]. In New York it was not found any correlation between the asbestos contained in drinking water and cancer occurrence among the population [16]. However asbestos fibers in the drinking water could become airborne and enter the langs. Another study made in Norway support the hypothesis of an association between ingested asbestos via drinking water and gastrointestinal cancer risk [17].
Galvanised pipes are a source of zinc in drinking water. Iron pipes are a source of arsenic. Zinc, arsenic and copper are heavy metals that pose health risk issues, and their concentrations must be monitored in DWDS [18,19,20,21,22,23].
When a pipe corrodes, it leaches substances that accumulate in the drinking water, but also the pipe softens, and loses its mechanical strength, overall reducing its service life.
Modern manufacturing technologies allow the fabrication of water distribution pipes by different association among materials (e.g., ductile iron pipe with cement lining or polymer lining such polyethylene or polyurethane). But the behavior of these pipes as regarding the progressively release in time of dangerous compounds due to pipe corrosion and aging it is not entirely known.
2. Materials used to manufacture the drinking water distribution pipes
A. Lead
Main lead source in a lead pipe is the pipe itself. Besides lead manufactured pipes, another source of lead in non-lead pipe systems, are the brass fixtures and lead-solder connections [24,25,26,27,28]. These fittings represent discrete sources of lead that may give rise to significant lead concentrations in the drinking water. There is no safe lead concentration in the drinking water. Lead concentration can vary within home, at the same tap over time or between homes. Currently no new lead system is being installed but many older DWDS still contain lead pipes. In latest years lead pipes have been started to be replaced worldwide, especially in the cases that Pb concentration are high.
Concentrations higher than 10 μg/L were consistently measured in old pipe systems in Taiwan which represent a health risk for the population [29].
However, care must be given when replacing part of the lead pipes system. Replacement of about 80% of lead pipe with copper pipe, in Canada, caused sustained lead release (sometimes worse than a full lead system) up to 12 weeks upon substitution [30]. The same behaviour has been reported in the USA [31]. This was attributed to galvanic corrosion between aged lead pipes and new copper pipes [30,32].
- (a)
-
Water chemistry parameters:
- (i)
- pH, alkalinity
- (ii)
- the content of dissolved inorganic carbon
- (iii)
- presence of disinfectants: chlorine, chloramine, dissolved oxygen
- (iv)
- presence of corrosion inhibitors (orthophosphate, orthophosphate/polyphosphate mixture, silica)
- (v)
- Oxidation Reduction Potential
- (vi)
- Presence of organic matter
- (b)
- Flowing regime: alternate flow / stagnant regime; pipes flushing.
Lead scale is a complex structure that accumulate many different metallic compounds, often in different layers. Because of that, lead release into the flowing water is more complex than the corresponding solubility mechanism. One of the factors affecting the lead leaching from the corrosion scale is the pH. Lead solubility from the scale increases with decreasing pH, allowing the detachment of lead particles from the scale into the drinking water [37,38]. Experiments have showed that arsenic and aluminium concentrations in drinking water during the pH experiments, are in strong correlation. This suggests that the aluminosilicate present in the scale is accumulating arsenic that can be later released when conditions are favourable [33,39].
The lead corrosion scale can contain other heavy metals such as V, Sb, Cu, Mn and Cr [39,40,41,42,43]. 2.8% of water samples analysed in a DWDS in USA exceeded the maximum allowable concentration for Pb, As and Cu [43]. Characterisation methods showed that hydrocerussite phase (Pb3(CO3)2(OH)2) is the major lead crystalline corrosion compound in the scale [34,39]. Cerussite (PbCO3) was also present in same cases. In the inner scale layers PbO2 and Pb3O4 were present [39]. Lead dioxide acts as protective layer; formation of PbO2 was reported to be beneficial in terms of pipe protection for future corrosion [44]. Metallic lead reacts with water only in the presence of oxidizing compounds to form lead hydroxide, Pb(OH)2 [45]. Then the white lead, an alkalic lead carbonate compound with high toxicity (hydrocerussite, 2PbCO3.Pb(OH)2) is forming (Figure 1). Addition of orthophosphate is decreasing the dissolution rate of hydrocerussite [34]. Darker layers correspond to accumulation in the lead scale of manganese containing compounds [41].
In soft water, traces of lead form colloidal lead compounds that are difficult to remove [46]. It has been experimentally observed that higher lead levels in water are often accompanied by high iron concentrations [47]. Lead is forming with iron and natural organic matter present in the environment, colloidal particles that are easily detached and transported in the DWDS.
Change of disinfectant from chlorine to chloramine caused an increase in lead corrosion. This is because, the predominantly tetravalent lead (PbO2) scale is destabilized in the presence of chloramine [48].
Analysis of tubercle scales collected from pipelines in the Columbus, Ohio, found to contain microorganisms like sulfate reducers, nitrate reducers, nitrite oxidizers, ammonia oxidizers, sulfur oxidizers [49].
To help reduce lead concentration, pipe flushing operation can be applied periodically [50]. This is however efficient on short time periods. To better control the lead pipe corrosion and there are several methods in use: pH/alkalinity adjustment, adding corrosion inhibitors (orthophosphate, orthophosphate/polyphosphate mixture, softening with Ca(OH)2 [51,52]. In the case of corrosion inhibition using orthophosphate, amorphous solid phase (containing mainly Pb, Al, P, and Fe) is formed. This layer is not very stable and can be easily detached when disturbances in flowing conditions take place [52].
B. Cement
Cement is frequently used for the manufacturing of pipes or as a protective layer on the inner of the surface of an iron or steel pipe. The cement is used as coating to prevent the corrosion of pipe metallic surfaces because of a high pH of the cement lining. In this way it is achieved the isolation of metallic pipe from water and is created an alkaline environment near the pipe walls that prevents corrosion. The protective layer can be applied during the manufacturing process of the pipes (prefabricated coated pipes) or during the renovation of corroded water pipes (manually coated pipes). The concrete pipes are cement based pipes made by mixing of cement (limestone), water, sand and additives that prevents the concrete pipe to crack.
Concrete pipes were among the oldest pipes systems to be employed for water transportation [53].
The types of cement allowed to be used in manufacturing the pipes for drinking pipes are Ordinary Portland Cement (OPC), High Alumina Cement (HA cement), Blast Furnace Slag Cement (BFS cement), Fly Ash Cement (FA cement), and Sulphate Resistant Portland Cement (SR cement) [54].
Cement manufactured pipes were usually used in combination with asbestos which provides tensile strength and are resistant to thermal and chemical breakdown. However, in the late 1980s concerns have raised in New York regarding the use asbestos-cement pipes (AC), because the asbestos fibers were detaching from the inner pipe surface and migrate to drinking water [55,56]. Figure 2 shows the state of an AC pipe replaced from DWDS of the town of Călăraşi, Romania. It was studied back then the possibility of fibers contained in the drinking water to become airborne. Results have evidenced an increased content of asbestos in the air of the houses being supplied with drinking water contaminated with asbestos fibers [56]. To this day there are still in use AC pipes for fresh water supply [57]. Mager et al. (2022) report the presences of asbestos fiber in drinking water originated from ageing AC pipes in New Zeeland [58]. The pipe system was installed between 1930 and 1960, and to this date was still releasing asbestos fibers: 10 μm long with an average concentration 0.9 million fibres per litre (MFL) and short asbestos fibres (0.5 μm) with an average concentration of 6.2 MFL.
The analysis of a 56-year-old AC pipe evidenced surface corrosion because of calcium leaching from the wall [57]. Seasonal variation of temperature was found to impact the calcium dissolution rate which in turn impacts the release of asbestos fibers: lower water temperature increased the calcium leaching which accelerates the detachment of asbestos fibers.
Cement is composed mainly by CaO, Al2O3, SiO2 Fe2O3, gypsum in various ratios [59,60,61]. In addition to the characteristics of running water, the durability of asbestos-cement pipes is also directly related to the free lime content, Ca(OH)2 [62].
Concrete and cement pipes are mainly affected by leaching process. Contaminants are released from the cement layer immediately after the installation of new pipes or after the rehabilitation of old pipes. The degree of water contamination is strongly related to the composition of the cement and is more accentuated at the beginning of the pipeline operation [54,63,64,65]. The leaching process means the dissolution of same compounds of the pipe walls. The dissolution takes place in the pores of the wall and assumes several steps:
- (i)
- internal diffusion of liquid water through the porous wall;
- (ii)
- dissolution of the compounds;
- (iii)
- diffusion of the dissolved compounds through the pores at the surface of the pipe;
- (iv)
- external diffusion of the dissolved compounds at the wall pipe into the main water stream. The permeability of the material controls how much water diffuses through the pores of material. The leaching rate depends on if the pipe just started to be operated, the permeability of the pipe material, the softness of the drinking water, and the solubility of the leached compound. The soft water is water relatively free of dissolved ions and has a higher capacity of dissolution compared with a more saturated water in minerals.
The cement is the source of toxic elements that can be of natural origin or introduced into the cement composition during the manufacturing process. The cement industry has modified its production methodology to include the valorisation of several types of waste materials (meat and bone meal, waste tires, solidified sewage sludge) as alternative fuel in cement kilns [66,67,68,69]. Waste tires are tires are the most common sources of antimony, cadmium, chromium, cobalt, lead, titanium, and zinc [66]. Solidified sewage sludge is a source of cadmium, chromium, zinc, vanadium, cobalt in varying concentrations [67]. No toxic heavy metals are leached from concrete manufactured using meat and bone meal waste [68].
Experimental studies conducted on cement coated iron and steel pipes showed that calcium, aluminium, chromium, lead, and cadmium are the main ions that are more susceptible to be leached form the cement surface [64,70]. Calcium hydroxide was found to be the most soluble compound from cement [71]. For cement coated iron and steel pipes, leaching of aluminium was found to be much more intensive from manually prepared coating than from prefabricated cement coating. The type of cement used for the experiments was BFS cement in the case of prefabricated pipe and OPC for the manually coated pipe. The cumulative quantity of aluminium leached was about 160 mg/m2 for manually coated pipe versus 0.5 mg/m2 for prefabricated pipe, after 100 days since the starting of the pipe’s operation [64]. Accelerated studies consisting of exposing samples of concrete to deionized water or acid solution for 64 days were made to see which one of HA, BFS or FA cement is more suitable for use in contact with drinking water. High amounts of calcium and aluminium were leached from HA cement whilst the smallest total amount of calcium and aluminium were measured for the BFS cement [54]. For the countries in the European Union, the limit of the aluminium in drinking water, is set to 200 μg/L, according to the Directive (EU) 2020/2184 [1].
Comparison between CEM I types (OPC) made by two different manufacturers showed a similar behaviour. For both cement the leaching of aluminium and calcium was very intensive in the initial contact with the drinking water and decreased over time. Aluminium leaching was still present after 64-day investigation period while calcium was leached only up to 4 days after the first contact with the drinking water. Leaching of chromium was similar for both types of cement CEM I and disappeared after 7 days. Lead leaching was not detectable after the fourth day for both types of cement. The main disadvantage when using CEM I type cement was exceeding the aluminium maximum concentration in drinking water for several days after the pipe is put in use [65].
Another parameter that affects the leaching of dangerous compounds from cement coating is the dose of disinfectant present in the drinking water. The disinfectant is added to ensure a reduced concentration of microorganisms in the water transported from the treatment plant to the consumer. Resistance to chloride ions of concrete based pipes was extensively evaluated [72,73,74,75,76].
Adding sodium hypochlorite to water does not impact the increase of the water pH at the contact with the cement lining. However, when comparing results obtained from tests on water with or without disinfectant, the presence of disinfectant does considerably increase the leaching of different compounds (like calcium, aluminium, chromium, and lead). The lowest tested sodium hypochlorite dose was the most aggressive causing the highest rate for calcium, aluminium, and chromium leaching. This indicates that the effect of disinfectant on the leaching rate is indirectly proportional with the disinfectant concentration [70].
Experiments with cements having different compositions have showed that there is dependence between the chemical composition of the cements and the type and concentrations of leached elements into the water [65].
Another aspect observed after the installation of a new cement coated pipeline was the significant increase of the water alkalinity [77]. One day after operation started, the water pH increased to 11 (the same pH value that was measured for the water inside the pores of fresh concrete material). The experiments were performed with still water (non-carbonated water). The pH values were above 8.5 even after 35 days of water flow although the pH was continuously decreasing according to a logarithmic path.
To improve the resistance of cement pipes, PVC (polyvinyl chloride) tubes can be used as an inner layer [78]. There are however some inconveniences when using cement based pipes with embedded polymer pipe. The parameters that were studied were pipe diameter, curing age, temperature and resistance to chloride ions. These factors change with increasing the pipes diameter. Between the two pipes a weak zone is formed, and this zone increases with the pipe diameter. The weak zone is characterised by a reduced compressive strength and a higher diffusion coefficient of chloride ions [79].
C. Copper
By comparison with stell [80], copper and copper alloys are corrosion scale forming materials [81,82,83]. This means that the corrosion by products accumulate on the interior of the pipe. It was found that pure water does not contribute significantly to the corrosion of copper pipes [84]. Generally, there are three types of scale in pipes made from:
- (a)
- compounds that crystallize directly onto tube surfaces from the flowing water (this is the case of calcium and magnesium carbonates that distribute uniformly on the inner surface of the pipe);
- (b)
- scale consisting in inorganic materials precipitated elsewhere and transported by the flowing water;
- (c)
- scale formed by the corrosion products (characteristic for unlined iron cast pipes, copper pipes); the corrosion scale is a hard mineral consisting in densely distributed corrosion tubercles.
At the beginning of their operation, the copper pipes are covered by a protective layer cuprous oxide.
The difference in the behaviour of stainless steel and copper and copper alloy materials resides in the fact the copper corrosion is much faster and the concentration of copper ions in the water near the pipe wall rises so the precipitation and crystallization of corrosion products takes place. Stainless steel is also forming a passivation film, but the corrosion of this film is so slow that the corrosion products do not accumulate at the pipe wall. Scale build-up is a process that takes months or even years. It is difficult to predict how the existing corrosion scale will behave when water composition changes or seasonal changes take place [85].
The copper corrosion in the presence of soft water at room temperature and flowing water is initiated by the breakdown of the metallic oxide thin layer. The cuprous oxide crystals that are separated from the layer migrate to form mounds at grain boundaries. Spherical pits are created in this way. The presence chloride ions used for water disinfection, accelerate the breakdown of the oxide layer [86].
The main factors that were found to affect the copper corrosion and later to cause the leaching of the corrosion products in the drinking water are:
The components of the scale formed by the corrosion products were products of Cu (I): cuprite (Cu2O) and copper (I) hydroxide (CuOH) and products of Cu(II) : CuO, copper (II) hydroxide (Cu(OH)2), and malachite (Cu2CO3(OH)2) [84].
By increasing the velocity of water flowing in the pipe, the copper release is also increasing [96].
Experiments with a lead-free laboratory system of pipes (consisting of copper pipes, stainless steel taps and brass fittings) evidenced elevated levels of lead leaching [97]. The samples were analysed after 475 days of alternative flowing/stagnation periods. Concentrations of 10 μg lead· L –1 were measured for five months after the 475 days, the source of lead being identified as a lead free brass fitting.
D. Iron
The iron pipes used for DWDS are cast iron pipe, galvanized iron pipe, unlined cast iron pipe, lined ductile iron pipe.
Corrosion of metallic iron means its dissolution from the metallic pipe as Fe2+ simultaneously with the reducing of oxidizing agents present in the water: O2, H+, SO42-, NO2–, NO3–, CO2; ferrous iron can be further oxidized to ferric iron. This ends up creating cracking and pitting iron corrosion. The primary parameters that affect the iron pipe stability are related to the flowing water characteristics: alkalinity, pH, presence of chloride and sulfate ions [98,99,100,101,102,103,104]. Adding orthophosphates to the flowing water, act as corrosion inhibitor by forming insoluble phosphates that create a coating protective layer [105].
The metallic surface (iron, steel etc) act as the anode, while the water near the pipe surface (containing oxidants: oxygen, chlorine, microbial metabolites), participate as the cathode (Figure 3).
The solid corrosion products build up in time thick corrosion scale that are responsible for pipe blockage, leakage, and red water formation [106,107]. Corrosion scales formed on the surface of pipes consist mainly in lepidocrocite (γ-FeOOH), magnetite (Fe3O4), goethite (α-FeOOH), hematite (Fe2O3) and ferrihydrite [108,109,110]. All these minerals have strong affinities to adsorb heavy metals (lead > vanadium > chromium > copper > arsenic > zinc > cadmium > nickel > uranium) [108]. Another source of heavy metals are the pipes themselves. The iron pipes can contain other metals in small amounts. As the iron pipe starts to corrode, these metals are released from the pipe wall and incorporated in the corrosion by-products. Red water is formed under stagnant conditions, due to oxygen depletion in water by iron, existing Fe(III) is reduced to Fe(II), followed by the dissolution of corrosion by products [101,111,112]. Measurements of iron corrosion potential in flowing and stagnant water confirmed the mechanism proposed by Kuch (1988) [111]. Experiments made with dissolved oxygen evidenced that the increase of iron corrosion potential during stagnation periods is associated with the consumption of dissolved oxygen by the iron [101]. The corrosion rate of cast iron in the drinking water distribution pipes decreases gradually in time [113].
The metals accumulation in corrosion scale represents a threat to the population health. A maximum accumulation rate of 3.94 mg vanadium/g of scale and 3.90 mg arsenic/g of scale respectively was found by He et al., (2021) on scales from cast iron pipe (20 years operation time) [110]. The accumulation rate depends on various factors such as pH, temperature; the scale was mainly composed by magnetite and goethite. Although the scale layer is thinner on the steel pipes, it was also reported that the scale deposited in the steel pipes also accumulate vanadium. The adsorption capacity in the different layers of the corrosion scale decreases in the following order: surface layer > porous core layer > hard shell-like layer [114]. Calculations on iron corrosion scale showed that it is sufficient to dissolve 0.0027% of a 0.1 cm thick corrosion scale (for a 1 m segment length and 3 cm diameter) to reach the limit for vanadium in drinking water which is 15μ/L [115].
Chloride and sulphate anions are competing in the arsenic accumulation therefore increasing their content will reduce arsenic accumulation on corrosion scales [110].
Another toxic heavy metal is chromium. The accumulation and release of chromium (III) and (VI) from iron corrosion scales was investigated [116]. The outer layer of the scale is accumulating less chromium and is releasing more. During the Cr6+ accumulation process, part of the Cr6+ is reduced to Cr3+ by the existing Fe2+ which is a beneficial process since the toxicity of Cr3+ is reduced.
Comparing with the stainless stell scale which contains chromium from the corrosion products, the iron scale is accumulating chromium from the water flowing in the pipe or from the inner linings of the pipe. The chromium content in scales of stainless steel pipes is higher than chromium content of iron corrosion scales [80].
The accumulated heavy metals can be released in some conditions. Vanadium release is increased by low pH, high temperatures and high sulphate ion concentration [115]. Chromium release is affected by several factor in decreasing order: pH >temperature> chloride ions concentration > sulfate ions concentration [116].
Manganese also can accumulate in iron pipe scales. Although not so dangerous as vanadium, chromium and arsenic, its concentration in the drinking water is however monitored and limited to 0.05mg/L [1]. The manganese release is enhanced in stagnant water. The factors influencing the manganese release are pH, alkalinity, sulfate ions concentrations, and the presence of disinfectants [117]. Like in the case of vanadium release, lower pH, lower alkalinity, higher temperature, and higher sulfate concentration are increasing the manganese release from the scales. Under the same contact time and disinfectant dose, the disinfectant inhibitory effect on the manganese release follows the order: ClO2 > NaClO > NH2Cl. Two indicators, alkalinity and sulfate ions concentration, have strong effect on manganese release. They could be monitored to control the manganese release from iron scales.
- (a)
- floor layer made of carbonates;
- (b)
- thin corrosion scale;
- (c)
- hollow tubercle.
In time, the corrosion scale formed on iron pipes develops a multi-layer structure consisting of the corroded floor which is the pipe inner wall, porous layer, stable shell layer and top layer (Figure 5). The shell layer gives resistance to further corrosion process by blocking the access of oxidizing compounds, being mainly composed of compact α-goetite and magnetite [119].
The water characteristics and disinfectant influence on iron corrosion in a ductile iron pipe were studied in accelerated laboratory tests, using increased concentrations of disinfectant [120]. Sodium hypochlorite, like the liquid chlorine enhances iron corrosion by oxidizing ferrous to ferric ions. The effect of NaClO in the presence of calcium ions is different than the chlorine effect, NaClO is responsible for calcium carbonate accumulation on the inner pipe wall in waters with high alkalinity and hardness. NaClO not only contributes to pipe corrosion but also intensifies the CaCO3 deposition in time.
Nitrogenous disinfection by-products (N-DBPs) are known to be more dangerous to human health and to environment than carbonaceous DBPs [121,122,123,124]. Increased content of N-DBPs (haloacetamides, halonitromethanes, and haloacetonitriles) and iron particles was found in the effluent of corroded iron cast pipes [125]. It was found that detaching iron particles from the corrosion scale, are covered by the biofilm. This provides a good surface for chlorine adsorption and N-DBPs formation.
Iron release rate from corrosion scale was found to be dependent on pH, hardness, nitrate ion content, Larson Ratio (ratio of the concentration of chloride and sulfate ions to the concentration of bicarbonate and carbonate ions) and dissolved oxygen [112].
The formation of siderite (FeCO3) was also found to play an important role in the iron corrosion [100,126]. Scales formed on different pipes (PVC; lined ductile iron, LDI; unlined cast iron, UCI; galvanized steel, GS) after 1 year use with water having different characteristics were analysed [100]. The order of total iron release is decreasing in the order: unlined cast iron > galvanized steel > = lined ductile iron > PVC. The main corrosion by products on unlined cast iron pipe were: FeCO3, α-FeOOH, β-FeOOH, γ-Fe2O3, Fe3O4, while on galvanized steel FeCO3 is replaced by significant amounts of zinc oxide. Lined ductile iron and PVC had low deposits of iron containing corrosion by products.
Higher amounts of zinc in drinking water were for galvanized iron pipe, GI reported also in the study of Li et al., (2016), when comparing the behaviour of UCI and GI pipe [127].
The scale deposited on iron based pipes provides a favourable environment for microinvertebrates (Asellus aquaticus) to develop and live in large number. On the contrary on plastic pipes there were only isolated specimens of Asellus aquaticus [128].
The effect of sulfate ions was studied for old cast iron distribution pipes [103]. “Red water” occurred for the pipes usually fed with groundwater while no coloration was noticeable for pipes supplied with surface water. The difference arises from the scale composition: (i) thin less stable for the groundwater supplied pipes containing mainly higher proportion β-FeOOH, FeCO3 and green rust; (ii) thick and more stable for surface water supplied pipes, having a high content of stable Fe3O4. The water sulfate content also influences the bacterial communities living on the scale surface. While the bacterial community did not vary much for pipes transporting treated surface water, in the case of pipes transporting groundwater changing to water with sulfate increases the content of sulfur oxidizing bacteria (SOB), sulfate reducing bacteria (SRB) and iron oxidizing bacteria (IOB). The authors did not study the sulfate effect on the release of dangerous heavy metals like vanadium and chromium.
Water cand be trapped in the scale (occluded water). The contaminants migrate from the occluded water to the bulk water or to the stagnant water, therefore occluded water is another source of drinking water contamination. This water is acidic and contains high amounts of iron, manganese, chloride, sulfate and nitrate [129]. In stagnant conditions, the occluded water becomes more acidic and concentrated in the compounds mentioned above, except nitrate.
E. Steel
Stainless steels pipes are extremely resistant to corrosion. However, under long term operation, they become susceptible to pitting corrosion which forms thin layers of corrosion scales.
It has been reported that stainless steel corrosion scales contain a large amounts of chromium compounds. The scale formation is initiated by pitting corrosion on the pipe surface followed by the homogeneous deposition of iron and chromium corrosion compounds (Figure 6) [80]. The insoluble corrosion products are α-FeOOH, α-Fe2O3, γ-FeOOH, γ-Fe2O3, Fe3O4, FeCO3, Cr2O3, CrOOH and possibly FeSO4.
The presence of disinfectant products enhances the corrosion of stainless steel pipe [80,132]. Steel pipes corrosion in the presence of chloride ions is a multi-step process that depends besides the characteristics of the water, also on the presence or absence of coating protective layer. For uncoated steel pipes, 3 steps were evidenced during chloride induced corrosion: (a) diffusion of chloride ions through the mortar/cement layer; (b) pitting corrosion by which cavities are produced in the steel layer; (c) transition from pitting corrosion to uniform corrosion as more and more chloride ions arrive at the surface of the steel layer. Figure 7 is showing comparative cross-sections of steel bars with different enamel or polymer protective layers [132]. Enamel protective layer did not postpone the initiation of corrosion process; only epoxy protective layer delayed the pitting corrosion.
Under stagnant water, the release of heavy metals from a galvanized steel pipe does not exceed the maximum allowable concentration limits for stagnation time below 8 hours. The heavy metal concentrations decreased in the following order: Mn > Fe > Zn > Pb [130].
It was found that pipe corrosion is reduced in flowing conditions comparing to stagnant conditions: in low water flow or stagnant conditions the corrosion rate is 0.29 mm/year and is decreasing to 0.18 mm/year for water flow rate above 0.15 m/s [131].
F. Polymer based pipes
Polymeric pipes have some advantages comparing to other pipes: they are lighter which is important if they are used in buildings, do not form corrosion scale etc. Among analysed pipes (PVC-U, galvanised steel pipe, copper pipe, and cast iron pipe) PVC-U pipes have the minimum value in terms of resource and energy consumption in residential buildings [133].
By using polymer based pipes in DWDSs, the problems related to compounds containing heavy metals is reduced significantly. However, polymer based pipes have a reduced mechanical strength and favours the formation of organoleptic compounds [134,135] and biofilm on the inner pipe surface [136]. To improve the mechanical strength, polymer based pipes are mostly used as inner pipes in cement or metal based pipes.
Experiments have shown that defective polyethylene tubings (dissolution of polymer additives and oxidation of pipe surface during extrusion) can explain the formation of organoleptic substances (alkylphenols, aldehydes, ketones). The release time of organoleptic compounds was found to exceed several months under low water flow rates [134].
It was shown experimentally over 16 weeks of investigation, that the migration of organic compounds was elevated within the first weeks of use, followed by a lower and constant level [137]. The organic compounds that are migrating from the pipe surface (polyethylene and cross-linked polyethylene) can be further transformed and degraded in the bulk water [138]. These compounds can be degraded biotically or abiotically, but the degradation rate is low. However, this study did not include the influence of pre-existent biofilm on the pipes inner surface. It is expected that the presence of the biofilm would change the degradation rate.
Reactions between water and the different materials of DWDS can result in alterations of water quality delivered to consumers. The DWDS consist of pipes of different materials that are replaced in time. The iron can dissolve itself from iron based pipes and migrate and concentrate on inner surface of polymer based pipes [139,140]. The study of Wang et al., (2019) evidenced that water quality parameters (e.g., contents of content, sulphate, bicarbonate, and humic acid, and water pH) affects the iron release from the polymer based pipes inner surface [139]. Like the iron, also the manganese can be deposited from the flowing water on PVC pipes [141]. The behaviour of PVC pipes and iron pipes is different regarding the deposition of manganese present in the drinking water: the PVC pipe is providing more favourable conditions for manganese adherence, but the layer formed is not stable and is easily detaching.
It was found that formation of biofilm is accelerated when increasing the water velocity. This is because when increasing the water velocity, the mass transfer of nutrients is intensified. Increased growth of biofilm with water velocity was reported for both copper and plastic pipes. However contrary to plastic pipes, in the case of copper pipes the increase of water flow rate results in an immediate increase of bacterial numbers and copper concentration in water caused by deposits detachment [142].
Although polymeric pipes are not susceptible to corrosion by scale formation, their mechanical structure can however be impacted by oxidation following the use of disinfectants.
The effect of two common disinfectants (chlorine dioxide, ClO2 and sodium hypochlorite, NaOCl) on polymer based pipes was studied in accelerated aging experiments. The evaluated pipes were high-density polyethylene (HDPE), low-density polyethylene (LDPE), unplasticized polyvinylidene chloride (PVC–U), and high-impact polyvinylidene chloride (Hi-PVC) pipes. The pipes have a lower resistance to oxidation in presence of ClO2 than in the presence of NaOCl. This can be explained by the fact that ClO2 generate free radicals that contributes to C – C chain scissions [143].
3. Biofilm formation on inner pipe wall
Biofilms formed on the inner walls of water distribution pipes are responsible for several types of problems, such as the deterioration of water quality, corrosion of metallic pipe walls, intensifying the leaching processes in concrete -based pipes, proliferation of pathogens, etc. The negative action of microorganisms in biofilm can be intensified by the existence of scale on the inner pipe walls.
It is known that the number and diversity of microorganisms in the film is higher than that in flowing water [144].
The biofilm and the scale formed on the pipe walls can exfoliate, releasing heavy metals and pathogens in the drinking water [142,145,146]. The biofilm can contain microorganisms like Pseudomonas aeruginosa and Legionella pneumophila that create health related issues [147,148,149]. Also, the biofilm can be responsible for the deterioration of the taste and odour of the drinking water [150].
The source of microorganisms can be the water itself or cracks in the pipe distribution system that are not remediated.
The biofilm produced by microorganisms present in the flowing water, is adhering on the surface of the inner pipes, and is formed by different constituents of extrapolymeric substances: carbohydrates, lipids, proteins, uronic acids [109], etc.
The steps of biofilm formation include the following successional steps: (i) microorganisms from the bulk water attach to the pipe surface; (ii) microorganism start to develop releasing extracellular polymeric substances (EPS); (iii) modify the surroundings so to exclude or enhance the development of other microorganisms [2,151].
The factors influencing the growth of the biofilm includes the water source [152,153,154], availability of the nutrients [155], disinfectant concentration [151,156,157], water flowing regime [158,159] and the pipe material [136,151,156,160,161,162,163,164,165,166,167].
The main microorganisms involved in the pipe corrosion are sulfate reducing bacteria (SRB) [168,169], nitrate reducing bacteria (NRB) [170,171], acid-producing bacteria (APB) [172], and metal-oxidizing bacteria (MOB) [173,174]. A particularity of biofilm effect on pipe corrosion is its non-uniform composition, inducing a non-equal distribution of corrosion process on the pipe surface [173]. Besides bacteria, the biofilm composition can also include viruses [175]. The proportion of both bacteria and viruses in water increases during stagnation periods.
Concrete was found to be susceptible to degradation under the action of microorganisms [176,177]. Biofilm formation has been reported also in the case of AC pipes. Microorganisms can bioaccumulate to form a layer of 2 to 5 mm thickness, coloured in yellow, orange, brown or black depending on the metallic cations that have been extracted from the AC pipe wall [178,179]. In this film several layers of microorganisms can be distinguished (Figure 8). By performing experiments with microorganisms cultivated on new AC pipes, the steps of pipe degradation and consequently pipe failure have been evidenced: (i) the fatty acids generated by bacterial growth especially under anaerobic conditions, decrease locally the pH; (ii) the concrete structure is deteriorated by leaching the free lime, leaving the asbestos fibers as a woven matrix inside the pipe wall; (iii) the path inside the fiber matrix will allow more development of the bacterial film growth; (iv) the asbestos structure weakens, detach and is released in the drinking water; (v) the structural strength of the AC pipe is reduced.
Microbiologically induced corrosion (MIC) is affecting metallic pipes. Worldwide there is a major concern related to the economic impact generated by maintenance of the water distribution system. Microbial induced corrosion together with scale accumulation may damage the pipeline resulting in pipe leakage or bursting. Biofilm formation can contribute to the acceleration of metallic pipes corrosion [92,93,94,95,180]. Pitting corrosion starts at the interface biofilm – metallic pipe because the water pH is modified by the release of metabolic degradation compounds [95].
To be able to prevent pipe bursting, it is important to characterise the scale accumulated on the inner surface of the pipe and to obtain information about the various microorganism that are colonizing the biofilm. An extended study on scale taken from cast iron pipes that were in service for 22 to 26 years was made by Jia et al., (2022) [180]. The pipes were affected by severe corrosion, burst, and leakage (Figure 9). FTIR and XRD analysis of pipe samples evidenced the presence of γ-FeOOH and α-FeOOH in loose scales, and of Fe3O4 in rigid scales. Also, late-stage corrosion products (Fe3O4, α-Fe2O3, γ-Fe2O3, and FeCO3), were observed in the severely corroded samples. Among the types of the bacteria that are known to play an important role in the processes of iron migration (iron-oxidizing bacteria, iron reducing bacteria, sulphur oxidizing bacteria, sulphate reducing bacteria, ammonia producing bacteria, nitrifying bacteria), sulphate reducing bacteria and ammonia producing bacteria were predominant in the biofilm.
It was found that in iron scales, microorganism community has a bigger influence in Fe3O4 formation than water chemical parameters. This means that in iron pipes distributing drinking water, microbial community influence the capture of iron from unstable corrosion products and enhance the formation of more stable and compact scale mainly consisting of Fe3O4 [181,182].
Corrosion of steel pipes used in water distribution systems, in the presence of microorganisms has been extensively studied [109,183,184,185]. MIC of carbon steel enhances the uniform and localized corrosion of pipe material [109]. Iron oxidizing bacteria (IOB) are responsible for corrosion of cast iron pipes and carbon steel pipes [185]. Iron oxidizing bacteria (Pseudomonas sp. strain DASEWM2) determinates a higher corrosion rate of the pipe by: (i) forming wider cracks in the corrosion layer in the presence of extrapolymeric substances; (ii) the presence of corrosion products with non-protective effect of surface [109].
Under stagnant water, the biofilm formed on corroded copper and stainless steel pipes is favourable to the formation and growth of Legionella pneumophila [149].
An extended study of the influence of pipe material on the evolution of the microorganism community was performed for water distribution systems in East China [162]. The study included samples of biofilm material from different pipe materials: ductile cast iron pipe (DCIP), gray cast iron pipe (GCIP), galvanized steel pipe (GSP), stainless steel clad pipe (SSCP), and polyvinyl chloride (PVC). Results showed that the biomass is growing faster on iron based pipes (DCIP and GCIP). The highest diversity of bacterial species is also found on iron based pipes. Total iron content in the biofilm samples influences the distribution of bacterial communities. The iron concentration in the flowing water is higher in the PVC pipe than in the iron based pipes which suggests that iron is accumulating in the biofilm. Analysed samples of biofilm showed that iron and manganese are accumulating in high concentrations in the biofilm formed on the iron based pipes.
Comparison among four pipe materials (steel, copper, stainless steel, and polyvinyl chloride) showed that bacterial communities are more developed on steel and copper pipes [186]. These pipes are forming important corrosion scales compared with stainless steel and PVC pipes. Stainlesss steel has the lowest bacterial count at the end of the operation. However, steel pipe has the highest bacterial diversity among the metallic pipes.
Nitrate was found to influence the bacterial communities and the iron release from the corrosion scales on cast iron and stainless steel pipes [170]. The increase of nitrate content promotes the growth of nitrate reducing bacteria while decreasing the activity of iron reducing bacteria. The percentage of goethite decreases and the predominant form of iron in the corrosion scales becomes the magnetite (Fe3O4) which is more stable compared with other forms of iron oxides. Therefore, the iron release in the drinking water decreases.
The biofilm presence significantly contributes to disinfectant concentration decay [157,187]. The pipe material influences the growth and distribution of microorganisms in the biofilm. The use of disinfectant 2,4,6-trichlorophenol (2,4,6-TCP) induced the formation of the 2,4,6-trichloroanisole (2,4,6-TCA) which is a source of odour in drinking water. Following this the interaction between the biofilm and the disinfectant will be different from one material to another. Ductile iron and stainless steel pipes produced much more amount of 2,4,6-TCA than PE pipe [150].
Comparison among three pipe materials (ductile iron, cement-lined stainless steel and polyethylene) used in the same conditions of flow and water characteristics showed significant differences in bacterial film growth and community [136]. The difference in the bacterial communities means that in the presence of disinfectant, each pipe will generate other disinfection by-products. Ductile iron had the highest disinfection byproduct formation potential. This is in accordance with the biofilm density and thickness measurements: ductile iron biofilm > stainless steel biofilm > polyethylene. The dominant bacteria percentage was similar for ductile iron and stainless steel pipes.
Another study comparing pipes made of PVC-U (polyvinyl chloride-unplasticised), PE-HD (polyethylene-high density) and cast iron pipes showed that on polymeric pipes the microbiome consists mainly of Proteobacteria while on cast iron pipe of Nitrospirae. The study included 7 years old pipes with biofilm complex composition and concluded that comparing to cast iron pipe, polymer based pipes offers a more suitable environment for pathogenic organisms development [164]. In a chlorinated DWDS, a community consisting of bacteria Pseudomonas, Massillia and Sphingomonas and the fungi Acremonium and Neocosmopora were detected in the biofilm formed on PE-HD [188].
Under the same operating conditions, PE–HD pipes were more susceptible towards biofilm development while concrete pipes were towards metals deposition (iron and manganese especially) [189].
Adherence of Legionella pneumophila and Pseudomonas aeruginosa on several types of pipes (ethylene-propylenediene-monomer rubber, EPDM, silane cross-linked polyethylene, PE-Xb, electron-ray cross-linked polyethylene, PE-Xc, and copper) in flowing tap water showed that these pathogens develop in the biofilms and resists up to several weeks on EPDM and PE. Legionella pneumophila adhere to copper surfaces while Pseudomonas aeruginosa did not [147].
Among several polymeric pipes (PVC–C chlorinated polyvinyl chloride, PE-Xb, PE-Xc, PE-100, PVC-P) tested for the transport of unchlorinated water, PVC–C is recommended for the control of biofilm growth. The ATP (adenosine triphosphate) concentrations, a measure of microbial activity in the biofilm, were minimum for PVC–C and maximum for PVC–P [165].
Among several tested pipes (stainless steel, glass, zinc-galvanized steel, copper, and polyvinyl chloride), Mycobacterium avium shows highest adherence to galvanized steel and smallest to glass [190].
The efficiency of disinfection process depends on the pipe material. Comparing chlorine disinfection in polyethylene and copper pipes, for the same disinfectant concentration, the microorganisms presence decreases both in water and film on polyethylene pipe. For the copper pipes the effect of disinfection is weaker, being effective in the front part of the pipeline. This suggests that copper pipes require a higher disinfectant concentration for an efficient decrease of microbial numbers [191].
Antibiotics present in the water flowing in the DWDS contribute to the development of biofilm resistance to antibiotics [192,193]. It was found that at low concentrations, the antibiotics (tetracycline, sulfadiazine, and chloramphenicol) will enhance the rate growth of bacteria in the biofilms [192].
4. Microplastic (MP) fate in DWDS
In the recent years the presence and fate of microplastic in drinking water is receiving increasing attention [194,195,196]. There are numerous MPs sources from various environments [197,198,199,200,201]. Once in DWDS, the MPs can sediment and be incorporated into the scale formed on the pipe inner surface.
Variation in total MPs content (polypropylene, polyethylene, polystyrene, polyethylene terephthalate, and polyvinyl chloride) along a pipeline showed a decrease of MPs concentration in water from 1570.8 n⋅L– 1 at water intake to 377.0 n⋅ L– 1 at the end of the pipeline network [202].
Attempts to remove MPs in conventional water treatment plants evidenced that this is not enough to reduce MPs, although some retention of bigger particles takes place, there is also a fragmentation process which generates even more small particles [201]. Negrete Velasco et al., (2023) evidenced the persistence in drinking water of some types of plastics (like polyethylene and polyethylene terephthalate) after the water passage through the Geneve’s water treatment plant [203]. Weber et al. (2021) found that the tap water from a German city did not contain MPs particles bigger than 10μm [204].
The toxicity of MPs derives from their chemical structure, from their physical and biological characteristics (small dimensions of different shapes that can adsorb chemicals, can be sedimented or easily transported) [205].
Also, it has been reported that MPs (e.g., polyethylene, polystyrene, polyvinylchloride, polypropylene, polyamide or polyformaldehyde) can interact with heavy metals (Cr, Co, Ni, Cu, Zn, Cd, Pb, Ag, Mn and Hg) present in the drinking water and contribute to metal accumulation [206,207,208,209] (Figure 10) .
MPs act as organic compounds carriers or adsorbents; they can accumulate dangerous chemicals present in small quantities in drinking water, like polycyclic aromatic hydrocarbons (PAHs), polychlorinated biphenyls (PCBs) and organochlorine pesticides [209,210].
The accumulated MPs (containing heavy metals or dangerous organic compounds in larger quantities than in the drinking water) can be later detached with the scale and be further transported by the flowing water, posing a health risk.
MPs present in water bodies are generally polyamide (PA, 33%), polyethylene terephthalate (PET, 15%), rubbers (10%), polyethylene (PE, 10%) and chlorinated polyethylene (CPE, 7%) [211]. Analysis of tap water showed MP particles present in almost half of the samples analysed and the polymers identified were polypropylene, polyester, and polyamide [212].
MPs were detected in different layers of the pipes scale: in the surface, in hard shell-like, and porous core layers (Figure 5) [119,213]. The study has been made using pipe scales samples collected from iron metallic pipe in use for about 20 years and polystyrene MP particles. The retention mechanism of MP is complicated. For polystyrene it was found that van der Waals, electrostatic interactions, hydrogen bonding, and pore filling were the main adsorption processes [213].
The scale is accumulating MP particles (nylon and polyvinyl chloride) with size 50–100 μm while those higher than 200 μm are flowing with the water [214].
The study of the interaction between MPS and biofilm is not extensively evaluated so far due to the complexity of the processes involved. The study of Chen et al., (2023) focused on the impact of hydraulic conditions on the development of a MPS containing biofilm [215]. The MPs tend to form clusters in the biofilm with dimensions depending on the water flow rate (the higher the water flow rate, the lower the dimension of cluster).
Another parameter that can affect the behavior of MPs in DWDS is the chlorination. It has been shown that the water disinfection with chlorine enhances the aggregation ability of MPs and their adsorption capacity of Cr(VI) ions [208].
5. Mathematical modelling
The pipes affected by the leaching process were found to be the metallic pipes and cement and cement protected pipes. Leaching depends on the material pipe and the water characteristics (disinfectant dose, pH, if is soft water). The compounds leached from the pipe surface will accumulate in water over the distance of the pipeline. Therefore, the concentrations of different dangerous compounds will be higher at the ends of drinking water supply pipeline sections. Few studies in the literature address the modelling and prediction of compounds leaching from different pipe surfaces. This is due to the complexity related to the processes on one side and on other side is that, depending on the type of pipe, the leaching processes are time dependent. Hence, the need for large spatial-temporal data to develop model that predicts the leaching of pipeline components.
Moreover, when developing a tool for modelling contaminants release from pipe distribution system, it is necessary to include a model for microbial contamination and disinfection by-products (DBP) formation because these processes are interfering with the release of contaminants from the pipeline [216].
Chlorine based disinfectants react with natural organic matter and form the DBP. DBP include THMs (trihalomethanes), HAAs (haloacetic acids), HANs (haloacetonitriles), HNMs (halonitromethanes), HAMs (halogenated acetamides) etc. Aldehydes (ALs) and iodinated DBP cand be formed when water is disinfected by ozone and iodine [217].
The water distribution system is a highly dynamic environment, with changes occurring throughout the whole distribution system. A great attention is given to disinfection by-products in the water treatment plant, but few studies are dedicated to what happens afterwards and how DBP transform in the water distribution system.
Because PVC manufactured pipes are more susceptible to biological film formation, the mathematical model developed for these distribution systems must include the interaction among the organic matter and the disinfection substances.
Models to account for longitudinal dispersion of pollutants in water distribution systems have been developed [218].
For a pipe system coated with cement, mathematical modelling of heavy metals (chromium and lead) release shortly after pipeline operation was studied by accounting for sorption [219,220]. By using this model, the chromium and lead concentrations at pipeline sections can be calculated after rehabilitation by cement lining. The developed mathematical model considers several mechanisms to describe the leaching of chromium and lead: dissolution, diffusion, advective transport and sorption. The sorption included in the model considers the adsorption of heavy metals inside porous cement coatings. The diffusion accounts for chromium and lead transport, in water phase in coating capillaries and in water phase inside the pipe. Experiments were performed in static [219] and in dynamic conditions [220]. Significantly different lead and chromium concentrations near the wall coating compared to the pipeline center, are obtained by including of the diffusive transport in the liquid phase in the mathematical model [219]. The maximum cross sectional average concentration depends on the pipe diameter, a pipe diameter twice as large will result in decreasing by half the maximum cross sectional average concentration.
The experiments performed under dynamic conditions were using fresh water or water replaced periodically [220]. The water was characterized by its pH, alkalinity, and hardness. The calculated and experimental concentrations of lead and chromium were in good agreement. The calculated concentrations corresponding to a pipeline 30 km long reached values that are well below the threshold of the current regulations (2.5 mg/m3 for chromium vs. 25 mg/m3 in regulations and 2 mg/m3 for lead vs. 5 mg/m3 in regulations) [1]. However, these concentrations may occasionally be exceeded in case of water stagnation or if the flowing water is already reach in chromium or lead. The impact of biofilm and DBP formation was neglected in this model.
To prevent unplanned pipe failure, the lifetime of a piping system must be approximated. Because pipes are affected by flowing water, soil, and environmental characteristics, it is difficult to predict what will be the degradation along a pipeline. In this case estimation of probability of failure based on Monte Carlo simulations are of help. This method was applied in the case of AC pipes distribution system [221]. Large experimental data is needed to calculate the degradation rate for different sections of an AC pipe system (different pipe diameter sizes, water with different characteristics from different locations in Thailand). Monte Carlo simulations will provide several failures cases that will allow to schedule a pipe replacement program.
Using 3D computed fluid dynamics calculations, it was studied the influence of pipeline geometry, sampling methods, and the flowing regime on the lead concentration in drinking water [27]. The case includes a system of copper pipes connected by lead-solders and brass valves. It was found that galvanic corrosion takes place when lead is in contact with copper in the presence of the water. The galvanic corrosion is an electrochemical process in which one metal corrodes when is electrically connected with a dissimilar metal in the presence of a conductive liquid. In this case lead is the anode and is corroding while copper being the cathode (Figure 11). In case of stagnant water, the lead concentration is increasing and when the water is used again, concentration peaks of lead in tap water are generated [28]. The model is based on Ohm’s law, Faradays’ law, and polarization theory to predict lead concentration in stagnant water, after a given time. The model does not include the effect of pH, temperature, and the concentration of organic matters and inorganic matters. To be used for modelling studies using water with different properties, the model must be adapted. The additional mass transport equations must be included to adapt the model to water flowing conditions. This model cand be however adapted to explore the effect of other pipe materials such as iron or stainless steel.
The copper release in drinking water is controlled by the acidity of the flowing water rather than by the concentration of dissolved oxygen [85]. In stagnant water, copper corrosion and therefore copper release in the drinking water is enhanced by the presence of the hydrogen ions which in turn increases the consumption of the dissolved oxygen. The kinetic modelling of dissolved oxygen consumption rate evidenced that for new pipes and low carbonate concentration, a zero-order linear kinetic rate law is describing well the experimental data. For aged copper the kinetics of dissolved oxygen consumption is better described by a first order kinetic rate law.
6. Conclusions
Metal based pipes form scale which contains and accumulate from environment heavy metals (e.g., lead, vanadium, chromium, copper, arsenic, zinc, cadmium, manganese). The scales can detach and end up in the flowing water. Cement based pipes release chemicals after commissioning. Calcium, aluminium, chromium, lead, and cadmium are the main ions released by cement containing pipes. In the case of asbestos containing cement pipes, asbestos fibbers can be released in the drinking water. Polymeric pipes are susceptible to release organoleptic substances (generated during the manufacture process) within firsts weeks after the commissioning.
The efficiency of disinfection process depends on the pipe material. Metallic pipes (e.g., copper) may require a higher concentration of disinfectant. As regarding the corrosion process, there is a clear advantage of polymeric based pipes versus metal based pipes. The polymeric pipes do not develop scale deposits. They are however subjected to degradation by chain scission, in the presence of water disinfectants that generate free radicals (e.g., ClO2).
All types of pipes develop biofilm on their surface. This biofilm retains and accumulates microplastic and compounds from water. Also, the biofilm accelerates the proliferation of opportunistic pathogens and bacteria. When changing the flow conditions or water parameters, the biofilm can detach, causing an instant increase of some compounds concentrations that may pose a health risk (especially heavy metals and microplastic). Microorganism present in the biofilm enhance metal based pipes corrosion (microbiologically induced corrosion) making them even more vulnerable to mechanical failure and accelerating the release of dangerous compounds in the drinking water.
Changing from flowing to stagnant conditions will cause an enhanced corrosion of metal based pipes. For the polymeric pipes there are no studies that discuss this aspect, but it is expected that the stagnant conditions will affect the microorganisms community in the biofilm.
Author Contributions
Conceptualization, D.S.S. and M.B.; methodology, G.T.; formal analysis, D.S.S.; investigation, M.B. and G.T.; resources, D.S.S.; writing—original draft preparation, M.B.; writing—review and editing, D.S.S. and M.B.; visualization, G.T.; supervision, D.S.S. and M.B.; funding acquisition, D.S.S. All authors have read and agreed to the published version of the manuscript.
Funding
This research received no external funding.
Conflicts of Interest
The authors declare no conflict of interest.
References
- DIRECTIVE (EU) 2020/2184 OF THE EUROPEAN PARLIAMENT AND OF THE COUNCIL of 16 December 2020. Available online: https://eur-lex.europa.eu/legal-content/EN/TXT/PDF/?uri=CELEX:32020L2184 (accessed on 8 June 2023).
- Prest, E.I.; Hammes, F.; van Loosdrecht, M.C.M.; Vrouwenvelder, J.S. Biological Stability of Drinking Water: Controlling Factors, Methods, and Challenges. Front. Microbiol. 2016, 7, 45. [Google Scholar] [CrossRef]
- Simoes, L.C.; Simoes, M.; Oliveira, R.; Vieira, M.J. Potential of the adhesion of bacteria isolated from drinking water to materials. J. Basic Microbiol. 2007, 47, 174–183. [Google Scholar] [CrossRef] [PubMed]
- Douterelo, I.; Sharpe, R.; Boxall, J. Bacterial community dynamics during the early stages of biofilm formation in a chlorinated experimental drinking water distribution system: implications for drinking water discolouration. J. Appl. Microbiol. 2014, 117, 286–301. [Google Scholar] [CrossRef]
- Liu, Y.; Yang, S.-F.; Li, Y.; Xu, H.; Qin, L.; Tay, J.-H. The influence of cell and substratum surface hydrophobicities on microbial attachment. J. Biotechnol. 2004, 110, 251–256. [Google Scholar] [CrossRef]
- Yu, J.; Kim, D.; Lee, T. Microbial diversity in biofilms on water distribution pipes of different materials. Water Sci. Technol. 2010, 61, 163–171. [Google Scholar] [CrossRef]
- Zacheus, O.M.; Iivanainen, E.K.; Nissinen, T.K.; Lehtola, M.J.; Martikainen, P.J. Bacterial biofilm formation on polyvinyl chloride, polyethylene and stainless steel exposed to ozonated water. Water Res. 2000, 34, 63–70. [Google Scholar] [CrossRef]
- Rabin, R. The lead industry and Lead Water Pipes “A MODEST CAMPAIGN. Am. J. Public Health 2008, 98, 1584–1592. [Google Scholar] [CrossRef]
- Dave, D.M.; Yang, M. Lead in drinking water and birth outcomes: A tale of two water treatment plants. J. Health Econ. 2022, 84, 102644. [Google Scholar] [CrossRef] [PubMed]
- Butler, G.; Ison, H.C.K. Corrosion and Its Prevention in Waters; Leonard-Hill: London, 1966; p. 121. [Google Scholar]
- Deshommes, E.; Andrews, R.C.; Gagnon, G.; McCluskey, T.; McIlwain, B.; Dore, E.; Nour, S.; Prevost, M. Evaluation of exposure to lead from drinking water in large buildings. Water Res. 2016, 99, 46–55. [Google Scholar] [CrossRef]
- Dore, E.; Deshommes, E.; Andrews, R.C.; Nour, S.; Prevost, M. Sampling in schools and large institutional buildings: Implications for regulations, exposure and management of lead and copper. Water Res. 2018, 140, 110–122. [Google Scholar] [CrossRef] [PubMed]
- Riblet, C.; Deshommes, E.; Laroche, L.; Prevost, M. True exposure to lead at the tap: Insights from proportional sampling, regulated sampling and water use monitoring. Water Res. 2019, 156, 327–336. [Google Scholar] [CrossRef] [PubMed]
- Fasaee, M.A.K.; Berglund, E.; Pieper, K.J.; Ling, E.; Benham, B.; Edwards, M. Developing a framework for classifying water lead levels at private drinking water systems: A Bayesian Belief Network approach. Water Res. 2021, 189, 116641. [Google Scholar] [CrossRef] [PubMed]
- Rondeau, V.; Jacqmin-Gadda, H.; Commenges, D.; Helmer, C.; Dartigues, J.F. Aluminum and Silica in Drinking Water and the Risk of Alzheimer’s Disease or Cognitive Decline: Findings From 15-Year Follow-up of the PAQUID Cohort. Am. J. Epidemiol. 2009, 169, 489–496. [Google Scholar] [CrossRef] [PubMed]
- Browne, M.L.; Varadarajulu, D.; Lewis-Michl, E.L.; Fitzgerald, E F. Cancer incidence and asbestos in drinking water, Town of Woodstock, New York, 1980–1998. Environ. Res. 2005, 98, 224–232. [Google Scholar] [CrossRef]
- Kjærheim, K.; Ulvestad, B.; Martinsen, J.I.; Andersen, A. Cancer of the gastrointestinal tract and exposure to asbestos in drinking water among lighthouse keepers (Norway). Cancer Causes Control 2005, 16, 593–598. [Google Scholar] [CrossRef]
- Xu, P.; Huang, S.; Wang, Z.; Lagos, G. Daily intakes of copper, zinc and arsenic in drinking water by population of Shanghai, China. Sci. Total Environ. 2006, 362, 50–55. [Google Scholar] [CrossRef]
- Mitra, S.; Chakraborty, A.J.; Tareq, A.M.; Emran, T.B.; Nainu, F.; Khusro, A.; Idris, A.M.; Khandaker, M.U.; Osman, H.; Alhumaydhi, F.A.; et al. Impact of heavy metals on the environment and human health: Novel therapeutic insights to counter the toxicity. J. King Saud Univ. Sci. 2022, 34, 101865. [Google Scholar] [CrossRef]
- Bhat, R.A.; Bakhshalizadeh, S.; Guerrera, M.C.; Kesbiç, O.S.; Fazio, F. Toxic effect of heavy metals on ovarian deformities, apoptotic changes, oxidative stress, and steroid hormones in rainbow trout. J. Trace Elem. Med. Biol. 2023, 75, 127106. [Google Scholar] [CrossRef]
- Li, D.; Pan, B.; Han, X.; Lu, Y.; Wang, X. Toxicity risks associated with trace metals call for conservation of threatened fish species in heavily sediment-laden Yellow River. J. Hazard. Mater. 2023, 448, 130928. [Google Scholar] [CrossRef]
- Patle, A.; Kurrey, R.; Deb, M.K.; Patle, T.K.; Sinha, D.; Shrivas, K. Analytical approaches on some selected toxic heavy metals in the environment and their socio-environmental impacts: A meticulous review. J. Indian Chem. Soc. 2022, 99, 100545. [Google Scholar] [CrossRef]
- Rehman, A.U.; Nazir, S.; Irshad, R.; Tahir, K.; ur Rehman, K.; Islamb, R.U.; Wahab, Z. Toxicity of heavy metals in plants and animals and their uptake by magnetic iron oxide nanoparticles. J. Mol. Liq. 2021, 321, 114455. [Google Scholar] [CrossRef]
- Wang, Y.; Jing, H.; Mehta, V.; Welter, G.J.; Giammar, D.E. Impact of galvanic corrosion on lead release from aged lead service lines. Water Res. 2012, 46, 5049–5060. [Google Scholar] [CrossRef] [PubMed]
- Lytle, D.A.; Schock, M.R.; Triantafyllidou, S. Identify Lead Plumbing Sources to Protect Public Health. Opflow 2018, 44, 16–20. [Google Scholar] [CrossRef]
- Snoeyink, V.L.; Tang, M.; Lytle, D.A. Lead pipe and lead–tin solder scale formation and structure: A conceptual model. AWWA Wat. Sci. 2021, 3, e1246. [Google Scholar] [CrossRef]
- Chang, L. Effects of pipeline geometry, sample volume, and flow rate on Pb monitoring outcomes in copper pipe drinking water supply systems. Water Res. 2022, 222, 118890. [Google Scholar] [CrossRef]
- Chang, L.; Lee, J.H.W.; Fung, Y.S. Prediction of lead leaching from galvanic corrosion of lead-containing components in copper pipe drinking water supply systems. J. Hazard. Mater. 2022, 436, 129169. [Google Scholar] [CrossRef]
- Ng, D.Q.; Liu, S.W.; Lin, Y.P. Lead as a legendary pollutant with emerging concern: Survey of lead in tap water in an old campus building using four sampling methods. Sci. Total Environ. 2018, 636, 1510–1516. [Google Scholar] [CrossRef]
- Cartier, C.; Dore, E.; Laroche, L.; Nour, S.; Edwards, M.; Prevost, M. Impact of treatment on Pb release from full and partially replaced harvested Lead Service Lines (LSLs). Water Res. 2013, 47, 661–671. [Google Scholar] [CrossRef]
- Triantafyllidou, S.; Edwards, M. Lead (Pb) in Tap Water and in Blood: Implications for Lead Exposure in the United States. Crit. Rev. Environ. Sci. Technol. 2012, 42, 1297–1352. [Google Scholar] [CrossRef]
- DeSantis, M.K.; Triantafyllidou, S.; Schock, M.; Lytle, D.A. Mineralogical evidence of galvanic corrosion in drinking water lead pipe joints. Environ. Sci. Technol. 2018, 52, 3365–3374. [Google Scholar] [CrossRef]
- Kim, E.J.; Herrera, J.E.; Huggins, D.; Braam, J.; Koshowski, S. Effect of pH on the concentrations of lead and trace contaminants in drinking water: A combined batch, pipe loop and sentinel home study. Water Res. 2011, 45, 2763–2774. [Google Scholar] [CrossRef] [PubMed]
- Noel, J.D.; Wang, Y.; Giammar, D.E. Effect of water chemistry on the dissolution rate of the lead corrosion product hydrocerussite. Water Res. 2014, 54, 237–246. [Google Scholar] [CrossRef] [PubMed]
- Triantafyllidou, S.; Burkhardt, J.; Tully, J.; Cahalan, K.; DeSantis, M.; Lytle, D.; Schock, M. Variability and sampling of lead (Pb) in drinking water: Assessing potential human exposure depends on the sampling protocol. Environ Int. 2021, 146, 106259. [Google Scholar] [CrossRef] [PubMed]
- Maheshwari, A.; Abokifa, A.; Gudi, R.D.; Biswas, P. Optimization of disinfectant dosage for simultaneous control of lead and disinfection-byproducts in water distribution networks. J. Environ. Manage. 2020, 276, 111186. [Google Scholar] [CrossRef]
- Stets, E.G.; Lee, C.J.; Lytle, D.A.; Schock, M.R. Increasing chloride in rivers of the conterminous U.S. and linkages to potential corrosivity and lead action level exceedances in drinking water. Sci. Total Environ. 2018, 613–614, 1498–1509. [Google Scholar] [CrossRef]
- Lytle, D.A.; Schock, M.R.; Formal, C.; Bennett-Stamper, C.; Harmon, S.; Nadagouda, M.N.; Williams, D.; DeSantis, M.K.; Tully, J.; Pham, M. Lead Particle Size Fractionation and Identification in Newark, New Jersey’s Drinking Water. Environ. Sci. Technol. 2020, 54, 13672–13679. [Google Scholar] [CrossRef]
- Kim, E.J.; Herrera, J.E. Characteristics of Lead Corrosion Scales Formed during Drinking Water Distribution and Their Influence on the Release of Lead and Other Contaminants. Environ. Sci. Technol. 2010, 44, 6054–6061. [Google Scholar] [CrossRef]
- Gerke, T.L.; Scheckel, K.G.; Schock, M.R. Identification and Distribution of Vanadinite (Pb5(V5+O4)3Cl) in Lead Pipe Corrosion By-Products. Environ. Sci. Technol. 2009, 43, 4412–4418. [Google Scholar] [CrossRef]
- Schock, M.R.; Cantor, A.F.; Triantafyllidou, S.; Desantis, M.K.; Scheckel, K.G. Importance of pipe deposits to Lead and Copper Rule compliance. J. Am. Water Works Assoc. 2014, 106, 336–349. [Google Scholar] [CrossRef]
- Harmon, S.M.; Tully, J.; DeSantis, M.K.; Schock, M.R.; Triantafyllidou, S.; Lytle, D.A. A holistic approach to lead pipe scale analysis: Importance, methodology, and limitations. AWWA Wat. Sci. 2022, 1278. [Google Scholar] [CrossRef]
- Bradham, K.D.; Nelson, C.M.; Sowers, T.D.; Lytle, D.A.; Tully, J.; Schock, M.R.; Li, K.; Blackmon, M.D.; Kovalcik, K.; Cox, D.; et al. A national survey of lead and other metal(loids) in residential drinking water in the United States. J. Expo. Sci. Environ. Epidemiol. 2023, 33, 160–167. [Google Scholar] [CrossRef] [PubMed]
- Triantafyllidou, S.; Schock, M.R.; DeSantis, M.K.; White, C. Low Contribution of PbO2-Coated Lead Service Lines to Water Lead Contamination at the Tap. Environ. Sci. Technol. 2015, 49, 3746–3754. [Google Scholar] [CrossRef] [PubMed]
- Available online: https://www.lenntech.com/periodic/water/lead/lead-and-water.htm (accessed on 3 July 2023).
- Bisogni, J.J.; Nassar, I.S.; Menegaux, A.M. Effect of calcium on lead in soft-water distribution systems. J. Environ. Eng. 2000, 126, 475–478. [Google Scholar] [CrossRef]
- Trueman, B.F.; Gagnon, G.A. A new analytical approach to understanding nanoscale lead-iron interactions in drinking water distribution systems. J. Hazard. Mater. 2016, 311, 151–157. [Google Scholar] [CrossRef] [PubMed]
- DeSantis, M.K.; Schock, M.R.; Tully, J.; Bennett-Stamper, C. Orthophosphate Interactions with Destabilized PbO2 Scales. Environ. Sci. Technol. 2020, 54, 14302–14311. [Google Scholar] [CrossRef]
- Touvinen, O.H.; Button, K.S.; Vuorinen, A.; Carlson, L.; Mair, D.M.; Yut, L.A. Bacterial, chemical, and mineralogical characteristics of tubercles in distribution pipelines. J. Am. Water Works Assoc. 1980, 72, 626–635. [Google Scholar] [CrossRef]
- Katner, A.; Pieper, K.; Brown, K.; Lin, H.Y.; Parks, J.; Wang, X.; Hu, C.Y.; Masters, S.; Mielke, H.; Edwards, M. Effectiveness of Prevailing Flush Guidelines to Prevent Exposure to Lead in Tap Water. Int. J. Environ. Res. Public Health 2018, 15, 1537. [Google Scholar] [CrossRef]
- Tully, J.; DeSantis, M.K.; Schock, M.R. Water quality–pipe deposit relationships in Midwestern lead pipes. AWWA Wat. Sci. 2019, 1, e1127. [Google Scholar] [CrossRef]
- Wasserstrom, L.W.; Miller, S.A.; Triantafyllidou, S.; DeSantis, M.K.; Schock, M.R. Scale Formation Under Blended Phosphate Treatment for a Utility With Lead Pipes. J. Am. Water Works Assoc. 2017, 109, E464–E478. [Google Scholar] [CrossRef]
- Available online: https://www.rinkerpipe.com/a-complete-guide-to-reinforced-concrete-pipe/ (accessed on 15 July 2023).
- Meland, I.S. Durability of mortar linings in ductile iron pipes. In: Durability of building materials and components. In Proceedings of the eighth international conference on durability of building materials and components, Vancouver, Canada, 30 May–3 June 1999; pp. 170–179. [Google Scholar]
- Cunningham, H.M.; Pontefract, R. Asbestos fibres in beverages and drinking water. Nature 1971, 232, 332–333. [Google Scholar] [CrossRef]
- Webber, J.S.; Syrotynski, S.; King, M.V. Asbestos-Contaminated Drinking Water: Its Impact on Household Air. Environ. Res. 1988, 46, 153–167. [Google Scholar] [CrossRef] [PubMed]
- Zavasnik, J.; Sestan, A.; Skapin, S. Degradation of asbestos – Reinforced water supply cement pipes after a long-term operation. Chemosphere 2022, 287, 131977. [Google Scholar] [CrossRef] [PubMed]
- Mager, S.; Knopick, M.; Oddy, G. The concentration and prevalence of asbestos fibres in Christchurch, New Zealand’s drinking water supply. Water Supply 2022, 22, 4445. [Google Scholar] [CrossRef]
- Mindess, S.; Young, F. Concrete; Prentice-Hall: New Jersey, USA, 1981; p. 671. [Google Scholar]
- Kosmatka, S.; Panarese, W. Design and Control of Concrete Mixes; Portland Cement Association: New Jersey, USA, 1988; p. 205. [Google Scholar]
- Liu, M.; Zhao, Y.; Yu, Z.; Cao, Z. Binding of Cu(II) and Zn(II) in Portland cement immobilization systems: Effect of C-A-S-H composition. Cem. Concr. Compos. 2022, 131, 104602. [Google Scholar] [CrossRef]
- AI-Adeeb, A.M.; Mattit, M.A. Int. J. Cem. Compos. Lightweight Concr. 1984, 6, 233–240. [CrossRef]
- Zielina, M.; Dabrowski, W.; Radziszewska-Zielina, E. Cement Mortar Lining as a Potential Source of Water Contamination. Int. J. Environ. Ecol. Eng. 2014, 8, 723–726. [Google Scholar]
- Młyńska, A.; Zielina, M. The influence of prefabricated pipe cement coatings and those made during pipe renovation on drinking water quality. E3S web of conferences, 9th conference on interdisciplinary problems in environmental protection and engineering EKO-DOK, Boguszów-Gorce, Poland, 23–25 April 2017. [Google Scholar]
- Młyńska, A.; Zielina, M. A comparative study of Portland cements CEM I used for water pipe renovation in terms of pollutants leaching from cement coatings and their impact on water quality. J. Water Supply Res. Technol. AQUA 2018, 67, 685–696. [Google Scholar] [CrossRef]
- Achternbosch, M.; Brautigam, K.R.; Hartlieb, N.; Kupsch, C.; Richers, U.; Stemmermann, P. Heavy metals in cement and concrete resulting from the co-incineration of wastes in cement kilns with regard to the legitimacy of waste utilisation. Umweltforschungsplan Des Bundesministeriums Für Umwelt, Naturschutz und Reaktorsicherheit, Förderkennzeichen (UFOPLAN No.) 200 33 335. Forschungszentrum Karlsruhe; 2003.
- Husillos Rodríguez, N.; Martínez-Ramírez, S.; Blanco-Varela, M.T.; Donatello, S.; Guillem, M.; Puig, J.; Fos, C.; Larrotcha, E.; Flores, J. The effect of using thermally dried sewage sludge as an alternative fuel on Portland cement clinker production. J. Clean. Prod. 2013, 52, 94–102. [Google Scholar] [CrossRef]
- Horsley, C.; Emmert, M.H.; Sakulich, A. Influence of alternative fuels on trace element content of ordinary portland cement. Fuel 2016, 184, 481–489. [Google Scholar] [CrossRef]
- Guo, X.; Yuan, S.; Xu, Y.; Qian, G. Effects of phosphorus and iron on the composition and property of Portland cement clinker utilized incinerated sewage sludge ash. Constr. Build. Mater. 2022, 341, 127754. [Google Scholar] [CrossRef]
- Mlynska, A.; Zielina, M.; Bielski, A. Contamination of drinking water soon after cement mortar lining renovation depending on the disinfectant doses. SN Appl. Sci. 2019, 1, 516. [Google Scholar] [CrossRef]
- Ekström, T. Leaching of concrete: Experiments and Modelling, Licentiate Thesis, Lund University, Division of Building Materials, 2001. [Google Scholar]
- Ismail, M.; Toumi, A.; François, R.; Gagné, R. Effect of crack opening on the local diffusion of chloride in inert materials. Cem. Concr. Res. 2004, 34, 711–716. [Google Scholar] [CrossRef]
- Li, G.; Yang, B.; Guo, C.; Du, J.; Xiaosuo, Wu. Time dependence and service life prediction of chloride resistance of concrete coatings. Constr. Build. Mater. 2015, 83, 19–25. [Google Scholar] [CrossRef]
- Zhang, J.; Bian, F.; Zhang, Y.; Fang, Z.; Fu, C.; Guo, J. Effect of pore structures on gas permeability and chloride diffusivity of concrete. Constr Build Mater. 2018, 163, 402–413. [Google Scholar] [CrossRef]
- Hassani, M.S.; Asadollahfardi, G.; Saghravani, S.F.; Sahar Jafari, S.; Peighambarzadeh, F.S. The difference in chloride ion diffusion coefficient of concrete made with drinking water and wastewater. Constr Build Mater. 2020, 231, 117182. [Google Scholar] [CrossRef]
- Wang, Y.; Liu, Z.; Fu, K.; Li, O.; Wang, Y. Experimental studies on the chloride ion permeability of concrete considering the effect of freeze–thaw damage. Constr Build Mater. 2020, 236, 117556. [Google Scholar] [CrossRef]
- Setunge, S.; Nguyen, N.; Alexander, B.L.; Dutton, L. Leaching of Alkali from Concrete in Contact with Waterways. Water Air Soil Pollut.: Focus 2009, 9, 381–391. [Google Scholar] [CrossRef]
- Abdulla, N.A. Concrete filled PVC tube: A review. Constr. Build. Mater. 2017, 156, 321–329. [Google Scholar] [CrossRef]
- Du, T.; Li, C.; Wang, X.; Ma, L.; Qu, F.; Wang, B.; Peng, J.; Li, W. Effects of pipe diameter, curing age and exposure temperature on chloride diffusion of concrete with embedded PVC pipe. J. Build. Eng. 2022, 57, 104957. [Google Scholar] [CrossRef]
- Cui, Y.; Liu, S.; Smith, K.; Hu, H.; Tang, F.; Li, Y.; Yu, K. Stainless steel corrosion scale formed in reclaimed water: Characteristics, model for scale growth and metal element release. J. Environ. Sci. 2016, 48, 79–91. [Google Scholar] [CrossRef]
- Merkel, T.H.; Pehkonen, S.O. General corrosion of copper in domestic drinking water installations: scientific background and mechanistic understanding. Corros. Eng. Sci. Technol. 2006, 41, 21–37. [Google Scholar] [CrossRef]
- Al-Roomi, Y.M.; Hussain, K.F.; Al-Rifaie, M. Performance of inhibitors on CaCO3 scale deposition in stainless steel & copper pipe surface. Desalination 2015, 375, 138–148. [Google Scholar] [CrossRef]
- Zhao, L.; Liu, D.; Zhang, H.; Wang, J.; Zhang, X.; Liu, S.; Chen, C. Study on electrochemical reduction mechanisms of iron oxides in pipe scale in drinking water distribution system. Water Res. 2023, 231, 119597. [Google Scholar] [CrossRef]
- Schock, M.R.; Lytle, D.A.; Clement, J.A. Effect of pH, DIC, Orthophosphate and Sulfate on Drinking Water Cuprosolvency. EPA/600/R-95/085. USEPA, Office of Research and Development, Cincinnati. 1995. [Google Scholar]
- Vargas, I.T.; Alsina, M.A.; Pastén, P.A.; Pizarro, G.E. Influence of solid corrosion by-products on the consumption of dissolved oxygen in copper pipes. Corros. Sci. 2009, 51, 1030–1037. [Google Scholar] [CrossRef]
- Shalaby, H.M.; Al-Kharafi, F.M.; Gouda, V.K. .A Morphological Study of Pitting Corrosion of Copper in Soft Tap Water. Corros. 1989, 45, 536–547. [Google Scholar] [CrossRef]
- Dartmann, J.; Sadlowsky, B.; Dorsch, T.; Johannsen, K. Copper corrosion in drinking water systems – effect of pH and phosphate-dosage. Mater. Corros. 2010, 61, 189–198. [Google Scholar] [CrossRef]
- Boulay, N.; Edwards, M. Role of temperature, chlorine, and organic matter in copper corrosion by-product release in soft water. Water Res. 2001, 35, 683–690. [Google Scholar] [CrossRef]
- Edwards, M.; Dudi, A. Role of chlorine and chloramine in corrosion of lead bearing plumbing materials. J. Am. Water Work. Assoc. 2004, 96, 69–81. [Google Scholar] [CrossRef]
- Edwards, M.; Hidmi, L.; Gladwell, D. Phosphate inhibition of soluble copper corrosion by-product release. Corros. Sci. 2002, 44, 1057–1071. [Google Scholar] [CrossRef]
- Lytle, D.A.; Schock, M.R.; Leo, J.; Barnes, B. A Model for Estimating the Impact of Orthophosphate on Copper in Water. J. Am. Water Works Assoc. 2018, 110, 1–15. [Google Scholar] [CrossRef]
- Walker, J.T.; Dowsett, A.B.; Dennis, P.J.L.; Keevil, C.W. Continuous culture studies of biofilm associated with copper corrosion, Int. Biodeter. 1991, 27, 121–134. [Google Scholar] [CrossRef]
- Wagner, D.; Chamberlain, A.H.L. Microbiologically influenced copper corrosion in potable water with emphasis on practical relevance. Biodegradation 1997, 8, 177–187. [Google Scholar] [CrossRef]
- Keevil, C.W. The physico-chemistry of biofilm-mediated pitting corrosion of copper pipe supplying potable water. Water Sci. Technol. 2004, 49, 91–98. [Google Scholar] [CrossRef]
- Reyes, A.; Letelier, M.V.; De la Iglesia, R.; Gonzalez, B.; Lagos, G. Microbiologically induced corrosion of copper pipes in low-pH water. Int. biodeterior. biodegrad. 2008, 61, 135–141. [Google Scholar] [CrossRef]
- Olivares, T.E.; Cienfuegos, R.; Vargas, I.T.; Pizarro, G.E. Experimental evidence for enhanced copper release from domestic copper plumbing under hydrodynamic control. Corros. Sci. 2014, 80, 473–481. [Google Scholar] [CrossRef]
- Ng, D.Q.; Lin, Y.P. Evaluation of Lead Release in a Simulated Lead-Free Premise Plumbing System Using a Sequential Sampling Approach. Int. J. Environ. Res. Public Health 2016, 13, 266. [Google Scholar] [CrossRef] [PubMed]
- Shull, K.E. An experimental approach to corrosion control, J. Am. Water Works Assoc. 1980, 72, 280–285. [Google Scholar] [CrossRef]
- Hem, L.J.; Vik, E.A.; Bjornson-Langen, A. Water treatment to reduce internal corrosion in the drinking water distribution system in Oslo. Water Sci. Technol. Water Supply 2001, 1, 91–96. [Google Scholar] [CrossRef]
- Tang, Z.; Hong, S.; Xiao, W.; Taylor, J. Characteristics of iron corrosion scales established under blending of ground, surface, and saline waters and their impacts on iron release in the pipe distribution system. Corros. Sci. 2006, 48, 322–342. [Google Scholar] [CrossRef]
- Fabbricino, M.; Korshin, G.V. Changes of the corrosion potential of iron in stagnation and flow conditions and their relationship with metal release. Water Res. 2014, 62, 136–146. [Google Scholar] [CrossRef]
- Zhang, X.; Mi, Z.; Wang, Y.; Liu, S.; Niu, Z.; Lu, P.; Wang, J.; Gu, J.; Chen, C. A red water occurrence in drinking water distribution systems caused by changes in water source in Beijing, China: mechanism analysis and control measures. Front. Environ. Sci. Eng. 2014, 8, 417–426. [Google Scholar] [CrossRef]
- Yang, F.; Shi, B.; Bai, Y.; Sun, H.; Lytle, D.A.; Wang, D. Effect of sulfate on the transformation of corrosion scale composition and bacterial community in cast iron water distribution pipes. Water Res. 2014, 59, 46–57. [Google Scholar] [CrossRef] [PubMed]
- Li, D.; Zhuang, Y.; Hua, Y.; Shi, B. Impact of initial chlorine concentration on water quality change in old unlined iron pipes. Water Res. 2022, 225, 119146. [Google Scholar] [CrossRef] [PubMed]
- Internal Corrosion of Water Distribution Systems, second ed., AWWA Research Foundation, DVGW-Technologiezentrum Wasser, Denver, USA, 1996; pp. 430.
- Oh, S.J.; Kwon, S.-J.; Lee, J.-Y.; Yoo, J.-Y.; Choo, W.-Y. Oxidation of Fe2+ ions in sulfate- and chloride-containing aqueous medium. Corros. 2002, 58, 498–504. [Google Scholar] [CrossRef]
- McNeill, L.S.; Edwards, M. Iron pipe corrosion in distribution systems. J. Am. Water Works Assoc. 2001, 93, 88–100. [Google Scholar] [CrossRef]
- Peng, C.Y.; Ferguson, J.F.; Korshin, G.V. Effects of chloride, sulfate and natural organic matter (NOM) on the accumulation and release of trace-level inorganic contaminants from corroding iron. Water Res. 2013, 47, 5257–5269. [Google Scholar] [CrossRef]
- Sachan, R.; Singh, A.K.; Negi, Y.S. Study of Microbially Influenced Corrosion in the Presence of Iron-Oxidizing Bacteria (Strain DASEWM2). J. Bio- Tribo-Corros. 2020, 6, 109. [Google Scholar] [CrossRef]
- He, N.; Tian, Y.; Liu, C.; Zhao, W.; Liu, R.; Huang, J. Accumulation of vanadium and arsenic by cast iron pipe scales under drinking water conditions: A batch study. Chemosphere 2021, 269, 129396. [Google Scholar] [CrossRef]
- Kuch, A. Investigations of the reduction and re-oxidation kinetics of iron (III) oxide scales formed in waters. Corros. Sci. 1988, 28, 221–231. [Google Scholar] [CrossRef]
- Lin, X.; Xu, Q.; Li, Y.; Zhao, B.; Li, L.; Qiang, Z. Modeling iron release from cast iron pipes in an urban water distribution system caused by source water switch. J. Environ. Sci. 2021, 110, 73–83. [Google Scholar] [CrossRef]
- Qiu, W.; Li, W.; He, J.; Zhao, H.; Liu, X.; Yuan, Y. Variations regularity of microorganisms and corrosion of cast iron in water distribution system. J. Environ. Sci. 2018, 74, 177–185. [Google Scholar] [CrossRef] [PubMed]
- Tian, Y.; Peng, Z.; Liua, Y.; Jia, S.; Shen, H.; Zhao, W. Characteristics of vanadium release from layered steel pipe scales to bulk, steady, and occluded water in drinking water distribution systems. Sci. Total Environ. 2022, 838, 156465. [Google Scholar] [CrossRef] [PubMed]
- Gerke, T.L.; Scheckel, K.G.; Maynard, J.B. Speciation and distribution of vanadium in drinking water iron pipe corrosion by-products. Sci. Total Environ. 2010, 408, 5845–5853. [Google Scholar] [CrossRef] [PubMed]
- Tian, Y.; Yu, T.; Shen, Y.; Zheng, G.; Li, H.; Zhao, W. Cr release after Cr(III) and Cr(VI) enrichment from different layers of cast iron corrosion scales in drinking water distribution systems: the impact of pH, temperature, sulfate, and chloride. Environ. Sci. Pollut. Res. 2022, 29, 18778–18792. [Google Scholar] [CrossRef] [PubMed]
- Zhang, S.; Tian, Y.; Guo, Y.; Shan, J.; Liu, R. Manganese release from corrosion products of cast iron pipes in drinking water distribution systems: Effect of water temperature, pH, alkalinity, concentration and disinfectants. Chemosphere 2021, 262, 127904. [Google Scholar] [CrossRef] [PubMed]
- Yang, F.; Shi, B.; Gu, J.; Dongsheng Wang, D.; Yang, M. Morphological and physicochemical characteristics of iron corrosion scales formed under different water source histories in a drinking water distribution system. Water Res. 2012, 46, 5423–5433. [Google Scholar] [CrossRef] [PubMed]
- Zhang, H.; Liu, D.; Zhao, L.; Wang, J.; Xie, S.; Liu, S.; Lin, P.; Zhang, X.; Chen, C. Review on corrosion and corrosion scale formation upon unlined cast iron pipes in drinking water distribution systems. J. Environ. Sci. 2022, 117, 173–189. [Google Scholar] [CrossRef]
- Zhang, H.; Zhao, L.; Liu, D.; Wang, J.; Zhang, X.; Chen, C. Early period corrosion and scaling characteristics of ductile iron pipe for ground water supply with sodium hypochlorite disinfection. Water Res. 2020, 176, 115742. [Google Scholar] [CrossRef] [PubMed]
- Li, C.; Wang, D.; Xu, X.; Wang, Z. Formation of known and unknown disinfection by-products from natural organic matter fractions during chlorination, chloramination, and ozonation. Sci. Total Environ., 2017, 587–588, 177–184. [Google Scholar] [CrossRef]
- Postigo, C.; Emiliano, P.; Barceló, D.; Valero, F. Chemical characterization and relative toxicity assessment of disinfection byproduct mixtures in a large drinking water supply network. J. Hazard. Mater., 2018, 359, 166–173. [Google Scholar] [CrossRef]
- Chaukura, N.; Marais, S.S.; Moyo, W.; Mbali, N.; Thakalekoala, L.C.; Ingwani, T.; Mamba, B.B.; Jarvis, P.; Nkambule, T.T.I. Contemporary issues on the occurrence and removal of disinfection byproducts in drinking water - A review. J. Environ. Chem. Eng. 2020, 8, 103659. [Google Scholar] [CrossRef]
- Richardson, S.D.; Plewa, M.J. To regulate or not to regulate? What to do with more toxic disinfection by-products? J. Environ. Chem. Eng. 2020, 8, 103939. [Google Scholar] [CrossRef]
- Qi, P.; Li, T.; Hu, C.; Li, Z.; Bi, Z.; Chen, Y.; Zhou, H.; Su, Z.; Li, X.; Xing, X.; et al. Effects of cast iron pipe corrosion on nitrogenous disinfection by-products formation in drinking water distribution systems via interaction among iron particles, biofilms, and chlorine. Chemosphere 2022, 292, 133364. [Google Scholar] [CrossRef]
- Sontheimer, H.; Kolle, W.; Snoeyink, V.L. Siderite model of the formation of corrosion-resistant scales. J. Am. Water Works Assoc. 1981, 73, 572–579. [Google Scholar] [CrossRef]
- Li, M.; Liu, Z.; Chen, Y.; Hai, Y. Characteristics of iron corrosion scales and water quality variations in drinking water distribution systems of different pipe materials. Water Res. 2016, 106, 593–603. [Google Scholar] [CrossRef] [PubMed]
- Christensen, S.C.B.; Nissen, E.; Arvin, E.; Albrechtsen, H.-J. Distribution of Asellus aquaticus and microinvertebrates in a non-chlorinated drinking water supply system–Effects of pipe material and sedimentation. Water Res. 2011, 45, 3215–3224. [Google Scholar] [CrossRef] [PubMed]
- Tong, H.; Zhao, P.; Zhang, H.; Tian, Y.; Chen, X.; Zhao, W.; Li, M. Identification and characterization of steady and occluded water in drinking water distribution systems. Chemosphere 2015, 119, 1141–1147. [Google Scholar] [CrossRef]
- Tian, Y.; Li, J.; Jia, S.; Zhao, W. Co-release potential and human health risk of heavy metals from galvanized steel pipe scales under stagnation conditions of drinking water. Chemosphere 2021, 267, 129270. [Google Scholar] [CrossRef]
- Vasyliev, G.; Chyhryn, O. Improving mild steel corrosion resistance in tap water: Influence of water flow and supply rates. Materials Today: Proceedings 2022, 50, 452–455. [Google Scholar] [CrossRef]
- Tang, F.; Chen, G.; Brow, R.K. Chloride-induced corrosion mechanism and rate of enamel- and epoxy-coated deformed steel bars embedded in mortar. Cem. Concr. Res. 2016, 82, 58–73. [Google Scholar] [CrossRef]
- Xiong, J.; Zhu, J.; He, Y.; Ren, S.; Huang, W.; Lu, F. The application of life cycle assessment for the optimization of pipe materials of building water supply and drainage system. Sustain. Cities Soc. 2020, 60, 102267. [Google Scholar] [CrossRef]
- Anselme, C.; Guyen, N.; Bruchet, A.; Mallevialle, J. Characterization of low molecular weight products desorbed from polyethylene tubings. Sci. Total Environ. 1985, 47, 371–384. [Google Scholar] [CrossRef]
- Denberg, M.; Mosbæk, H.; Hassager, O.; Arvin, E. Determination of the concentration profile and homogeneity of antioxidants and degradation products in a cross-linked polyethylene type A (PEXa) pipe. Polym. Test. 2009, 28, 378–385. [Google Scholar] [CrossRef]
- Yan, X.; Lin, T.; Wang, X.; Zhang, S.; Zhou, K. Effects of pipe materials on the characteristic recognition, disinfection byproduct formation, and toxicity risk of pipe wall biofilms during chlorination in water supply pipelines. Water Res. 2022, 210, 117980. [Google Scholar] [CrossRef] [PubMed]
- Corfitzen, C.B. Investigation of aftergrowth potential of polymers for use in drinking water distribution: Factors affecting migration of bioavailable compounds investigated by batch set-ups and continuous flow model systems. DTU Environment 2004. [Google Scholar]
- Ryssel, S.T.; Arvin, E.; Holten Lützhøft, H.–C.; Olsson, M.E.; Prochazkova, Z.; Albrechtsen, H.-J. Degradation of specific aromatic compounds migrating from PEX pipes into drinking water. Water Res. 2015, 81, 269–278. [Google Scholar] [CrossRef] [PubMed]
- Wang, J.; Yan, H.; Xin, K.; Tao, T. Iron stability on the inner wall of prepared polyethylene drinking pipe: Effects of multi-water quality factors. Sci. Total Environ. 2019, 658, 1006–1012. [Google Scholar] [CrossRef]
- Braga, A.S.; Filion, Y. The interplay of suspended sediment concentration, particle size and fluid velocity on the rapid deposition of suspended iron oxide particles in PVC drinking water pipes. Water Res. 2022, X 15, 100143. [Google Scholar] [CrossRef]
- Cerrato, J.M.; Reyes, L.P.; Alvarado, C.N.; Dietrich, A.M. Effect of PVC and iron materials on Mn(II) deposition in drinking water distribution systems. Water Res. 2006, 40, 2720–2726. [Google Scholar] [CrossRef]
- Lehtola, M.J.; Laxander, M.; Miettinen, I.T.; Hirvonen, A.; Vartiainen, T.; Martikainen, P.J. The effects of changing water flow velocity on the formation of biofilms and water quality in pilot distribution system consisting of copper or polyethylene pipes. Water Res. 2006, 40, 2151–2160. [Google Scholar] [CrossRef]
- Khan, I.A.; Lee, K.H.; Lee, Y.-S.; Kim, J.-O. Degradation analysis of polymeric pipe materials used for water supply systems under various disinfectant conditions. Chemosphere 2022, 291, 132669. [Google Scholar] [CrossRef]
- Huang, C.K.; Weerasekara, A.; Bond, P.L.; Weynberg, K.D.; Guo, J. Characterizing the premise plumbing microbiome in both water and biofilms of a 50-year-old building. Sci. Total Environ. 2021, 798, 149225. [Google Scholar] [CrossRef]
- Liu, G.; Zhang, Y.; Knibbe, W.-J.; Feng, C.; Liu, W.; Medema, G.; van der Meer, W. Potential impacts of changing supply-water quality on drinking water distribution: A review. Water Res. 2017, 116, 135–148. [Google Scholar] [CrossRef]
- Chen, J.; Li, W.; Tan, Q.; Sheng, D.; Li, Y.; Chen, S.; Zhou, W. Effect of disinfectant exposure and starvation treatment on the detachment of simulated drinking water biofilms. Sci. Total Environ. 2022, 807, 150896. [Google Scholar] [CrossRef] [PubMed]
- Moritz, M.M.; Flemming, H.-C.; Wingender, J. Integration of Pseudomonas aeruginosa and Legionella pneumophila in drinking water biofilms grown on domestic plumbing materials. Int. J. Hyg. Environ. Health 2010, 213, 190–197. [Google Scholar] [CrossRef] [PubMed]
- Wingender, J.; Flemming, H.-C. Biofilms in drinking water and their role as reservoir for pathogens. Int. J. Hyg. Environ. Health 2011, 214, 417–423. [Google Scholar] [CrossRef] [PubMed]
- Van der Kooij, D.; Veenendaal, H.R.; Italiaander, R. Corroding copper and steel exposed to intermittently flowing tap water promote biofilm formation and growth of Legionella pneumophila. Water Res. 2020, 183, 115951. [Google Scholar] [CrossRef] [PubMed]
- Zhang, K.; Cao, C.; Zhou, X.; Zheng, F.; Sun, Y.; Cai, Z.; Fu, J. Pilot investigation on formation of 2,4,6-trichloroanisole via microbial O-methylation of 2,4,6-trichlorophenol in drinking water distribution system: An insight into microbial mechanism. Water Res. 2018, 131, 11–21. [Google Scholar] [CrossRef]
- Zhang, X.; Lin, T.; Jiang, F.; Zhang, X.; Wang, S.; Zhang, S. Impact of pipe material and chlorination on the biofilm structure and microbial communities. Chemosphere 2022, 289, 133218. [Google Scholar] [CrossRef]
- Li, X.; Wang, H.; Hu, X.; Hu, C.; Liao, L. Characteristics of corrosion scales and biofilm in aged pipe distribution systems with switching water source. Eng. Fail. Anal. 2016, 60, 166–175. [Google Scholar] [CrossRef]
- Pan, R.; Zhang, K.; Cen, C.; Zhou, X.; Xu, J.; Wu, J.; Wu, X. Characteristics of biostability of drinking water in aged pipes after water source switching: ATP evaluation, biofilms niches and microbial community transition. Environ. Pollut. 2021, 271, 116293. [Google Scholar] [CrossRef]
- Learbuch, K.L.G.; Smidt, H.; van der Wielen, P.W.J.J. Water and biofilm in drinking water distribution systems in the Netherlands. Sci. Total Environ. 2022, 831, 154940. [Google Scholar] [CrossRef]
- Park, S.-K.; Hu, J.Y. Interaction between phosphorus and biodegradable organic carbon on drinking water biofilm subject to chlorination. J. Appl. Microbiol. 2010, 108, 2077–2087. [Google Scholar] [CrossRef]
- Wang, H.; Masters, S.; Edwards, M.A.; Falkinham, J.O.; Pruden, A. Effect of disinfectant, water age, and pipe materials on bacterial and eukaryotic community structure in drinking water biofilm. Environ. Sci. Technol. 2014, 48, 1426–1435. [Google Scholar] [CrossRef] [PubMed]
- Trinh, Q.T.; Krishna, K.C.B.; Salih, A.; Listowski, A.; Sathasivan, A. Biofilm growth on PVC and HDPE pipes impacts chlorine stability in the recycled water. J. Environ. Chem. Eng. 2020, 8, 104476. [Google Scholar] [CrossRef]
- Liduino, V.S.; Cravo-Laureau, C.; Noel, C.; Carbon, A.; Duran, R.; Lutterbach, M.T.; Camporese Sérvulo, E.F. Comparison of flow regimes on biocorrosion of steel pipe weldments: Community composition and diversity of biofilms. Int. Biodeterior. Biodegrad. 2019, 143, 104717. [Google Scholar] [CrossRef]
- Chen, X.; Lian, X.Y.; Wang, Y.; Chen, S.; Sun, Y.R.; Tao, G.L.; Tan, Q.W.; Feng, J.C. Impacts of hydraulic conditions on microplastics biofilm development, shear stresses distribution, and microbial community structures in drinking water distribution pipes. J. Environ. Manage. 2023, 325, 116510. [Google Scholar] [CrossRef]
- Allion, A.; Lassiaz, S.; Peguet, L.; Boillot, P.; Jacques, S.; Peultier, J.; Bonnet, M.-C. A long term study on biofilm development in drinking water distribution system: comparison of stainless steel grades with commonly used materials. Revue de Métallurgie 2011, 108, 259–268. [Google Scholar] [CrossRef]
- Buse, H.Y.; Lu, J.; Lu, X.; Mou, X.; Ashbolt, N.J. Microbial diversities (16S and 18S rRNA gene pyrosequencing) and environmental pathogens within drinking water biofilms grown on the common premise plumbing materials unplasticized polyvinylchloride and copper. FEMS Microbiol Ecol. 2014, 88, 280–295. [Google Scholar] [CrossRef]
- Ren, H.; Wang, W.; Liu, Y.; Liu, S.; Lou, L.; Cheng, D.; He, X.; Zhou, X.; Qiu, S.; Fu, L.; et al. Pyrosequencing analysis of bacterial communities in biofilms from different pipe materials in a city drinking water distribution system of East China. Appl. Microbiol. Biotechnol. 2015, 99, 10713–10724. [Google Scholar] [CrossRef]
- Fu, Y.; Peng, H.; Liu, J.; Nguyen, T.H.; Hashmi, M.Z.; Shen, C. Occurrence and quantification of culturable and viable but non-culturable (VBNC) pathogens in biofilm on different pipes from a metropolitan drinking water distribution system. Sci. Total Environ. 2021, 764, 142851. [Google Scholar] [CrossRef]
- Goraj, W.; Pytlak, A.; Kowalska, B.; Kowalski, D.; Grządziel, J.; Szafranek-Nakonieczna, A.; Galazka, A.; Stępniewska, Z.; Stępniewski, W. Influence of pipe material on biofilm microbial communities found in drinking water supply system. Environ. Res. 2021, 196, 110433. [Google Scholar] [CrossRef]
- Learbuch, K.L.G.; Smidt, H.; van der Wielen, P.W.J.J. Influence of pipe materials on the microbial community in unchlorinated drinking water and biofilm. Water Res. 2021, 194, 116922. [Google Scholar] [CrossRef]
- Lee, D.; Calendo, G.; Kopec, K.; Henry, R.; Coutts, S.; McCarthy, D.; Murphy, H.M. The Impact of Pipe Material on the Diversity of Microbial Communities in Drinking Water Distribution Systems. Front. Microbiol. 2021, 12, 779016. [Google Scholar] [CrossRef] [PubMed]
- Shan, L.; Siyang Xu, S.; Pei, Y.; Zhu, Z.; Xu, L.; Liu, X.; Yixing Yuan, Y. Effect of domestic pipe materials on microbiological safety of drinking water: Different biofilm formation and chlorination resistance for diverse pipe materials. Process Biochem. 2023, 129, 11–21. [Google Scholar] [CrossRef]
- Lv, M.; Du, M. A review: microbiologically influenced corrosion and the effect of cathodic polarization on typical bacteria. Rev. Environ. Sci. Biotechnol. 2018, 17, 431–446. [Google Scholar] [CrossRef]
- Gu, T.; Jia, R.; Unsal, T.; Xu, D. Toward a better understanding of microbiologically influenced corrosion caused by sulfate reducing bacteria. J. Mater. Sci. Technol. 2019, 35, 631–636. [Google Scholar] [CrossRef]
- Zhang, H.; Liu, Y.; Wang, L.; Liu, S. Iron release and characteristics of corrosion scales and bacterial communities in drinking water supply pipes of different materials with varied nitrate concentrations. Chemosphere 2022, 301, 134652. [Google Scholar] [CrossRef]
- Liu, B.; Fan, E.; Jia, J.; Du, C.; Liu, Z.; Li, X. Corrosion mechanism of nitrate reducing bacteria on X80 steel correlated to its intermediate metabolite nitrite. Constr. Build. Mater. 2021, 303, 124454. [Google Scholar] [CrossRef]
- Kryachko, Y.; Hemmingsen, S.M. The role of localized acidity generation in microbially influenced corrosion. Curr. Microbiol. 2017, 74, 870–876. [Google Scholar] [CrossRef]
- Starosvetsky, J.; Starosvetsky, D.; Pokroy, B.; Hilel, T.; Armon, R. Electrochemical behaviour of stainless steels in media containing iron-oxidizing bacteria (IOB) by corrosion process modeling. Corros. Sci. 2008, 50, 540–547. [Google Scholar] [CrossRef]
- Teng, F.; Guan, Y.T.; Zhu, W.P. Effect of biofilm on cast iron pipe corrosion in drinking water distribution system: Corrosion scales characterization and microbial community structure investigation. Corros. Sci. 2008, 50, 2816–2823. [Google Scholar] [CrossRef]
- Miao, X.; Liu, C.; Liu, M.; Han, X.; Zhu, L.; Bai, X. The role of pipe biofilms on dissemination of viral pathogens and virulence factor genes in a full-scale drinking water supply system. J. Hazard. Mater. 2022, 432, 128694. [Google Scholar] [CrossRef]
- Grengg, C.; Mittermayr, F.; Baldermann, A.; Böttcher, M.E.; Leis, A.; Koraimann, G.; Grunert, P.; Dietzel, M. Microbiologically induced concrete corrosion: A case study from a combined sewer network. Cem. Concr. Res. 2015, 77, 16–25. [Google Scholar] [CrossRef]
- Sulikowski, J.; Kozubal, J. The Durability of a Concrete Sewer Pipeline Under Deterioration by Sulphate and Chloride Corrosion. Procedia Eng. 2016, 153, 698–705. [Google Scholar] [CrossRef]
- Wang, D.; Cullimore, R. Bacteriological challenges to asbestos cement water distribution pipelines. J. Environ. Sci. 2010, 22, 1203–1208. [Google Scholar] [CrossRef] [PubMed]
- Wang, D.; Cullimore, R.; Hu, Y.; Chowdhury, R. Biodeterioration of asbestos cement (AC) pipe in drinking water distribution systems. Int. Biodeterior. Biodegradation 2011, 65, 810–817. [Google Scholar] [CrossRef]
- Jia, S.; Tian, Y.; Li, J.; Chu, X.; Zheng, G.; Liu, Y.; Zhao, W. Field study on the characteristics of scales in damaged multi-material water supply pipelines: Insights into heavy metal and biological stability. J. Hazard. Mater. 2022, 424, 127324. [Google Scholar] [CrossRef] [PubMed]
- Wang, H.; Hu, C.; Zhang, L.; Li, X.; Zhang, Y.; Yang¸, M. Effects of microbial redox cycling of iron on cast iron pipe corrosion in drinking water distribution systems. Water Res. 2014, 65, 362–370. [Google Scholar] [CrossRef]
- Li, X.; Wanga, H.; Hu, C.; Yang, M.; Hu, H.; Niu, J. Characteristics of biofilms and iron corrosion scales with ground and surface waters in drinking water distribution systems. Corros. Sci. 2015, 90, 331–339. [Google Scholar] [CrossRef]
- Zhu, Y.; Wang, H.; Li, X.; Hu, C.; Yang, M.; Qu, J. Characterization of biofilm and corrosion of cast iron pipes in drinking water distribution system with UV/Cl2 disinfection. Water Res. 2014, 60, 174–181. [Google Scholar] [CrossRef]
- Liu, H.; Fu, C.; Gu, T.; Zhang, G.; Lv, Y.; Wang, H.; Liu, H. Corrosion behavior of carbon steel in the presence of sulfate reducing bacteria and iron oxidizing bacteria cultured in oilfeld produced water. Corros. Sci. 2015, 100, 484–495. [Google Scholar] [CrossRef]
- Liu, H.; Gu, T.; Zhang, G.; Cheng, Y.; Wang, H.; Liu, H. The effect of magnetic field on biomineralization and corrosion behavior of carbon steel induced by iron-oxidizing bacteria. Corros. Sci. 2016, 102, 93–102. [Google Scholar] [CrossRef]
- Hyun-Jung, J.; Choi, Y.-J.; Ka, J.-O. Effects of Diverse Water Pipe Materials on Bacterial Communities and Water Quality in the Annular Reactor. J. Microbiol. Biotechnol. 2011, 21, 115–123. [Google Scholar] [CrossRef]
- Ding, S.; Deng, Y.; Bond, T.; Fang, C.; Cao, Z.; Chu, W. Disinfection byproduct formation during drinking water treatment and distribution: A review of unintended effects of engineering agents and materials. Water Res. 2019, 160, 313–329. [Google Scholar] [CrossRef] [PubMed]
- Douterelo, I.; Fish, K.E.; Boxall, J.B. Succession of bacterial and fungal communities within biofilms of a chlorinated drinking water distribution system. Water Res. 2018, 141, 74–85. [Google Scholar] [CrossRef] [PubMed]
- Ginige, M.P.; Garbin, S.; Wylie, J.; Krishna, K.C.B. Effectiveness of Devices to Monitor Biofouling and Metals Deposition on Plumbing Materials Exposed to a Full-Scale Drinking Water Distribution System. PLoS ONE 2017, 12, 0169140. [Google Scholar] [CrossRef]
- Mullis, S.N.; Falkinham, J.O., III. Adherence and biofilm formation of Mycobacterium avium, Mycobacterium intracellulare and Mycobacterium abscessus to household plumbing materials. J. Appl. Microbiol. 2013, 115, 908–914. [Google Scholar] [CrossRef]
- Lehtola, M.J.; Miettinen, I.T.; Lampola, T.; Hirvonen, A.; Vartiainen, T.; Martikainen, P.J. Pipeline materials modify the effectiveness of disinfectants in drinking water distribution systems. Water Res. 2005, 39, 1962–1971. [Google Scholar] [CrossRef]
- Zhang, Y.; Zhang, Y.; Liu, L.; Zhou, L.; Zhao, Z. Impacts of antibiotics on biofilm bacterial community and disinfection performance on simulated drinking water supply pipe wall. Environ. Pollut. 2021, 288, 117736. [Google Scholar] [CrossRef]
- Zhang, J.; Li, W.; Chen, J.; Qi, W.; Wang, F.; Zhou, Y. Impact of biofilm formation and detachment on the transmission of bacterial antibiotic resistance in drinking water distribution systems. Chemosphere 2018, 203, 368–380. [Google Scholar] [CrossRef]
- Tong, H.; Jiang, Q.; Hu, X.; Zhong, X. Occurrence and identification of microplastics in tap water from China. Chemosphere 2020, 252, 126493. [Google Scholar] [CrossRef]
- Kirstein, I.V.; Gomiero, A.; Jes Vollertsen, J. Microplastic pollution in drinking water. Curr. Opin. Toxicol. 2021, 28, 70–75. [Google Scholar] [CrossRef]
- Oßmann, B.E. Microplastics in drinking water? Present state of knowledge and open questions. Curr. Opin. Food Sci. 2021, 41, 44–51. [Google Scholar] [CrossRef]
- Shen, M.; Song, B.; Zhu, Y.; Zeng, G.; Zhang, Y.; Yang, Y.; Wen, X.; Chen, M.; Yi, H. Removal of microplastics via drinking water treatment: Current knowledge and future directions. Chemosphere 2020, 251, 126612. [Google Scholar] [CrossRef]
- Radityaningrum, A.D.; Trihadiningrum, Y.; Mar’atusholihah; Soedjono, E.S.; Herumurti, W. Microplastic contamination in water supply and the removal efficiencies of the treatment plants: A case of Surabaya City, Indonesia. J. Water Process. Eng. 2021, 43, 102195. [Google Scholar] [CrossRef]
- Menon, V.; Sharma, S.; Gupta, S.; Ghosal, A.; Nadda, A.K.; Jose, R.; Sharma, P.; Kumar, S.; Singh, P.; Raizada, P. Prevalence and implications of microplastics in potable water system: An update. Chemosphere 2023, 317, 137848. [Google Scholar] [CrossRef]
- Muhib, Md.I.; Uddin, Md.K.; Rahman, Md.M.; Malafaia, G. Occurrence of microplastics in tap and bottled water, and food packaging: A narrative review on current knowledge. Sci. Total Environ. 2023, 865, 161274. [Google Scholar] [CrossRef]
- Taghipour, H.; Ghayebzadeh, M.; Ganji, F.; Mousavi, S.; Azizi, N. Tracking microplastics contamination in drinking water in Zahedan, Iran: From source to consumption taps. Sci. Total Environ. 2023, 872, 162121. [Google Scholar] [CrossRef] [PubMed]
- Tao, H.; Zhou, L.; Qi, Y.; Chen, Y.; Han, Z.; Lin, T. Variation of microplastics and biofilm community characteristics along the long-distance raw water pipeline. Process Saf. Environ. Prot. 2023, 169, 304–312. [Google Scholar] [CrossRef]
- Negrete Velasco, A.; Ramseier Gentile, S.; Zimmermann, S.; Le Coustumer, P.; Serge Stoll, S. Contamination and removal efficiency of microplastics and synthetic fibres in a conventional drinking water treatment plant in Geneva, Switzerland. Sci. Total Environ. 2023, 880, 163270. [Google Scholar] [CrossRef]
- Weber, F.; Kerpen, J.; Wolff, S.; René Langer, R.; Eschweiler, V. Investigation of microplastics contamination in drinking water of a German city. Sci. Total Environ. 2021, 755, 143421. [Google Scholar] [CrossRef]
- Adegoke, K.A.; Adu, F.A.; Oyebamiji, A.K.; Bamisaye, A.; Adigun, R.A.; Olasoji, S.O.; Ogunjinmi, O.E. Microplastics toxicity, detection, and removal from water/wastewater. Mar. Pollut. Bull. 2023, 187, 114546. [Google Scholar] [CrossRef] [PubMed]
- Cao, Y.; Zhao, M.; Ma, X.; Song, Y.; Zuo, S.; Li, H.; Deng, W. A critical review on the interactions of microplastics with heavy metals: Mechanism and their combined effect on organisms and humans. Sci. Total Environ. 2021, 788, 147620. [Google Scholar] [CrossRef] [PubMed]
- He, W.; Wang, X.; Zhang, Y.; Zhu, B.; Wu, H. Adsorption behavior of aged polystyrene microplastics (PSMPs) for manganese in water: Critical role of hydrated functional zone surrounding the microplastic surface. J. Environ. Chem. Eng. 2022, 10, 109040. [Google Scholar] [CrossRef]
- Miao, M.; Yu, B.; Cheng, X.; Hao, T.; Yuanyuan Dou, Y.; Zhang, M.; Li, Y. Effects of chlorination on microplastics pollution: Physicochemical transformation and chromium adsorption. Environ. Pollut. 2023, 323, 121254. [Google Scholar] [CrossRef] [PubMed]
- Nirmala, K.; Rangasamy, G.; Ramya, M.; Shankar, V.U.; Rajesh, G. A critical review on recent research progress on microplastic pollutants in drinking water. Environ. Res. 2023, 222, 115312. [Google Scholar] [CrossRef] [PubMed]
- Sun, Q.; Ren, S.Y.; Ni, H.G. Effects of microplastic sorption on microbial degradation of halogenated polycyclic aromatic hydrocarbons in water. Environ. Pollut. 2022, 313, 120238. [Google Scholar] [CrossRef]
- Bauerlein, P.S.; Hofman-Caris, R.C.H.M.; Pieke, E.N.; ter Laak, T.L. Fate of microplastics in the drinking water production. Water Res. 2022, 221, 118790. [Google Scholar] [CrossRef]
- Dalmau-Soler, J.; Ballesteros-Cano, R.; Ferrer, N.; Boleda, M.R.; Lacorte, S. Microplastics throughout a tap water supply network. Water Environ. J. 2022, 36, 292–298. [Google Scholar] [CrossRef]
- Chu, X.; Tian, Y.; Liu, J.; Jia, S.; Zhao, W.; Zhao, P. The effect of adsorption on the fate of colloidal polystyrene microplastics in drinking water distribution system pipe scales. J. Hazard. Mater. 2022, 439, 129680. [Google Scholar] [CrossRef]
- Chu, X.; Zheng, B.; Li, Z.; Cai, C.; Peng, Z.; Zhao, P.; Tian, Y. Occurrence and distribution of microplastics in water supply systems: In water and pipe scales. Sci. Total Environ. 2022, 803, 150004. [Google Scholar] [CrossRef]
- Chen, X.; Lian, X.Y.; Wang, Y.; Chen, S.; Sun, Y.R.; Tao, G.L.; Tan, Q.W.; Feng, J.C. Impacts of hydraulic conditions on microplastics biofilm development, shear stresses distribution, and microbial community structures in drinking water distribution pipes. J. Environ. Manage. 2023, 325, 116510. [Google Scholar] [CrossRef]
- Wang, H.; Hu, C.; Hu, X.; Yang, M.; Qu, J. Effects of disinfectant and biofilm on the corrosion of cast iron pipes in a reclaimed water distribution system. Water Res. 2012, 46, 1070–1078. [Google Scholar] [CrossRef] [PubMed]
- Mian, H.R.; Hu, G.; Hewage, K.; Rodriguez, M.J.; Sadiq, R. Prioritization of unregulated disinfection by-products in drinking water distribution systems for human health risk mitigation: A critical review. Water Res. 2018, 147, 112–131. [Google Scholar] [CrossRef] [PubMed]
- Abhijith, G.R.; Ostfeld, A. Examining the Longitudinal Dispersion of Solutes Inside Water Distribution Systems. J. Water. Resour. Plan. Manag. 2022, 148, 04022022. [Google Scholar] [CrossRef]
- Bielski, A.; Zielina, M.; Mlynska, A. Analysis of heavy metals leaching from internal pipe cement coating into potable water. J. Clean. Prod. 2020, 265, 121425. [Google Scholar] [CrossRef]
- Zielina, M.; Bielski, A.; Mlynska, A. Leaching of chromium and lead from the cement mortar lining into the flowing drinking water shortly after pipeline rehabilitation. J. Clean. Prod. 2022, 362, 132512. [Google Scholar] [CrossRef]
- Punurai, W.; Davis, P. Prediction of Asbestos Cement Water Pipe Aging and Pipe Prioritization using Monte Carlo Simulation. Eng. J. 2017, 21, 1–13. [Google Scholar] [CrossRef]
Figure 1.
Lead pipe replaced after about 50 years in service (courtesy of Ecoaqua S.A. Călăraşi, Romania).
Figure 1.
Lead pipe replaced after about 50 years in service (courtesy of Ecoaqua S.A. Călăraşi, Romania).
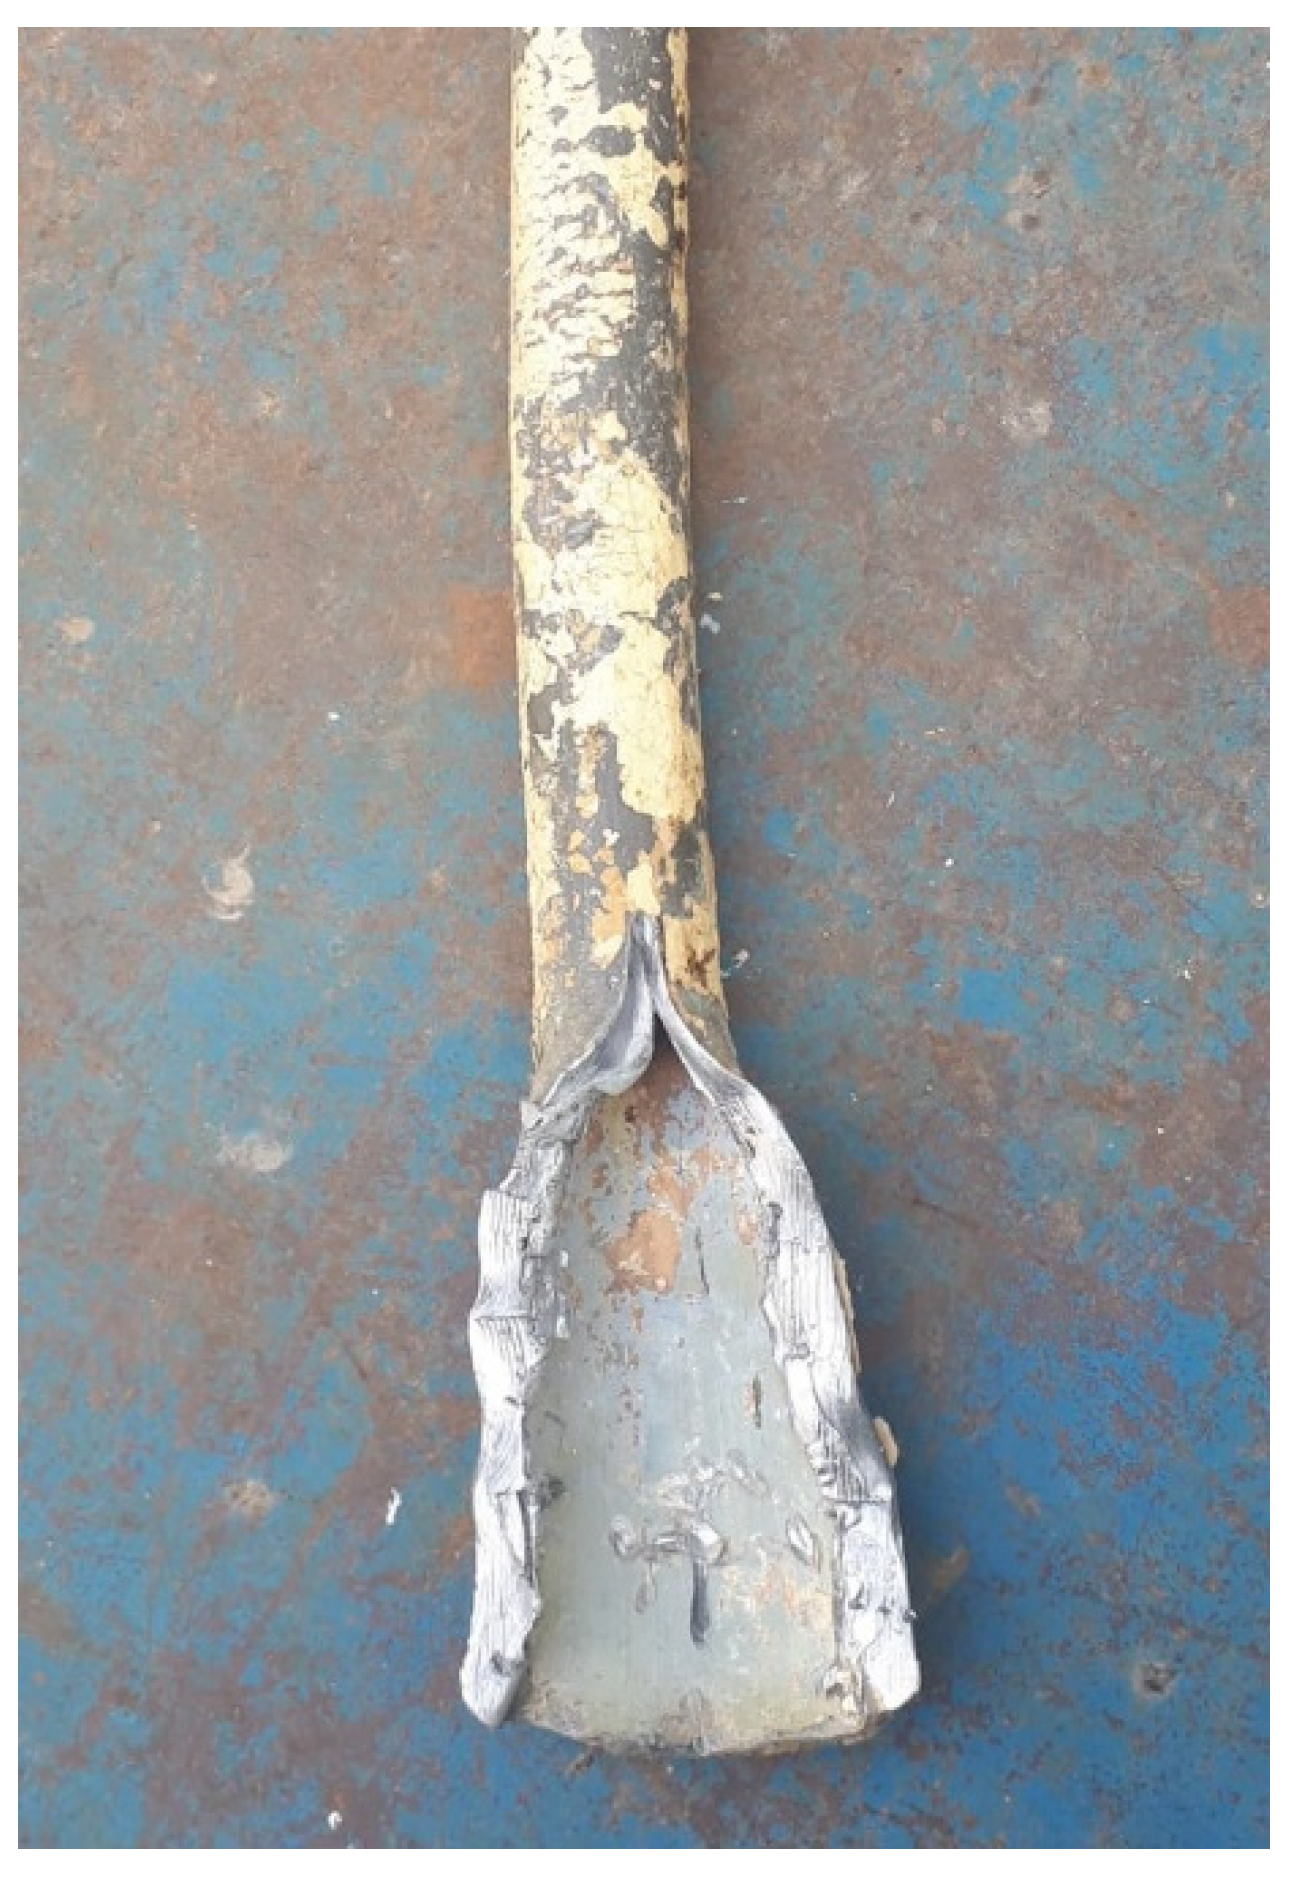
Figure 2.
AC pipe replaced after about 50 years in service (courtesy of Ecoaqua S.A. Călăraşi, Romania).
Figure 2.
AC pipe replaced after about 50 years in service (courtesy of Ecoaqua S.A. Călăraşi, Romania).
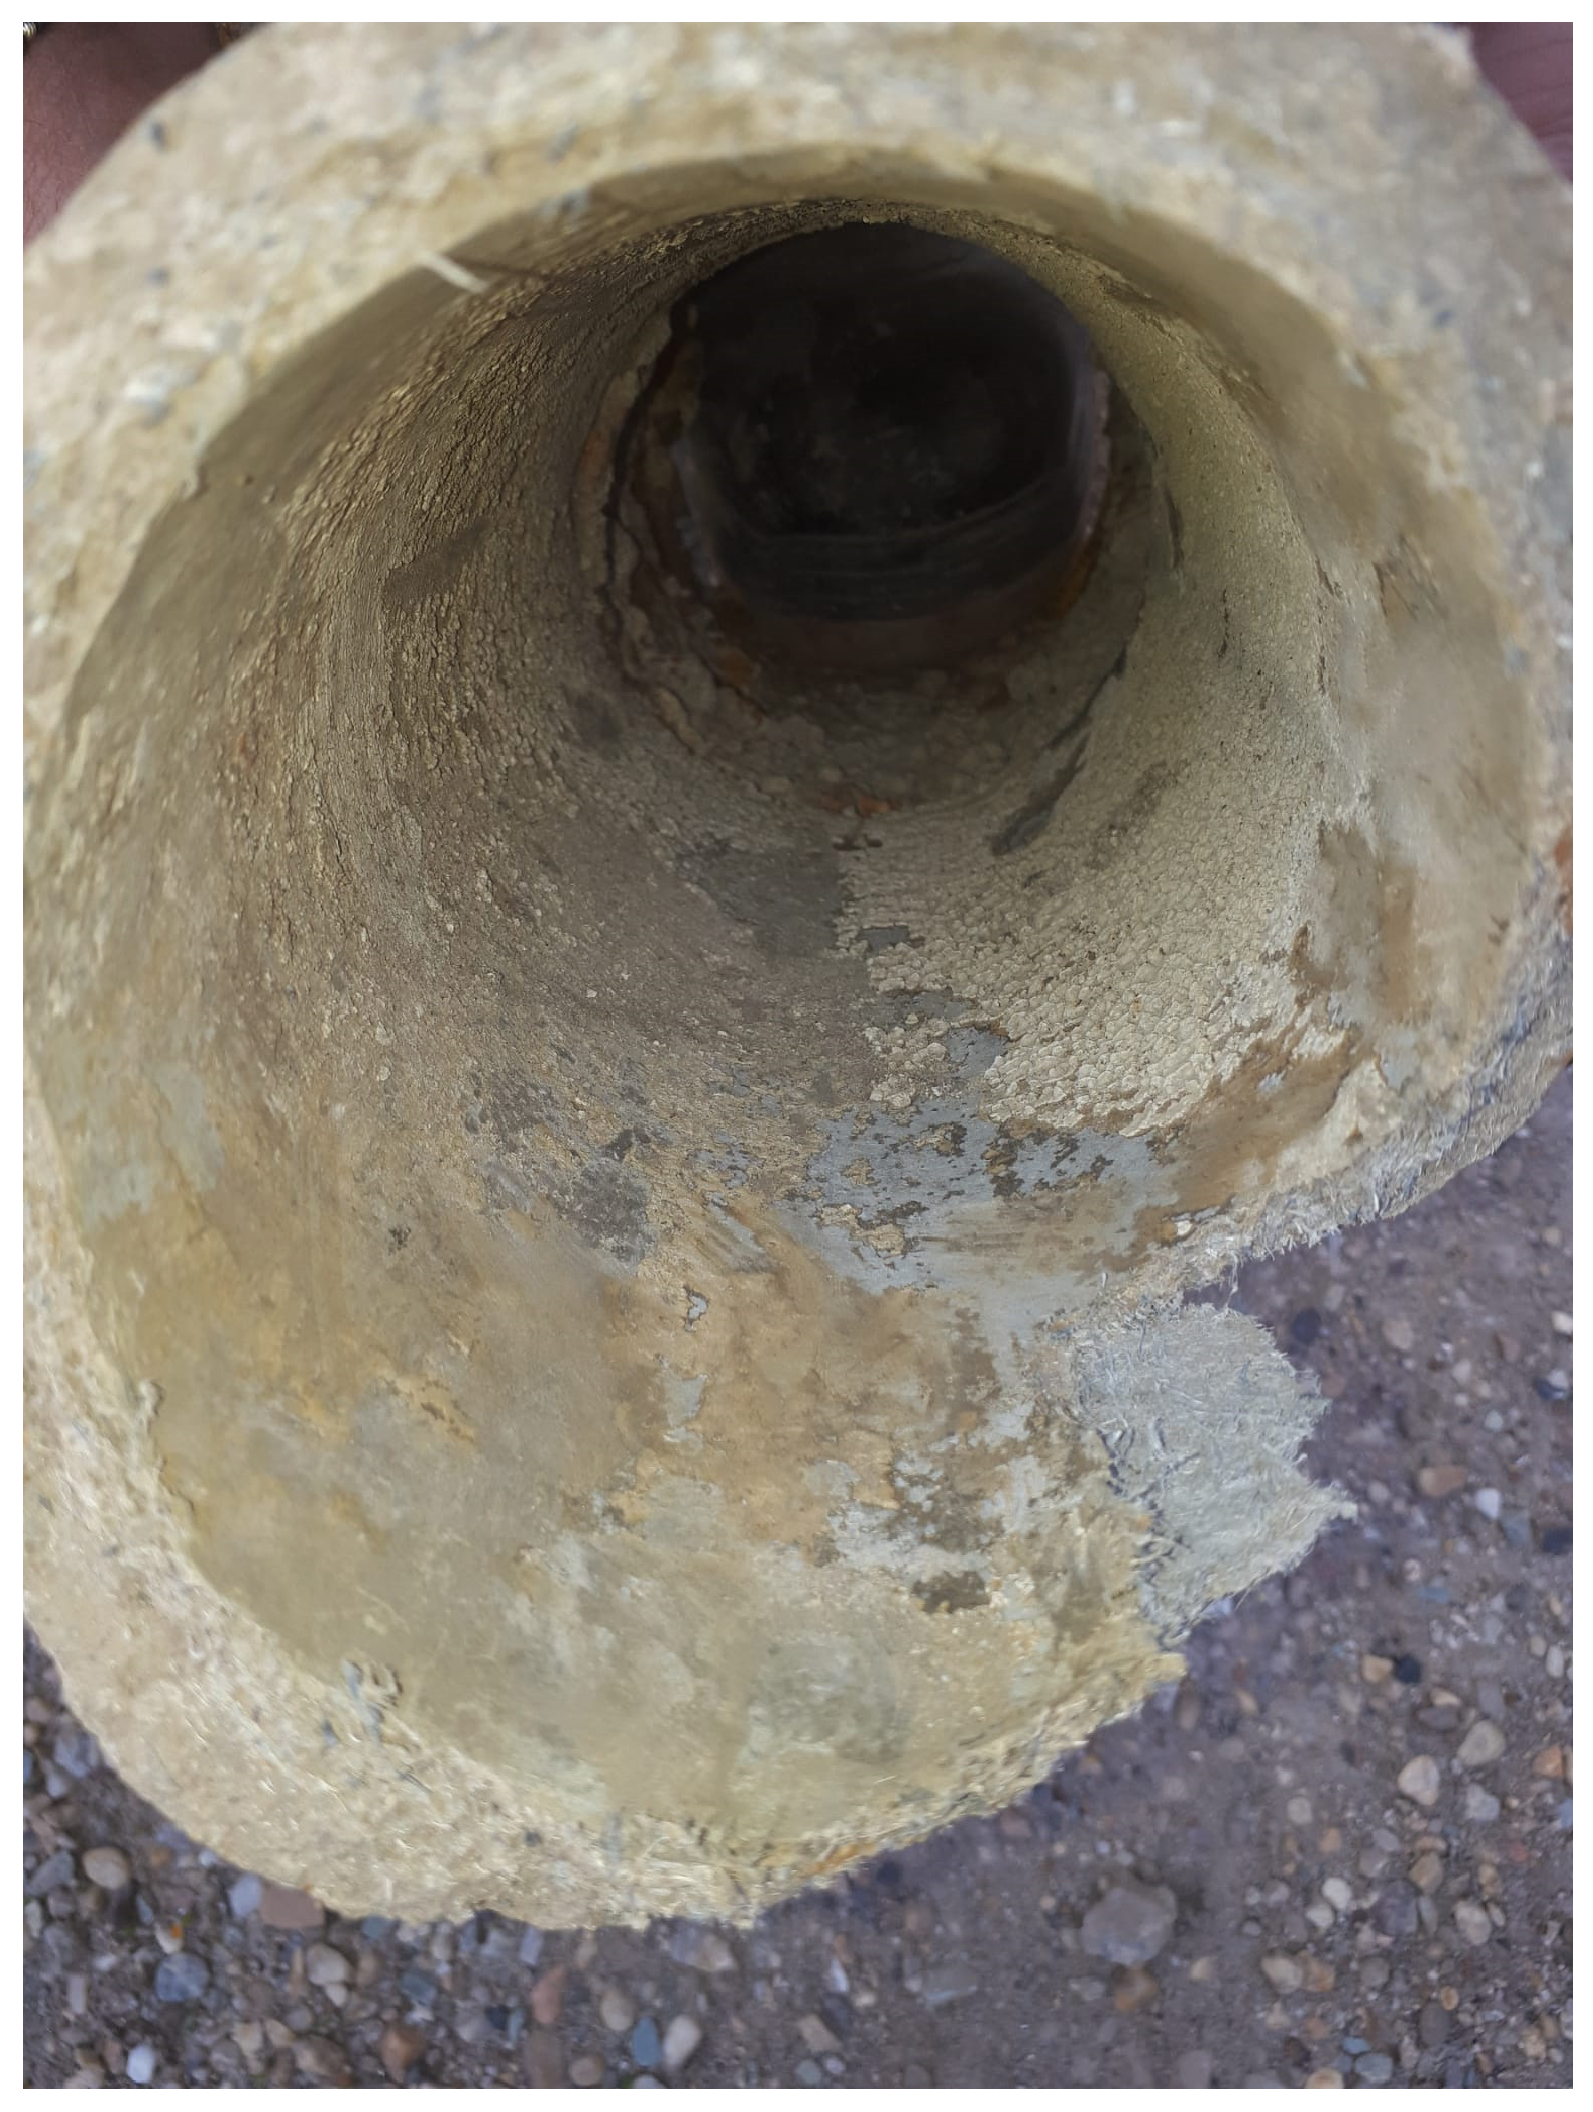
Figure 3.
(a) Schematic representation of corrosion reactions; (b) new iron pipe and old iron pipes (courtesy of Ecoaqua S.A. Călăraşi, Romania).
Figure 3.
(a) Schematic representation of corrosion reactions; (b) new iron pipe and old iron pipes (courtesy of Ecoaqua S.A. Călăraşi, Romania).
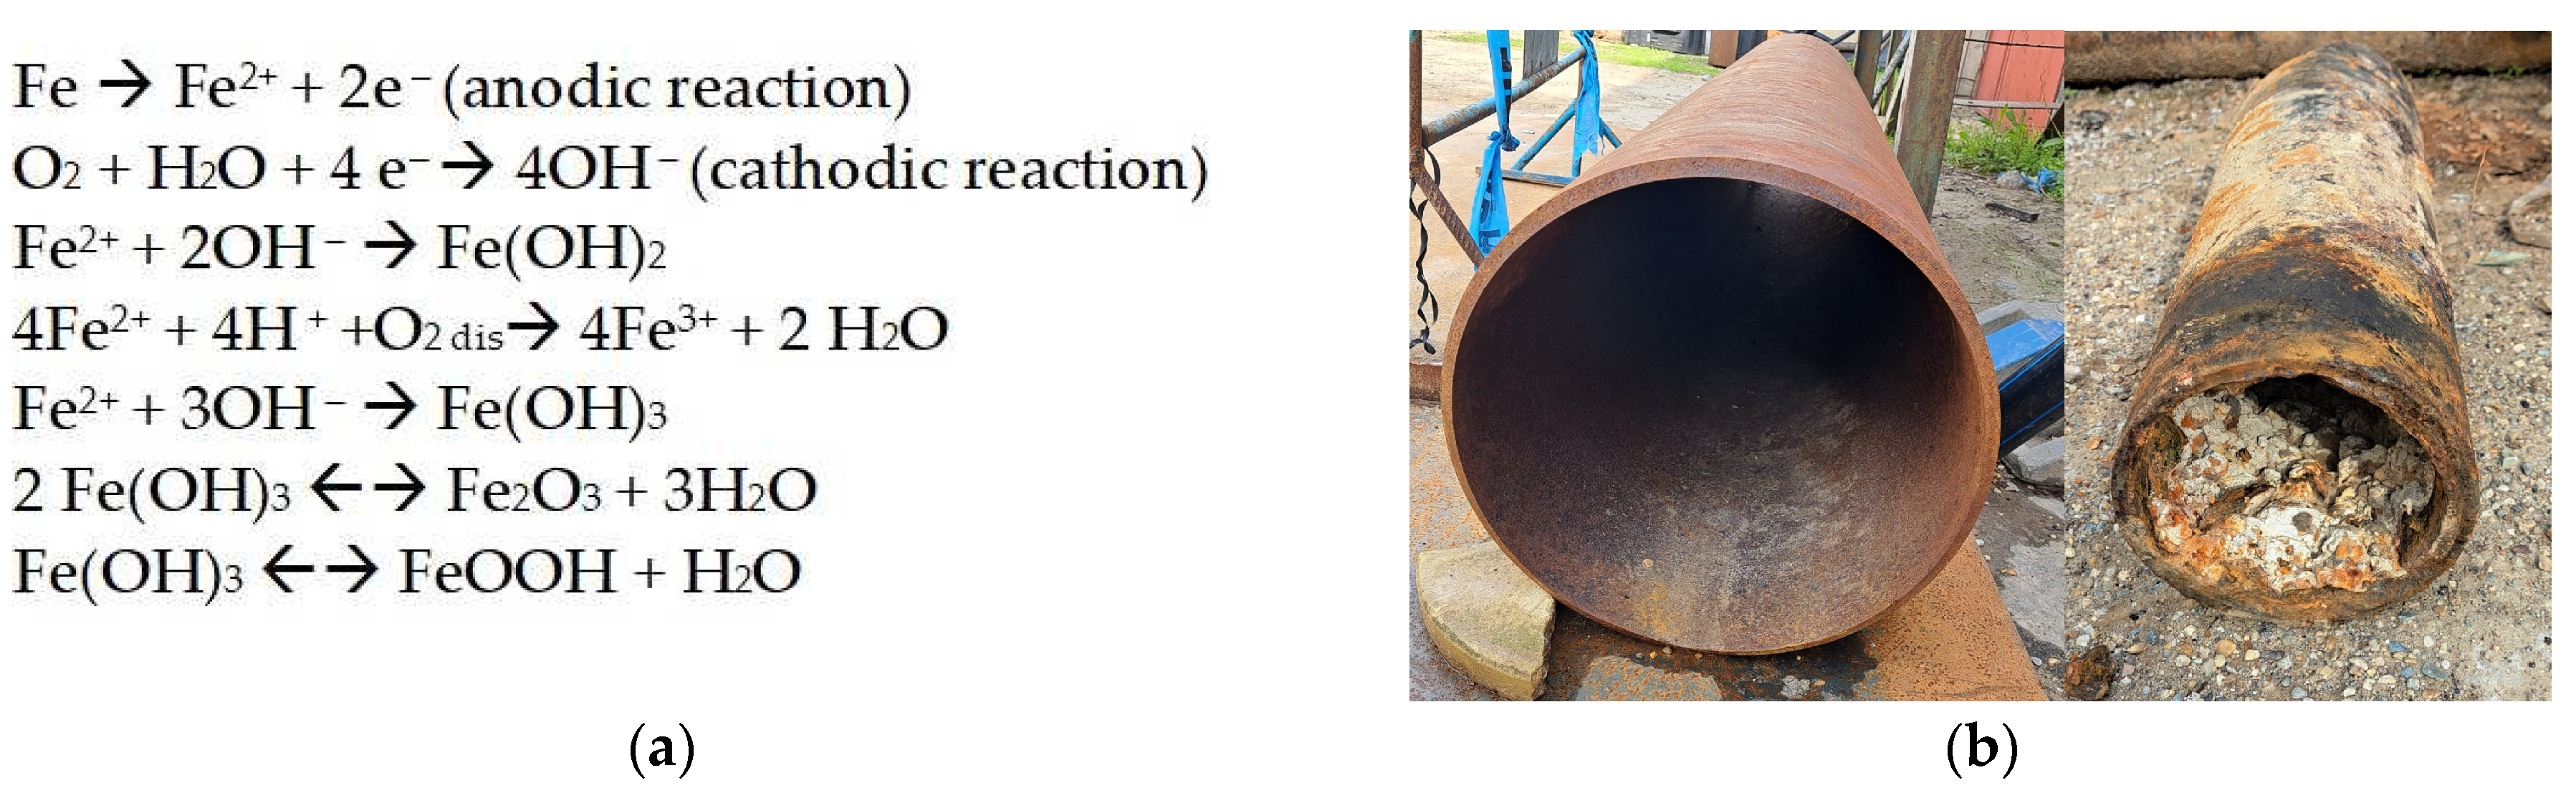
Figure 4.
Types of iron corrosion scale (a) schematical representation [118]; (b) appearance of corrosion scale on cast iron pipe (courtesy of Ecoaqua S.A. Călăraşi, Romania).
Figure 4.
Types of iron corrosion scale (a) schematical representation [118]; (b) appearance of corrosion scale on cast iron pipe (courtesy of Ecoaqua S.A. Călăraşi, Romania).
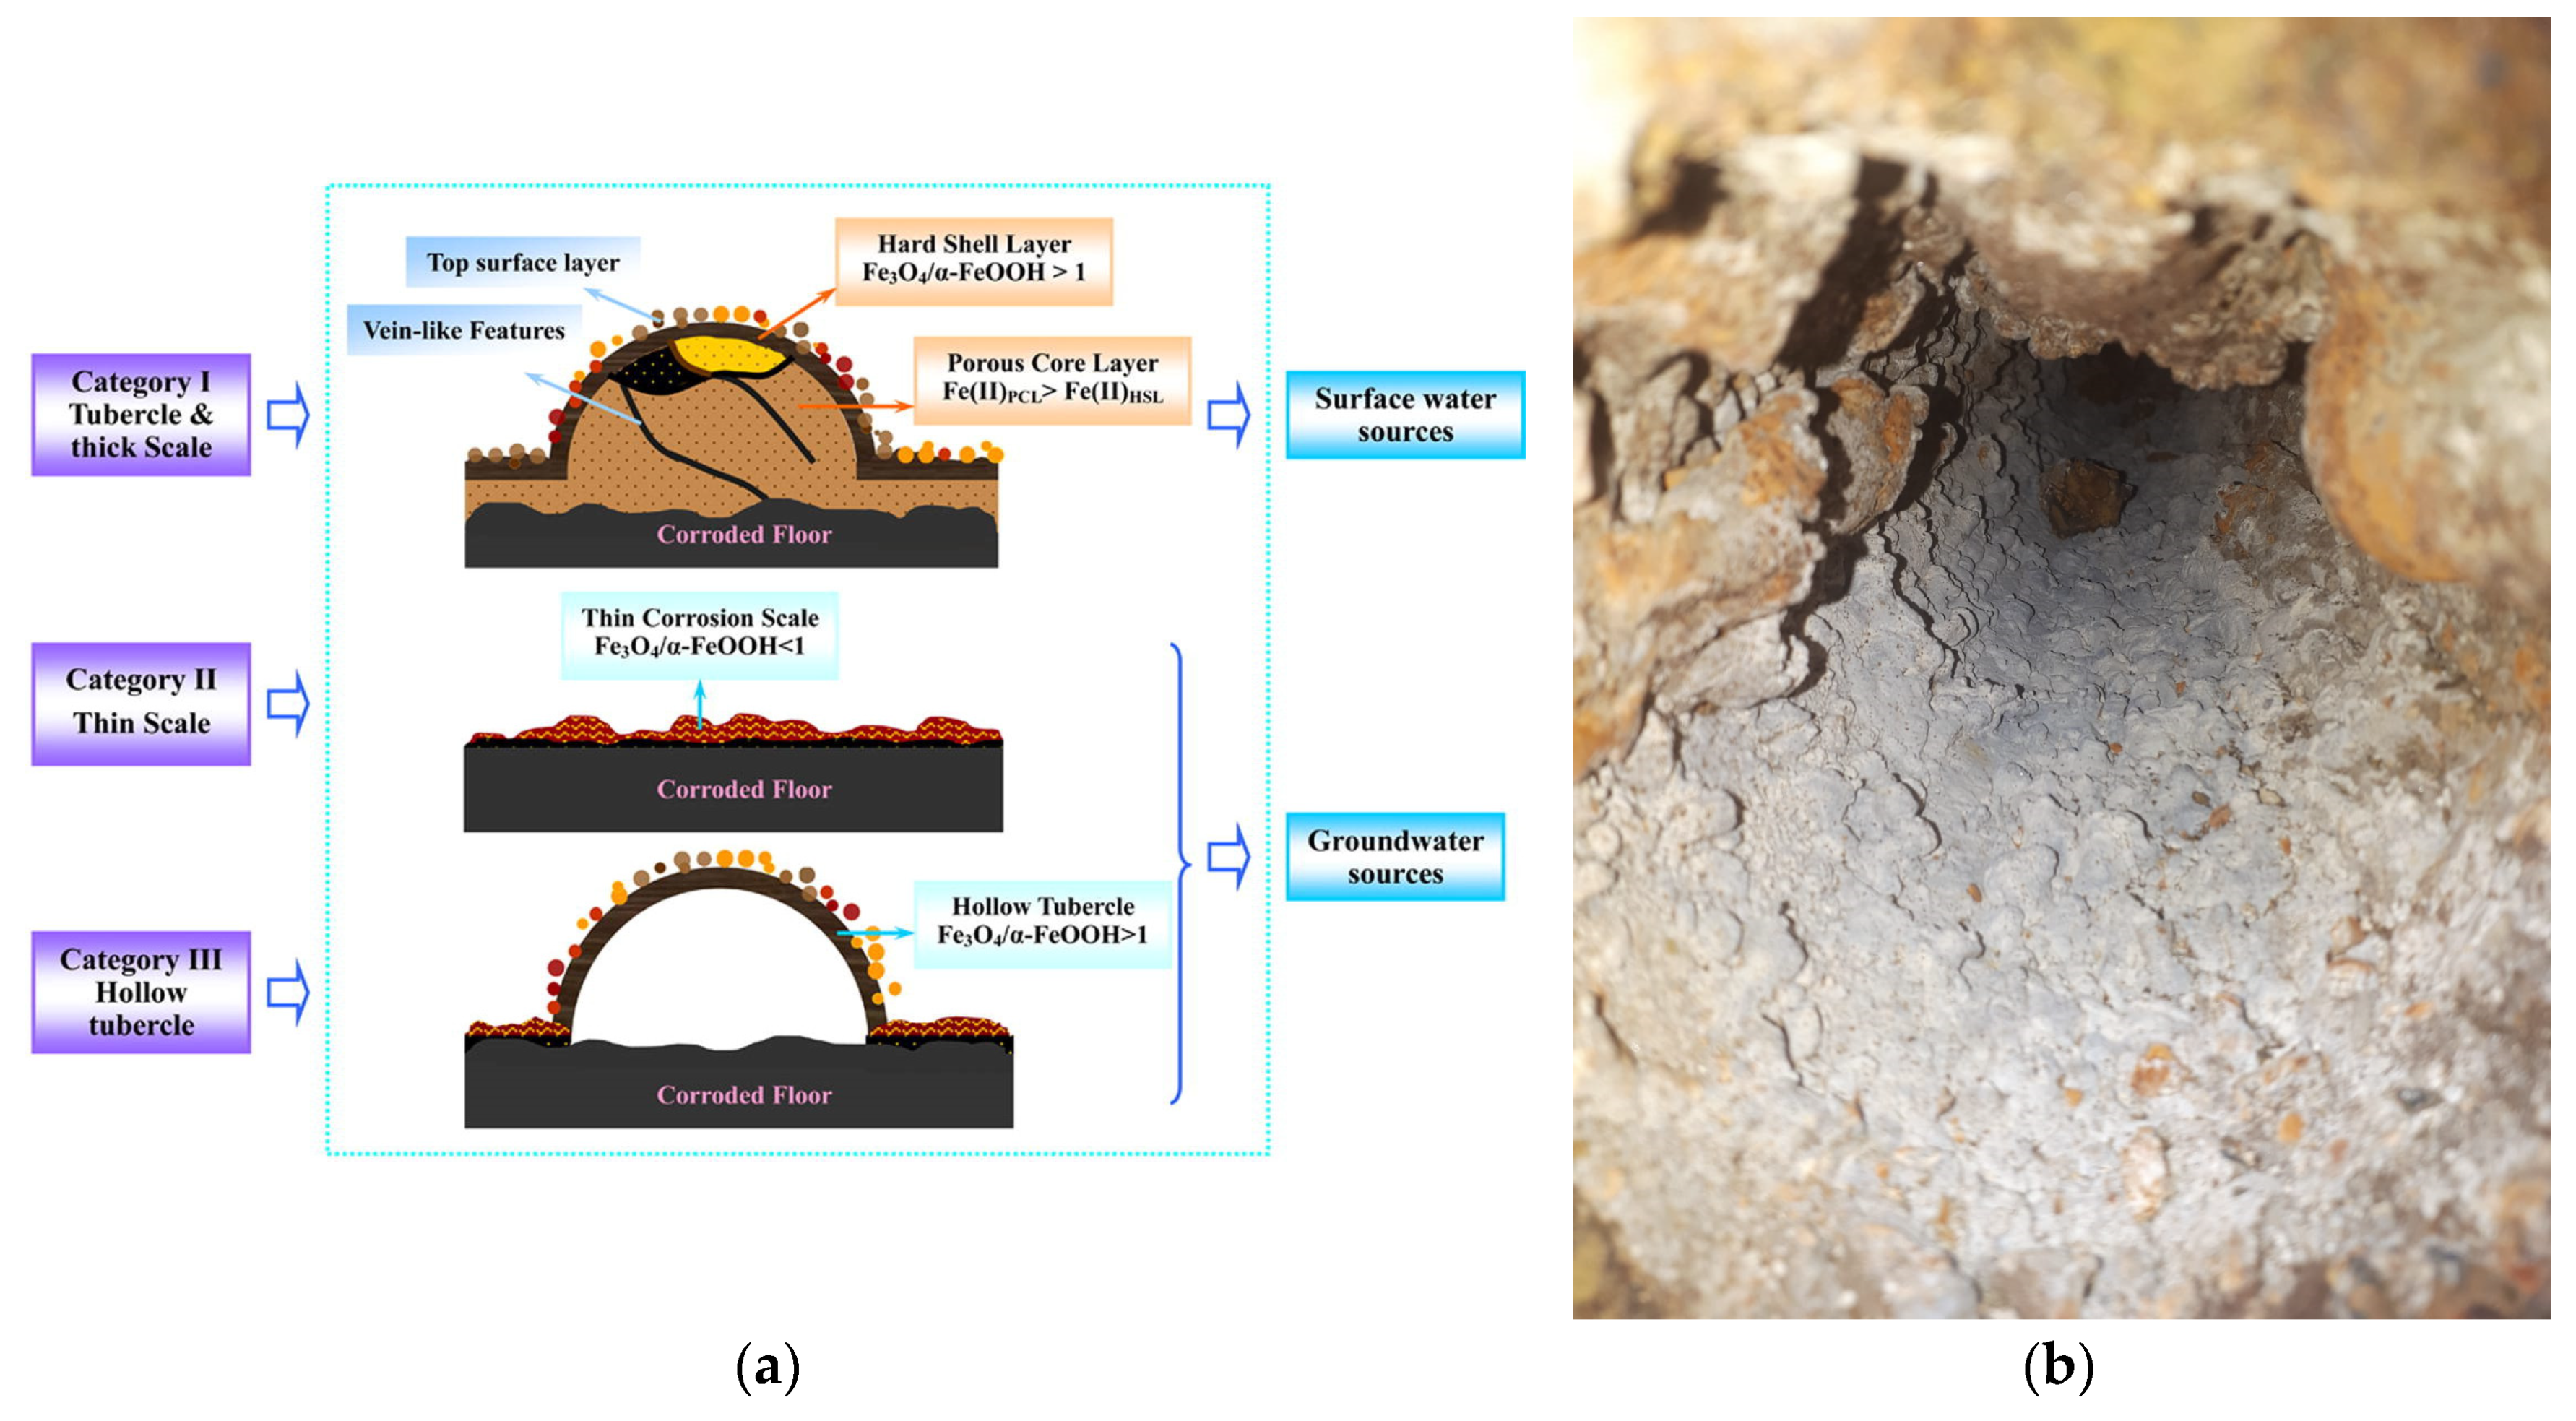
Figure 5.
Stages of corrosion scale formation: (a) initial stage; (b) intermediate stage (note: An− represent ions); (c) stable stage; (d) image of actual iron pipe corrosion scale from DWDSs in Hangzhou city of China [119].
Figure 5.
Stages of corrosion scale formation: (a) initial stage; (b) intermediate stage (note: An− represent ions); (c) stable stage; (d) image of actual iron pipe corrosion scale from DWDSs in Hangzhou city of China [119].
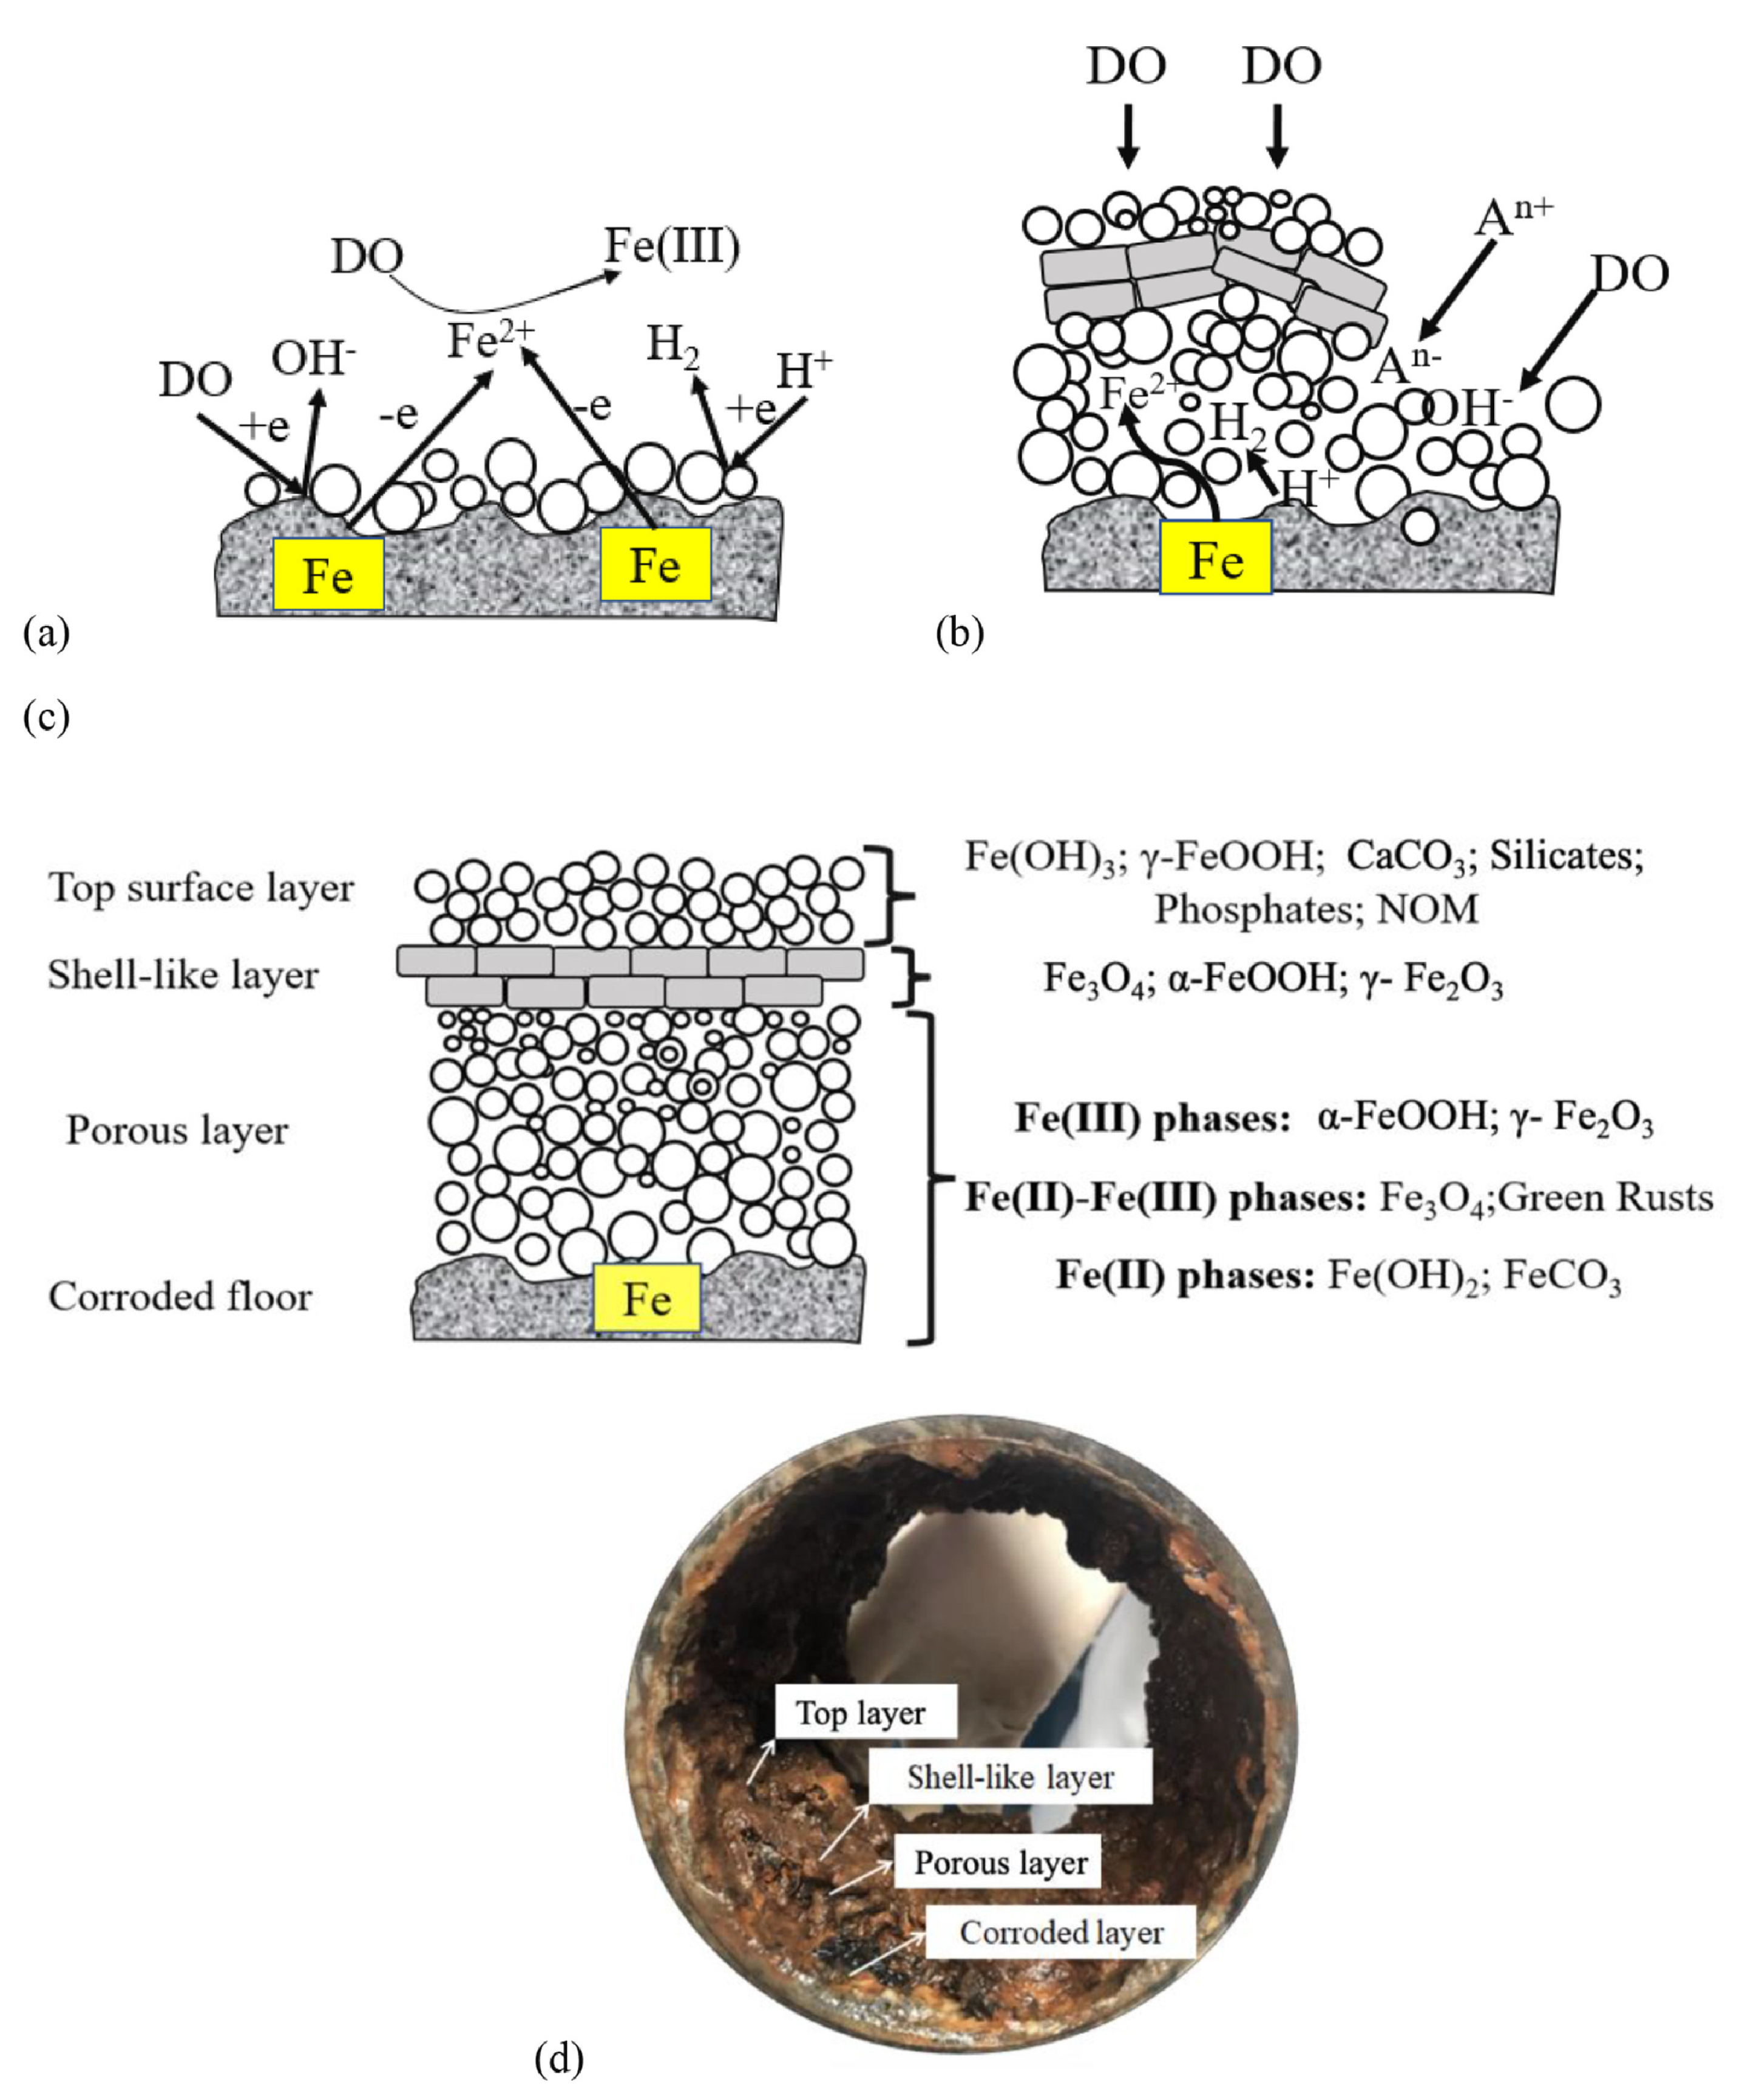
Figure 6.
Steel corrosion: (a) schematic representation of formation mechanism of the stainless-steel corrosion scale [80]; (b) appearance of corrosion scale on steel pipe (courtesy of Ecoaqua S.A. Călăraşi, Romania).
Figure 6.
Steel corrosion: (a) schematic representation of formation mechanism of the stainless-steel corrosion scale [80]; (b) appearance of corrosion scale on steel pipe (courtesy of Ecoaqua S.A. Călăraşi, Romania).
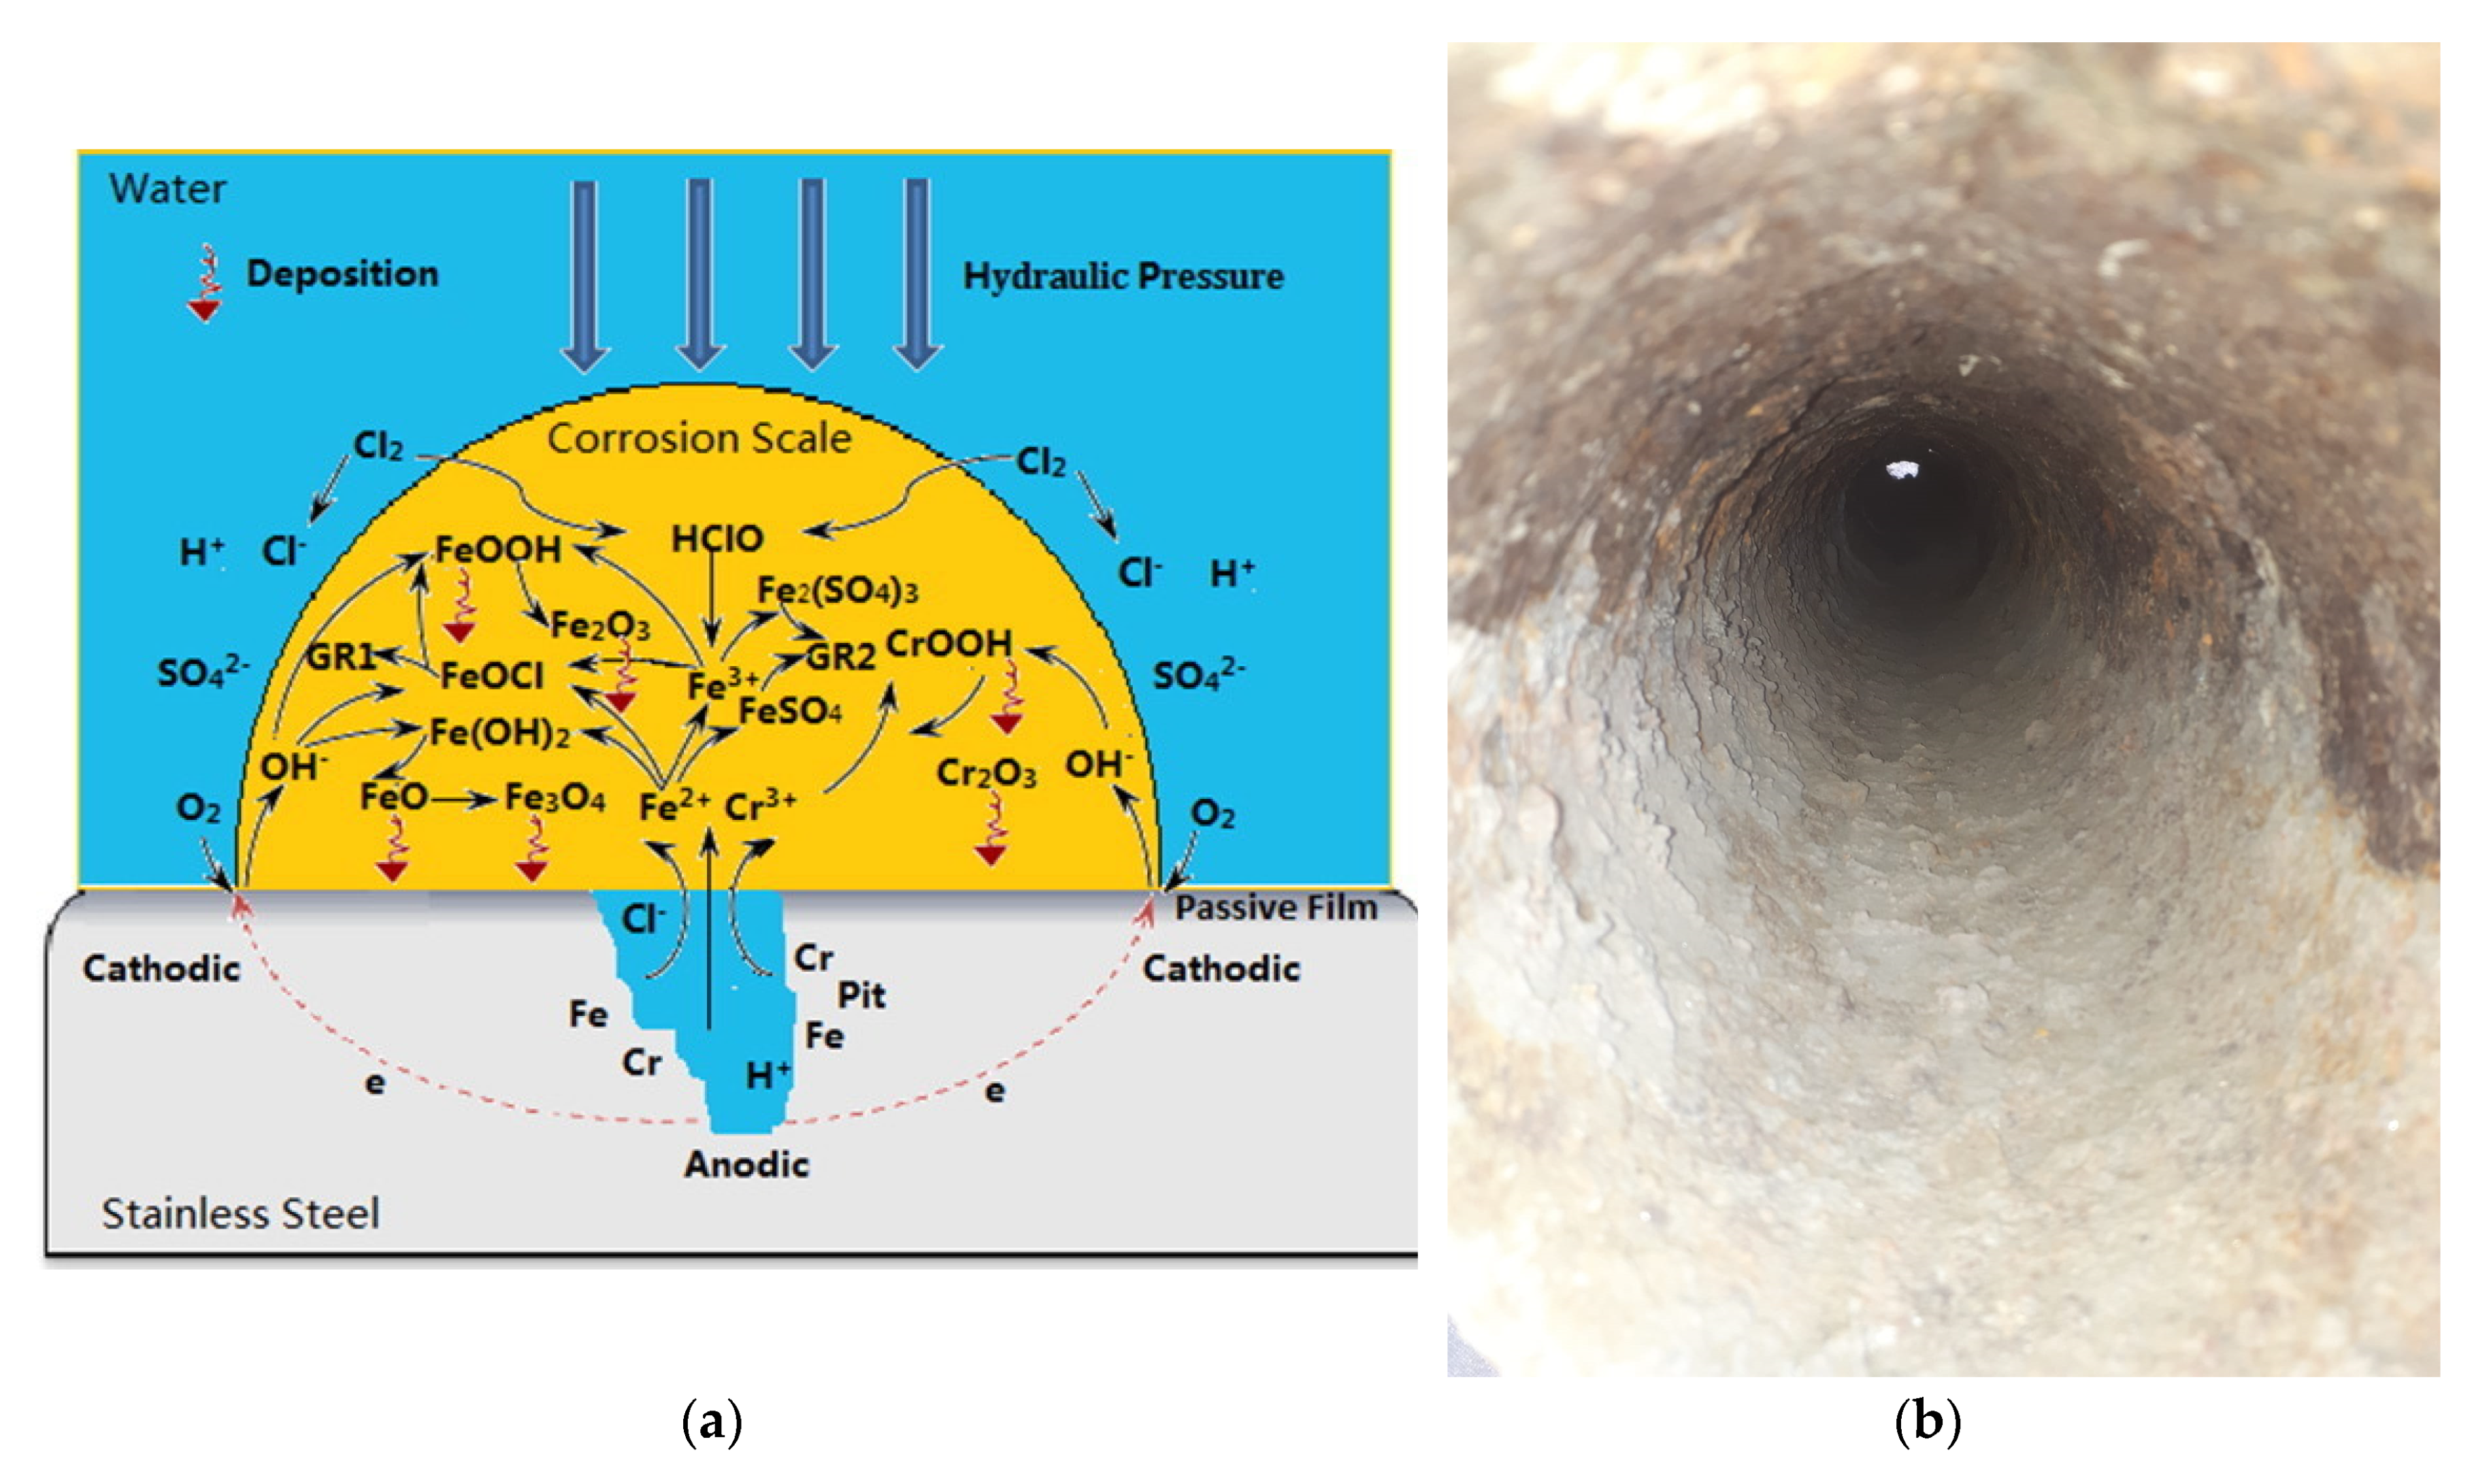
Figure 7.
Cross-sectional view of corrosion pits on (a) uncoated, (b) PE-pure enamel coating, (c) ME-mixed enamel coating, (d) DE-double enamel coating, and (e) FBE-fusion bonded epoxy coated steel bars after 244 days of test [132].
Figure 7.
Cross-sectional view of corrosion pits on (a) uncoated, (b) PE-pure enamel coating, (c) ME-mixed enamel coating, (d) DE-double enamel coating, and (e) FBE-fusion bonded epoxy coated steel bars after 244 days of test [132].
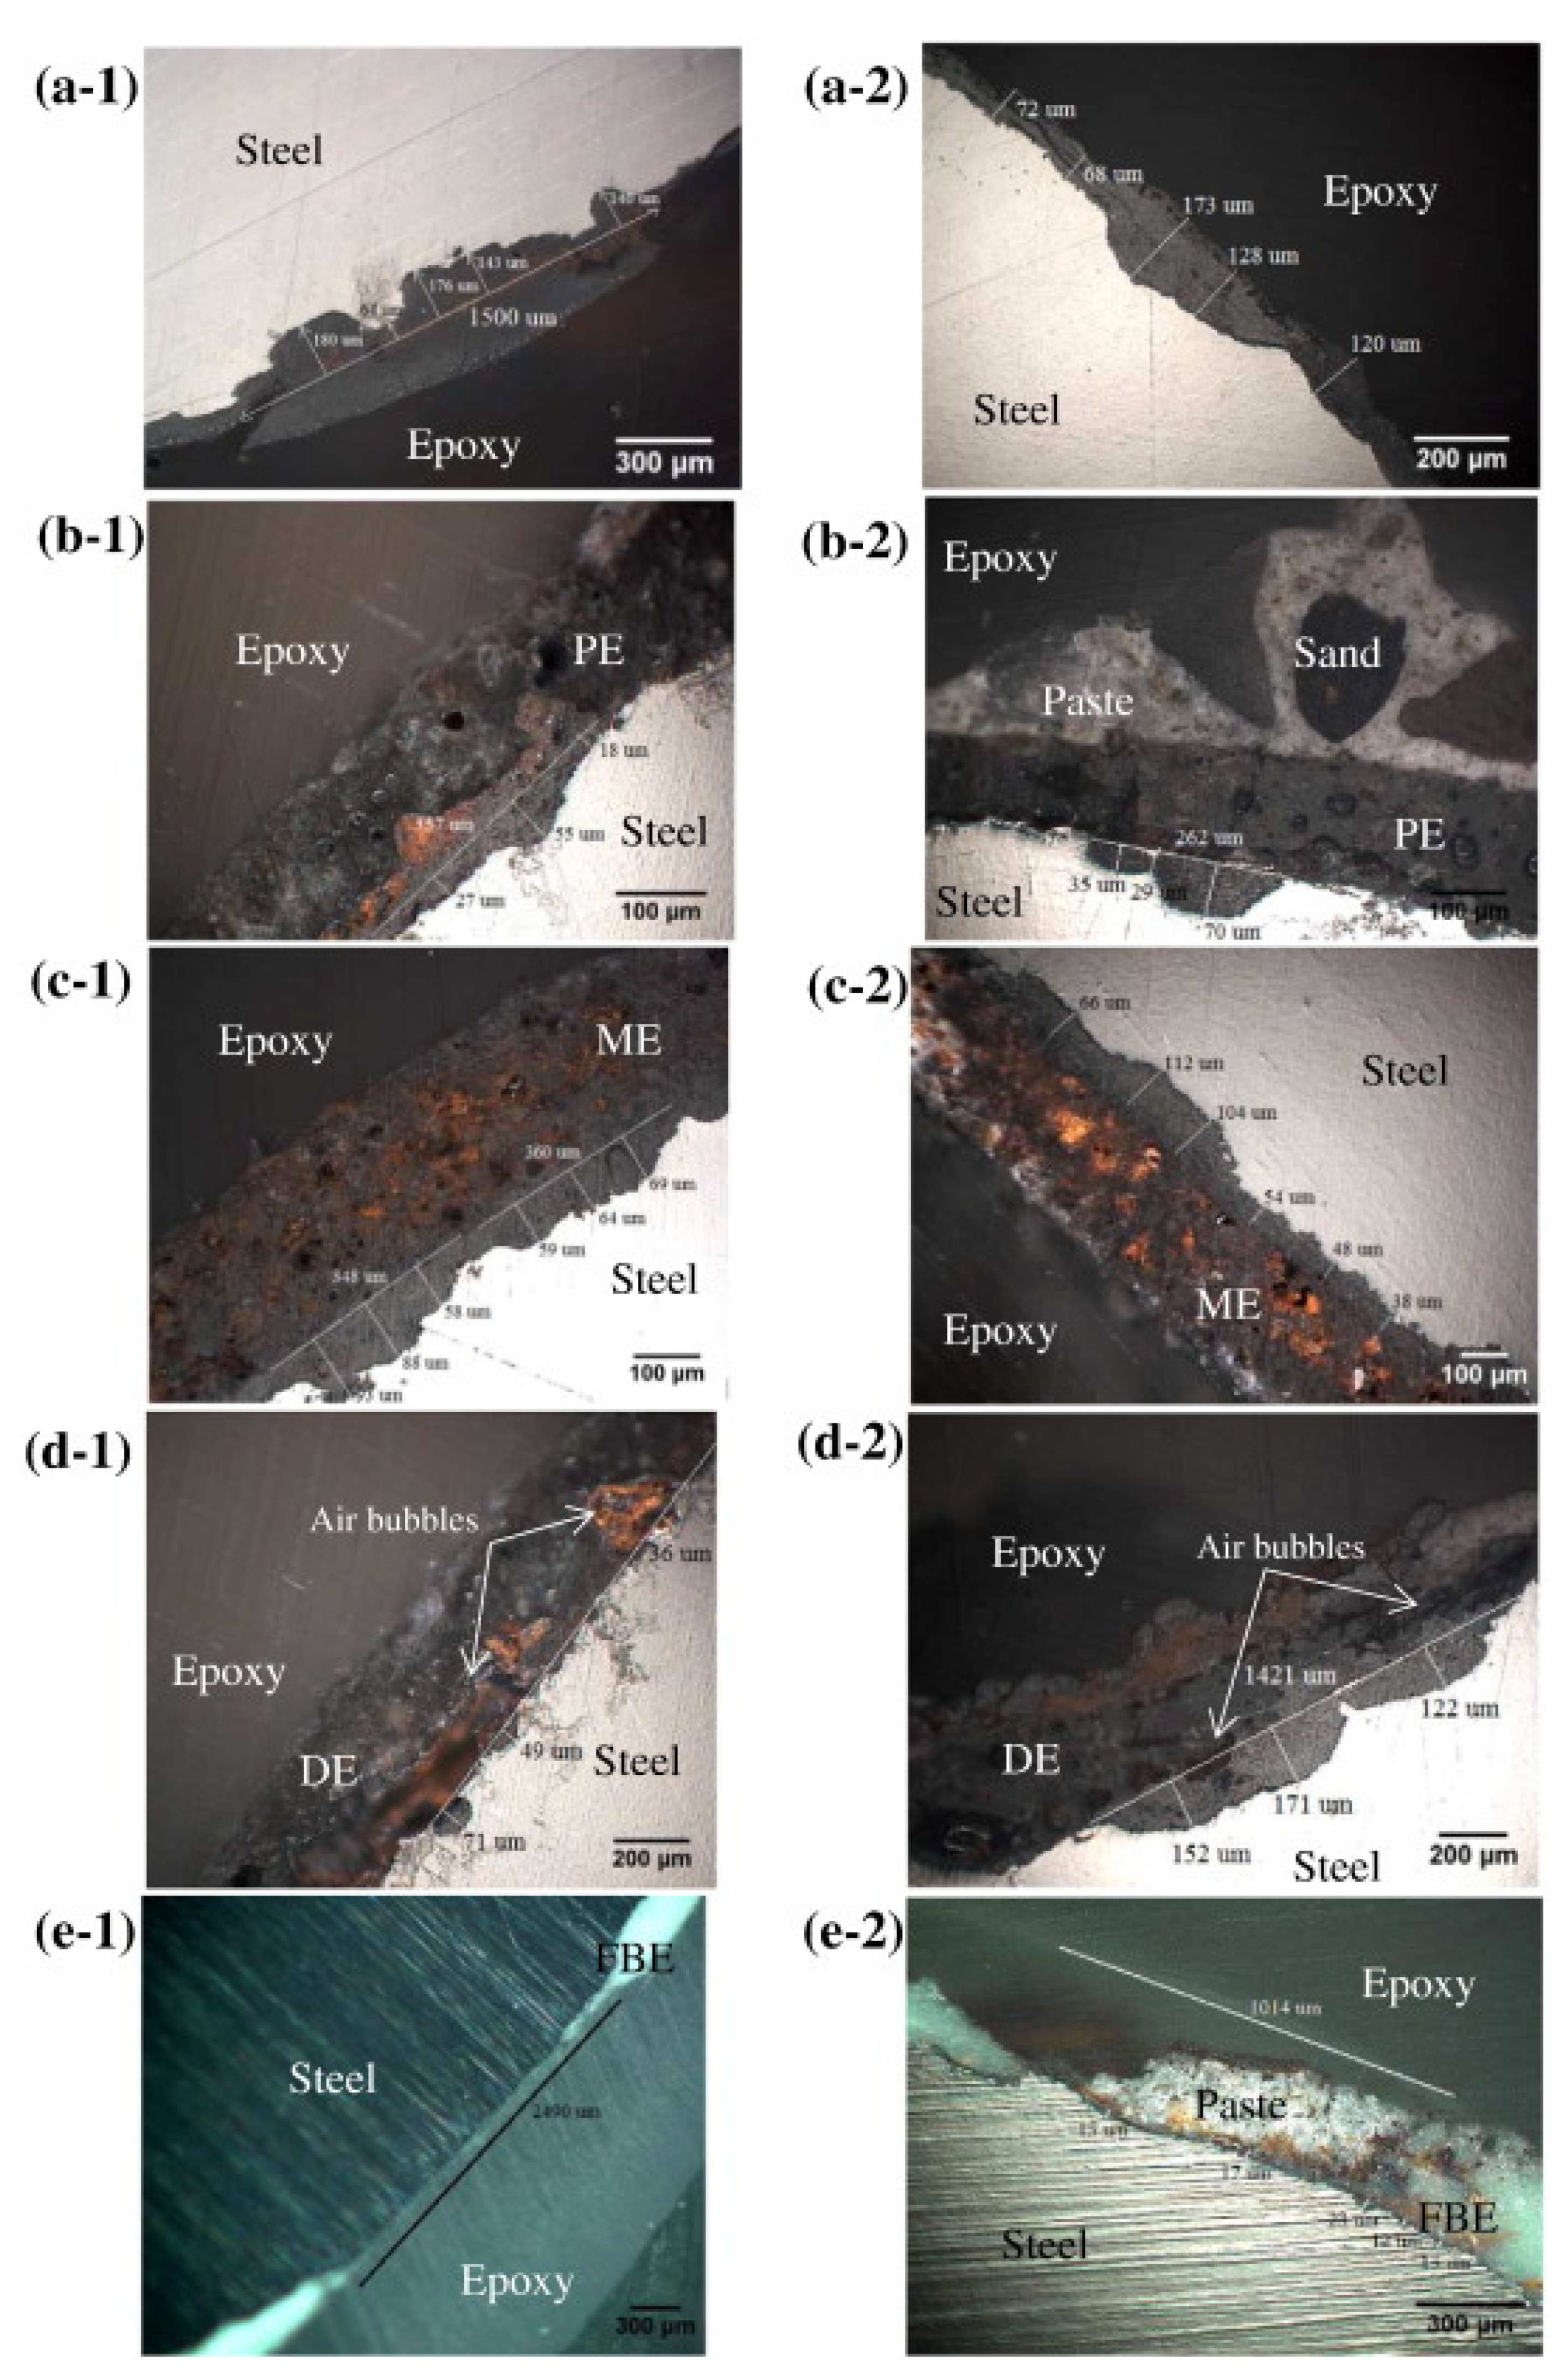
Figure 8.
A: (a) inside wall of AC pipe is coated with a layer of patina 3–4 mm depth; (b) patina is thick fibrous films that are composed of high fibrous asbestos and some biomass forming gelatinous like materials; (c) patina tends to have yellow to brown colorations implying the presence of some iron. B: AC segments after 10 days cultivation under different conditions. (a) IRB in anaerobic conditions; (b) APB in anaerobic conditions; (c) SLYM in anaerobic conditions, c1: layer of discoloration immediately behind the patina 4–6 mm, c2: discolored patches within the concrete; (d) SLYM in aerobic conditions, d1: patina, d2: main body, d3: outer layer; (e) HAB in anaerobic conditions, Methylene Blue was found on patina and the layer immediately behind patina; arrow indicates a weathering spot on the segment; (f) SRB in aerobic conditions (IRB – iron reducing bacteria; APB - acid-producing bacteria; SLYM – slime forming bacteria; HAB - heterotrophic aerobic bacteria; SRB - sulfate reducing bacteria) [178].
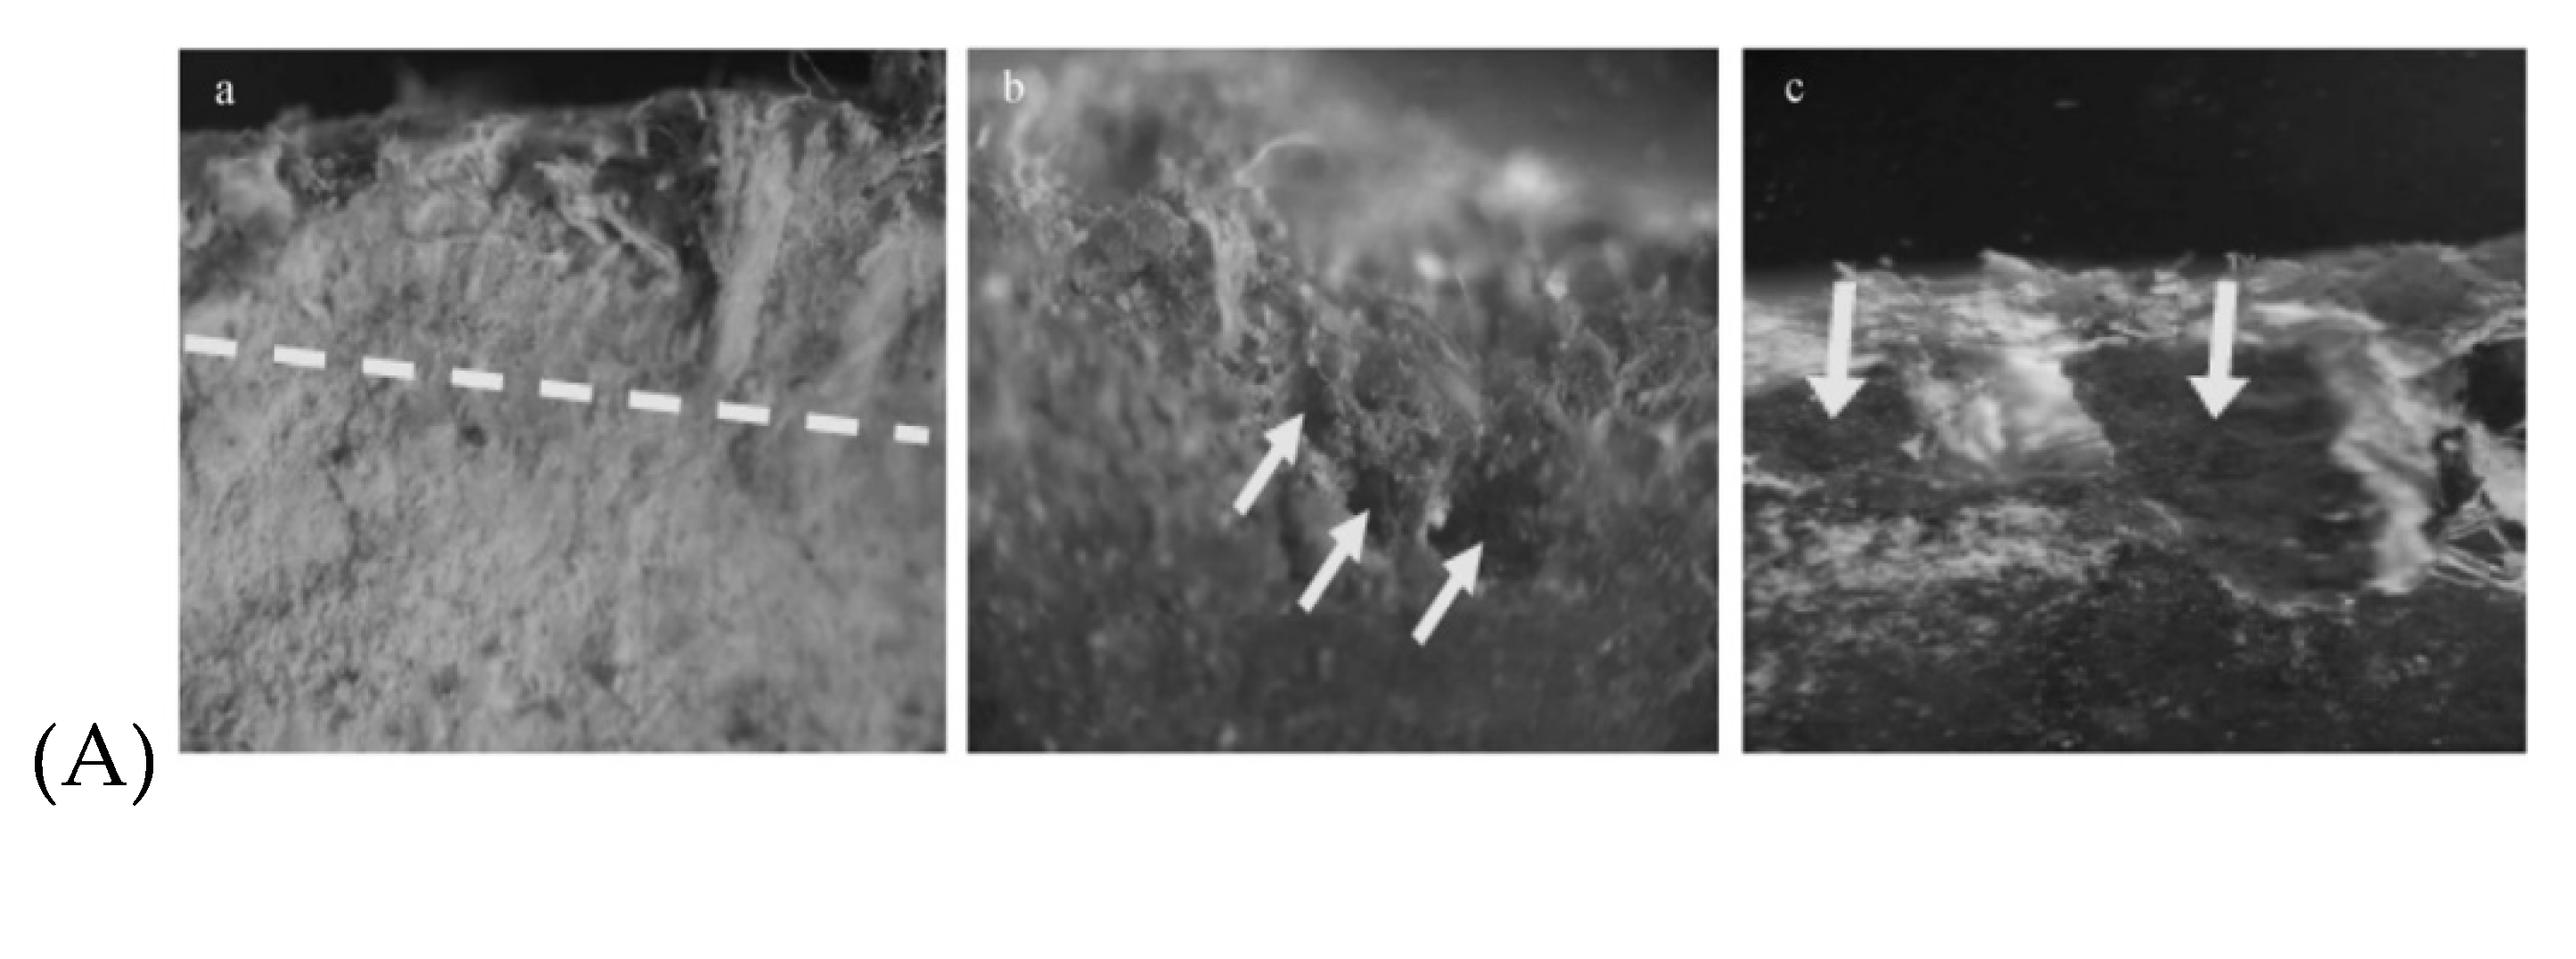
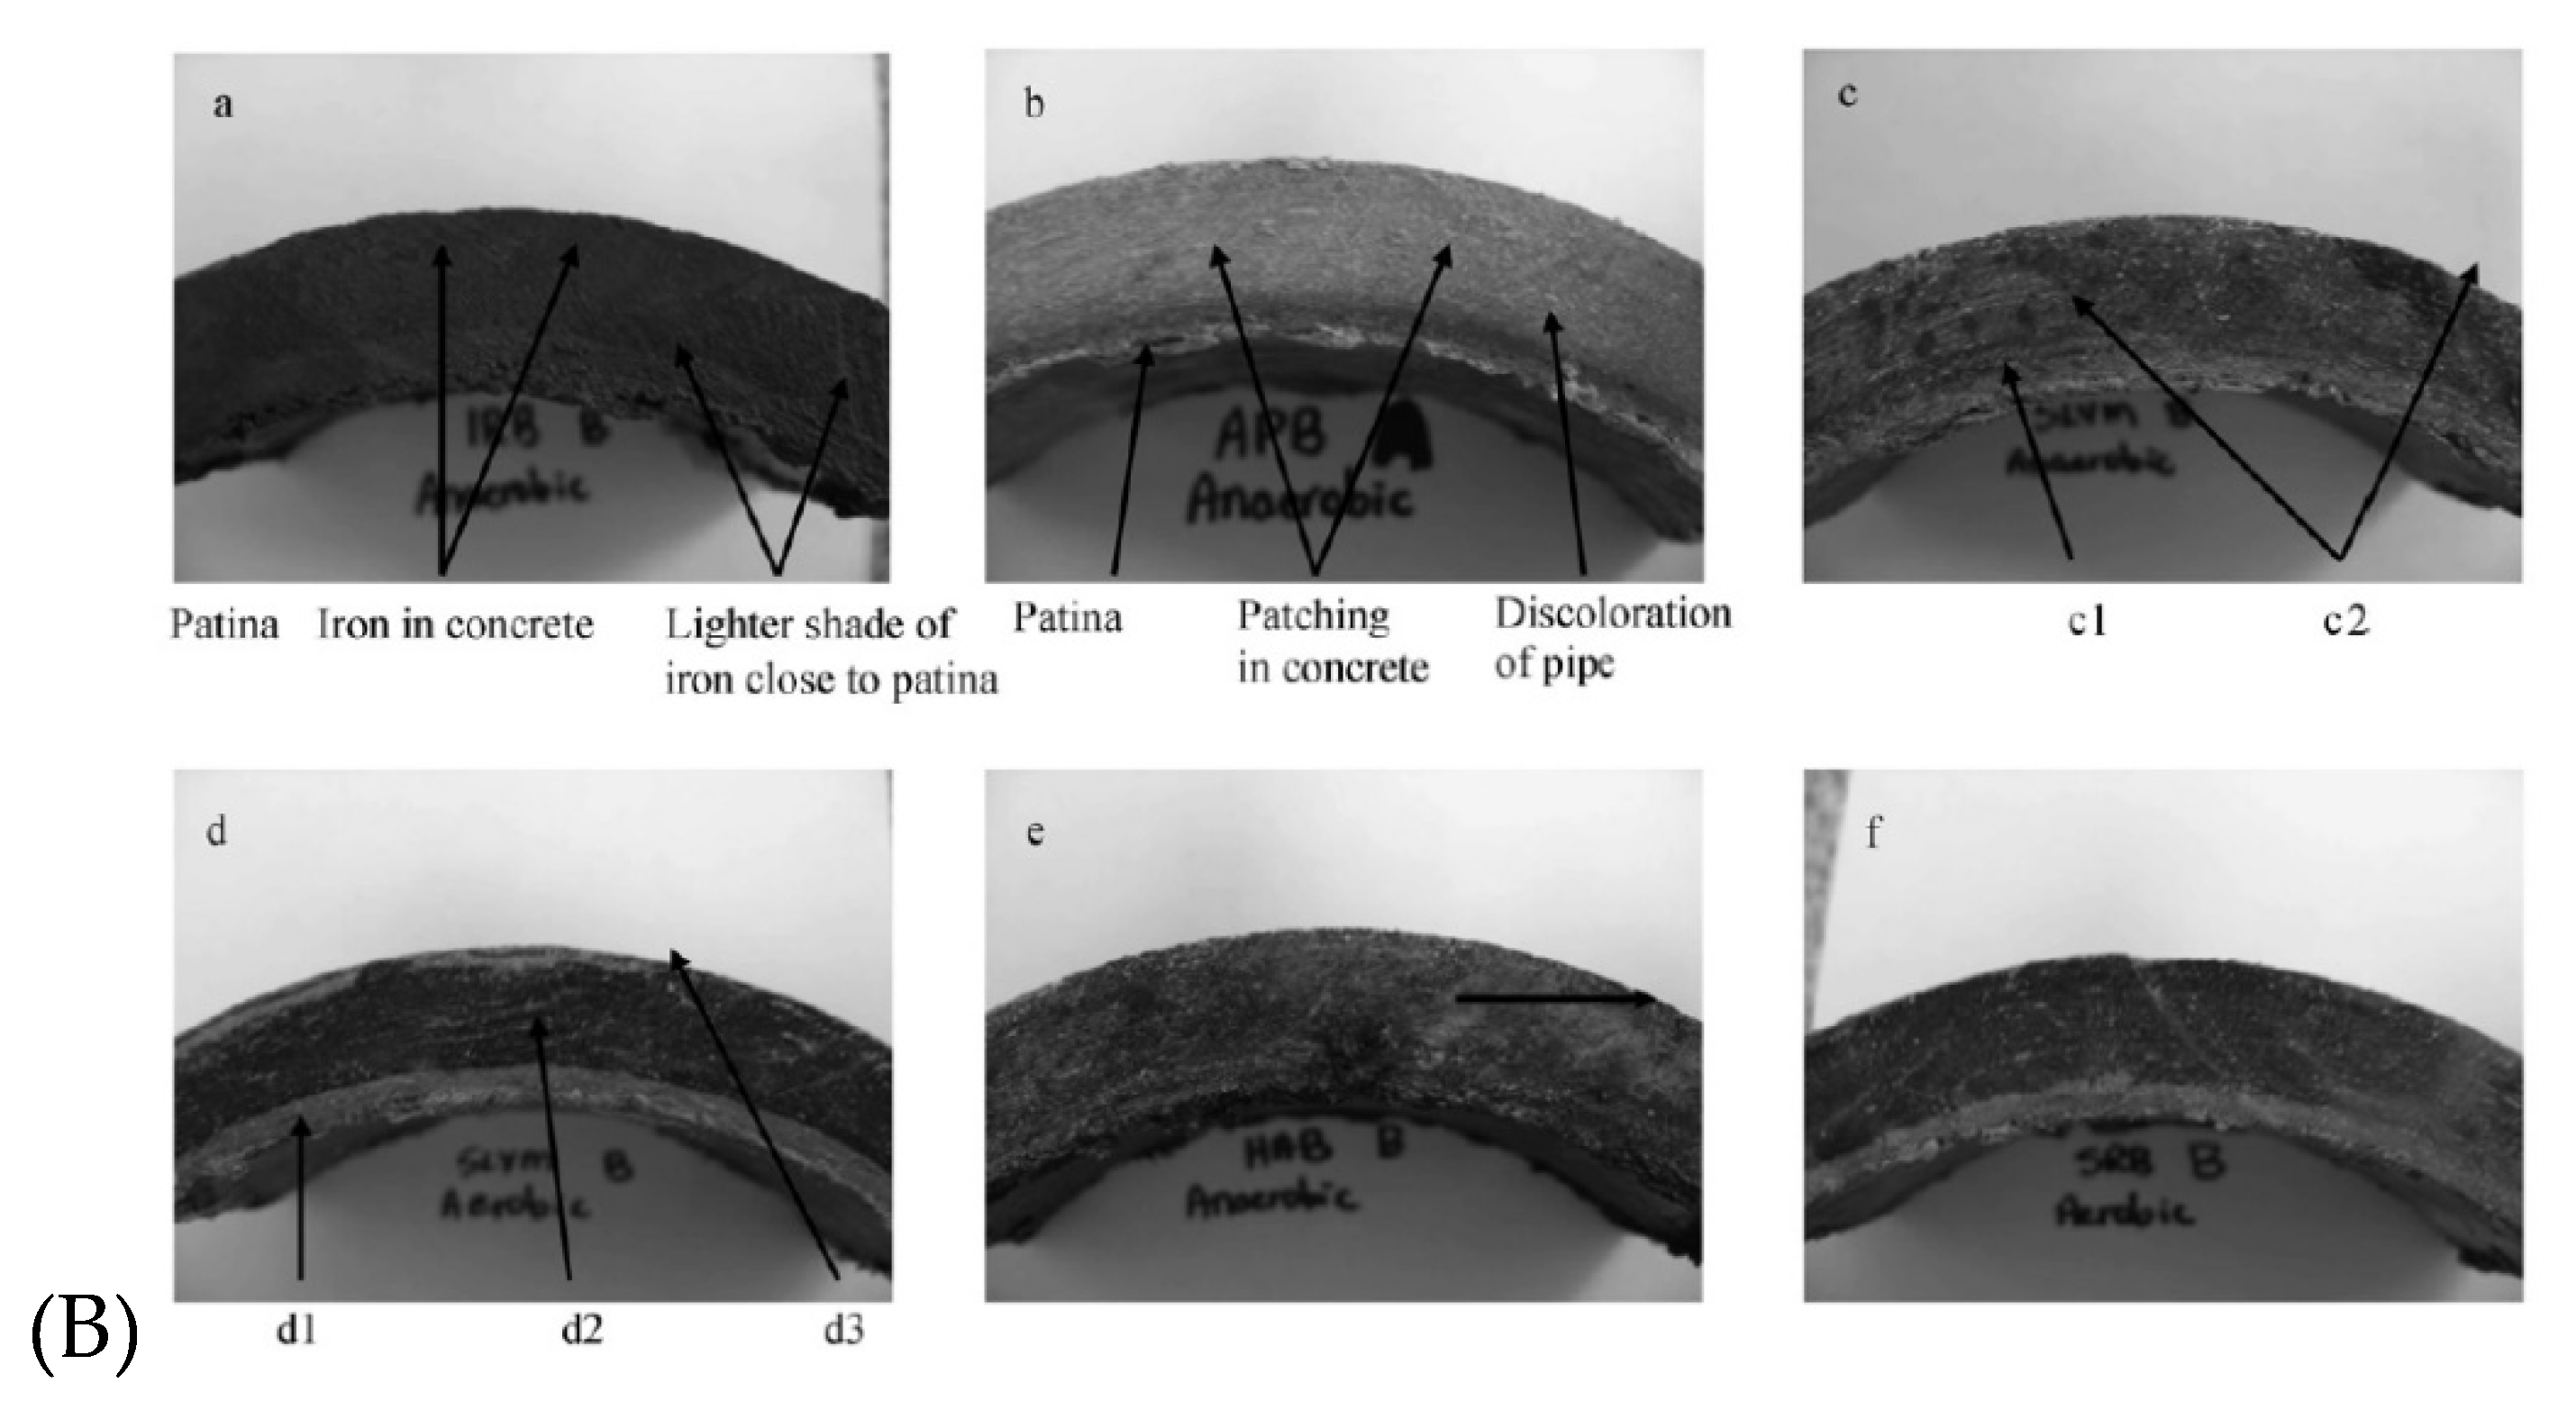
Figure 9.
Cast iron pipes: corrosion scale image of pipeline inner and outer walls. (a1), (b1) and (c1) represent the appearance of lined pipe A, unlined pipe B and unlined pipe C, respectively; (a2), (b2), and (c2) represent the internal corrosion of lined pipe A, unlined pipe B and unlined pipe C, respectively. (a3), (b3), and (c3) corresponding to (a2), (b2), and (c2) represent the internal pipe scale extraction location. The sample labels A1-A6, B1-B6 and C1-C6 represent sampling locations. Note: Inner wall scale: A1, A2, B1, B2, B3, C1, C2 and C3. Outer wall scale: A3, A4, A5, A5, B4, B5, B6, C4, C5 and C6 [180].
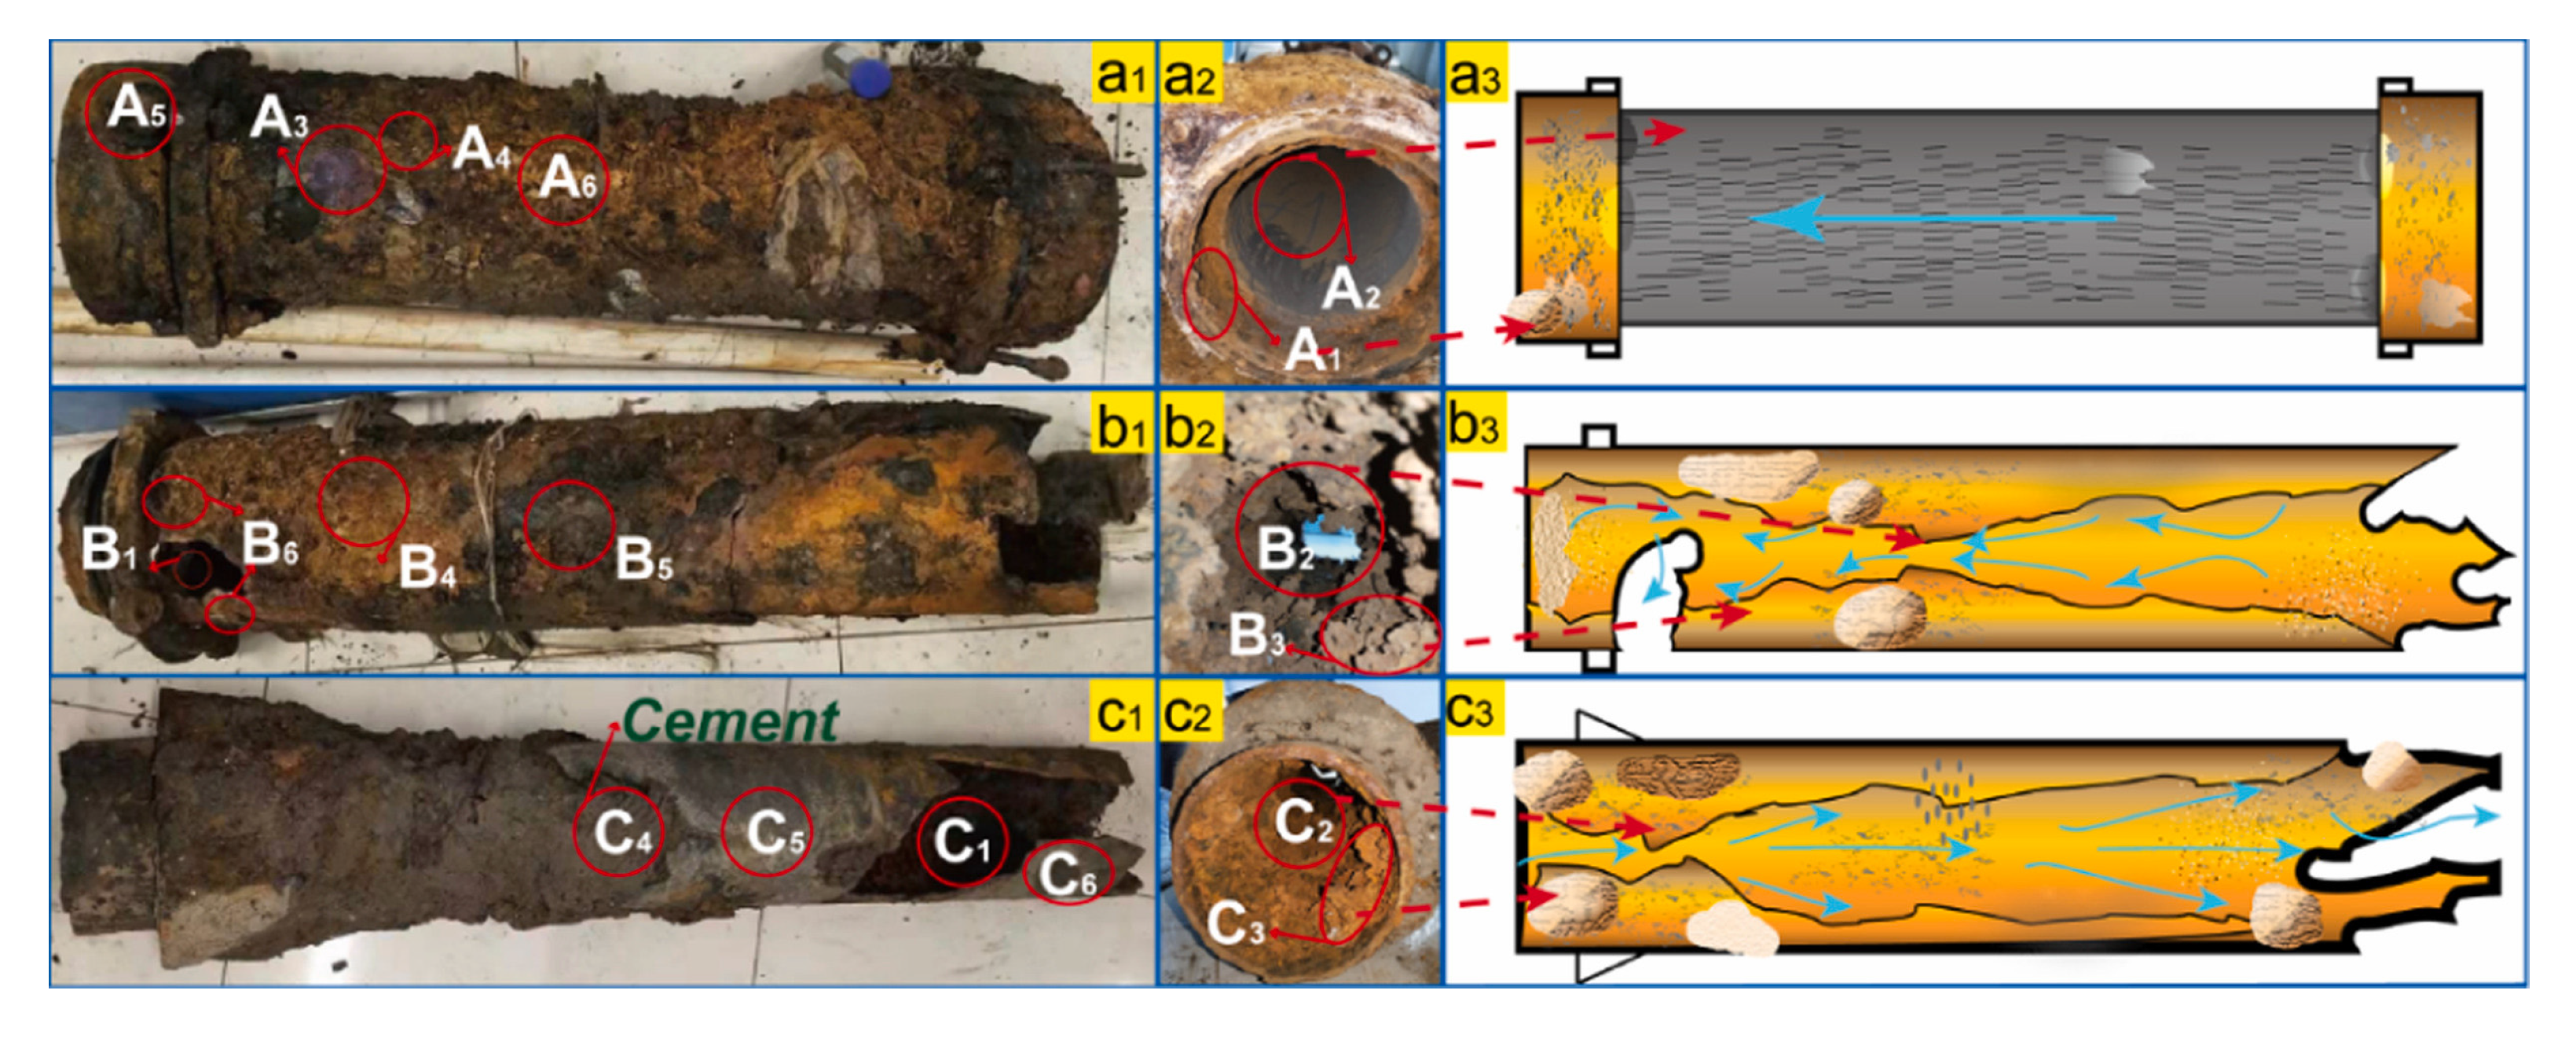
Figure 10.
Interaction mechanisms between MPs and heavy metals present in the DWDS. Factors that influence the retention mechanisms (HMs - heavy metal complex) [206].
Figure 10.
Interaction mechanisms between MPs and heavy metals present in the DWDS. Factors that influence the retention mechanisms (HMs - heavy metal complex) [206].
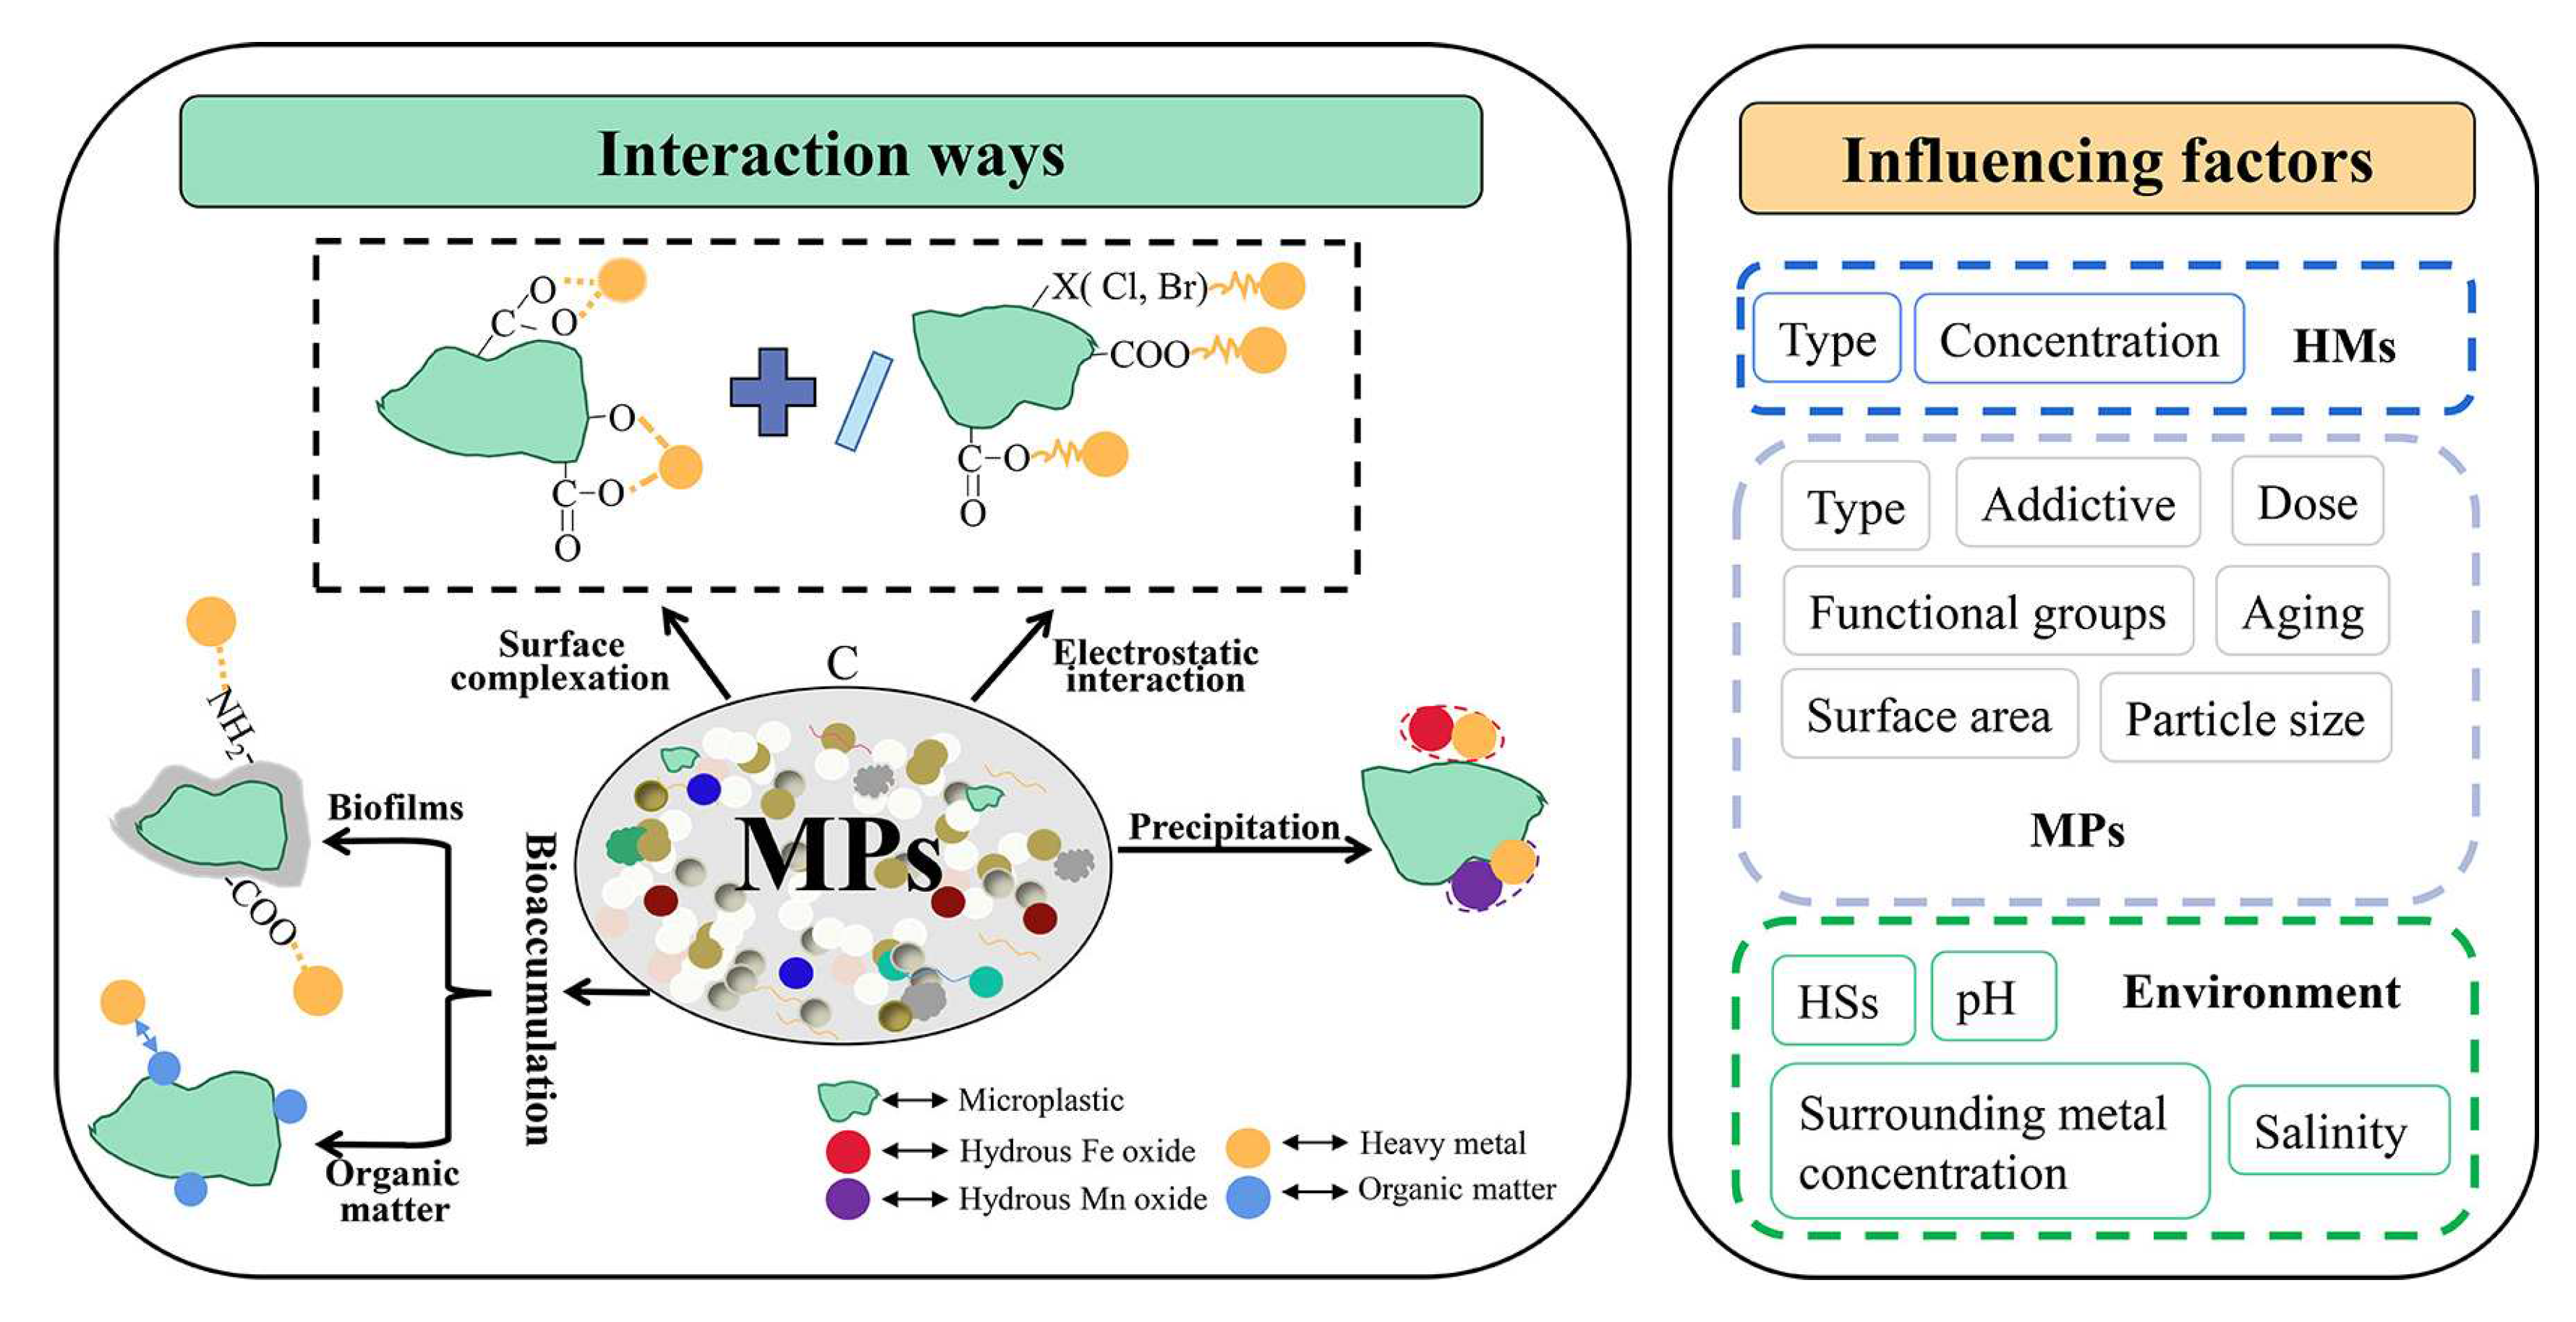
Figure 11.
Schematic diagram of corrosion reactions of (a) uniform corrosion of copper pipes and (b) galvanic corrosion system with the half-cell reactions [28].
Figure 11.
Schematic diagram of corrosion reactions of (a) uniform corrosion of copper pipes and (b) galvanic corrosion system with the half-cell reactions [28].
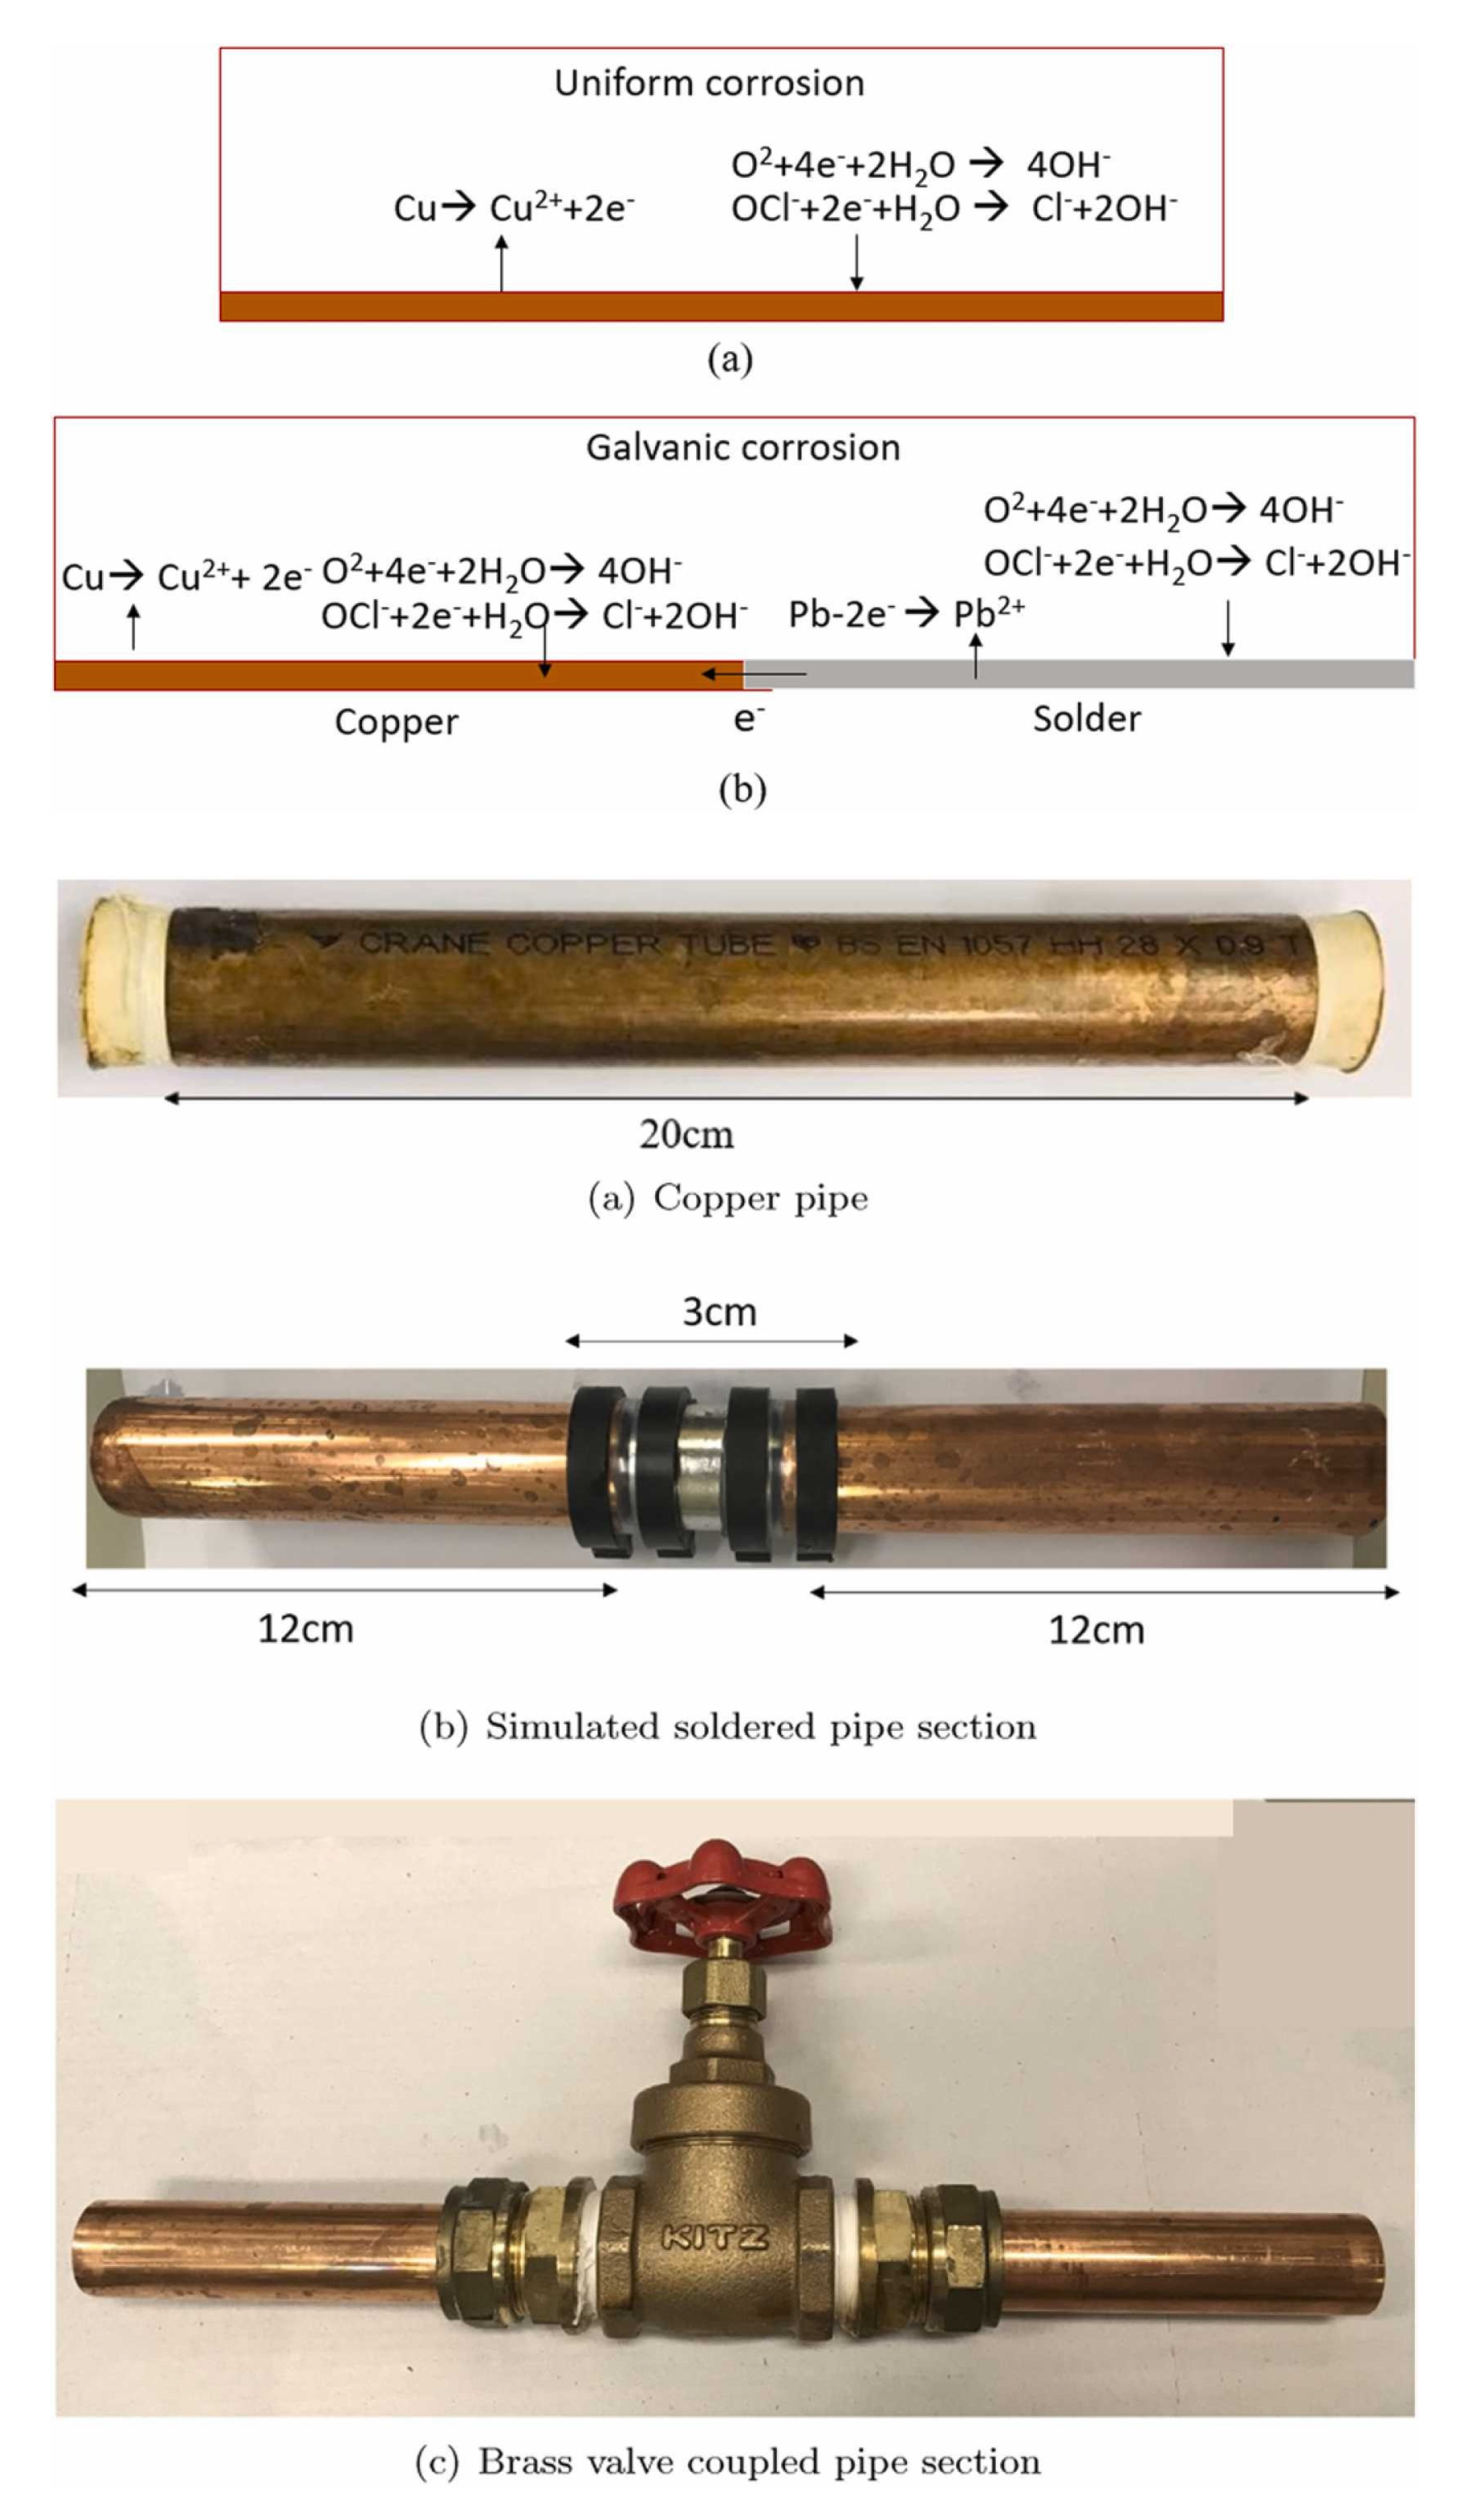
Disclaimer/Publisher’s Note: The statements, opinions and data contained in all publications are solely those of the individual author(s) and contributor(s) and not of MDPI and/or the editor(s). MDPI and/or the editor(s) disclaim responsibility for any injury to people or property resulting from any ideas, methods, instructions or products referred to in the content. |
© 2023 by the authors. Licensee MDPI, Basel, Switzerland. This article is an open access article distributed under the terms and conditions of the Creative Commons Attribution (CC BY) license (http://creativecommons.org/licenses/by/4.0/).
Copyright: This open access article is published under a Creative Commons CC BY 4.0 license, which permit the free download, distribution, and reuse, provided that the author and preprint are cited in any reuse.
Submitted:
04 September 2023
Posted:
05 September 2023
You are already at the latest version
Alerts
A peer-reviewed article of this preprint also exists.
This version is not peer-reviewed
Submitted:
04 September 2023
Posted:
05 September 2023
You are already at the latest version
Alerts
Abstract
The inner walls of drinking water distribution system (DWDS) are expected to be clean to ensure a safe quality of drinking water. In reality, complex physical, chemical and biological processes take place when water comes into contact with the pipe surface. This paper describes the impact of leaching different compounds from the water supply pipes into the drinking water and subsequent risks. Among these compounds there are heavy metals. It is necessary to prevent these metals to get into the DWDS. Those compounds are susceptible to impact the quality of the water delivered to population either by leaching dangerous chemicals into the water or by enhancing the development of microorganism growth on the pipe surface. The corrosion process of different pipes materials, scale formation mechanisms and the impact of bacteria formed in corrosion layers are discussed. Water treatment processes and the pipe materials also affect the water composition. Pipes materials act differently in the flowing and stagnation conditions. Also, they age differently (e.g metal based pipes are subjected to corrosion while polymer based pipes have a decreased mechanical resistance) and are susceptible to enhance bacterial film formation. This review helps to clarify what are the possible sources of compounds responsible for drinking water quality degradation. Also, it gives guidance on the measures that are needed to maintain a stable and safe drinking water quality.
Keywords:
Subject: Environmental and Earth Sciences - Water Science and Technology
1. Introduction
Water is essential for life development throughout the world, all plants and animals need the water. Its quality (expressed by chemical, physical and biological characteristics) influences the population health. Drinking water quality varies from a place to another and is affected by the water source, the treatment that water underwent and the pipe distribution system.
Water in contact with the pipe material can cause components leaching, pipe corrosion in time or promote microorganism growth on the inner pipe surface. The first two mechanisms lead to chemical contamination of water whilst microorganism multiplication deteriorate the biological stability of water (development of pathogens, deterioration of taste, odour colour). Water quality at tap and the problems that arise are specific to each water distribution system. The 2021 EU Directive regarding the quality of drinking water are stricter regarding the presence of toxic chemical compounds [1].
Microorganism growth inside the pipes depends on several factors such as availability of nutrients, concentration of disinfectant, water temperature and pH, existence of biofilm or corrosion layer on the pipe inner surface.
The biological stability of drinking water is defined as the capacity of water to maintain the same microbiological characteristics from the treatment plant to the consumption point. The presence of bacterial communities during the water treatment step is carefully checked. However, the distribution system can contribute to the developing of microorganisms in the biofilm and corrosion layers formed on the pipes inner walls [2]. The adhesion of microorganisms is influenced by several factors: (i) pipe characteristics (such as material, roughness), (ii) water physical-chemical parameters (pH, temperature, load in organic compounds, existence of minerals) and (iii) characteristics of microorganisms (ability to produce extracellular polymeric substance, cell hydrophobicity and motility) [3,4,5,6,7].
Among the first materials used for the water distribution systems (concrete and lead), lead was extensively employed. Lead exposure has severe consequences (affecting mental and physical development), with symptoms that don’t appear until dangerous amounts have accumulated in the human body [8]. Adverse health effects have been observed also in prenatal stage [9] Because of that, during the last decades it was decided the replacement of lead plumbing by other materials such iron, galvanized steel, PVC, and copper [10,11,12,13,14]. Each of these materials has advantages and disadvantages that will be further discussed.
Aluminium can be leached from the cement-based pipes. Constant exposure to this ion can lead to an important risk of cognitive decline, dementia, and Alzheimer’s disease [15]. In New York it was not found any correlation between the asbestos contained in drinking water and cancer occurrence among the population [16]. However asbestos fibers in the drinking water could become airborne and enter the langs. Another study made in Norway support the hypothesis of an association between ingested asbestos via drinking water and gastrointestinal cancer risk [17].
Galvanised pipes are a source of zinc in drinking water. Iron pipes are a source of arsenic. Zinc, arsenic and copper are heavy metals that pose health risk issues, and their concentrations must be monitored in DWDS [18,19,20,21,22,23].
When a pipe corrodes, it leaches substances that accumulate in the drinking water, but also the pipe softens, and loses its mechanical strength, overall reducing its service life.
Modern manufacturing technologies allow the fabrication of water distribution pipes by different association among materials (e.g., ductile iron pipe with cement lining or polymer lining such polyethylene or polyurethane). But the behavior of these pipes as regarding the progressively release in time of dangerous compounds due to pipe corrosion and aging it is not entirely known.
2. Materials used to manufacture the drinking water distribution pipes
A. Lead
Main lead source in a lead pipe is the pipe itself. Besides lead manufactured pipes, another source of lead in non-lead pipe systems, are the brass fixtures and lead-solder connections [24,25,26,27,28]. These fittings represent discrete sources of lead that may give rise to significant lead concentrations in the drinking water. There is no safe lead concentration in the drinking water. Lead concentration can vary within home, at the same tap over time or between homes. Currently no new lead system is being installed but many older DWDS still contain lead pipes. In latest years lead pipes have been started to be replaced worldwide, especially in the cases that Pb concentration are high.
Concentrations higher than 10 μg/L were consistently measured in old pipe systems in Taiwan which represent a health risk for the population [29].
However, care must be given when replacing part of the lead pipes system. Replacement of about 80% of lead pipe with copper pipe, in Canada, caused sustained lead release (sometimes worse than a full lead system) up to 12 weeks upon substitution [30]. The same behaviour has been reported in the USA [31]. This was attributed to galvanic corrosion between aged lead pipes and new copper pipes [30,32].
- (a)
-
Water chemistry parameters:
- (i)
- pH, alkalinity
- (ii)
- the content of dissolved inorganic carbon
- (iii)
- presence of disinfectants: chlorine, chloramine, dissolved oxygen
- (iv)
- presence of corrosion inhibitors (orthophosphate, orthophosphate/polyphosphate mixture, silica)
- (v)
- Oxidation Reduction Potential
- (vi)
- Presence of organic matter
- (b)
- Flowing regime: alternate flow / stagnant regime; pipes flushing.
Lead scale is a complex structure that accumulate many different metallic compounds, often in different layers. Because of that, lead release into the flowing water is more complex than the corresponding solubility mechanism. One of the factors affecting the lead leaching from the corrosion scale is the pH. Lead solubility from the scale increases with decreasing pH, allowing the detachment of lead particles from the scale into the drinking water [37,38]. Experiments have showed that arsenic and aluminium concentrations in drinking water during the pH experiments, are in strong correlation. This suggests that the aluminosilicate present in the scale is accumulating arsenic that can be later released when conditions are favourable [33,39].
The lead corrosion scale can contain other heavy metals such as V, Sb, Cu, Mn and Cr [39,40,41,42,43]. 2.8% of water samples analysed in a DWDS in USA exceeded the maximum allowable concentration for Pb, As and Cu [43]. Characterisation methods showed that hydrocerussite phase (Pb3(CO3)2(OH)2) is the major lead crystalline corrosion compound in the scale [34,39]. Cerussite (PbCO3) was also present in same cases. In the inner scale layers PbO2 and Pb3O4 were present [39]. Lead dioxide acts as protective layer; formation of PbO2 was reported to be beneficial in terms of pipe protection for future corrosion [44]. Metallic lead reacts with water only in the presence of oxidizing compounds to form lead hydroxide, Pb(OH)2 [45]. Then the white lead, an alkalic lead carbonate compound with high toxicity (hydrocerussite, 2PbCO3.Pb(OH)2) is forming (Figure 1). Addition of orthophosphate is decreasing the dissolution rate of hydrocerussite [34]. Darker layers correspond to accumulation in the lead scale of manganese containing compounds [41].
In soft water, traces of lead form colloidal lead compounds that are difficult to remove [46]. It has been experimentally observed that higher lead levels in water are often accompanied by high iron concentrations [47]. Lead is forming with iron and natural organic matter present in the environment, colloidal particles that are easily detached and transported in the DWDS.
Change of disinfectant from chlorine to chloramine caused an increase in lead corrosion. This is because, the predominantly tetravalent lead (PbO2) scale is destabilized in the presence of chloramine [48].
Analysis of tubercle scales collected from pipelines in the Columbus, Ohio, found to contain microorganisms like sulfate reducers, nitrate reducers, nitrite oxidizers, ammonia oxidizers, sulfur oxidizers [49].
To help reduce lead concentration, pipe flushing operation can be applied periodically [50]. This is however efficient on short time periods. To better control the lead pipe corrosion and there are several methods in use: pH/alkalinity adjustment, adding corrosion inhibitors (orthophosphate, orthophosphate/polyphosphate mixture, softening with Ca(OH)2 [51,52]. In the case of corrosion inhibition using orthophosphate, amorphous solid phase (containing mainly Pb, Al, P, and Fe) is formed. This layer is not very stable and can be easily detached when disturbances in flowing conditions take place [52].
B. Cement
Cement is frequently used for the manufacturing of pipes or as a protective layer on the inner of the surface of an iron or steel pipe. The cement is used as coating to prevent the corrosion of pipe metallic surfaces because of a high pH of the cement lining. In this way it is achieved the isolation of metallic pipe from water and is created an alkaline environment near the pipe walls that prevents corrosion. The protective layer can be applied during the manufacturing process of the pipes (prefabricated coated pipes) or during the renovation of corroded water pipes (manually coated pipes). The concrete pipes are cement based pipes made by mixing of cement (limestone), water, sand and additives that prevents the concrete pipe to crack.
Concrete pipes were among the oldest pipes systems to be employed for water transportation [53].
The types of cement allowed to be used in manufacturing the pipes for drinking pipes are Ordinary Portland Cement (OPC), High Alumina Cement (HA cement), Blast Furnace Slag Cement (BFS cement), Fly Ash Cement (FA cement), and Sulphate Resistant Portland Cement (SR cement) [54].
Cement manufactured pipes were usually used in combination with asbestos which provides tensile strength and are resistant to thermal and chemical breakdown. However, in the late 1980s concerns have raised in New York regarding the use asbestos-cement pipes (AC), because the asbestos fibers were detaching from the inner pipe surface and migrate to drinking water [55,56]. Figure 2 shows the state of an AC pipe replaced from DWDS of the town of Călăraşi, Romania. It was studied back then the possibility of fibers contained in the drinking water to become airborne. Results have evidenced an increased content of asbestos in the air of the houses being supplied with drinking water contaminated with asbestos fibers [56]. To this day there are still in use AC pipes for fresh water supply [57]. Mager et al. (2022) report the presences of asbestos fiber in drinking water originated from ageing AC pipes in New Zeeland [58]. The pipe system was installed between 1930 and 1960, and to this date was still releasing asbestos fibers: 10 μm long with an average concentration 0.9 million fibres per litre (MFL) and short asbestos fibres (0.5 μm) with an average concentration of 6.2 MFL.
The analysis of a 56-year-old AC pipe evidenced surface corrosion because of calcium leaching from the wall [57]. Seasonal variation of temperature was found to impact the calcium dissolution rate which in turn impacts the release of asbestos fibers: lower water temperature increased the calcium leaching which accelerates the detachment of asbestos fibers.
Cement is composed mainly by CaO, Al2O3, SiO2 Fe2O3, gypsum in various ratios [59,60,61]. In addition to the characteristics of running water, the durability of asbestos-cement pipes is also directly related to the free lime content, Ca(OH)2 [62].
Concrete and cement pipes are mainly affected by leaching process. Contaminants are released from the cement layer immediately after the installation of new pipes or after the rehabilitation of old pipes. The degree of water contamination is strongly related to the composition of the cement and is more accentuated at the beginning of the pipeline operation [54,63,64,65]. The leaching process means the dissolution of same compounds of the pipe walls. The dissolution takes place in the pores of the wall and assumes several steps:
- (i)
- internal diffusion of liquid water through the porous wall;
- (ii)
- dissolution of the compounds;
- (iii)
- diffusion of the dissolved compounds through the pores at the surface of the pipe;
- (iv)
- external diffusion of the dissolved compounds at the wall pipe into the main water stream. The permeability of the material controls how much water diffuses through the pores of material. The leaching rate depends on if the pipe just started to be operated, the permeability of the pipe material, the softness of the drinking water, and the solubility of the leached compound. The soft water is water relatively free of dissolved ions and has a higher capacity of dissolution compared with a more saturated water in minerals.
The cement is the source of toxic elements that can be of natural origin or introduced into the cement composition during the manufacturing process. The cement industry has modified its production methodology to include the valorisation of several types of waste materials (meat and bone meal, waste tires, solidified sewage sludge) as alternative fuel in cement kilns [66,67,68,69]. Waste tires are tires are the most common sources of antimony, cadmium, chromium, cobalt, lead, titanium, and zinc [66]. Solidified sewage sludge is a source of cadmium, chromium, zinc, vanadium, cobalt in varying concentrations [67]. No toxic heavy metals are leached from concrete manufactured using meat and bone meal waste [68].
Experimental studies conducted on cement coated iron and steel pipes showed that calcium, aluminium, chromium, lead, and cadmium are the main ions that are more susceptible to be leached form the cement surface [64,70]. Calcium hydroxide was found to be the most soluble compound from cement [71]. For cement coated iron and steel pipes, leaching of aluminium was found to be much more intensive from manually prepared coating than from prefabricated cement coating. The type of cement used for the experiments was BFS cement in the case of prefabricated pipe and OPC for the manually coated pipe. The cumulative quantity of aluminium leached was about 160 mg/m2 for manually coated pipe versus 0.5 mg/m2 for prefabricated pipe, after 100 days since the starting of the pipe’s operation [64]. Accelerated studies consisting of exposing samples of concrete to deionized water or acid solution for 64 days were made to see which one of HA, BFS or FA cement is more suitable for use in contact with drinking water. High amounts of calcium and aluminium were leached from HA cement whilst the smallest total amount of calcium and aluminium were measured for the BFS cement [54]. For the countries in the European Union, the limit of the aluminium in drinking water, is set to 200 μg/L, according to the Directive (EU) 2020/2184 [1].
Comparison between CEM I types (OPC) made by two different manufacturers showed a similar behaviour. For both cement the leaching of aluminium and calcium was very intensive in the initial contact with the drinking water and decreased over time. Aluminium leaching was still present after 64-day investigation period while calcium was leached only up to 4 days after the first contact with the drinking water. Leaching of chromium was similar for both types of cement CEM I and disappeared after 7 days. Lead leaching was not detectable after the fourth day for both types of cement. The main disadvantage when using CEM I type cement was exceeding the aluminium maximum concentration in drinking water for several days after the pipe is put in use [65].
Another parameter that affects the leaching of dangerous compounds from cement coating is the dose of disinfectant present in the drinking water. The disinfectant is added to ensure a reduced concentration of microorganisms in the water transported from the treatment plant to the consumer. Resistance to chloride ions of concrete based pipes was extensively evaluated [72,73,74,75,76].
Adding sodium hypochlorite to water does not impact the increase of the water pH at the contact with the cement lining. However, when comparing results obtained from tests on water with or without disinfectant, the presence of disinfectant does considerably increase the leaching of different compounds (like calcium, aluminium, chromium, and lead). The lowest tested sodium hypochlorite dose was the most aggressive causing the highest rate for calcium, aluminium, and chromium leaching. This indicates that the effect of disinfectant on the leaching rate is indirectly proportional with the disinfectant concentration [70].
Experiments with cements having different compositions have showed that there is dependence between the chemical composition of the cements and the type and concentrations of leached elements into the water [65].
Another aspect observed after the installation of a new cement coated pipeline was the significant increase of the water alkalinity [77]. One day after operation started, the water pH increased to 11 (the same pH value that was measured for the water inside the pores of fresh concrete material). The experiments were performed with still water (non-carbonated water). The pH values were above 8.5 even after 35 days of water flow although the pH was continuously decreasing according to a logarithmic path.
To improve the resistance of cement pipes, PVC (polyvinyl chloride) tubes can be used as an inner layer [78]. There are however some inconveniences when using cement based pipes with embedded polymer pipe. The parameters that were studied were pipe diameter, curing age, temperature and resistance to chloride ions. These factors change with increasing the pipes diameter. Between the two pipes a weak zone is formed, and this zone increases with the pipe diameter. The weak zone is characterised by a reduced compressive strength and a higher diffusion coefficient of chloride ions [79].
C. Copper
By comparison with stell [80], copper and copper alloys are corrosion scale forming materials [81,82,83]. This means that the corrosion by products accumulate on the interior of the pipe. It was found that pure water does not contribute significantly to the corrosion of copper pipes [84]. Generally, there are three types of scale in pipes made from:
- (a)
- compounds that crystallize directly onto tube surfaces from the flowing water (this is the case of calcium and magnesium carbonates that distribute uniformly on the inner surface of the pipe);
- (b)
- scale consisting in inorganic materials precipitated elsewhere and transported by the flowing water;
- (c)
- scale formed by the corrosion products (characteristic for unlined iron cast pipes, copper pipes); the corrosion scale is a hard mineral consisting in densely distributed corrosion tubercles.
At the beginning of their operation, the copper pipes are covered by a protective layer cuprous oxide.
The difference in the behaviour of stainless steel and copper and copper alloy materials resides in the fact the copper corrosion is much faster and the concentration of copper ions in the water near the pipe wall rises so the precipitation and crystallization of corrosion products takes place. Stainless steel is also forming a passivation film, but the corrosion of this film is so slow that the corrosion products do not accumulate at the pipe wall. Scale build-up is a process that takes months or even years. It is difficult to predict how the existing corrosion scale will behave when water composition changes or seasonal changes take place [85].
The copper corrosion in the presence of soft water at room temperature and flowing water is initiated by the breakdown of the metallic oxide thin layer. The cuprous oxide crystals that are separated from the layer migrate to form mounds at grain boundaries. Spherical pits are created in this way. The presence chloride ions used for water disinfection, accelerate the breakdown of the oxide layer [86].
The main factors that were found to affect the copper corrosion and later to cause the leaching of the corrosion products in the drinking water are:
The components of the scale formed by the corrosion products were products of Cu (I): cuprite (Cu2O) and copper (I) hydroxide (CuOH) and products of Cu(II) : CuO, copper (II) hydroxide (Cu(OH)2), and malachite (Cu2CO3(OH)2) [84].
By increasing the velocity of water flowing in the pipe, the copper release is also increasing [96].
Experiments with a lead-free laboratory system of pipes (consisting of copper pipes, stainless steel taps and brass fittings) evidenced elevated levels of lead leaching [97]. The samples were analysed after 475 days of alternative flowing/stagnation periods. Concentrations of 10 μg lead· L –1 were measured for five months after the 475 days, the source of lead being identified as a lead free brass fitting.
D. Iron
The iron pipes used for DWDS are cast iron pipe, galvanized iron pipe, unlined cast iron pipe, lined ductile iron pipe.
Corrosion of metallic iron means its dissolution from the metallic pipe as Fe2+ simultaneously with the reducing of oxidizing agents present in the water: O2, H+, SO42-, NO2–, NO3–, CO2; ferrous iron can be further oxidized to ferric iron. This ends up creating cracking and pitting iron corrosion. The primary parameters that affect the iron pipe stability are related to the flowing water characteristics: alkalinity, pH, presence of chloride and sulfate ions [98,99,100,101,102,103,104]. Adding orthophosphates to the flowing water, act as corrosion inhibitor by forming insoluble phosphates that create a coating protective layer [105].
The metallic surface (iron, steel etc) act as the anode, while the water near the pipe surface (containing oxidants: oxygen, chlorine, microbial metabolites), participate as the cathode (Figure 3).
The solid corrosion products build up in time thick corrosion scale that are responsible for pipe blockage, leakage, and red water formation [106,107]. Corrosion scales formed on the surface of pipes consist mainly in lepidocrocite (γ-FeOOH), magnetite (Fe3O4), goethite (α-FeOOH), hematite (Fe2O3) and ferrihydrite [108,109,110]. All these minerals have strong affinities to adsorb heavy metals (lead > vanadium > chromium > copper > arsenic > zinc > cadmium > nickel > uranium) [108]. Another source of heavy metals are the pipes themselves. The iron pipes can contain other metals in small amounts. As the iron pipe starts to corrode, these metals are released from the pipe wall and incorporated in the corrosion by-products. Red water is formed under stagnant conditions, due to oxygen depletion in water by iron, existing Fe(III) is reduced to Fe(II), followed by the dissolution of corrosion by products [101,111,112]. Measurements of iron corrosion potential in flowing and stagnant water confirmed the mechanism proposed by Kuch (1988) [111]. Experiments made with dissolved oxygen evidenced that the increase of iron corrosion potential during stagnation periods is associated with the consumption of dissolved oxygen by the iron [101]. The corrosion rate of cast iron in the drinking water distribution pipes decreases gradually in time [113].
The metals accumulation in corrosion scale represents a threat to the population health. A maximum accumulation rate of 3.94 mg vanadium/g of scale and 3.90 mg arsenic/g of scale respectively was found by He et al., (2021) on scales from cast iron pipe (20 years operation time) [110]. The accumulation rate depends on various factors such as pH, temperature; the scale was mainly composed by magnetite and goethite. Although the scale layer is thinner on the steel pipes, it was also reported that the scale deposited in the steel pipes also accumulate vanadium. The adsorption capacity in the different layers of the corrosion scale decreases in the following order: surface layer > porous core layer > hard shell-like layer [114]. Calculations on iron corrosion scale showed that it is sufficient to dissolve 0.0027% of a 0.1 cm thick corrosion scale (for a 1 m segment length and 3 cm diameter) to reach the limit for vanadium in drinking water which is 15μ/L [115].
Chloride and sulphate anions are competing in the arsenic accumulation therefore increasing their content will reduce arsenic accumulation on corrosion scales [110].
Another toxic heavy metal is chromium. The accumulation and release of chromium (III) and (VI) from iron corrosion scales was investigated [116]. The outer layer of the scale is accumulating less chromium and is releasing more. During the Cr6+ accumulation process, part of the Cr6+ is reduced to Cr3+ by the existing Fe2+ which is a beneficial process since the toxicity of Cr3+ is reduced.
Comparing with the stainless stell scale which contains chromium from the corrosion products, the iron scale is accumulating chromium from the water flowing in the pipe or from the inner linings of the pipe. The chromium content in scales of stainless steel pipes is higher than chromium content of iron corrosion scales [80].
The accumulated heavy metals can be released in some conditions. Vanadium release is increased by low pH, high temperatures and high sulphate ion concentration [115]. Chromium release is affected by several factor in decreasing order: pH >temperature> chloride ions concentration > sulfate ions concentration [116].
Manganese also can accumulate in iron pipe scales. Although not so dangerous as vanadium, chromium and arsenic, its concentration in the drinking water is however monitored and limited to 0.05mg/L [1]. The manganese release is enhanced in stagnant water. The factors influencing the manganese release are pH, alkalinity, sulfate ions concentrations, and the presence of disinfectants [117]. Like in the case of vanadium release, lower pH, lower alkalinity, higher temperature, and higher sulfate concentration are increasing the manganese release from the scales. Under the same contact time and disinfectant dose, the disinfectant inhibitory effect on the manganese release follows the order: ClO2 > NaClO > NH2Cl. Two indicators, alkalinity and sulfate ions concentration, have strong effect on manganese release. They could be monitored to control the manganese release from iron scales.
- (a)
- floor layer made of carbonates;
- (b)
- thin corrosion scale;
- (c)
- hollow tubercle.
In time, the corrosion scale formed on iron pipes develops a multi-layer structure consisting of the corroded floor which is the pipe inner wall, porous layer, stable shell layer and top layer (Figure 5). The shell layer gives resistance to further corrosion process by blocking the access of oxidizing compounds, being mainly composed of compact α-goetite and magnetite [119].
The water characteristics and disinfectant influence on iron corrosion in a ductile iron pipe were studied in accelerated laboratory tests, using increased concentrations of disinfectant [120]. Sodium hypochlorite, like the liquid chlorine enhances iron corrosion by oxidizing ferrous to ferric ions. The effect of NaClO in the presence of calcium ions is different than the chlorine effect, NaClO is responsible for calcium carbonate accumulation on the inner pipe wall in waters with high alkalinity and hardness. NaClO not only contributes to pipe corrosion but also intensifies the CaCO3 deposition in time.
Nitrogenous disinfection by-products (N-DBPs) are known to be more dangerous to human health and to environment than carbonaceous DBPs [121,122,123,124]. Increased content of N-DBPs (haloacetamides, halonitromethanes, and haloacetonitriles) and iron particles was found in the effluent of corroded iron cast pipes [125]. It was found that detaching iron particles from the corrosion scale, are covered by the biofilm. This provides a good surface for chlorine adsorption and N-DBPs formation.
Iron release rate from corrosion scale was found to be dependent on pH, hardness, nitrate ion content, Larson Ratio (ratio of the concentration of chloride and sulfate ions to the concentration of bicarbonate and carbonate ions) and dissolved oxygen [112].
The formation of siderite (FeCO3) was also found to play an important role in the iron corrosion [100,126]. Scales formed on different pipes (PVC; lined ductile iron, LDI; unlined cast iron, UCI; galvanized steel, GS) after 1 year use with water having different characteristics were analysed [100]. The order of total iron release is decreasing in the order: unlined cast iron > galvanized steel > = lined ductile iron > PVC. The main corrosion by products on unlined cast iron pipe were: FeCO3, α-FeOOH, β-FeOOH, γ-Fe2O3, Fe3O4, while on galvanized steel FeCO3 is replaced by significant amounts of zinc oxide. Lined ductile iron and PVC had low deposits of iron containing corrosion by products.
Higher amounts of zinc in drinking water were for galvanized iron pipe, GI reported also in the study of Li et al., (2016), when comparing the behaviour of UCI and GI pipe [127].
The scale deposited on iron based pipes provides a favourable environment for microinvertebrates (Asellus aquaticus) to develop and live in large number. On the contrary on plastic pipes there were only isolated specimens of Asellus aquaticus [128].
The effect of sulfate ions was studied for old cast iron distribution pipes [103]. “Red water” occurred for the pipes usually fed with groundwater while no coloration was noticeable for pipes supplied with surface water. The difference arises from the scale composition: (i) thin less stable for the groundwater supplied pipes containing mainly higher proportion β-FeOOH, FeCO3 and green rust; (ii) thick and more stable for surface water supplied pipes, having a high content of stable Fe3O4. The water sulfate content also influences the bacterial communities living on the scale surface. While the bacterial community did not vary much for pipes transporting treated surface water, in the case of pipes transporting groundwater changing to water with sulfate increases the content of sulfur oxidizing bacteria (SOB), sulfate reducing bacteria (SRB) and iron oxidizing bacteria (IOB). The authors did not study the sulfate effect on the release of dangerous heavy metals like vanadium and chromium.
Water cand be trapped in the scale (occluded water). The contaminants migrate from the occluded water to the bulk water or to the stagnant water, therefore occluded water is another source of drinking water contamination. This water is acidic and contains high amounts of iron, manganese, chloride, sulfate and nitrate [129]. In stagnant conditions, the occluded water becomes more acidic and concentrated in the compounds mentioned above, except nitrate.
E. Steel
Stainless steels pipes are extremely resistant to corrosion. However, under long term operation, they become susceptible to pitting corrosion which forms thin layers of corrosion scales.
It has been reported that stainless steel corrosion scales contain a large amounts of chromium compounds. The scale formation is initiated by pitting corrosion on the pipe surface followed by the homogeneous deposition of iron and chromium corrosion compounds (Figure 6) [80]. The insoluble corrosion products are α-FeOOH, α-Fe2O3, γ-FeOOH, γ-Fe2O3, Fe3O4, FeCO3, Cr2O3, CrOOH and possibly FeSO4.
The presence of disinfectant products enhances the corrosion of stainless steel pipe [80,132]. Steel pipes corrosion in the presence of chloride ions is a multi-step process that depends besides the characteristics of the water, also on the presence or absence of coating protective layer. For uncoated steel pipes, 3 steps were evidenced during chloride induced corrosion: (a) diffusion of chloride ions through the mortar/cement layer; (b) pitting corrosion by which cavities are produced in the steel layer; (c) transition from pitting corrosion to uniform corrosion as more and more chloride ions arrive at the surface of the steel layer. Figure 7 is showing comparative cross-sections of steel bars with different enamel or polymer protective layers [132]. Enamel protective layer did not postpone the initiation of corrosion process; only epoxy protective layer delayed the pitting corrosion.
Under stagnant water, the release of heavy metals from a galvanized steel pipe does not exceed the maximum allowable concentration limits for stagnation time below 8 hours. The heavy metal concentrations decreased in the following order: Mn > Fe > Zn > Pb [130].
It was found that pipe corrosion is reduced in flowing conditions comparing to stagnant conditions: in low water flow or stagnant conditions the corrosion rate is 0.29 mm/year and is decreasing to 0.18 mm/year for water flow rate above 0.15 m/s [131].
F. Polymer based pipes
Polymeric pipes have some advantages comparing to other pipes: they are lighter which is important if they are used in buildings, do not form corrosion scale etc. Among analysed pipes (PVC-U, galvanised steel pipe, copper pipe, and cast iron pipe) PVC-U pipes have the minimum value in terms of resource and energy consumption in residential buildings [133].
By using polymer based pipes in DWDSs, the problems related to compounds containing heavy metals is reduced significantly. However, polymer based pipes have a reduced mechanical strength and favours the formation of organoleptic compounds [134,135] and biofilm on the inner pipe surface [136]. To improve the mechanical strength, polymer based pipes are mostly used as inner pipes in cement or metal based pipes.
Experiments have shown that defective polyethylene tubings (dissolution of polymer additives and oxidation of pipe surface during extrusion) can explain the formation of organoleptic substances (alkylphenols, aldehydes, ketones). The release time of organoleptic compounds was found to exceed several months under low water flow rates [134].
It was shown experimentally over 16 weeks of investigation, that the migration of organic compounds was elevated within the first weeks of use, followed by a lower and constant level [137]. The organic compounds that are migrating from the pipe surface (polyethylene and cross-linked polyethylene) can be further transformed and degraded in the bulk water [138]. These compounds can be degraded biotically or abiotically, but the degradation rate is low. However, this study did not include the influence of pre-existent biofilm on the pipes inner surface. It is expected that the presence of the biofilm would change the degradation rate.
Reactions between water and the different materials of DWDS can result in alterations of water quality delivered to consumers. The DWDS consist of pipes of different materials that are replaced in time. The iron can dissolve itself from iron based pipes and migrate and concentrate on inner surface of polymer based pipes [139,140]. The study of Wang et al., (2019) evidenced that water quality parameters (e.g., contents of content, sulphate, bicarbonate, and humic acid, and water pH) affects the iron release from the polymer based pipes inner surface [139]. Like the iron, also the manganese can be deposited from the flowing water on PVC pipes [141]. The behaviour of PVC pipes and iron pipes is different regarding the deposition of manganese present in the drinking water: the PVC pipe is providing more favourable conditions for manganese adherence, but the layer formed is not stable and is easily detaching.
It was found that formation of biofilm is accelerated when increasing the water velocity. This is because when increasing the water velocity, the mass transfer of nutrients is intensified. Increased growth of biofilm with water velocity was reported for both copper and plastic pipes. However contrary to plastic pipes, in the case of copper pipes the increase of water flow rate results in an immediate increase of bacterial numbers and copper concentration in water caused by deposits detachment [142].
Although polymeric pipes are not susceptible to corrosion by scale formation, their mechanical structure can however be impacted by oxidation following the use of disinfectants.
The effect of two common disinfectants (chlorine dioxide, ClO2 and sodium hypochlorite, NaOCl) on polymer based pipes was studied in accelerated aging experiments. The evaluated pipes were high-density polyethylene (HDPE), low-density polyethylene (LDPE), unplasticized polyvinylidene chloride (PVC–U), and high-impact polyvinylidene chloride (Hi-PVC) pipes. The pipes have a lower resistance to oxidation in presence of ClO2 than in the presence of NaOCl. This can be explained by the fact that ClO2 generate free radicals that contributes to C – C chain scissions [143].
3. Biofilm formation on inner pipe wall
Biofilms formed on the inner walls of water distribution pipes are responsible for several types of problems, such as the deterioration of water quality, corrosion of metallic pipe walls, intensifying the leaching processes in concrete -based pipes, proliferation of pathogens, etc. The negative action of microorganisms in biofilm can be intensified by the existence of scale on the inner pipe walls.
It is known that the number and diversity of microorganisms in the film is higher than that in flowing water [144].
The biofilm and the scale formed on the pipe walls can exfoliate, releasing heavy metals and pathogens in the drinking water [142,145,146]. The biofilm can contain microorganisms like Pseudomonas aeruginosa and Legionella pneumophila that create health related issues [147,148,149]. Also, the biofilm can be responsible for the deterioration of the taste and odour of the drinking water [150].
The source of microorganisms can be the water itself or cracks in the pipe distribution system that are not remediated.
The biofilm produced by microorganisms present in the flowing water, is adhering on the surface of the inner pipes, and is formed by different constituents of extrapolymeric substances: carbohydrates, lipids, proteins, uronic acids [109], etc.
The steps of biofilm formation include the following successional steps: (i) microorganisms from the bulk water attach to the pipe surface; (ii) microorganism start to develop releasing extracellular polymeric substances (EPS); (iii) modify the surroundings so to exclude or enhance the development of other microorganisms [2,151].
The factors influencing the growth of the biofilm includes the water source [152,153,154], availability of the nutrients [155], disinfectant concentration [151,156,157], water flowing regime [158,159] and the pipe material [136,151,156,160,161,162,163,164,165,166,167].
The main microorganisms involved in the pipe corrosion are sulfate reducing bacteria (SRB) [168,169], nitrate reducing bacteria (NRB) [170,171], acid-producing bacteria (APB) [172], and metal-oxidizing bacteria (MOB) [173,174]. A particularity of biofilm effect on pipe corrosion is its non-uniform composition, inducing a non-equal distribution of corrosion process on the pipe surface [173]. Besides bacteria, the biofilm composition can also include viruses [175]. The proportion of both bacteria and viruses in water increases during stagnation periods.
Concrete was found to be susceptible to degradation under the action of microorganisms [176,177]. Biofilm formation has been reported also in the case of AC pipes. Microorganisms can bioaccumulate to form a layer of 2 to 5 mm thickness, coloured in yellow, orange, brown or black depending on the metallic cations that have been extracted from the AC pipe wall [178,179]. In this film several layers of microorganisms can be distinguished (Figure 8). By performing experiments with microorganisms cultivated on new AC pipes, the steps of pipe degradation and consequently pipe failure have been evidenced: (i) the fatty acids generated by bacterial growth especially under anaerobic conditions, decrease locally the pH; (ii) the concrete structure is deteriorated by leaching the free lime, leaving the asbestos fibers as a woven matrix inside the pipe wall; (iii) the path inside the fiber matrix will allow more development of the bacterial film growth; (iv) the asbestos structure weakens, detach and is released in the drinking water; (v) the structural strength of the AC pipe is reduced.
Microbiologically induced corrosion (MIC) is affecting metallic pipes. Worldwide there is a major concern related to the economic impact generated by maintenance of the water distribution system. Microbial induced corrosion together with scale accumulation may damage the pipeline resulting in pipe leakage or bursting. Biofilm formation can contribute to the acceleration of metallic pipes corrosion [92,93,94,95,180]. Pitting corrosion starts at the interface biofilm – metallic pipe because the water pH is modified by the release of metabolic degradation compounds [95].
To be able to prevent pipe bursting, it is important to characterise the scale accumulated on the inner surface of the pipe and to obtain information about the various microorganism that are colonizing the biofilm. An extended study on scale taken from cast iron pipes that were in service for 22 to 26 years was made by Jia et al., (2022) [180]. The pipes were affected by severe corrosion, burst, and leakage (Figure 9). FTIR and XRD analysis of pipe samples evidenced the presence of γ-FeOOH and α-FeOOH in loose scales, and of Fe3O4 in rigid scales. Also, late-stage corrosion products (Fe3O4, α-Fe2O3, γ-Fe2O3, and FeCO3), were observed in the severely corroded samples. Among the types of the bacteria that are known to play an important role in the processes of iron migration (iron-oxidizing bacteria, iron reducing bacteria, sulphur oxidizing bacteria, sulphate reducing bacteria, ammonia producing bacteria, nitrifying bacteria), sulphate reducing bacteria and ammonia producing bacteria were predominant in the biofilm.
It was found that in iron scales, microorganism community has a bigger influence in Fe3O4 formation than water chemical parameters. This means that in iron pipes distributing drinking water, microbial community influence the capture of iron from unstable corrosion products and enhance the formation of more stable and compact scale mainly consisting of Fe3O4 [181,182].
Corrosion of steel pipes used in water distribution systems, in the presence of microorganisms has been extensively studied [109,183,184,185]. MIC of carbon steel enhances the uniform and localized corrosion of pipe material [109]. Iron oxidizing bacteria (IOB) are responsible for corrosion of cast iron pipes and carbon steel pipes [185]. Iron oxidizing bacteria (Pseudomonas sp. strain DASEWM2) determinates a higher corrosion rate of the pipe by: (i) forming wider cracks in the corrosion layer in the presence of extrapolymeric substances; (ii) the presence of corrosion products with non-protective effect of surface [109].
Under stagnant water, the biofilm formed on corroded copper and stainless steel pipes is favourable to the formation and growth of Legionella pneumophila [149].
An extended study of the influence of pipe material on the evolution of the microorganism community was performed for water distribution systems in East China [162]. The study included samples of biofilm material from different pipe materials: ductile cast iron pipe (DCIP), gray cast iron pipe (GCIP), galvanized steel pipe (GSP), stainless steel clad pipe (SSCP), and polyvinyl chloride (PVC). Results showed that the biomass is growing faster on iron based pipes (DCIP and GCIP). The highest diversity of bacterial species is also found on iron based pipes. Total iron content in the biofilm samples influences the distribution of bacterial communities. The iron concentration in the flowing water is higher in the PVC pipe than in the iron based pipes which suggests that iron is accumulating in the biofilm. Analysed samples of biofilm showed that iron and manganese are accumulating in high concentrations in the biofilm formed on the iron based pipes.
Comparison among four pipe materials (steel, copper, stainless steel, and polyvinyl chloride) showed that bacterial communities are more developed on steel and copper pipes [186]. These pipes are forming important corrosion scales compared with stainless steel and PVC pipes. Stainlesss steel has the lowest bacterial count at the end of the operation. However, steel pipe has the highest bacterial diversity among the metallic pipes.
Nitrate was found to influence the bacterial communities and the iron release from the corrosion scales on cast iron and stainless steel pipes [170]. The increase of nitrate content promotes the growth of nitrate reducing bacteria while decreasing the activity of iron reducing bacteria. The percentage of goethite decreases and the predominant form of iron in the corrosion scales becomes the magnetite (Fe3O4) which is more stable compared with other forms of iron oxides. Therefore, the iron release in the drinking water decreases.
The biofilm presence significantly contributes to disinfectant concentration decay [157,187]. The pipe material influences the growth and distribution of microorganisms in the biofilm. The use of disinfectant 2,4,6-trichlorophenol (2,4,6-TCP) induced the formation of the 2,4,6-trichloroanisole (2,4,6-TCA) which is a source of odour in drinking water. Following this the interaction between the biofilm and the disinfectant will be different from one material to another. Ductile iron and stainless steel pipes produced much more amount of 2,4,6-TCA than PE pipe [150].
Comparison among three pipe materials (ductile iron, cement-lined stainless steel and polyethylene) used in the same conditions of flow and water characteristics showed significant differences in bacterial film growth and community [136]. The difference in the bacterial communities means that in the presence of disinfectant, each pipe will generate other disinfection by-products. Ductile iron had the highest disinfection byproduct formation potential. This is in accordance with the biofilm density and thickness measurements: ductile iron biofilm > stainless steel biofilm > polyethylene. The dominant bacteria percentage was similar for ductile iron and stainless steel pipes.
Another study comparing pipes made of PVC-U (polyvinyl chloride-unplasticised), PE-HD (polyethylene-high density) and cast iron pipes showed that on polymeric pipes the microbiome consists mainly of Proteobacteria while on cast iron pipe of Nitrospirae. The study included 7 years old pipes with biofilm complex composition and concluded that comparing to cast iron pipe, polymer based pipes offers a more suitable environment for pathogenic organisms development [164]. In a chlorinated DWDS, a community consisting of bacteria Pseudomonas, Massillia and Sphingomonas and the fungi Acremonium and Neocosmopora were detected in the biofilm formed on PE-HD [188].
Under the same operating conditions, PE–HD pipes were more susceptible towards biofilm development while concrete pipes were towards metals deposition (iron and manganese especially) [189].
Adherence of Legionella pneumophila and Pseudomonas aeruginosa on several types of pipes (ethylene-propylenediene-monomer rubber, EPDM, silane cross-linked polyethylene, PE-Xb, electron-ray cross-linked polyethylene, PE-Xc, and copper) in flowing tap water showed that these pathogens develop in the biofilms and resists up to several weeks on EPDM and PE. Legionella pneumophila adhere to copper surfaces while Pseudomonas aeruginosa did not [147].
Among several polymeric pipes (PVC–C chlorinated polyvinyl chloride, PE-Xb, PE-Xc, PE-100, PVC-P) tested for the transport of unchlorinated water, PVC–C is recommended for the control of biofilm growth. The ATP (adenosine triphosphate) concentrations, a measure of microbial activity in the biofilm, were minimum for PVC–C and maximum for PVC–P [165].
Among several tested pipes (stainless steel, glass, zinc-galvanized steel, copper, and polyvinyl chloride), Mycobacterium avium shows highest adherence to galvanized steel and smallest to glass [190].
The efficiency of disinfection process depends on the pipe material. Comparing chlorine disinfection in polyethylene and copper pipes, for the same disinfectant concentration, the microorganisms presence decreases both in water and film on polyethylene pipe. For the copper pipes the effect of disinfection is weaker, being effective in the front part of the pipeline. This suggests that copper pipes require a higher disinfectant concentration for an efficient decrease of microbial numbers [191].
Antibiotics present in the water flowing in the DWDS contribute to the development of biofilm resistance to antibiotics [192,193]. It was found that at low concentrations, the antibiotics (tetracycline, sulfadiazine, and chloramphenicol) will enhance the rate growth of bacteria in the biofilms [192].
4. Microplastic (MP) fate in DWDS
In the recent years the presence and fate of microplastic in drinking water is receiving increasing attention [194,195,196]. There are numerous MPs sources from various environments [197,198,199,200,201]. Once in DWDS, the MPs can sediment and be incorporated into the scale formed on the pipe inner surface.
Variation in total MPs content (polypropylene, polyethylene, polystyrene, polyethylene terephthalate, and polyvinyl chloride) along a pipeline showed a decrease of MPs concentration in water from 1570.8 n⋅L– 1 at water intake to 377.0 n⋅ L– 1 at the end of the pipeline network [202].
Attempts to remove MPs in conventional water treatment plants evidenced that this is not enough to reduce MPs, although some retention of bigger particles takes place, there is also a fragmentation process which generates even more small particles [201]. Negrete Velasco et al., (2023) evidenced the persistence in drinking water of some types of plastics (like polyethylene and polyethylene terephthalate) after the water passage through the Geneve’s water treatment plant [203]. Weber et al. (2021) found that the tap water from a German city did not contain MPs particles bigger than 10μm [204].
The toxicity of MPs derives from their chemical structure, from their physical and biological characteristics (small dimensions of different shapes that can adsorb chemicals, can be sedimented or easily transported) [205].
Also, it has been reported that MPs (e.g., polyethylene, polystyrene, polyvinylchloride, polypropylene, polyamide or polyformaldehyde) can interact with heavy metals (Cr, Co, Ni, Cu, Zn, Cd, Pb, Ag, Mn and Hg) present in the drinking water and contribute to metal accumulation [206,207,208,209] (Figure 10) .
MPs act as organic compounds carriers or adsorbents; they can accumulate dangerous chemicals present in small quantities in drinking water, like polycyclic aromatic hydrocarbons (PAHs), polychlorinated biphenyls (PCBs) and organochlorine pesticides [209,210].
The accumulated MPs (containing heavy metals or dangerous organic compounds in larger quantities than in the drinking water) can be later detached with the scale and be further transported by the flowing water, posing a health risk.
MPs present in water bodies are generally polyamide (PA, 33%), polyethylene terephthalate (PET, 15%), rubbers (10%), polyethylene (PE, 10%) and chlorinated polyethylene (CPE, 7%) [211]. Analysis of tap water showed MP particles present in almost half of the samples analysed and the polymers identified were polypropylene, polyester, and polyamide [212].
MPs were detected in different layers of the pipes scale: in the surface, in hard shell-like, and porous core layers (Figure 5) [119,213]. The study has been made using pipe scales samples collected from iron metallic pipe in use for about 20 years and polystyrene MP particles. The retention mechanism of MP is complicated. For polystyrene it was found that van der Waals, electrostatic interactions, hydrogen bonding, and pore filling were the main adsorption processes [213].
The scale is accumulating MP particles (nylon and polyvinyl chloride) with size 50–100 μm while those higher than 200 μm are flowing with the water [214].
The study of the interaction between MPS and biofilm is not extensively evaluated so far due to the complexity of the processes involved. The study of Chen et al., (2023) focused on the impact of hydraulic conditions on the development of a MPS containing biofilm [215]. The MPs tend to form clusters in the biofilm with dimensions depending on the water flow rate (the higher the water flow rate, the lower the dimension of cluster).
Another parameter that can affect the behavior of MPs in DWDS is the chlorination. It has been shown that the water disinfection with chlorine enhances the aggregation ability of MPs and their adsorption capacity of Cr(VI) ions [208].
5. Mathematical modelling
The pipes affected by the leaching process were found to be the metallic pipes and cement and cement protected pipes. Leaching depends on the material pipe and the water characteristics (disinfectant dose, pH, if is soft water). The compounds leached from the pipe surface will accumulate in water over the distance of the pipeline. Therefore, the concentrations of different dangerous compounds will be higher at the ends of drinking water supply pipeline sections. Few studies in the literature address the modelling and prediction of compounds leaching from different pipe surfaces. This is due to the complexity related to the processes on one side and on other side is that, depending on the type of pipe, the leaching processes are time dependent. Hence, the need for large spatial-temporal data to develop model that predicts the leaching of pipeline components.
Moreover, when developing a tool for modelling contaminants release from pipe distribution system, it is necessary to include a model for microbial contamination and disinfection by-products (DBP) formation because these processes are interfering with the release of contaminants from the pipeline [216].
Chlorine based disinfectants react with natural organic matter and form the DBP. DBP include THMs (trihalomethanes), HAAs (haloacetic acids), HANs (haloacetonitriles), HNMs (halonitromethanes), HAMs (halogenated acetamides) etc. Aldehydes (ALs) and iodinated DBP cand be formed when water is disinfected by ozone and iodine [217].
The water distribution system is a highly dynamic environment, with changes occurring throughout the whole distribution system. A great attention is given to disinfection by-products in the water treatment plant, but few studies are dedicated to what happens afterwards and how DBP transform in the water distribution system.
Because PVC manufactured pipes are more susceptible to biological film formation, the mathematical model developed for these distribution systems must include the interaction among the organic matter and the disinfection substances.
Models to account for longitudinal dispersion of pollutants in water distribution systems have been developed [218].
For a pipe system coated with cement, mathematical modelling of heavy metals (chromium and lead) release shortly after pipeline operation was studied by accounting for sorption [219,220]. By using this model, the chromium and lead concentrations at pipeline sections can be calculated after rehabilitation by cement lining. The developed mathematical model considers several mechanisms to describe the leaching of chromium and lead: dissolution, diffusion, advective transport and sorption. The sorption included in the model considers the adsorption of heavy metals inside porous cement coatings. The diffusion accounts for chromium and lead transport, in water phase in coating capillaries and in water phase inside the pipe. Experiments were performed in static [219] and in dynamic conditions [220]. Significantly different lead and chromium concentrations near the wall coating compared to the pipeline center, are obtained by including of the diffusive transport in the liquid phase in the mathematical model [219]. The maximum cross sectional average concentration depends on the pipe diameter, a pipe diameter twice as large will result in decreasing by half the maximum cross sectional average concentration.
The experiments performed under dynamic conditions were using fresh water or water replaced periodically [220]. The water was characterized by its pH, alkalinity, and hardness. The calculated and experimental concentrations of lead and chromium were in good agreement. The calculated concentrations corresponding to a pipeline 30 km long reached values that are well below the threshold of the current regulations (2.5 mg/m3 for chromium vs. 25 mg/m3 in regulations and 2 mg/m3 for lead vs. 5 mg/m3 in regulations) [1]. However, these concentrations may occasionally be exceeded in case of water stagnation or if the flowing water is already reach in chromium or lead. The impact of biofilm and DBP formation was neglected in this model.
To prevent unplanned pipe failure, the lifetime of a piping system must be approximated. Because pipes are affected by flowing water, soil, and environmental characteristics, it is difficult to predict what will be the degradation along a pipeline. In this case estimation of probability of failure based on Monte Carlo simulations are of help. This method was applied in the case of AC pipes distribution system [221]. Large experimental data is needed to calculate the degradation rate for different sections of an AC pipe system (different pipe diameter sizes, water with different characteristics from different locations in Thailand). Monte Carlo simulations will provide several failures cases that will allow to schedule a pipe replacement program.
Using 3D computed fluid dynamics calculations, it was studied the influence of pipeline geometry, sampling methods, and the flowing regime on the lead concentration in drinking water [27]. The case includes a system of copper pipes connected by lead-solders and brass valves. It was found that galvanic corrosion takes place when lead is in contact with copper in the presence of the water. The galvanic corrosion is an electrochemical process in which one metal corrodes when is electrically connected with a dissimilar metal in the presence of a conductive liquid. In this case lead is the anode and is corroding while copper being the cathode (Figure 11). In case of stagnant water, the lead concentration is increasing and when the water is used again, concentration peaks of lead in tap water are generated [28]. The model is based on Ohm’s law, Faradays’ law, and polarization theory to predict lead concentration in stagnant water, after a given time. The model does not include the effect of pH, temperature, and the concentration of organic matters and inorganic matters. To be used for modelling studies using water with different properties, the model must be adapted. The additional mass transport equations must be included to adapt the model to water flowing conditions. This model cand be however adapted to explore the effect of other pipe materials such as iron or stainless steel.
The copper release in drinking water is controlled by the acidity of the flowing water rather than by the concentration of dissolved oxygen [85]. In stagnant water, copper corrosion and therefore copper release in the drinking water is enhanced by the presence of the hydrogen ions which in turn increases the consumption of the dissolved oxygen. The kinetic modelling of dissolved oxygen consumption rate evidenced that for new pipes and low carbonate concentration, a zero-order linear kinetic rate law is describing well the experimental data. For aged copper the kinetics of dissolved oxygen consumption is better described by a first order kinetic rate law.
6. Conclusions
Metal based pipes form scale which contains and accumulate from environment heavy metals (e.g., lead, vanadium, chromium, copper, arsenic, zinc, cadmium, manganese). The scales can detach and end up in the flowing water. Cement based pipes release chemicals after commissioning. Calcium, aluminium, chromium, lead, and cadmium are the main ions released by cement containing pipes. In the case of asbestos containing cement pipes, asbestos fibbers can be released in the drinking water. Polymeric pipes are susceptible to release organoleptic substances (generated during the manufacture process) within firsts weeks after the commissioning.
The efficiency of disinfection process depends on the pipe material. Metallic pipes (e.g., copper) may require a higher concentration of disinfectant. As regarding the corrosion process, there is a clear advantage of polymeric based pipes versus metal based pipes. The polymeric pipes do not develop scale deposits. They are however subjected to degradation by chain scission, in the presence of water disinfectants that generate free radicals (e.g., ClO2).
All types of pipes develop biofilm on their surface. This biofilm retains and accumulates microplastic and compounds from water. Also, the biofilm accelerates the proliferation of opportunistic pathogens and bacteria. When changing the flow conditions or water parameters, the biofilm can detach, causing an instant increase of some compounds concentrations that may pose a health risk (especially heavy metals and microplastic). Microorganism present in the biofilm enhance metal based pipes corrosion (microbiologically induced corrosion) making them even more vulnerable to mechanical failure and accelerating the release of dangerous compounds in the drinking water.
Changing from flowing to stagnant conditions will cause an enhanced corrosion of metal based pipes. For the polymeric pipes there are no studies that discuss this aspect, but it is expected that the stagnant conditions will affect the microorganisms community in the biofilm.
Author Contributions
Conceptualization, D.S.S. and M.B.; methodology, G.T.; formal analysis, D.S.S.; investigation, M.B. and G.T.; resources, D.S.S.; writing—original draft preparation, M.B.; writing—review and editing, D.S.S. and M.B.; visualization, G.T.; supervision, D.S.S. and M.B.; funding acquisition, D.S.S. All authors have read and agreed to the published version of the manuscript.
Funding
This research received no external funding.
Conflicts of Interest
The authors declare no conflict of interest.
References
- DIRECTIVE (EU) 2020/2184 OF THE EUROPEAN PARLIAMENT AND OF THE COUNCIL of 16 December 2020. Available online: https://eur-lex.europa.eu/legal-content/EN/TXT/PDF/?uri=CELEX:32020L2184 (accessed on 8 June 2023).
- Prest, E.I.; Hammes, F.; van Loosdrecht, M.C.M.; Vrouwenvelder, J.S. Biological Stability of Drinking Water: Controlling Factors, Methods, and Challenges. Front. Microbiol. 2016, 7, 45. [Google Scholar] [CrossRef]
- Simoes, L.C.; Simoes, M.; Oliveira, R.; Vieira, M.J. Potential of the adhesion of bacteria isolated from drinking water to materials. J. Basic Microbiol. 2007, 47, 174–183. [Google Scholar] [CrossRef] [PubMed]
- Douterelo, I.; Sharpe, R.; Boxall, J. Bacterial community dynamics during the early stages of biofilm formation in a chlorinated experimental drinking water distribution system: implications for drinking water discolouration. J. Appl. Microbiol. 2014, 117, 286–301. [Google Scholar] [CrossRef]
- Liu, Y.; Yang, S.-F.; Li, Y.; Xu, H.; Qin, L.; Tay, J.-H. The influence of cell and substratum surface hydrophobicities on microbial attachment. J. Biotechnol. 2004, 110, 251–256. [Google Scholar] [CrossRef]
- Yu, J.; Kim, D.; Lee, T. Microbial diversity in biofilms on water distribution pipes of different materials. Water Sci. Technol. 2010, 61, 163–171. [Google Scholar] [CrossRef]
- Zacheus, O.M.; Iivanainen, E.K.; Nissinen, T.K.; Lehtola, M.J.; Martikainen, P.J. Bacterial biofilm formation on polyvinyl chloride, polyethylene and stainless steel exposed to ozonated water. Water Res. 2000, 34, 63–70. [Google Scholar] [CrossRef]
- Rabin, R. The lead industry and Lead Water Pipes “A MODEST CAMPAIGN. Am. J. Public Health 2008, 98, 1584–1592. [Google Scholar] [CrossRef]
- Dave, D.M.; Yang, M. Lead in drinking water and birth outcomes: A tale of two water treatment plants. J. Health Econ. 2022, 84, 102644. [Google Scholar] [CrossRef] [PubMed]
- Butler, G.; Ison, H.C.K. Corrosion and Its Prevention in Waters; Leonard-Hill: London, 1966; p. 121. [Google Scholar]
- Deshommes, E.; Andrews, R.C.; Gagnon, G.; McCluskey, T.; McIlwain, B.; Dore, E.; Nour, S.; Prevost, M. Evaluation of exposure to lead from drinking water in large buildings. Water Res. 2016, 99, 46–55. [Google Scholar] [CrossRef]
- Dore, E.; Deshommes, E.; Andrews, R.C.; Nour, S.; Prevost, M. Sampling in schools and large institutional buildings: Implications for regulations, exposure and management of lead and copper. Water Res. 2018, 140, 110–122. [Google Scholar] [CrossRef] [PubMed]
- Riblet, C.; Deshommes, E.; Laroche, L.; Prevost, M. True exposure to lead at the tap: Insights from proportional sampling, regulated sampling and water use monitoring. Water Res. 2019, 156, 327–336. [Google Scholar] [CrossRef] [PubMed]
- Fasaee, M.A.K.; Berglund, E.; Pieper, K.J.; Ling, E.; Benham, B.; Edwards, M. Developing a framework for classifying water lead levels at private drinking water systems: A Bayesian Belief Network approach. Water Res. 2021, 189, 116641. [Google Scholar] [CrossRef] [PubMed]
- Rondeau, V.; Jacqmin-Gadda, H.; Commenges, D.; Helmer, C.; Dartigues, J.F. Aluminum and Silica in Drinking Water and the Risk of Alzheimer’s Disease or Cognitive Decline: Findings From 15-Year Follow-up of the PAQUID Cohort. Am. J. Epidemiol. 2009, 169, 489–496. [Google Scholar] [CrossRef] [PubMed]
- Browne, M.L.; Varadarajulu, D.; Lewis-Michl, E.L.; Fitzgerald, E F. Cancer incidence and asbestos in drinking water, Town of Woodstock, New York, 1980–1998. Environ. Res. 2005, 98, 224–232. [Google Scholar] [CrossRef]
- Kjærheim, K.; Ulvestad, B.; Martinsen, J.I.; Andersen, A. Cancer of the gastrointestinal tract and exposure to asbestos in drinking water among lighthouse keepers (Norway). Cancer Causes Control 2005, 16, 593–598. [Google Scholar] [CrossRef]
- Xu, P.; Huang, S.; Wang, Z.; Lagos, G. Daily intakes of copper, zinc and arsenic in drinking water by population of Shanghai, China. Sci. Total Environ. 2006, 362, 50–55. [Google Scholar] [CrossRef]
- Mitra, S.; Chakraborty, A.J.; Tareq, A.M.; Emran, T.B.; Nainu, F.; Khusro, A.; Idris, A.M.; Khandaker, M.U.; Osman, H.; Alhumaydhi, F.A.; et al. Impact of heavy metals on the environment and human health: Novel therapeutic insights to counter the toxicity. J. King Saud Univ. Sci. 2022, 34, 101865. [Google Scholar] [CrossRef]
- Bhat, R.A.; Bakhshalizadeh, S.; Guerrera, M.C.; Kesbiç, O.S.; Fazio, F. Toxic effect of heavy metals on ovarian deformities, apoptotic changes, oxidative stress, and steroid hormones in rainbow trout. J. Trace Elem. Med. Biol. 2023, 75, 127106. [Google Scholar] [CrossRef]
- Li, D.; Pan, B.; Han, X.; Lu, Y.; Wang, X. Toxicity risks associated with trace metals call for conservation of threatened fish species in heavily sediment-laden Yellow River. J. Hazard. Mater. 2023, 448, 130928. [Google Scholar] [CrossRef]
- Patle, A.; Kurrey, R.; Deb, M.K.; Patle, T.K.; Sinha, D.; Shrivas, K. Analytical approaches on some selected toxic heavy metals in the environment and their socio-environmental impacts: A meticulous review. J. Indian Chem. Soc. 2022, 99, 100545. [Google Scholar] [CrossRef]
- Rehman, A.U.; Nazir, S.; Irshad, R.; Tahir, K.; ur Rehman, K.; Islamb, R.U.; Wahab, Z. Toxicity of heavy metals in plants and animals and their uptake by magnetic iron oxide nanoparticles. J. Mol. Liq. 2021, 321, 114455. [Google Scholar] [CrossRef]
- Wang, Y.; Jing, H.; Mehta, V.; Welter, G.J.; Giammar, D.E. Impact of galvanic corrosion on lead release from aged lead service lines. Water Res. 2012, 46, 5049–5060. [Google Scholar] [CrossRef] [PubMed]
- Lytle, D.A.; Schock, M.R.; Triantafyllidou, S. Identify Lead Plumbing Sources to Protect Public Health. Opflow 2018, 44, 16–20. [Google Scholar] [CrossRef]
- Snoeyink, V.L.; Tang, M.; Lytle, D.A. Lead pipe and lead–tin solder scale formation and structure: A conceptual model. AWWA Wat. Sci. 2021, 3, e1246. [Google Scholar] [CrossRef]
- Chang, L. Effects of pipeline geometry, sample volume, and flow rate on Pb monitoring outcomes in copper pipe drinking water supply systems. Water Res. 2022, 222, 118890. [Google Scholar] [CrossRef]
- Chang, L.; Lee, J.H.W.; Fung, Y.S. Prediction of lead leaching from galvanic corrosion of lead-containing components in copper pipe drinking water supply systems. J. Hazard. Mater. 2022, 436, 129169. [Google Scholar] [CrossRef]
- Ng, D.Q.; Liu, S.W.; Lin, Y.P. Lead as a legendary pollutant with emerging concern: Survey of lead in tap water in an old campus building using four sampling methods. Sci. Total Environ. 2018, 636, 1510–1516. [Google Scholar] [CrossRef]
- Cartier, C.; Dore, E.; Laroche, L.; Nour, S.; Edwards, M.; Prevost, M. Impact of treatment on Pb release from full and partially replaced harvested Lead Service Lines (LSLs). Water Res. 2013, 47, 661–671. [Google Scholar] [CrossRef]
- Triantafyllidou, S.; Edwards, M. Lead (Pb) in Tap Water and in Blood: Implications for Lead Exposure in the United States. Crit. Rev. Environ. Sci. Technol. 2012, 42, 1297–1352. [Google Scholar] [CrossRef]
- DeSantis, M.K.; Triantafyllidou, S.; Schock, M.; Lytle, D.A. Mineralogical evidence of galvanic corrosion in drinking water lead pipe joints. Environ. Sci. Technol. 2018, 52, 3365–3374. [Google Scholar] [CrossRef]
- Kim, E.J.; Herrera, J.E.; Huggins, D.; Braam, J.; Koshowski, S. Effect of pH on the concentrations of lead and trace contaminants in drinking water: A combined batch, pipe loop and sentinel home study. Water Res. 2011, 45, 2763–2774. [Google Scholar] [CrossRef] [PubMed]
- Noel, J.D.; Wang, Y.; Giammar, D.E. Effect of water chemistry on the dissolution rate of the lead corrosion product hydrocerussite. Water Res. 2014, 54, 237–246. [Google Scholar] [CrossRef] [PubMed]
- Triantafyllidou, S.; Burkhardt, J.; Tully, J.; Cahalan, K.; DeSantis, M.; Lytle, D.; Schock, M. Variability and sampling of lead (Pb) in drinking water: Assessing potential human exposure depends on the sampling protocol. Environ Int. 2021, 146, 106259. [Google Scholar] [CrossRef] [PubMed]
- Maheshwari, A.; Abokifa, A.; Gudi, R.D.; Biswas, P. Optimization of disinfectant dosage for simultaneous control of lead and disinfection-byproducts in water distribution networks. J. Environ. Manage. 2020, 276, 111186. [Google Scholar] [CrossRef]
- Stets, E.G.; Lee, C.J.; Lytle, D.A.; Schock, M.R. Increasing chloride in rivers of the conterminous U.S. and linkages to potential corrosivity and lead action level exceedances in drinking water. Sci. Total Environ. 2018, 613–614, 1498–1509. [Google Scholar] [CrossRef]
- Lytle, D.A.; Schock, M.R.; Formal, C.; Bennett-Stamper, C.; Harmon, S.; Nadagouda, M.N.; Williams, D.; DeSantis, M.K.; Tully, J.; Pham, M. Lead Particle Size Fractionation and Identification in Newark, New Jersey’s Drinking Water. Environ. Sci. Technol. 2020, 54, 13672–13679. [Google Scholar] [CrossRef]
- Kim, E.J.; Herrera, J.E. Characteristics of Lead Corrosion Scales Formed during Drinking Water Distribution and Their Influence on the Release of Lead and Other Contaminants. Environ. Sci. Technol. 2010, 44, 6054–6061. [Google Scholar] [CrossRef]
- Gerke, T.L.; Scheckel, K.G.; Schock, M.R. Identification and Distribution of Vanadinite (Pb5(V5+O4)3Cl) in Lead Pipe Corrosion By-Products. Environ. Sci. Technol. 2009, 43, 4412–4418. [Google Scholar] [CrossRef]
- Schock, M.R.; Cantor, A.F.; Triantafyllidou, S.; Desantis, M.K.; Scheckel, K.G. Importance of pipe deposits to Lead and Copper Rule compliance. J. Am. Water Works Assoc. 2014, 106, 336–349. [Google Scholar] [CrossRef]
- Harmon, S.M.; Tully, J.; DeSantis, M.K.; Schock, M.R.; Triantafyllidou, S.; Lytle, D.A. A holistic approach to lead pipe scale analysis: Importance, methodology, and limitations. AWWA Wat. Sci. 2022, 1278. [Google Scholar] [CrossRef]
- Bradham, K.D.; Nelson, C.M.; Sowers, T.D.; Lytle, D.A.; Tully, J.; Schock, M.R.; Li, K.; Blackmon, M.D.; Kovalcik, K.; Cox, D.; et al. A national survey of lead and other metal(loids) in residential drinking water in the United States. J. Expo. Sci. Environ. Epidemiol. 2023, 33, 160–167. [Google Scholar] [CrossRef] [PubMed]
- Triantafyllidou, S.; Schock, M.R.; DeSantis, M.K.; White, C. Low Contribution of PbO2-Coated Lead Service Lines to Water Lead Contamination at the Tap. Environ. Sci. Technol. 2015, 49, 3746–3754. [Google Scholar] [CrossRef] [PubMed]
- Available online: https://www.lenntech.com/periodic/water/lead/lead-and-water.htm (accessed on 3 July 2023).
- Bisogni, J.J.; Nassar, I.S.; Menegaux, A.M. Effect of calcium on lead in soft-water distribution systems. J. Environ. Eng. 2000, 126, 475–478. [Google Scholar] [CrossRef]
- Trueman, B.F.; Gagnon, G.A. A new analytical approach to understanding nanoscale lead-iron interactions in drinking water distribution systems. J. Hazard. Mater. 2016, 311, 151–157. [Google Scholar] [CrossRef] [PubMed]
- DeSantis, M.K.; Schock, M.R.; Tully, J.; Bennett-Stamper, C. Orthophosphate Interactions with Destabilized PbO2 Scales. Environ. Sci. Technol. 2020, 54, 14302–14311. [Google Scholar] [CrossRef]
- Touvinen, O.H.; Button, K.S.; Vuorinen, A.; Carlson, L.; Mair, D.M.; Yut, L.A. Bacterial, chemical, and mineralogical characteristics of tubercles in distribution pipelines. J. Am. Water Works Assoc. 1980, 72, 626–635. [Google Scholar] [CrossRef]
- Katner, A.; Pieper, K.; Brown, K.; Lin, H.Y.; Parks, J.; Wang, X.; Hu, C.Y.; Masters, S.; Mielke, H.; Edwards, M. Effectiveness of Prevailing Flush Guidelines to Prevent Exposure to Lead in Tap Water. Int. J. Environ. Res. Public Health 2018, 15, 1537. [Google Scholar] [CrossRef]
- Tully, J.; DeSantis, M.K.; Schock, M.R. Water quality–pipe deposit relationships in Midwestern lead pipes. AWWA Wat. Sci. 2019, 1, e1127. [Google Scholar] [CrossRef]
- Wasserstrom, L.W.; Miller, S.A.; Triantafyllidou, S.; DeSantis, M.K.; Schock, M.R. Scale Formation Under Blended Phosphate Treatment for a Utility With Lead Pipes. J. Am. Water Works Assoc. 2017, 109, E464–E478. [Google Scholar] [CrossRef]
- Available online: https://www.rinkerpipe.com/a-complete-guide-to-reinforced-concrete-pipe/ (accessed on 15 July 2023).
- Meland, I.S. Durability of mortar linings in ductile iron pipes. In: Durability of building materials and components. In Proceedings of the eighth international conference on durability of building materials and components, Vancouver, Canada, 30 May–3 June 1999; pp. 170–179. [Google Scholar]
- Cunningham, H.M.; Pontefract, R. Asbestos fibres in beverages and drinking water. Nature 1971, 232, 332–333. [Google Scholar] [CrossRef]
- Webber, J.S.; Syrotynski, S.; King, M.V. Asbestos-Contaminated Drinking Water: Its Impact on Household Air. Environ. Res. 1988, 46, 153–167. [Google Scholar] [CrossRef] [PubMed]
- Zavasnik, J.; Sestan, A.; Skapin, S. Degradation of asbestos – Reinforced water supply cement pipes after a long-term operation. Chemosphere 2022, 287, 131977. [Google Scholar] [CrossRef] [PubMed]
- Mager, S.; Knopick, M.; Oddy, G. The concentration and prevalence of asbestos fibres in Christchurch, New Zealand’s drinking water supply. Water Supply 2022, 22, 4445. [Google Scholar] [CrossRef]
- Mindess, S.; Young, F. Concrete; Prentice-Hall: New Jersey, USA, 1981; p. 671. [Google Scholar]
- Kosmatka, S.; Panarese, W. Design and Control of Concrete Mixes; Portland Cement Association: New Jersey, USA, 1988; p. 205. [Google Scholar]
- Liu, M.; Zhao, Y.; Yu, Z.; Cao, Z. Binding of Cu(II) and Zn(II) in Portland cement immobilization systems: Effect of C-A-S-H composition. Cem. Concr. Compos. 2022, 131, 104602. [Google Scholar] [CrossRef]
- AI-Adeeb, A.M.; Mattit, M.A. Int. J. Cem. Compos. Lightweight Concr. 1984, 6, 233–240. [CrossRef]
- Zielina, M.; Dabrowski, W.; Radziszewska-Zielina, E. Cement Mortar Lining as a Potential Source of Water Contamination. Int. J. Environ. Ecol. Eng. 2014, 8, 723–726. [Google Scholar]
- Młyńska, A.; Zielina, M. The influence of prefabricated pipe cement coatings and those made during pipe renovation on drinking water quality. E3S web of conferences, 9th conference on interdisciplinary problems in environmental protection and engineering EKO-DOK, Boguszów-Gorce, Poland, 23–25 April 2017. [Google Scholar]
- Młyńska, A.; Zielina, M. A comparative study of Portland cements CEM I used for water pipe renovation in terms of pollutants leaching from cement coatings and their impact on water quality. J. Water Supply Res. Technol. AQUA 2018, 67, 685–696. [Google Scholar] [CrossRef]
- Achternbosch, M.; Brautigam, K.R.; Hartlieb, N.; Kupsch, C.; Richers, U.; Stemmermann, P. Heavy metals in cement and concrete resulting from the co-incineration of wastes in cement kilns with regard to the legitimacy of waste utilisation. Umweltforschungsplan Des Bundesministeriums Für Umwelt, Naturschutz und Reaktorsicherheit, Förderkennzeichen (UFOPLAN No.) 200 33 335. Forschungszentrum Karlsruhe; 2003.
- Husillos Rodríguez, N.; Martínez-Ramírez, S.; Blanco-Varela, M.T.; Donatello, S.; Guillem, M.; Puig, J.; Fos, C.; Larrotcha, E.; Flores, J. The effect of using thermally dried sewage sludge as an alternative fuel on Portland cement clinker production. J. Clean. Prod. 2013, 52, 94–102. [Google Scholar] [CrossRef]
- Horsley, C.; Emmert, M.H.; Sakulich, A. Influence of alternative fuels on trace element content of ordinary portland cement. Fuel 2016, 184, 481–489. [Google Scholar] [CrossRef]
- Guo, X.; Yuan, S.; Xu, Y.; Qian, G. Effects of phosphorus and iron on the composition and property of Portland cement clinker utilized incinerated sewage sludge ash. Constr. Build. Mater. 2022, 341, 127754. [Google Scholar] [CrossRef]
- Mlynska, A.; Zielina, M.; Bielski, A. Contamination of drinking water soon after cement mortar lining renovation depending on the disinfectant doses. SN Appl. Sci. 2019, 1, 516. [Google Scholar] [CrossRef]
- Ekström, T. Leaching of concrete: Experiments and Modelling, Licentiate Thesis, Lund University, Division of Building Materials, 2001. [Google Scholar]
- Ismail, M.; Toumi, A.; François, R.; Gagné, R. Effect of crack opening on the local diffusion of chloride in inert materials. Cem. Concr. Res. 2004, 34, 711–716. [Google Scholar] [CrossRef]
- Li, G.; Yang, B.; Guo, C.; Du, J.; Xiaosuo, Wu. Time dependence and service life prediction of chloride resistance of concrete coatings. Constr. Build. Mater. 2015, 83, 19–25. [Google Scholar] [CrossRef]
- Zhang, J.; Bian, F.; Zhang, Y.; Fang, Z.; Fu, C.; Guo, J. Effect of pore structures on gas permeability and chloride diffusivity of concrete. Constr Build Mater. 2018, 163, 402–413. [Google Scholar] [CrossRef]
- Hassani, M.S.; Asadollahfardi, G.; Saghravani, S.F.; Sahar Jafari, S.; Peighambarzadeh, F.S. The difference in chloride ion diffusion coefficient of concrete made with drinking water and wastewater. Constr Build Mater. 2020, 231, 117182. [Google Scholar] [CrossRef]
- Wang, Y.; Liu, Z.; Fu, K.; Li, O.; Wang, Y. Experimental studies on the chloride ion permeability of concrete considering the effect of freeze–thaw damage. Constr Build Mater. 2020, 236, 117556. [Google Scholar] [CrossRef]
- Setunge, S.; Nguyen, N.; Alexander, B.L.; Dutton, L. Leaching of Alkali from Concrete in Contact with Waterways. Water Air Soil Pollut.: Focus 2009, 9, 381–391. [Google Scholar] [CrossRef]
- Abdulla, N.A. Concrete filled PVC tube: A review. Constr. Build. Mater. 2017, 156, 321–329. [Google Scholar] [CrossRef]
- Du, T.; Li, C.; Wang, X.; Ma, L.; Qu, F.; Wang, B.; Peng, J.; Li, W. Effects of pipe diameter, curing age and exposure temperature on chloride diffusion of concrete with embedded PVC pipe. J. Build. Eng. 2022, 57, 104957. [Google Scholar] [CrossRef]
- Cui, Y.; Liu, S.; Smith, K.; Hu, H.; Tang, F.; Li, Y.; Yu, K. Stainless steel corrosion scale formed in reclaimed water: Characteristics, model for scale growth and metal element release. J. Environ. Sci. 2016, 48, 79–91. [Google Scholar] [CrossRef]
- Merkel, T.H.; Pehkonen, S.O. General corrosion of copper in domestic drinking water installations: scientific background and mechanistic understanding. Corros. Eng. Sci. Technol. 2006, 41, 21–37. [Google Scholar] [CrossRef]
- Al-Roomi, Y.M.; Hussain, K.F.; Al-Rifaie, M. Performance of inhibitors on CaCO3 scale deposition in stainless steel & copper pipe surface. Desalination 2015, 375, 138–148. [Google Scholar] [CrossRef]
- Zhao, L.; Liu, D.; Zhang, H.; Wang, J.; Zhang, X.; Liu, S.; Chen, C. Study on electrochemical reduction mechanisms of iron oxides in pipe scale in drinking water distribution system. Water Res. 2023, 231, 119597. [Google Scholar] [CrossRef]
- Schock, M.R.; Lytle, D.A.; Clement, J.A. Effect of pH, DIC, Orthophosphate and Sulfate on Drinking Water Cuprosolvency. EPA/600/R-95/085. USEPA, Office of Research and Development, Cincinnati. 1995. [Google Scholar]
- Vargas, I.T.; Alsina, M.A.; Pastén, P.A.; Pizarro, G.E. Influence of solid corrosion by-products on the consumption of dissolved oxygen in copper pipes. Corros. Sci. 2009, 51, 1030–1037. [Google Scholar] [CrossRef]
- Shalaby, H.M.; Al-Kharafi, F.M.; Gouda, V.K. .A Morphological Study of Pitting Corrosion of Copper in Soft Tap Water. Corros. 1989, 45, 536–547. [Google Scholar] [CrossRef]
- Dartmann, J.; Sadlowsky, B.; Dorsch, T.; Johannsen, K. Copper corrosion in drinking water systems – effect of pH and phosphate-dosage. Mater. Corros. 2010, 61, 189–198. [Google Scholar] [CrossRef]
- Boulay, N.; Edwards, M. Role of temperature, chlorine, and organic matter in copper corrosion by-product release in soft water. Water Res. 2001, 35, 683–690. [Google Scholar] [CrossRef]
- Edwards, M.; Dudi, A. Role of chlorine and chloramine in corrosion of lead bearing plumbing materials. J. Am. Water Work. Assoc. 2004, 96, 69–81. [Google Scholar] [CrossRef]
- Edwards, M.; Hidmi, L.; Gladwell, D. Phosphate inhibition of soluble copper corrosion by-product release. Corros. Sci. 2002, 44, 1057–1071. [Google Scholar] [CrossRef]
- Lytle, D.A.; Schock, M.R.; Leo, J.; Barnes, B. A Model for Estimating the Impact of Orthophosphate on Copper in Water. J. Am. Water Works Assoc. 2018, 110, 1–15. [Google Scholar] [CrossRef]
- Walker, J.T.; Dowsett, A.B.; Dennis, P.J.L.; Keevil, C.W. Continuous culture studies of biofilm associated with copper corrosion, Int. Biodeter. 1991, 27, 121–134. [Google Scholar] [CrossRef]
- Wagner, D.; Chamberlain, A.H.L. Microbiologically influenced copper corrosion in potable water with emphasis on practical relevance. Biodegradation 1997, 8, 177–187. [Google Scholar] [CrossRef]
- Keevil, C.W. The physico-chemistry of biofilm-mediated pitting corrosion of copper pipe supplying potable water. Water Sci. Technol. 2004, 49, 91–98. [Google Scholar] [CrossRef]
- Reyes, A.; Letelier, M.V.; De la Iglesia, R.; Gonzalez, B.; Lagos, G. Microbiologically induced corrosion of copper pipes in low-pH water. Int. biodeterior. biodegrad. 2008, 61, 135–141. [Google Scholar] [CrossRef]
- Olivares, T.E.; Cienfuegos, R.; Vargas, I.T.; Pizarro, G.E. Experimental evidence for enhanced copper release from domestic copper plumbing under hydrodynamic control. Corros. Sci. 2014, 80, 473–481. [Google Scholar] [CrossRef]
- Ng, D.Q.; Lin, Y.P. Evaluation of Lead Release in a Simulated Lead-Free Premise Plumbing System Using a Sequential Sampling Approach. Int. J. Environ. Res. Public Health 2016, 13, 266. [Google Scholar] [CrossRef] [PubMed]
- Shull, K.E. An experimental approach to corrosion control, J. Am. Water Works Assoc. 1980, 72, 280–285. [Google Scholar] [CrossRef]
- Hem, L.J.; Vik, E.A.; Bjornson-Langen, A. Water treatment to reduce internal corrosion in the drinking water distribution system in Oslo. Water Sci. Technol. Water Supply 2001, 1, 91–96. [Google Scholar] [CrossRef]
- Tang, Z.; Hong, S.; Xiao, W.; Taylor, J. Characteristics of iron corrosion scales established under blending of ground, surface, and saline waters and their impacts on iron release in the pipe distribution system. Corros. Sci. 2006, 48, 322–342. [Google Scholar] [CrossRef]
- Fabbricino, M.; Korshin, G.V. Changes of the corrosion potential of iron in stagnation and flow conditions and their relationship with metal release. Water Res. 2014, 62, 136–146. [Google Scholar] [CrossRef]
- Zhang, X.; Mi, Z.; Wang, Y.; Liu, S.; Niu, Z.; Lu, P.; Wang, J.; Gu, J.; Chen, C. A red water occurrence in drinking water distribution systems caused by changes in water source in Beijing, China: mechanism analysis and control measures. Front. Environ. Sci. Eng. 2014, 8, 417–426. [Google Scholar] [CrossRef]
- Yang, F.; Shi, B.; Bai, Y.; Sun, H.; Lytle, D.A.; Wang, D. Effect of sulfate on the transformation of corrosion scale composition and bacterial community in cast iron water distribution pipes. Water Res. 2014, 59, 46–57. [Google Scholar] [CrossRef] [PubMed]
- Li, D.; Zhuang, Y.; Hua, Y.; Shi, B. Impact of initial chlorine concentration on water quality change in old unlined iron pipes. Water Res. 2022, 225, 119146. [Google Scholar] [CrossRef] [PubMed]
- Internal Corrosion of Water Distribution Systems, second ed., AWWA Research Foundation, DVGW-Technologiezentrum Wasser, Denver, USA, 1996; pp. 430.
- Oh, S.J.; Kwon, S.-J.; Lee, J.-Y.; Yoo, J.-Y.; Choo, W.-Y. Oxidation of Fe2+ ions in sulfate- and chloride-containing aqueous medium. Corros. 2002, 58, 498–504. [Google Scholar] [CrossRef]
- McNeill, L.S.; Edwards, M. Iron pipe corrosion in distribution systems. J. Am. Water Works Assoc. 2001, 93, 88–100. [Google Scholar] [CrossRef]
- Peng, C.Y.; Ferguson, J.F.; Korshin, G.V. Effects of chloride, sulfate and natural organic matter (NOM) on the accumulation and release of trace-level inorganic contaminants from corroding iron. Water Res. 2013, 47, 5257–5269. [Google Scholar] [CrossRef]
- Sachan, R.; Singh, A.K.; Negi, Y.S. Study of Microbially Influenced Corrosion in the Presence of Iron-Oxidizing Bacteria (Strain DASEWM2). J. Bio- Tribo-Corros. 2020, 6, 109. [Google Scholar] [CrossRef]
- He, N.; Tian, Y.; Liu, C.; Zhao, W.; Liu, R.; Huang, J. Accumulation of vanadium and arsenic by cast iron pipe scales under drinking water conditions: A batch study. Chemosphere 2021, 269, 129396. [Google Scholar] [CrossRef]
- Kuch, A. Investigations of the reduction and re-oxidation kinetics of iron (III) oxide scales formed in waters. Corros. Sci. 1988, 28, 221–231. [Google Scholar] [CrossRef]
- Lin, X.; Xu, Q.; Li, Y.; Zhao, B.; Li, L.; Qiang, Z. Modeling iron release from cast iron pipes in an urban water distribution system caused by source water switch. J. Environ. Sci. 2021, 110, 73–83. [Google Scholar] [CrossRef]
- Qiu, W.; Li, W.; He, J.; Zhao, H.; Liu, X.; Yuan, Y. Variations regularity of microorganisms and corrosion of cast iron in water distribution system. J. Environ. Sci. 2018, 74, 177–185. [Google Scholar] [CrossRef] [PubMed]
- Tian, Y.; Peng, Z.; Liua, Y.; Jia, S.; Shen, H.; Zhao, W. Characteristics of vanadium release from layered steel pipe scales to bulk, steady, and occluded water in drinking water distribution systems. Sci. Total Environ. 2022, 838, 156465. [Google Scholar] [CrossRef] [PubMed]
- Gerke, T.L.; Scheckel, K.G.; Maynard, J.B. Speciation and distribution of vanadium in drinking water iron pipe corrosion by-products. Sci. Total Environ. 2010, 408, 5845–5853. [Google Scholar] [CrossRef] [PubMed]
- Tian, Y.; Yu, T.; Shen, Y.; Zheng, G.; Li, H.; Zhao, W. Cr release after Cr(III) and Cr(VI) enrichment from different layers of cast iron corrosion scales in drinking water distribution systems: the impact of pH, temperature, sulfate, and chloride. Environ. Sci. Pollut. Res. 2022, 29, 18778–18792. [Google Scholar] [CrossRef] [PubMed]
- Zhang, S.; Tian, Y.; Guo, Y.; Shan, J.; Liu, R. Manganese release from corrosion products of cast iron pipes in drinking water distribution systems: Effect of water temperature, pH, alkalinity, concentration and disinfectants. Chemosphere 2021, 262, 127904. [Google Scholar] [CrossRef] [PubMed]
- Yang, F.; Shi, B.; Gu, J.; Dongsheng Wang, D.; Yang, M. Morphological and physicochemical characteristics of iron corrosion scales formed under different water source histories in a drinking water distribution system. Water Res. 2012, 46, 5423–5433. [Google Scholar] [CrossRef] [PubMed]
- Zhang, H.; Liu, D.; Zhao, L.; Wang, J.; Xie, S.; Liu, S.; Lin, P.; Zhang, X.; Chen, C. Review on corrosion and corrosion scale formation upon unlined cast iron pipes in drinking water distribution systems. J. Environ. Sci. 2022, 117, 173–189. [Google Scholar] [CrossRef]
- Zhang, H.; Zhao, L.; Liu, D.; Wang, J.; Zhang, X.; Chen, C. Early period corrosion and scaling characteristics of ductile iron pipe for ground water supply with sodium hypochlorite disinfection. Water Res. 2020, 176, 115742. [Google Scholar] [CrossRef] [PubMed]
- Li, C.; Wang, D.; Xu, X.; Wang, Z. Formation of known and unknown disinfection by-products from natural organic matter fractions during chlorination, chloramination, and ozonation. Sci. Total Environ., 2017, 587–588, 177–184. [Google Scholar] [CrossRef]
- Postigo, C.; Emiliano, P.; Barceló, D.; Valero, F. Chemical characterization and relative toxicity assessment of disinfection byproduct mixtures in a large drinking water supply network. J. Hazard. Mater., 2018, 359, 166–173. [Google Scholar] [CrossRef]
- Chaukura, N.; Marais, S.S.; Moyo, W.; Mbali, N.; Thakalekoala, L.C.; Ingwani, T.; Mamba, B.B.; Jarvis, P.; Nkambule, T.T.I. Contemporary issues on the occurrence and removal of disinfection byproducts in drinking water - A review. J. Environ. Chem. Eng. 2020, 8, 103659. [Google Scholar] [CrossRef]
- Richardson, S.D.; Plewa, M.J. To regulate or not to regulate? What to do with more toxic disinfection by-products? J. Environ. Chem. Eng. 2020, 8, 103939. [Google Scholar] [CrossRef]
- Qi, P.; Li, T.; Hu, C.; Li, Z.; Bi, Z.; Chen, Y.; Zhou, H.; Su, Z.; Li, X.; Xing, X.; et al. Effects of cast iron pipe corrosion on nitrogenous disinfection by-products formation in drinking water distribution systems via interaction among iron particles, biofilms, and chlorine. Chemosphere 2022, 292, 133364. [Google Scholar] [CrossRef]
- Sontheimer, H.; Kolle, W.; Snoeyink, V.L. Siderite model of the formation of corrosion-resistant scales. J. Am. Water Works Assoc. 1981, 73, 572–579. [Google Scholar] [CrossRef]
- Li, M.; Liu, Z.; Chen, Y.; Hai, Y. Characteristics of iron corrosion scales and water quality variations in drinking water distribution systems of different pipe materials. Water Res. 2016, 106, 593–603. [Google Scholar] [CrossRef] [PubMed]
- Christensen, S.C.B.; Nissen, E.; Arvin, E.; Albrechtsen, H.-J. Distribution of Asellus aquaticus and microinvertebrates in a non-chlorinated drinking water supply system–Effects of pipe material and sedimentation. Water Res. 2011, 45, 3215–3224. [Google Scholar] [CrossRef] [PubMed]
- Tong, H.; Zhao, P.; Zhang, H.; Tian, Y.; Chen, X.; Zhao, W.; Li, M. Identification and characterization of steady and occluded water in drinking water distribution systems. Chemosphere 2015, 119, 1141–1147. [Google Scholar] [CrossRef]
- Tian, Y.; Li, J.; Jia, S.; Zhao, W. Co-release potential and human health risk of heavy metals from galvanized steel pipe scales under stagnation conditions of drinking water. Chemosphere 2021, 267, 129270. [Google Scholar] [CrossRef]
- Vasyliev, G.; Chyhryn, O. Improving mild steel corrosion resistance in tap water: Influence of water flow and supply rates. Materials Today: Proceedings 2022, 50, 452–455. [Google Scholar] [CrossRef]
- Tang, F.; Chen, G.; Brow, R.K. Chloride-induced corrosion mechanism and rate of enamel- and epoxy-coated deformed steel bars embedded in mortar. Cem. Concr. Res. 2016, 82, 58–73. [Google Scholar] [CrossRef]
- Xiong, J.; Zhu, J.; He, Y.; Ren, S.; Huang, W.; Lu, F. The application of life cycle assessment for the optimization of pipe materials of building water supply and drainage system. Sustain. Cities Soc. 2020, 60, 102267. [Google Scholar] [CrossRef]
- Anselme, C.; Guyen, N.; Bruchet, A.; Mallevialle, J. Characterization of low molecular weight products desorbed from polyethylene tubings. Sci. Total Environ. 1985, 47, 371–384. [Google Scholar] [CrossRef]
- Denberg, M.; Mosbæk, H.; Hassager, O.; Arvin, E. Determination of the concentration profile and homogeneity of antioxidants and degradation products in a cross-linked polyethylene type A (PEXa) pipe. Polym. Test. 2009, 28, 378–385. [Google Scholar] [CrossRef]
- Yan, X.; Lin, T.; Wang, X.; Zhang, S.; Zhou, K. Effects of pipe materials on the characteristic recognition, disinfection byproduct formation, and toxicity risk of pipe wall biofilms during chlorination in water supply pipelines. Water Res. 2022, 210, 117980. [Google Scholar] [CrossRef] [PubMed]
- Corfitzen, C.B. Investigation of aftergrowth potential of polymers for use in drinking water distribution: Factors affecting migration of bioavailable compounds investigated by batch set-ups and continuous flow model systems. DTU Environment 2004. [Google Scholar]
- Ryssel, S.T.; Arvin, E.; Holten Lützhøft, H.–C.; Olsson, M.E.; Prochazkova, Z.; Albrechtsen, H.-J. Degradation of specific aromatic compounds migrating from PEX pipes into drinking water. Water Res. 2015, 81, 269–278. [Google Scholar] [CrossRef] [PubMed]
- Wang, J.; Yan, H.; Xin, K.; Tao, T. Iron stability on the inner wall of prepared polyethylene drinking pipe: Effects of multi-water quality factors. Sci. Total Environ. 2019, 658, 1006–1012. [Google Scholar] [CrossRef]
- Braga, A.S.; Filion, Y. The interplay of suspended sediment concentration, particle size and fluid velocity on the rapid deposition of suspended iron oxide particles in PVC drinking water pipes. Water Res. 2022, X 15, 100143. [Google Scholar] [CrossRef]
- Cerrato, J.M.; Reyes, L.P.; Alvarado, C.N.; Dietrich, A.M. Effect of PVC and iron materials on Mn(II) deposition in drinking water distribution systems. Water Res. 2006, 40, 2720–2726. [Google Scholar] [CrossRef]
- Lehtola, M.J.; Laxander, M.; Miettinen, I.T.; Hirvonen, A.; Vartiainen, T.; Martikainen, P.J. The effects of changing water flow velocity on the formation of biofilms and water quality in pilot distribution system consisting of copper or polyethylene pipes. Water Res. 2006, 40, 2151–2160. [Google Scholar] [CrossRef]
- Khan, I.A.; Lee, K.H.; Lee, Y.-S.; Kim, J.-O. Degradation analysis of polymeric pipe materials used for water supply systems under various disinfectant conditions. Chemosphere 2022, 291, 132669. [Google Scholar] [CrossRef]
- Huang, C.K.; Weerasekara, A.; Bond, P.L.; Weynberg, K.D.; Guo, J. Characterizing the premise plumbing microbiome in both water and biofilms of a 50-year-old building. Sci. Total Environ. 2021, 798, 149225. [Google Scholar] [CrossRef]
- Liu, G.; Zhang, Y.; Knibbe, W.-J.; Feng, C.; Liu, W.; Medema, G.; van der Meer, W. Potential impacts of changing supply-water quality on drinking water distribution: A review. Water Res. 2017, 116, 135–148. [Google Scholar] [CrossRef]
- Chen, J.; Li, W.; Tan, Q.; Sheng, D.; Li, Y.; Chen, S.; Zhou, W. Effect of disinfectant exposure and starvation treatment on the detachment of simulated drinking water biofilms. Sci. Total Environ. 2022, 807, 150896. [Google Scholar] [CrossRef] [PubMed]
- Moritz, M.M.; Flemming, H.-C.; Wingender, J. Integration of Pseudomonas aeruginosa and Legionella pneumophila in drinking water biofilms grown on domestic plumbing materials. Int. J. Hyg. Environ. Health 2010, 213, 190–197. [Google Scholar] [CrossRef] [PubMed]
- Wingender, J.; Flemming, H.-C. Biofilms in drinking water and their role as reservoir for pathogens. Int. J. Hyg. Environ. Health 2011, 214, 417–423. [Google Scholar] [CrossRef] [PubMed]
- Van der Kooij, D.; Veenendaal, H.R.; Italiaander, R. Corroding copper and steel exposed to intermittently flowing tap water promote biofilm formation and growth of Legionella pneumophila. Water Res. 2020, 183, 115951. [Google Scholar] [CrossRef] [PubMed]
- Zhang, K.; Cao, C.; Zhou, X.; Zheng, F.; Sun, Y.; Cai, Z.; Fu, J. Pilot investigation on formation of 2,4,6-trichloroanisole via microbial O-methylation of 2,4,6-trichlorophenol in drinking water distribution system: An insight into microbial mechanism. Water Res. 2018, 131, 11–21. [Google Scholar] [CrossRef]
- Zhang, X.; Lin, T.; Jiang, F.; Zhang, X.; Wang, S.; Zhang, S. Impact of pipe material and chlorination on the biofilm structure and microbial communities. Chemosphere 2022, 289, 133218. [Google Scholar] [CrossRef]
- Li, X.; Wang, H.; Hu, X.; Hu, C.; Liao, L. Characteristics of corrosion scales and biofilm in aged pipe distribution systems with switching water source. Eng. Fail. Anal. 2016, 60, 166–175. [Google Scholar] [CrossRef]
- Pan, R.; Zhang, K.; Cen, C.; Zhou, X.; Xu, J.; Wu, J.; Wu, X. Characteristics of biostability of drinking water in aged pipes after water source switching: ATP evaluation, biofilms niches and microbial community transition. Environ. Pollut. 2021, 271, 116293. [Google Scholar] [CrossRef]
- Learbuch, K.L.G.; Smidt, H.; van der Wielen, P.W.J.J. Water and biofilm in drinking water distribution systems in the Netherlands. Sci. Total Environ. 2022, 831, 154940. [Google Scholar] [CrossRef]
- Park, S.-K.; Hu, J.Y. Interaction between phosphorus and biodegradable organic carbon on drinking water biofilm subject to chlorination. J. Appl. Microbiol. 2010, 108, 2077–2087. [Google Scholar] [CrossRef]
- Wang, H.; Masters, S.; Edwards, M.A.; Falkinham, J.O.; Pruden, A. Effect of disinfectant, water age, and pipe materials on bacterial and eukaryotic community structure in drinking water biofilm. Environ. Sci. Technol. 2014, 48, 1426–1435. [Google Scholar] [CrossRef] [PubMed]
- Trinh, Q.T.; Krishna, K.C.B.; Salih, A.; Listowski, A.; Sathasivan, A. Biofilm growth on PVC and HDPE pipes impacts chlorine stability in the recycled water. J. Environ. Chem. Eng. 2020, 8, 104476. [Google Scholar] [CrossRef]
- Liduino, V.S.; Cravo-Laureau, C.; Noel, C.; Carbon, A.; Duran, R.; Lutterbach, M.T.; Camporese Sérvulo, E.F. Comparison of flow regimes on biocorrosion of steel pipe weldments: Community composition and diversity of biofilms. Int. Biodeterior. Biodegrad. 2019, 143, 104717. [Google Scholar] [CrossRef]
- Chen, X.; Lian, X.Y.; Wang, Y.; Chen, S.; Sun, Y.R.; Tao, G.L.; Tan, Q.W.; Feng, J.C. Impacts of hydraulic conditions on microplastics biofilm development, shear stresses distribution, and microbial community structures in drinking water distribution pipes. J. Environ. Manage. 2023, 325, 116510. [Google Scholar] [CrossRef]
- Allion, A.; Lassiaz, S.; Peguet, L.; Boillot, P.; Jacques, S.; Peultier, J.; Bonnet, M.-C. A long term study on biofilm development in drinking water distribution system: comparison of stainless steel grades with commonly used materials. Revue de Métallurgie 2011, 108, 259–268. [Google Scholar] [CrossRef]
- Buse, H.Y.; Lu, J.; Lu, X.; Mou, X.; Ashbolt, N.J. Microbial diversities (16S and 18S rRNA gene pyrosequencing) and environmental pathogens within drinking water biofilms grown on the common premise plumbing materials unplasticized polyvinylchloride and copper. FEMS Microbiol Ecol. 2014, 88, 280–295. [Google Scholar] [CrossRef]
- Ren, H.; Wang, W.; Liu, Y.; Liu, S.; Lou, L.; Cheng, D.; He, X.; Zhou, X.; Qiu, S.; Fu, L.; et al. Pyrosequencing analysis of bacterial communities in biofilms from different pipe materials in a city drinking water distribution system of East China. Appl. Microbiol. Biotechnol. 2015, 99, 10713–10724. [Google Scholar] [CrossRef]
- Fu, Y.; Peng, H.; Liu, J.; Nguyen, T.H.; Hashmi, M.Z.; Shen, C. Occurrence and quantification of culturable and viable but non-culturable (VBNC) pathogens in biofilm on different pipes from a metropolitan drinking water distribution system. Sci. Total Environ. 2021, 764, 142851. [Google Scholar] [CrossRef]
- Goraj, W.; Pytlak, A.; Kowalska, B.; Kowalski, D.; Grządziel, J.; Szafranek-Nakonieczna, A.; Galazka, A.; Stępniewska, Z.; Stępniewski, W. Influence of pipe material on biofilm microbial communities found in drinking water supply system. Environ. Res. 2021, 196, 110433. [Google Scholar] [CrossRef]
- Learbuch, K.L.G.; Smidt, H.; van der Wielen, P.W.J.J. Influence of pipe materials on the microbial community in unchlorinated drinking water and biofilm. Water Res. 2021, 194, 116922. [Google Scholar] [CrossRef]
- Lee, D.; Calendo, G.; Kopec, K.; Henry, R.; Coutts, S.; McCarthy, D.; Murphy, H.M. The Impact of Pipe Material on the Diversity of Microbial Communities in Drinking Water Distribution Systems. Front. Microbiol. 2021, 12, 779016. [Google Scholar] [CrossRef] [PubMed]
- Shan, L.; Siyang Xu, S.; Pei, Y.; Zhu, Z.; Xu, L.; Liu, X.; Yixing Yuan, Y. Effect of domestic pipe materials on microbiological safety of drinking water: Different biofilm formation and chlorination resistance for diverse pipe materials. Process Biochem. 2023, 129, 11–21. [Google Scholar] [CrossRef]
- Lv, M.; Du, M. A review: microbiologically influenced corrosion and the effect of cathodic polarization on typical bacteria. Rev. Environ. Sci. Biotechnol. 2018, 17, 431–446. [Google Scholar] [CrossRef]
- Gu, T.; Jia, R.; Unsal, T.; Xu, D. Toward a better understanding of microbiologically influenced corrosion caused by sulfate reducing bacteria. J. Mater. Sci. Technol. 2019, 35, 631–636. [Google Scholar] [CrossRef]
- Zhang, H.; Liu, Y.; Wang, L.; Liu, S. Iron release and characteristics of corrosion scales and bacterial communities in drinking water supply pipes of different materials with varied nitrate concentrations. Chemosphere 2022, 301, 134652. [Google Scholar] [CrossRef]
- Liu, B.; Fan, E.; Jia, J.; Du, C.; Liu, Z.; Li, X. Corrosion mechanism of nitrate reducing bacteria on X80 steel correlated to its intermediate metabolite nitrite. Constr. Build. Mater. 2021, 303, 124454. [Google Scholar] [CrossRef]
- Kryachko, Y.; Hemmingsen, S.M. The role of localized acidity generation in microbially influenced corrosion. Curr. Microbiol. 2017, 74, 870–876. [Google Scholar] [CrossRef]
- Starosvetsky, J.; Starosvetsky, D.; Pokroy, B.; Hilel, T.; Armon, R. Electrochemical behaviour of stainless steels in media containing iron-oxidizing bacteria (IOB) by corrosion process modeling. Corros. Sci. 2008, 50, 540–547. [Google Scholar] [CrossRef]
- Teng, F.; Guan, Y.T.; Zhu, W.P. Effect of biofilm on cast iron pipe corrosion in drinking water distribution system: Corrosion scales characterization and microbial community structure investigation. Corros. Sci. 2008, 50, 2816–2823. [Google Scholar] [CrossRef]
- Miao, X.; Liu, C.; Liu, M.; Han, X.; Zhu, L.; Bai, X. The role of pipe biofilms on dissemination of viral pathogens and virulence factor genes in a full-scale drinking water supply system. J. Hazard. Mater. 2022, 432, 128694. [Google Scholar] [CrossRef]
- Grengg, C.; Mittermayr, F.; Baldermann, A.; Böttcher, M.E.; Leis, A.; Koraimann, G.; Grunert, P.; Dietzel, M. Microbiologically induced concrete corrosion: A case study from a combined sewer network. Cem. Concr. Res. 2015, 77, 16–25. [Google Scholar] [CrossRef]
- Sulikowski, J.; Kozubal, J. The Durability of a Concrete Sewer Pipeline Under Deterioration by Sulphate and Chloride Corrosion. Procedia Eng. 2016, 153, 698–705. [Google Scholar] [CrossRef]
- Wang, D.; Cullimore, R. Bacteriological challenges to asbestos cement water distribution pipelines. J. Environ. Sci. 2010, 22, 1203–1208. [Google Scholar] [CrossRef] [PubMed]
- Wang, D.; Cullimore, R.; Hu, Y.; Chowdhury, R. Biodeterioration of asbestos cement (AC) pipe in drinking water distribution systems. Int. Biodeterior. Biodegradation 2011, 65, 810–817. [Google Scholar] [CrossRef]
- Jia, S.; Tian, Y.; Li, J.; Chu, X.; Zheng, G.; Liu, Y.; Zhao, W. Field study on the characteristics of scales in damaged multi-material water supply pipelines: Insights into heavy metal and biological stability. J. Hazard. Mater. 2022, 424, 127324. [Google Scholar] [CrossRef] [PubMed]
- Wang, H.; Hu, C.; Zhang, L.; Li, X.; Zhang, Y.; Yang¸, M. Effects of microbial redox cycling of iron on cast iron pipe corrosion in drinking water distribution systems. Water Res. 2014, 65, 362–370. [Google Scholar] [CrossRef]
- Li, X.; Wanga, H.; Hu, C.; Yang, M.; Hu, H.; Niu, J. Characteristics of biofilms and iron corrosion scales with ground and surface waters in drinking water distribution systems. Corros. Sci. 2015, 90, 331–339. [Google Scholar] [CrossRef]
- Zhu, Y.; Wang, H.; Li, X.; Hu, C.; Yang, M.; Qu, J. Characterization of biofilm and corrosion of cast iron pipes in drinking water distribution system with UV/Cl2 disinfection. Water Res. 2014, 60, 174–181. [Google Scholar] [CrossRef]
- Liu, H.; Fu, C.; Gu, T.; Zhang, G.; Lv, Y.; Wang, H.; Liu, H. Corrosion behavior of carbon steel in the presence of sulfate reducing bacteria and iron oxidizing bacteria cultured in oilfeld produced water. Corros. Sci. 2015, 100, 484–495. [Google Scholar] [CrossRef]
- Liu, H.; Gu, T.; Zhang, G.; Cheng, Y.; Wang, H.; Liu, H. The effect of magnetic field on biomineralization and corrosion behavior of carbon steel induced by iron-oxidizing bacteria. Corros. Sci. 2016, 102, 93–102. [Google Scholar] [CrossRef]
- Hyun-Jung, J.; Choi, Y.-J.; Ka, J.-O. Effects of Diverse Water Pipe Materials on Bacterial Communities and Water Quality in the Annular Reactor. J. Microbiol. Biotechnol. 2011, 21, 115–123. [Google Scholar] [CrossRef]
- Ding, S.; Deng, Y.; Bond, T.; Fang, C.; Cao, Z.; Chu, W. Disinfection byproduct formation during drinking water treatment and distribution: A review of unintended effects of engineering agents and materials. Water Res. 2019, 160, 313–329. [Google Scholar] [CrossRef] [PubMed]
- Douterelo, I.; Fish, K.E.; Boxall, J.B. Succession of bacterial and fungal communities within biofilms of a chlorinated drinking water distribution system. Water Res. 2018, 141, 74–85. [Google Scholar] [CrossRef] [PubMed]
- Ginige, M.P.; Garbin, S.; Wylie, J.; Krishna, K.C.B. Effectiveness of Devices to Monitor Biofouling and Metals Deposition on Plumbing Materials Exposed to a Full-Scale Drinking Water Distribution System. PLoS ONE 2017, 12, 0169140. [Google Scholar] [CrossRef]
- Mullis, S.N.; Falkinham, J.O., III. Adherence and biofilm formation of Mycobacterium avium, Mycobacterium intracellulare and Mycobacterium abscessus to household plumbing materials. J. Appl. Microbiol. 2013, 115, 908–914. [Google Scholar] [CrossRef]
- Lehtola, M.J.; Miettinen, I.T.; Lampola, T.; Hirvonen, A.; Vartiainen, T.; Martikainen, P.J. Pipeline materials modify the effectiveness of disinfectants in drinking water distribution systems. Water Res. 2005, 39, 1962–1971. [Google Scholar] [CrossRef]
- Zhang, Y.; Zhang, Y.; Liu, L.; Zhou, L.; Zhao, Z. Impacts of antibiotics on biofilm bacterial community and disinfection performance on simulated drinking water supply pipe wall. Environ. Pollut. 2021, 288, 117736. [Google Scholar] [CrossRef]
- Zhang, J.; Li, W.; Chen, J.; Qi, W.; Wang, F.; Zhou, Y. Impact of biofilm formation and detachment on the transmission of bacterial antibiotic resistance in drinking water distribution systems. Chemosphere 2018, 203, 368–380. [Google Scholar] [CrossRef]
- Tong, H.; Jiang, Q.; Hu, X.; Zhong, X. Occurrence and identification of microplastics in tap water from China. Chemosphere 2020, 252, 126493. [Google Scholar] [CrossRef]
- Kirstein, I.V.; Gomiero, A.; Jes Vollertsen, J. Microplastic pollution in drinking water. Curr. Opin. Toxicol. 2021, 28, 70–75. [Google Scholar] [CrossRef]
- Oßmann, B.E. Microplastics in drinking water? Present state of knowledge and open questions. Curr. Opin. Food Sci. 2021, 41, 44–51. [Google Scholar] [CrossRef]
- Shen, M.; Song, B.; Zhu, Y.; Zeng, G.; Zhang, Y.; Yang, Y.; Wen, X.; Chen, M.; Yi, H. Removal of microplastics via drinking water treatment: Current knowledge and future directions. Chemosphere 2020, 251, 126612. [Google Scholar] [CrossRef]
- Radityaningrum, A.D.; Trihadiningrum, Y.; Mar’atusholihah; Soedjono, E.S.; Herumurti, W. Microplastic contamination in water supply and the removal efficiencies of the treatment plants: A case of Surabaya City, Indonesia. J. Water Process. Eng. 2021, 43, 102195. [Google Scholar] [CrossRef]
- Menon, V.; Sharma, S.; Gupta, S.; Ghosal, A.; Nadda, A.K.; Jose, R.; Sharma, P.; Kumar, S.; Singh, P.; Raizada, P. Prevalence and implications of microplastics in potable water system: An update. Chemosphere 2023, 317, 137848. [Google Scholar] [CrossRef]
- Muhib, Md.I.; Uddin, Md.K.; Rahman, Md.M.; Malafaia, G. Occurrence of microplastics in tap and bottled water, and food packaging: A narrative review on current knowledge. Sci. Total Environ. 2023, 865, 161274. [Google Scholar] [CrossRef]
- Taghipour, H.; Ghayebzadeh, M.; Ganji, F.; Mousavi, S.; Azizi, N. Tracking microplastics contamination in drinking water in Zahedan, Iran: From source to consumption taps. Sci. Total Environ. 2023, 872, 162121. [Google Scholar] [CrossRef] [PubMed]
- Tao, H.; Zhou, L.; Qi, Y.; Chen, Y.; Han, Z.; Lin, T. Variation of microplastics and biofilm community characteristics along the long-distance raw water pipeline. Process Saf. Environ. Prot. 2023, 169, 304–312. [Google Scholar] [CrossRef]
- Negrete Velasco, A.; Ramseier Gentile, S.; Zimmermann, S.; Le Coustumer, P.; Serge Stoll, S. Contamination and removal efficiency of microplastics and synthetic fibres in a conventional drinking water treatment plant in Geneva, Switzerland. Sci. Total Environ. 2023, 880, 163270. [Google Scholar] [CrossRef]
- Weber, F.; Kerpen, J.; Wolff, S.; René Langer, R.; Eschweiler, V. Investigation of microplastics contamination in drinking water of a German city. Sci. Total Environ. 2021, 755, 143421. [Google Scholar] [CrossRef]
- Adegoke, K.A.; Adu, F.A.; Oyebamiji, A.K.; Bamisaye, A.; Adigun, R.A.; Olasoji, S.O.; Ogunjinmi, O.E. Microplastics toxicity, detection, and removal from water/wastewater. Mar. Pollut. Bull. 2023, 187, 114546. [Google Scholar] [CrossRef] [PubMed]
- Cao, Y.; Zhao, M.; Ma, X.; Song, Y.; Zuo, S.; Li, H.; Deng, W. A critical review on the interactions of microplastics with heavy metals: Mechanism and their combined effect on organisms and humans. Sci. Total Environ. 2021, 788, 147620. [Google Scholar] [CrossRef] [PubMed]
- He, W.; Wang, X.; Zhang, Y.; Zhu, B.; Wu, H. Adsorption behavior of aged polystyrene microplastics (PSMPs) for manganese in water: Critical role of hydrated functional zone surrounding the microplastic surface. J. Environ. Chem. Eng. 2022, 10, 109040. [Google Scholar] [CrossRef]
- Miao, M.; Yu, B.; Cheng, X.; Hao, T.; Yuanyuan Dou, Y.; Zhang, M.; Li, Y. Effects of chlorination on microplastics pollution: Physicochemical transformation and chromium adsorption. Environ. Pollut. 2023, 323, 121254. [Google Scholar] [CrossRef] [PubMed]
- Nirmala, K.; Rangasamy, G.; Ramya, M.; Shankar, V.U.; Rajesh, G. A critical review on recent research progress on microplastic pollutants in drinking water. Environ. Res. 2023, 222, 115312. [Google Scholar] [CrossRef] [PubMed]
- Sun, Q.; Ren, S.Y.; Ni, H.G. Effects of microplastic sorption on microbial degradation of halogenated polycyclic aromatic hydrocarbons in water. Environ. Pollut. 2022, 313, 120238. [Google Scholar] [CrossRef]
- Bauerlein, P.S.; Hofman-Caris, R.C.H.M.; Pieke, E.N.; ter Laak, T.L. Fate of microplastics in the drinking water production. Water Res. 2022, 221, 118790. [Google Scholar] [CrossRef]
- Dalmau-Soler, J.; Ballesteros-Cano, R.; Ferrer, N.; Boleda, M.R.; Lacorte, S. Microplastics throughout a tap water supply network. Water Environ. J. 2022, 36, 292–298. [Google Scholar] [CrossRef]
- Chu, X.; Tian, Y.; Liu, J.; Jia, S.; Zhao, W.; Zhao, P. The effect of adsorption on the fate of colloidal polystyrene microplastics in drinking water distribution system pipe scales. J. Hazard. Mater. 2022, 439, 129680. [Google Scholar] [CrossRef]
- Chu, X.; Zheng, B.; Li, Z.; Cai, C.; Peng, Z.; Zhao, P.; Tian, Y. Occurrence and distribution of microplastics in water supply systems: In water and pipe scales. Sci. Total Environ. 2022, 803, 150004. [Google Scholar] [CrossRef]
- Chen, X.; Lian, X.Y.; Wang, Y.; Chen, S.; Sun, Y.R.; Tao, G.L.; Tan, Q.W.; Feng, J.C. Impacts of hydraulic conditions on microplastics biofilm development, shear stresses distribution, and microbial community structures in drinking water distribution pipes. J. Environ. Manage. 2023, 325, 116510. [Google Scholar] [CrossRef]
- Wang, H.; Hu, C.; Hu, X.; Yang, M.; Qu, J. Effects of disinfectant and biofilm on the corrosion of cast iron pipes in a reclaimed water distribution system. Water Res. 2012, 46, 1070–1078. [Google Scholar] [CrossRef] [PubMed]
- Mian, H.R.; Hu, G.; Hewage, K.; Rodriguez, M.J.; Sadiq, R. Prioritization of unregulated disinfection by-products in drinking water distribution systems for human health risk mitigation: A critical review. Water Res. 2018, 147, 112–131. [Google Scholar] [CrossRef] [PubMed]
- Abhijith, G.R.; Ostfeld, A. Examining the Longitudinal Dispersion of Solutes Inside Water Distribution Systems. J. Water. Resour. Plan. Manag. 2022, 148, 04022022. [Google Scholar] [CrossRef]
- Bielski, A.; Zielina, M.; Mlynska, A. Analysis of heavy metals leaching from internal pipe cement coating into potable water. J. Clean. Prod. 2020, 265, 121425. [Google Scholar] [CrossRef]
- Zielina, M.; Bielski, A.; Mlynska, A. Leaching of chromium and lead from the cement mortar lining into the flowing drinking water shortly after pipeline rehabilitation. J. Clean. Prod. 2022, 362, 132512. [Google Scholar] [CrossRef]
- Punurai, W.; Davis, P. Prediction of Asbestos Cement Water Pipe Aging and Pipe Prioritization using Monte Carlo Simulation. Eng. J. 2017, 21, 1–13. [Google Scholar] [CrossRef]
Figure 1.
Lead pipe replaced after about 50 years in service (courtesy of Ecoaqua S.A. Călăraşi, Romania).
Figure 1.
Lead pipe replaced after about 50 years in service (courtesy of Ecoaqua S.A. Călăraşi, Romania).
Figure 2.
AC pipe replaced after about 50 years in service (courtesy of Ecoaqua S.A. Călăraşi, Romania).
Figure 2.
AC pipe replaced after about 50 years in service (courtesy of Ecoaqua S.A. Călăraşi, Romania).
Figure 3.
(a) Schematic representation of corrosion reactions; (b) new iron pipe and old iron pipes (courtesy of Ecoaqua S.A. Călăraşi, Romania).
Figure 3.
(a) Schematic representation of corrosion reactions; (b) new iron pipe and old iron pipes (courtesy of Ecoaqua S.A. Călăraşi, Romania).
Figure 4.
Types of iron corrosion scale (a) schematical representation [118]; (b) appearance of corrosion scale on cast iron pipe (courtesy of Ecoaqua S.A. Călăraşi, Romania).
Figure 4.
Types of iron corrosion scale (a) schematical representation [118]; (b) appearance of corrosion scale on cast iron pipe (courtesy of Ecoaqua S.A. Călăraşi, Romania).
Figure 5.
Stages of corrosion scale formation: (a) initial stage; (b) intermediate stage (note: An− represent ions); (c) stable stage; (d) image of actual iron pipe corrosion scale from DWDSs in Hangzhou city of China [119].
Figure 5.
Stages of corrosion scale formation: (a) initial stage; (b) intermediate stage (note: An− represent ions); (c) stable stage; (d) image of actual iron pipe corrosion scale from DWDSs in Hangzhou city of China [119].
Figure 6.
Steel corrosion: (a) schematic representation of formation mechanism of the stainless-steel corrosion scale [80]; (b) appearance of corrosion scale on steel pipe (courtesy of Ecoaqua S.A. Călăraşi, Romania).
Figure 6.
Steel corrosion: (a) schematic representation of formation mechanism of the stainless-steel corrosion scale [80]; (b) appearance of corrosion scale on steel pipe (courtesy of Ecoaqua S.A. Călăraşi, Romania).
Figure 7.
Cross-sectional view of corrosion pits on (a) uncoated, (b) PE-pure enamel coating, (c) ME-mixed enamel coating, (d) DE-double enamel coating, and (e) FBE-fusion bonded epoxy coated steel bars after 244 days of test [132].
Figure 7.
Cross-sectional view of corrosion pits on (a) uncoated, (b) PE-pure enamel coating, (c) ME-mixed enamel coating, (d) DE-double enamel coating, and (e) FBE-fusion bonded epoxy coated steel bars after 244 days of test [132].
Figure 8.
A: (a) inside wall of AC pipe is coated with a layer of patina 3–4 mm depth; (b) patina is thick fibrous films that are composed of high fibrous asbestos and some biomass forming gelatinous like materials; (c) patina tends to have yellow to brown colorations implying the presence of some iron. B: AC segments after 10 days cultivation under different conditions. (a) IRB in anaerobic conditions; (b) APB in anaerobic conditions; (c) SLYM in anaerobic conditions, c1: layer of discoloration immediately behind the patina 4–6 mm, c2: discolored patches within the concrete; (d) SLYM in aerobic conditions, d1: patina, d2: main body, d3: outer layer; (e) HAB in anaerobic conditions, Methylene Blue was found on patina and the layer immediately behind patina; arrow indicates a weathering spot on the segment; (f) SRB in aerobic conditions (IRB – iron reducing bacteria; APB - acid-producing bacteria; SLYM – slime forming bacteria; HAB - heterotrophic aerobic bacteria; SRB - sulfate reducing bacteria) [178].
Figure 9.
Cast iron pipes: corrosion scale image of pipeline inner and outer walls. (a1), (b1) and (c1) represent the appearance of lined pipe A, unlined pipe B and unlined pipe C, respectively; (a2), (b2), and (c2) represent the internal corrosion of lined pipe A, unlined pipe B and unlined pipe C, respectively. (a3), (b3), and (c3) corresponding to (a2), (b2), and (c2) represent the internal pipe scale extraction location. The sample labels A1-A6, B1-B6 and C1-C6 represent sampling locations. Note: Inner wall scale: A1, A2, B1, B2, B3, C1, C2 and C3. Outer wall scale: A3, A4, A5, A5, B4, B5, B6, C4, C5 and C6 [180].
Figure 10.
Interaction mechanisms between MPs and heavy metals present in the DWDS. Factors that influence the retention mechanisms (HMs - heavy metal complex) [206].
Figure 10.
Interaction mechanisms between MPs and heavy metals present in the DWDS. Factors that influence the retention mechanisms (HMs - heavy metal complex) [206].
Figure 11.
Schematic diagram of corrosion reactions of (a) uniform corrosion of copper pipes and (b) galvanic corrosion system with the half-cell reactions [28].
Figure 11.
Schematic diagram of corrosion reactions of (a) uniform corrosion of copper pipes and (b) galvanic corrosion system with the half-cell reactions [28].
Disclaimer/Publisher’s Note: The statements, opinions and data contained in all publications are solely those of the individual author(s) and contributor(s) and not of MDPI and/or the editor(s). MDPI and/or the editor(s) disclaim responsibility for any injury to people or property resulting from any ideas, methods, instructions or products referred to in the content. |
© 2023 by the authors. Licensee MDPI, Basel, Switzerland. This article is an open access article distributed under the terms and conditions of the Creative Commons Attribution (CC BY) license (http://creativecommons.org/licenses/by/4.0/).
Copyright: This open access article is published under a Creative Commons CC BY 4.0 license, which permit the free download, distribution, and reuse, provided that the author and preprint are cited in any reuse.
Chlorine Dioxide Degradation Issues on Metal and Plastic Water Pipes Tested in Parallel in a Semi-Closed System
Alberto Vertova
et al.
IJERPH,
2019
A Study on the Comparison of Corrosion in Water Supply Pipes Due to Tap Water (TW) and Reclaimed Water (RW)
Hyundong Lee
et al.
Water,
2018
Effects of Sulfate, Chloride, and Bicarbonate on Iron Stability in a PVC-U Drinking Pipe
Jiaying Wang
et al.
IJERPH,
2017


MDPI Initiatives
Important Links
© 2024 MDPI (Basel, Switzerland) unless otherwise stated