3.1. Microstructure Evaluation
The air plasma sprayed coating’s microstructure is extremely complicated and heterogeneous.
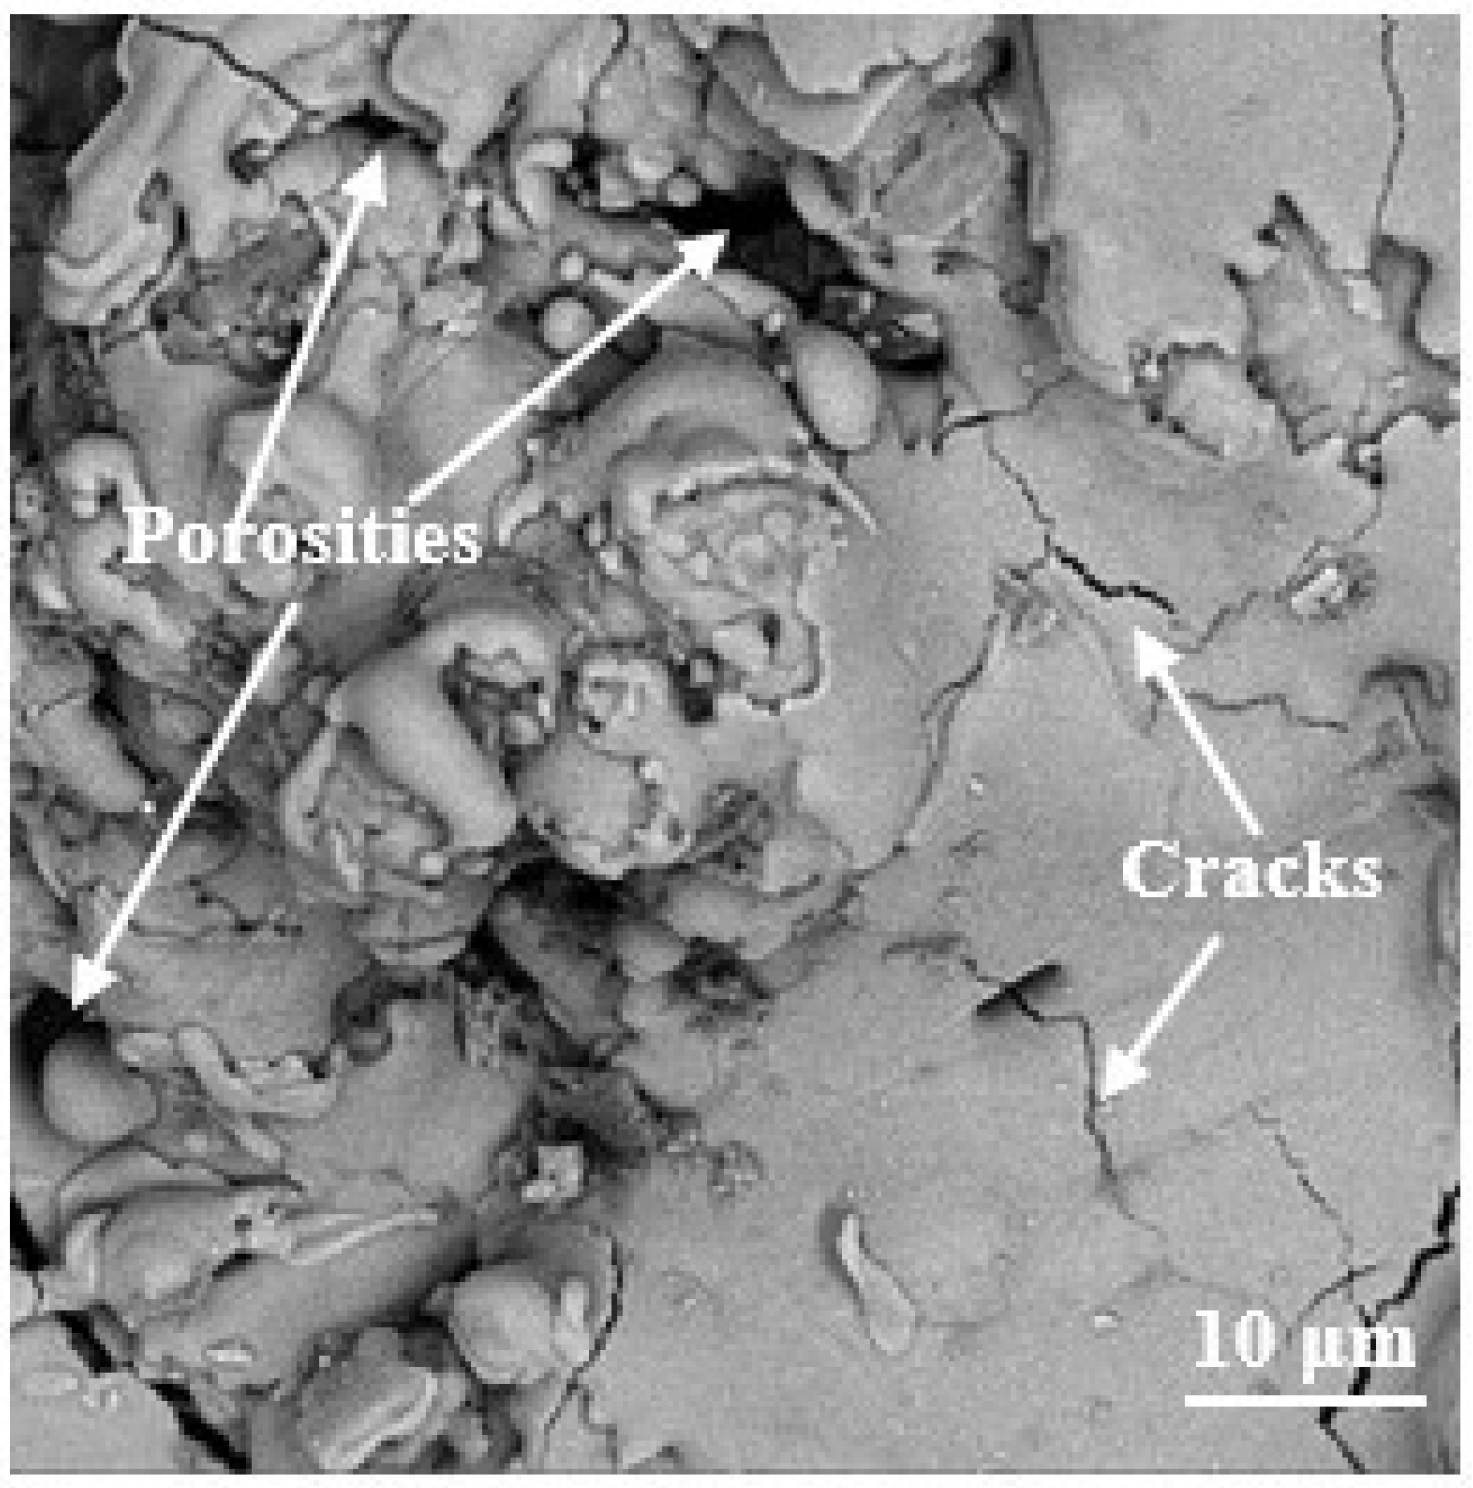
Figure 1 shows typical FE-SEM micrographs of the upper surface view. They clearly demonstrated a rough appearance, a non-uniform and uneven distribution of open porosity, unmelted particles, semi-melted particles, and a network of cracks inside the splats. The existence of intrasplat cracks in the splat structure was attributed to residual process stresses. Pores can form between the splats for a number of causes, including trapped gas, insufficient filling of previously deposited particle holes, poor inter-splat interface contact, or insufficient melted particles to fill the surface irregularities. Using image J software, the percentage of open porosity was estimated to be around 14%. This general microstructure is due to the rapid solidification of the plasma-spraying process.
Figure 1.
FE-SEM micrograph of the surface morphology of plasma sprayed coating.
Figure 1.
FE-SEM micrograph of the surface morphology of plasma sprayed coating.
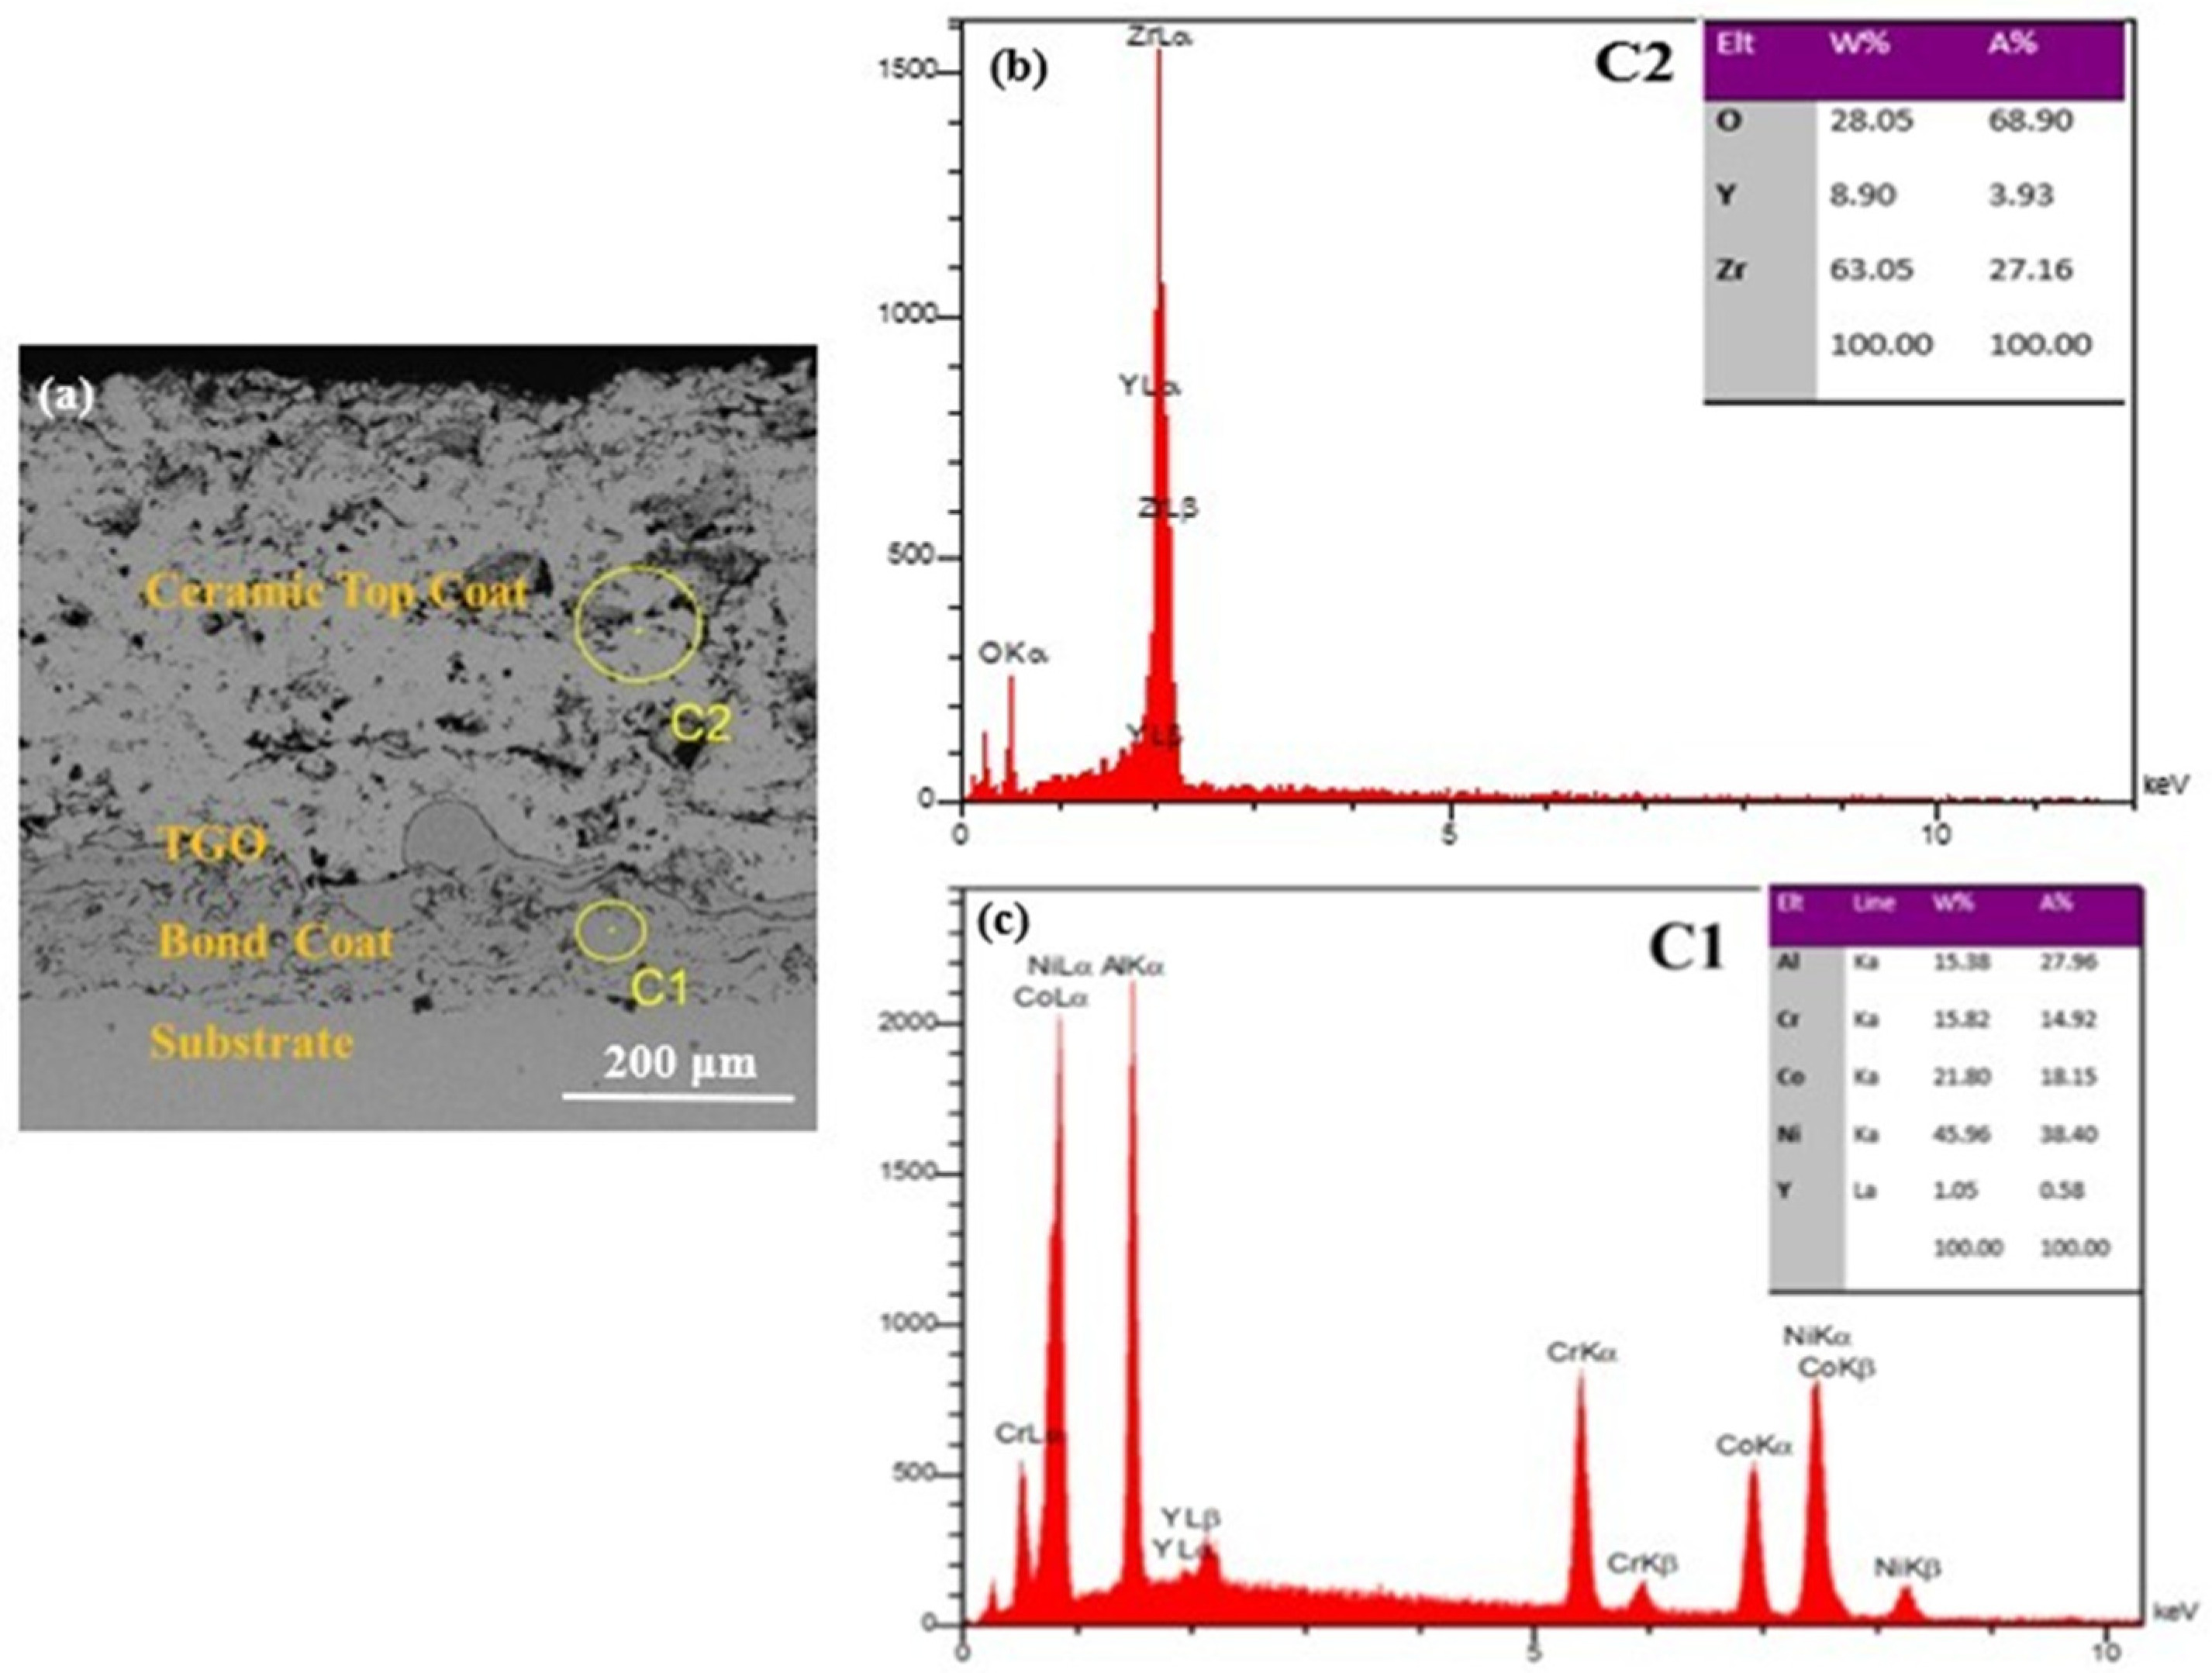
Figure 2a depicts the cross-sectional microstructure of the components. The microstructure is revealed to be composed of a multilayer of metallic bond coat, YSZ ceramic topcoat, and a thin layer of thermally generated oxide (TGO) at the bond coat/ceramic interface. There are various vertical and horizontal cracks with porosity, which are typical APS process flaws. The element distribution in the plasma sprayed coating was shown by a typical EDS analysis in
Figure 2b,c. As the main constituents of YSZ coatings, it is composed of Zr, Y, and O elements. While the elements for the bond coat, are Ni, Co, Cr, Al, and Y.
Figure 2.
FE-SEM (a) and EDS analysis for the cross-section of plasma sprayed TBCs for ceramic top coat (b) and bond coat (c).
Figure 2.
FE-SEM (a) and EDS analysis for the cross-section of plasma sprayed TBCs for ceramic top coat (b) and bond coat (c).
The deposition rate of nano YSZ on the surface of plasma sprayed coating using the EPD process mostly depended on the EPD process parameters and suspension parameters. The best parameters resulted from the optimizing coating thickness of electrophoretic deposition overlay in [
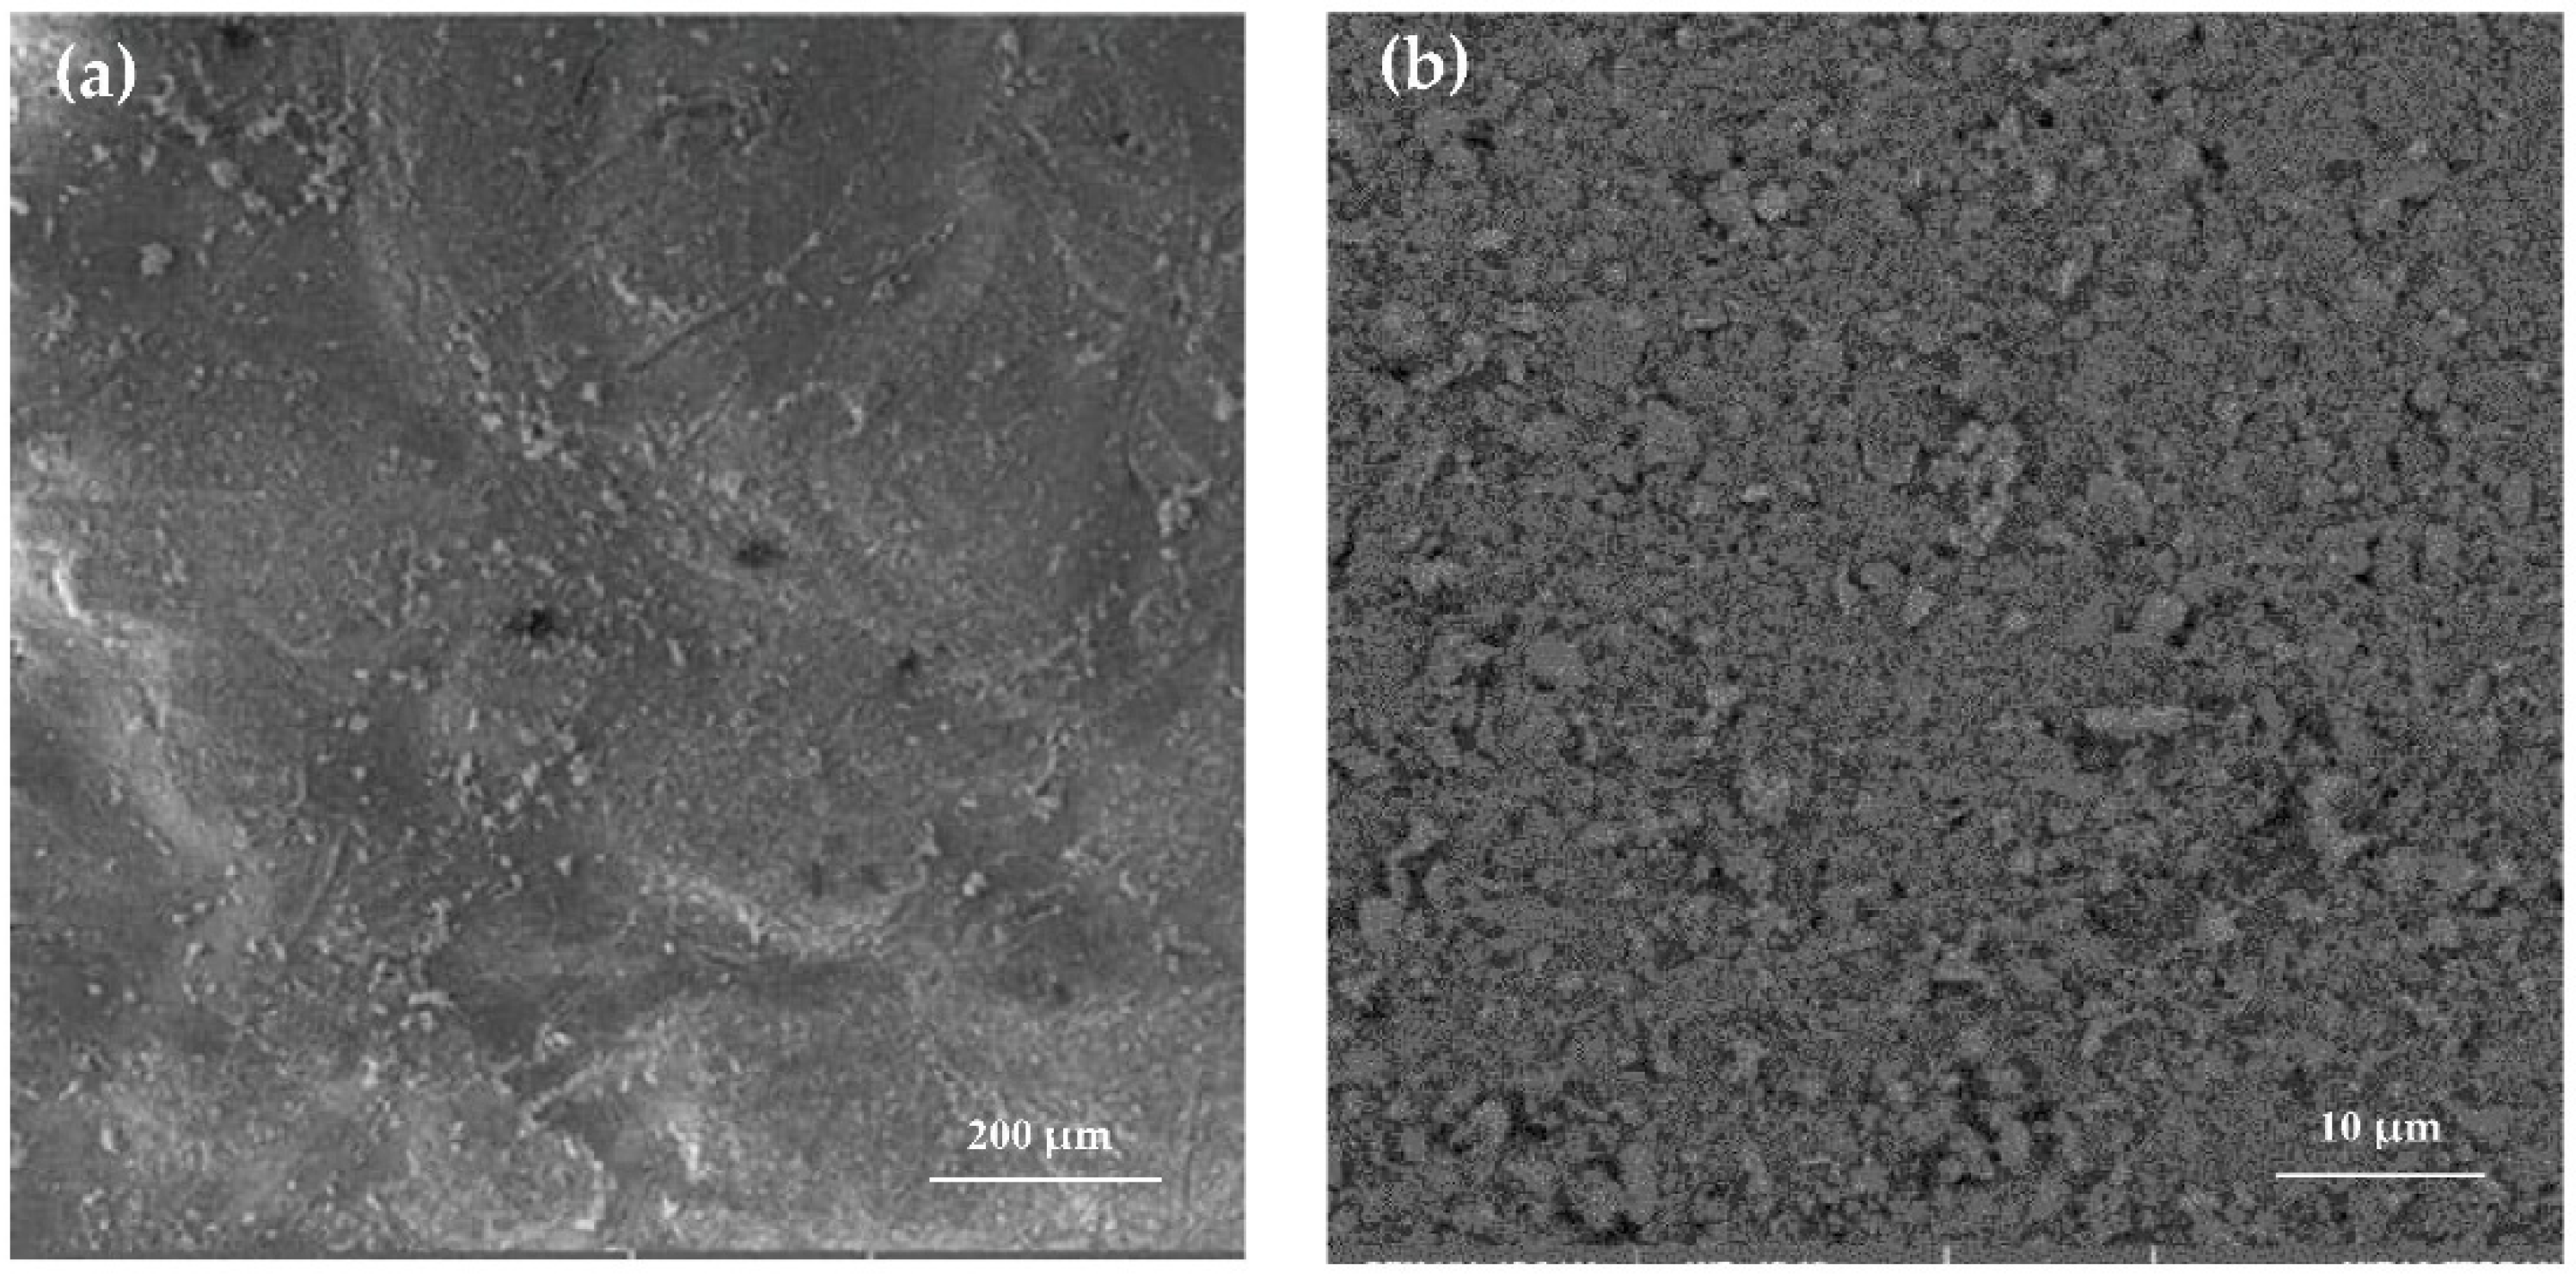
11] was utilized (40V, 10g/l, and 5 min). The surface morphology of the green EPD overlay on the APS TBCs is shown at low magnification in
Figure 3a and high magnification in
Figure 3b. One can observe the uniformity and homogeneity of the coating layer, as well as the formation of flat and smooth surfaces. MIP measurements in
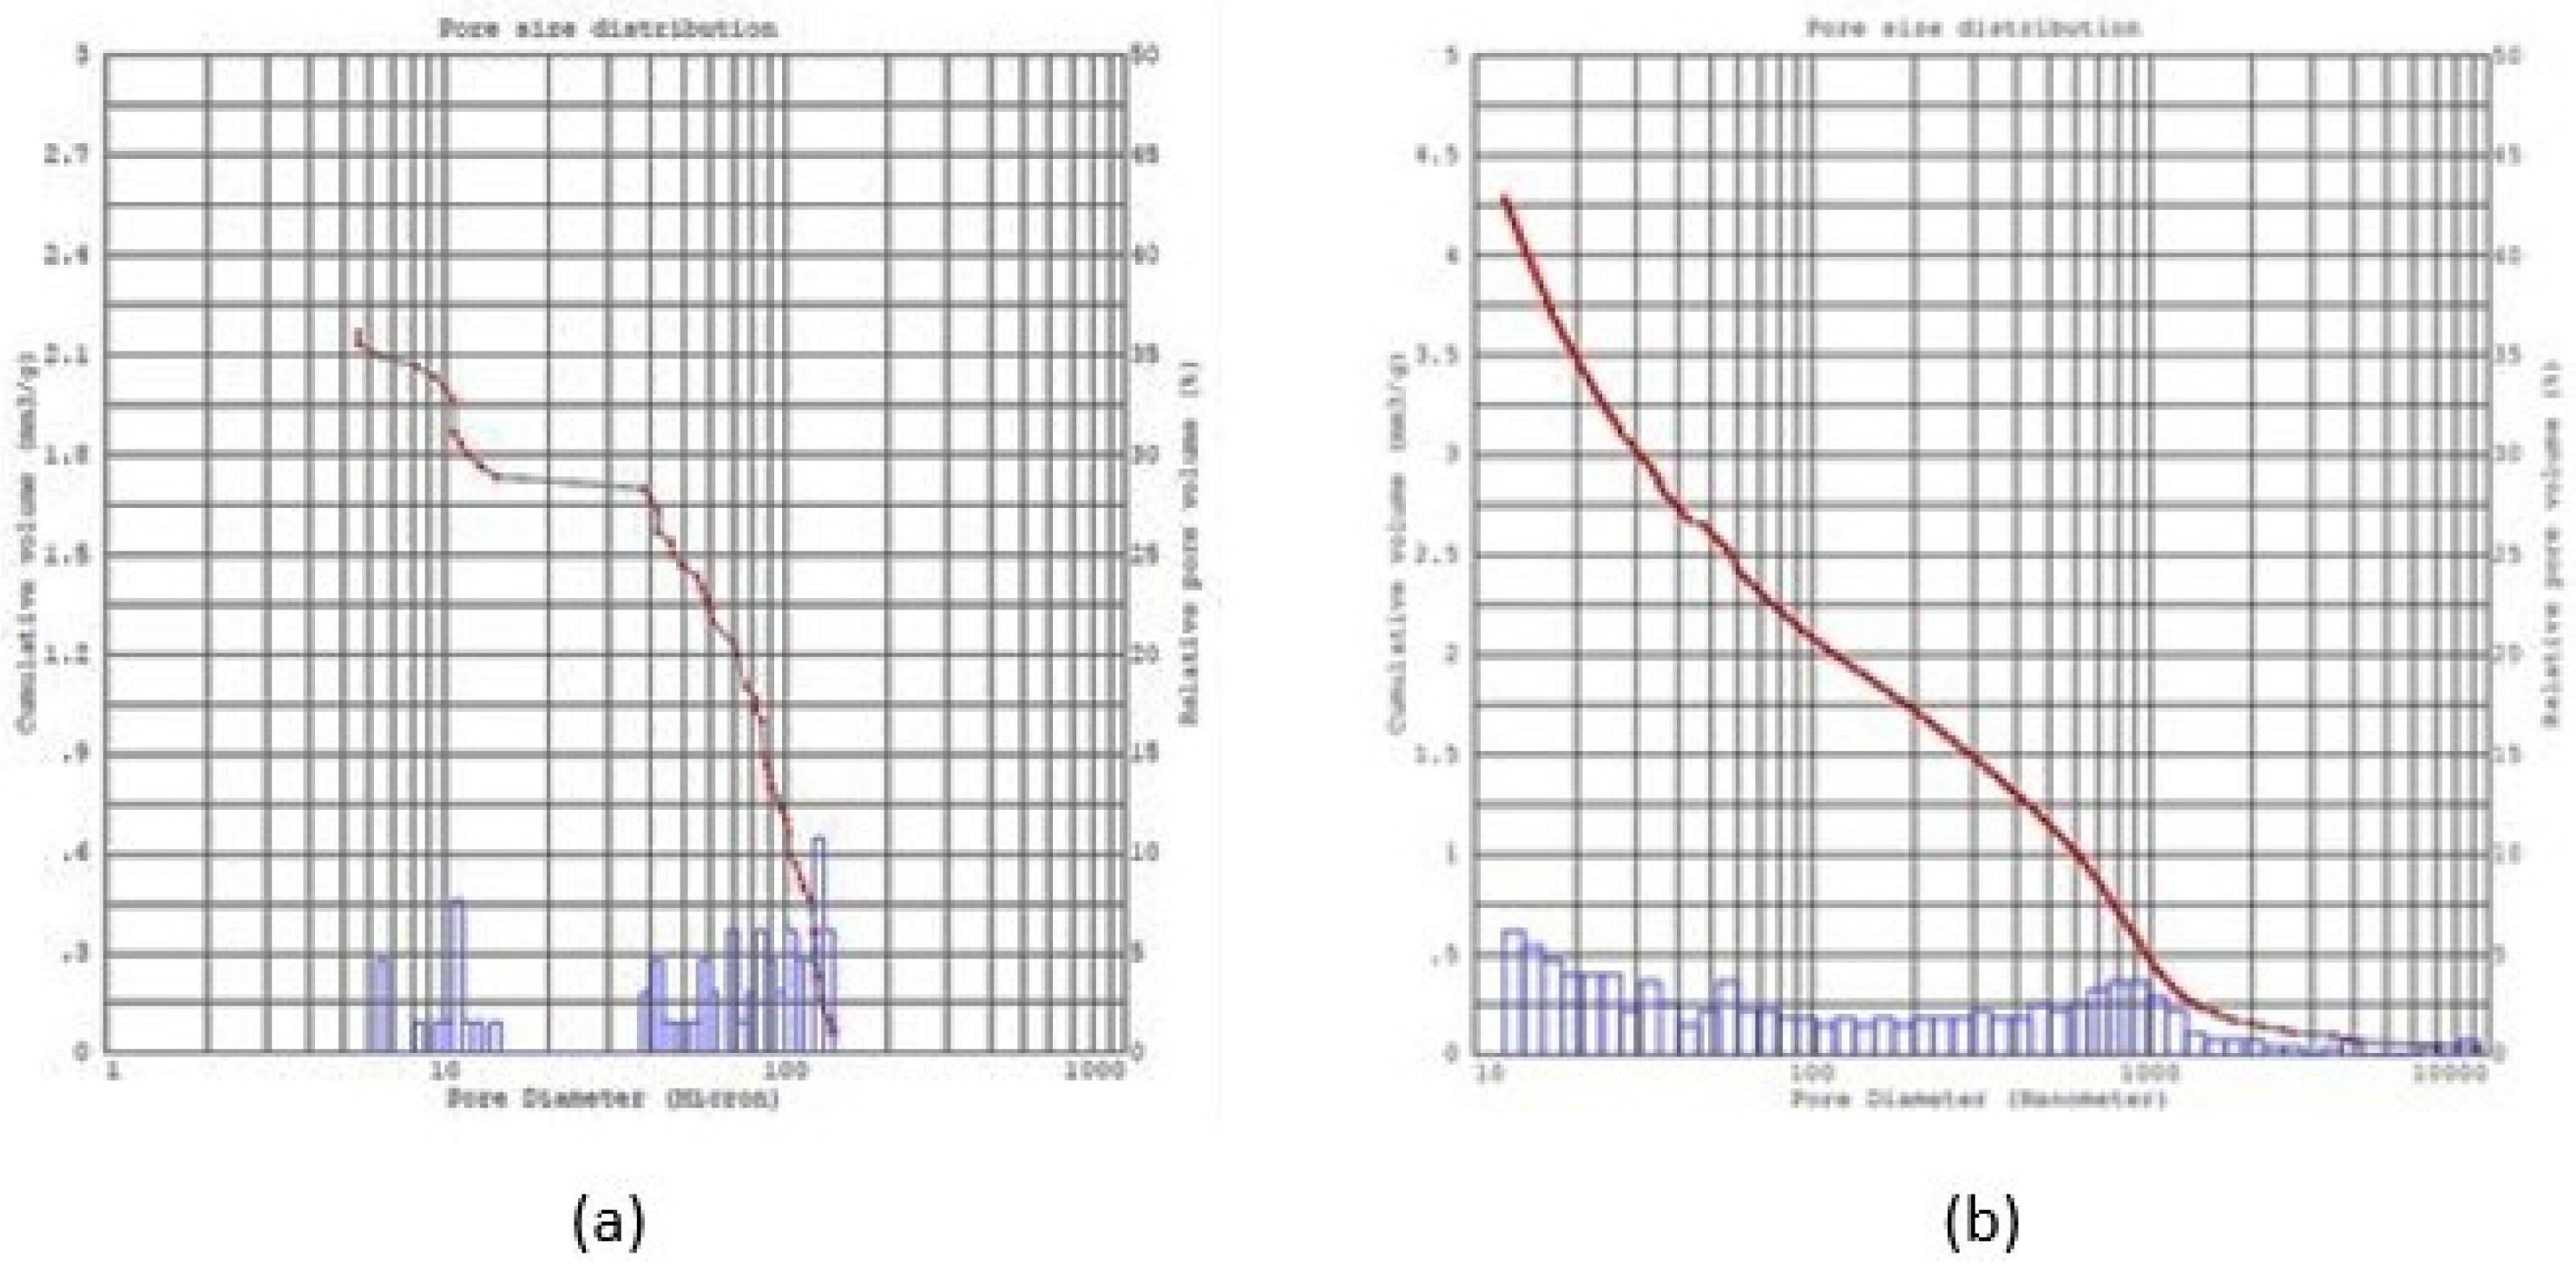
Figure 4 demonstrate the pore size distribution of both plasma sprayed coatings before applying the EPD overlay and after the green EPD overlay. The cumulative liquid mercury volume as a function of pressure is used to compute the pore size distribution. Mercury porosimetry
Figure 4a shows that the majority of the pore volume lies in the macroporous size range of the pore diameter 5.5 to 137.7 µm. The pore size distribution after EPD overlay
Figure 4b lies in the nanoporous size range of the pore diameter 12.21 to 9346.69 nm. This lack of pores was critical for preventing the inward diffusion of harmful substances such as CMAS and oxygen from the environment through the structure of the plasma-sprayed coating beneath during service. So the probability of component failure due to oxidation or hot corrosion will be reduced.
Figure 3.
FE-SEM of the surface morphology of the EPD overlay on plasma-sprayed YSZ TBCs at (a) low magnification and (b) high magnification.
Figure 3.
FE-SEM of the surface morphology of the EPD overlay on plasma-sprayed YSZ TBCs at (a) low magnification and (b) high magnification.
Figure 4.
Frequency and pore size distribution of (
a) as-sprayed coating [
27] (
b) EPD overlay surface.
Figure 4.
Frequency and pore size distribution of (
a) as-sprayed coating [
27] (
b) EPD overlay surface.
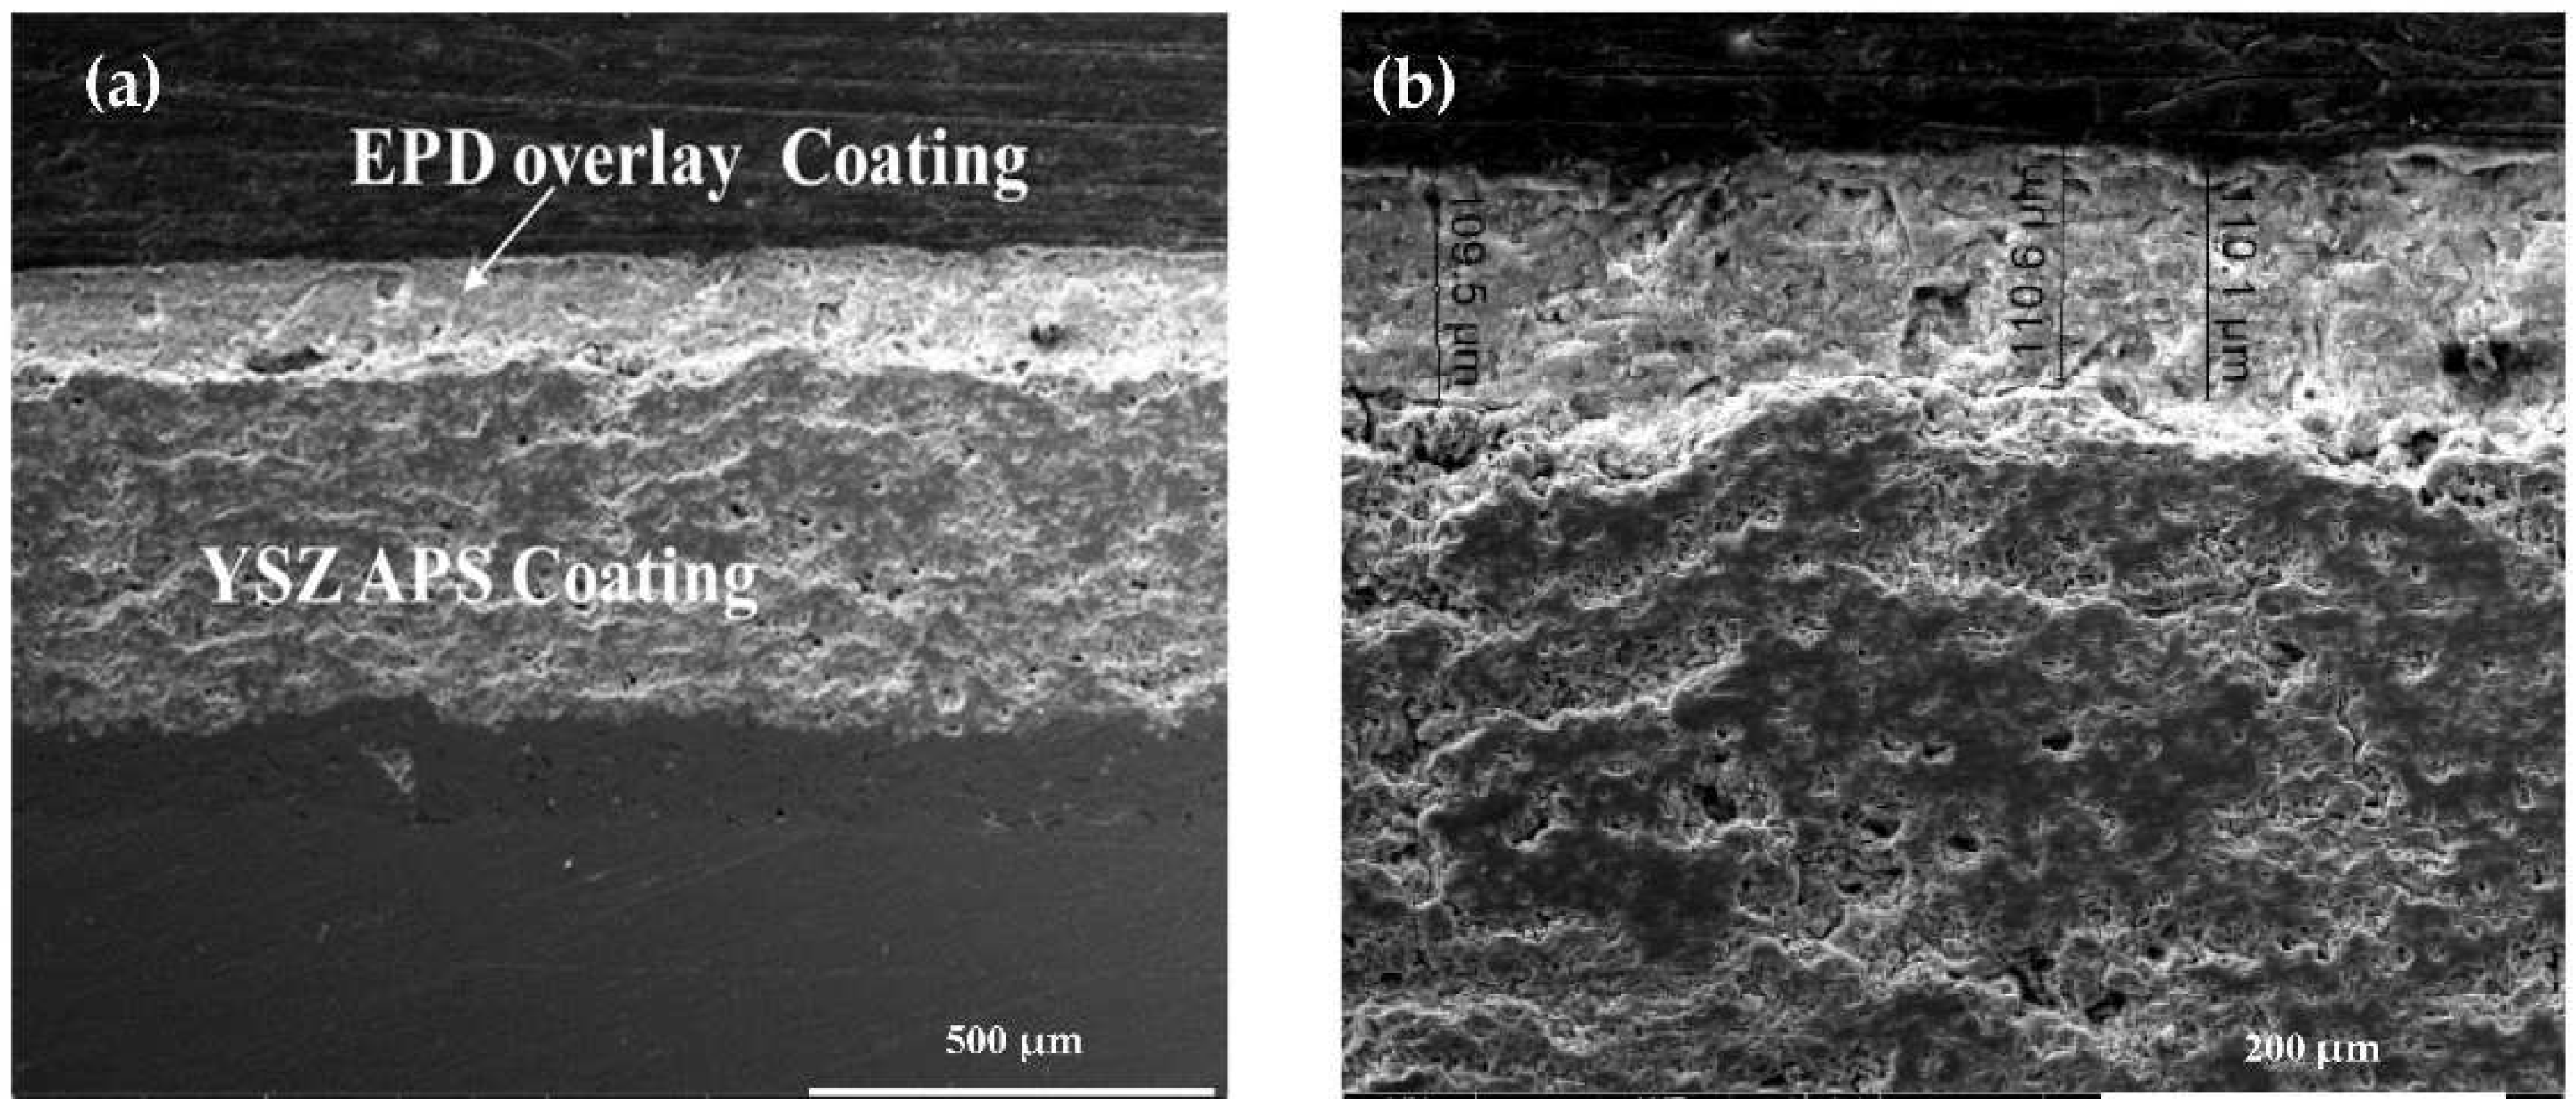
Figure 5a shows a cross-section of the YSZ nanocoatings, to which we applied a voltage of 40 V for 5 min and a concentration of 10 g/L. It can be observed that the EPD overlay thickness of the YSZ nanocoating is approximately 110 µm in
Figure 5b. The coating maintained a dense, continuous, and crack-free morphology. The contact between the EPD overlay coating and the APS coating clearly provided good adherence. The quality of the green YSZ EPD overlay depended strongly on the stability of the suspension used. The use of iodine as a dispersant in suspension enhances the formation of free protons through the reaction between I
2 and the ethanol solvent. A sufficient amount of iodine was added to the suspension as a dispersant at a level of approximately 0.5 g/l to adjust the particles’ surface charge in the YSZ EPD suspension. Resulting in high zeta potential and mobility at 10 g/l concentration as in [
11].
Figure 5.
FE-SEM images of the cross-section of the EPD overlay on plasma-sprayed TBC surfaces at (a) low and (b) high magnification showing the homogeneity of the coating.
Figure 5.
FE-SEM images of the cross-section of the EPD overlay on plasma-sprayed TBC surfaces at (a) low and (b) high magnification showing the homogeneity of the coating.
The green EPD overlay was dried at room temperature for 24 h before it was laser-sintered.
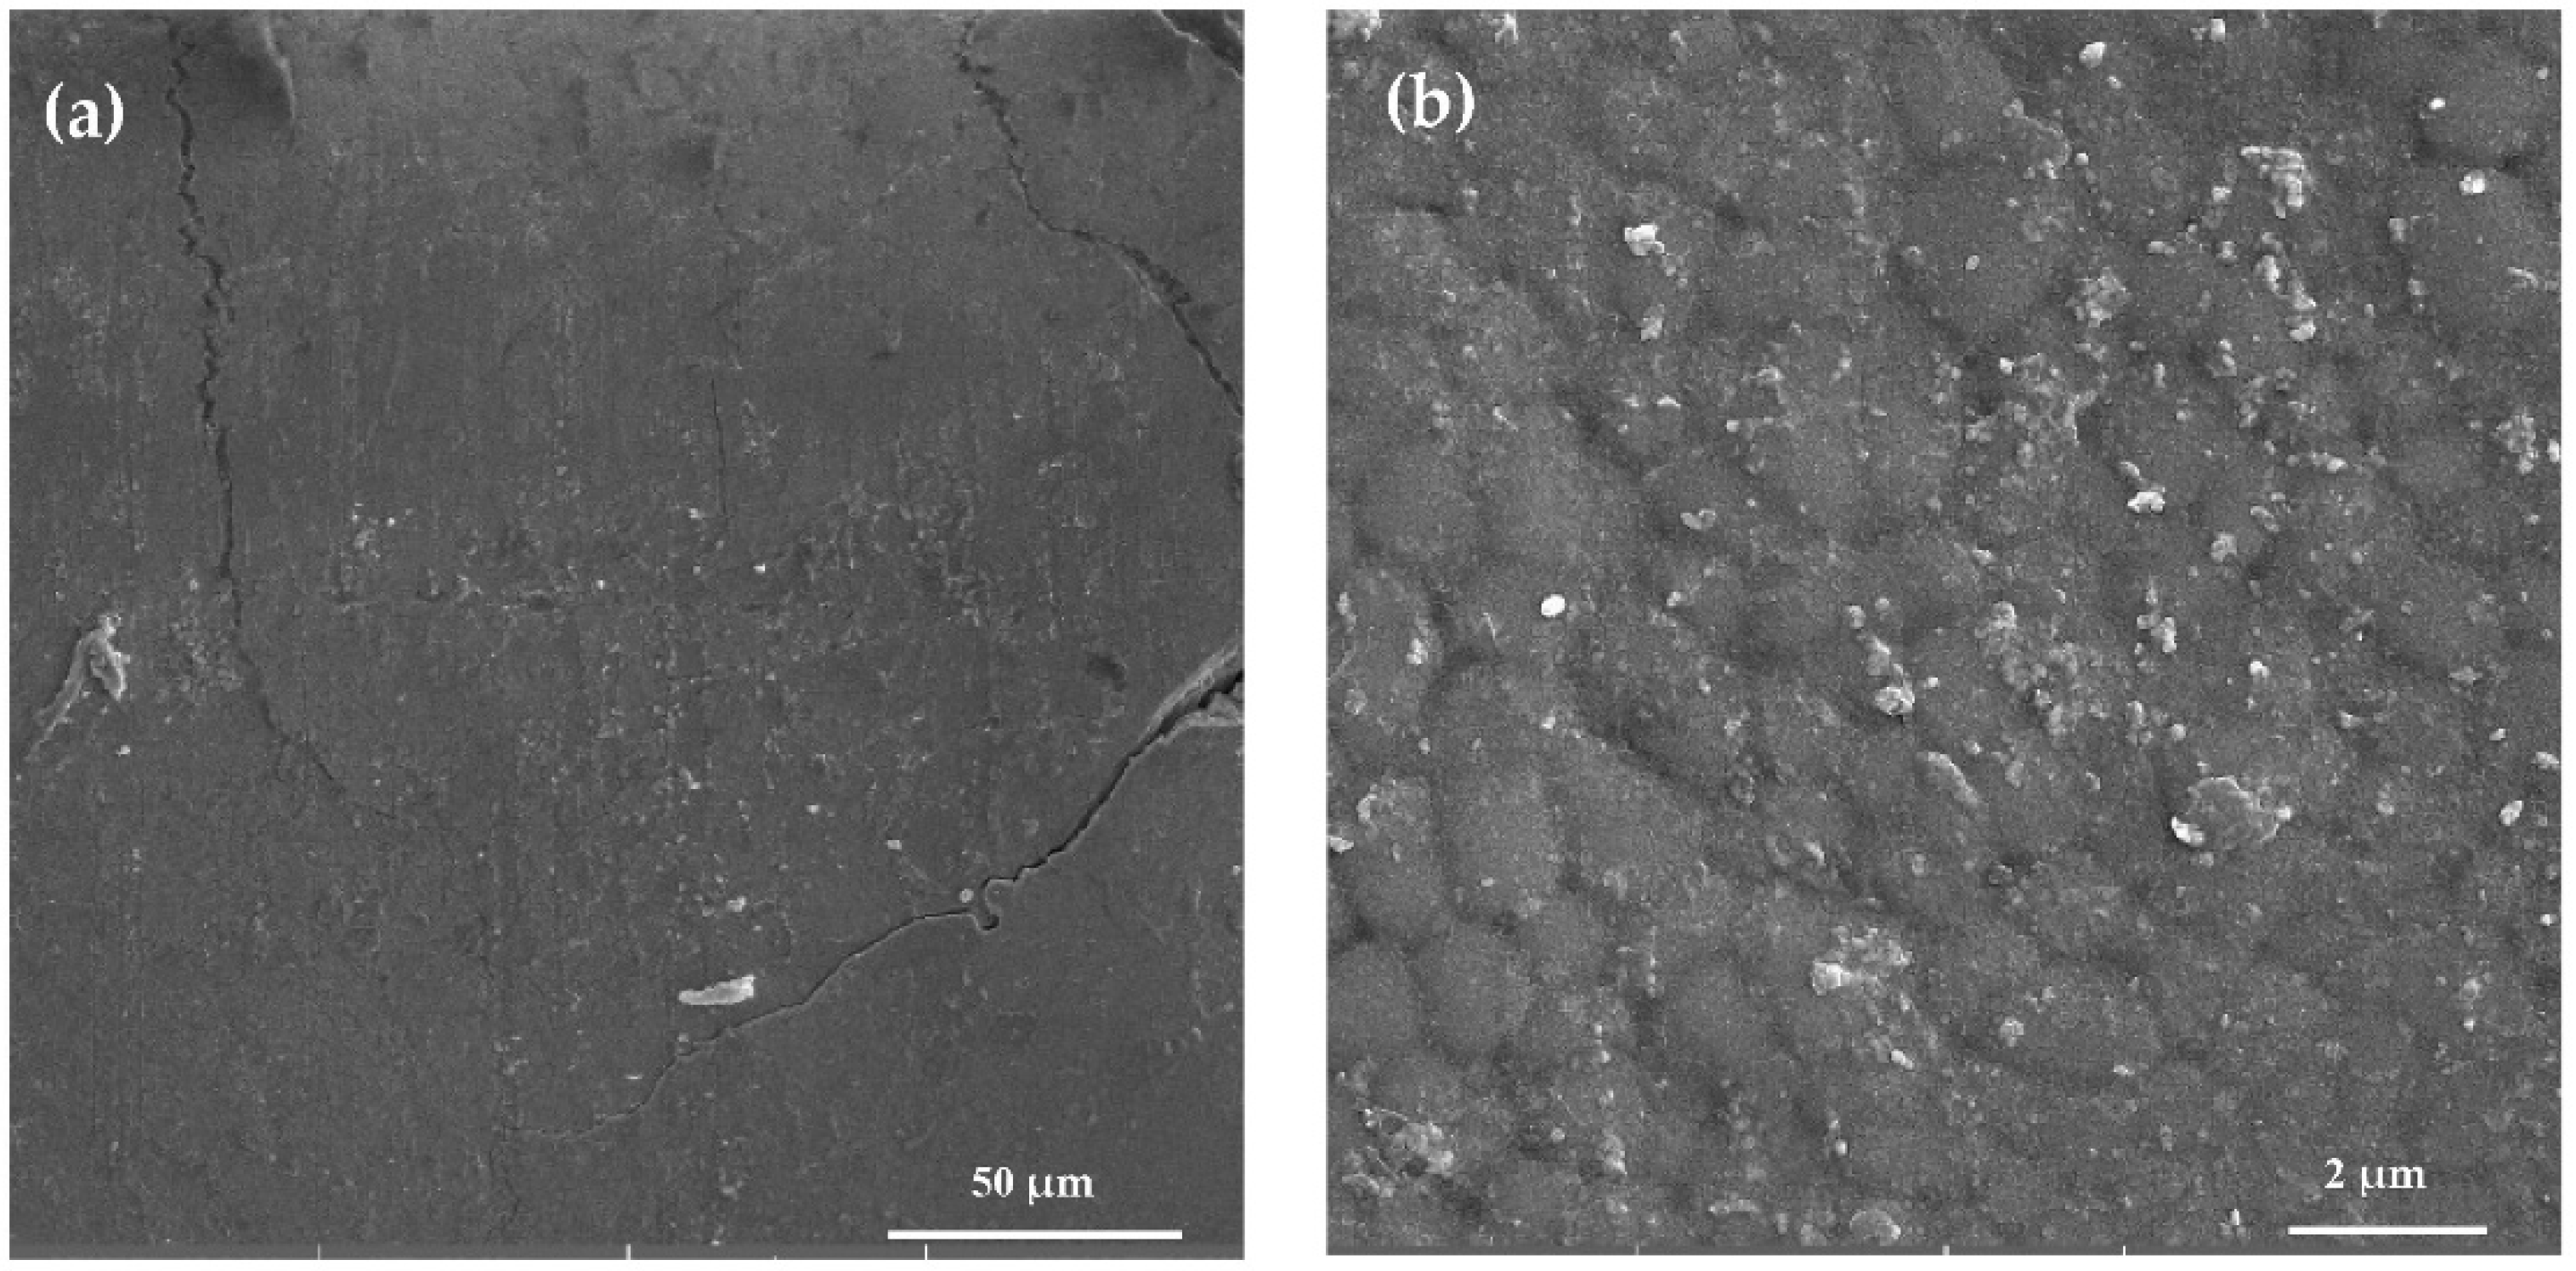
Figure 6 demonstrates the surface top view of the direct-laser-sintered EPD overlay. An obvious change in the surface structure can be observed. At a low magnification,
Figure 6a shows a smooth appearance and a network of segmented cracks distributed throughout the whole laser-treated surface. Grain refinement can be observed at a high magnification in
Figure 6b. The cells are distributed in different sizes, which reflects the solidification mechanism occurring after laser treatment, associated with a high cooling rate [
28]. The laser’s interaction with the nonhomogeneous surface causes different temperature absorption areas, resulting in different solidification rates.
Figure 6.
FE-SEM with (a) low and (b) higher magnification of the upper surface subjected to direct laser sintering, showing the small network of cracks and cells.
Figure 6.
FE-SEM with (a) low and (b) higher magnification of the upper surface subjected to direct laser sintering, showing the small network of cracks and cells.
It can be concluded that it is possible to use the laser beam to directly sinter and modify the green EPD overlay in one step, instead of sintering the green layer using an electrical furnace followed by modification of the surface using a laser beam (two steps). Our selection of the appropriate laser parameters (power, scanning speed, and pulse length) resulted in continuous and consistent laser tracks. A power density of 150 Wmm
−2 and specific energy of 8.593 Jmm
−2 are sufficient to produce densified and homogeneous ceramic coatings.
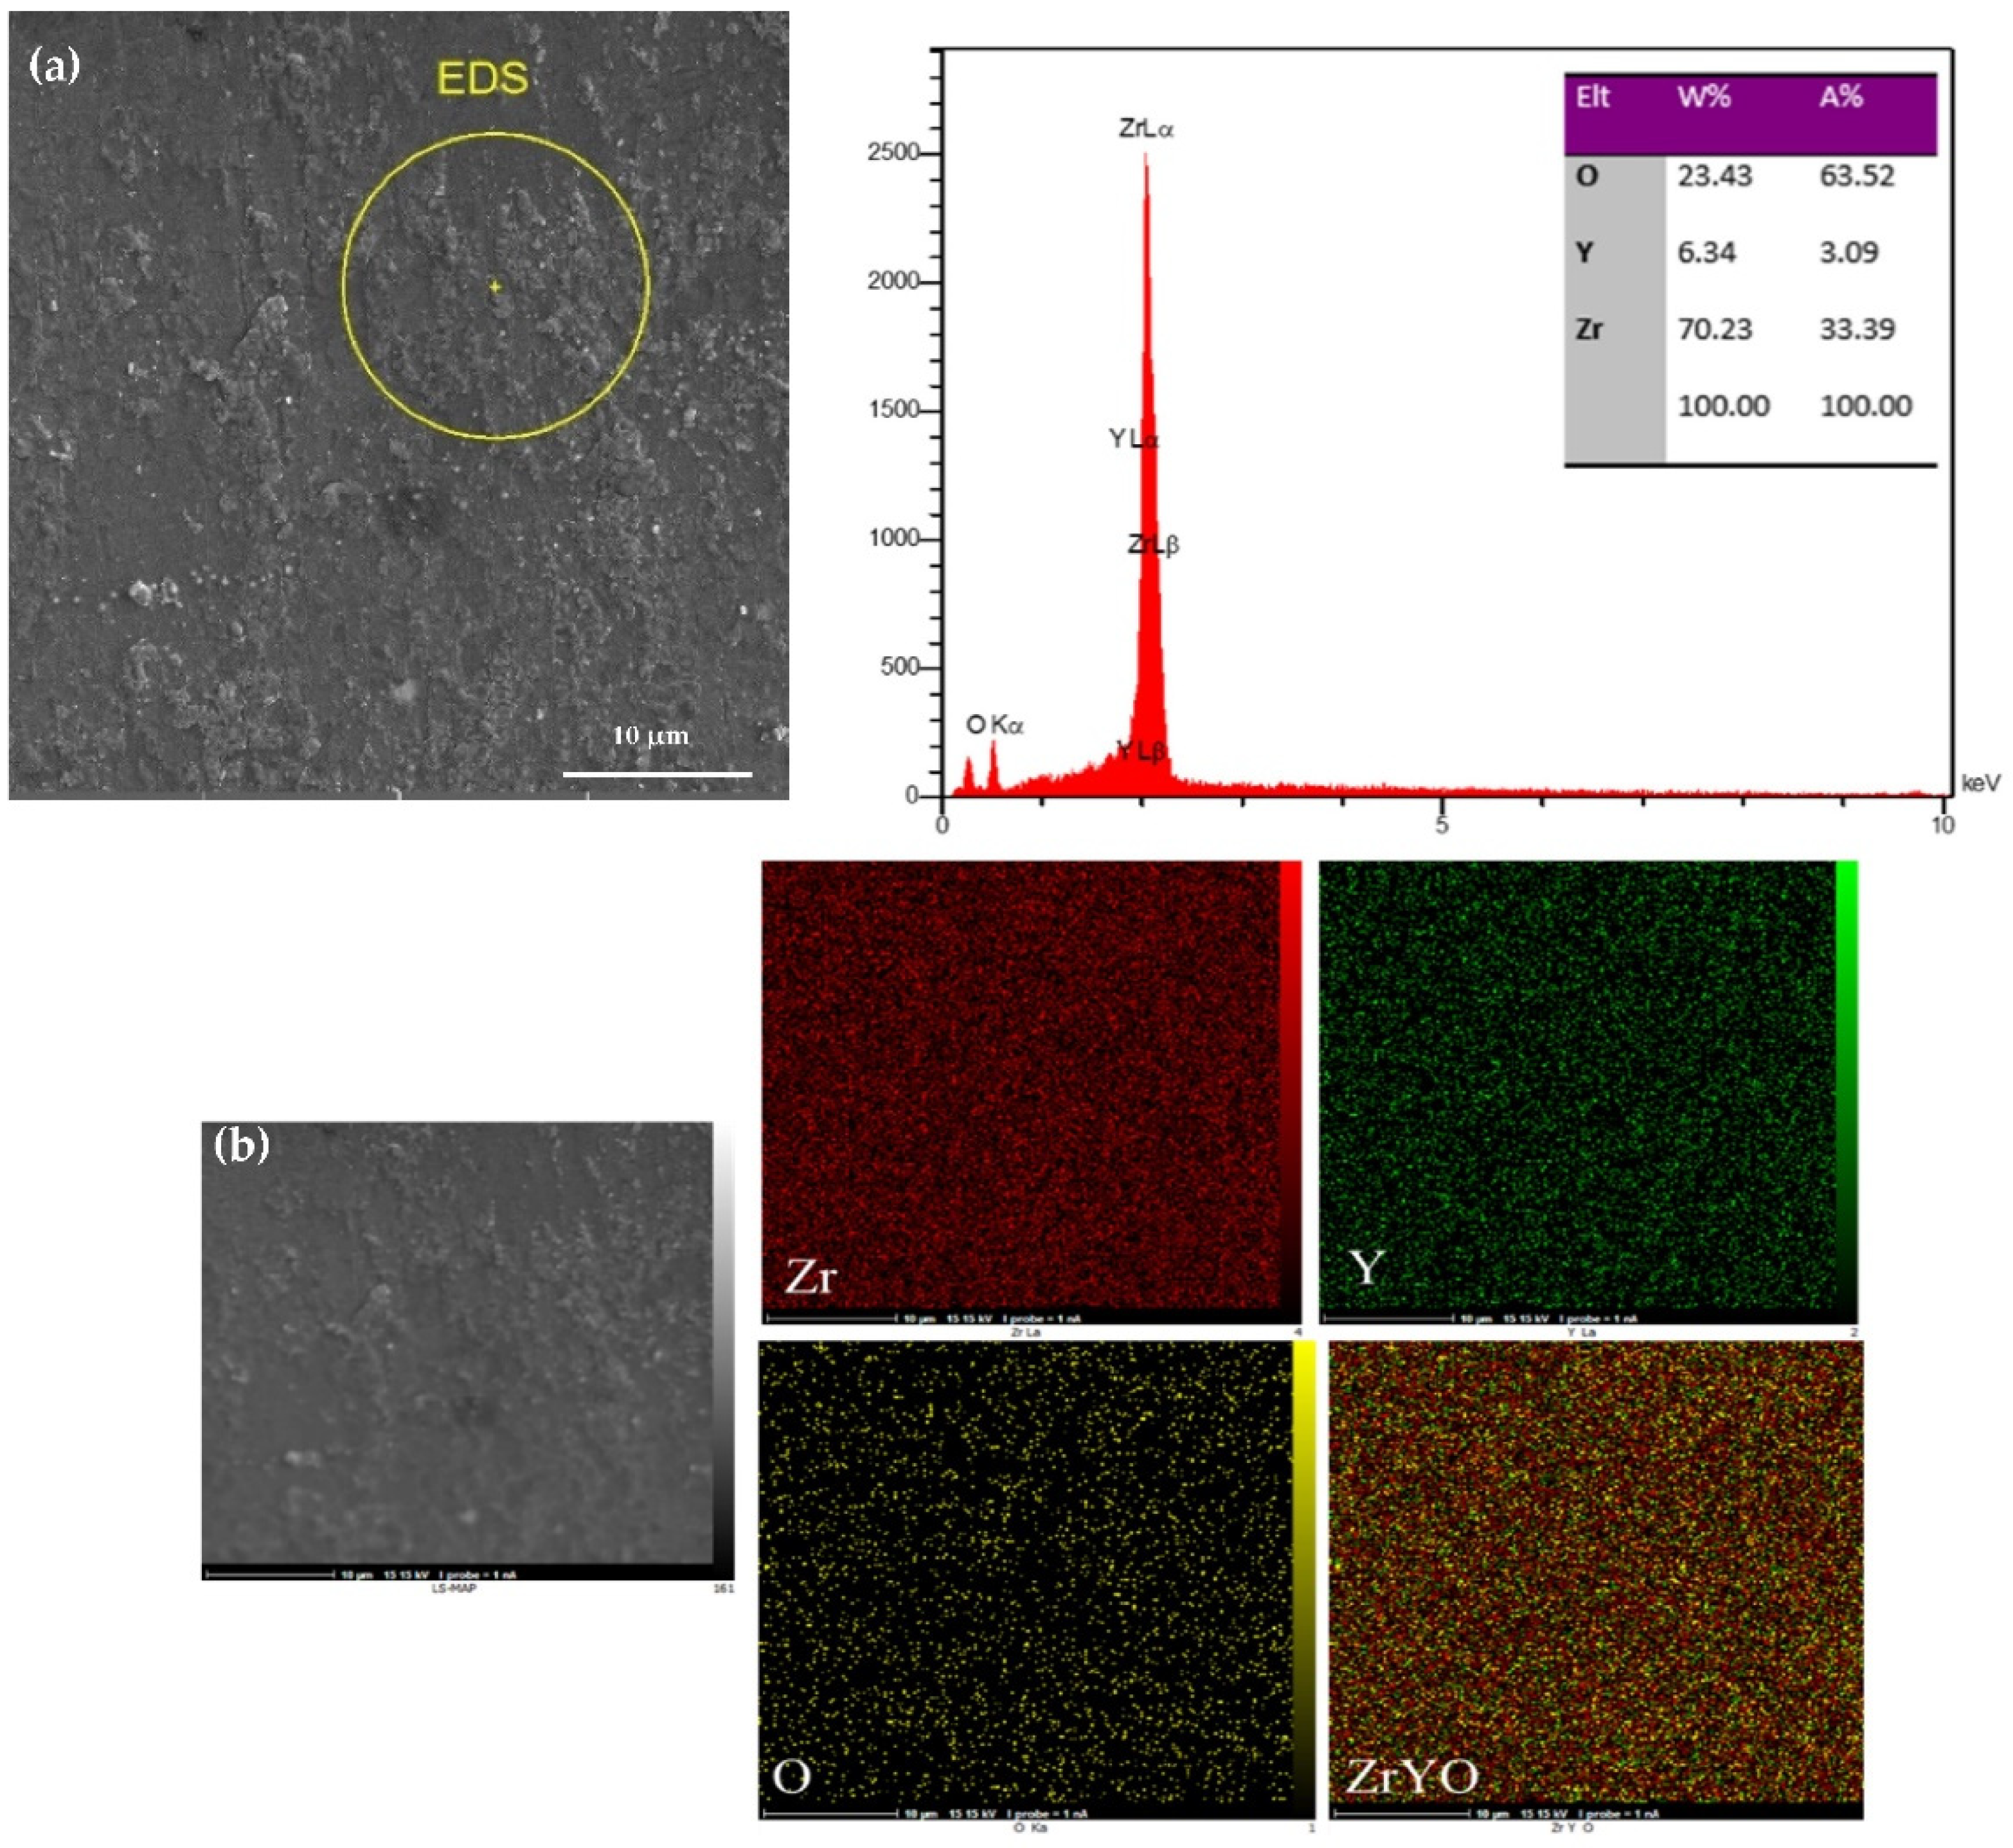
Figure 7a demonstrates the consistent distribution of elements (Zr, O, and Y) in the surface layer, with the mapping shown in
Figure 7b.
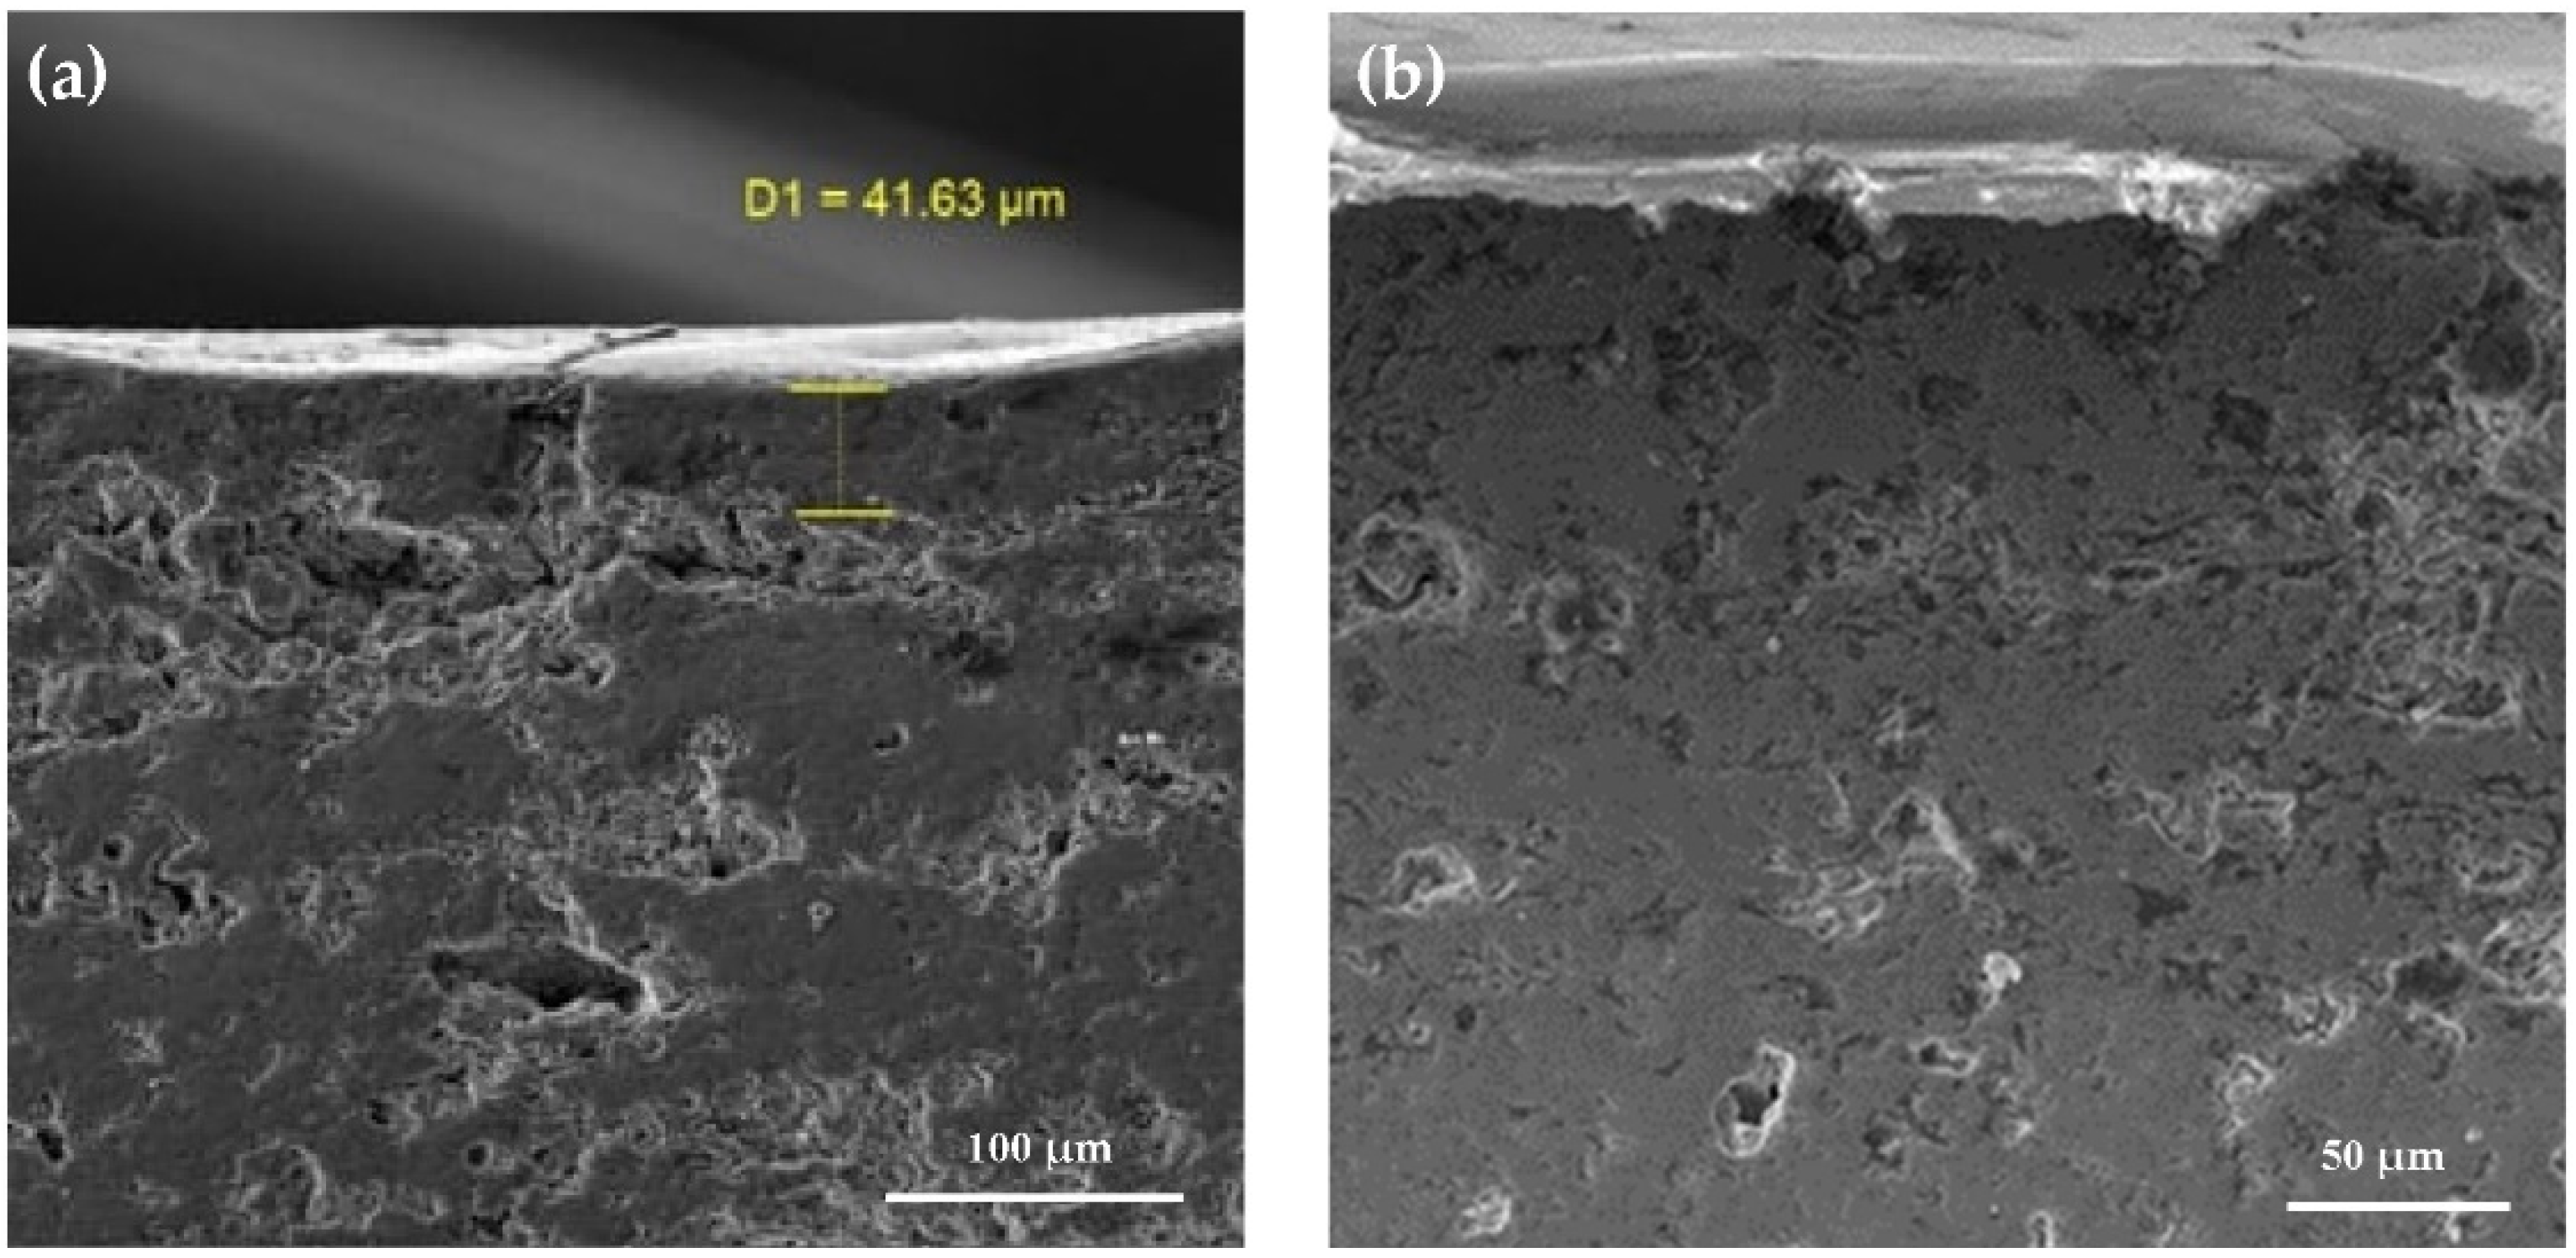
The cross-sectional FE-SEM micrograph of the green EPD overlay coating after laser sintering is illustrated in
Figure 8. The laser irradiation beam produced a remelted overlay with a densified microstructure and a network of segmented cracks, which are perpendicular to the surface. The maximum depth of complete laser melting was measured from the FE-SEM images at approximately 41 µm [
12].
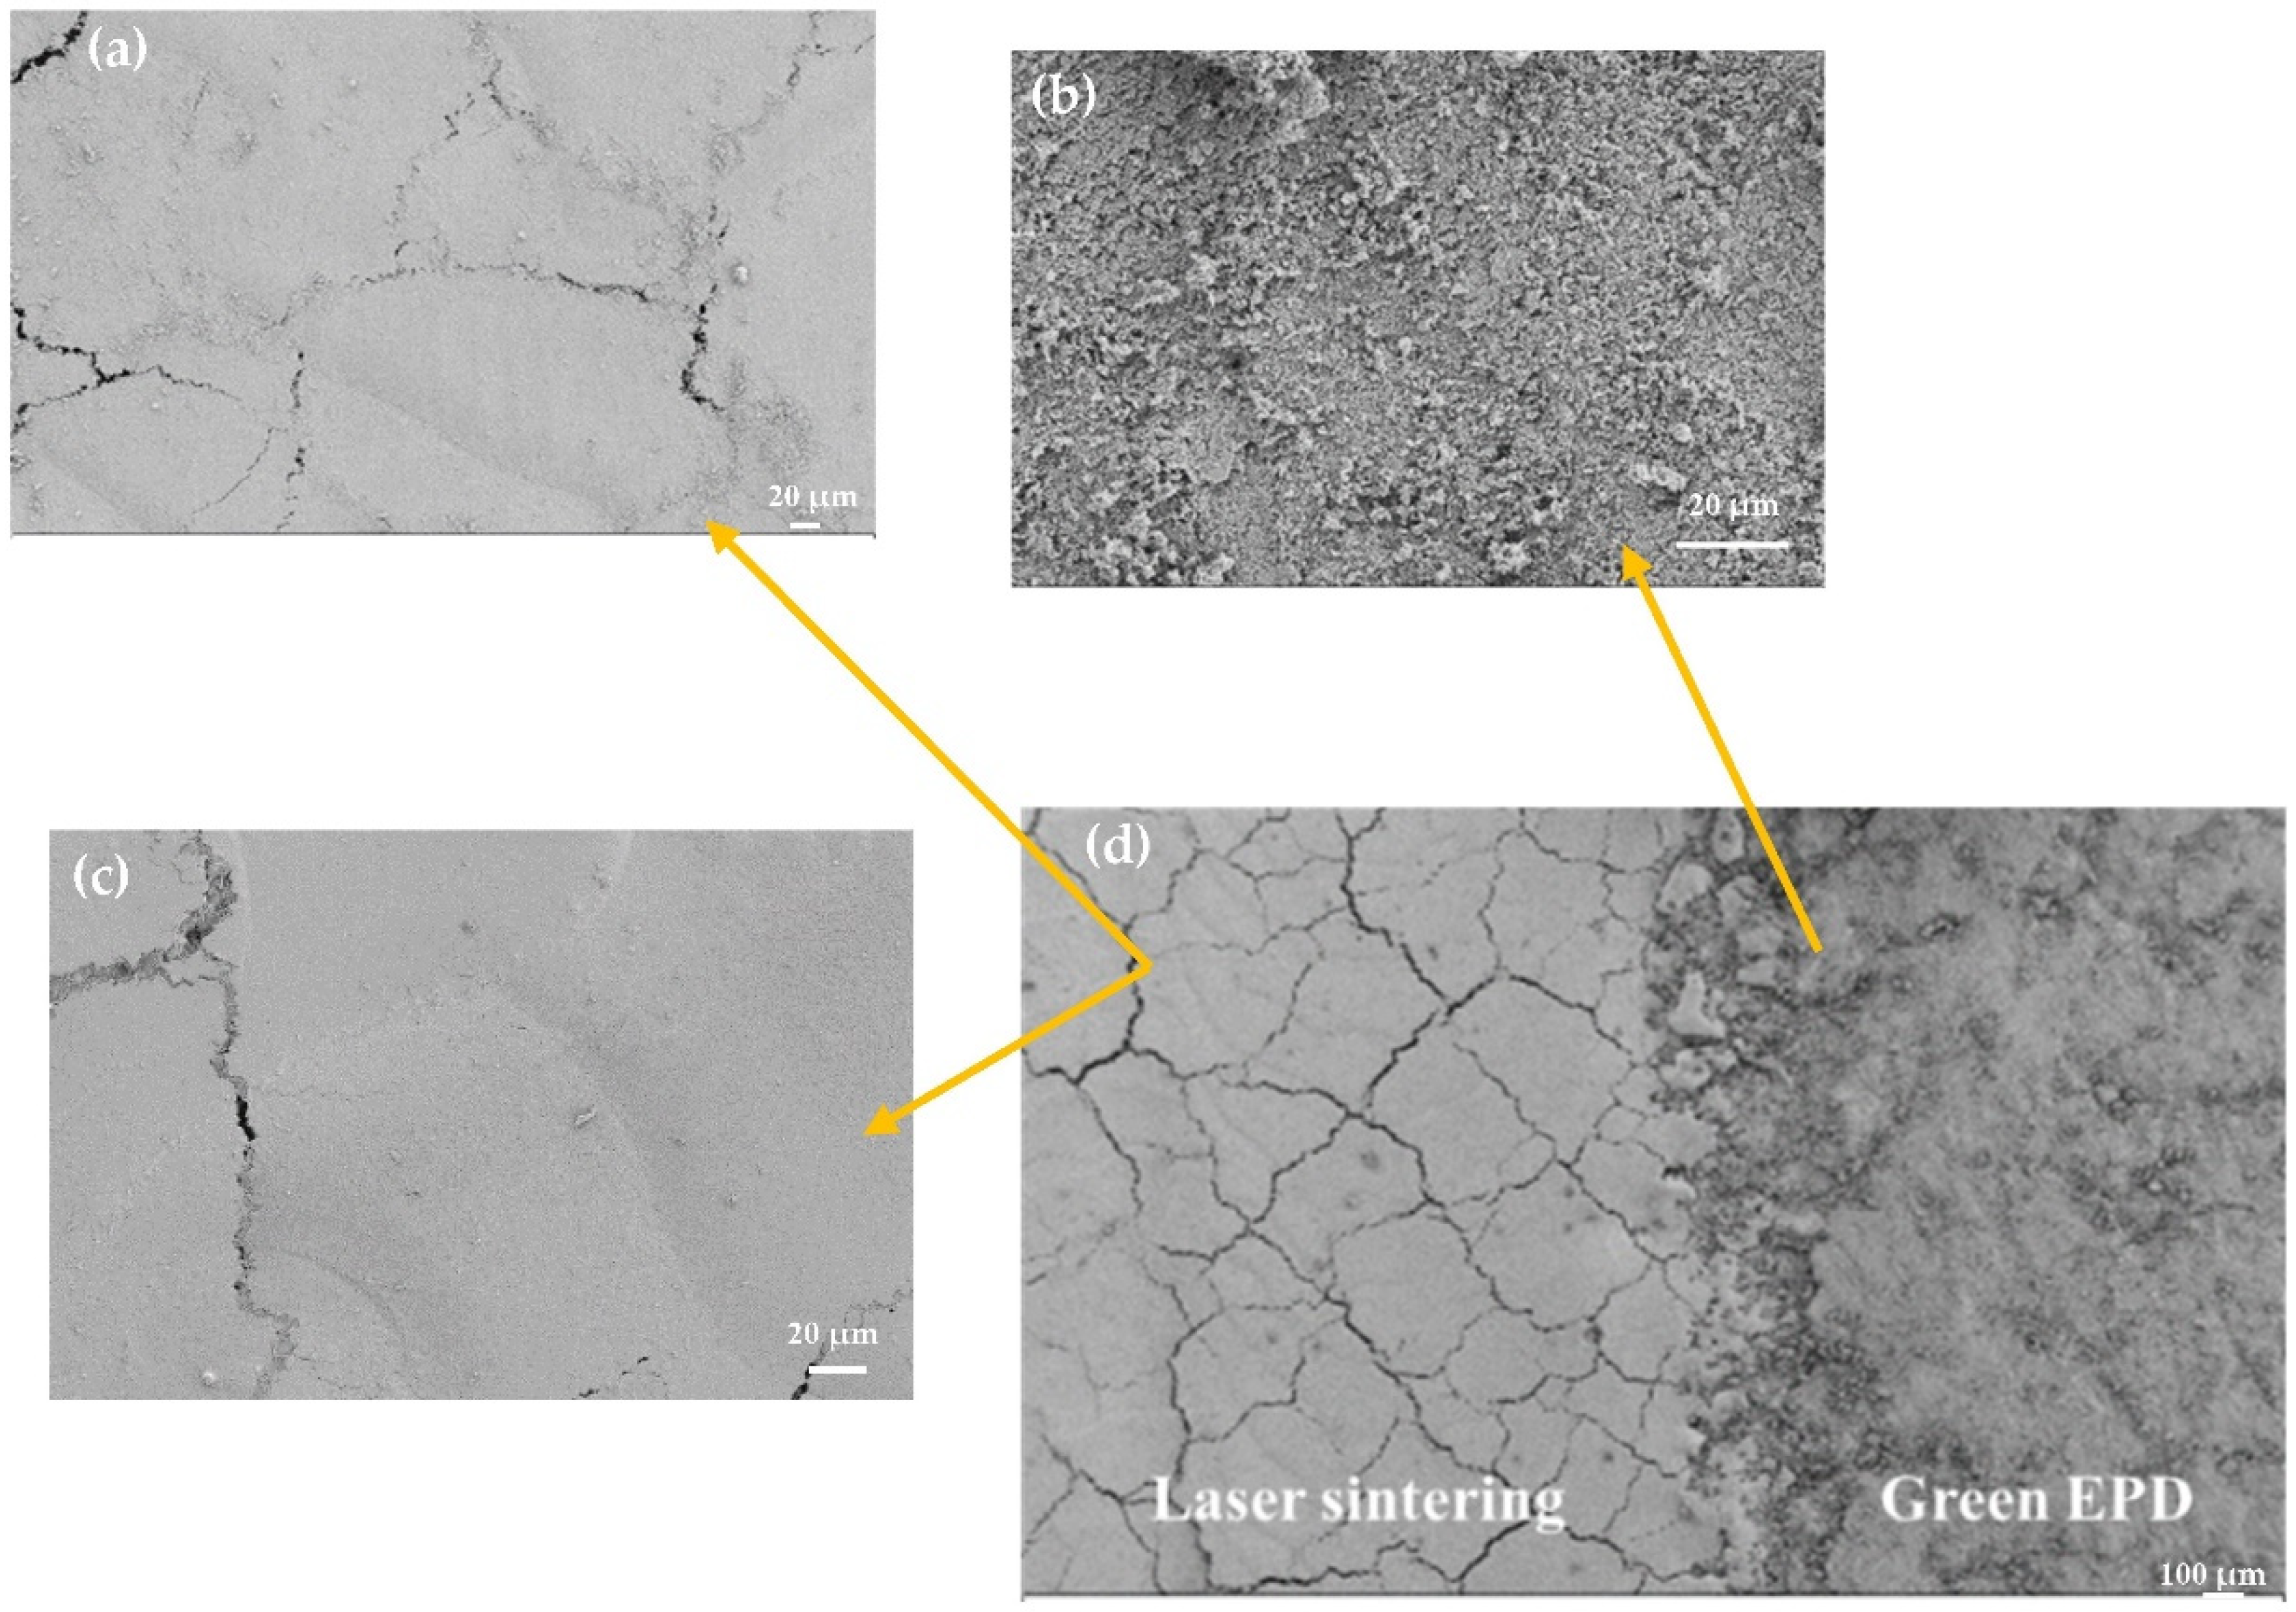
The FE-SEM micrograph of the interface between the YSZ EPD overlay and the direct laser sintering region is presented in
Figure 9, which shows the contrast. It can be revealed that the laser sintering track has a completely different microstructure than those of the EPD region when the heat input is sufficient for surface remelting. It can be concluded that the heat input of 13.75 J/mm was sufficient to sinter and modify the green EPD overlay.
Figure 7.
(a) EDS analysis with (b) mapping after the direct laser sintering process for the EPD overlay.
Figure 7.
(a) EDS analysis with (b) mapping after the direct laser sintering process for the EPD overlay.
Figure 8.
The cross-section of the densified green EPD overlay subjected to direct laser sintering, showing (a) the maximum depth of melting and (b) the general appearance.
Figure 8.
The cross-section of the densified green EPD overlay subjected to direct laser sintering, showing (a) the maximum depth of melting and (b) the general appearance.
Figure 9.
FE-SEM for the interface between the EPD overlay and the direct laser sintering region showing the surface modification (a,c), laser sintering region, (b) EPD overlay region, and (d) the contact between two regions.
Figure 9.
FE-SEM for the interface between the EPD overlay and the direct laser sintering region showing the surface modification (a,c), laser sintering region, (b) EPD overlay region, and (d) the contact between two regions.
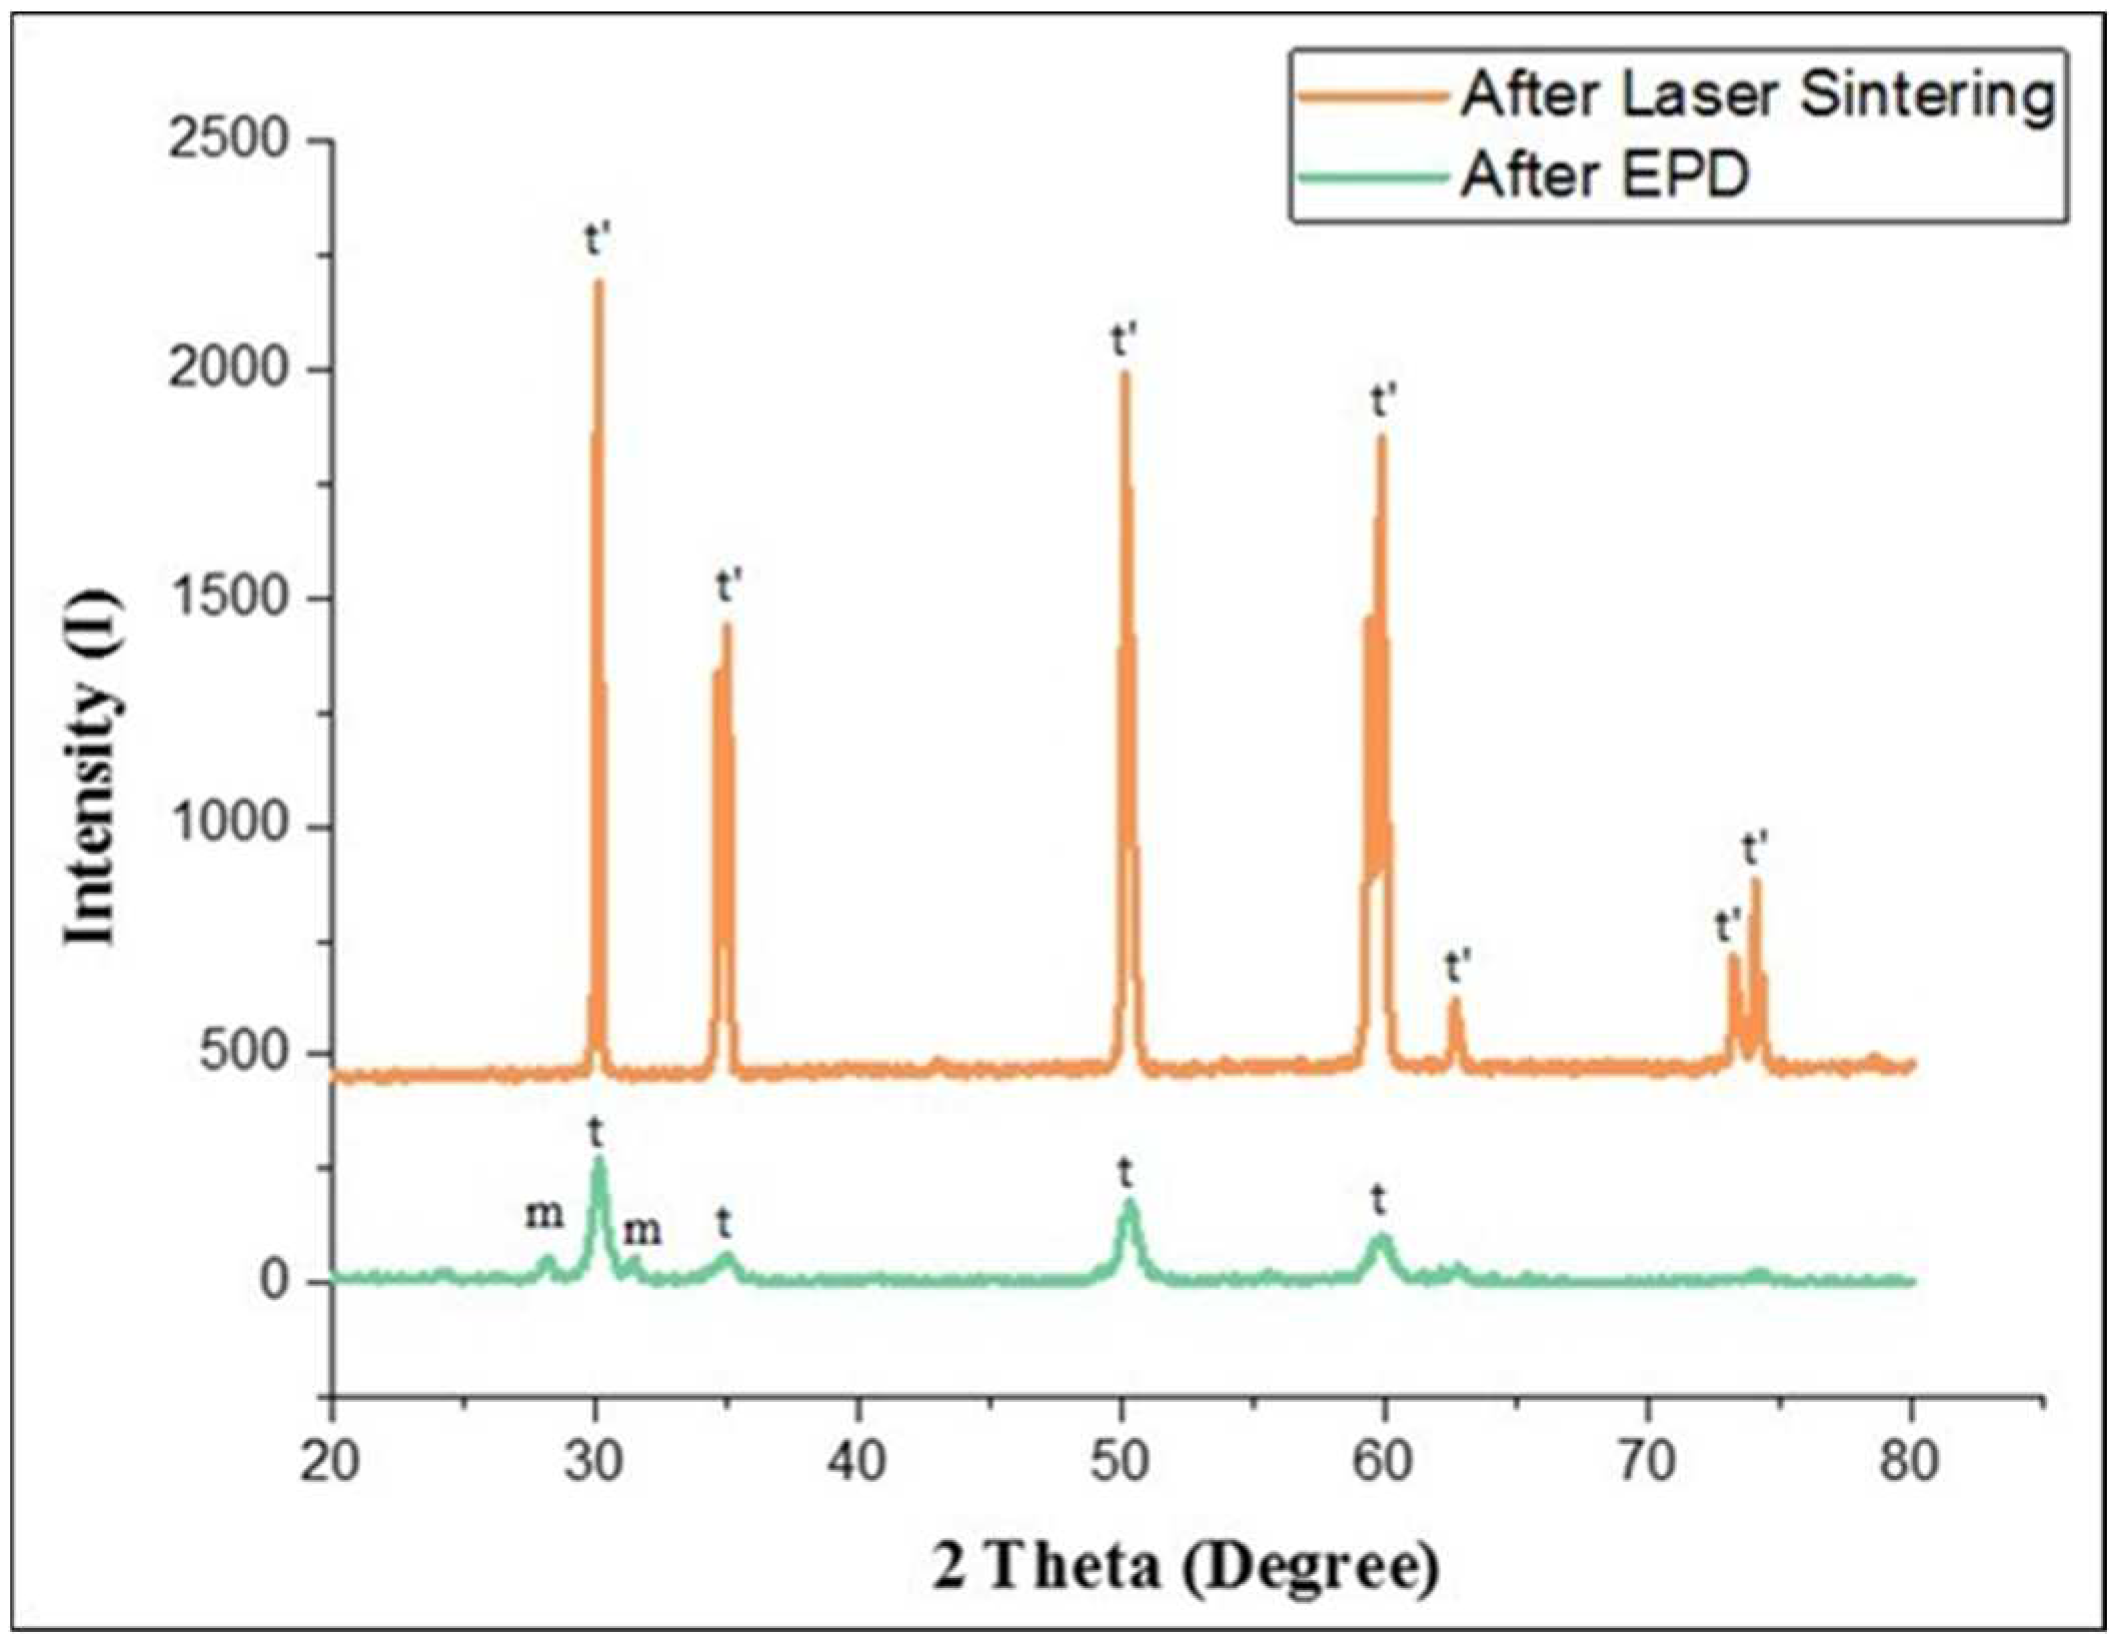
Figure 10 shows the XRD pattern of the green YSZ overlay deposited via the EPD method. It demonstrates that the structure consists of transformable tetragonal (t) phases as a predominant phase, with a minimal monoclinic (m) phase, while the direct laser sintering process of the YSZ overlay deposited via EPD coating clearly shows the non-transformable (t’) tetragonal phase alone, as shown in
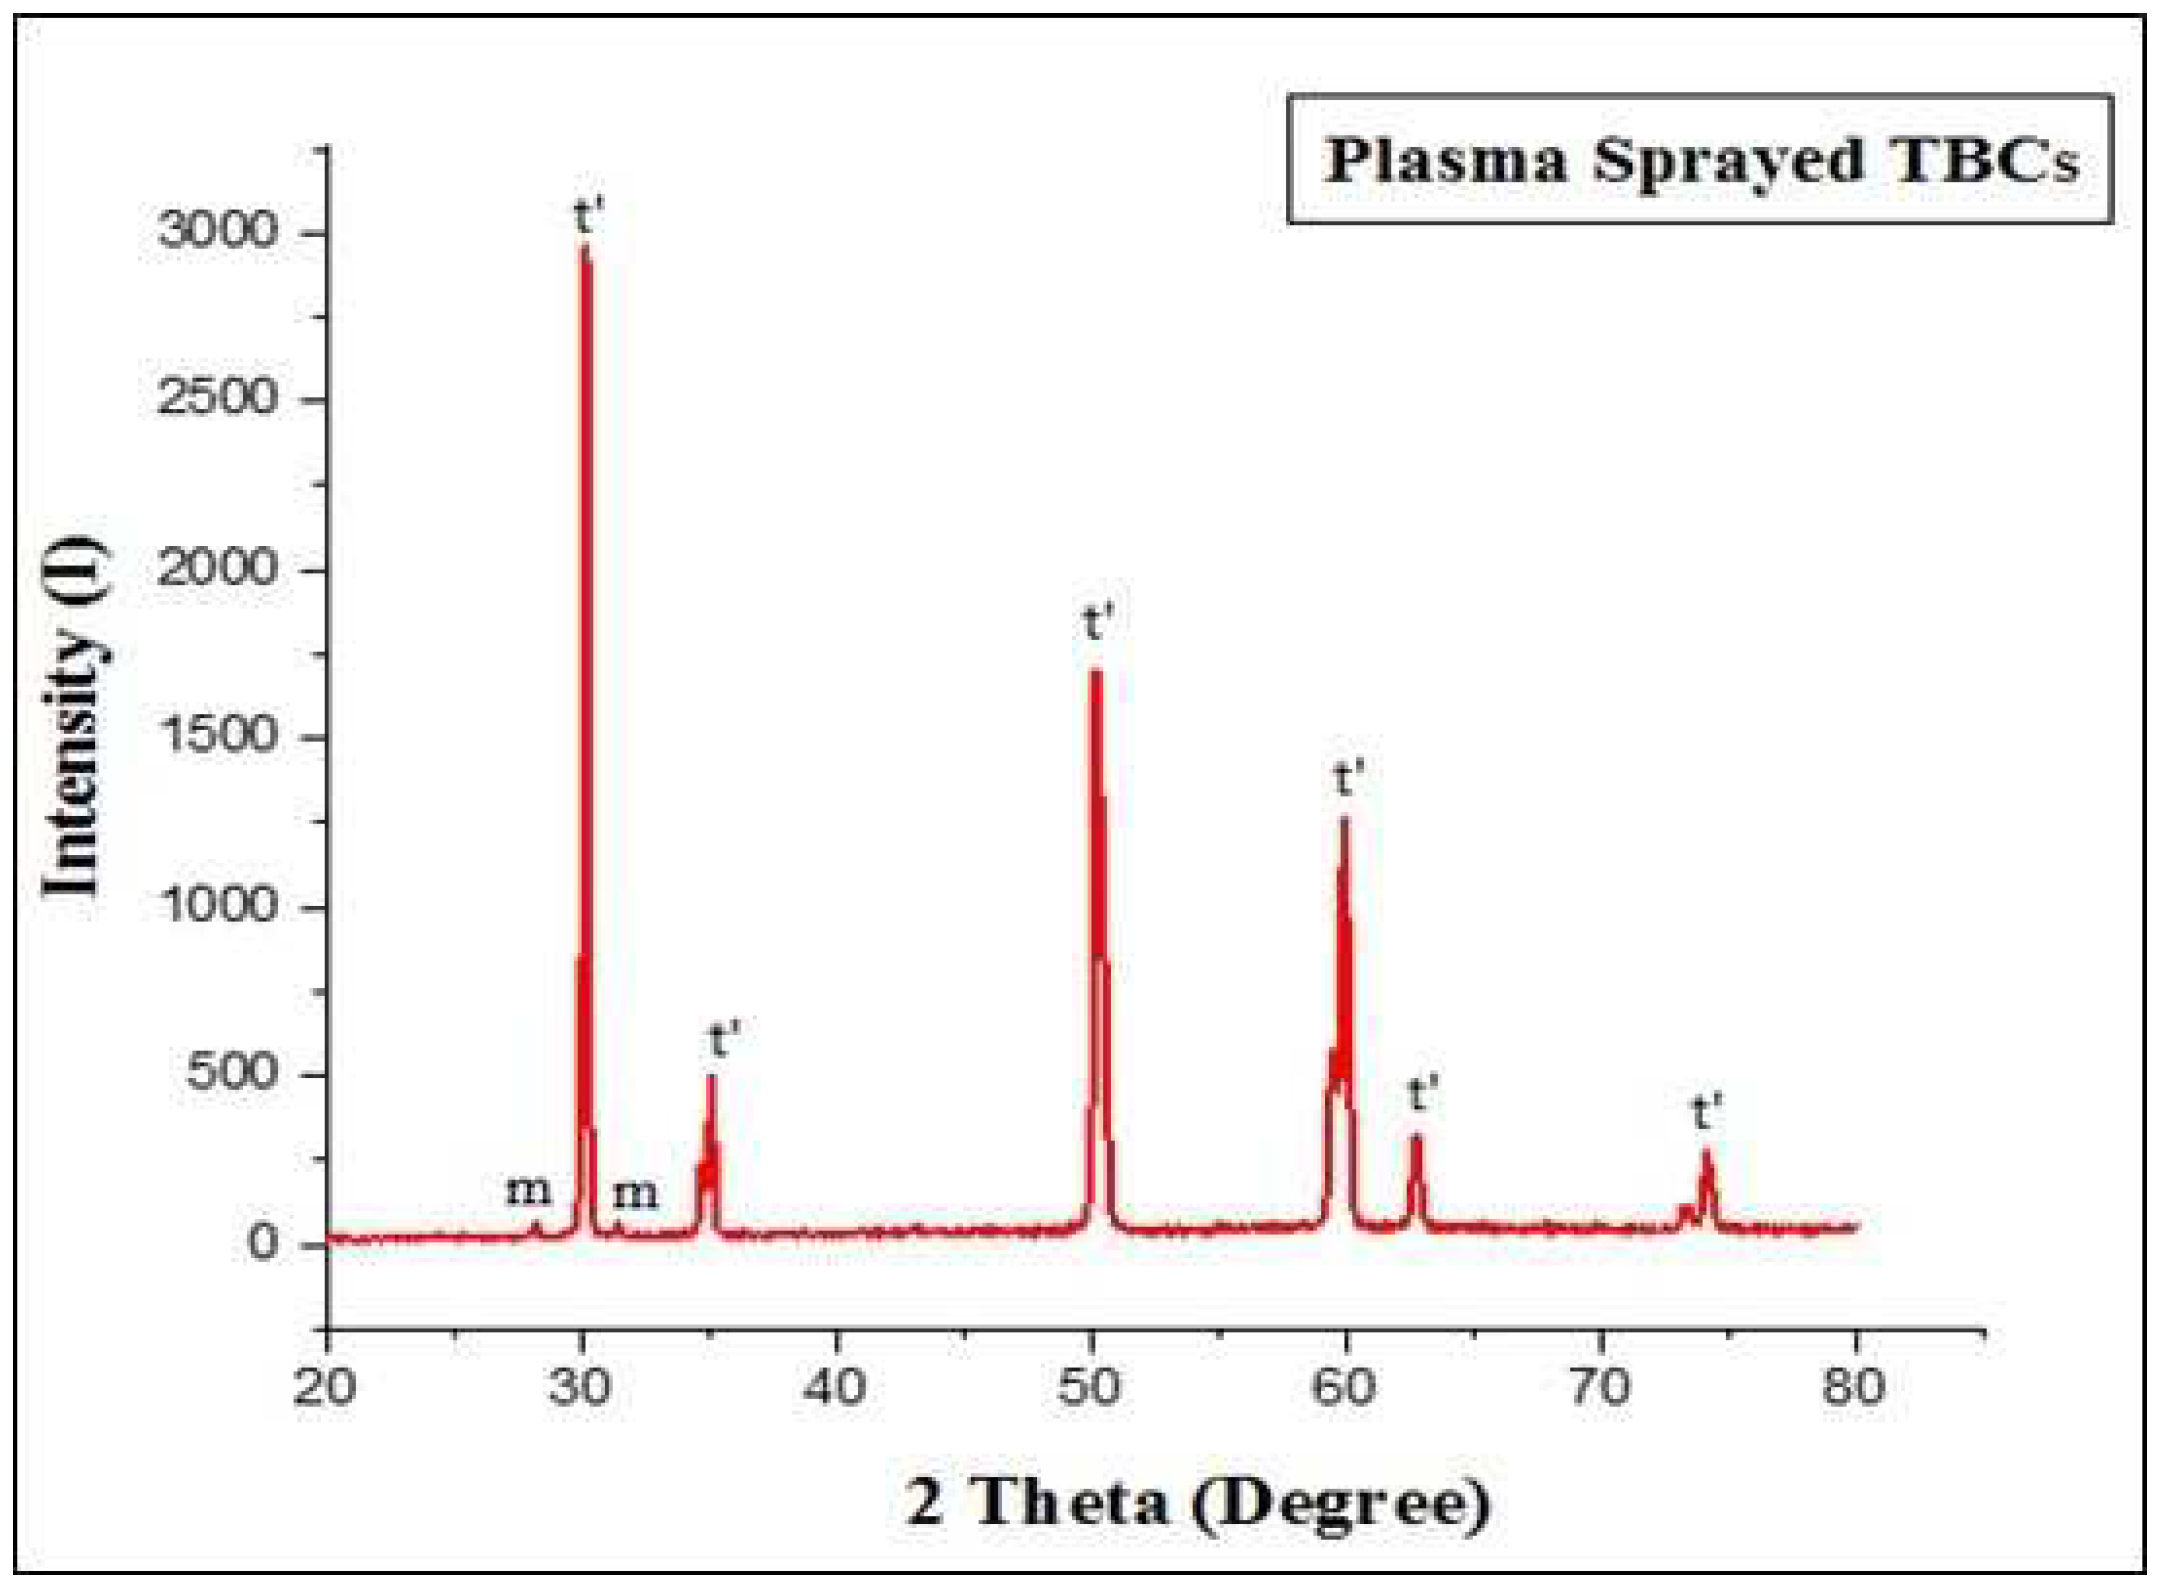
Figure 10. Because the green EPD coating was formed at room temperature, no phase transformation occurred. However, the (t’) phase occurred due to diffusionless transformation as a result of fast cooling during the laser treatment. It is important to mention the absence of a monoclinic phase in the direct laser sintering of the coating. This concerns one of the enhancements in this work, as compared with the plasma-sprayed YSZ thermal barrier coatings shown in
Figure 11. It can be observed that the coating consists of a non-transformable (t’) tetragonal phase, containing a minimal monoclinic (m) phase. Top coat oxide phase stability is an essential factor in optimizing TBC performance. This means that the presence of the (m) phase is likely to lead to subsequent transformations during the service of the coating layer, in contrast to the presence of the non-transformed (t’) phase, which increases the stability of the coating.
Figure 10.
XRD pattern of YSZ overlay subjected to the EPD process and after the laser sintering of the overlay.
Figure 10.
XRD pattern of YSZ overlay subjected to the EPD process and after the laser sintering of the overlay.
Figure 11.
XRD pattern of plasma-sprayed YSZ thermal barrier coating.
Figure 11.
XRD pattern of plasma-sprayed YSZ thermal barrier coating.
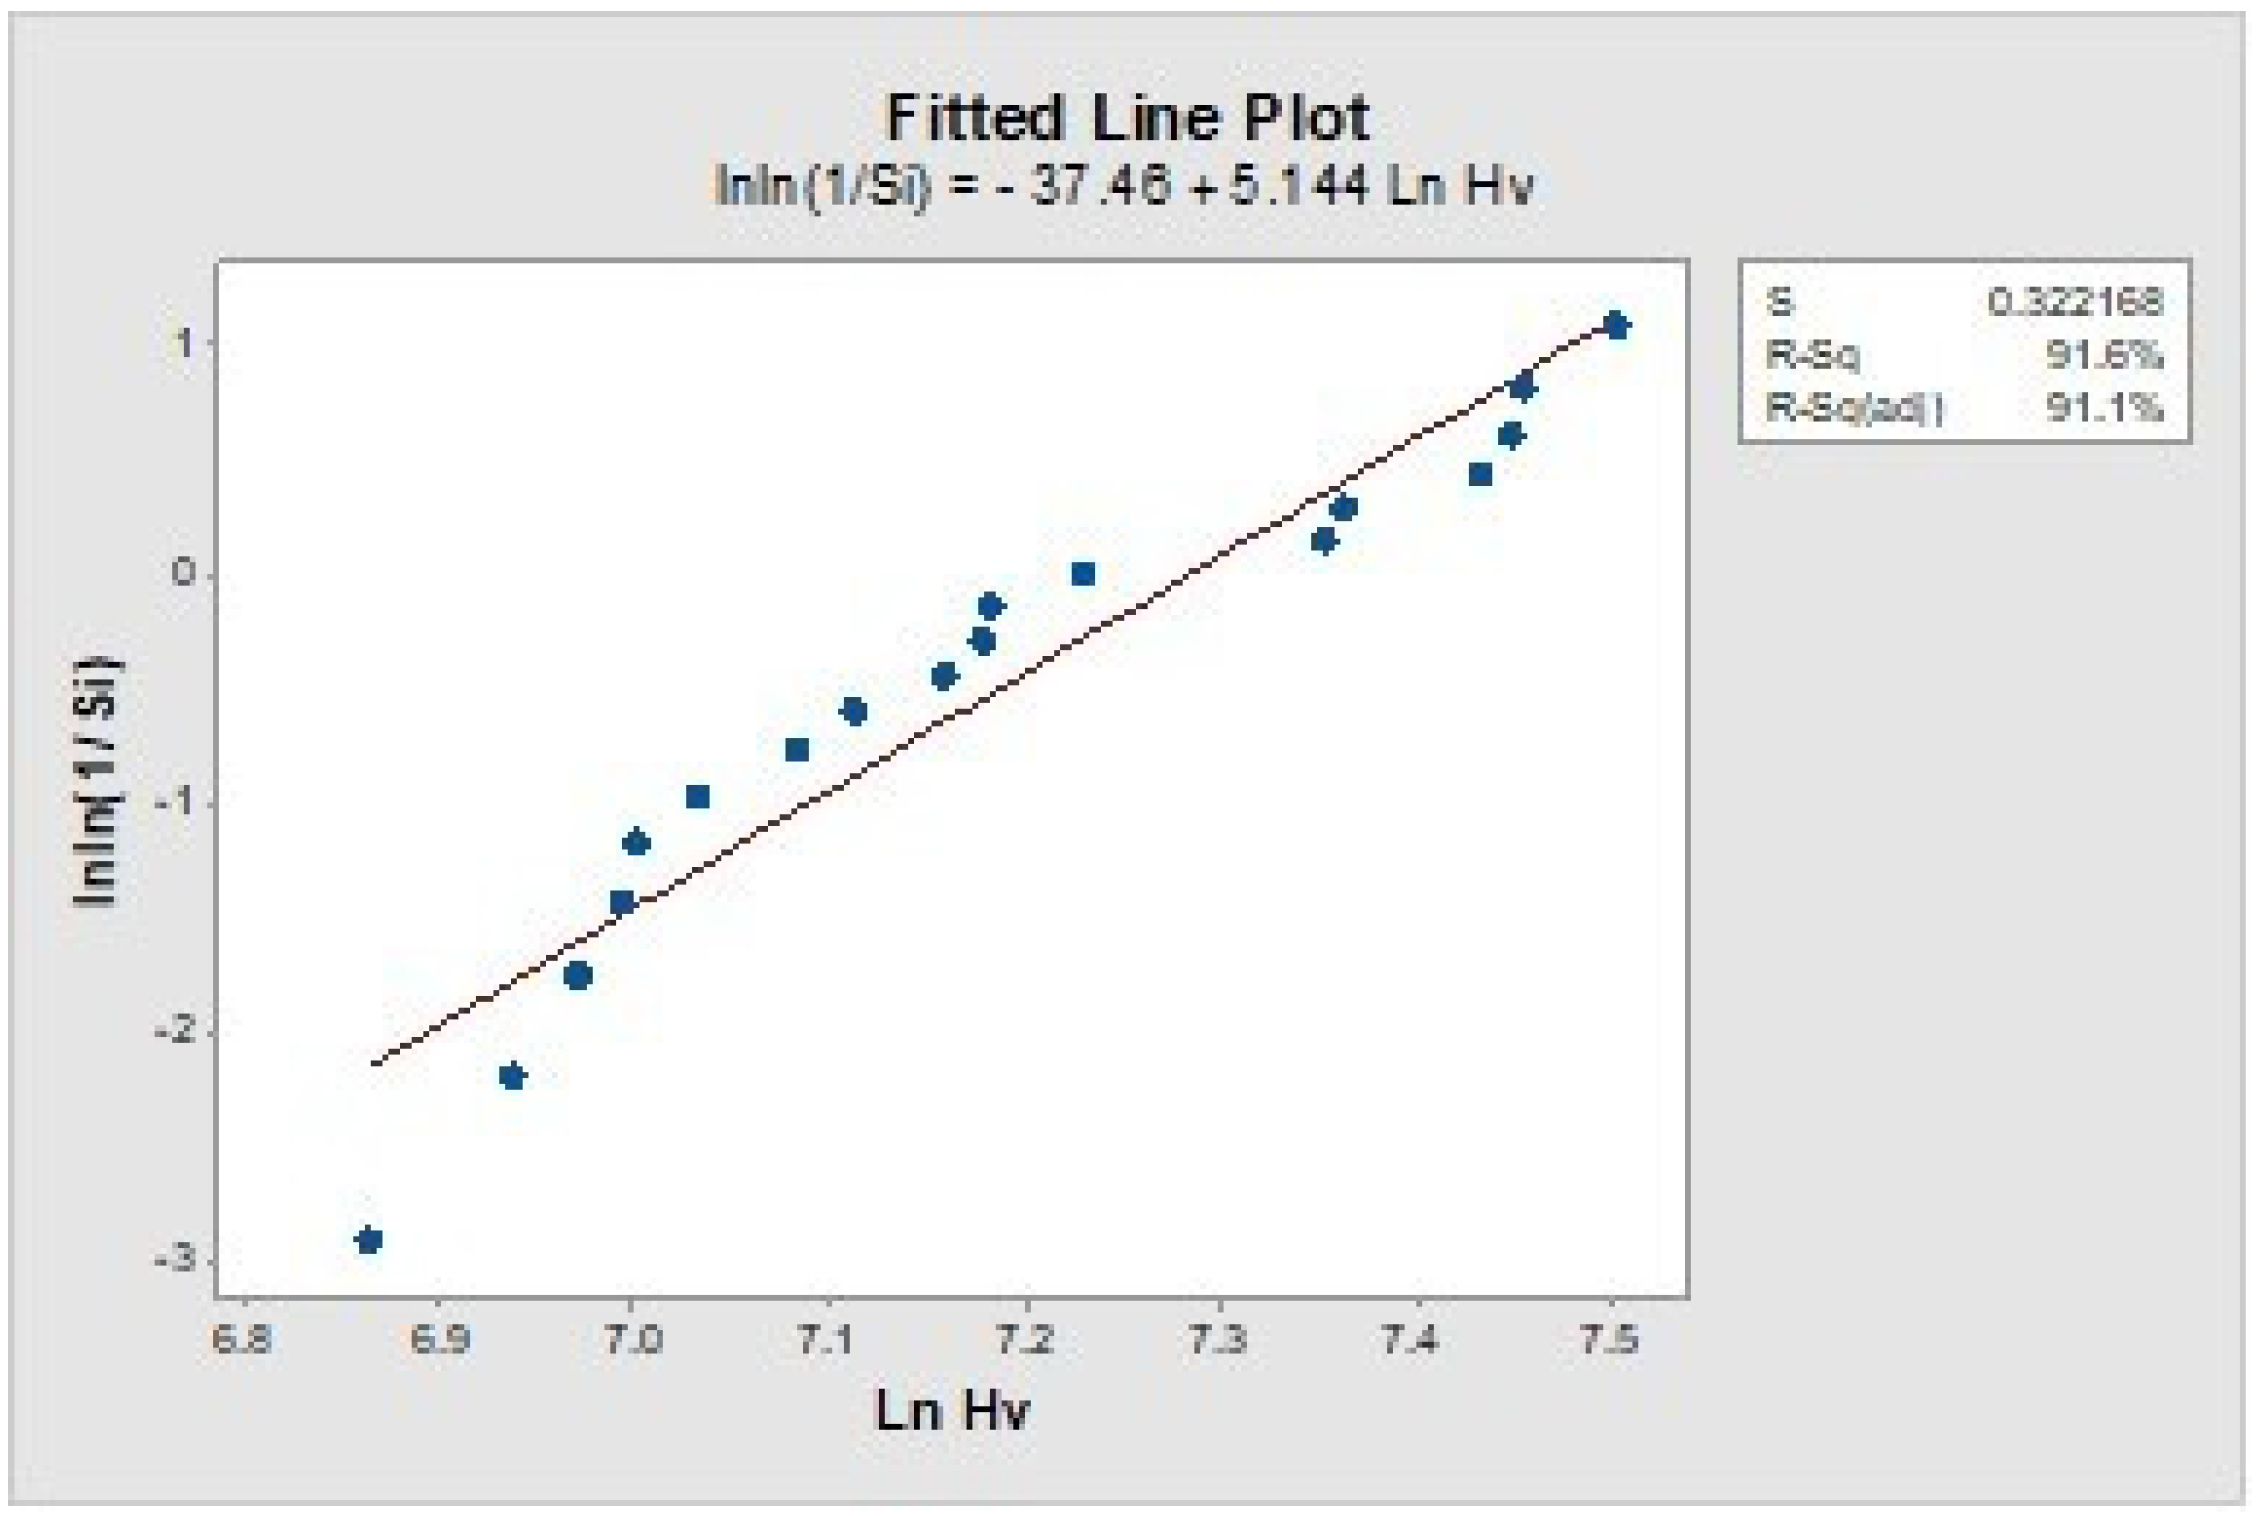
In the microhardness measurements following direct laser sintering (DLS), as demonstrated in
Figure 12 and
Table A1 (
Appendix A), there was significant variance in the hardness value of the same specimen, ranging between (957) and (1809) Hv. Due to the heterogeneous structure of the plasma-sprayed coating, which is composed of (melted, semi-melted, and non-melted) particles on the surface and, as a consequence, contains defects such as pores, with a network of cracks inside the splats [
27], wide scattering from the mean value of the measured feature (microhardness) was observed. Hence, another approach was required to increase the reliability of the investigated property, and Weibull’s distribution approach was applied [
27]. The microhardness value for the plasma-sprayed YSZ thermal barrier coating was only 603 Hv. For more details, see [
27]. In contrast, after the two methods of enhancement, namely, the EPD overlay and laser sintering process, there was an increase in the microhardness value to 1376 Hv. This higher microhardness after the laser sintering process was mostly due to the lack of porosity and fine grains in the remelted zone.
Figure 12.
Weibull’s distribution of microhardness values for laser-modified coatings treated with direct laser sintering (DLS).
Figure 12.
Weibull’s distribution of microhardness values for laser-modified coatings treated with direct laser sintering (DLS).
3.2. Surface Roughness
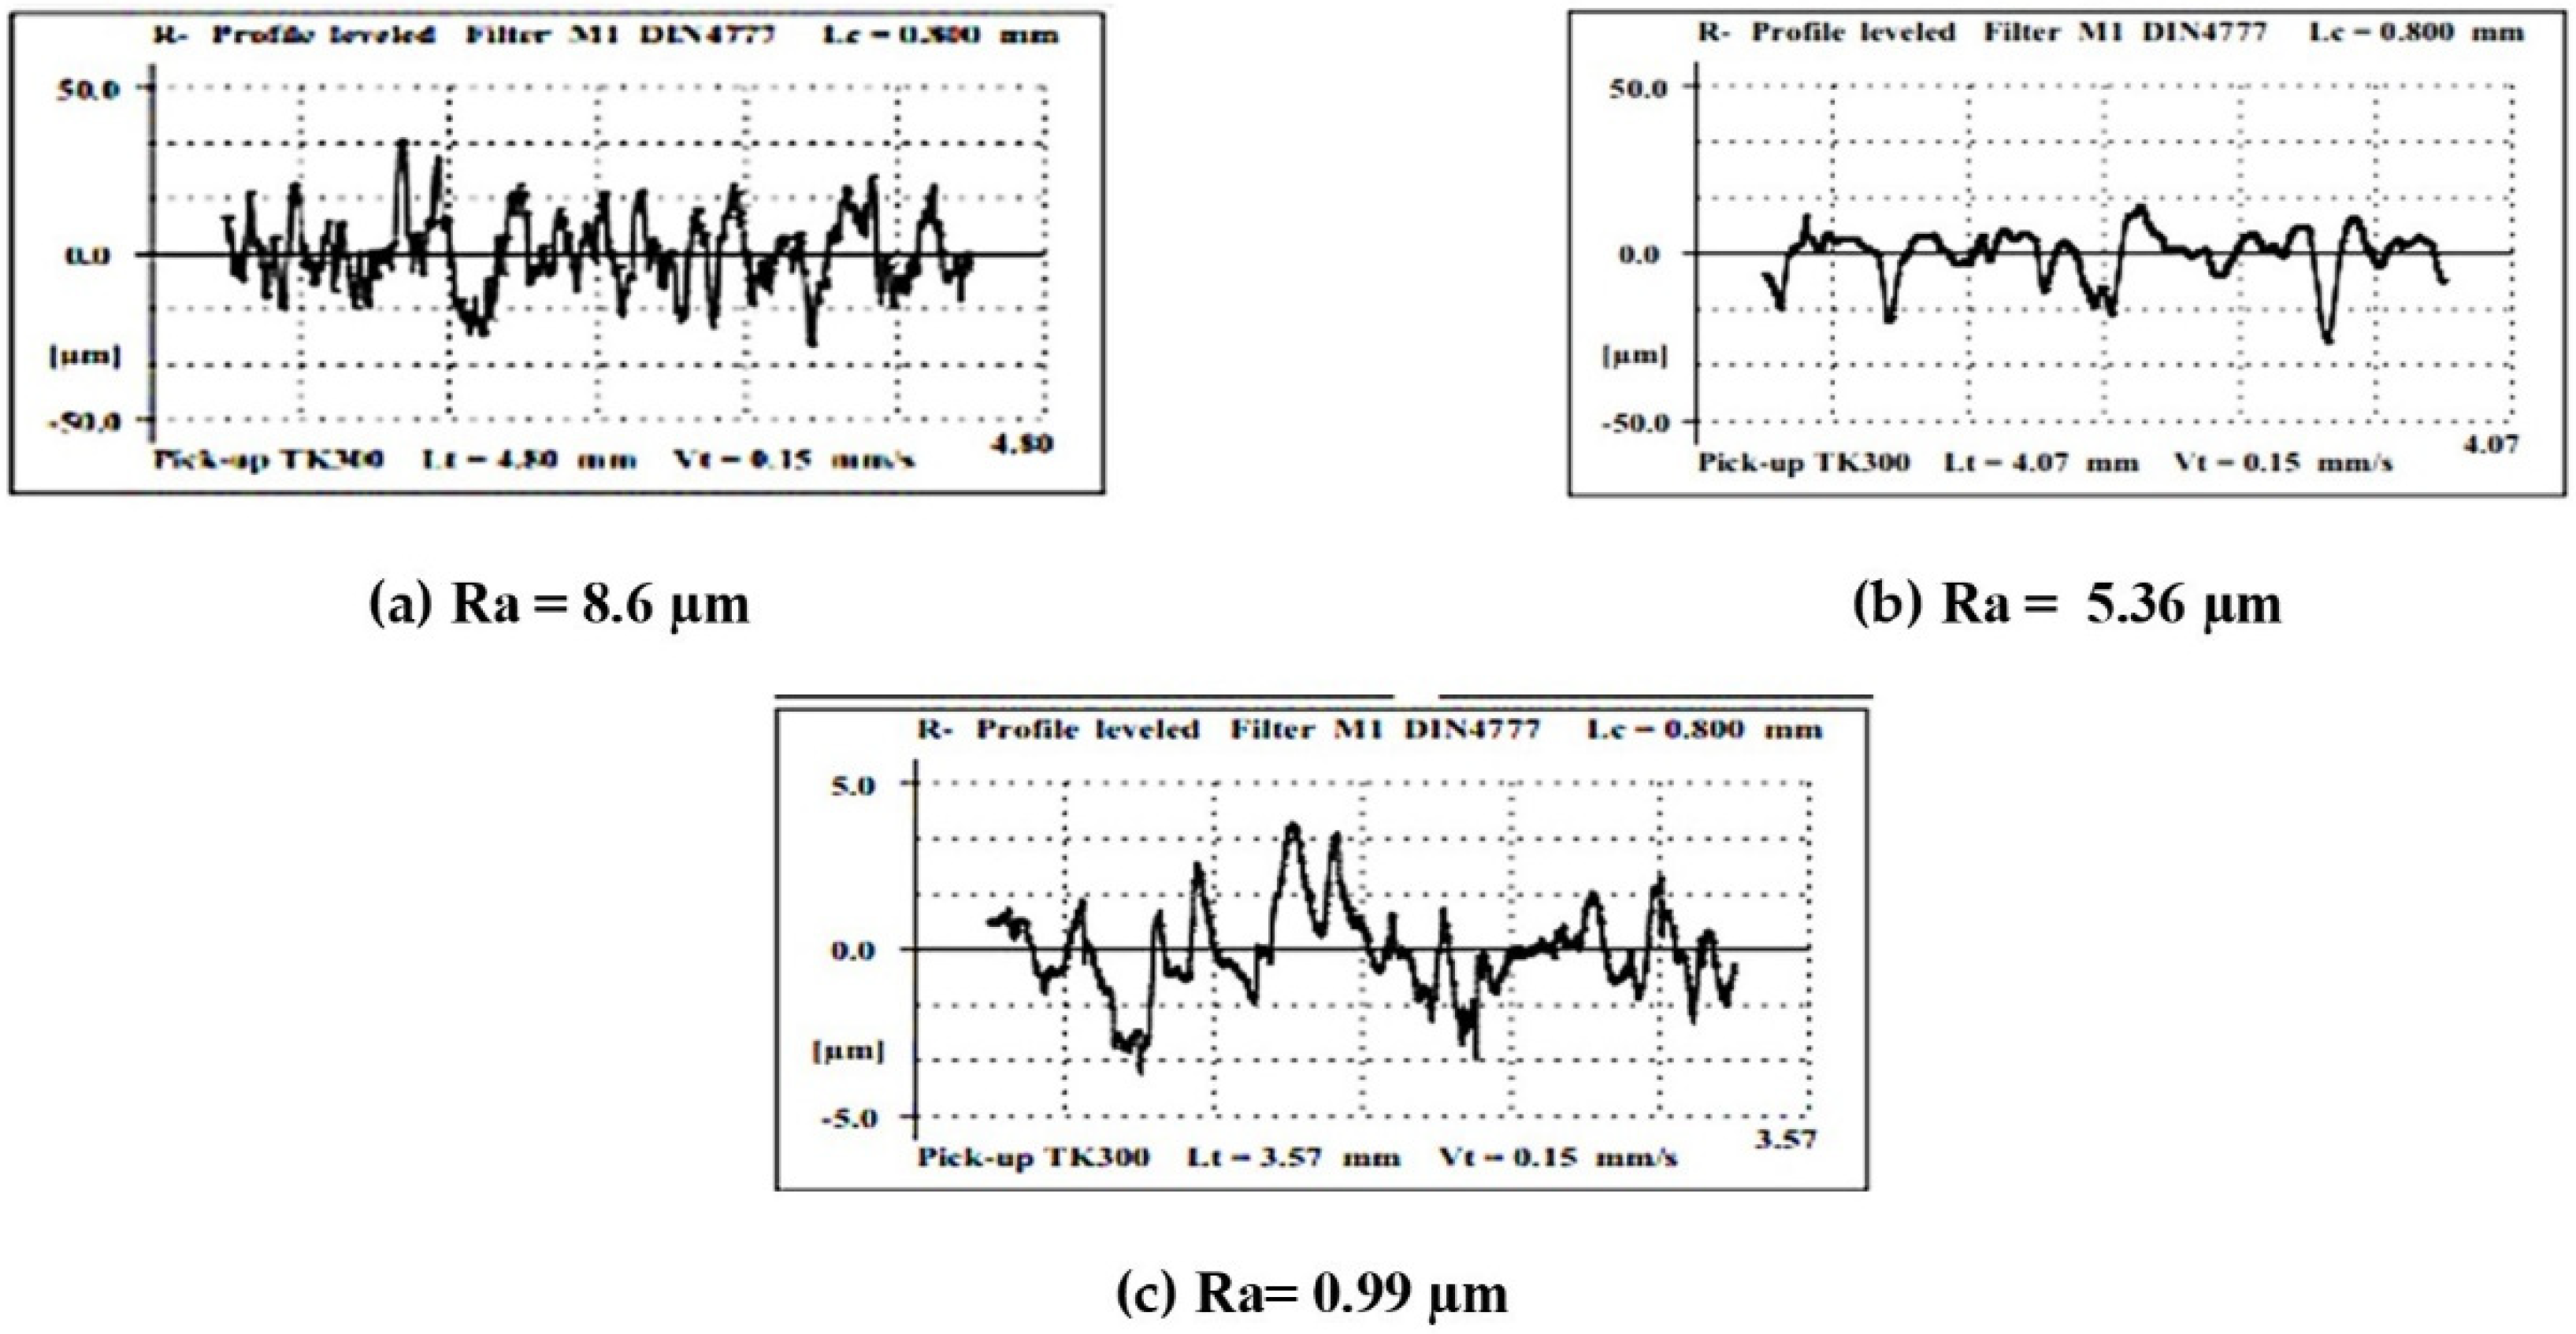
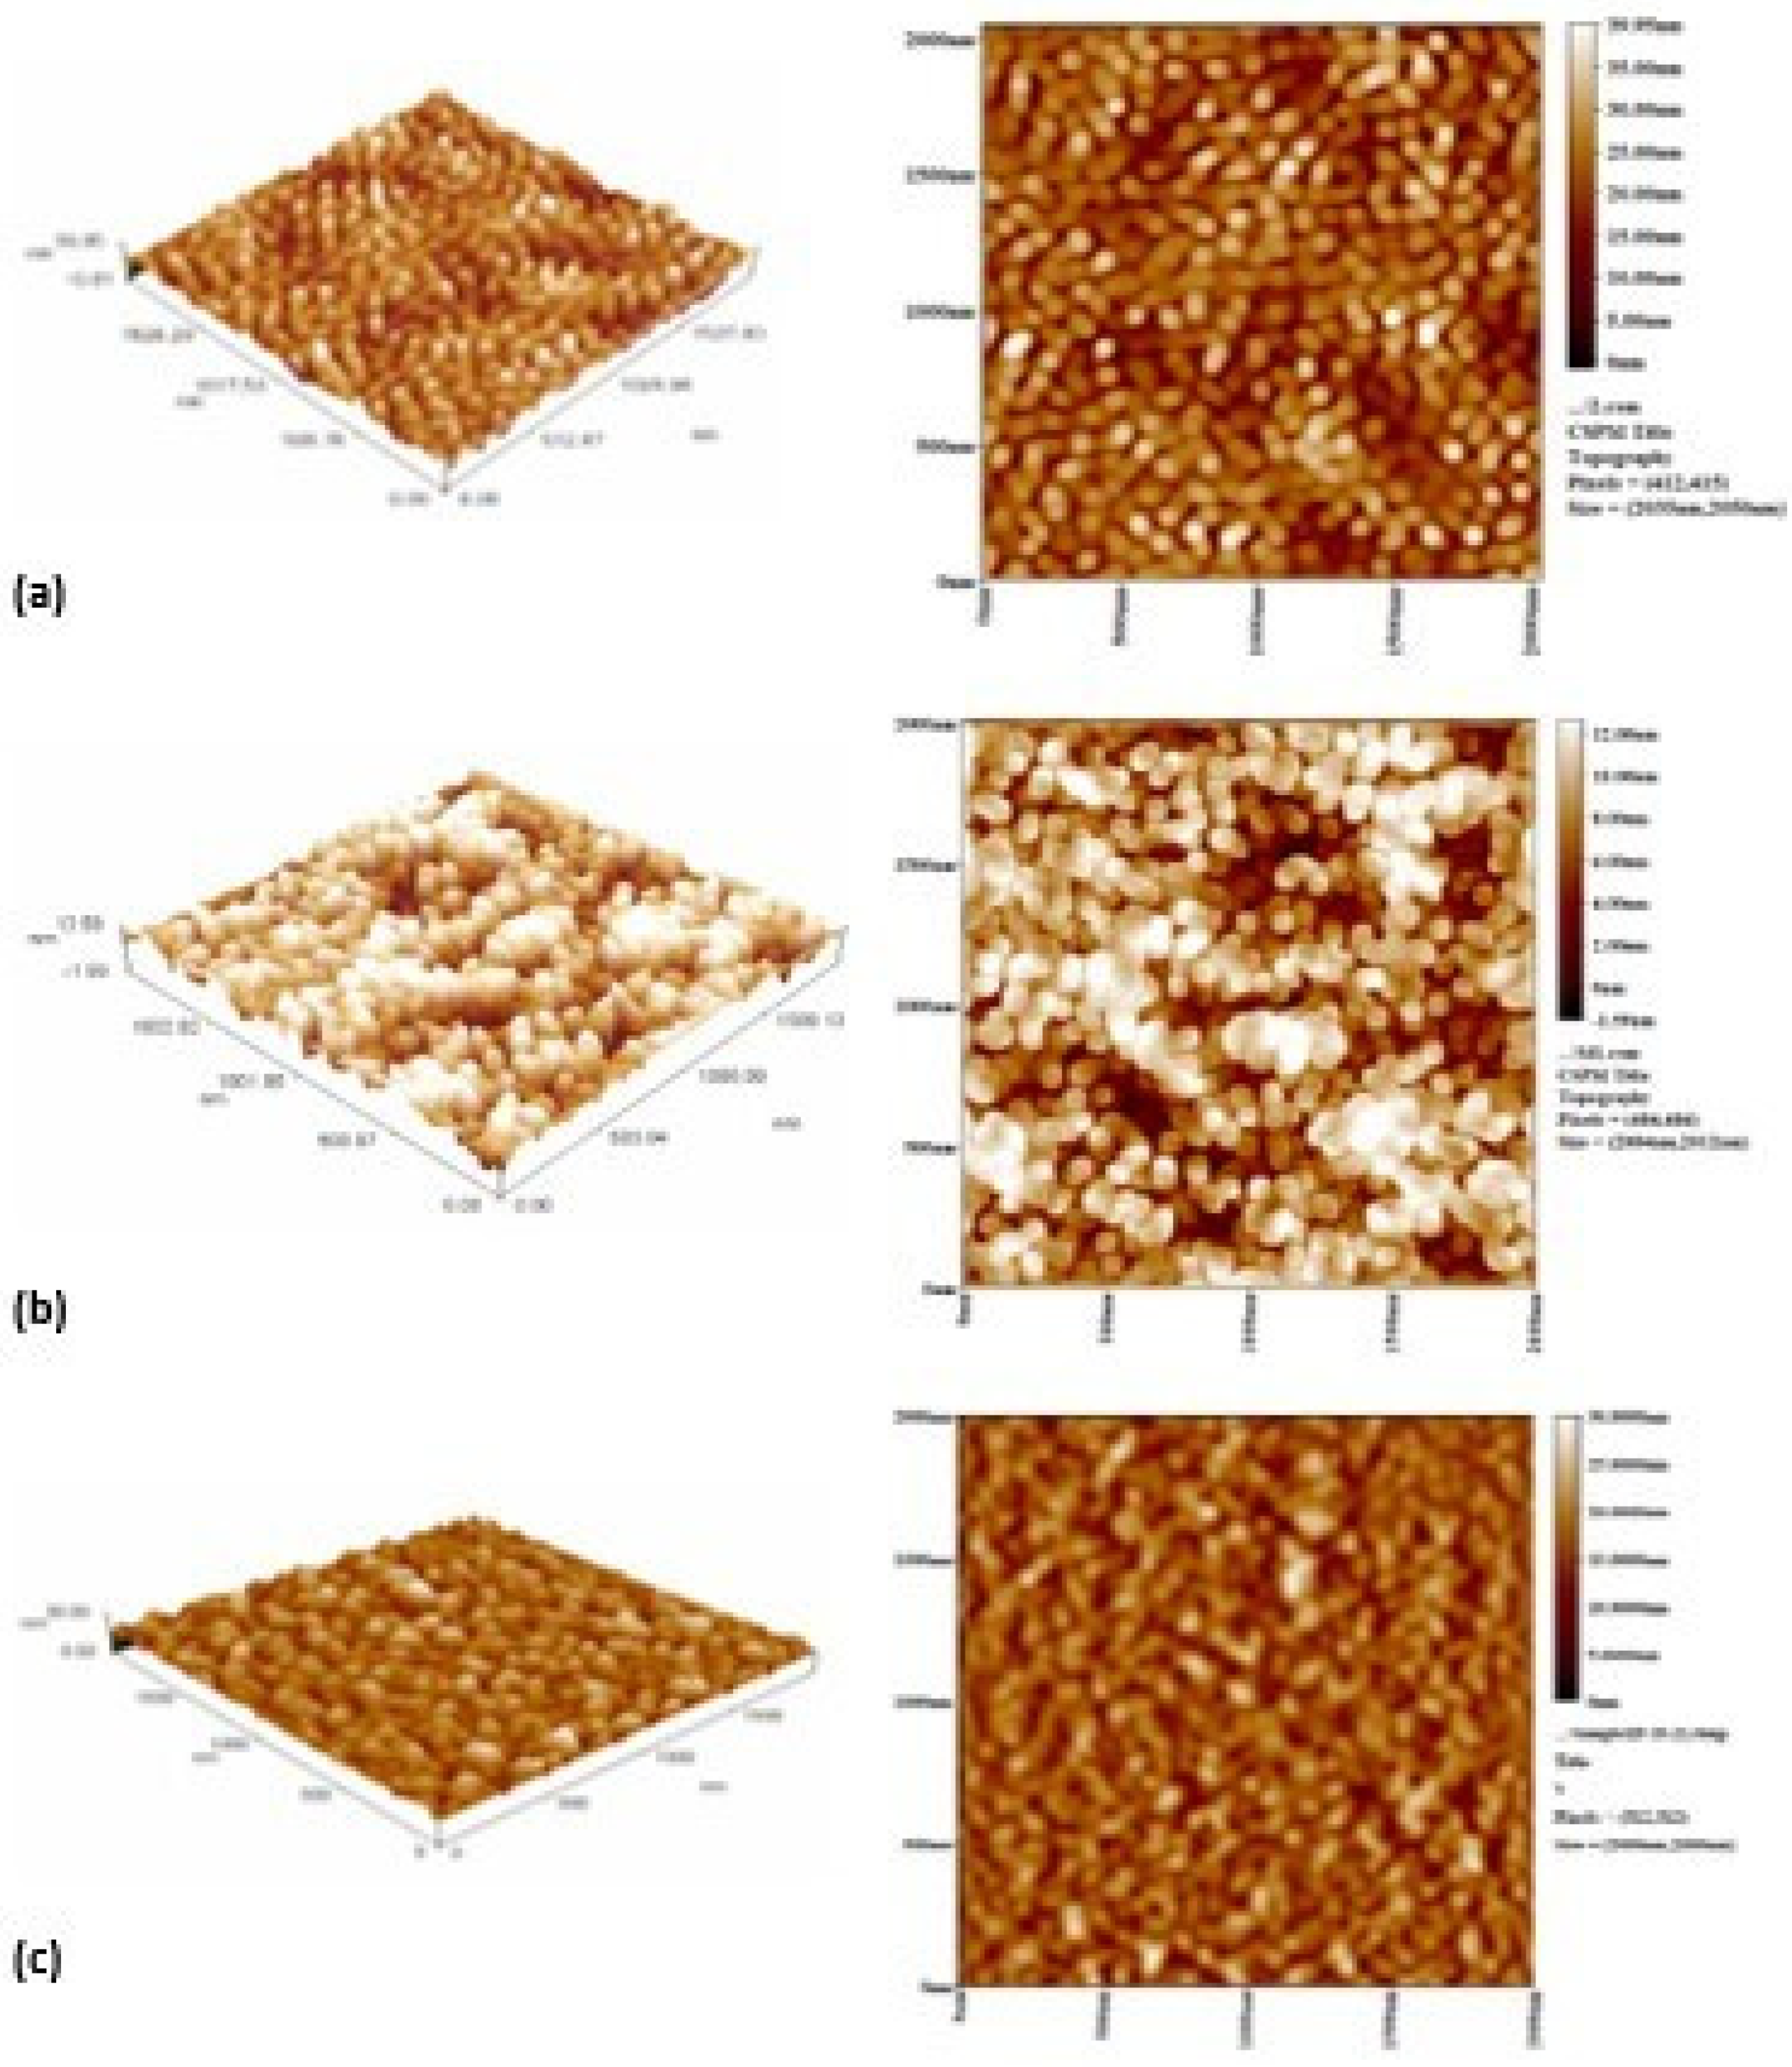
The central line average (CLA) roughness and nanoroughness measurements can be observed in
Figure 13 and
Figure 14. One can clearly observe the increase in the roughness values after the modification of the thermal barrier coating surfaces via EPD overlaying and the following laser sintering process.
The previously obtained initial Ra measurements of the surfaces of the as-sprayed coatings at a spray distance of 100 mm were around 8.6 m [
27]. It is possible to observe the roughness profile, and because of the heterogeneous microstructure generated from the plasma-spraying technique, featuring microcracks and partially molten particles, it is highly inconsistent and rough, while the surface roughness after the application of the EPD overlay was decreased to 5.36 μm, as compared with the coating subjected to plasma spraying alone. The fine particles were spread consistently, which increased the level of homogeneity and resulted in crack-free coatings. The nanoroughness value of the green EPD was (2.32) nm. These results were also confirmed through FE-SEM observation. All the roughness results are summarized in
Table 5.
Figure 13.
The microroughness profile of (a) specimens subjected to plasma spraying at a 100 mm spray distance, (b) EPD overlay, and (c) direct laser sintering.
Figure 13.
The microroughness profile of (a) specimens subjected to plasma spraying at a 100 mm spray distance, (b) EPD overlay, and (c) direct laser sintering.
Table 5.
Average values of (CLA) roughness and nanoroughness for all specimens.
Table 5.
Average values of (CLA) roughness and nanoroughness for all specimens.
| No. |
Specimens |
Ra, μm |
Ra, nm |
| 1 |
Plasma coated |
8.609 |
4.38 |
| 2 |
Green EPD |
5.36 |
2.32 |
| 3 |
Direct laser sintering |
0.99 |
2.48 |
Figure 14.
The two- and three-dimensional images from the AFM analysis of coatings for (a) specimens subjected to plasma spraying, (b) EPD overlay, (c) and direct laser sintering (LS).
Figure 14.
The two- and three-dimensional images from the AFM analysis of coatings for (a) specimens subjected to plasma spraying, (b) EPD overlay, (c) and direct laser sintering (LS).
Direct laser sintering is a promising technique for the densification of green EPD layers with a dispensed furnace sintering step. There are many benefits of this technique, including the possibility of obtaining a high-density surface and good microstructure. The improvement in the roughness behavior is typically attributed to the sufficient amount of energy applied to the full surface for the modification of the green EPD layer. The (CLA) roughness value decreased to 0.99 μm after the laser sintering process, while the AFM results showed that the roughness decreased to 2.48 nm. It can also be observed from the AFM analysis that the shadow effect was absent, which indicates a very low roughness value due to the lack of defects. The 3D images demonstrated clear changes in the microstructure after the laser sintering process and the homogenous distribution of the particles.
Surface modification with a laser irradiation beam is effective as a post-processing treatment and proved to be capable of reducing surface roughness. It can be concluded that it is possible to decrease surface roughness using an appropriate method of surface enhancement. Both the EPD overlay and laser treatment decrease roughness. This means that the performance of the thermal barrier coating can be greatly improved.
3.3. Hot corrosion
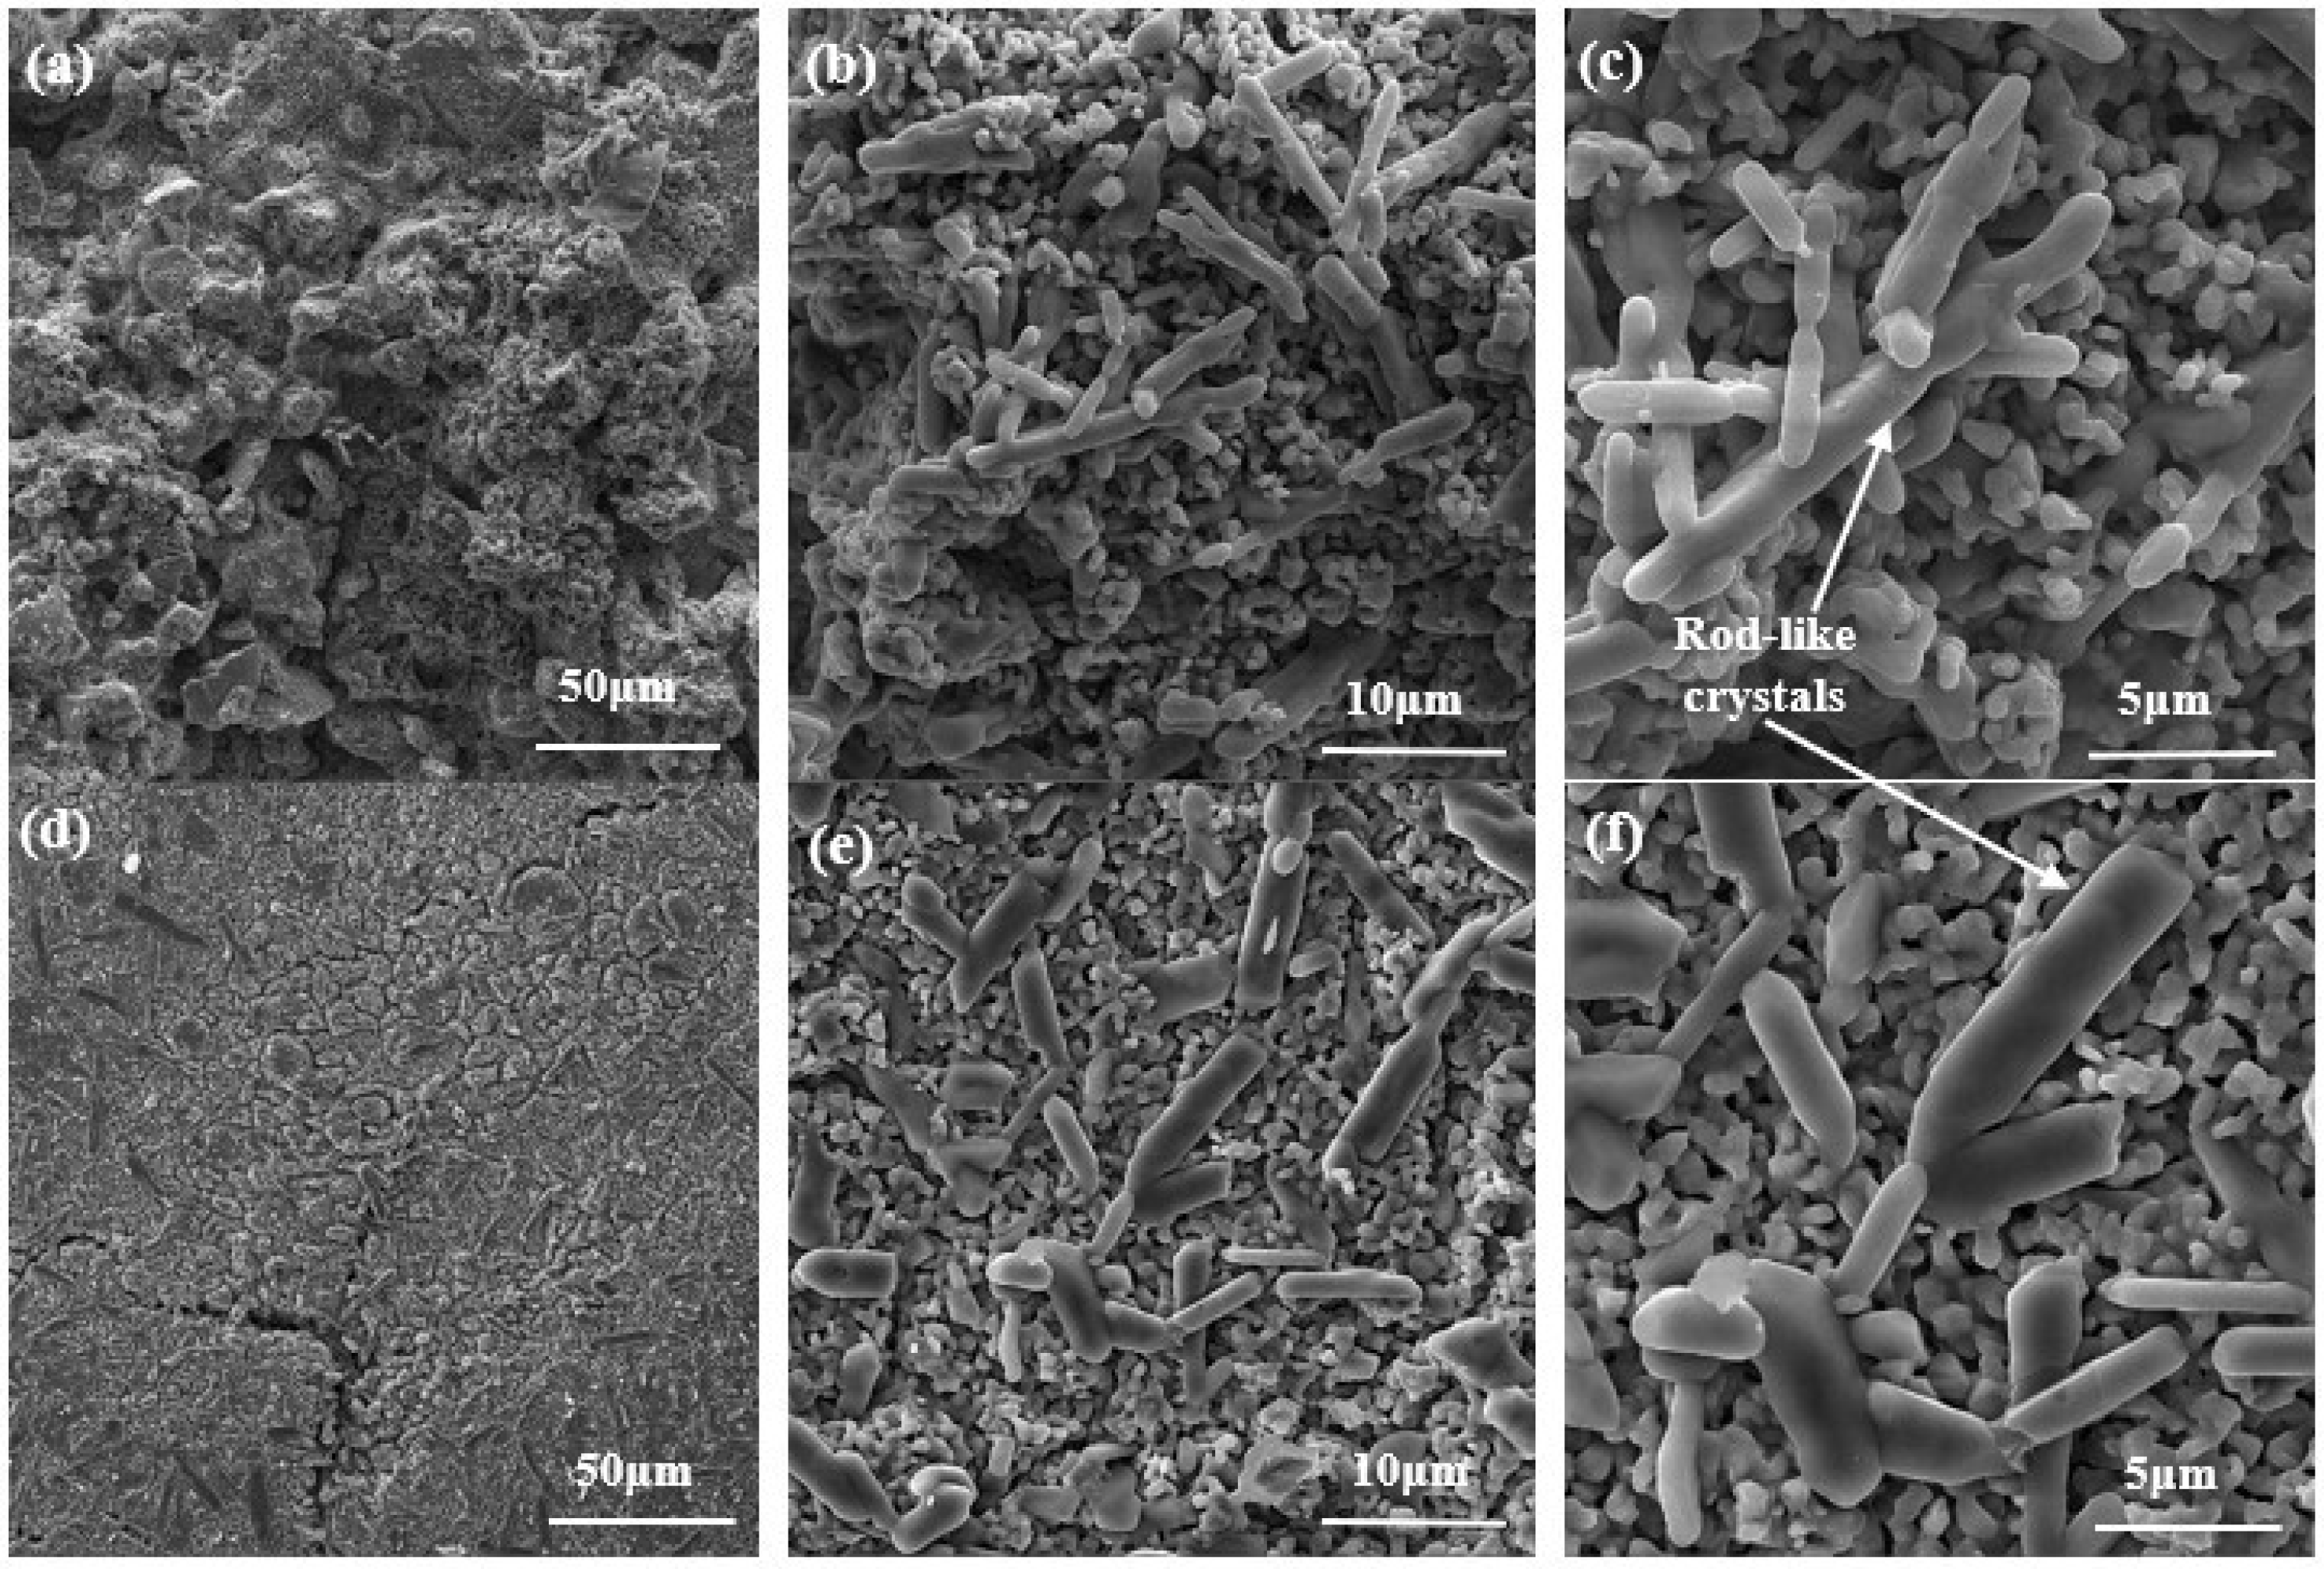
The surface morphologies of the plasma-sprayed YSZ coating before and after modification with EPD overlay and direct laser sintering after 90 hours of hot corrosion at 1000 ֩C were shown in
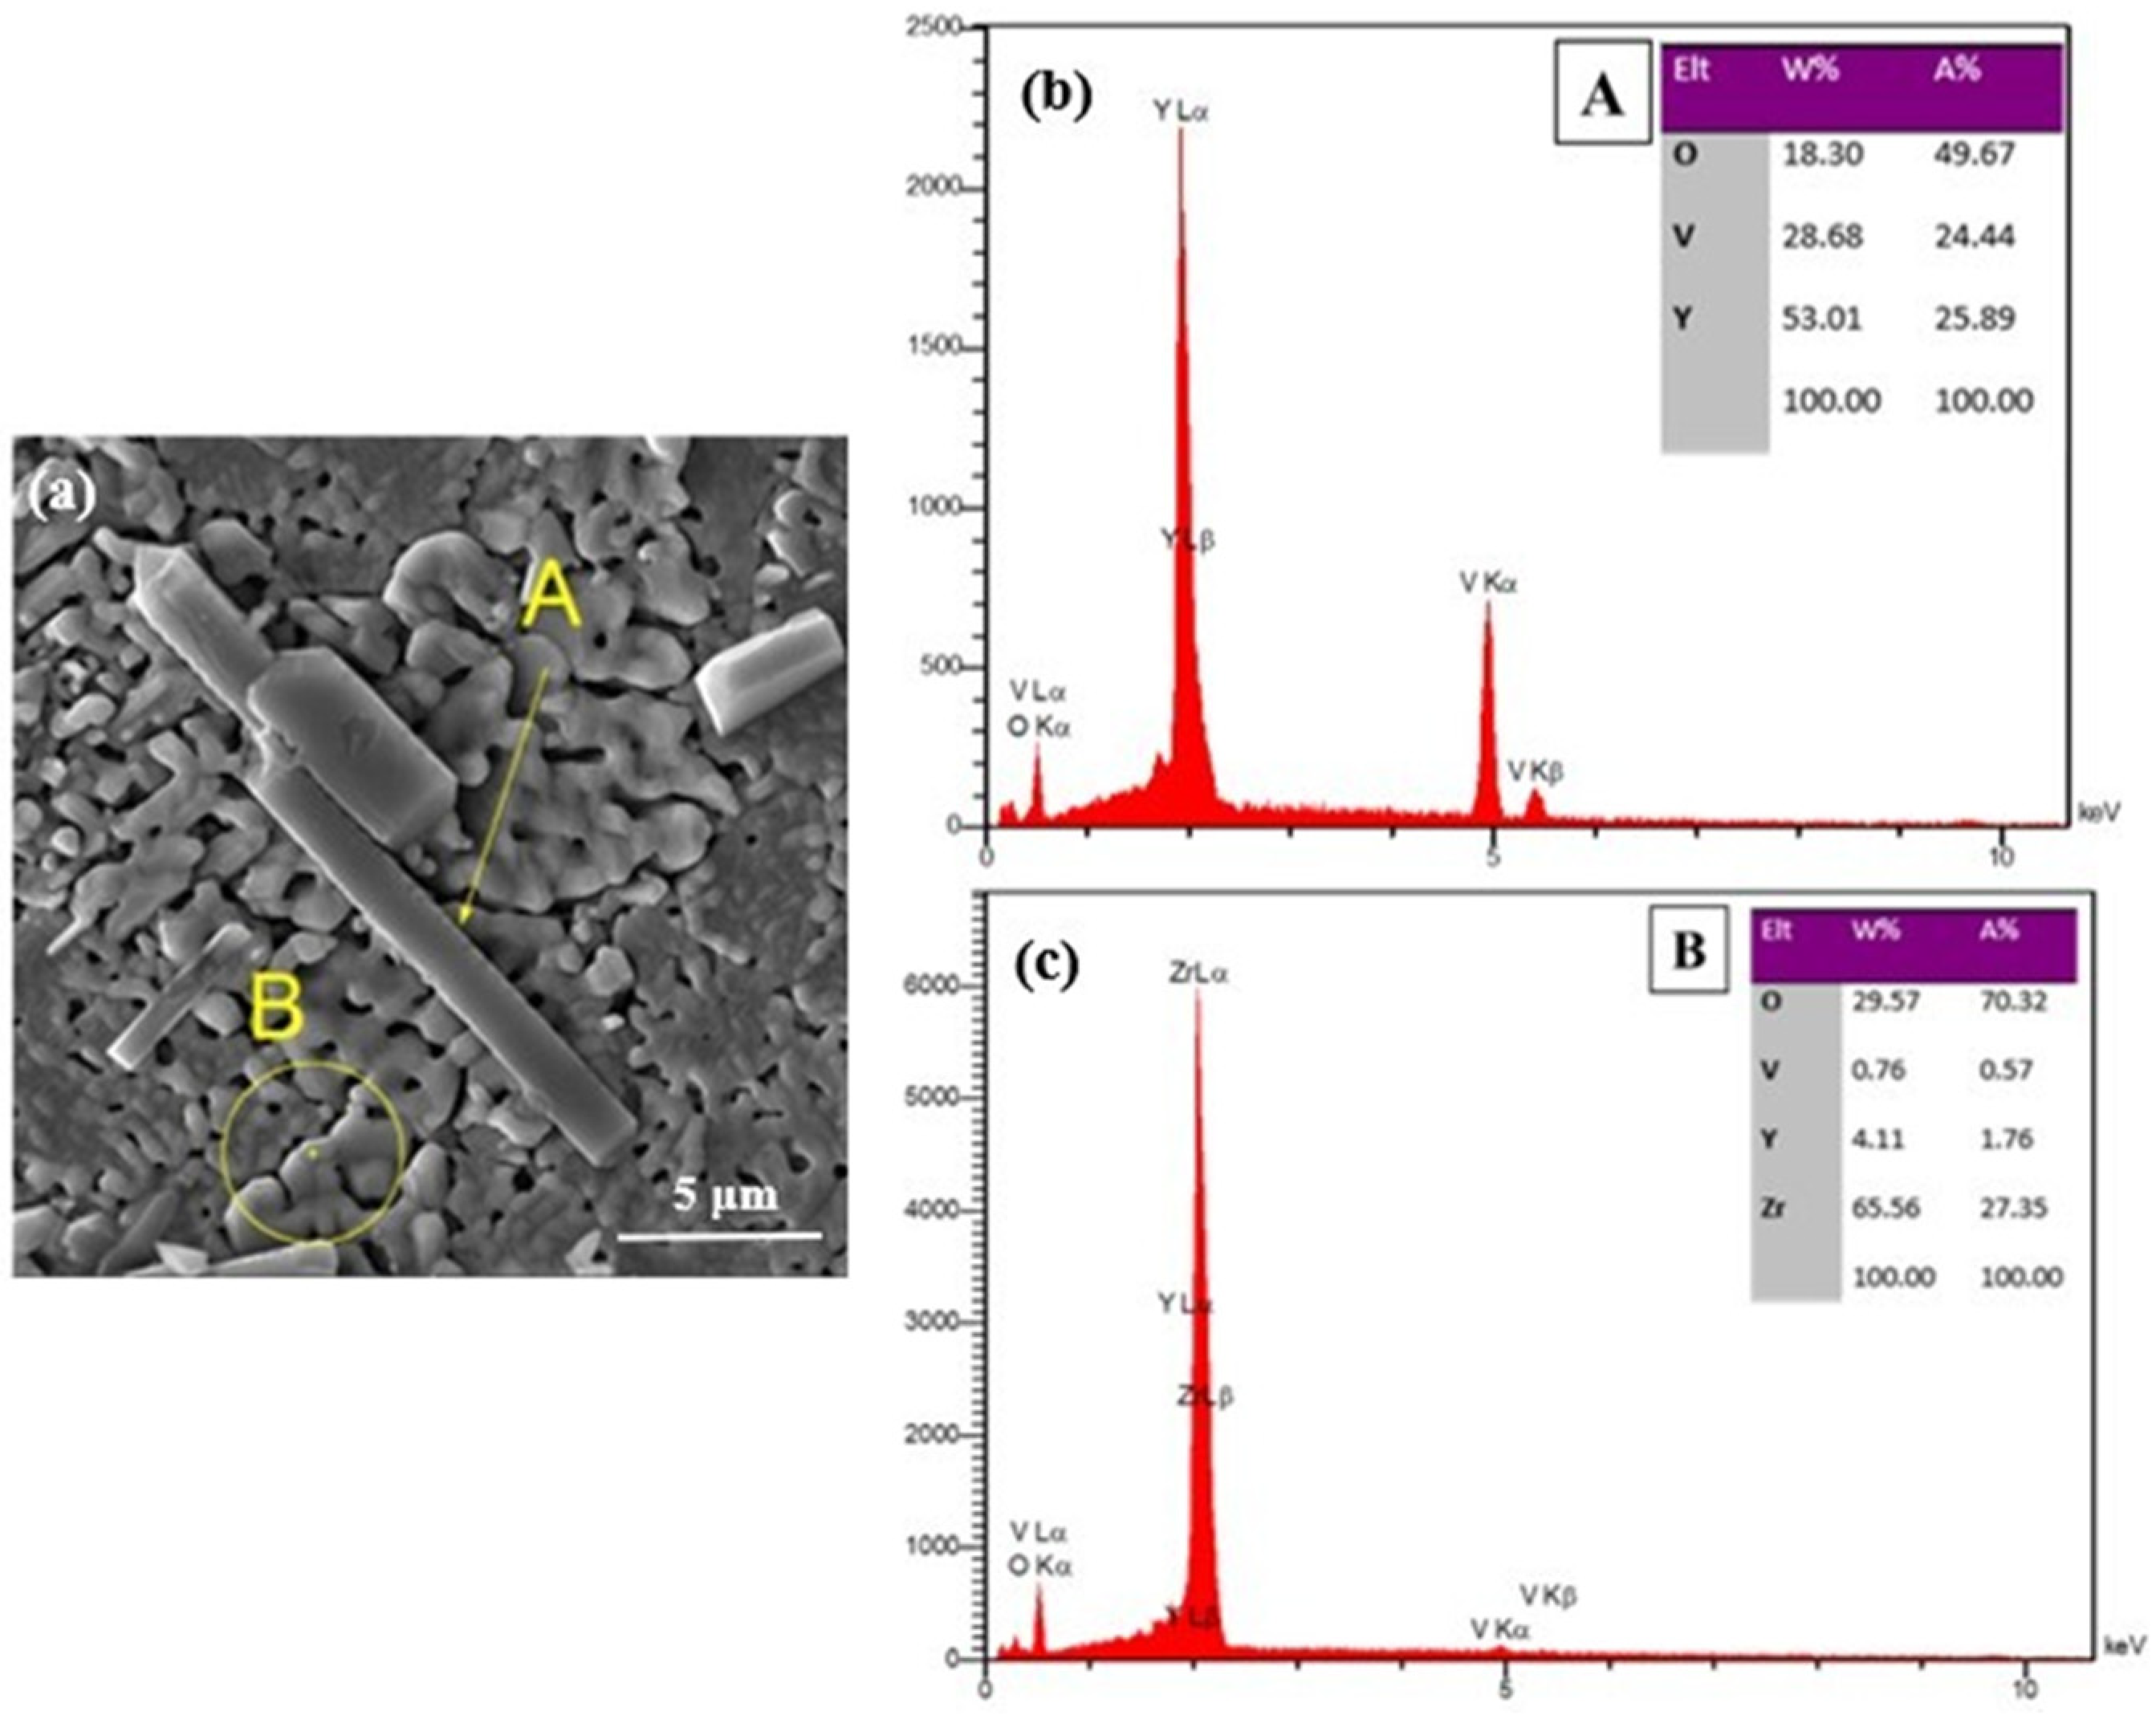
Figure 15. The plasma-sprayed coating appeared to be almost completely covered with rode-like crystals, indicating the existence of chemical corrosion between the molten salts and the YSZ coating.
Figure 15b,c shows the corrosion products of the plasma-sprayed coating at higher magnification. There were many plate-shaped crystals stacked on top of each other, as well as a few cubic-shaped crystals, were observed. It is important to note that the corrosion products on the surfaces of the direct laser sintering of the EPD overlay sample are identical to those of the original plasma sprayed coatings due to the same formation procedure
Figure 15 d–f. The corrosion products of the remelting coating consist of certain extended rod-shaped crystals that are spread uniformly on the remelting coating’s surface. However, the attack by corrosion salts (V
2O
5 + Na
2SO
4) was greater in the case of plasma-sprayed YSZ coating without surface modification than in the case of direct laser sintering of the EPD overlay. This was due to the presence of open porosity on the plasma coating’s surface, which acts as a salt concentration pocket. As a result, the molten salts can easily penetrate the coating structure via the flaws. Furthermore, the specific surface area for the corrosion reaction was high due to the morphology of the surface of the plasma sprayed coating (extremely rough surface)
Figure 15a compared to the smooth surface after laser treatment
Figure 15d.
Figure 15.
FE-SEM surface morphology of the plasma-sprayed coating after the hot corrosion test at 1000 ֩C for 90 h. (a) lower magnification; (b,c) higher magnification. (d) after direct laser sintering of EPD overlay on the surface of plasma sprayed coating. (e,f) higher magnification of (d).
Figure 15.
FE-SEM surface morphology of the plasma-sprayed coating after the hot corrosion test at 1000 ֩C for 90 h. (a) lower magnification; (b,c) higher magnification. (d) after direct laser sintering of EPD overlay on the surface of plasma sprayed coating. (e,f) higher magnification of (d).
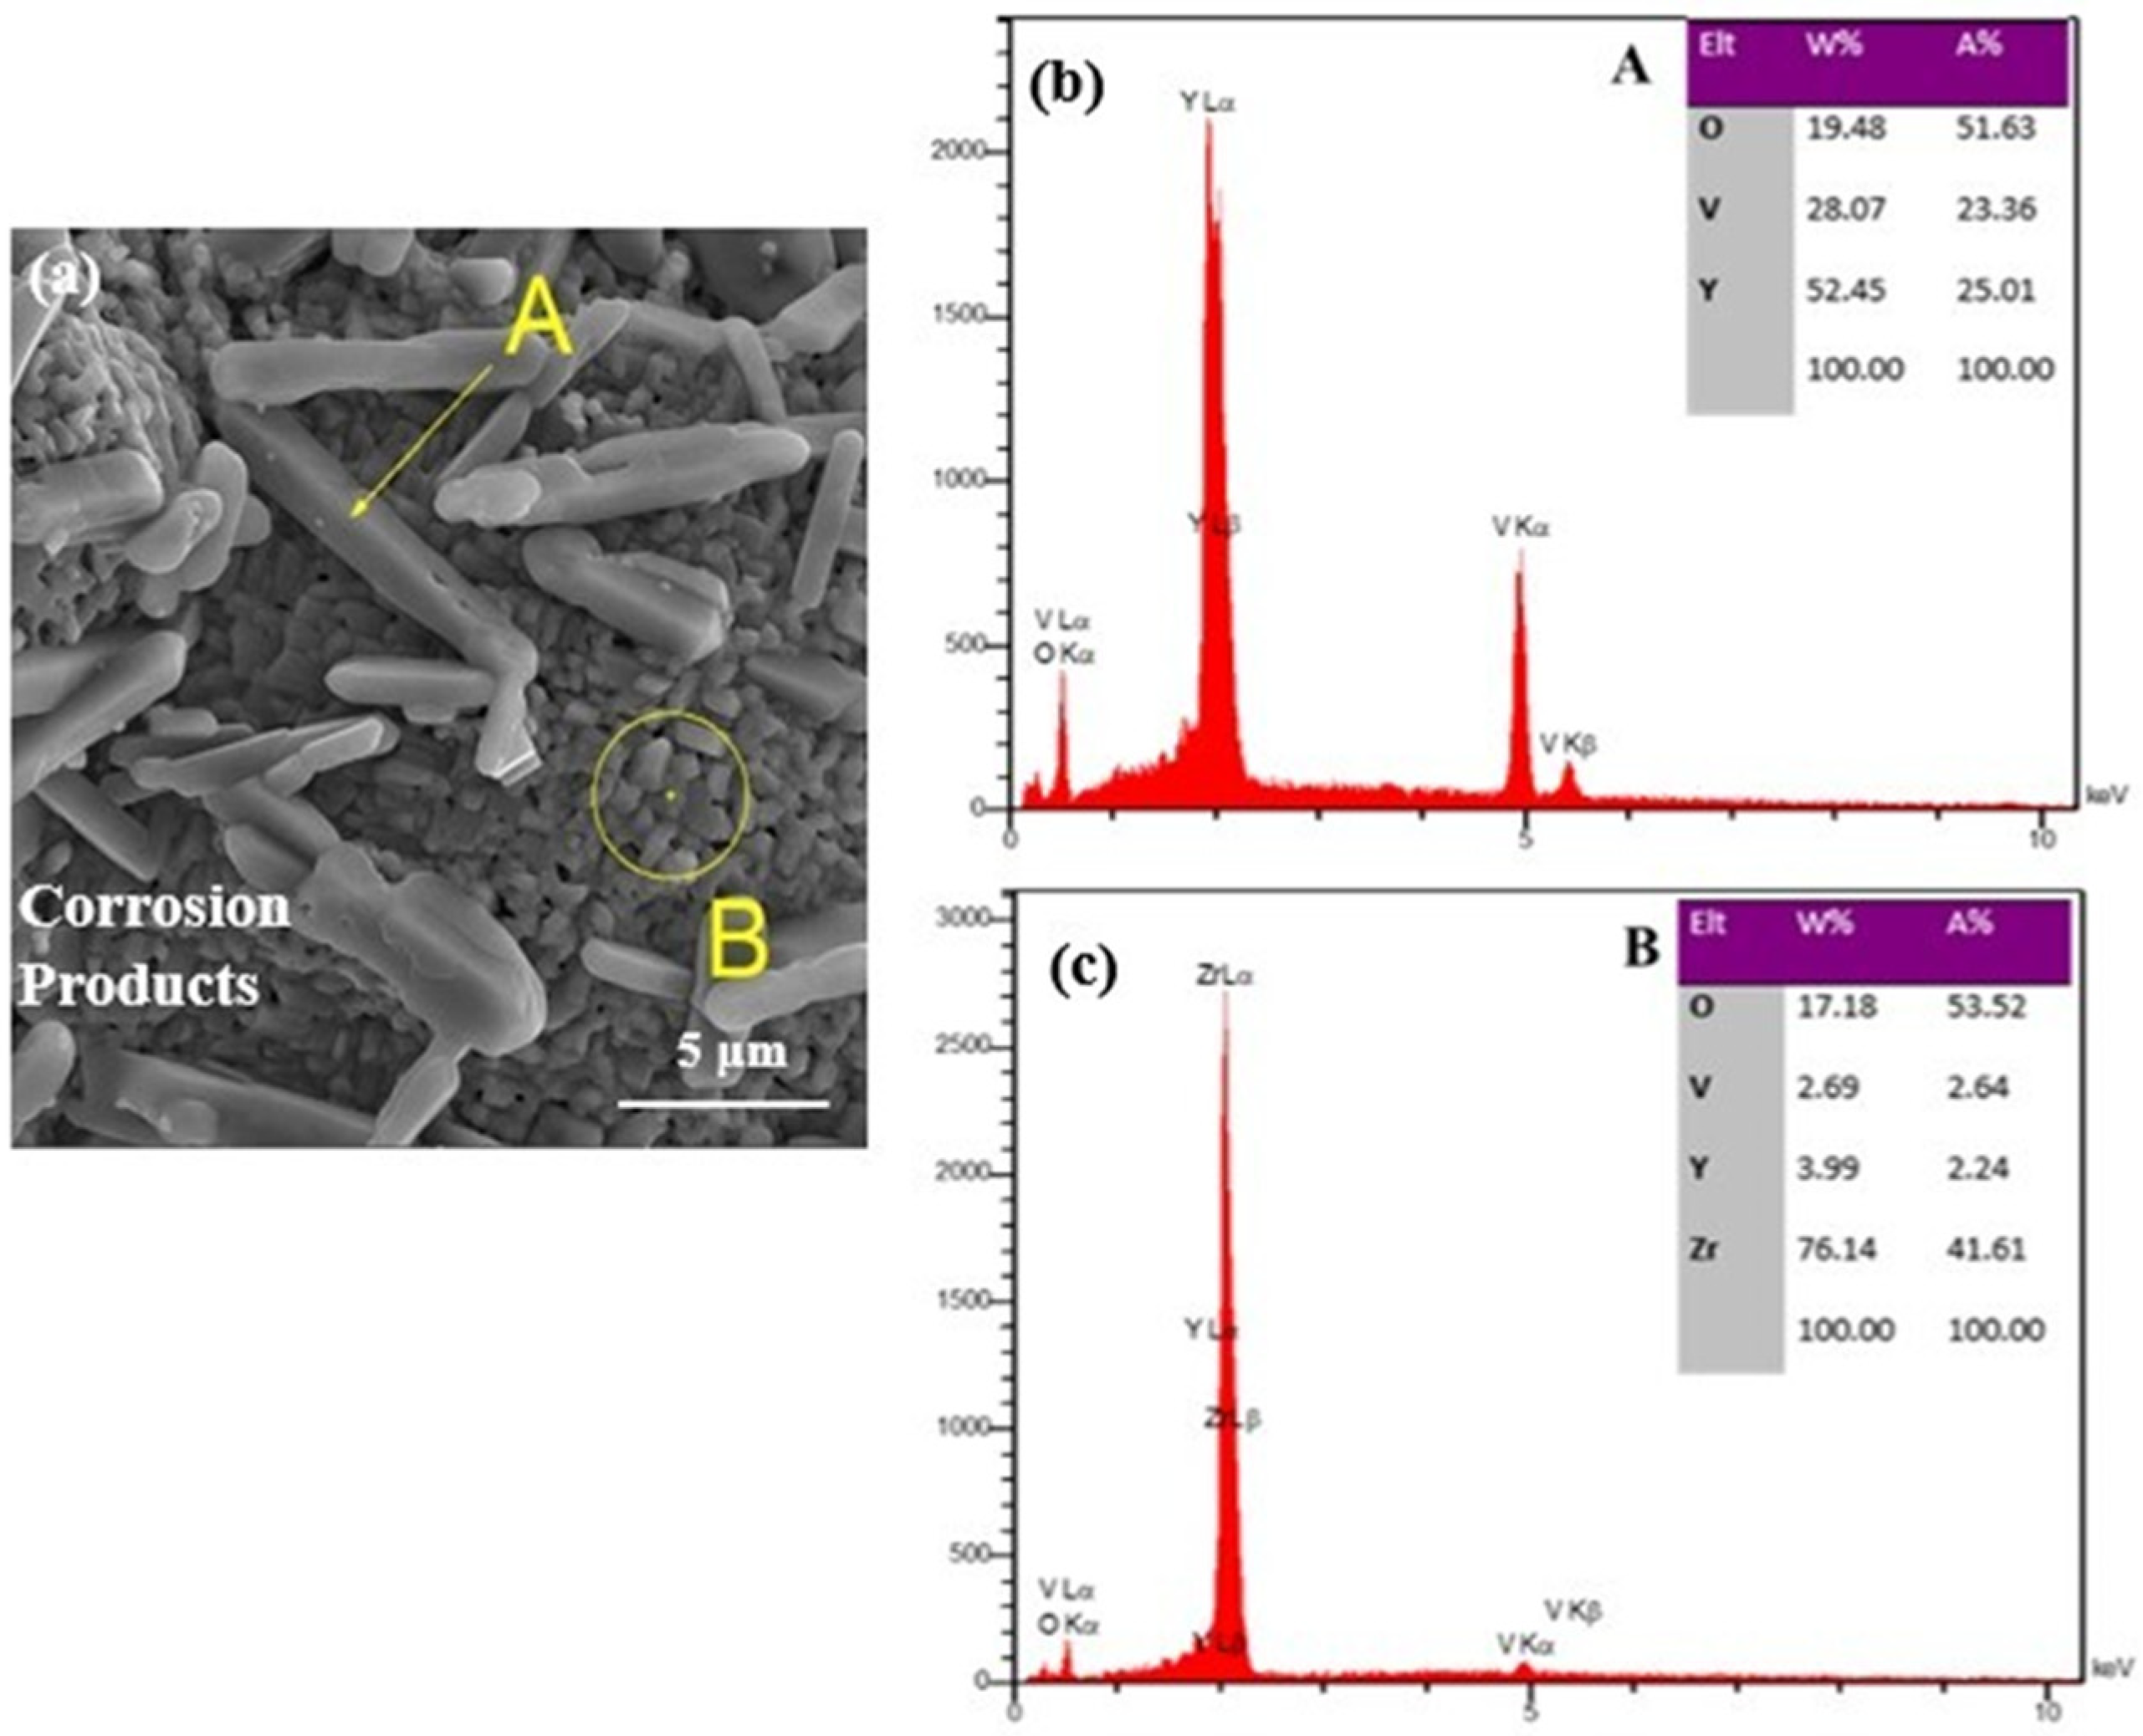
After laser treatment, rod-like crystals were reduced and corrosion resistance was improved as compared to plasma-sprayed coating. This is mainly due to the removal of pores and cracks by the use of nano-sized YSZ powder deposited using the EPD method and subsequent laser modification. This resulted in sealing the surface and the penetration pathways of molten salts into the plasma sprayed covering being reduced. The formation of rod-like crystals (YVO
4) can be attributed to the reaction of the stabilizer Y
2O
3 in zirconia-based TBCs with corrosion salts. This is confirmed by SEM micrograph and EDS analysis in
Figure 16 and
Figure 17. According to EDS analysis from point A in
Figure 16 and
Figure 17, these rod-like crystals contain Y, V, and O, whereas the matrix (region B) contains Zr, Y, V, and O.
Figure 16.
FE-SEM micrographs and EDS analysis of the plasma sprayed coating after hot corrosion, (a) the surface of the coating, (b) EDS of point A,(c) EDS of area B.
Figure 16.
FE-SEM micrographs and EDS analysis of the plasma sprayed coating after hot corrosion, (a) the surface of the coating, (b) EDS of point A,(c) EDS of area B.
Figure 17.
FE-SEM micrographs and EDS analysis of the direct laser sintering of EPD overlay after hot corrosion, (a) the surface of the coating, (b) EDS of point A, (c) EDS of area B.
Figure 17.
FE-SEM micrographs and EDS analysis of the direct laser sintering of EPD overlay after hot corrosion, (a) the surface of the coating, (b) EDS of point A, (c) EDS of area B.
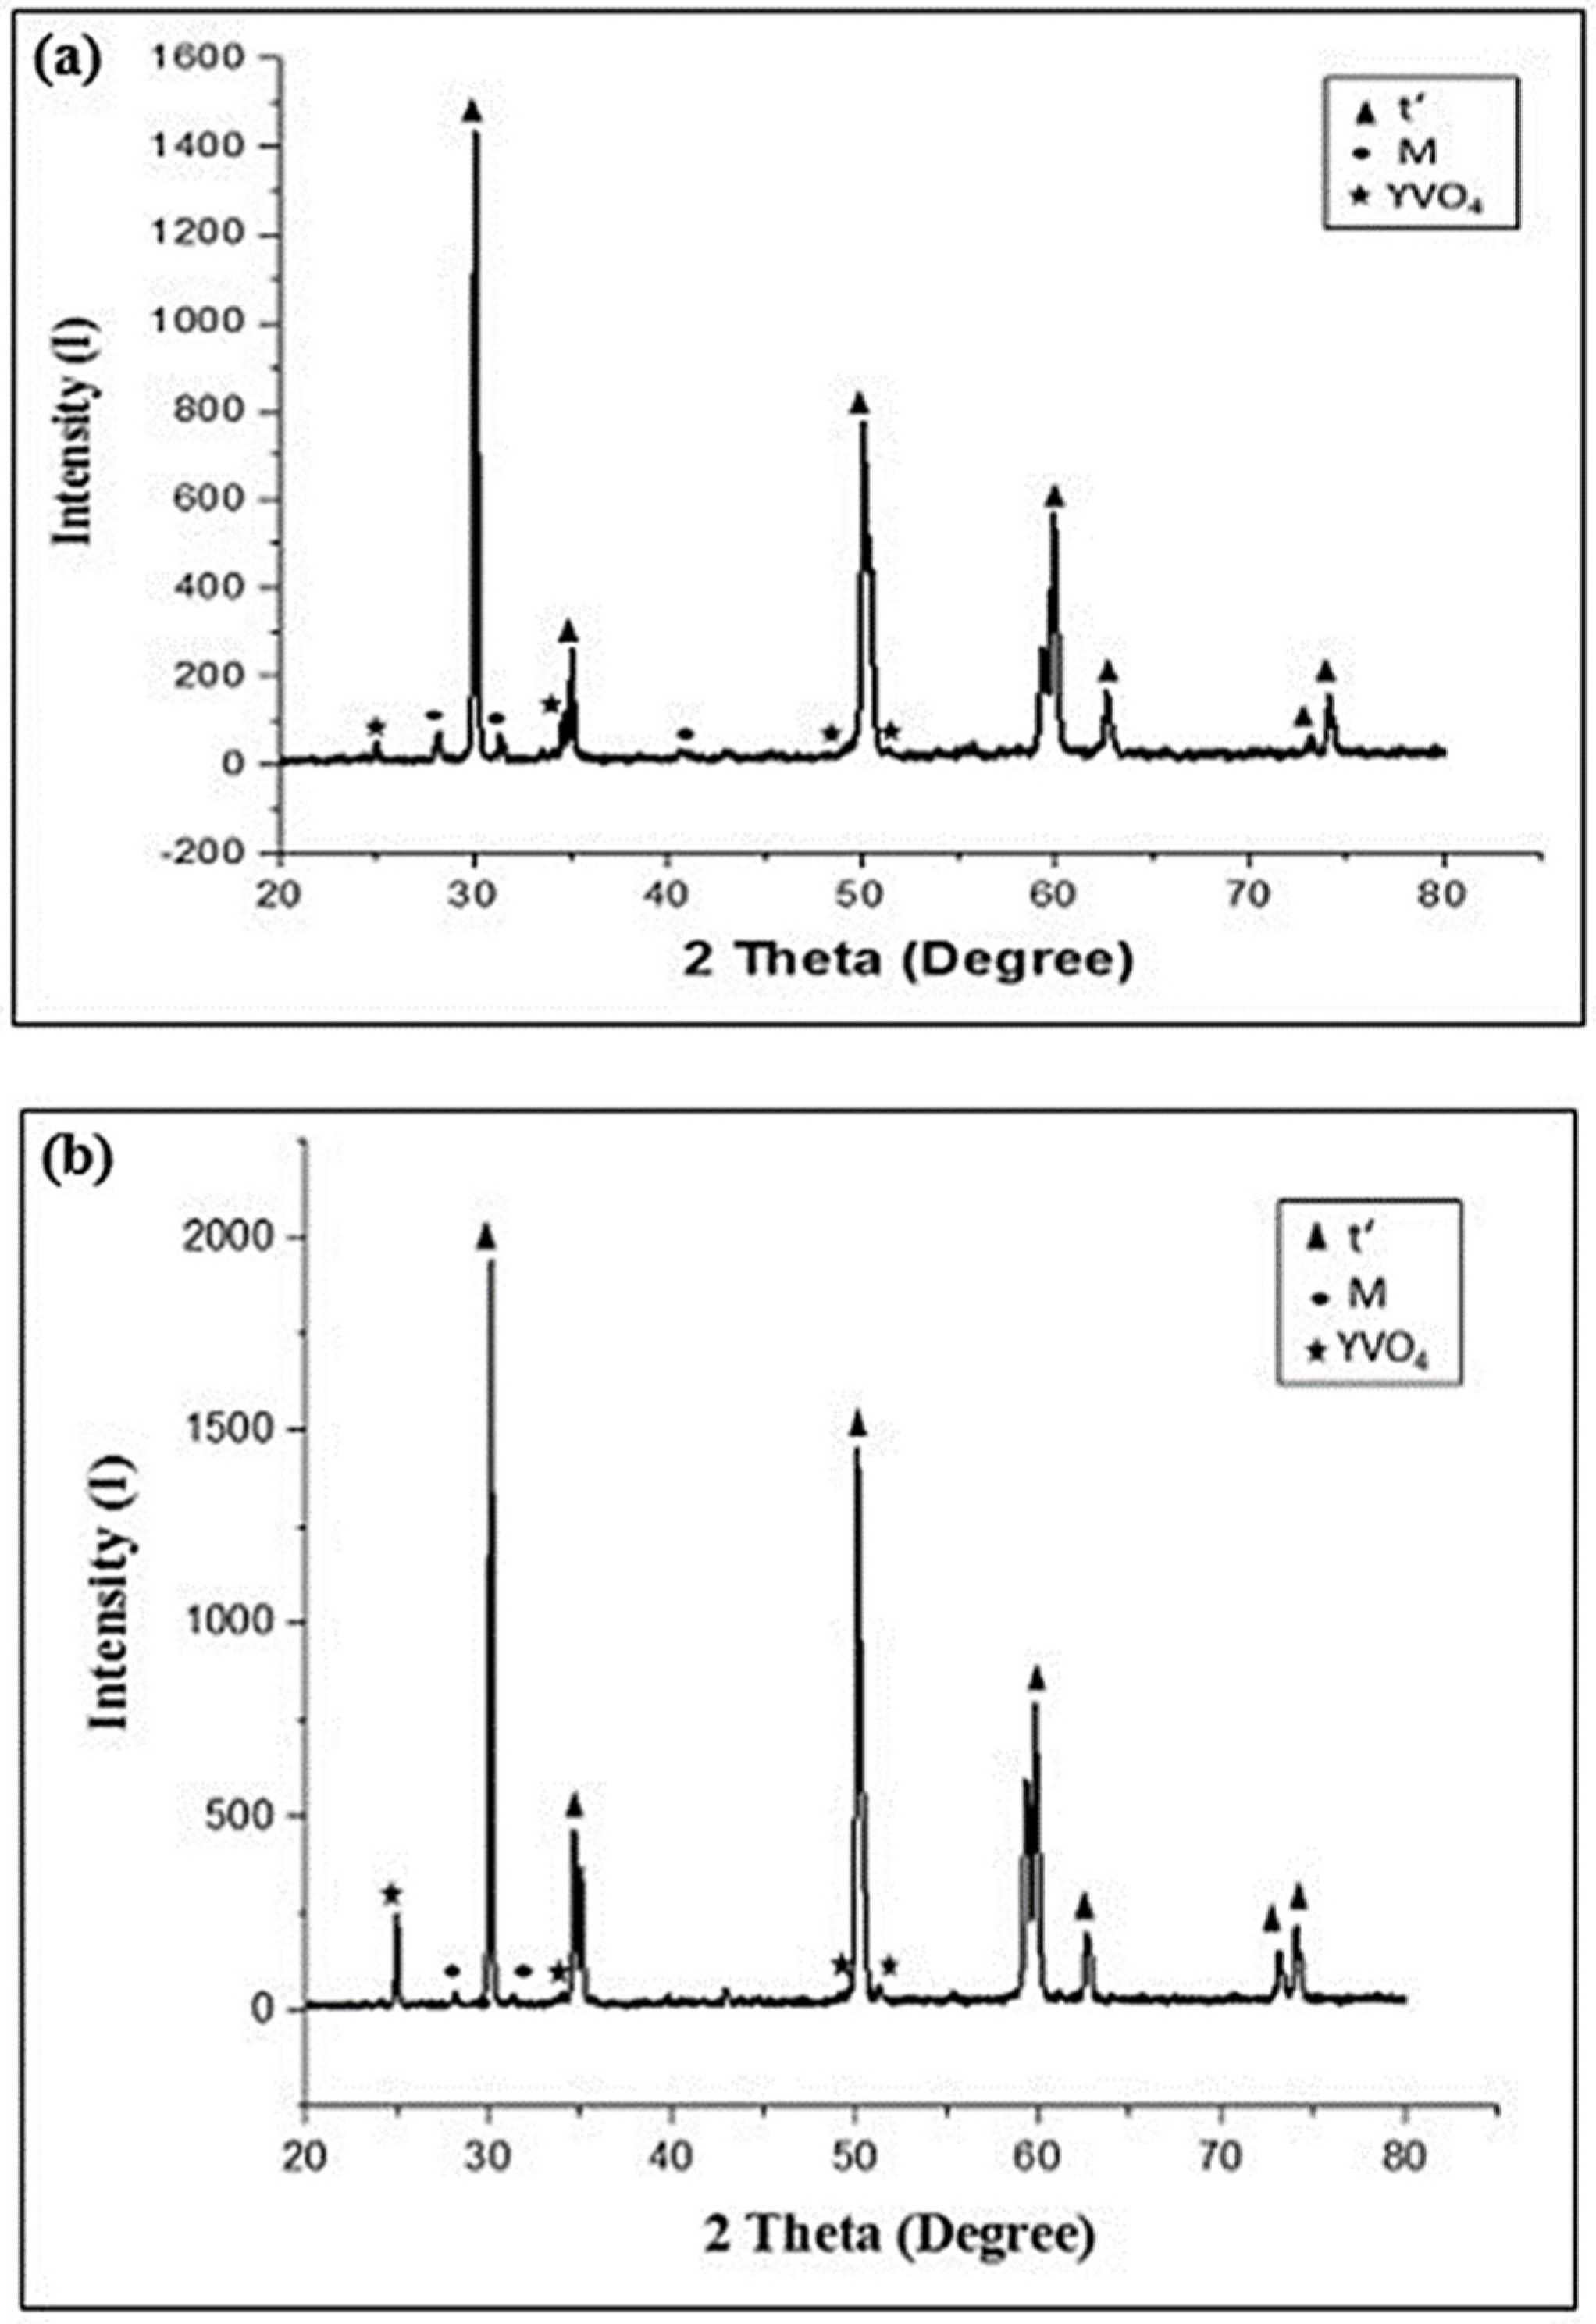
The XRD patterns of plasma-sprayed YSZ coatings after 90 hours of interaction at 1000֩ C clearly reveal that a new phase formed, as shown in
Figure 18a. Zirconia was found in both the nontransformable tetragonal (t’) phase and the monoclinic phase, as well as the presence of YVO
4 peaks. Part of the tetragonal ZrO
2 transformed into the monoclinic phase during the hot corrosion test. Hot corrosion is caused by interactions between the stabilizer phase of ZrO
2 and impurities like sodium sulfate and vanadium pentoxide. As a result of the detrimental reactions, the stabilizer phase leaves the system, resulting in the change of tetragonal to monoclinic Zirconia, which causes TBC spallation [
29,
30]. The amounts of these phases were directly related to (i) exposure time, (ii) temperature, and (iii) surface state [
31].
After laser treatment, the XRD pattern for the coatings revealed a Large amount of the t’ phase
Figure 18b. Large amounts of the t’ phase were observed in the XRD pattern for the coatings after the laser treatment
Figure 18b, indicating that the modified coating has significantly improved the phase stability in molten salt, which is desirable because the high phase stability is necessary for TBC applications. Obviously, the laser remelting coating had a lower fraction of monoclinic ZrO
2 as compared to plasma YSZ coating. The amounts of the harmful phase (m) were considerably reduced after the laser surface treatment. This reduction is due to the complete removal of void imperfections. The corrosion reactions of the molten salts with the surface of YSZ in the laser-treated layer were lower than in plasma-sprayed coatings due to the reduced specific surface area of the dense layer.
Figure 18.
The XRD patterns of (a) plasma-sprayed, (b) direct laser sintering of EPD overlay after the hot corrosion test at 1000 ֩C for 90 h. using mixture salts of Na2SO4 + V2O5.
Figure 18.
The XRD patterns of (a) plasma-sprayed, (b) direct laser sintering of EPD overlay after the hot corrosion test at 1000 ֩C for 90 h. using mixture salts of Na2SO4 + V2O5.
The linear least square approach was used to obtain the parabolic rate constants (𝐾p) (Hot corrosion rate constant) using the following equation:
where (W/A) is the weight gain per unit area (mg/cm
2), t is the exposure duration (hour), and 𝐾p is the Parabolic rate constant (hot corrosion rate) (mg
2 cm
−4 S
−1).
The weight gain (mg/cm
2) for the samples subjected to hot corrosion was used to calculate the kinetics of hot corrosion. In comparison, plasma spraying coating resulted in a greater weight gain, whereas laser modification of the EPD overlay surface revealed lesser weight gain. As a result, the hot corrosion resistance in the molten salt environment was higher. The corrosion rate (𝐾p) value for the direct laser sintering of the EPD overlay was significantly lower than the plasma sprayed coating
Table 6. This low corrosion rate (𝐾p)) result also suggests that the laser surface modification of the coating layer is more resistant to the Na
2SO
4-55%V
2O
5 environment.
Table 6.
The hot corrosion rate kp (mg2 cm−4 s−1) measurements.
Table 6.
The hot corrosion rate kp (mg2 cm−4 s−1) measurements.
| Specimens |
Δw (g) |
kp (mg2 cm−4s−1) |
| Plasma sprayed coating |
0.0025 |
2.3814* 10−3
|
| Direct laser sintering of the EPD overlay |
0.0013 |
6.4395*10−4
|
