
Submitted:
22 August 2023
Posted:
06 September 2023
You are already at the latest version
Abstract
One of the interactions that has been studied in recent decades under the ecohydrological approach is infiltration, which is difficult to determine because the existing methods for estimation depends on certain variables that are difficult to establish or identify, and in other cases, the implementation of instrumentation is expensive. Given this, saturated hydraulic conductivity has been the descriptive variable of the infiltration process by recent authors, being understood as the conduction of water that occurs through the soil and its composition through the vegetation cover. The present design generated an easily accessible portable instrumentation model for the monitoring and collection of infiltration data in situ for basins and ecosystems with different land uses, in an automated manner with the objective of determining the vegetation patterns necessary to sustain the infiltration function. The INDI-INECOL tension infiltrometer [1] was chosen as the reference instrument. It evaluates the saturated hydraulic conductivity based on a column of water that descends through the system and it is exchanged in the soil by the air between the pores. To automate data collection, a measurement system has been proposed through a SCADA system, which is defined as a control, action, decision, storage and data recording system. This system collects field data from a sensor VL053L0X connected to a master station, in our case an Arduino board UNO, connected through the serial port and by a graphical user interface programmed on Python, to display, storage and enrichment of the sensor data and finally to be exported in files suitable for Microsoft Excel.
Keywords:
Infiltration
; SCADA system
; Automated instrumentation
1. Introduction
In recent years, ecohydrology has been positioned as an interdisciplinary science that seeks to establish bridges between ecology and hydrology [2]. In this regard, it is aimed at linking various elements of environmental sciences, including surface and soil hydrology, hydraulics, hydrogeology, geophysics and ecology. This approach makes it possible to study the relationships between the vegetation-soil-geomorphology subsystems and the interaction with the hydrological cycle that occurs within the basin, as well as the effects of anthropic activities that modify these subsystems, such as changes in land use and vegetation [3].
One of the interactions that has been studied under the ecohydrological approach in recent decades is infiltration [4,5], since this process is associated with the recharge of water from aquifers, as well as ecosystem support functions [3]. Water infiltration is a concept of great importance for the management of hydrological basins at all scales that, under field conditions, varies for each event of precipitation, vegetation cover, soil and mainly due to its dependence on the background soil moisture [6]. As a function, it is difficult to determine because the existing methods for estimation depend on certain variables that, in some cases, difficult to establish or identify and in other cases, are costly to implement [7]. Given this, some authors use the saturated hydraulic conductivity (Ks) as a descriptor variable of the infiltration process, which allows the comparison between sites with different initial moisture contents and characteristics of cover and soil. Some investigations reported differences between infiltration as Ks and patches of vegetation, patterns of land use change and vegetation recovery, at different ecosystems and human practices from tropical humid forests to semi-arid and mediterranean scrublands, mountain cloud forests and temperate forests [6,8,9,10,11,12,13].
At least three ecosystem functions related to the water provided by forests have been recognized: water supply, regulation of quality and temporality, as well as support of the ecohydrosocial cycle [14,15], this means that water and the ecosystem which includes human societies are mutually related in such a way that they are closely dependent, and that when the vegetation cover characteristics are modified, all these relationships are transformed to problems such as erosion and desertification. Facing this emergency for understanding the infiltration process through this perspective, could allow us to know which are the vegetation conditions necessary to sustain ecosystem functions related due infiltration.
In Mexico, changes in land use and vegetation cover have been a common practice that has been carried out through different approaches to natural resource management, many of them without considering the effects or changes in the dynamics of life of the social ecosystems or highly transforming landscape, modifying its structures and with it, the relationship between water and life. For the temperate forest living at Sierra del Rincon, recognized as a water recharge zone for the San Juan del Río Valley aquifer [16] and fundamental in the water regulation of the metropolitan region of the state of Querétaro (currently at deficit [7]), is undergoing a series of changes in vegetation cover, threatening the aforementioned water-related ecosystem services for regional life support.
The objective of this design was to generate a portable and easily accessible instrumentation model for the monitoring and collection of infiltration data in situ as an automated manner to do in basins with different land uses. For that purpose, an infiltrometer was chosen to start as a reference instrument, the INDI-INECOL infiltrometer [1] which is also based on the 2009 design of Spongrová and Kechavarzi. They explain that tension infiltrometers allow a broad characterization of different hydrophysical properties important to understand the flow of water in the soil, measurinig the flow of water entering the soil, eliminating the influence of preferential flow that usually occurs in saturated conditions and in this way, it is possible to characterize the water conduction capacity of pores of different sizes, including active macro and mesopores.
The operation of the INDI-INECOL infiltrometer system occurs through 3 main components:
a) Main Reservoir contains the column of water that will infiltrate and it is our variable to be measured (water column vs time). The reservoir has a stopper that prevents the entry of atmospheric pressure, so that when the column descends, a vacuum is generated.
b) This is where Mariotte comes into play, since it allows the entrance of controlled air into the main reservoir, thereby reducing the negative pressure generated at the main reservoir with which the water column can continue to drop. as the infiltration proceeds.
c) As the water column descends through the system, it is necessary to homogenize the distribution of water in the contact medium, this is the function of the Base, which, through a standard microporosity nylon mesh, performs the exchange of water between the soil and the column, occurring through the tension generated by the exchange of air between the soil pores and the water in the reservoir.
2. Materials and Methods
Instrument design
The design was proposed through two main axes: Instrument mechanics and data collection automation (SCADA System):
- Design proposals based on the mechanics of the instrument:
Design was made at On Shape software, where three new pieces came to replace the base and Mariotte tube and main reservoir support mentioned on the Infiltrometry Manual [1]. The design was thought for an easy assembly system, modifying pieces of connectors to pressure assembly and replacing the metal ball valve by a PVC one, and it manufacturing they were 3D printed of Hard resin polymer.
The third piece was designed for supporting control system, and it was made at same software and 3D printed at PET Polymer.
The Infiltrometer commercial components were acquired and with the printed components were assembled, generating an assembly file that includes bill of materials and step by step assembly card.
- Development of the automated data collection system:
The SCADA system was developed with the following physical components: an Arduino Uno control card, coupled to a ToF time-of-flight sensor, VL53L0XⓇ. For computational control, the Arduino Ide is used to read the sensor data and generate a message on the serial port with the distance records in millimeters. Mathlab was used to read this serial port and develop a graphical user interface for displaying, storing, and enriching the sensor data. The data is finally exported in files suitable for Microsoft Excel.
Calibration of the measurement system
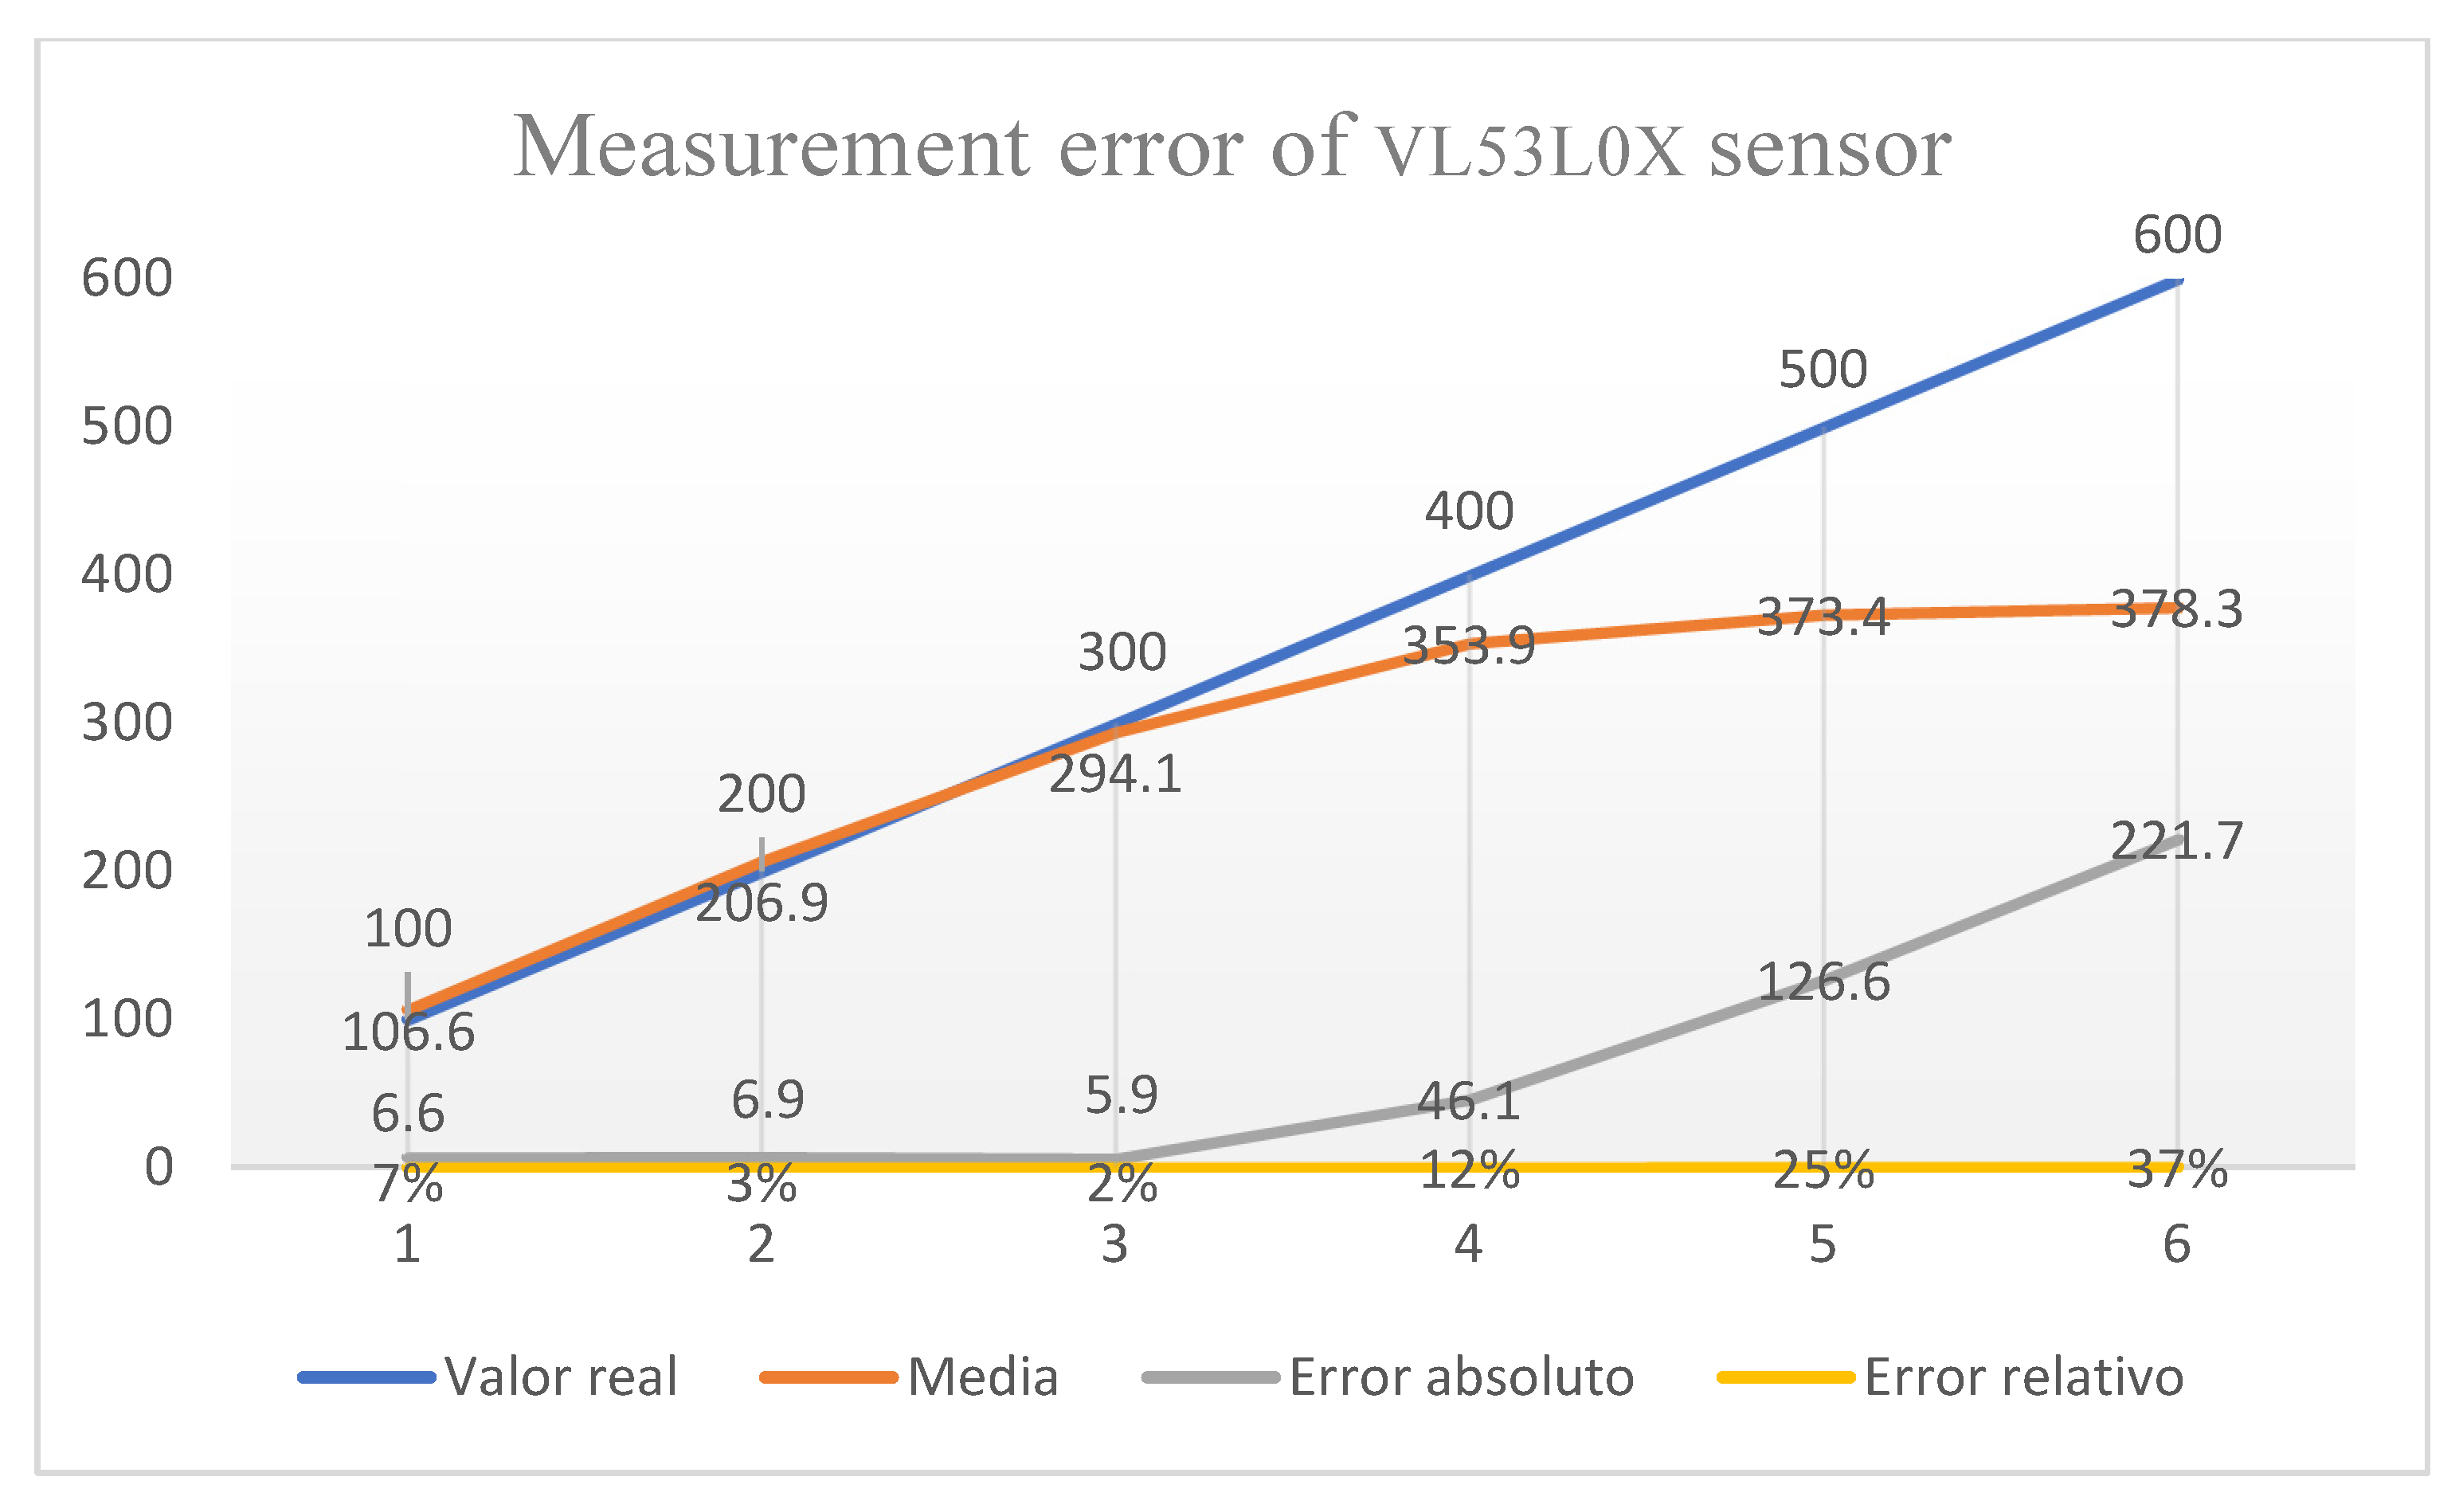
The calibration of the sensor was carried out through the comparison with a tape measure placed in a rail-type system, in which a Styrofoam wall (white) was placed perpendicular to the rail, with the possibility of moving up to 1000 mm on it and with a fastening for the sensor at one end, with which it detected the wall at the distances chosen for the test, to carry out 30 measurements (one per second), for distances of 100, 200, 300, 400, 500 and 600 millimeters, calculating standard deviation, absolute and relative errors for each value.
Instrument test
The test of the instrument was carried out at the facilities of the Autonomous University of Querétaro, with which the mechanical operation of the system was tested, as well as the coupling of the automated data collection system and its functioning.
3. Results
3.1. Instrument design
The instrument was designed to be a portable easy to ensemble mechanism, so it could be replicated easily. Tension infiltrometer is presented on the next Figure 1.
Designed Items (components) are described in the next section, for all other items at ill of materials, are accessible to find at commercial vendors.
3.1.1. Designed components (instrument mechanics)
Components have been designed using Onshape CAD software, exporting it to .STL format files, with which they were 3D printed. For components with water contact was chosen hard-type resin and for non-contact, polyethylene (PET).
This section may be divided by subheadings. It should provide a concise and precise description of the experimental results, their interpretation, as well as the experimental conclusions that can be drawn.
3.1.1.1. Infiltrometer base
The base has been designed with mechanical elements from the base of the INDI-INECOL infiltrometer: a water distribution chamber, which was designed with a smaller volume to reduce the drop in the water column when opening the valve and starting the rehearsal; a 36 mm diameter connection to press-fit the 1-inch PVC ball valve and another 11 mm diameter connection to connect a rubber tube to Mariotte system.
The diameter of contact with the ground was modified to improve stability in the field, without modifying the diameter of the water outlet, adding to the design an edge under the base to reduce the loss of contact with the ground during the operation of the equipment. Finally, the perforated bottom with 2 mm holes (25) was attached to the base design, and 4 fastening points were added to the outside of the piece that allow the infiltrometer to be staked when performing the tension test. Figure 1, shows the scheme and views of the component described.
3.1.1.2. Connection for reservoir and Mariotte
The Mariotte holder was designed to be pressed directly into the PVC valve replacing metal ball valve at original design, supporting water column weight at the reservoir and Mariotte. The design included the connections for the Mariotte conduit to the base, and the custom holes to insert the acrylic tubes (Mariotte and main reservoir) to pressure assembly them. Figure 2, shows scheme and views of the component described.
3.1.1.3. Sensor support
A piece was designed to hold the physical components of the SCADA system, where the Arduino Uno card, coupled to a commercial acrylic casing, is assembled to this piece called sensor support, and it is designed to be placed in the water inlet of the main reservoir at top of the infiltrometer. Figure 3, shows the scheme and views of the component described.
3.1.1.4. Design for infiltrometer assembly
The assembly design considers it to be simple, so that the infiltrometer can be built in situ. For this, an assembly diagram was made, which considered Infiltrometer components showing the assembly sequence and operation diagram. Scheme is shown at Supplementary information.
3.2. Development of the automated data collection system
For the present design, a SCADA system has been developed, which is defined as a control, action, decision, storage and data recording system. This system collects field data from a sensor connected to a master station, which in our case is an Arduino Uno card, for reading through the serial port. Matlab R2023a version [17] was used to read this serial port and a graphical user interface was developed for the display, storage and enrichment of the sensor data. The data is finally exported in files suitable for Microsoft Excel.
A VL530LXⓇ sensor was selected that is based on a Time-of-Flight (ToF) distance measurement system or time of flight which allows to accurately measure the time it takes for light to travel from the closest object and return reflected to the sensor. It has a supply voltage of 3V – 5V DC, a current of 10mA (40mA Max), a resolution of one mm and works at an operating temperature of -20°C to 70°C and its dimensions are: 25 mm x 10.3 mm x 3.5 mm. This sensor detects the height of the water column from a circle of Styrofoam that floats in the water column within the main reservoir, which descends as the soil consumes the water from the reservoir.
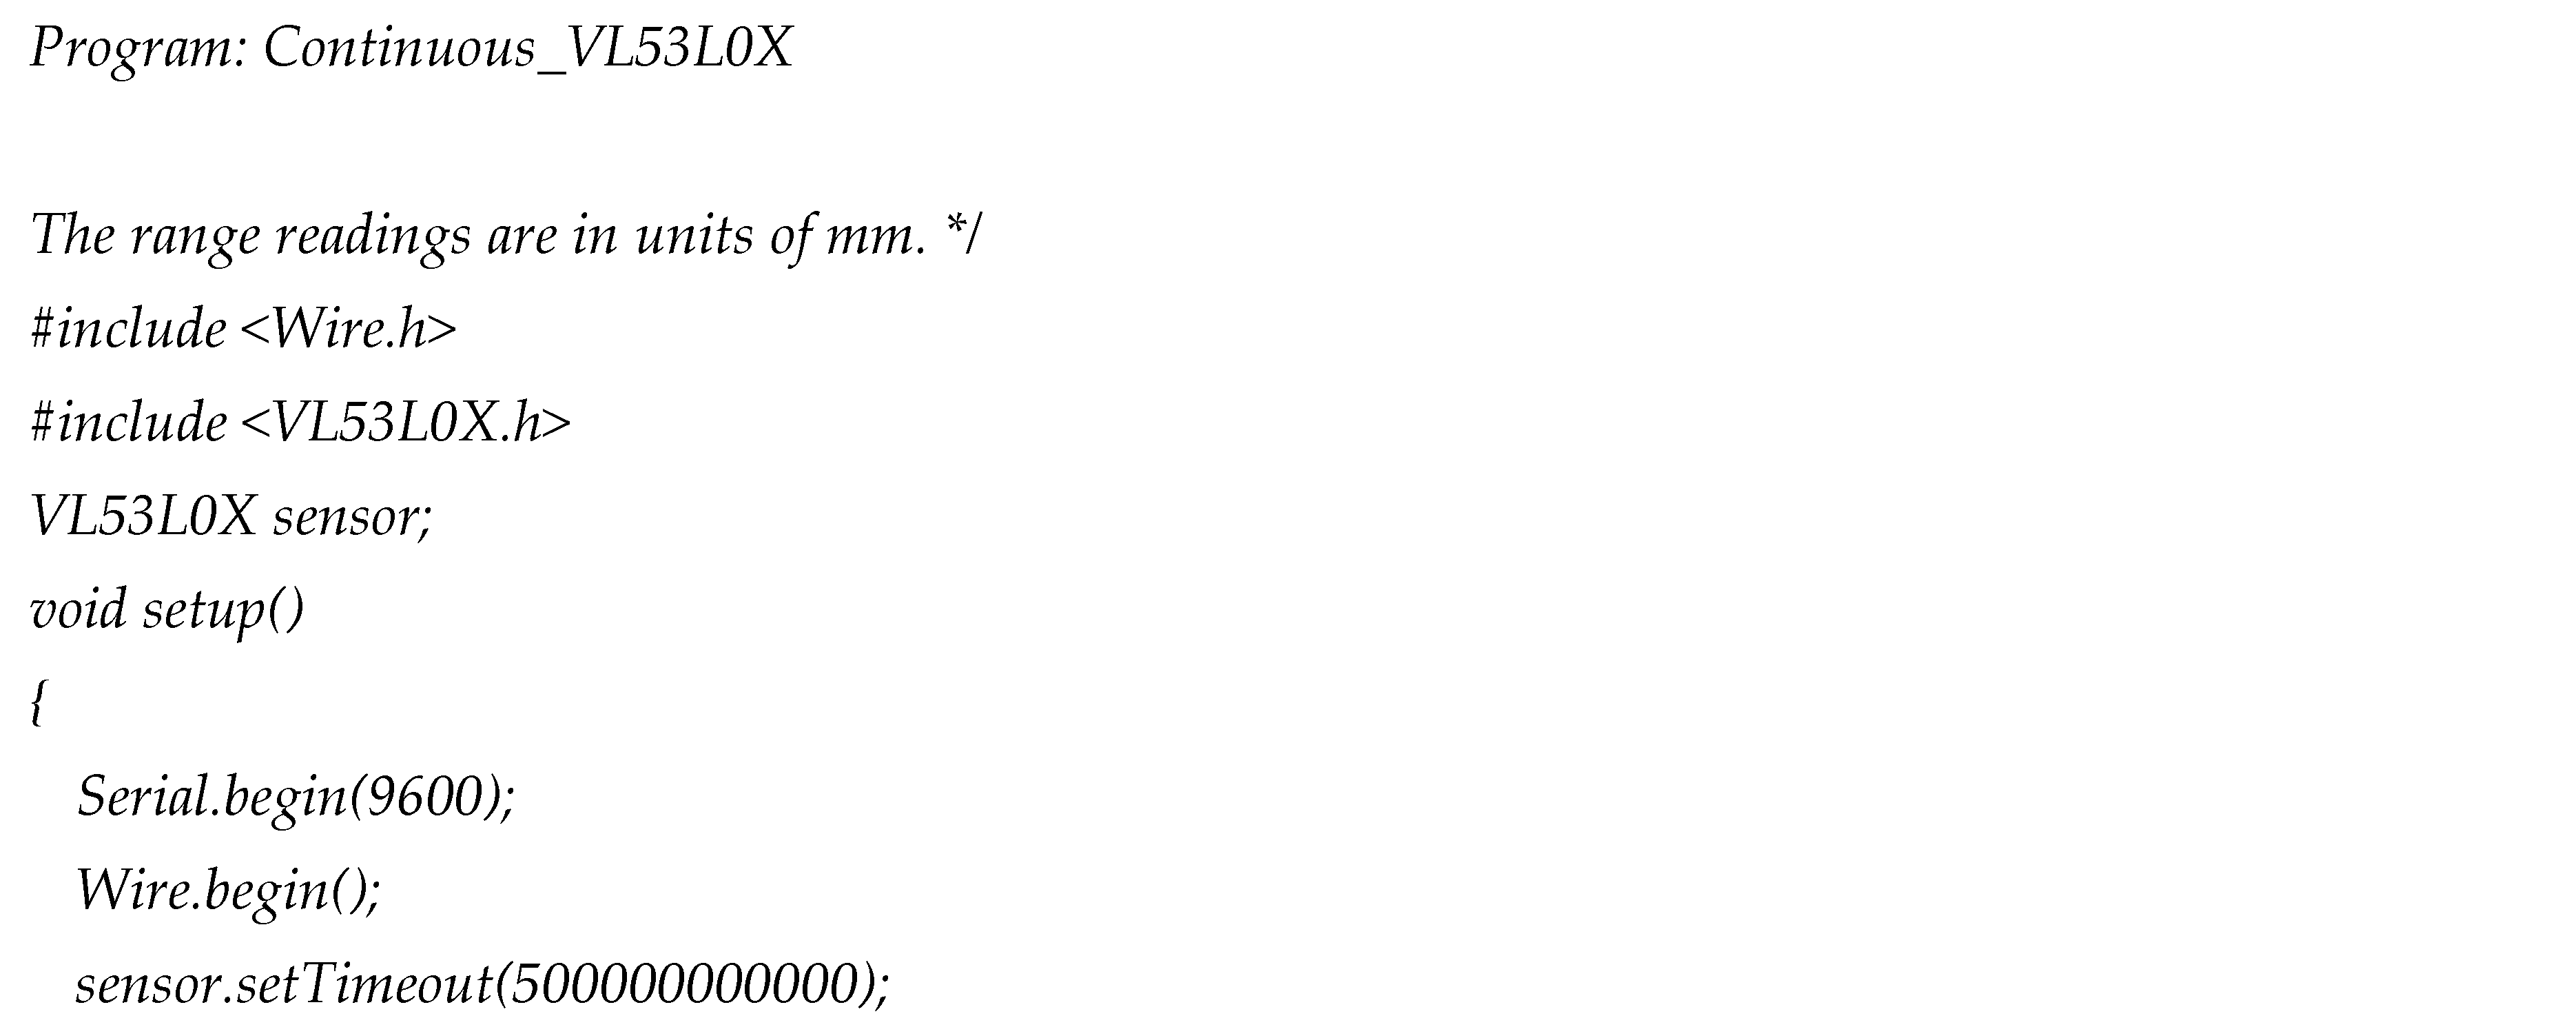
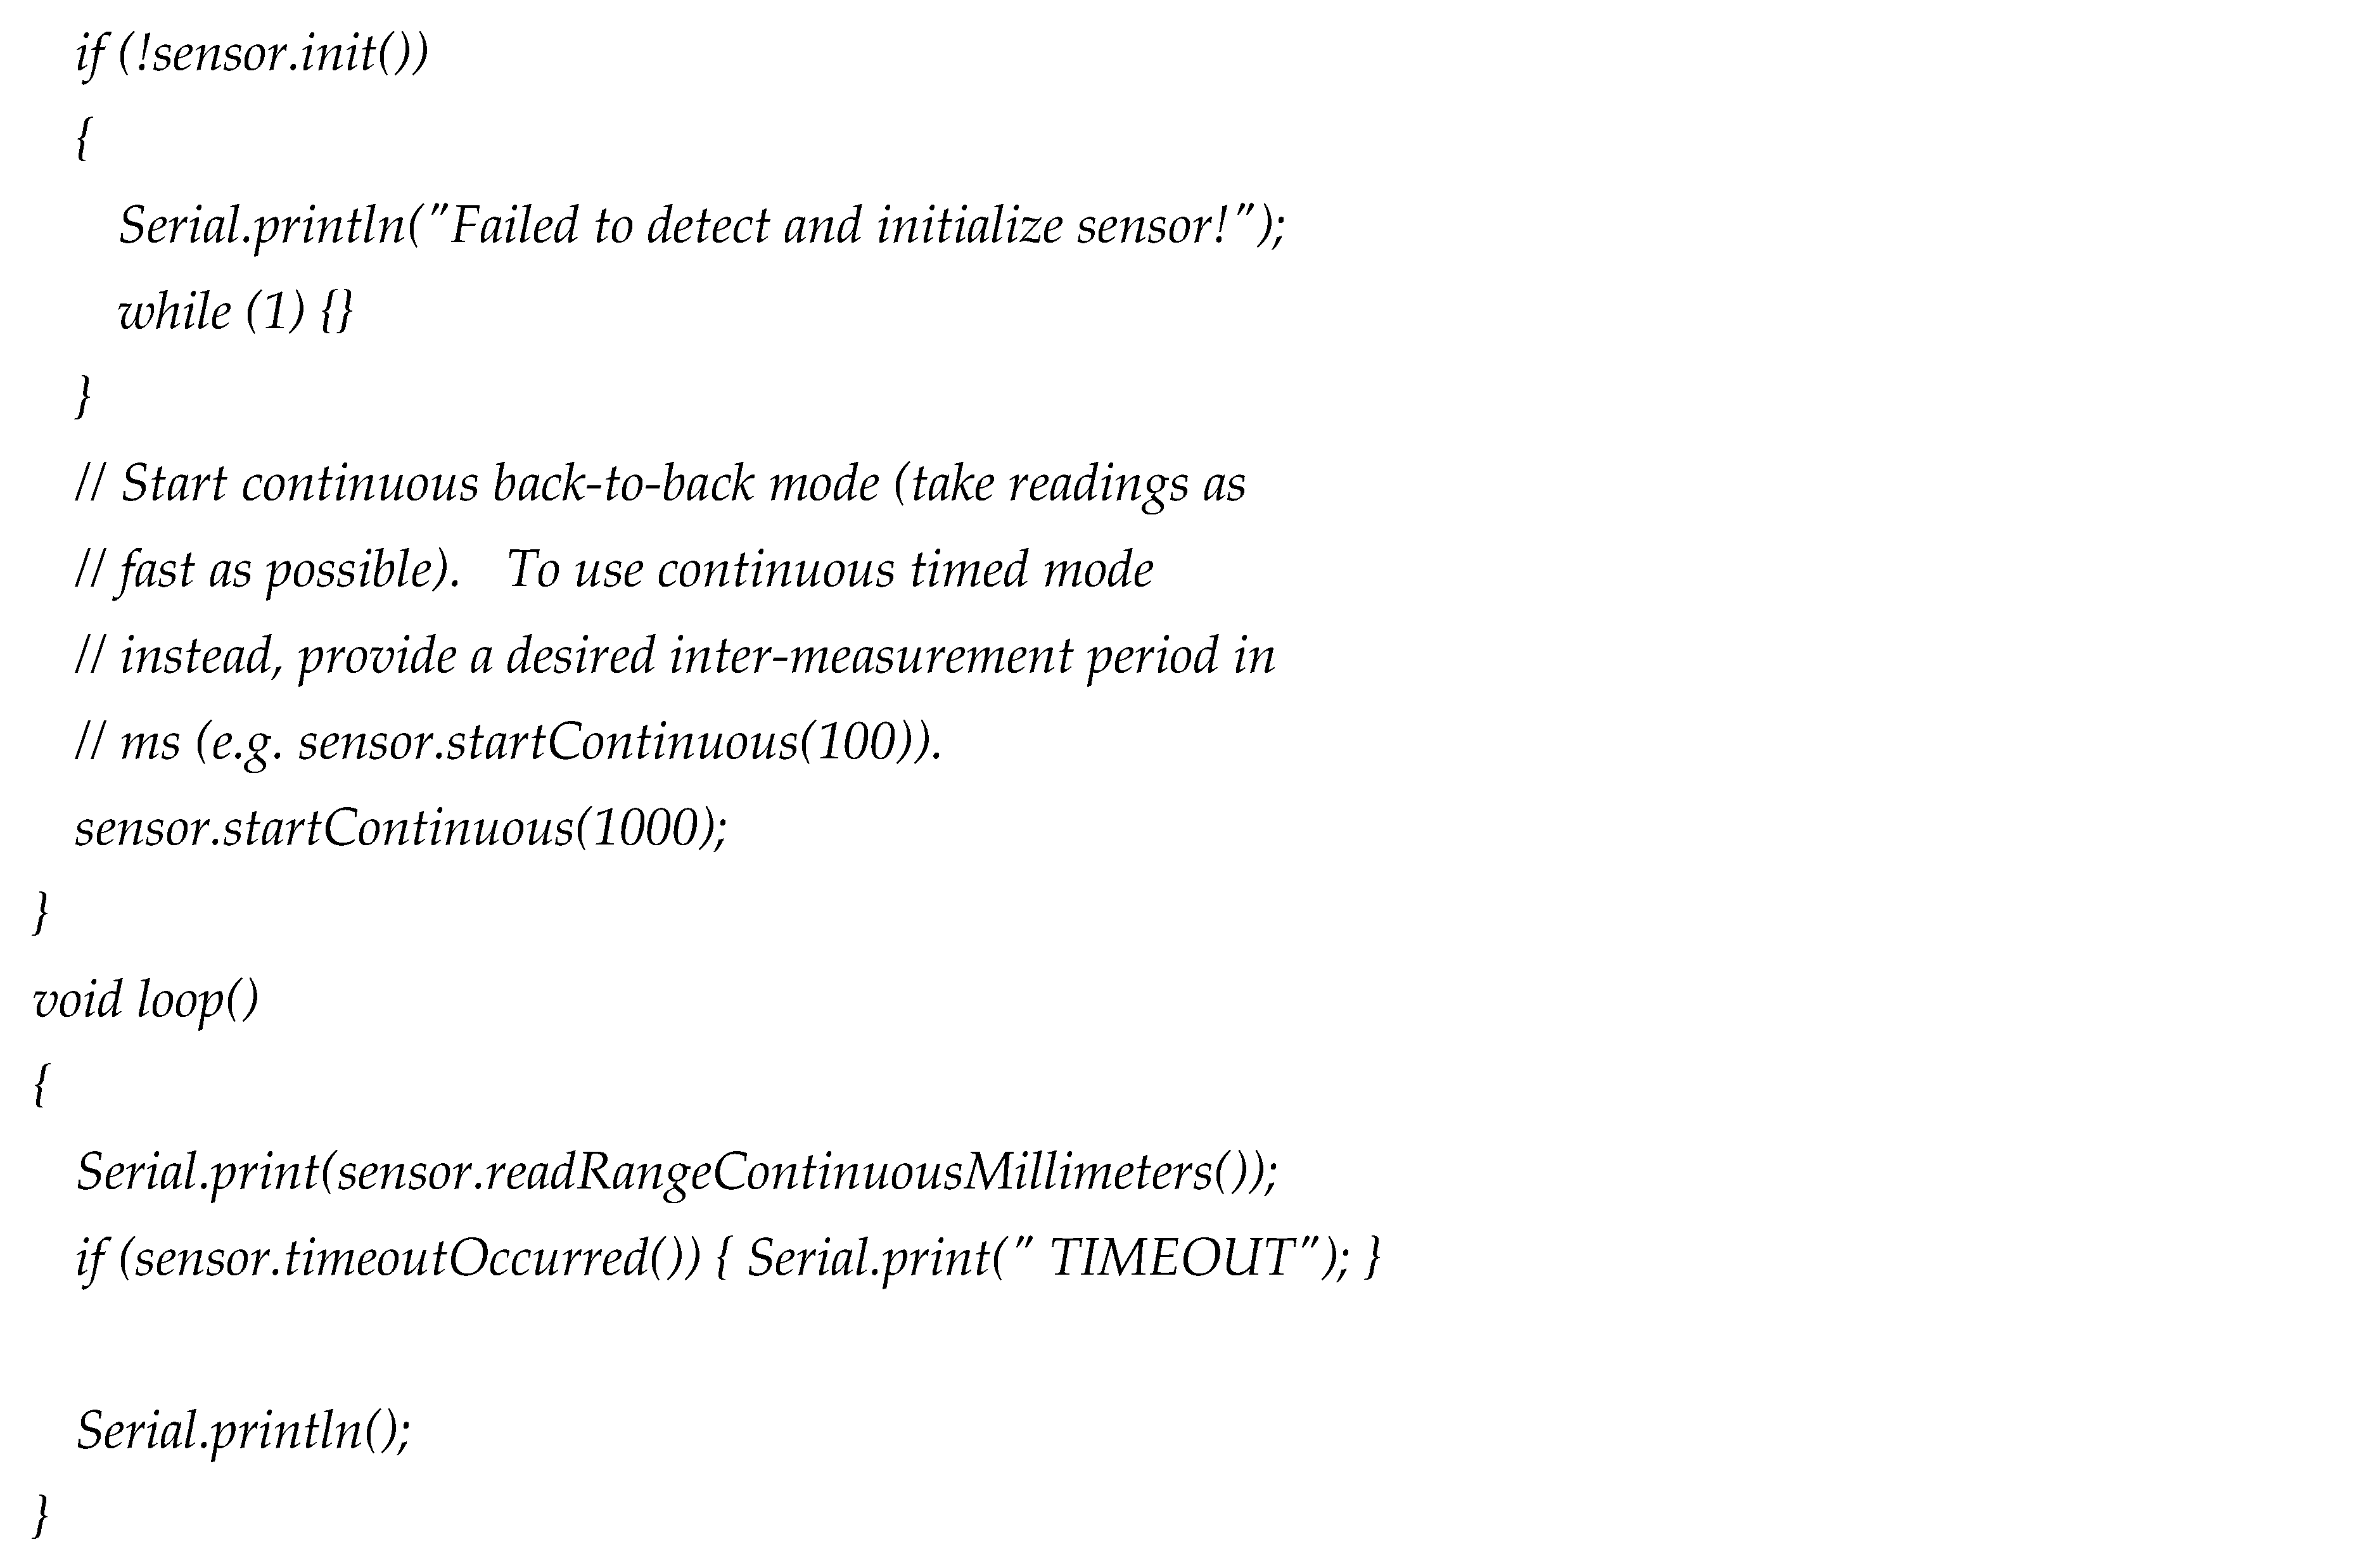
3.2.1. Programming the data collection through Ide Arduino
To program the VL53L0XⓇ sensor, it was downloaded from the Adafruit library, choosing the measurement option continues to adapt it to the measurement ranges by choosing to measure every 10 seconds (100000 ms). The code is showed up next:
3.2.2. User interface in Arduino and Matlab environment
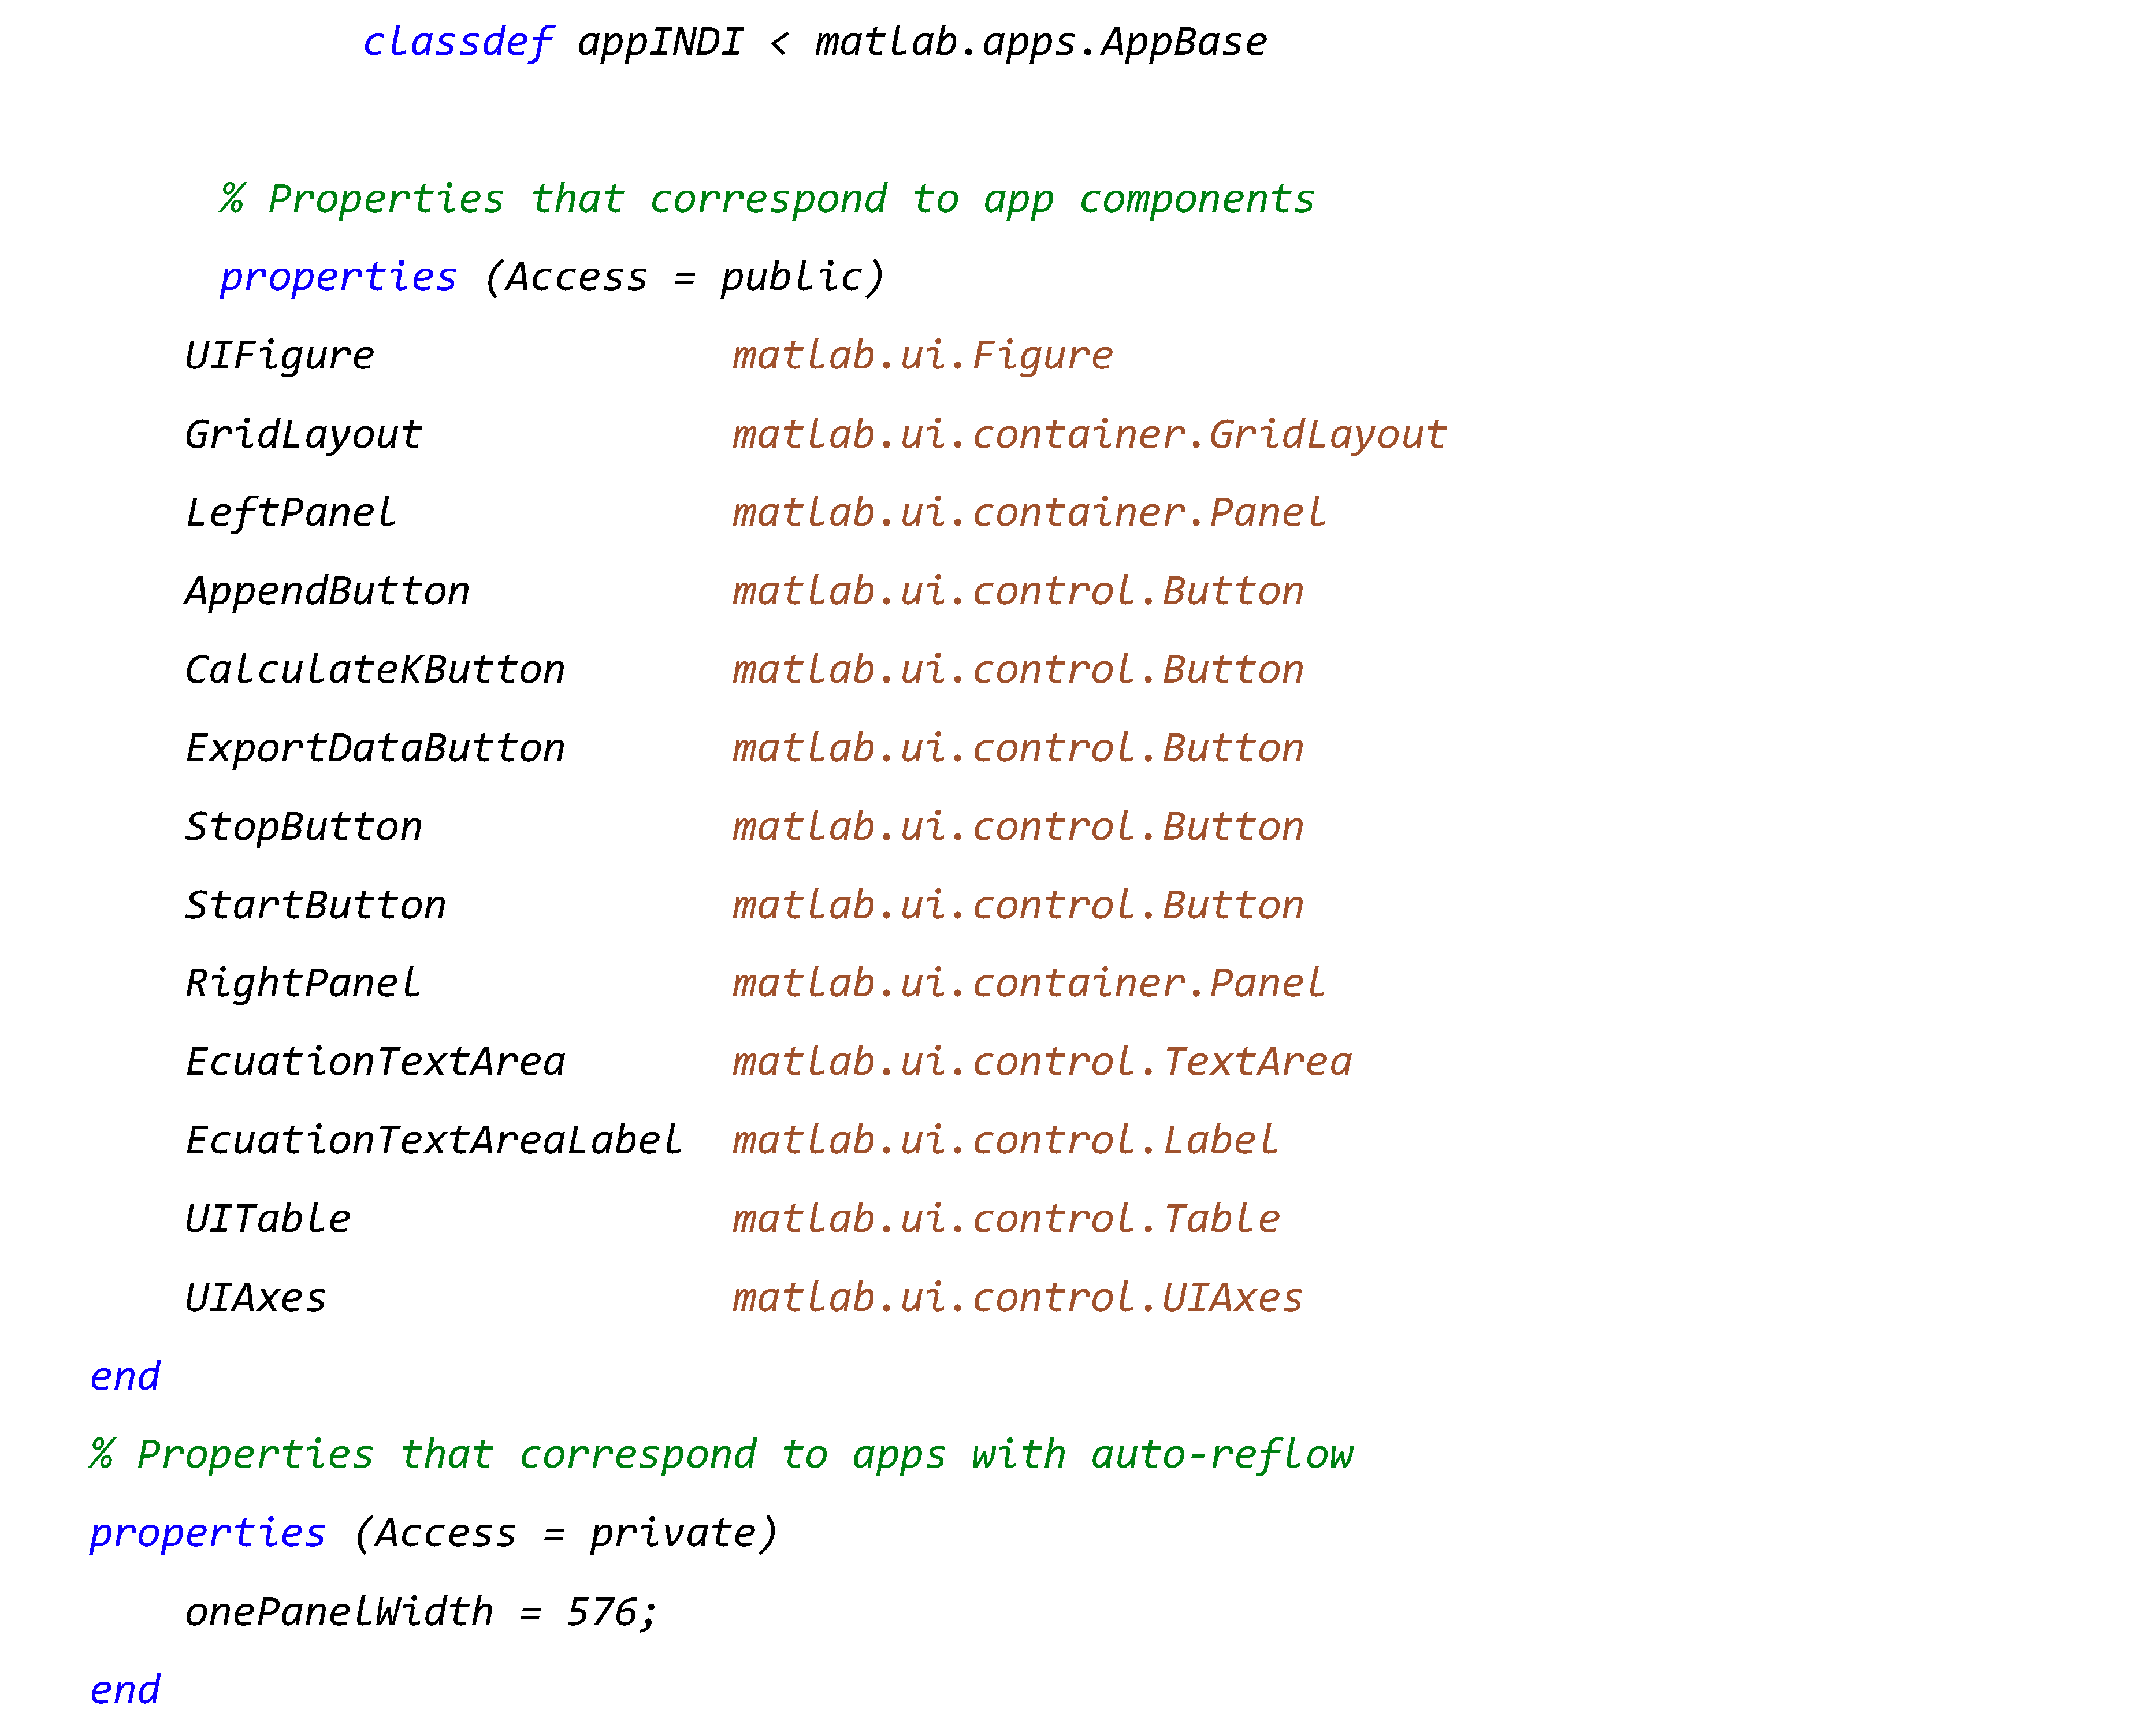
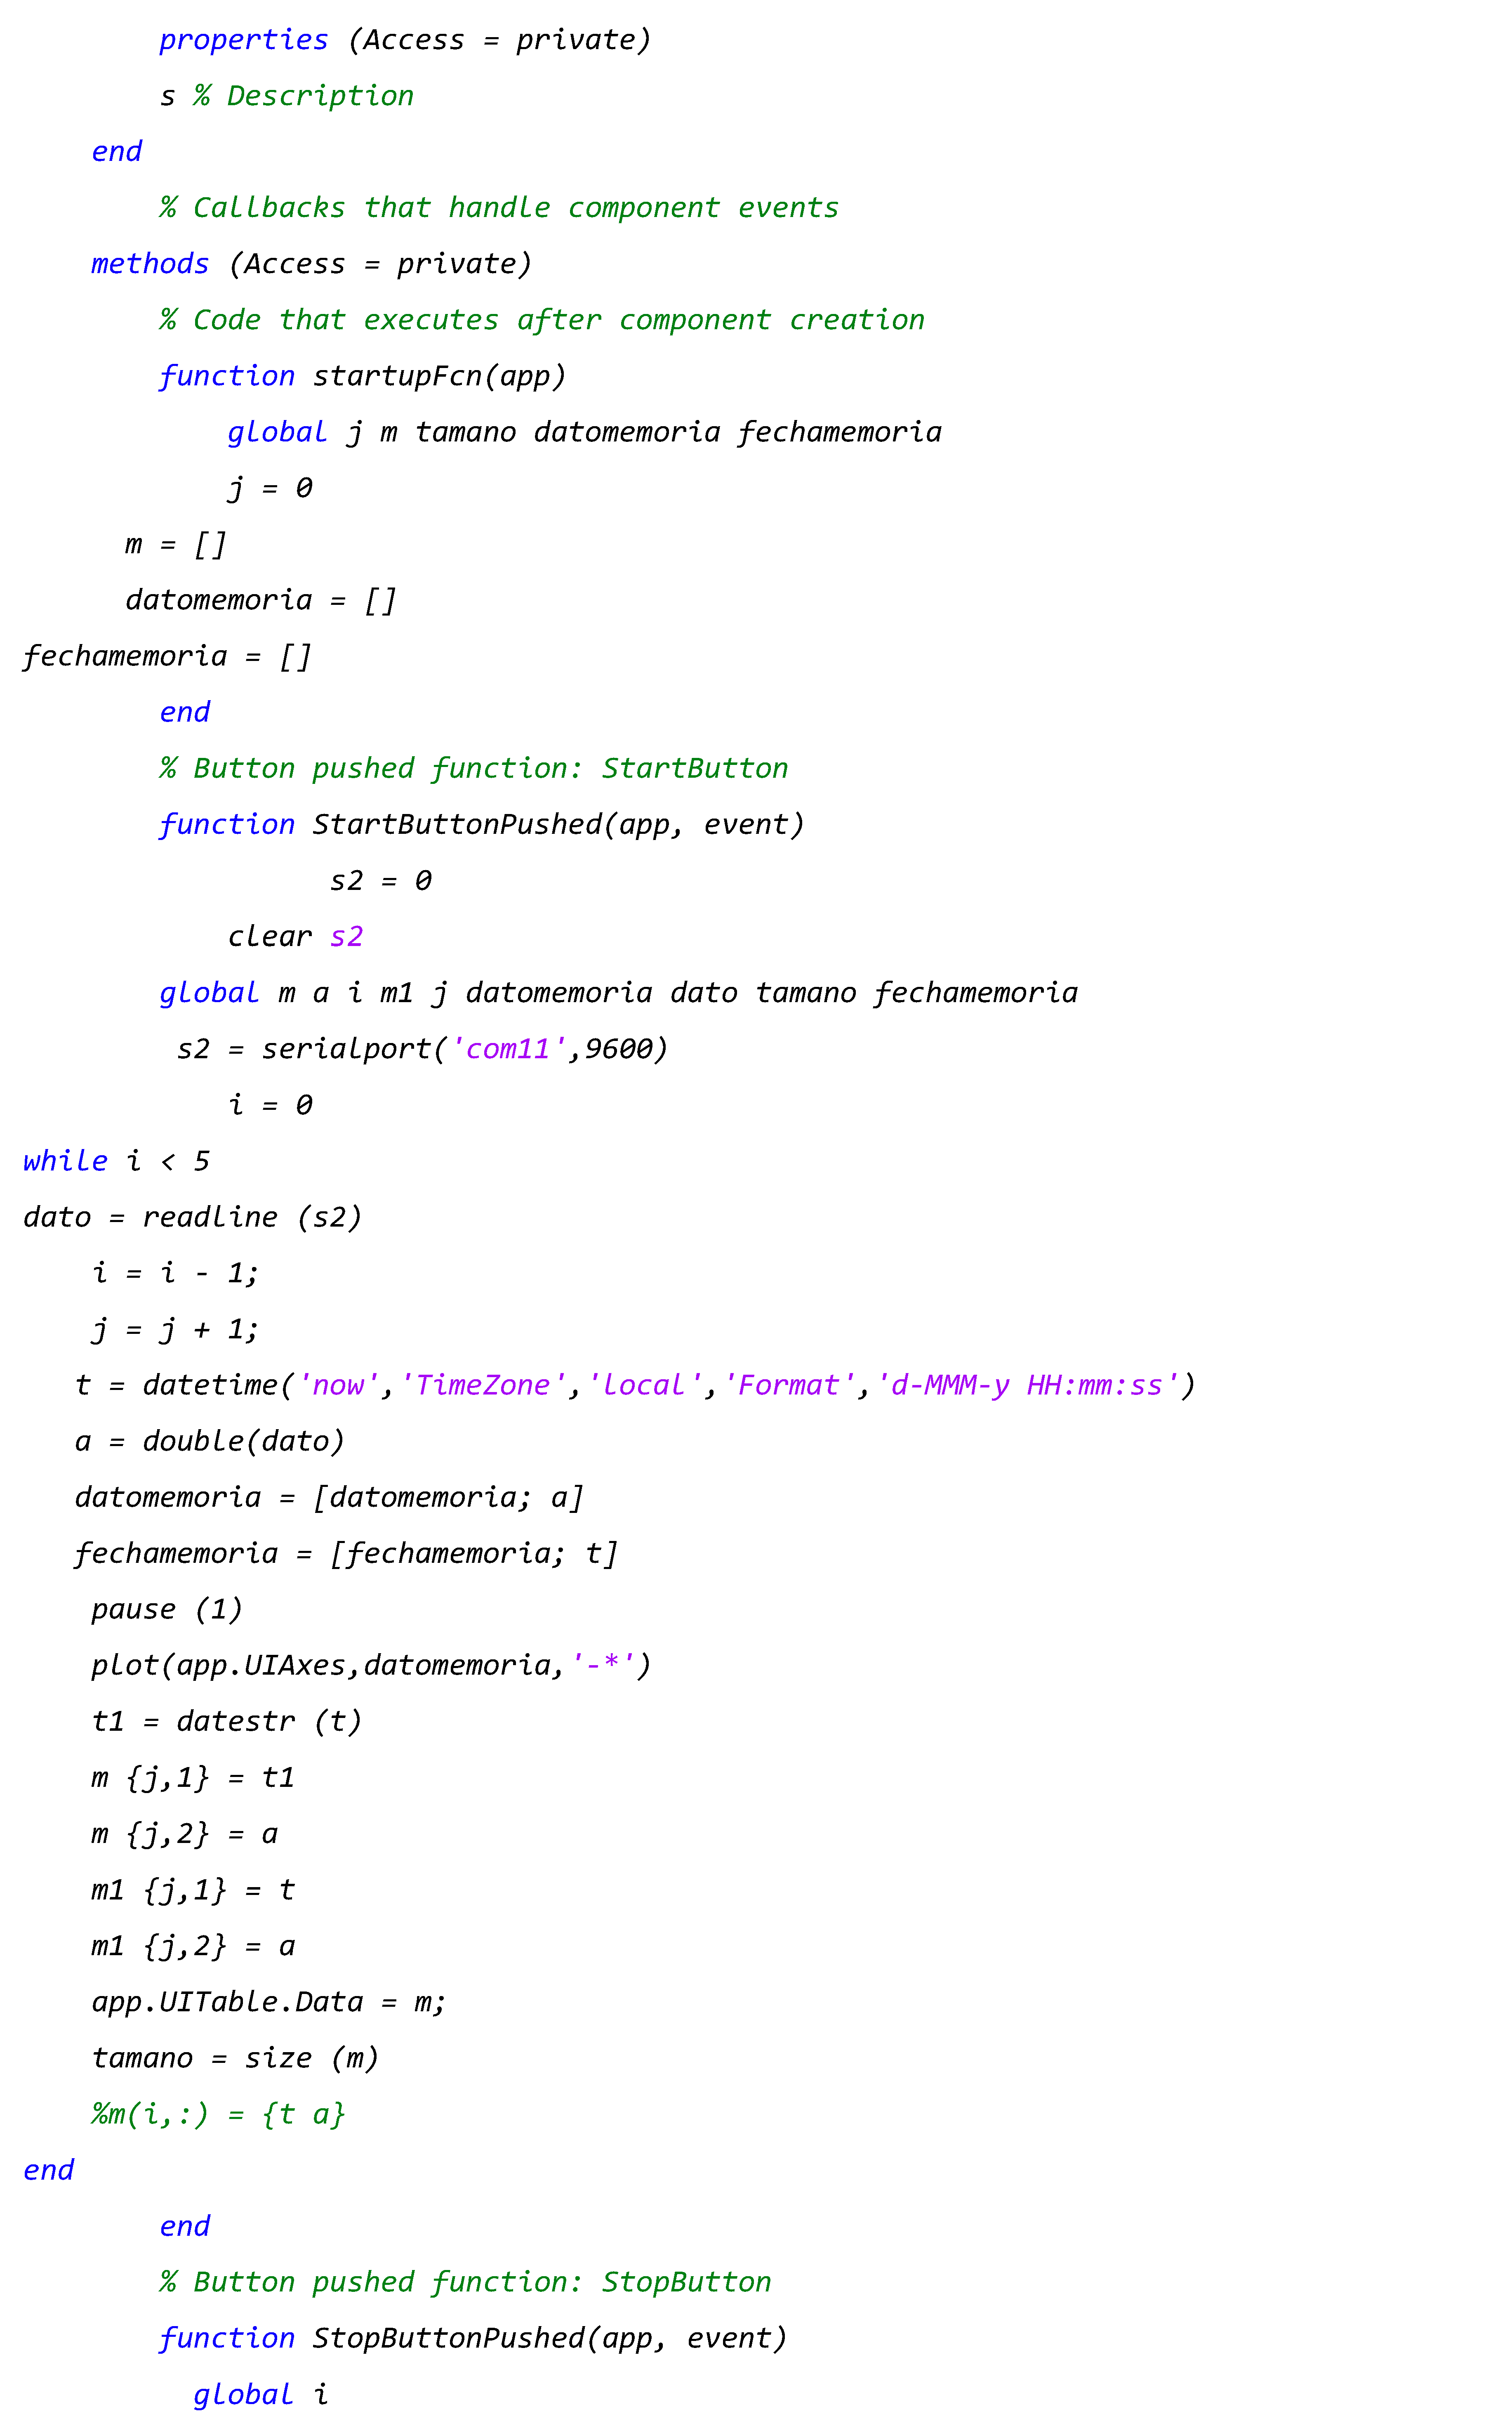
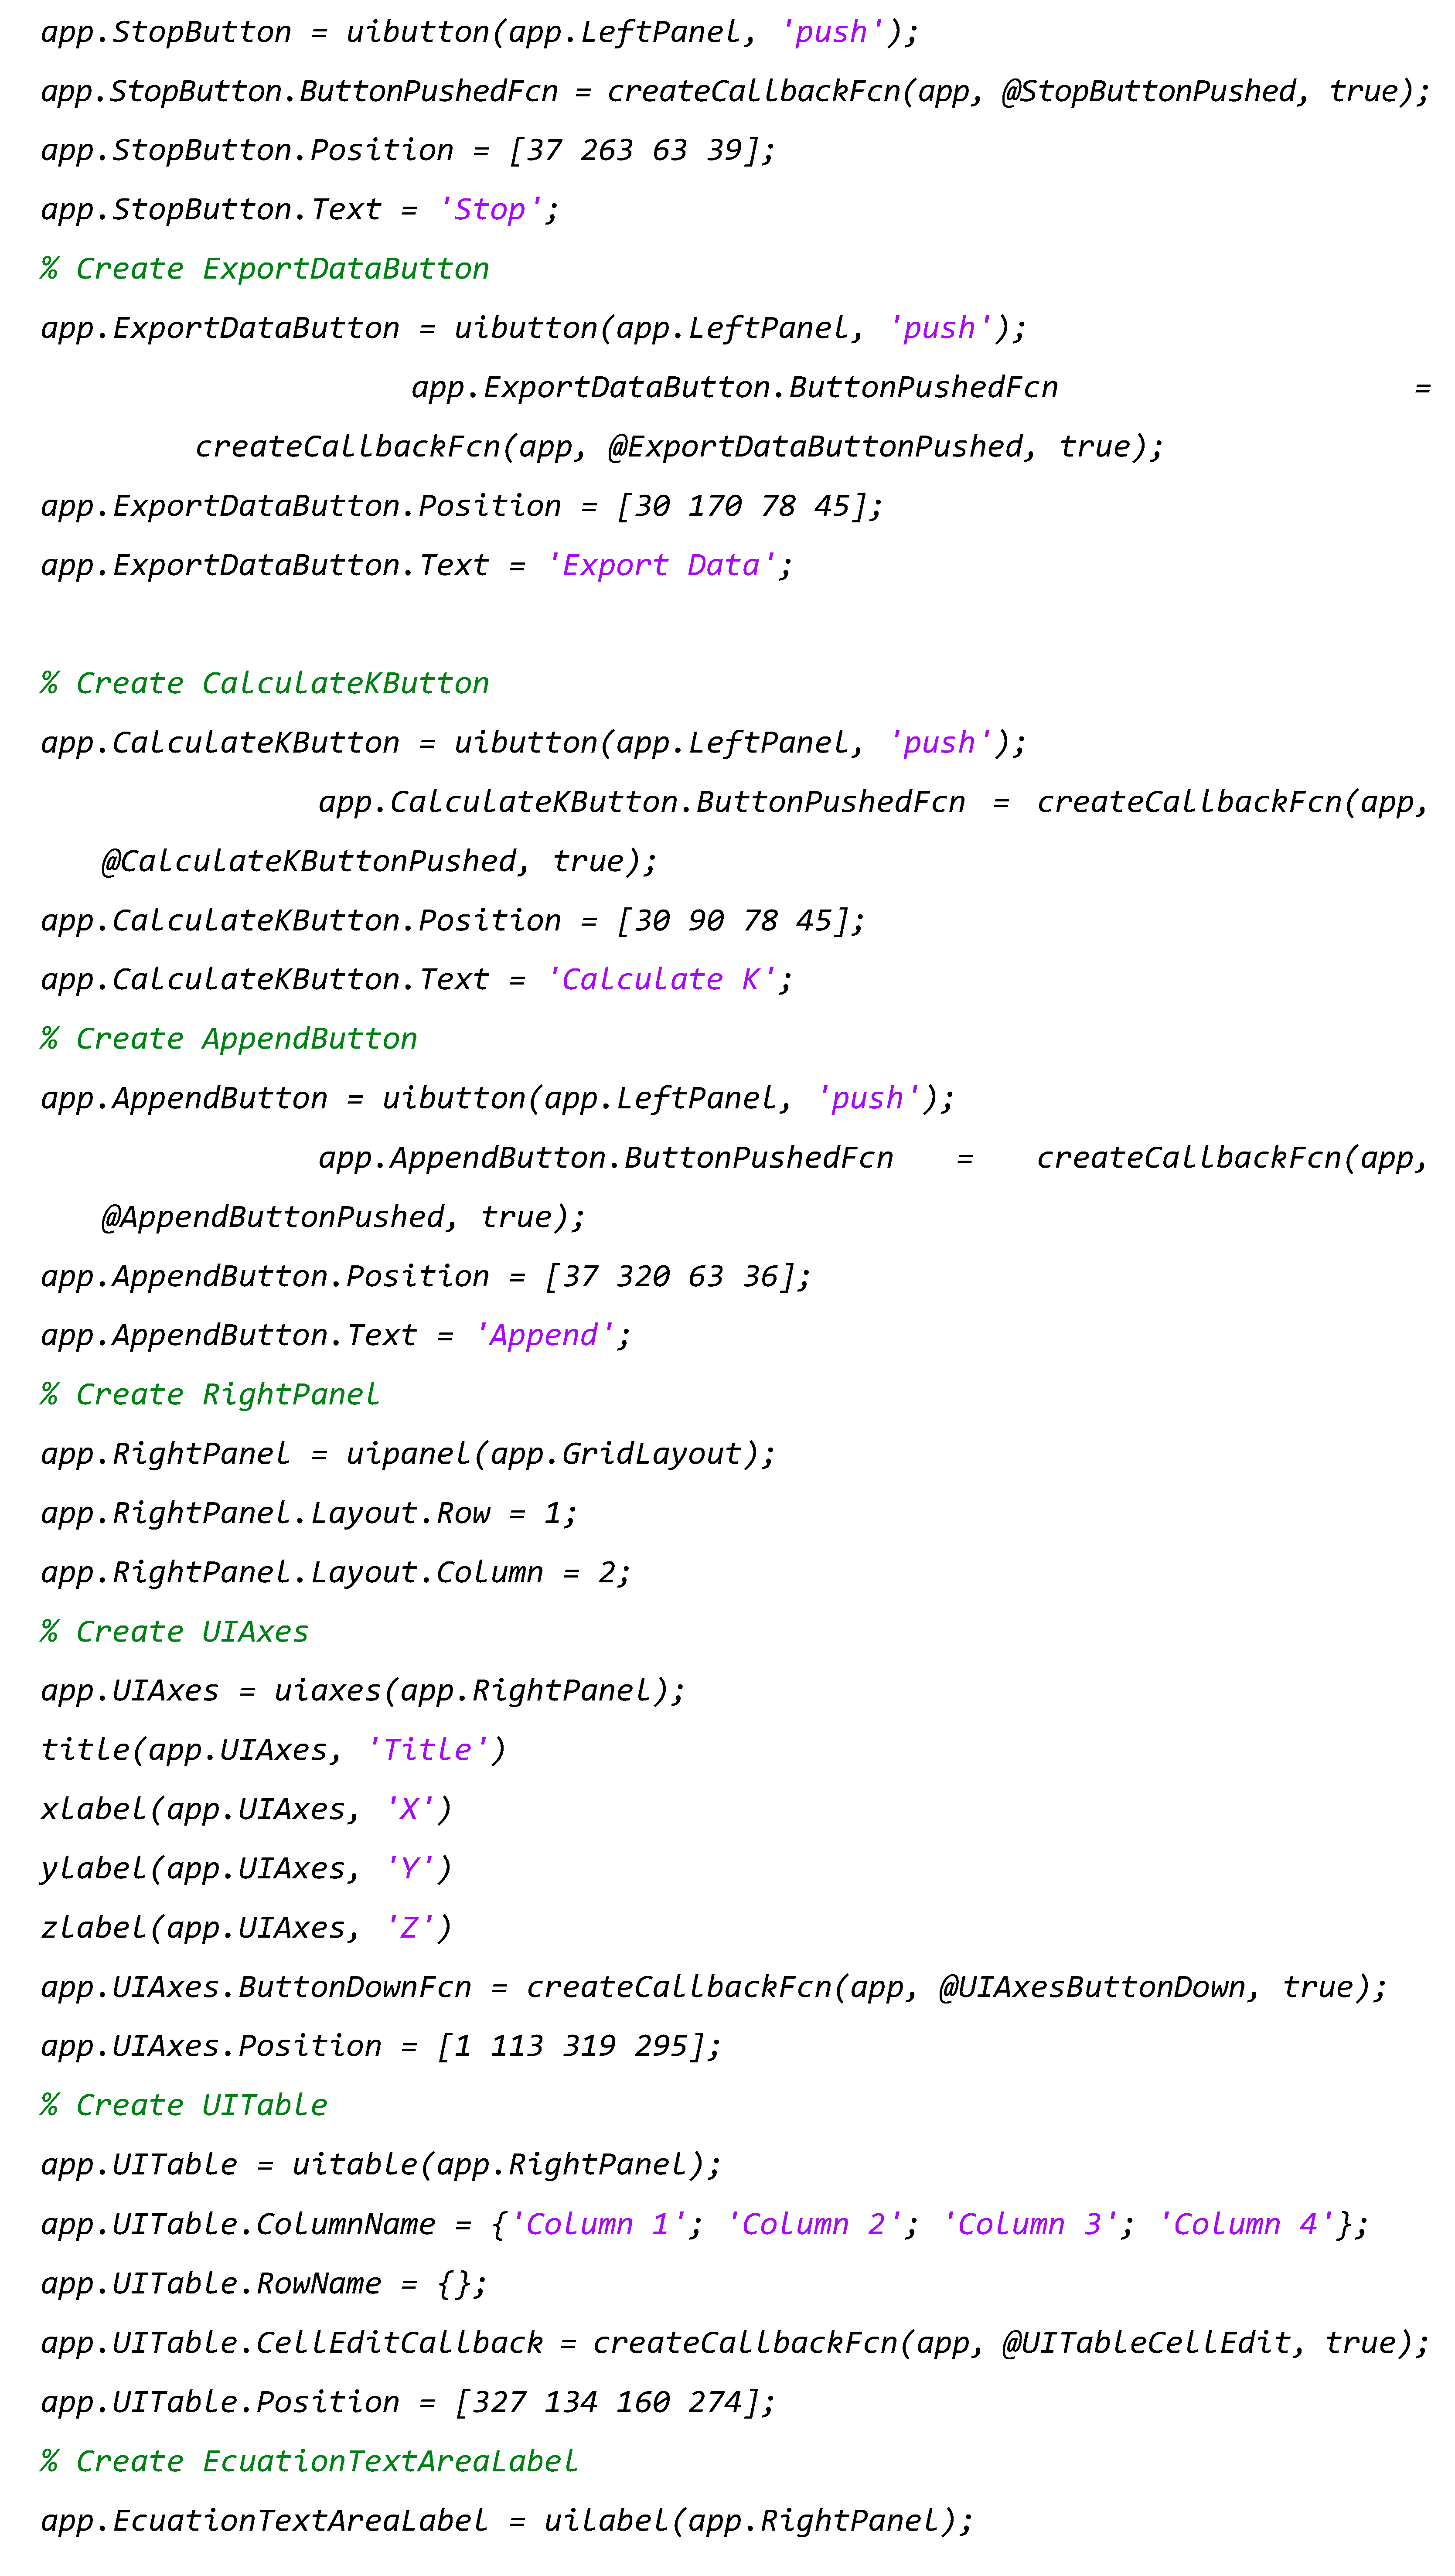
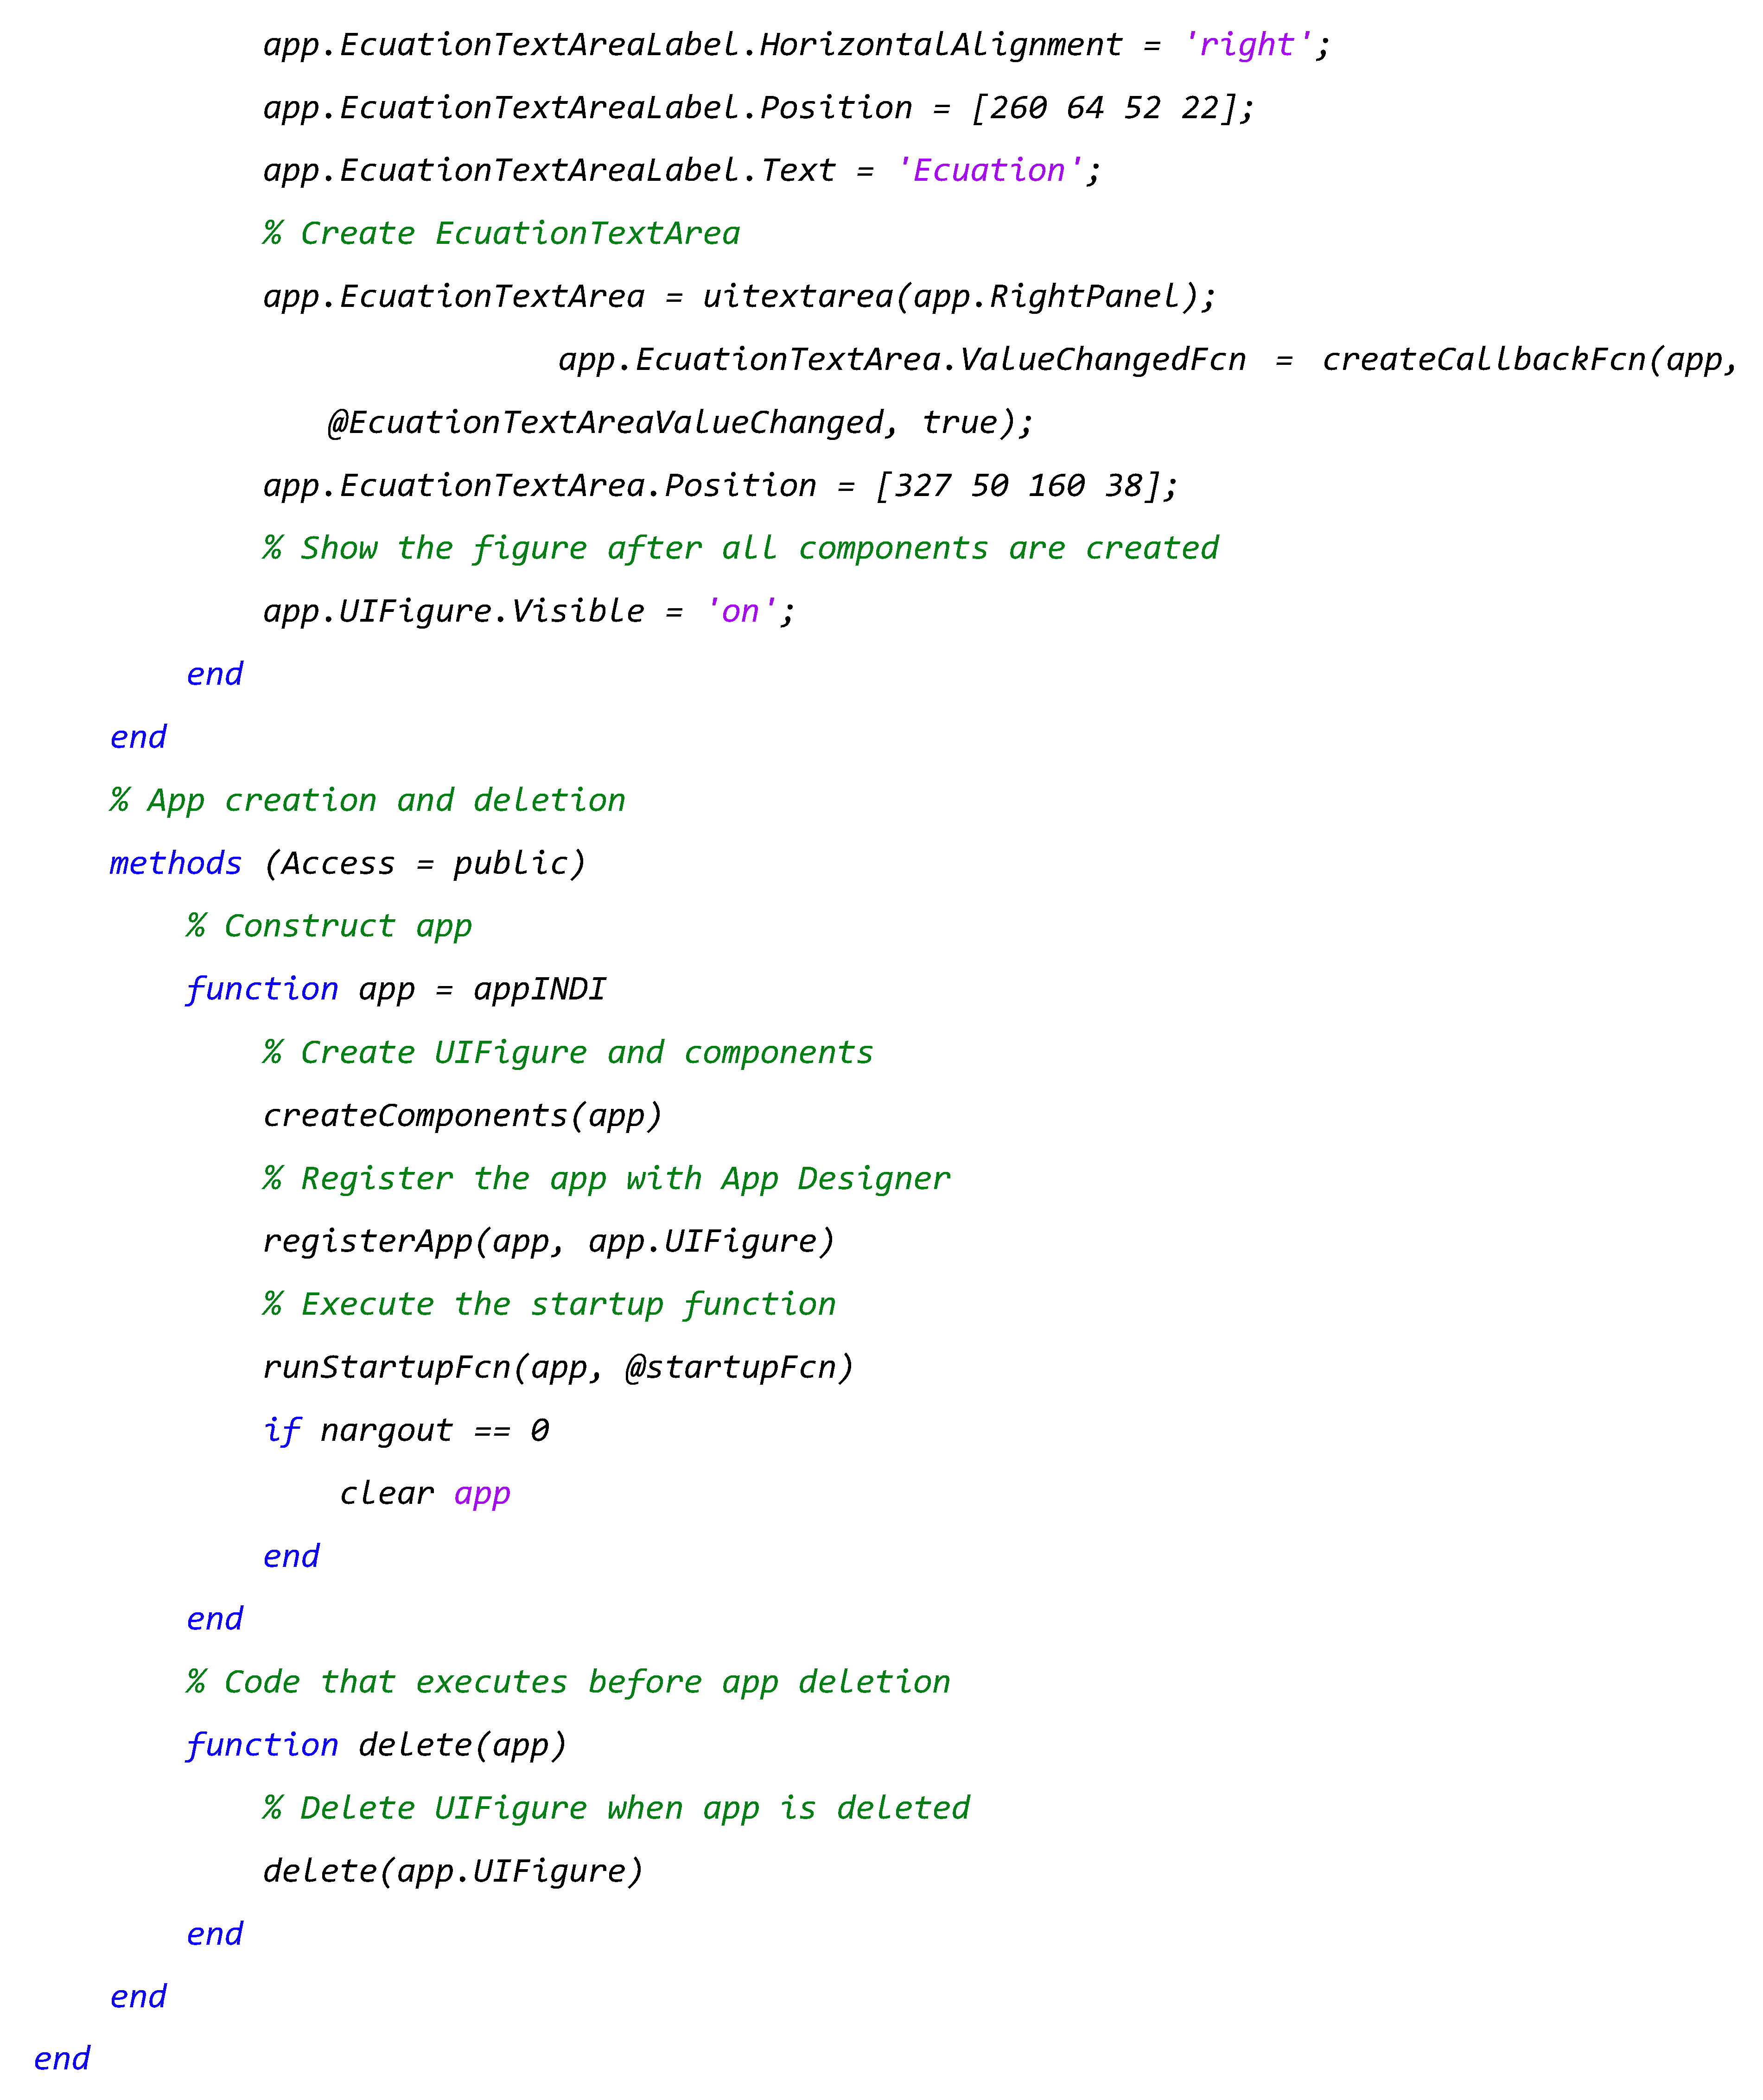
Matlab R2023a version, was used to read the data through the serial port and through a graphical user interface, developed through appdesigner within the same environment, for the display, storage and enrichment of the sensor data to finally be exported in appropriate files. for MS Excel.
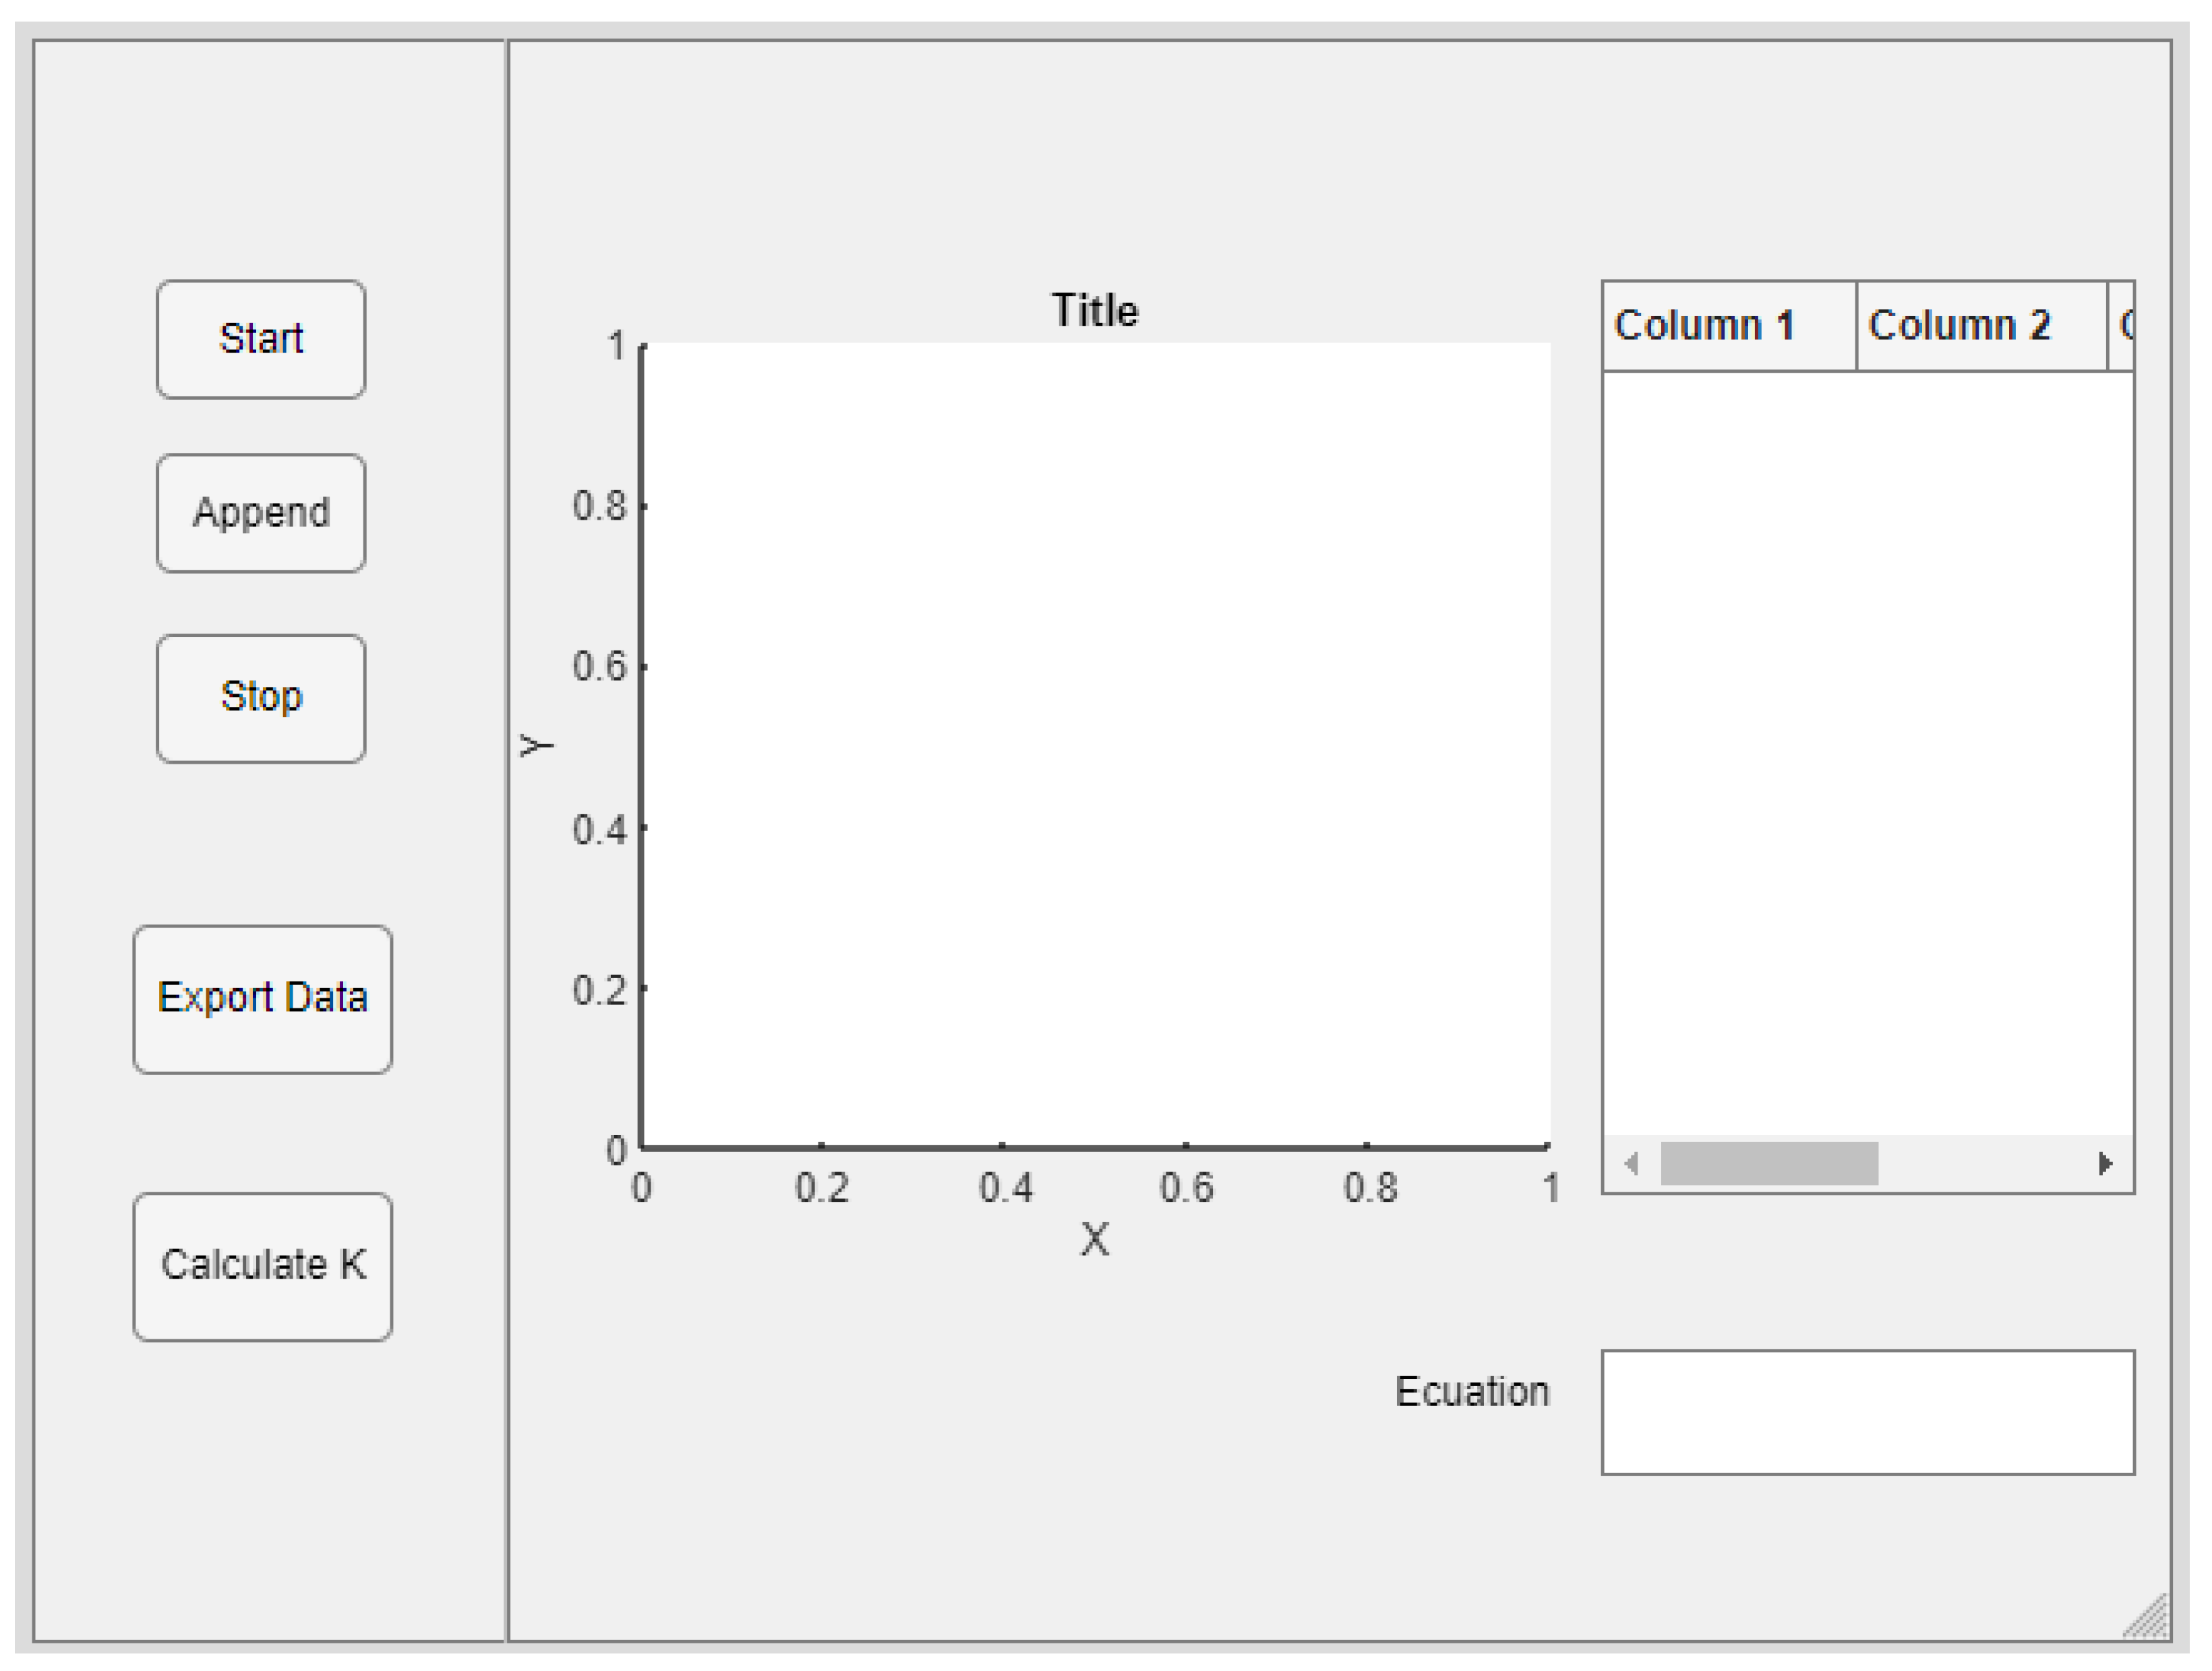
In this environment we can use apps that are stand-alone programs with a GUI graphical user front end that automates a task or calculation. The programmed application collects data in real time on the distance of the water column within the main reservoir. The application was designed with four buttons, a table (Table) and an axis graph (Axes), which perform the following functions:
o Start button (Start). When pressed, the reading of data from the serial port begins, and from that moment, the system memory stores the data, ordering them in the table component (Table), storing them in virtual memory to also graph them in the graph component of axes (Axes), being that in the ordinates the collection time is plotted in hours, minutes and seconds, against the data of height of the water column in mm, in the abscissas.
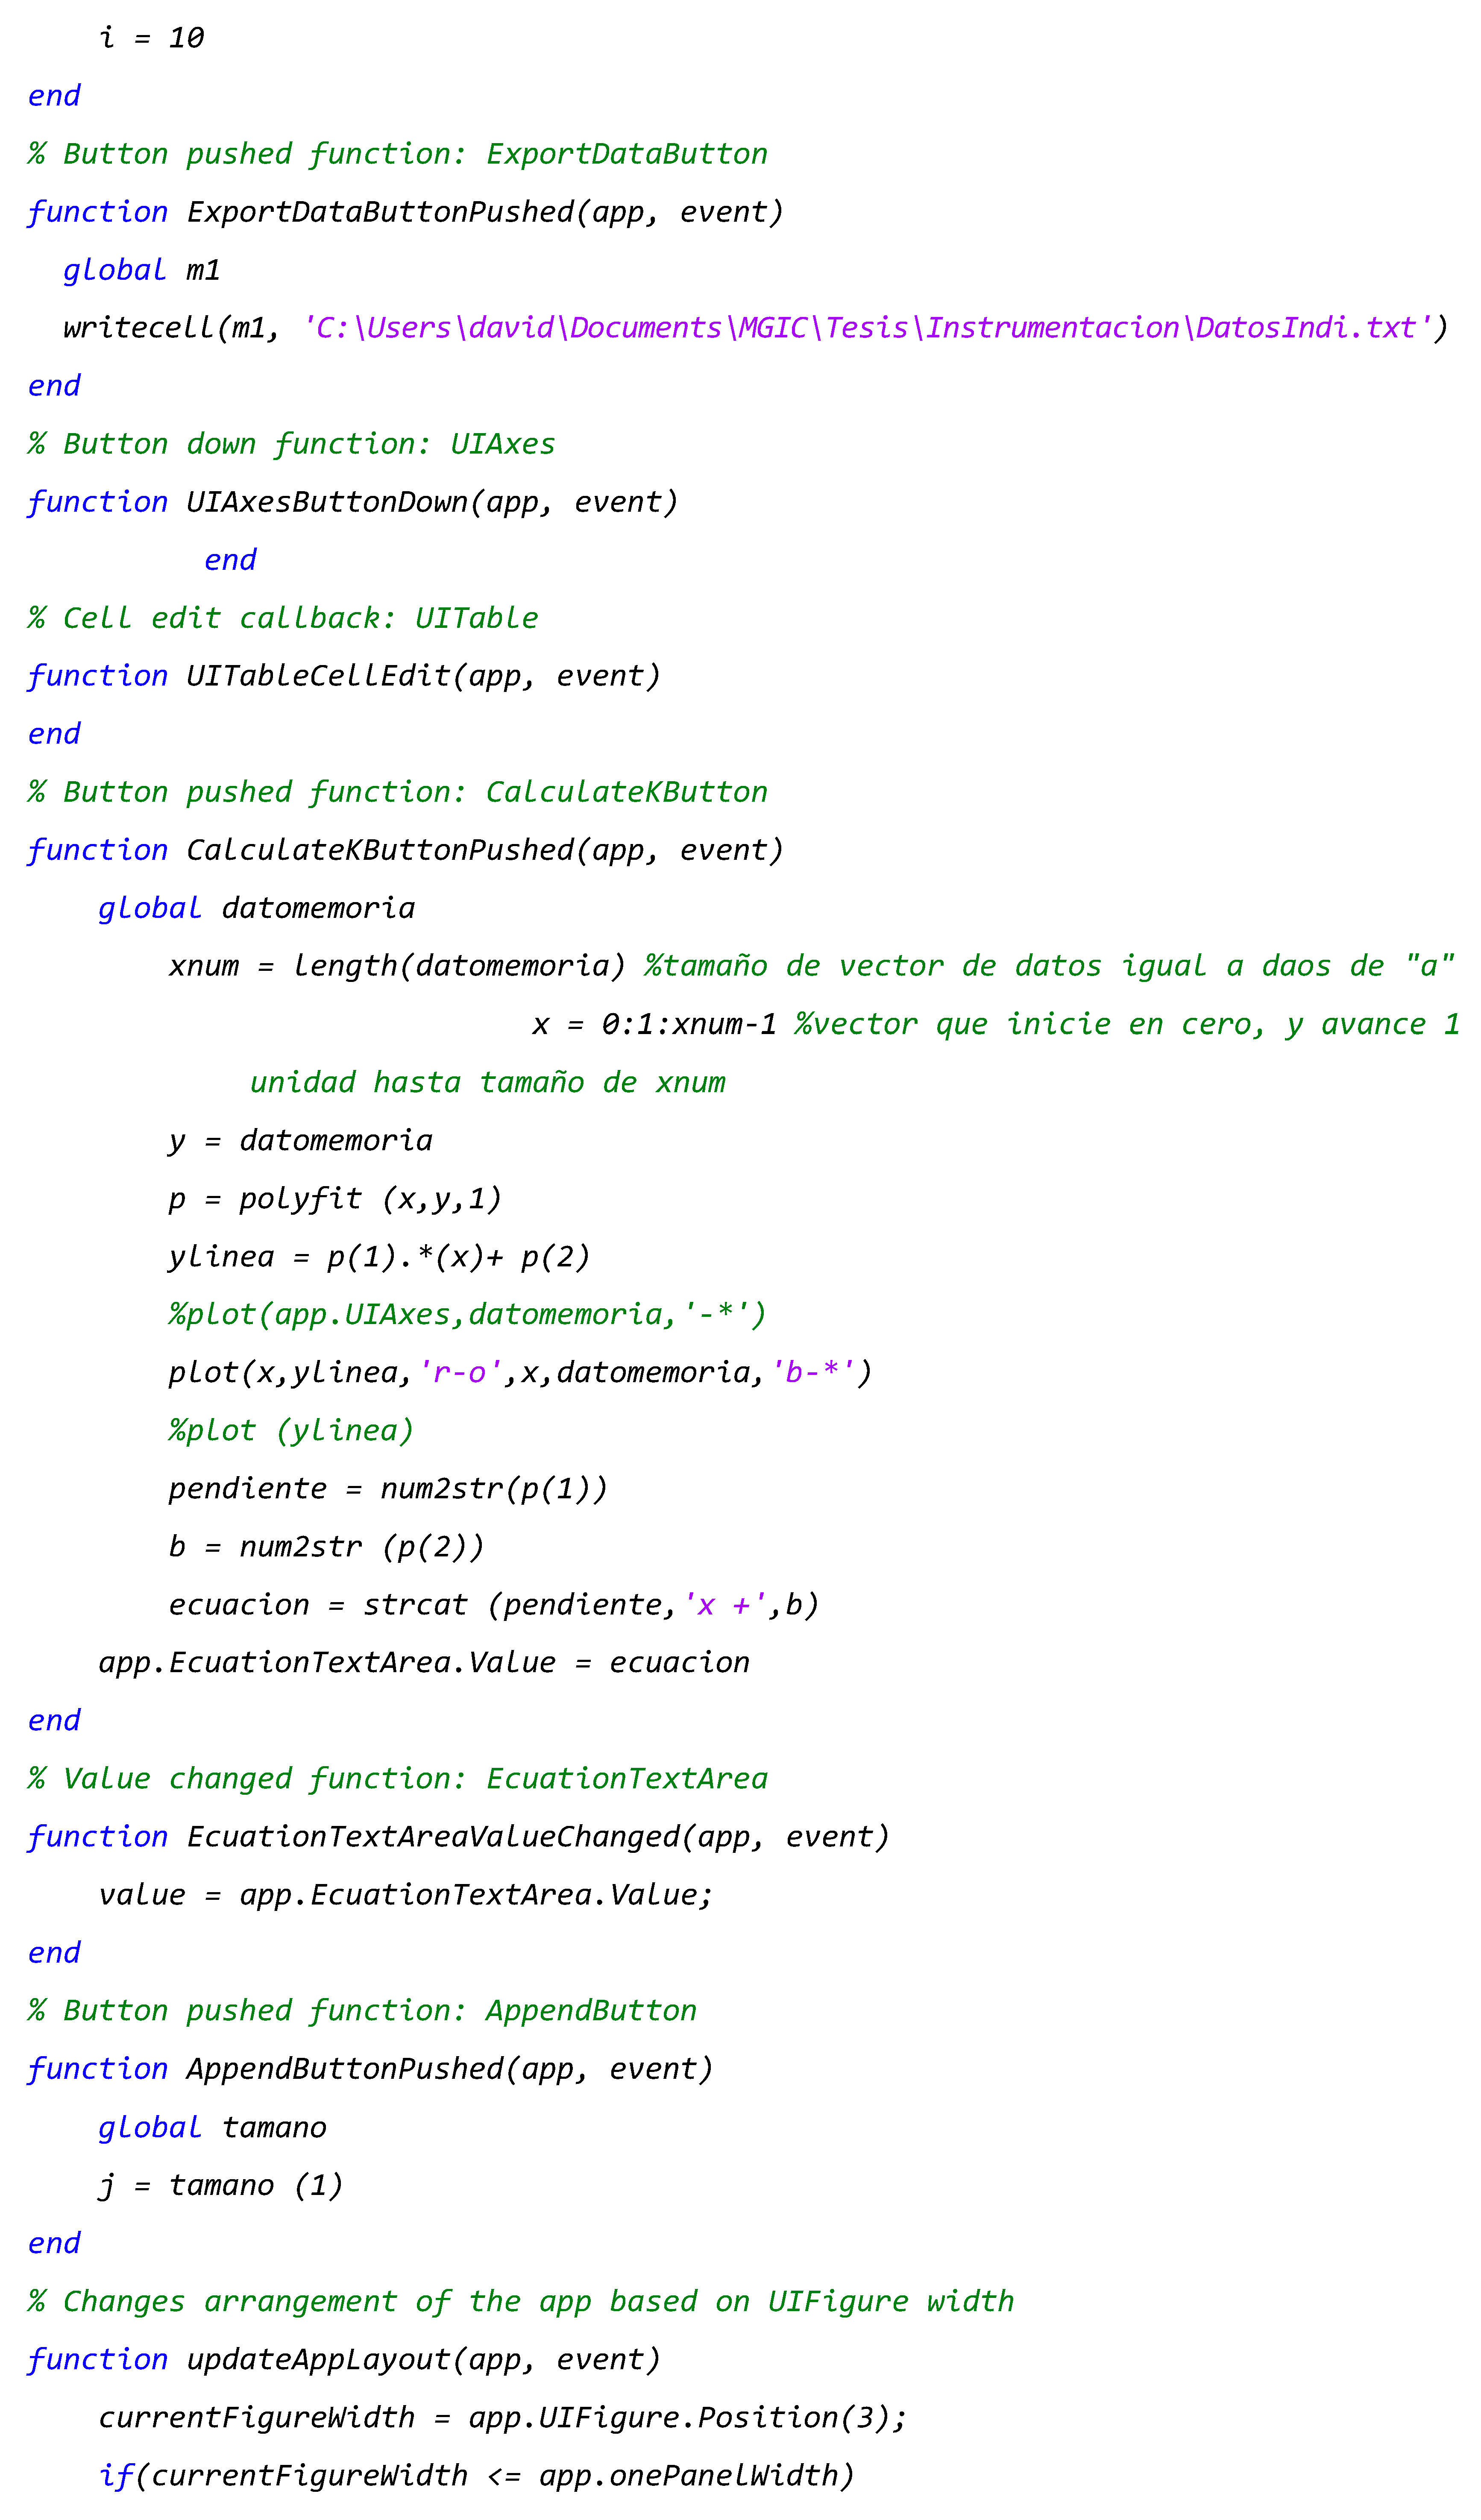
- End of data collection button (Stop). When this button is pressed, it ends the functions of reading data in the serial port, graphing and ordering in the table.
- Button to export the data obtained (Export) to a suitable file for Microsoft Excel for further processing.
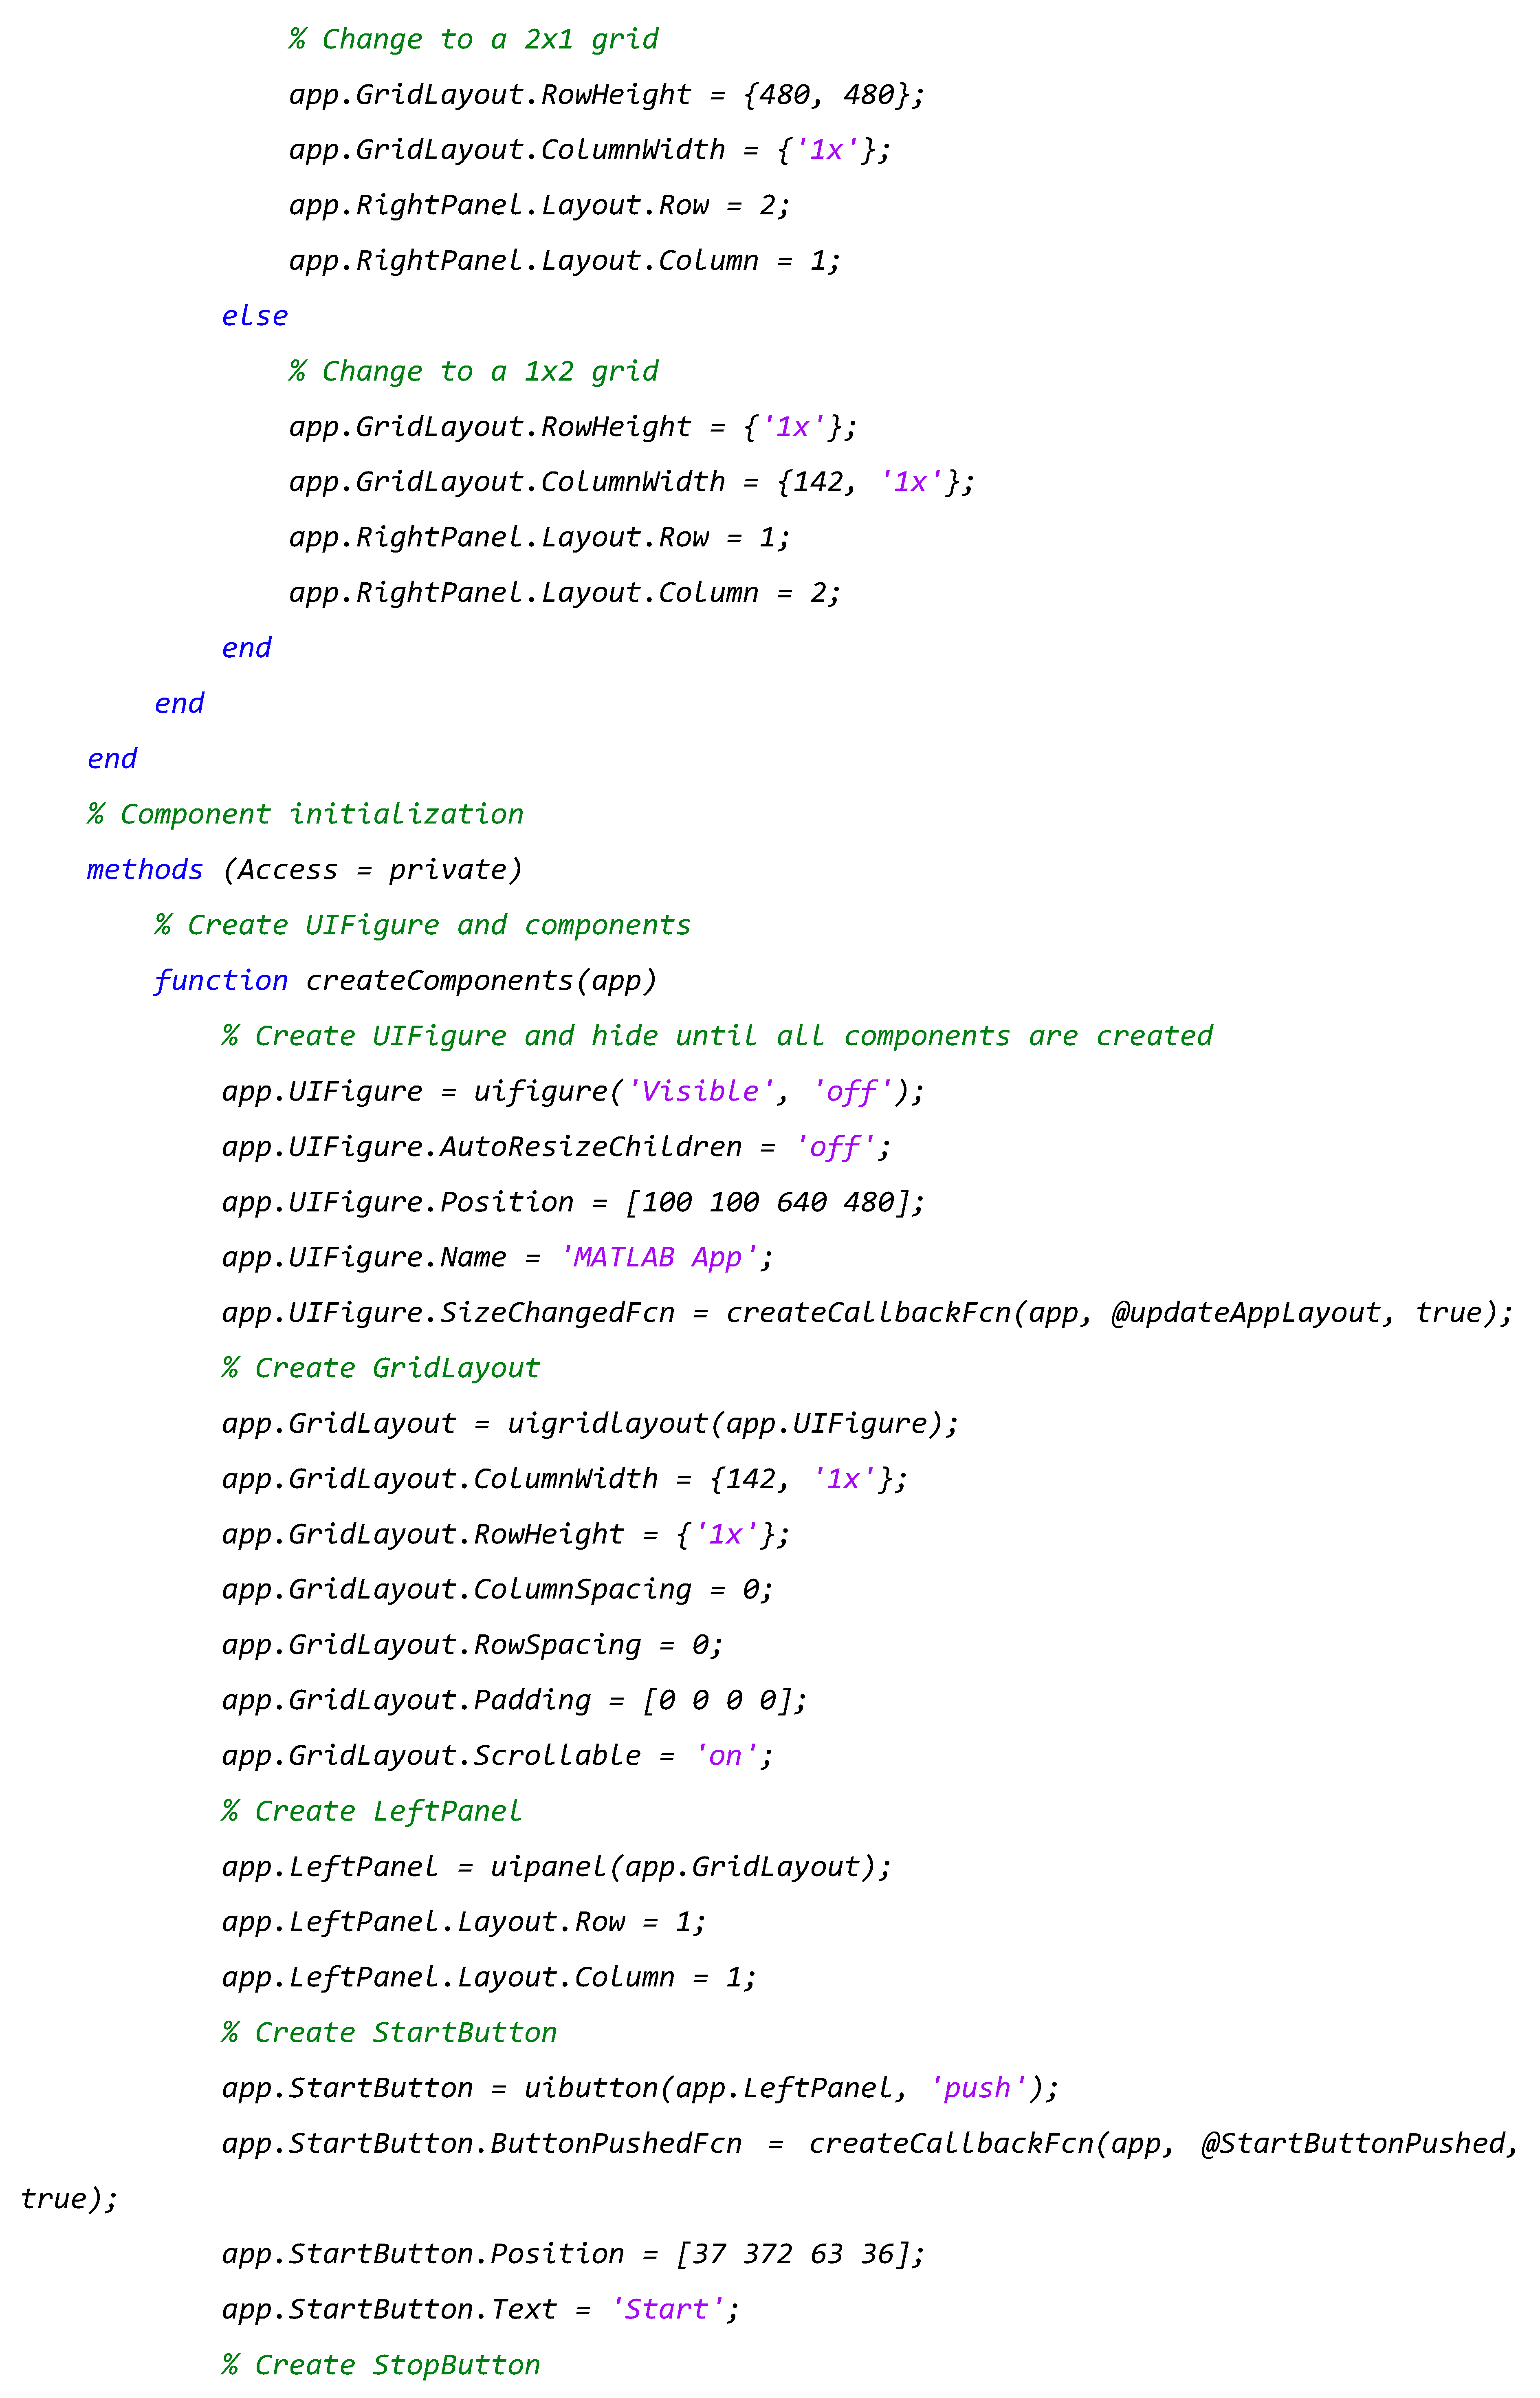
Layout of the designed application is shown in Figure 5, with each of the aforementioned components.
Figure 4.
Infiltrometer user interface layout.
The work program was carried out through the Matlab Appdsigner application, as is shown below:
3.2.3. Calibration of the measurement system
Once the program has been chosen in the Arduino environment, it was uploaded to the UNO board and the sensor calibration was performed. The increased measurement error turned out to be acceptable between the ranges of 0 and 400 mm, being that in the calculation 6, 3.5, 2 and 11.5 % were obtained, however, increasing this distance, the error increases up to 37%, with which it is not pertinent to carry out the measurement in values greater than 400 mm. These results were graphed in Figure 6.
Figure 5.
VL053L0X results.
3.2.4. Equipment test
The tests carried out at Autonomous University of Querétaro facilities, showing that the mechanical system of the infiltrometer objectives of improving portability, simplifying construction and improving the hermeticity of the instrument were made correctly. The data collection, in which the user interface was designed and tested, which finally allow validation of the objective of obtaining quality data in real time and reducing data processing time.
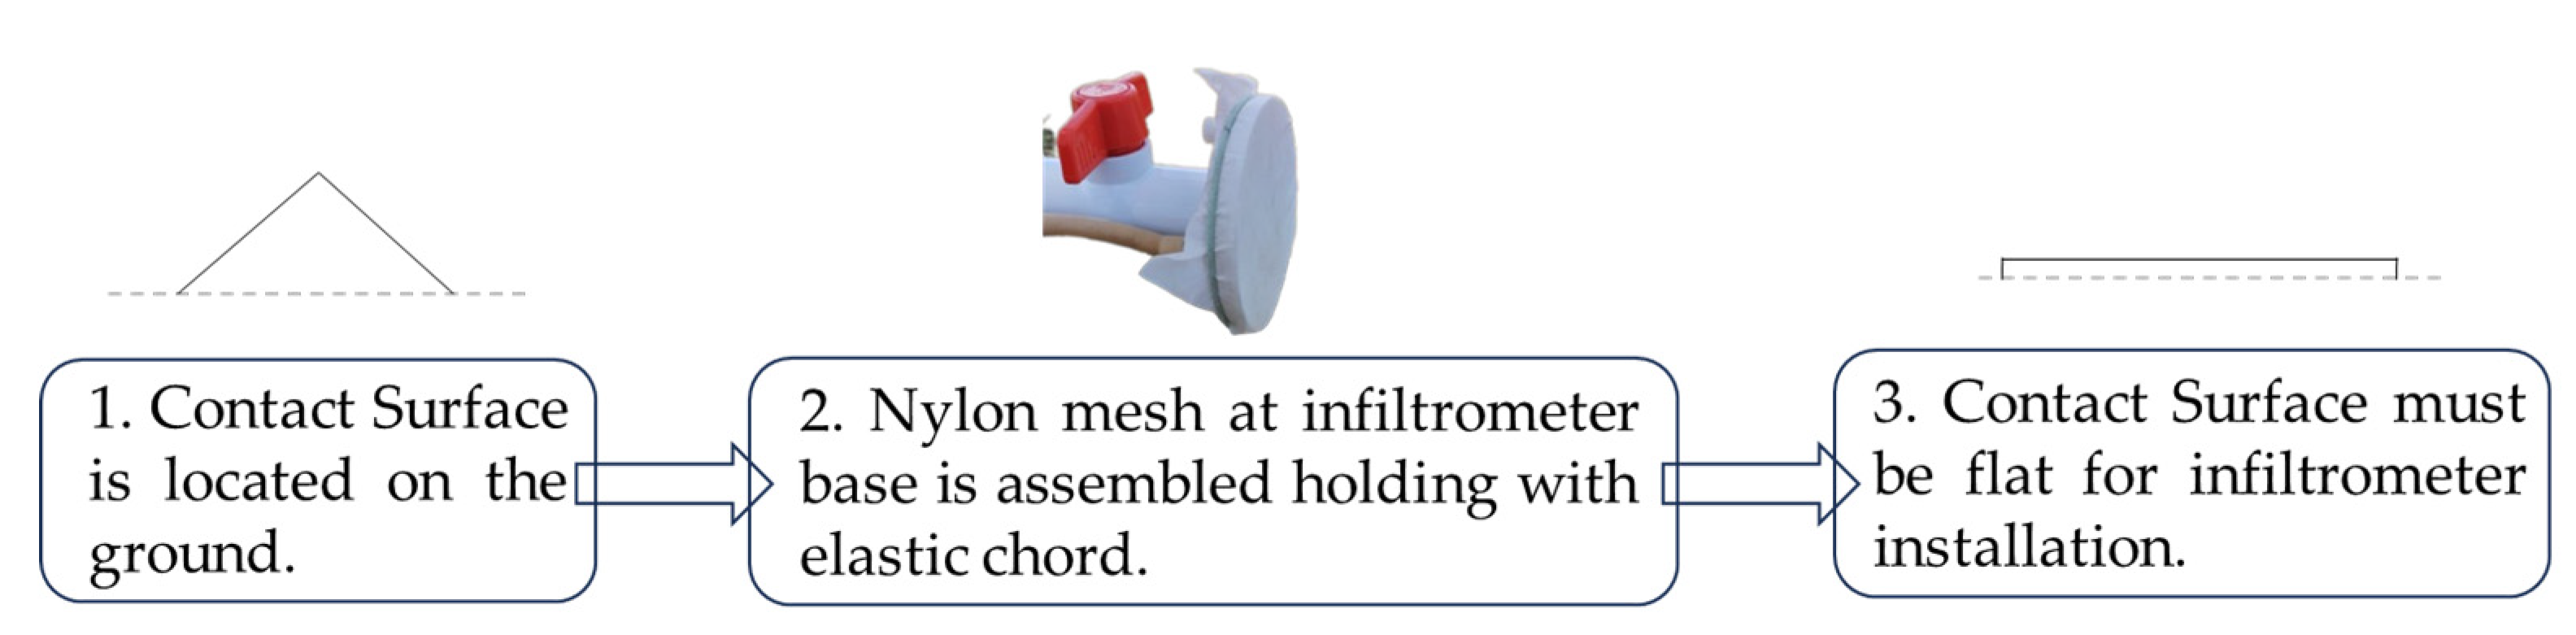
The installation procedure was carried out based on what is described in the manual regarding the study surface, contact material and adjustment of the nylon mesh as Figure 6.
Figure 6.
Installation diagram.
Once the working tension is selected (Size of porosity to test), the Mariotte is filled with height of water in centimeters selected and then, the main reservoir is filled taking into account a minimum empty distance of 3 cm with respect to the nozzle of the main reservoir.
Once the above is done, the cap of the main reservoir is placed, previously assembled with the sensor support and the SCADA system, and it is connected to the field computer that will be used by USB cable.
It is necessary to run the system application in this case named AppIndi, which will be displayed visually on the screen showing the layout shown in Figure 4. Once deployed, with the instrument installed on the ground, data collection must be started by pressing the Start button and immediately opening the valve of the infiltrometer.
As the water column descends, it will be graphed in real time, however it is recommended that the measured working height does not exceed 40 cm or 400 mm, since the measurement error of the VL53L0XⓇ sensor increases exponentially and therefore, You must stop the collection by pressing STOP, to fill the reservoir. Once the reservoir is filled again, the Append button must be pressed to store the previous data recorded and not lose the information obtained, once this is done, the Start button must be pressed again and the collection will start again.
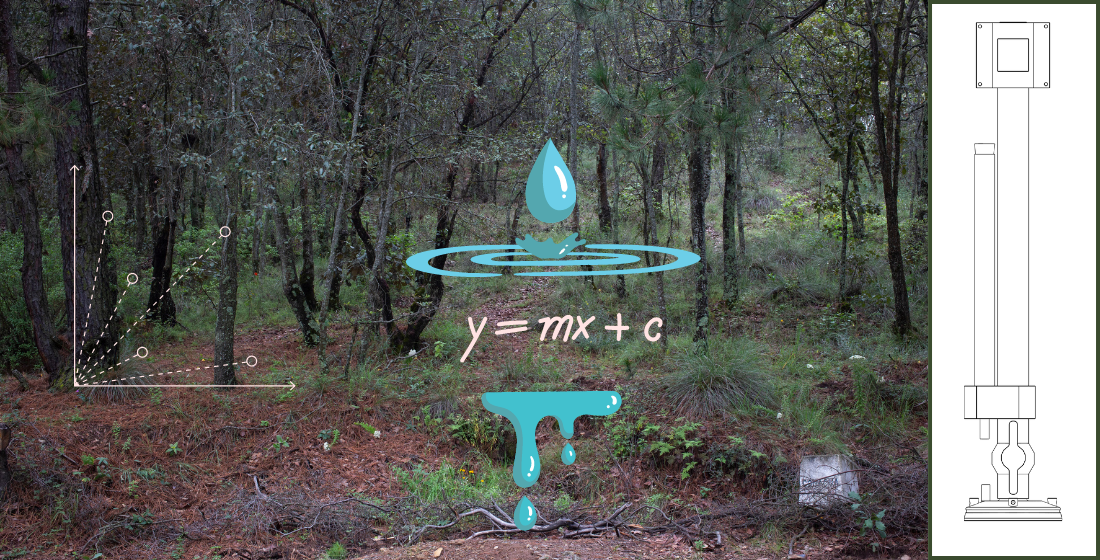
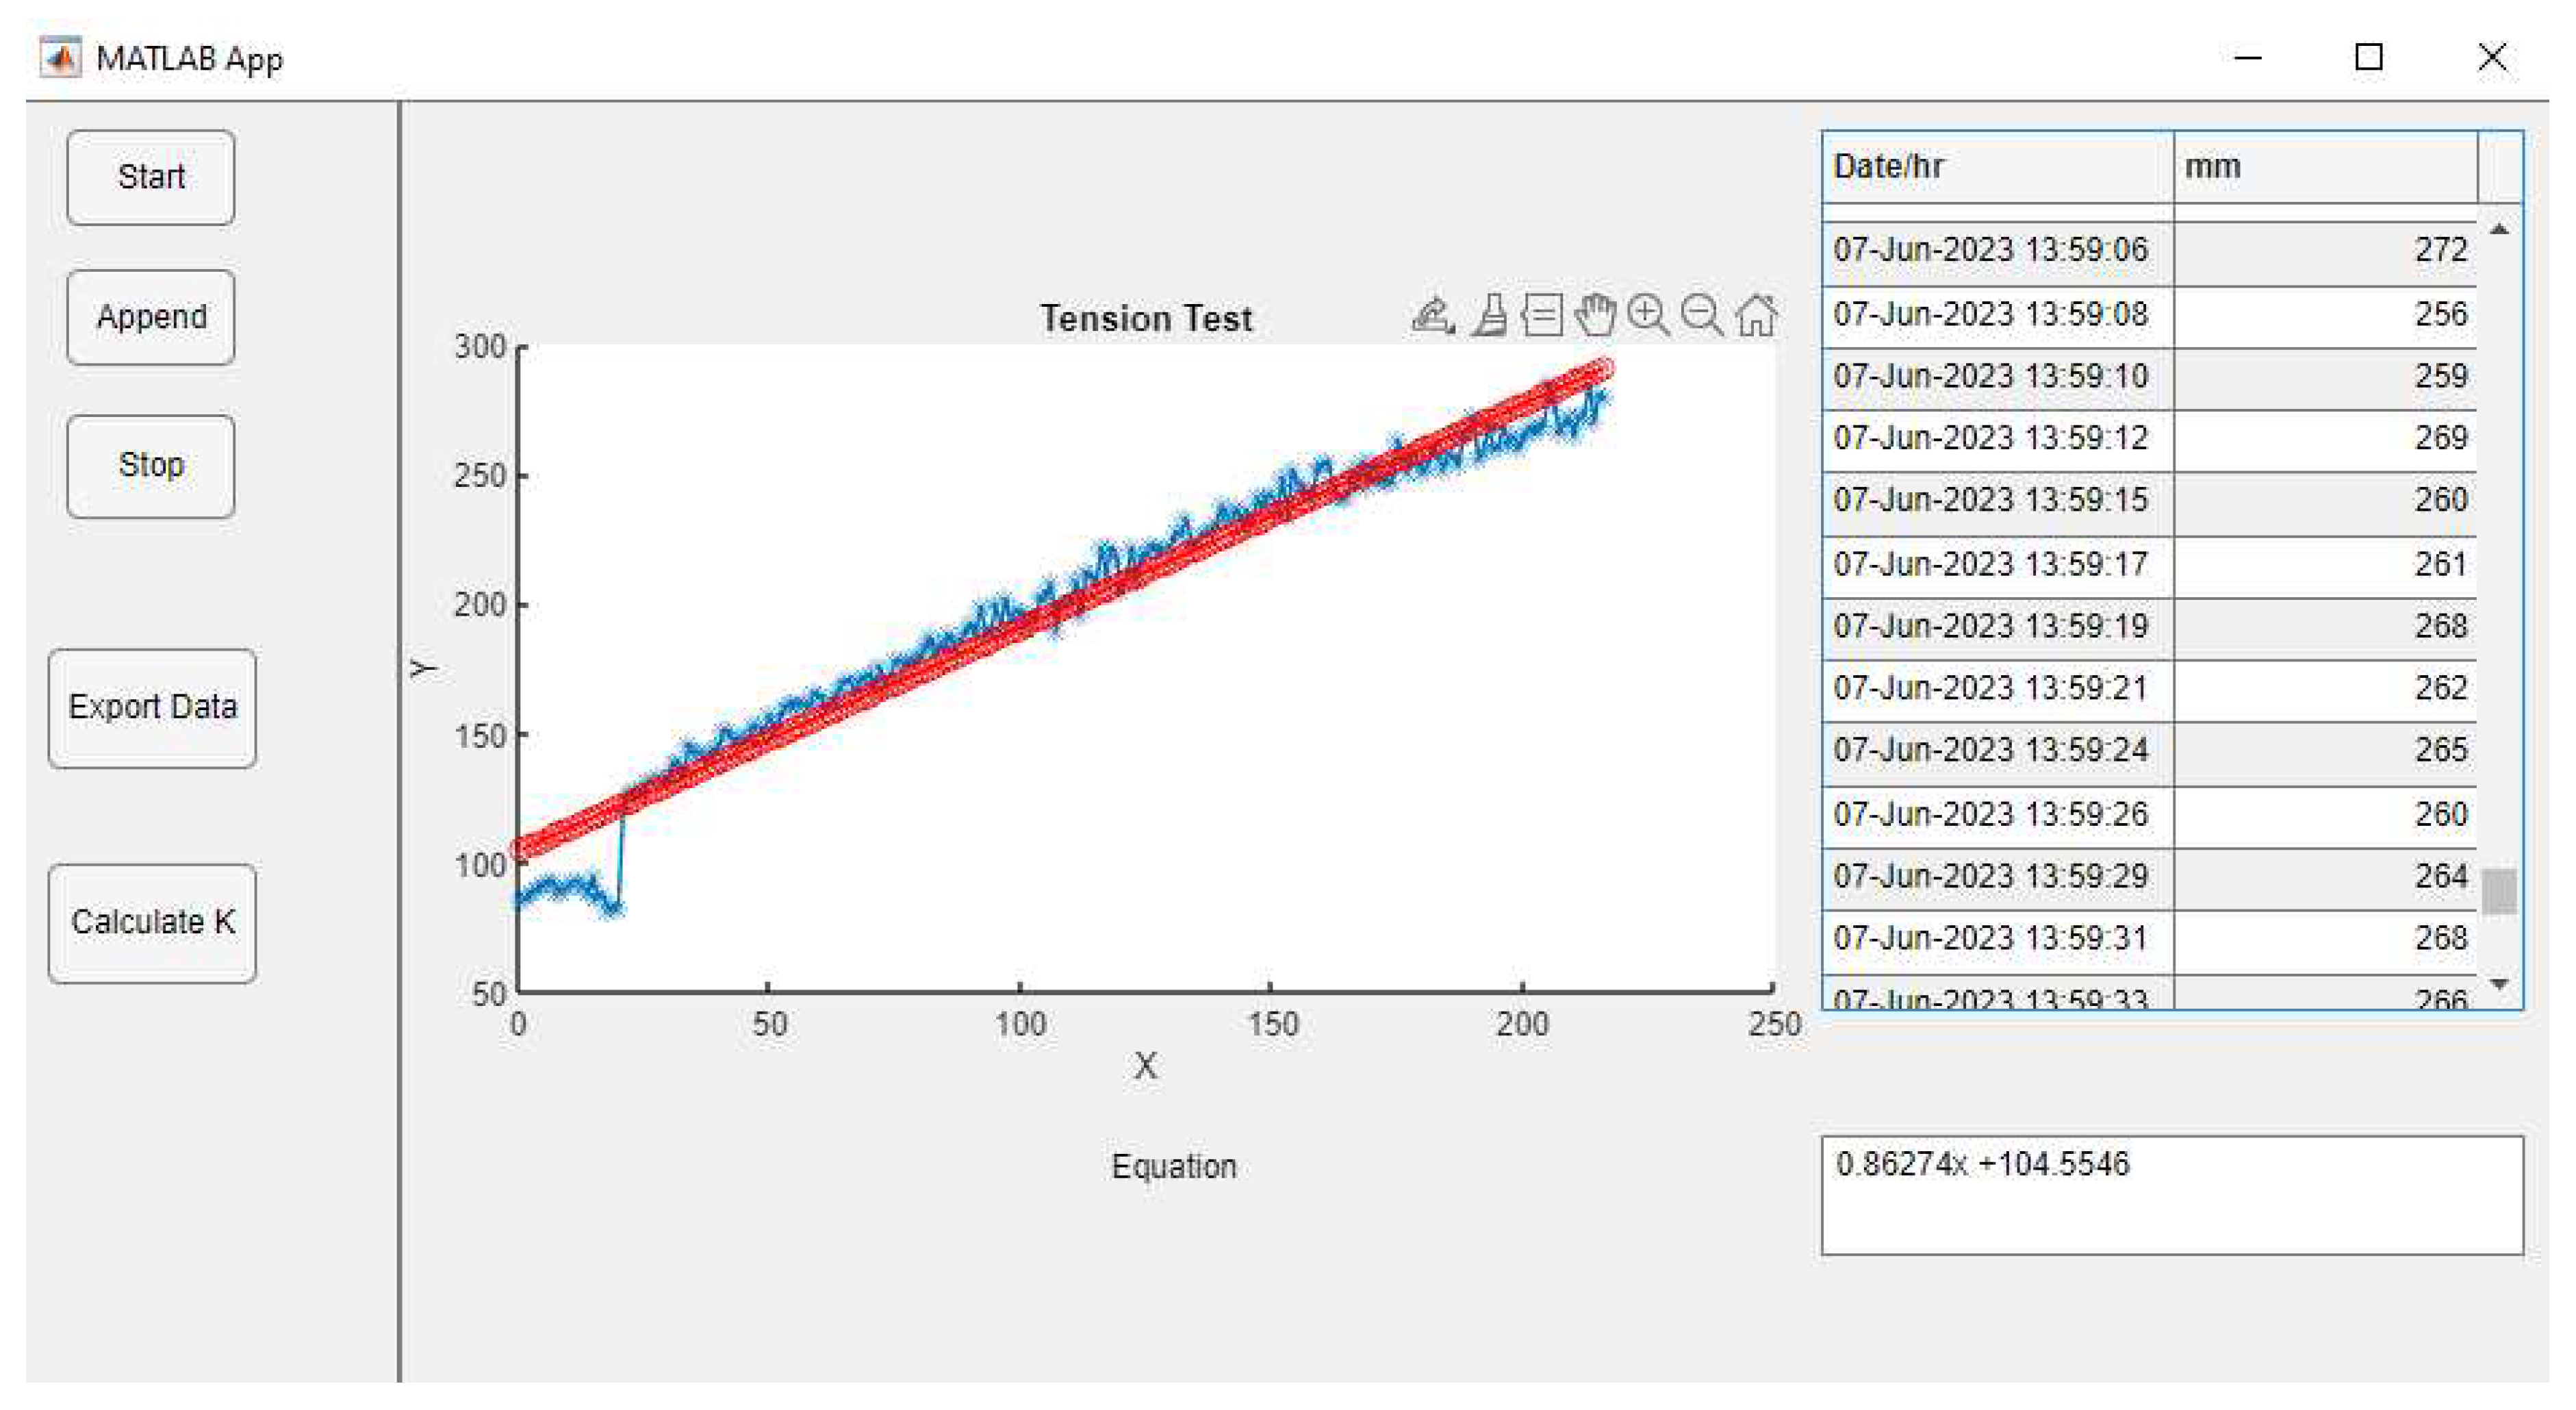
The next figure shows app display after a tension test at university, in which we observe the blue points line, which are data thru time, and a red point line which is the result of pushing Calculate K button, which calculates the straight-line true data, and plots the equation y = mx + b, at text box. Hydraulic conductivity is the magnitude represented by the slope of the line.
Hidraulic conductivity for tension test at tension of -7.0 cm is given by the equation 0.86247X + 104.5546, wich it means that our value of conductivity in the moment of experiment is 0.8624. It can be observed at Figure 8.
4. Discussion
The design is in the continuous improvement and development of automation phase, for example, once the calibration was carried out and it showed high measurement errors for values greater than 400 mm, it was decided to reduce the height of the reservoir to 450 millimeters, and thus enable the use of the developed SCADA system. In addition, by verifying that the objectives of the mechanical design are feasible, and also the choice of the components and the computer systems for the control, they meet the accessibility requirements that the instrument needs, as well as the simplification of the collection and treatment processes. of data, the development of the instrument is feasible.
5. Conclusions
The increasingly frequent use of automated systems for the collection of ecosystem data, based on development cards, represents a great opportunity for science in terms of research and obtaining data for decision-making that, from the ecohydrological approach, these Data can allow us to visualize a broader panorama regarding the maintenance requirements of ecosystem functions and services, such as infiltration.
Author Contributions
Conceptualization, David Alberto Morales Ortega.; methodology, David Alberto Morales Ortega and Israel Ruiz Gonzalez.; software, David Alberto Morales Ortega and Israel Ruiz Gonzalez.; validation, David Alberto Morales Ortega and Israel Ruiz Gonzalez; data curation, Victor Hugo Cambron Sandoval.; writing—original draft preparation, David Alberto Morales Ortega; writing—review and editing, Hugo Luna Soria.; supervision, Hugo Luna Soria ; discussion Juan Hernandez and Genaro Garcia; project administration, Victor Hugo Cambron Sandoval, ; funding acquisition, Victor Hugo Cambron Sandoval. All authors have read and agreed to the published version of the manuscript.” Please turn to the CRediT taxonomy for the term explanation. Authorship must be limited to those who have contributed substantially to the work reported.
Data Availability Statement
Results can be observed at Ecohydrological diagnosis of infiltration and runoff under different land uses and vegetation in La Beata micro-basin, Querétaro, 2023 Magister Thesis, Universidad Autónoma de Querétaro, Natural Sciences Faculty.
References
- Gómez-Tagle A.; Geissert D.; Enriquez E. Manual de infiltrometría: Infiltrómetro de tensión INDI. Instituto de Ecología, A.C. Xalapa 2014. [CrossRef]
- Rodríguez-Iturbe, J. Ecohydrology: a hydrologicperspective of climate-soil-vegetation dynamics. Water Resources Research 2000, 36, 3–9. [Google Scholar] [CrossRef]
- Blanco, J. A. Bosques, suelo y agua: explorando sus interacciones. Ecosistemas 2017, 26, 1–9. [Google Scholar] [CrossRef]
- Dongmei, H.; Currell, M.; Guoliang, C.; Hall, B. ; Alterations to groundwater recharge due to anthropogenic landscape change. J. Hydrol. 2017, 554, 545–557. [Google Scholar] [CrossRef]
- Uturbia Villagrán, B. P. Análisis para la infiltración artificial de agua en la cuenca de Santiago. Tesis ara obtención de título de Geología, Universidad de Chile. Facultad de Ciencias Físicas y Matemáticas, Departamento de Geología, 2015.
- Cerdà A, Doerr SH. Influence of vegetation recovery on soil hydrology and erodibility following fire: an 11-year investigation. Int. J. Wildland Fire 2005, 14, 423–437. [CrossRef]
- Valle González A.; Zaragoza Contreras H.U. La recarga de acuíferos. Análisis de su estimación de acuerdo con la información disponible, el caso del acuífero del Valle de San Juan del Río, Querétaro. Tesis para obtener el grado de Licenciatura en geología ambiental y recursos hídricos, Universidad Autónoma del Estado de México, Facultad de geografía. 2019.
- Ziegler, A.D.; Giambelluca, T.W.; Tran, L.T.; Vana, T.T.; Nullet, M.A.; Fox, J.; Tran Duc, V.; Pinthong, J.; Maxwell, J.F.; Evett, S. Hydrological consequences of landscape fragmentation in mountainous Northern Vietnam: evidence of accelerated overland flow generation. J. Hydrol. 2004, 287, 124–146. [Google Scholar] [CrossRef]
- Tobón, C. L.; Bruijinzel, A.; Frumau, A.; y Calvo, J.C. Changes in soil physical properties alter conversion of tropical montane cloud forest to pasture in northern Costa Rica. Second International Symposium Mountains in the Mist. Waimea, Hawaii, July 27- August 2, 2004.
- Li, Y. Y.; Shao M., A. Change of soil physical properties under long-term natural vegetation restoration in the Loess Plateau of China. J. Arid. Environ. 2006, 64, 77–96. [Google Scholar] [CrossRef]
- Mendoza, M.E.; Bocco, G.; López, E.; Bravo, M. Implicaciones hidrológicas del cambio de la cobertura vegetal y uso del suelo: una propuesta de análisis espacial a nivel regional en la cuenca cerrada del Lago de Cuitzeo, Michoacán. Investigaciones Geográficas, Boletín del Instituto de Geografía 2002, 49, 98–117. [Google Scholar]
- Zimmermann, B.; Elsenbeer, H. Spatial and temporal variability of soil saturated hydraulic conductivity in gradients of disturbance. J. Hydrol. 2008, 361, 78–95. [Google Scholar] [CrossRef]
- Gómez-Tagle, A. Linking hydropedology and ecosystem services: differential controls of surface field saturated hydraulic conductivity in a volcanic setting in central Mexico. Hydrol. Earth Syst. Sci. Discuss. 2009, 6, 2499–2536. [Google Scholar] [CrossRef]
- Linton, J.; Budds, J. The hydrosocial cycle: Defining and mobilizing a relational-dialectical approach to water. Geoforum 2014, 57, 170–180. [Google Scholar] [CrossRef]
- Munoz-Villers, L. E.; McDonnell, J. J. Land use change effects on runoff generation in a humid tropical montane cloud forest region. Hydrol. Earth Syst. Sci. 2013, 17, 3543–3560. [Google Scholar] [CrossRef]
- Hernández-Pérez, E.; Levresse, G.; Carrera-Hernández, J.; Inguaggiato, C.; Vega-González, M.; Corbo-Camargo, F.; Carreón-Freyre, D.; Billarent-Cedillo, A.; Sancén, F.; Ramírez Hernández, C. Geochemical and isotopic multi-tracing (δ18O, δ2 H, δ13C, Δ14C) of groundwater fow dynamics and mixing patterns in the volcanoclastic aquifer of the semiarid San Juan del Río Basin in central Mexico. Hydrogeol. J. 2022, 30, 2073–2095. [Google Scholar] [CrossRef]
- MATLAB. (2023). 11436441 (R2023a). Natick, Massachusetts: The MathWorks Inc.
Figure 1.
Presentation of the tension infiltrometer, bill of materials and designed components.
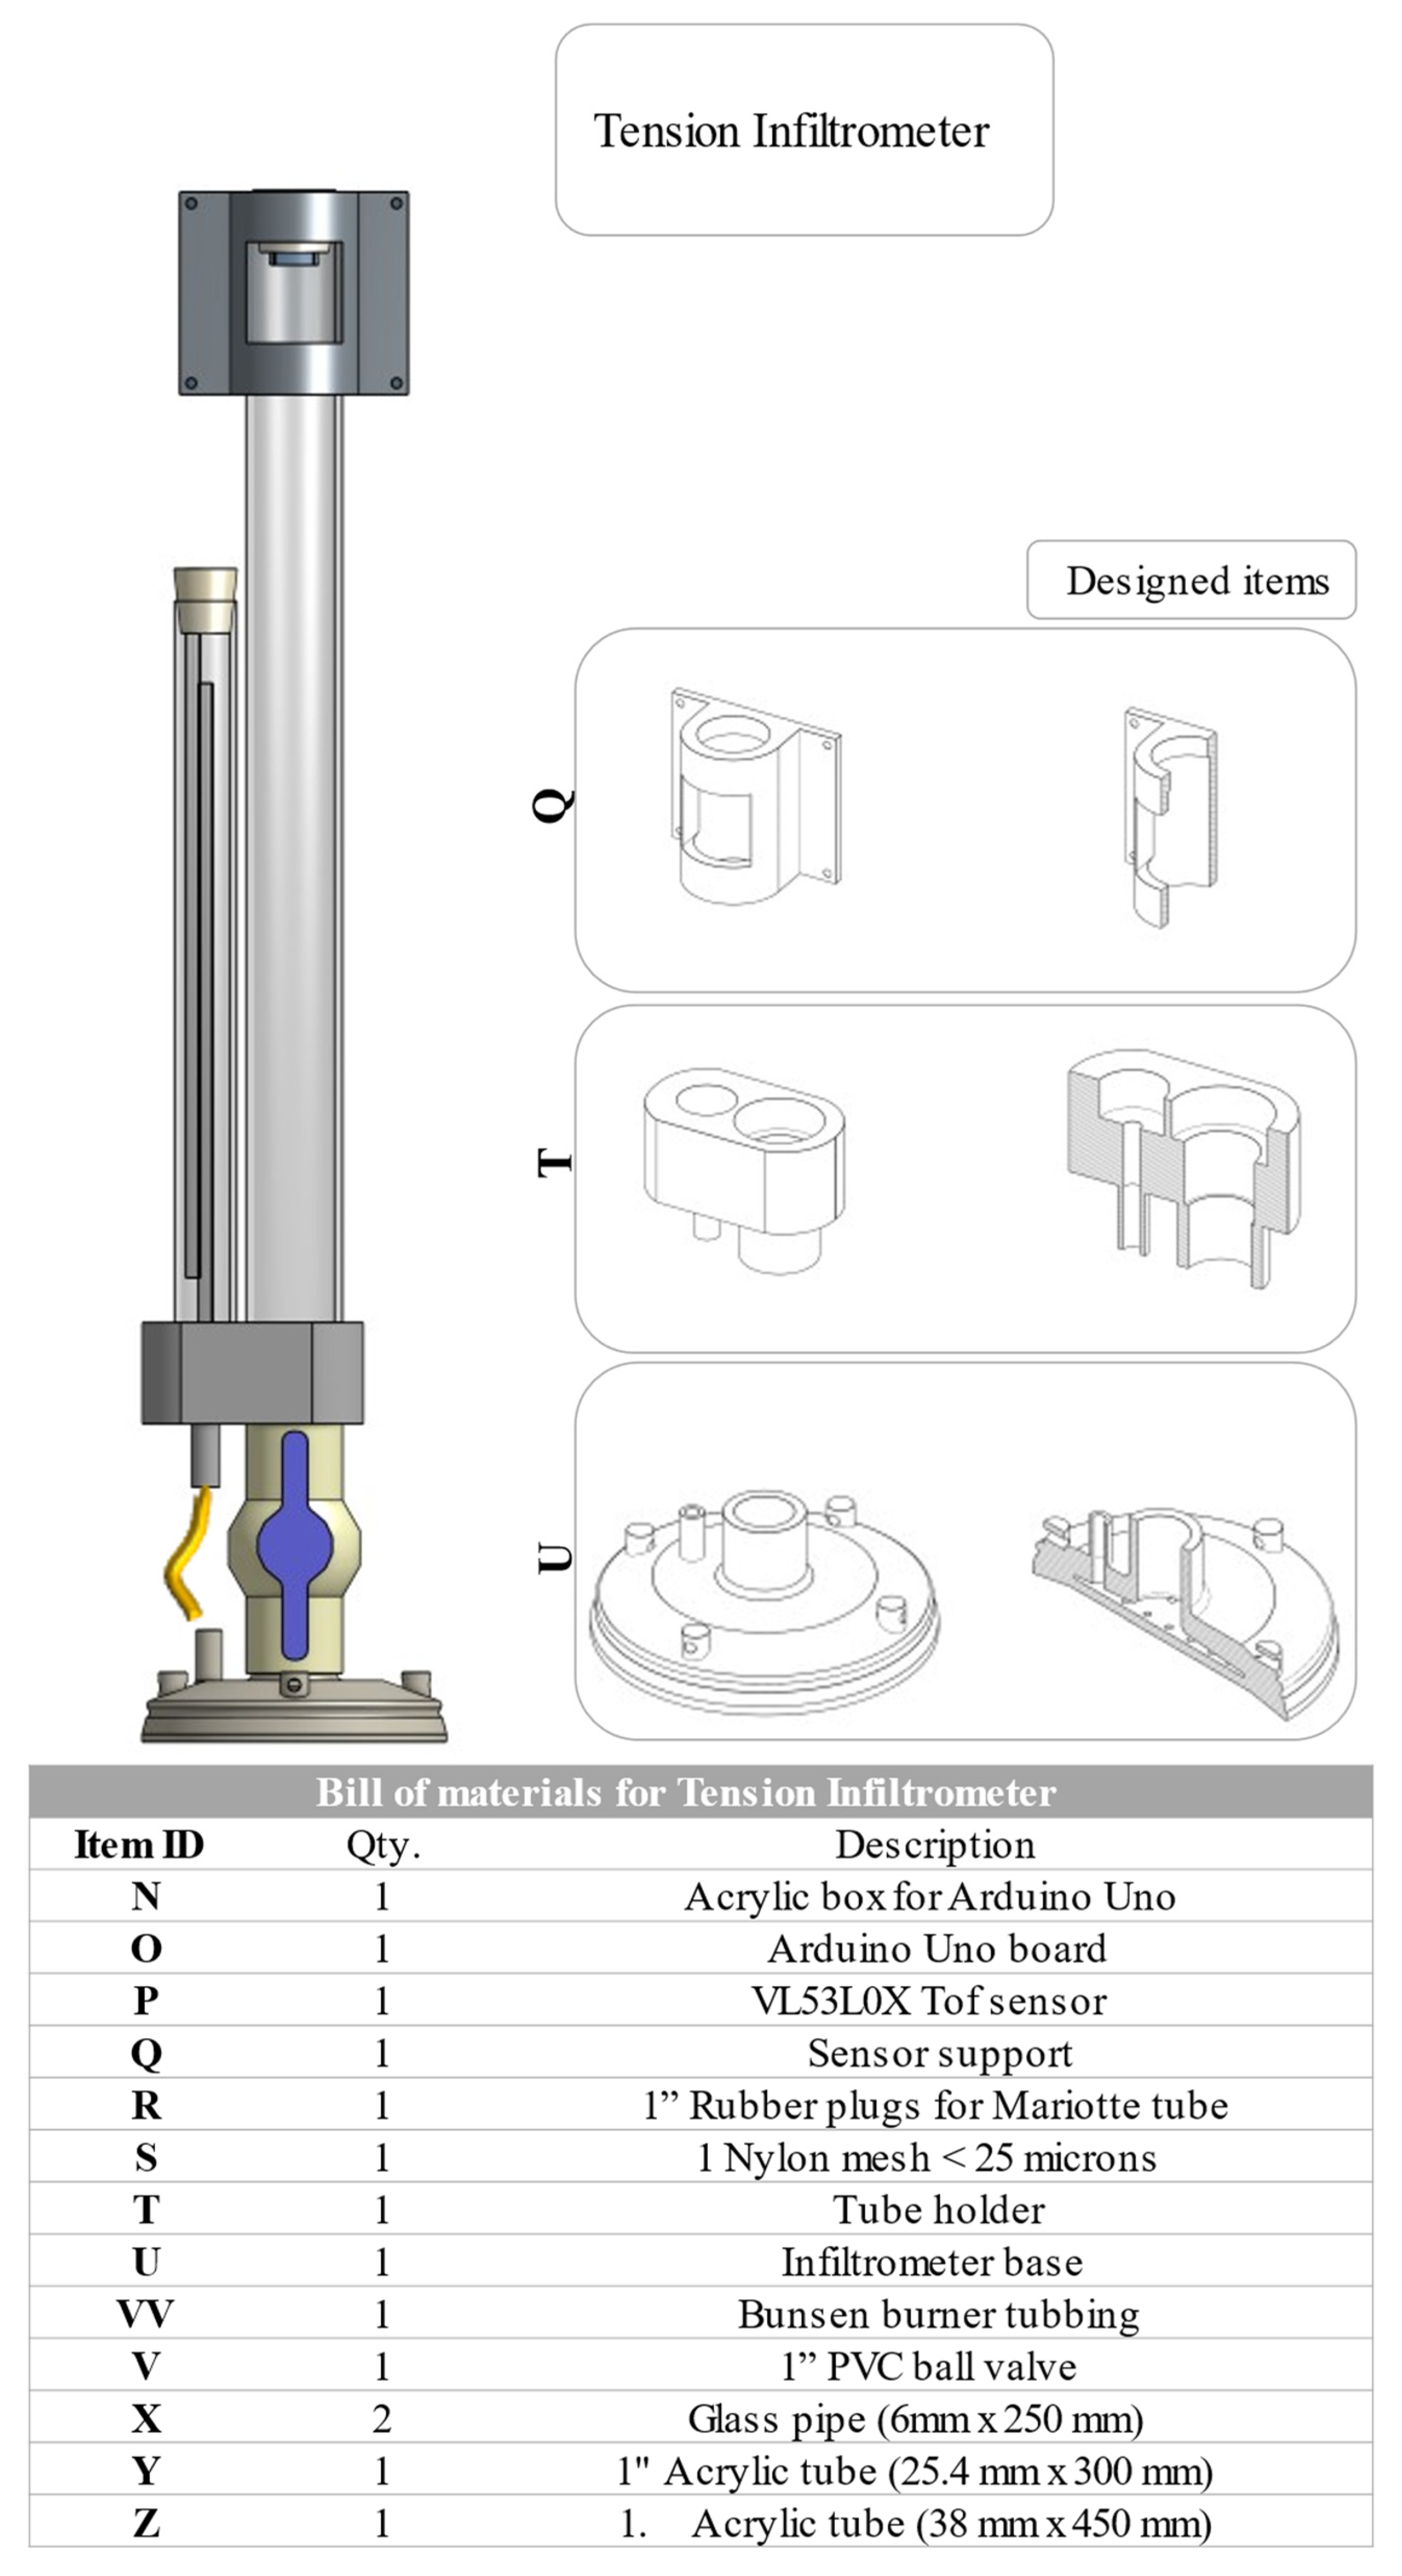
Figure 2.
Assembling the tension infiltrometer.
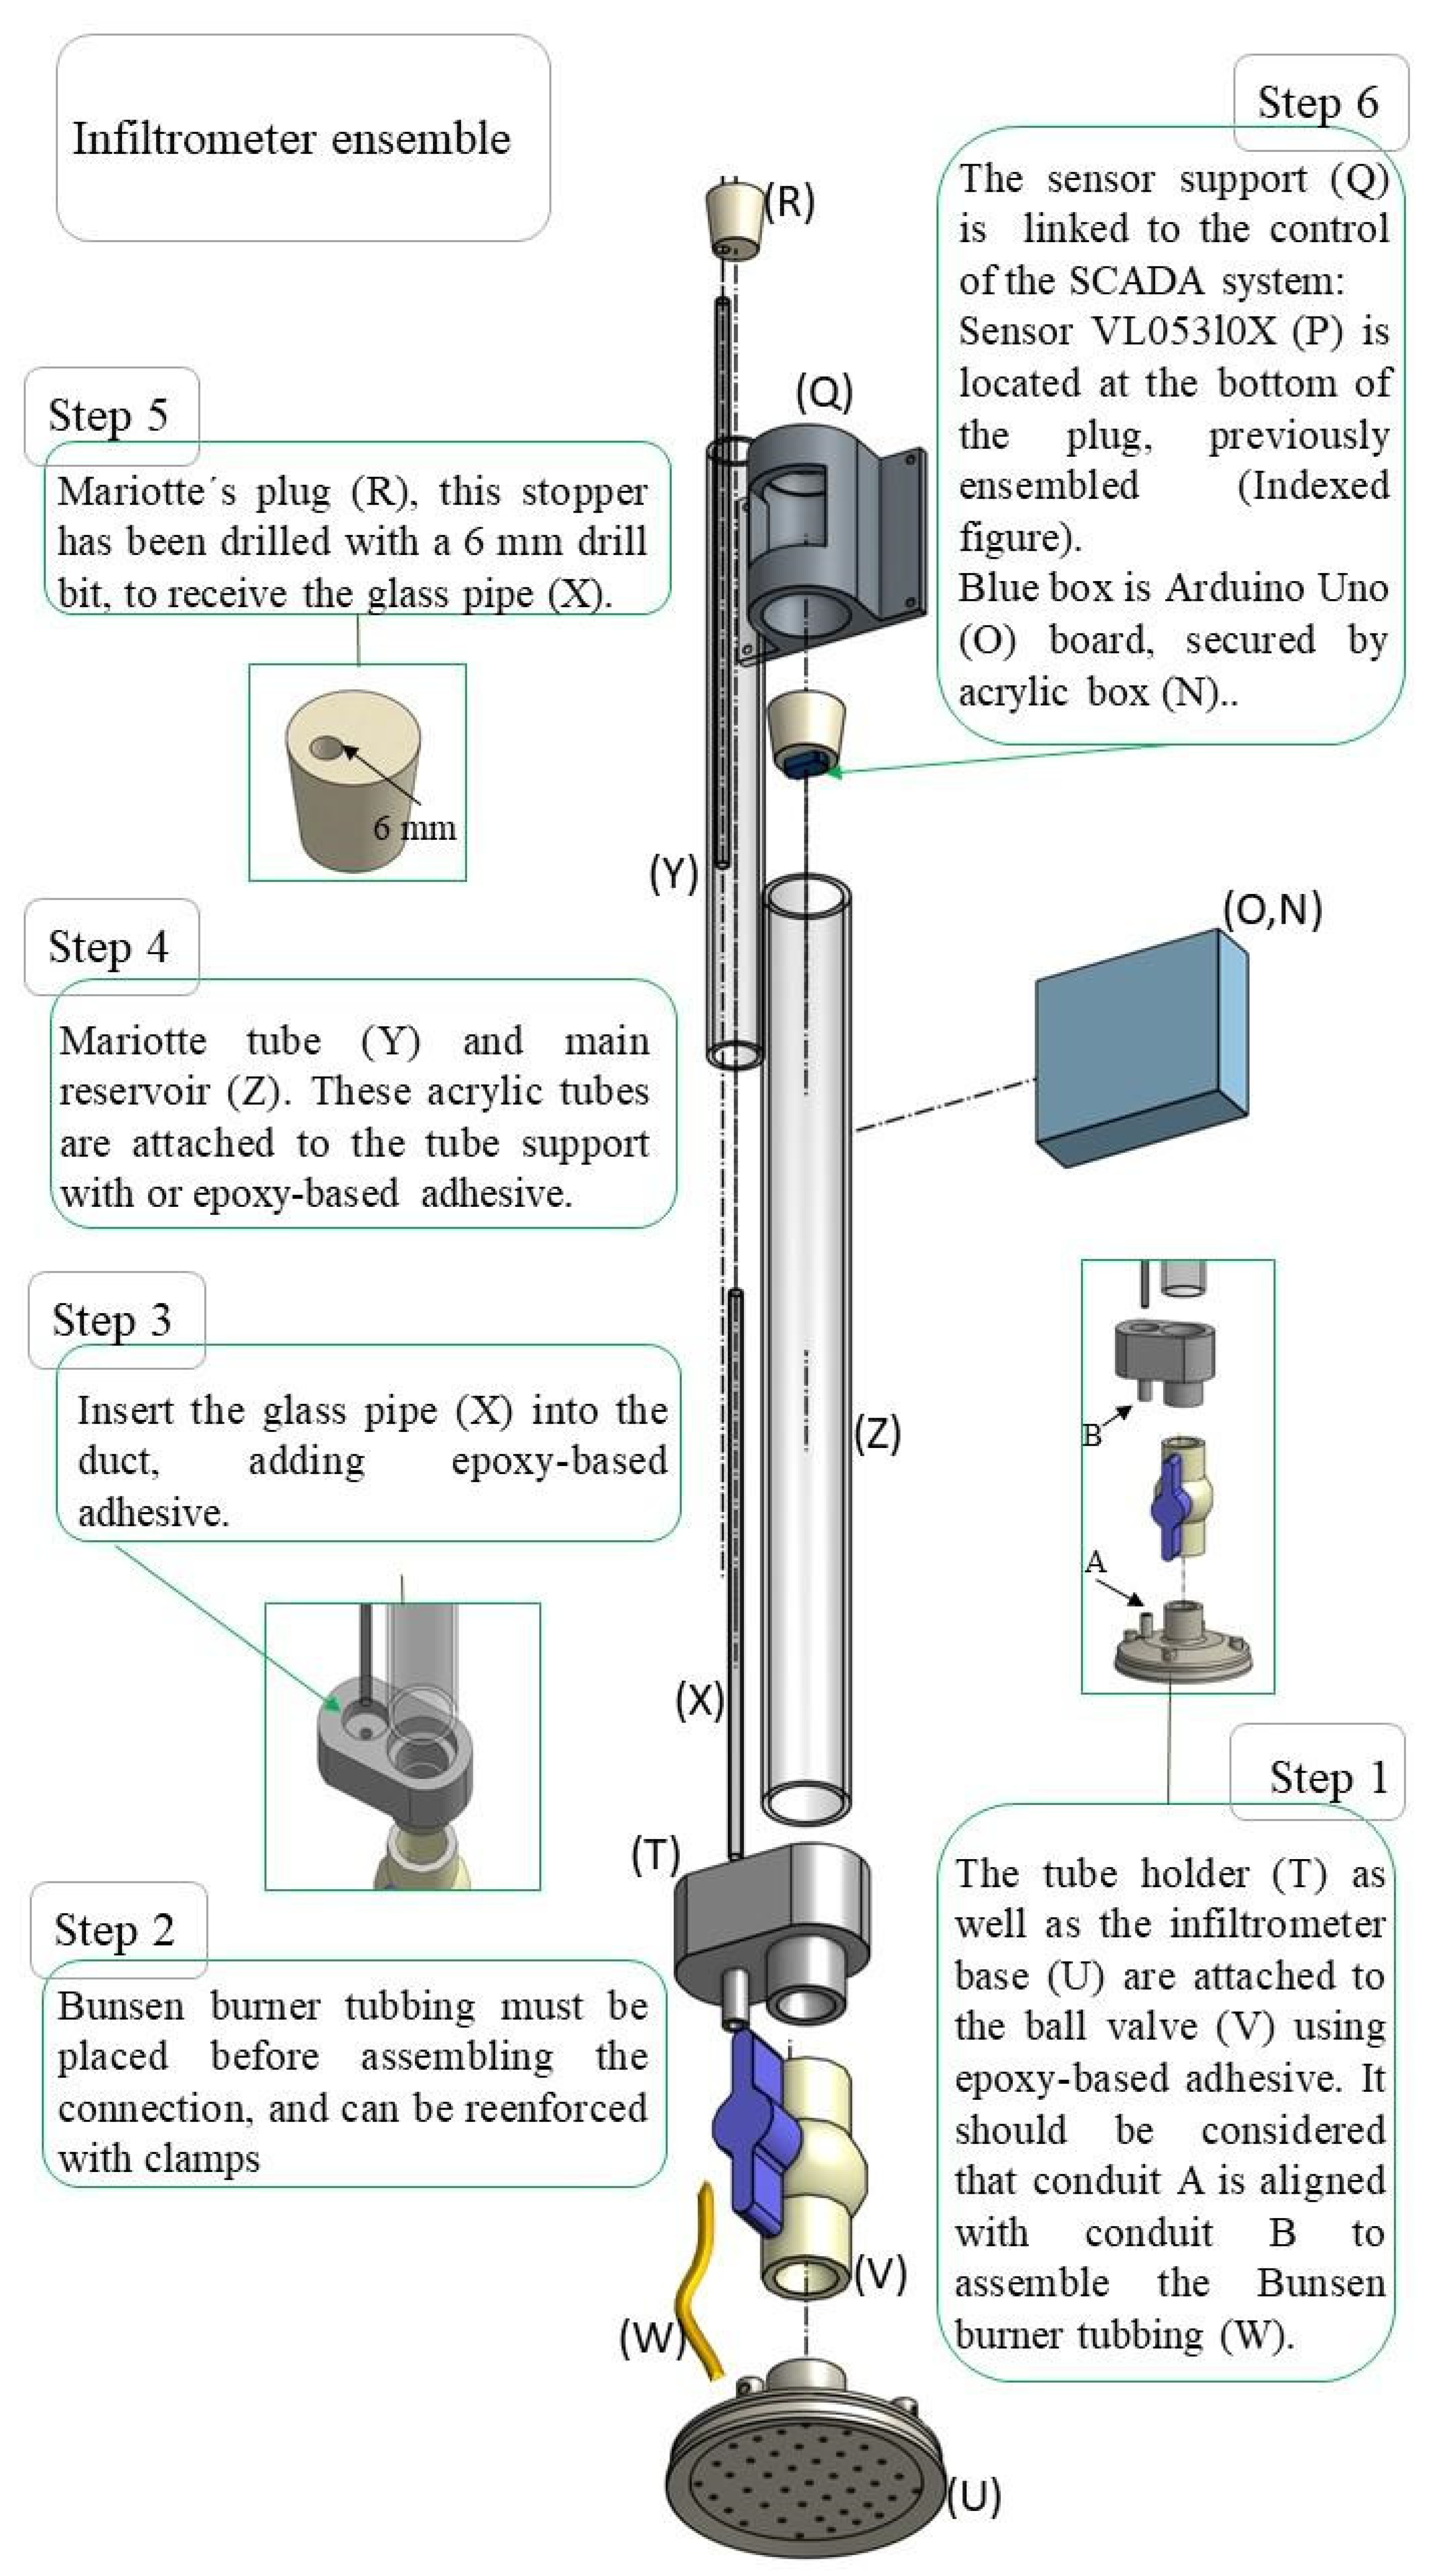
Figure 3.
Infiltrometer automated data collection system, connections scheme.
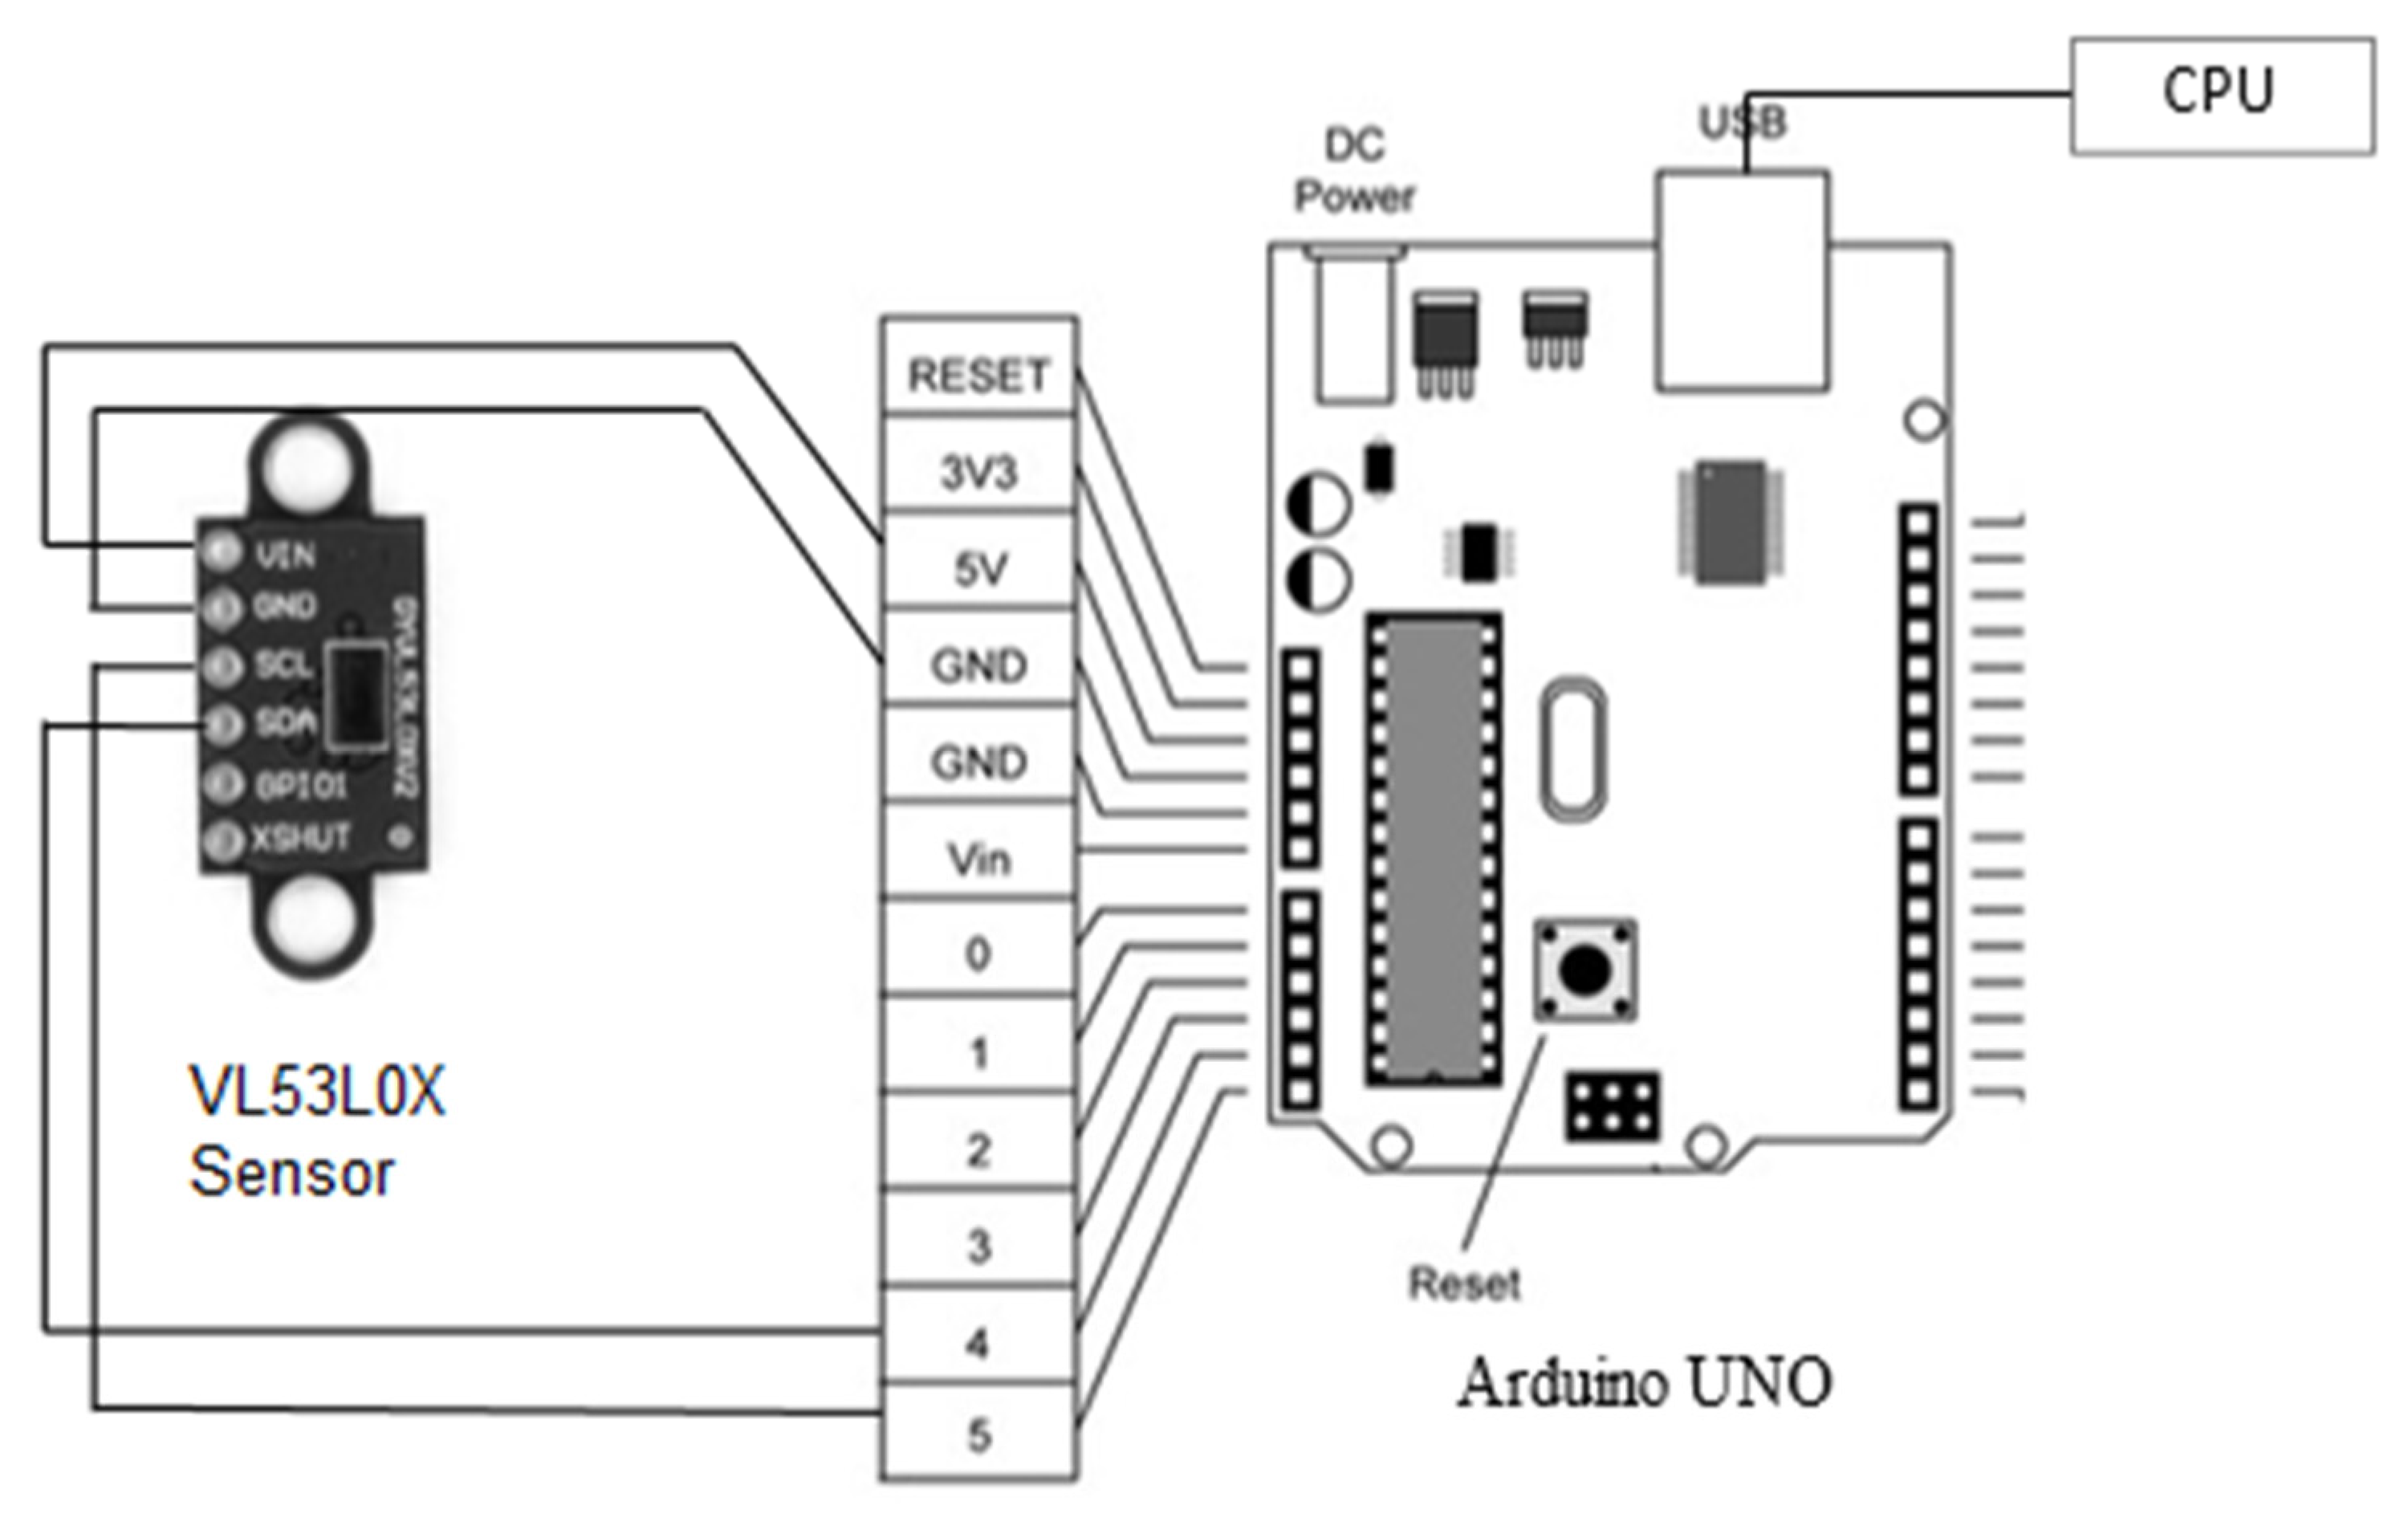
Figure 8.
Tension Test results. Screenshot to appINDI display.
Disclaimer/Publisher’s Note: The statements, opinions and data contained in all publications are solely those of the individual author(s) and contributor(s) and not of MDPI and/or the editor(s). MDPI and/or the editor(s) disclaim responsibility for any injury to people or property resulting from any ideas, methods, instructions or products referred to in the content. |
© 2023 by the authors. Licensee MDPI, Basel, Switzerland. This article is an open access article distributed under the terms and conditions of the Creative Commons Attribution (CC BY) license (http://creativecommons.org/licenses/by/4.0/).
Copyright: This open access article is published under a Creative Commons CC BY 4.0 license, which permit the free download, distribution, and reuse, provided that the author and preprint are cited in any reuse.


