Submitted:
05 September 2023
Posted:
06 September 2023
You are already at the latest version
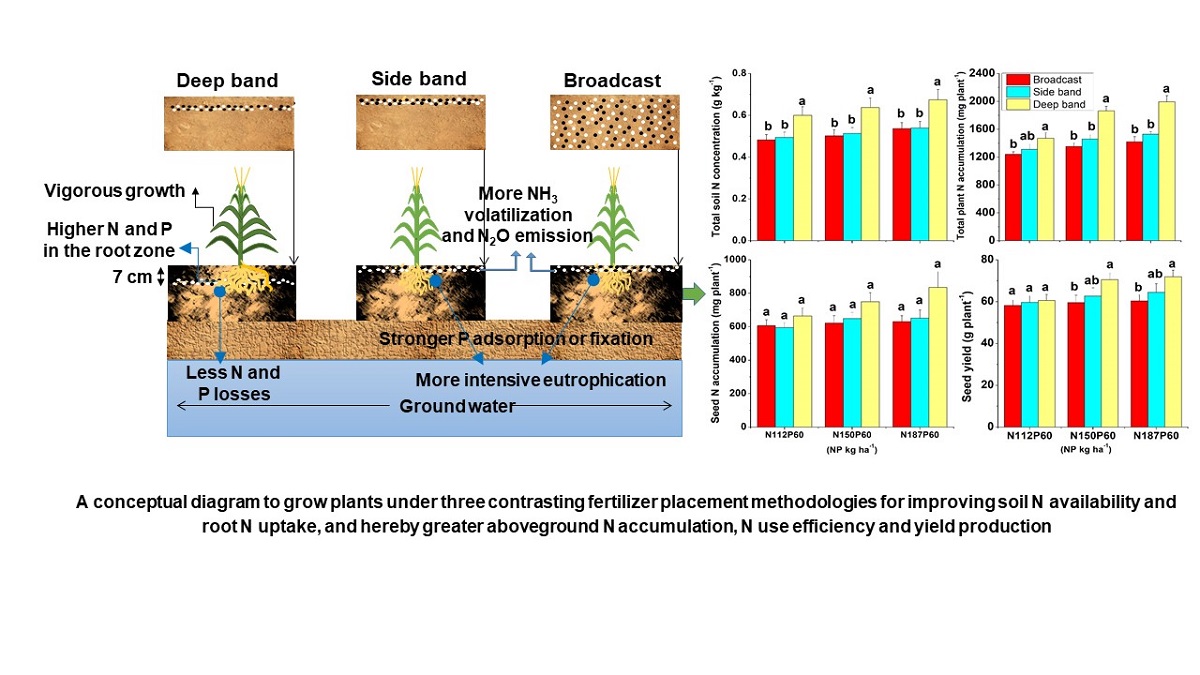
Abstract
Keywords:
1. Introduction
2. Results
2.1. Leaf N Concentration and Accumulation
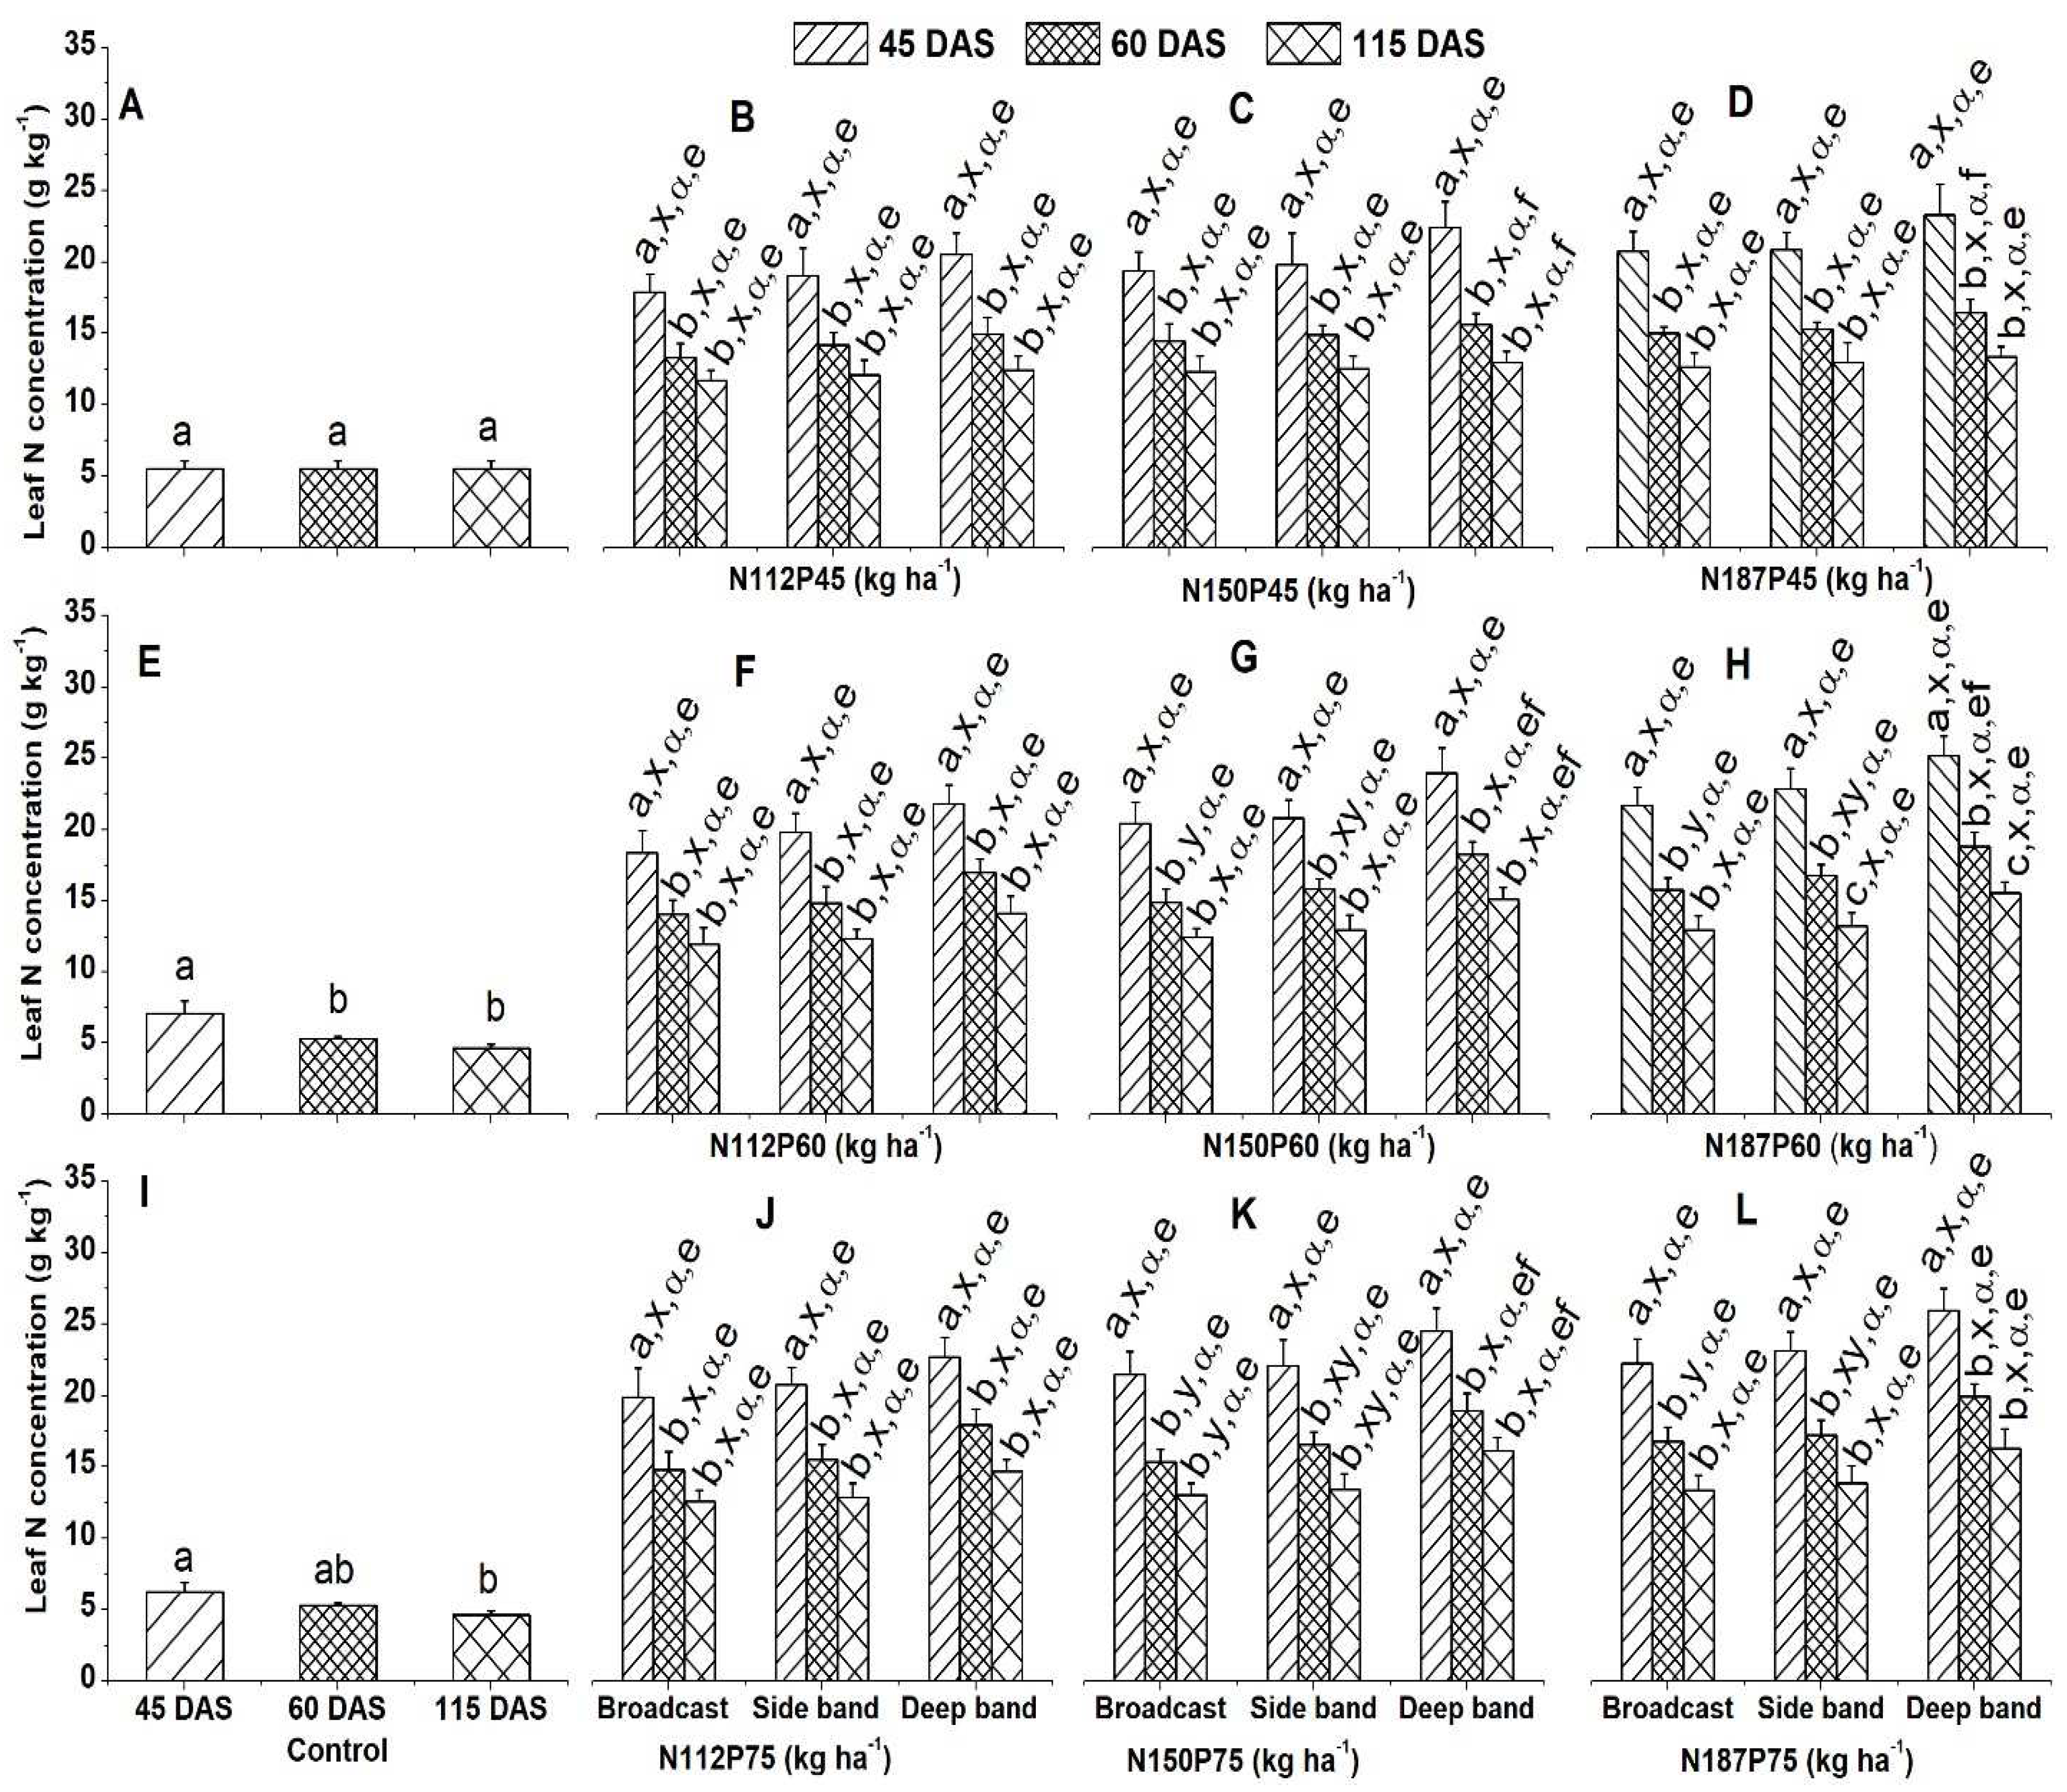
2.1.1. Leaf N Concentration
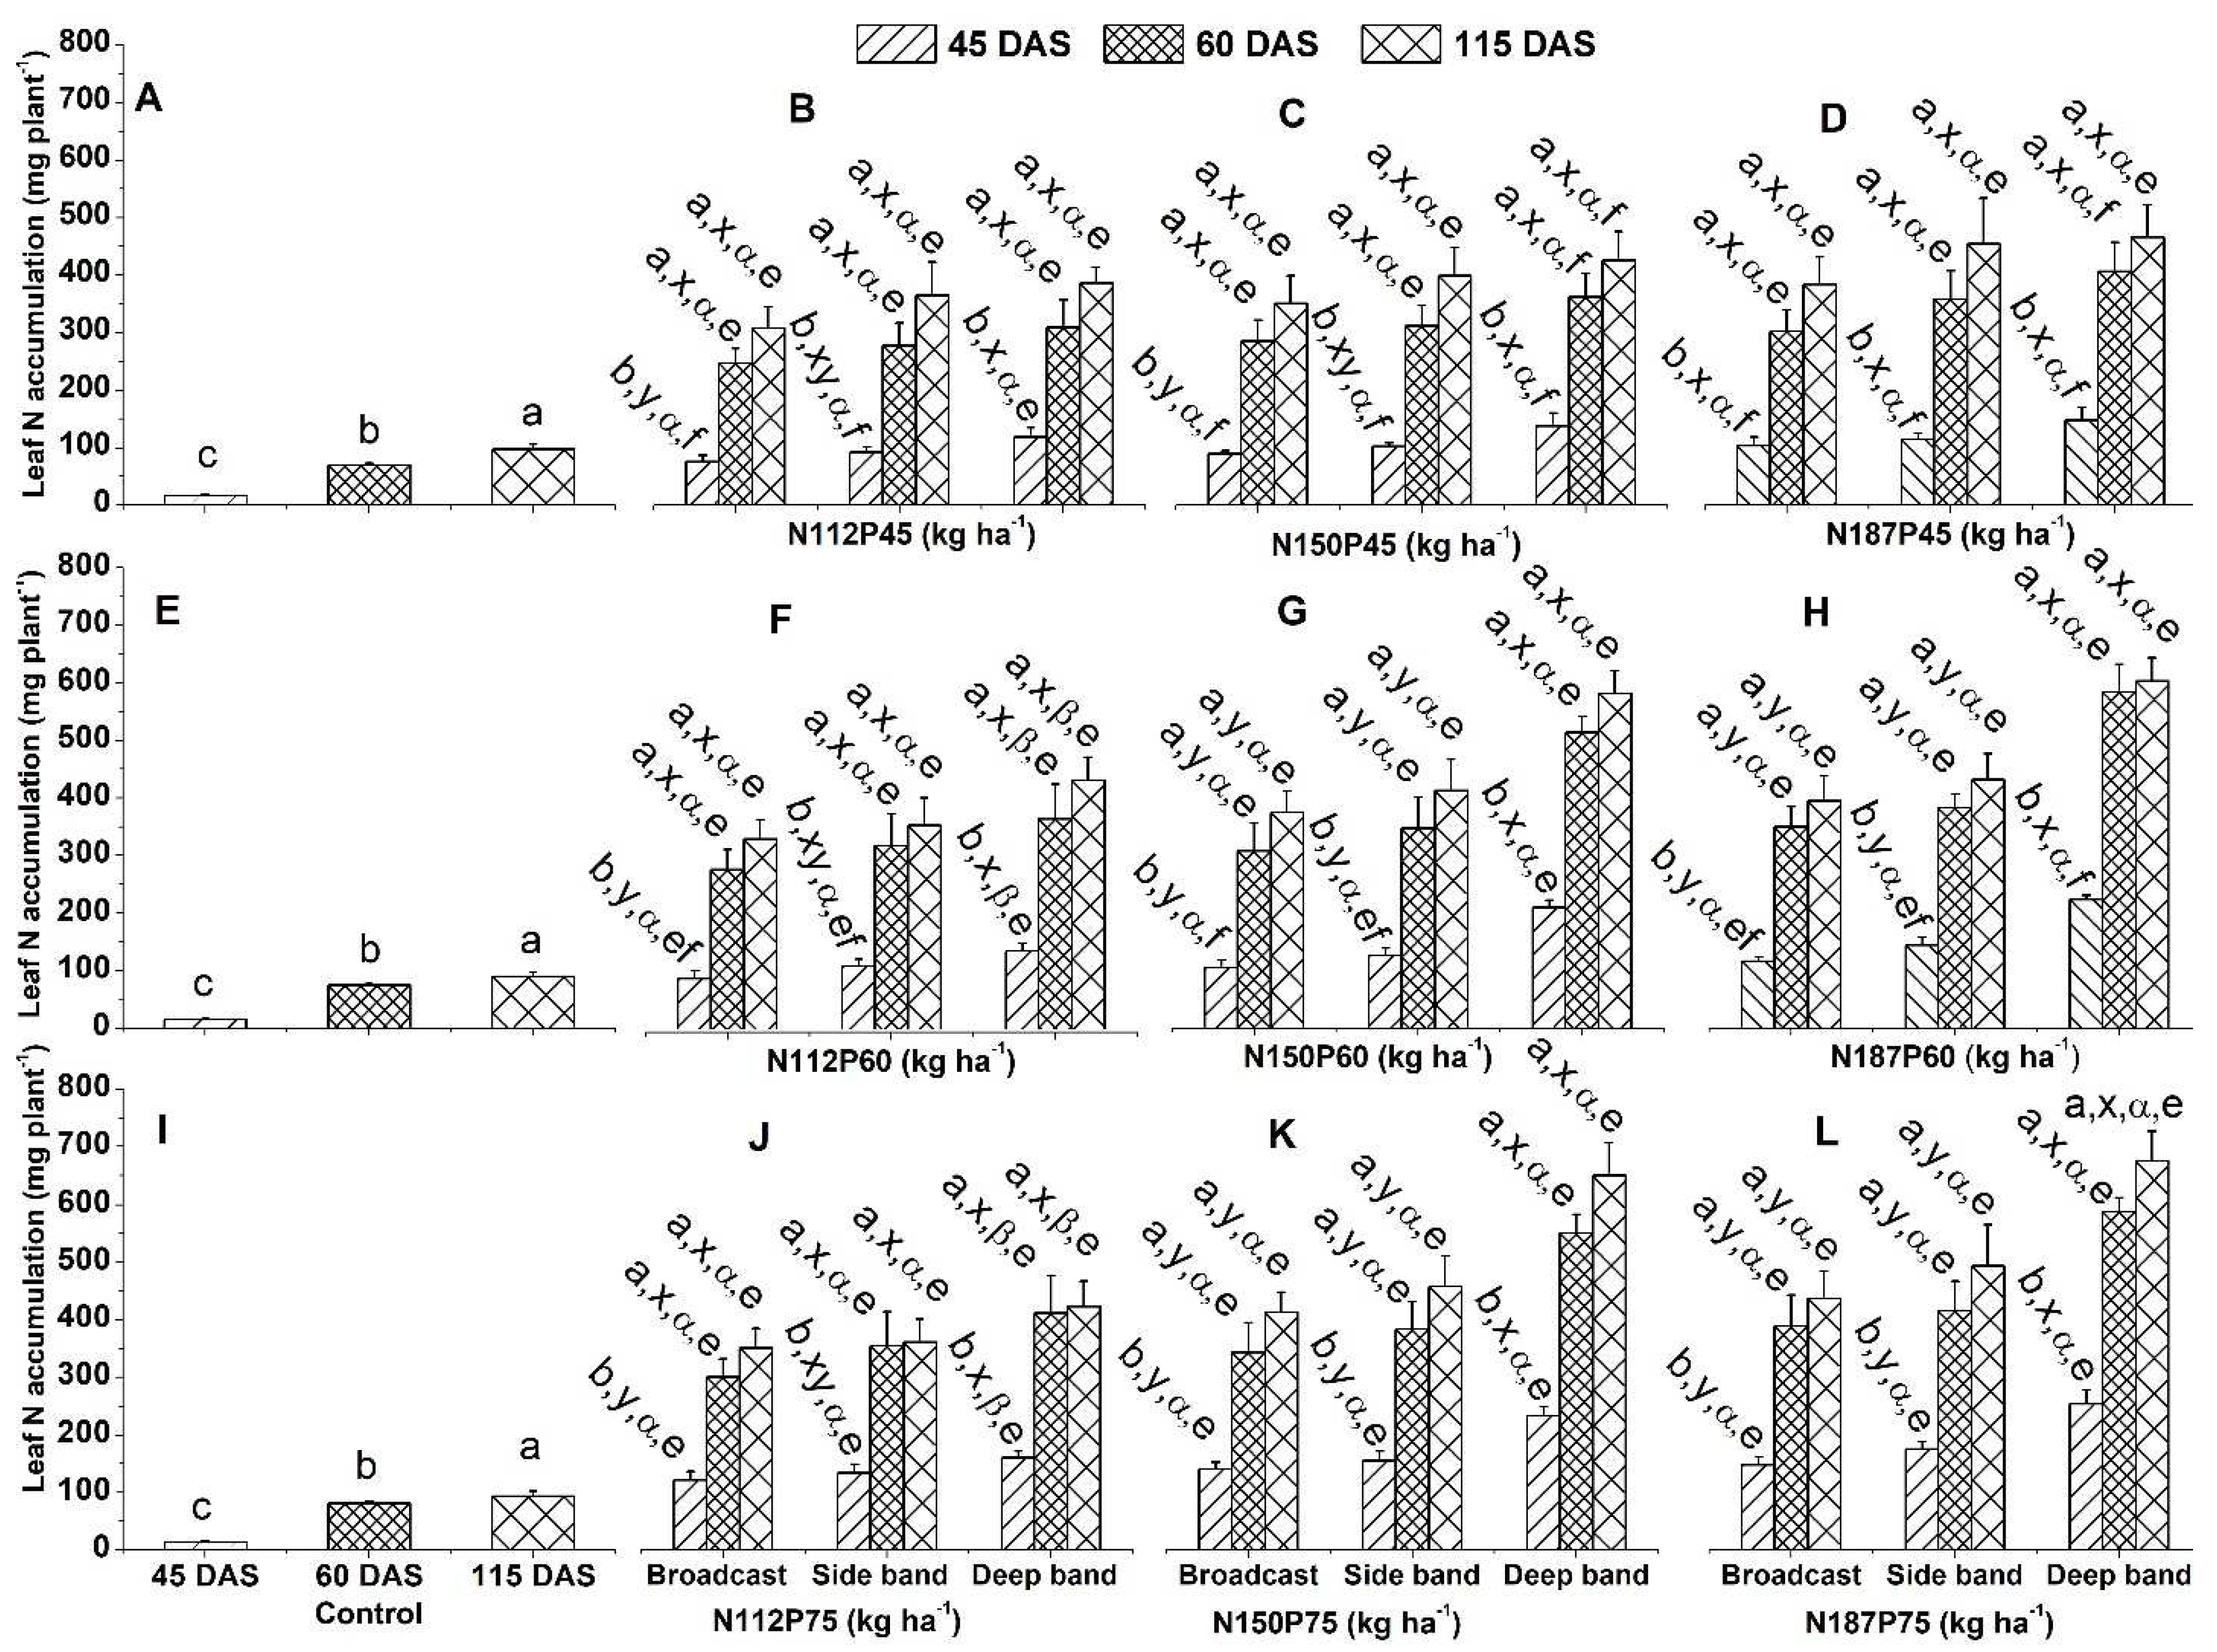
2.1.2. Leaf N Accumulation
2.2. Stem N Concentration and Accumulation
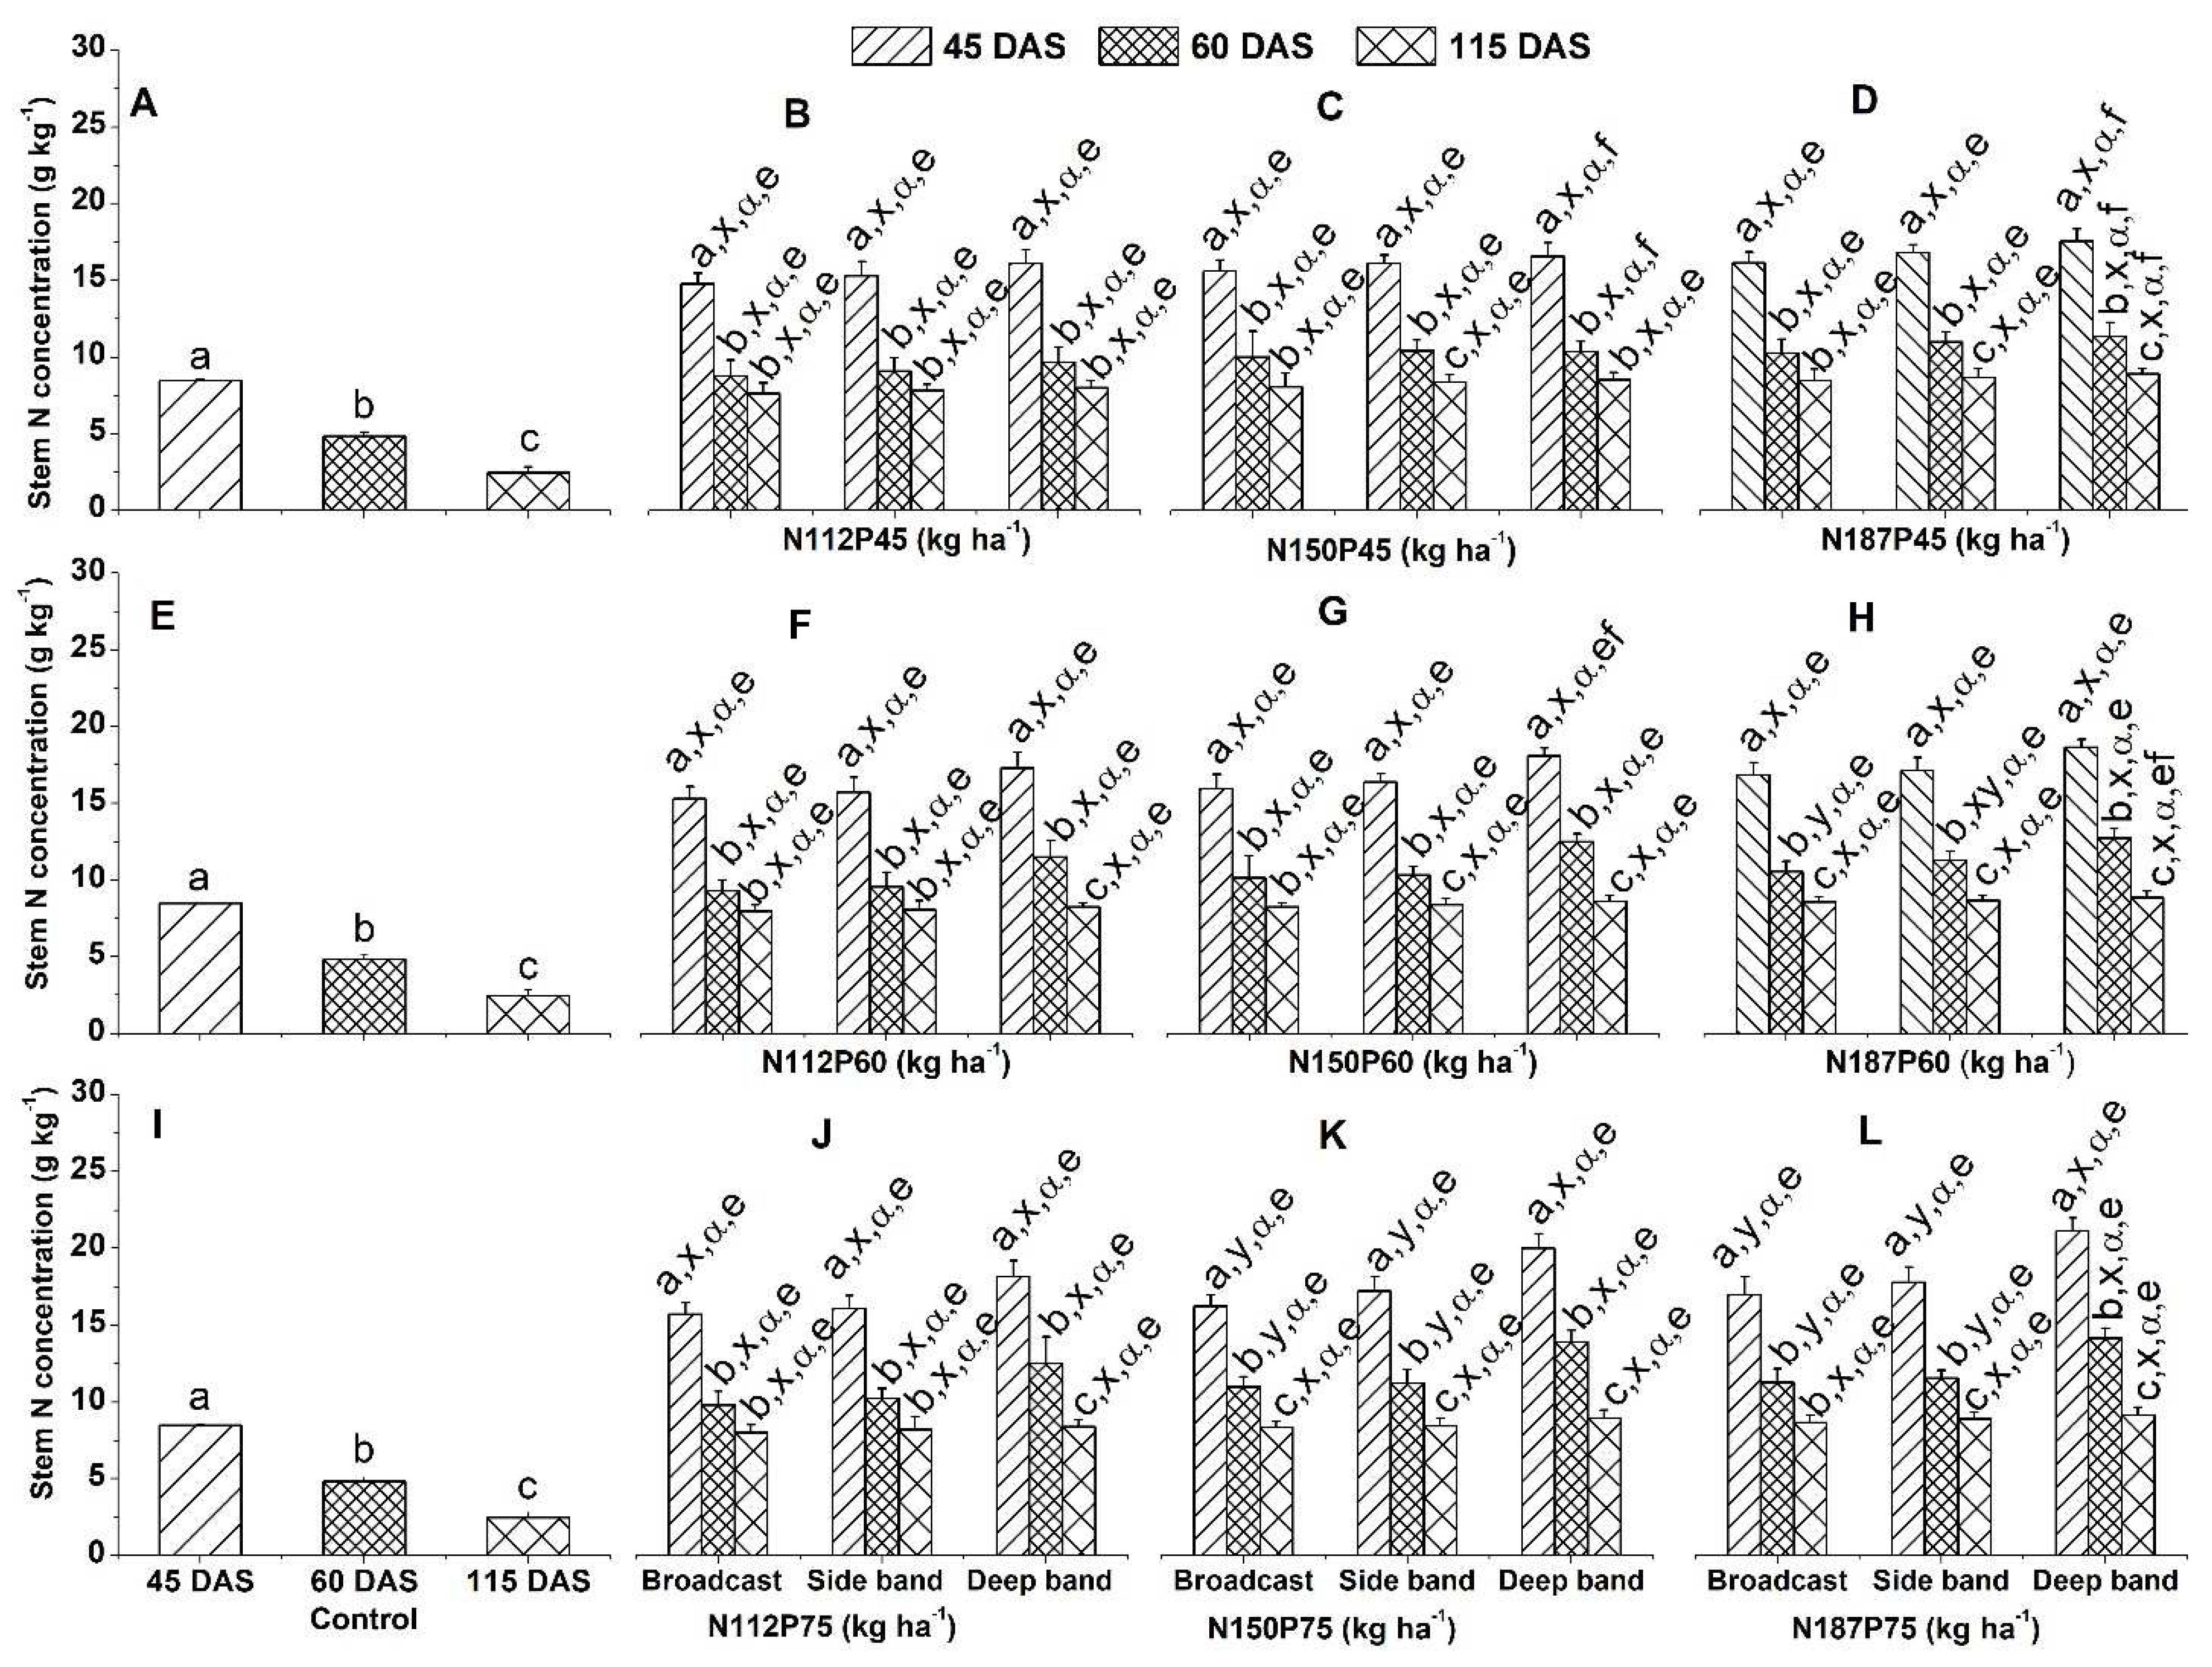
2.2.1. Stem N Concentration
2.2.2. Stem N Accumulation
2.3. Root N Concentration and Accumulation
2.3.1. Root N Concentration
2.3.2. Root N Accumulation
2.4. Seed N Concentration and Accumulation
2.4.1. Seed N Concentration
2.4.2. Seed N Accumulation
2.5. Total Plant N Accumulation
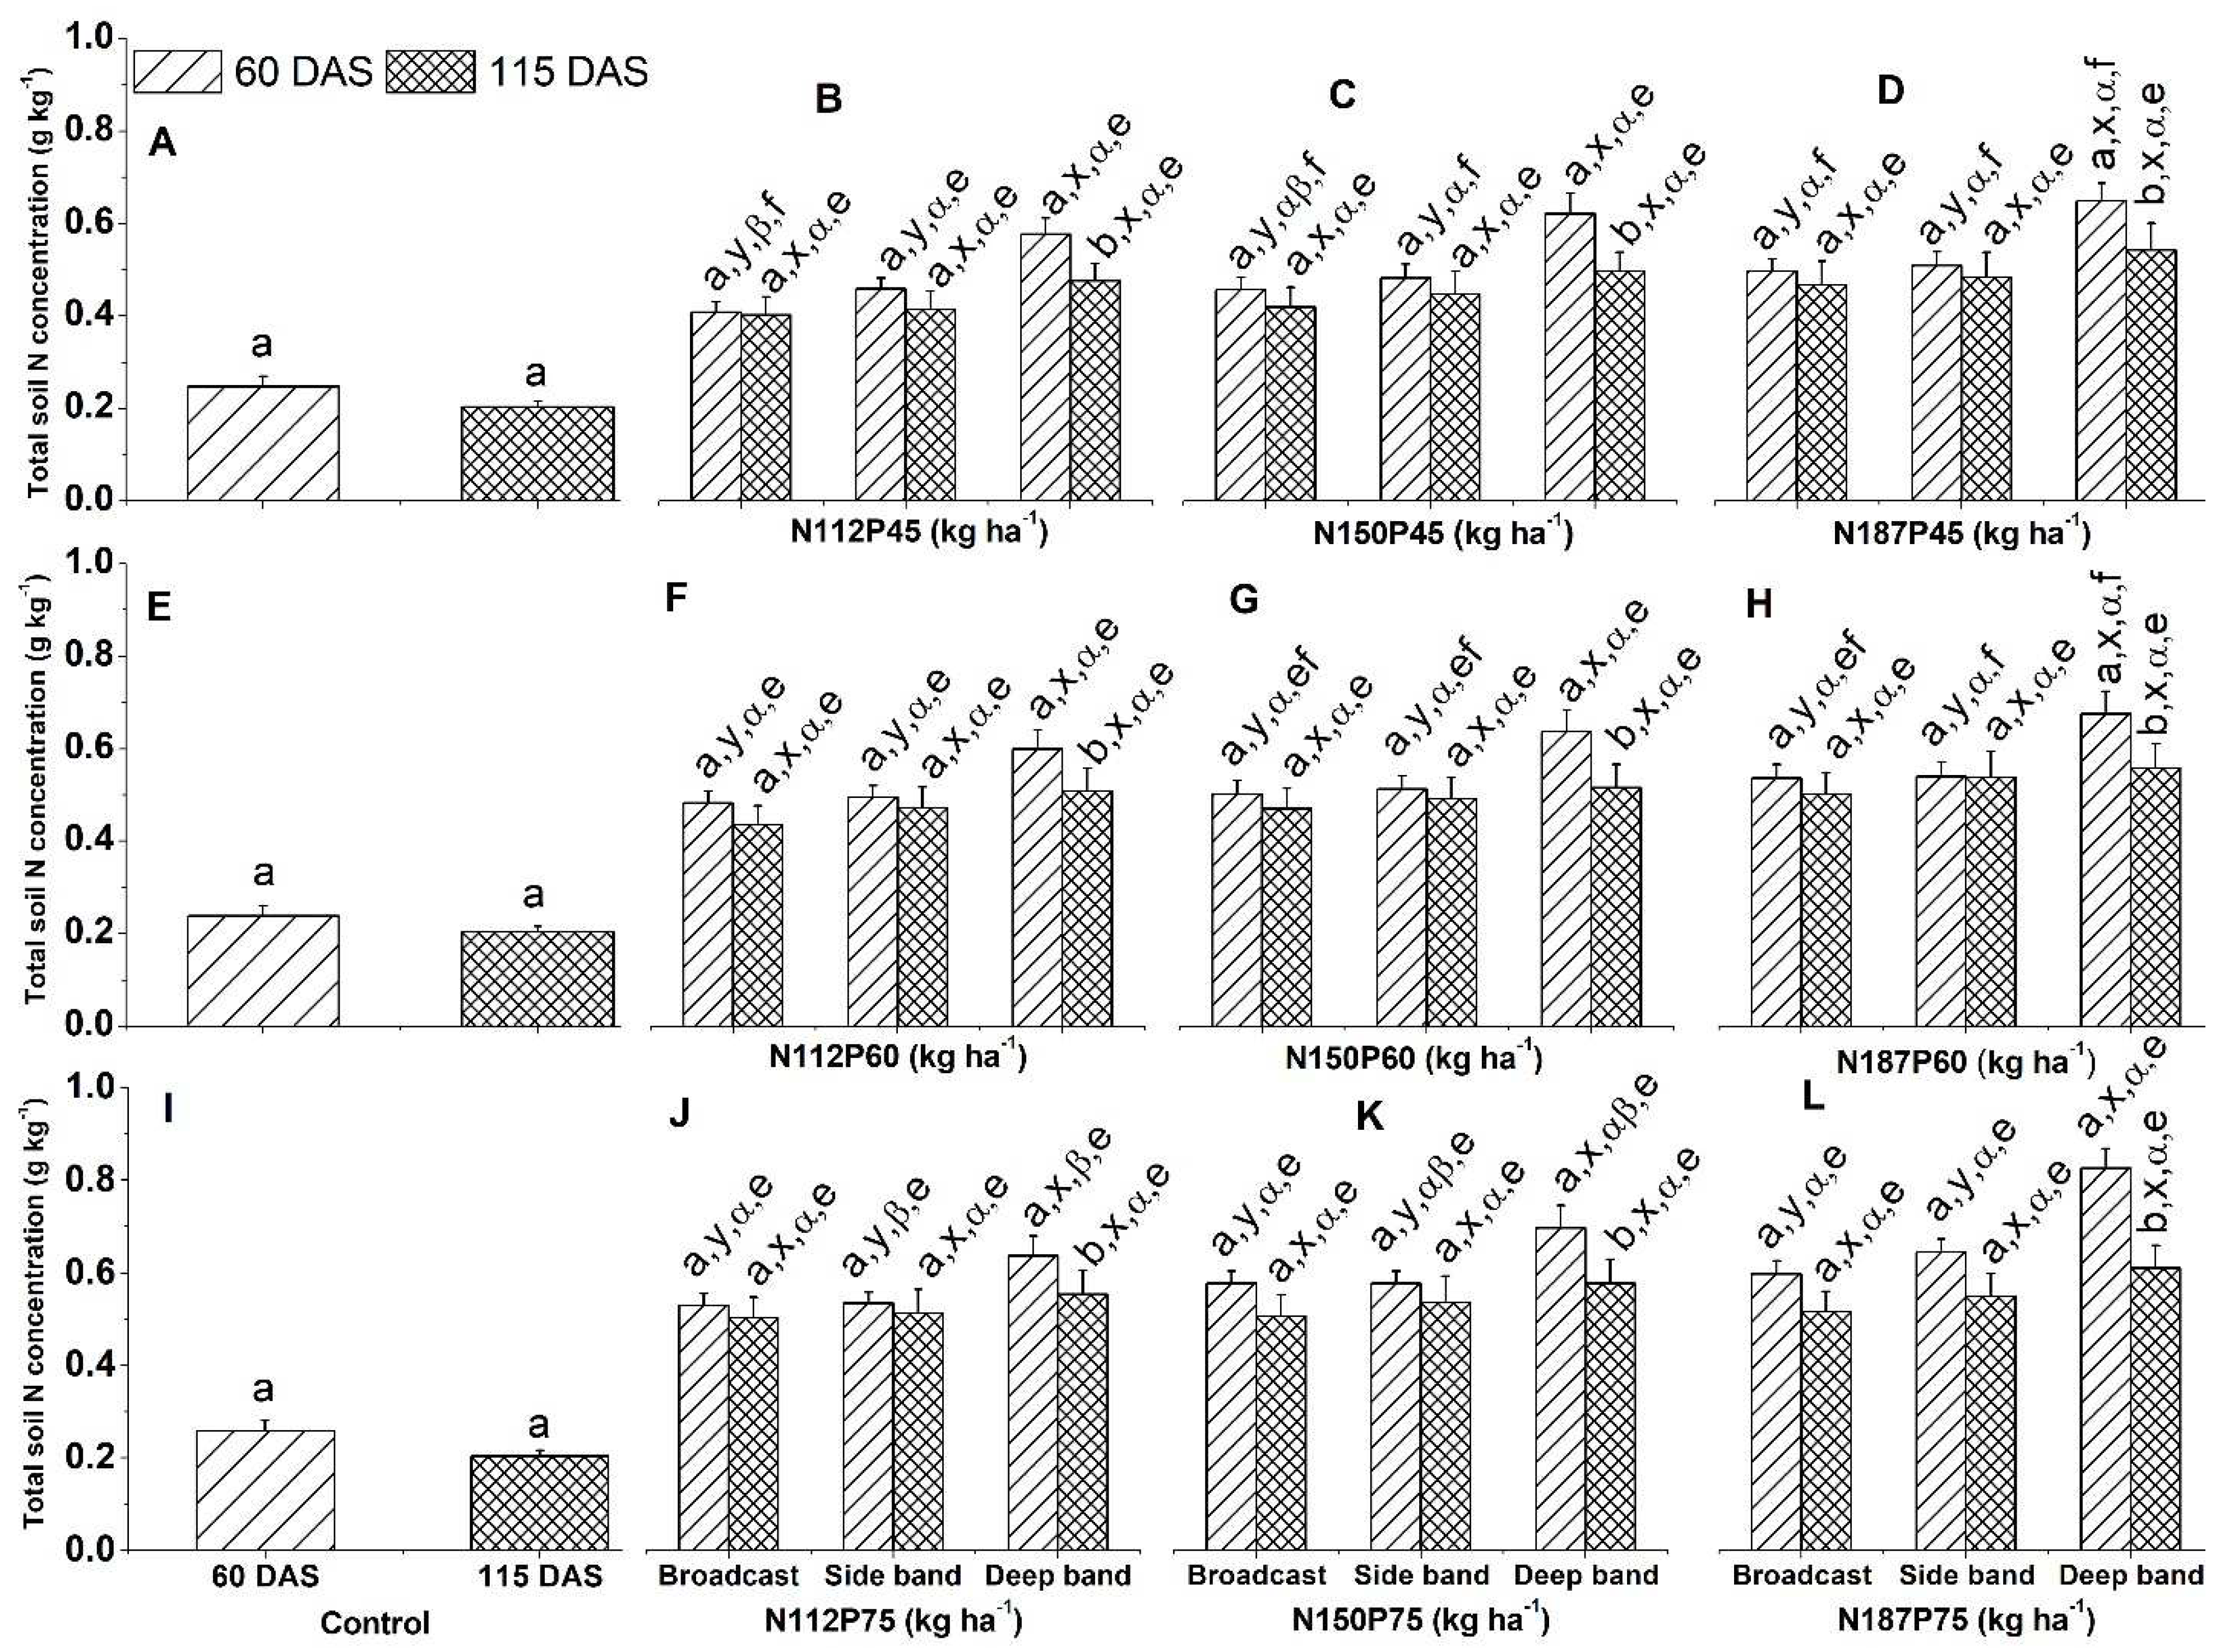
2.6. Total Soil N Concentration
2.7. N Use Efficiency
| NP rate | Placement | NAE (kg kg-1) | NUE (%) | PFPN (kg kg-1 N) |
|---|---|---|---|---|
| N112P45 | Broadcast | 14.2 ± 3.7 (a,x,e) | 42.4 ± 5.3 (a,x,f) | 35.8 ± 2.5 (a,x,e) |
| Side band | 14.9 ± 2.9 (a,x,e) | 48.4 ± 4.6 (a,x,e) | 37.5 ± 1.4 (a,x,e) | |
| Deep band | 16.8 ± 3.2 (a,x,e) | 52.5 ± 3.3 (a,x,f) | 38.7 ± 2.1 (a,x,e) | |
| N150P45 | Broadcast | 11.2 ± 1.4 (a,x,e) | 36.1 ± 2.8 (a,x,f) | 27.3 ± 1.5 (b,x,e) |
| Side band | 11.6 ± 2.2 (a,x,e) | 41.3 ± 4.4 (a,x,e) | 28.4 ± 1.1 (b,x,e) | |
| Deep band | 13.1 ± 2.7 (a,x,f) | 45.3 ± 4.6 (a,x,g) | 29.4 ± 2.1 (b,x,f) | |
| N187P45 | Broadcast | 9.5 ± 2.0 (a,x,e) | 33.9 ± 3.9 (a,x,e) | 22.4 ± 1.3 (b,x,e) |
| Side band | 10.2 ± 1.8 (a,x,e) | 39.6 ± 2.8 (a,x,f) | 23.7 ± 1.9 (c,x,e) | |
| Deep band | 11.0 ± 1.8 (a,x,f) | 43.5 ± 4.9 (a,x,f) | 24.2 ± 0.9 (b,x,f) | |
| N112P60 | Broadcast | 18.4 ± 3.0 (a,x,e) | 51.4 ± 2.0 (a,x,ef) | 40.0 ± 1.9 (a,x,e) |
| Side band | 18.4 ± 4.2 (a,x,e) | 54.7 ± 6.5 (a,x,e) | 41.0 ± 2.1 (a,x,e) | |
| Deep band | 19.8 ± 3.0 (a,x,e) | 65.2 ± 6.2 (a,x,ef) | 41.7 ± 1.9 (a,x,e) | |
| N150P60 | Broadcast | 14.5 ± 3.0 (a,x,e) | 44.3 ± 2.3 (ab,y,ef) | 30.6 ± 1.8 (b,y,e) |
| Side band | 15.3 ± 1.7 (a,x,e) | 48.5 ± 4.0 (a,y,e) | 32.2 ± 2.0 (b,xy,e) | |
| Deep band | 19.8 ± 1.8 (a,x,e) | 68.9 ± 2.9 (a,x,f) | 36.2 ± 1.5 (b,x,e) | |
| N187P60 | Broadcast | 12.0 ± 1.1 (a,y,e) | 38.3 ± 3.5 (b,y,e) | 24.9 ± 1.2 (c,y,e) |
| Side band | 13.0 ± 1.7 (a,xy,e) | 41.9 ± 1.4 (a,y,ef) | 26.6 ± 1.7 (b,xy,e) | |
| Deep band | 16.5 ± 1.1 (a,x,e) | 60.7 ± 3.1 (a,x,e) | 29.6 ± 1.3 (c,x,e) | |
| N112P75 | Broadcast | 15.6 ± 4.0 (a,x,e) | 55.7 ± 2.8 (a,x,e) | 38.2 ± 2.2 (a,x,e) |
| Side band | 17.4 ± 4.0 (a,x,e) | 58.8 ± 5.4 (a,x,e) | 39.9 ± 2.8 (a,x,e) | |
| Deep band | 21.0 ± 4.0 (a,x,e) | 69.1 ± 5.3 (b,x,e) | 41.8 ± 2.5 (a,x,e) | |
| N150P75 | Broadcast | 12.6 ± 4.4 (a,y,e) | 46.6 ± 3.3 (b,y,e) | 29.5 ± 2.0 (b,y,e) |
| Side band | 13.7 ± 3.0 (a,y,e) | 53.8 ± 3.6 (a,y,e) | 30.5 ± 1.9 (b,y,e) | |
| Deep band | 22.0 ± 1.2 (a,x,e) | 80.3 ± 2.4 (a,x,e) | 37.6 ± 1.9 (a,x,e) | |
| N187P75 | Broadcast | 10.4 ± 1.7 (a,y,e) | 40.8 ± 2.8 (b,y,e) | 23.9 ± 1.3 (b,y,e) |
| Side band | 12.4 ± 0.9 (a,y,e) | 48.3 ± 3.2 (a,y,e) | 25.9 ± 1.6 (b,y,e) | |
| Deep band | 18.6 ± 1.8 (a,x,e) | 68.3 ± 2.2 (b,x,e) | 31.0 ± 1.8 (b,x,e) |
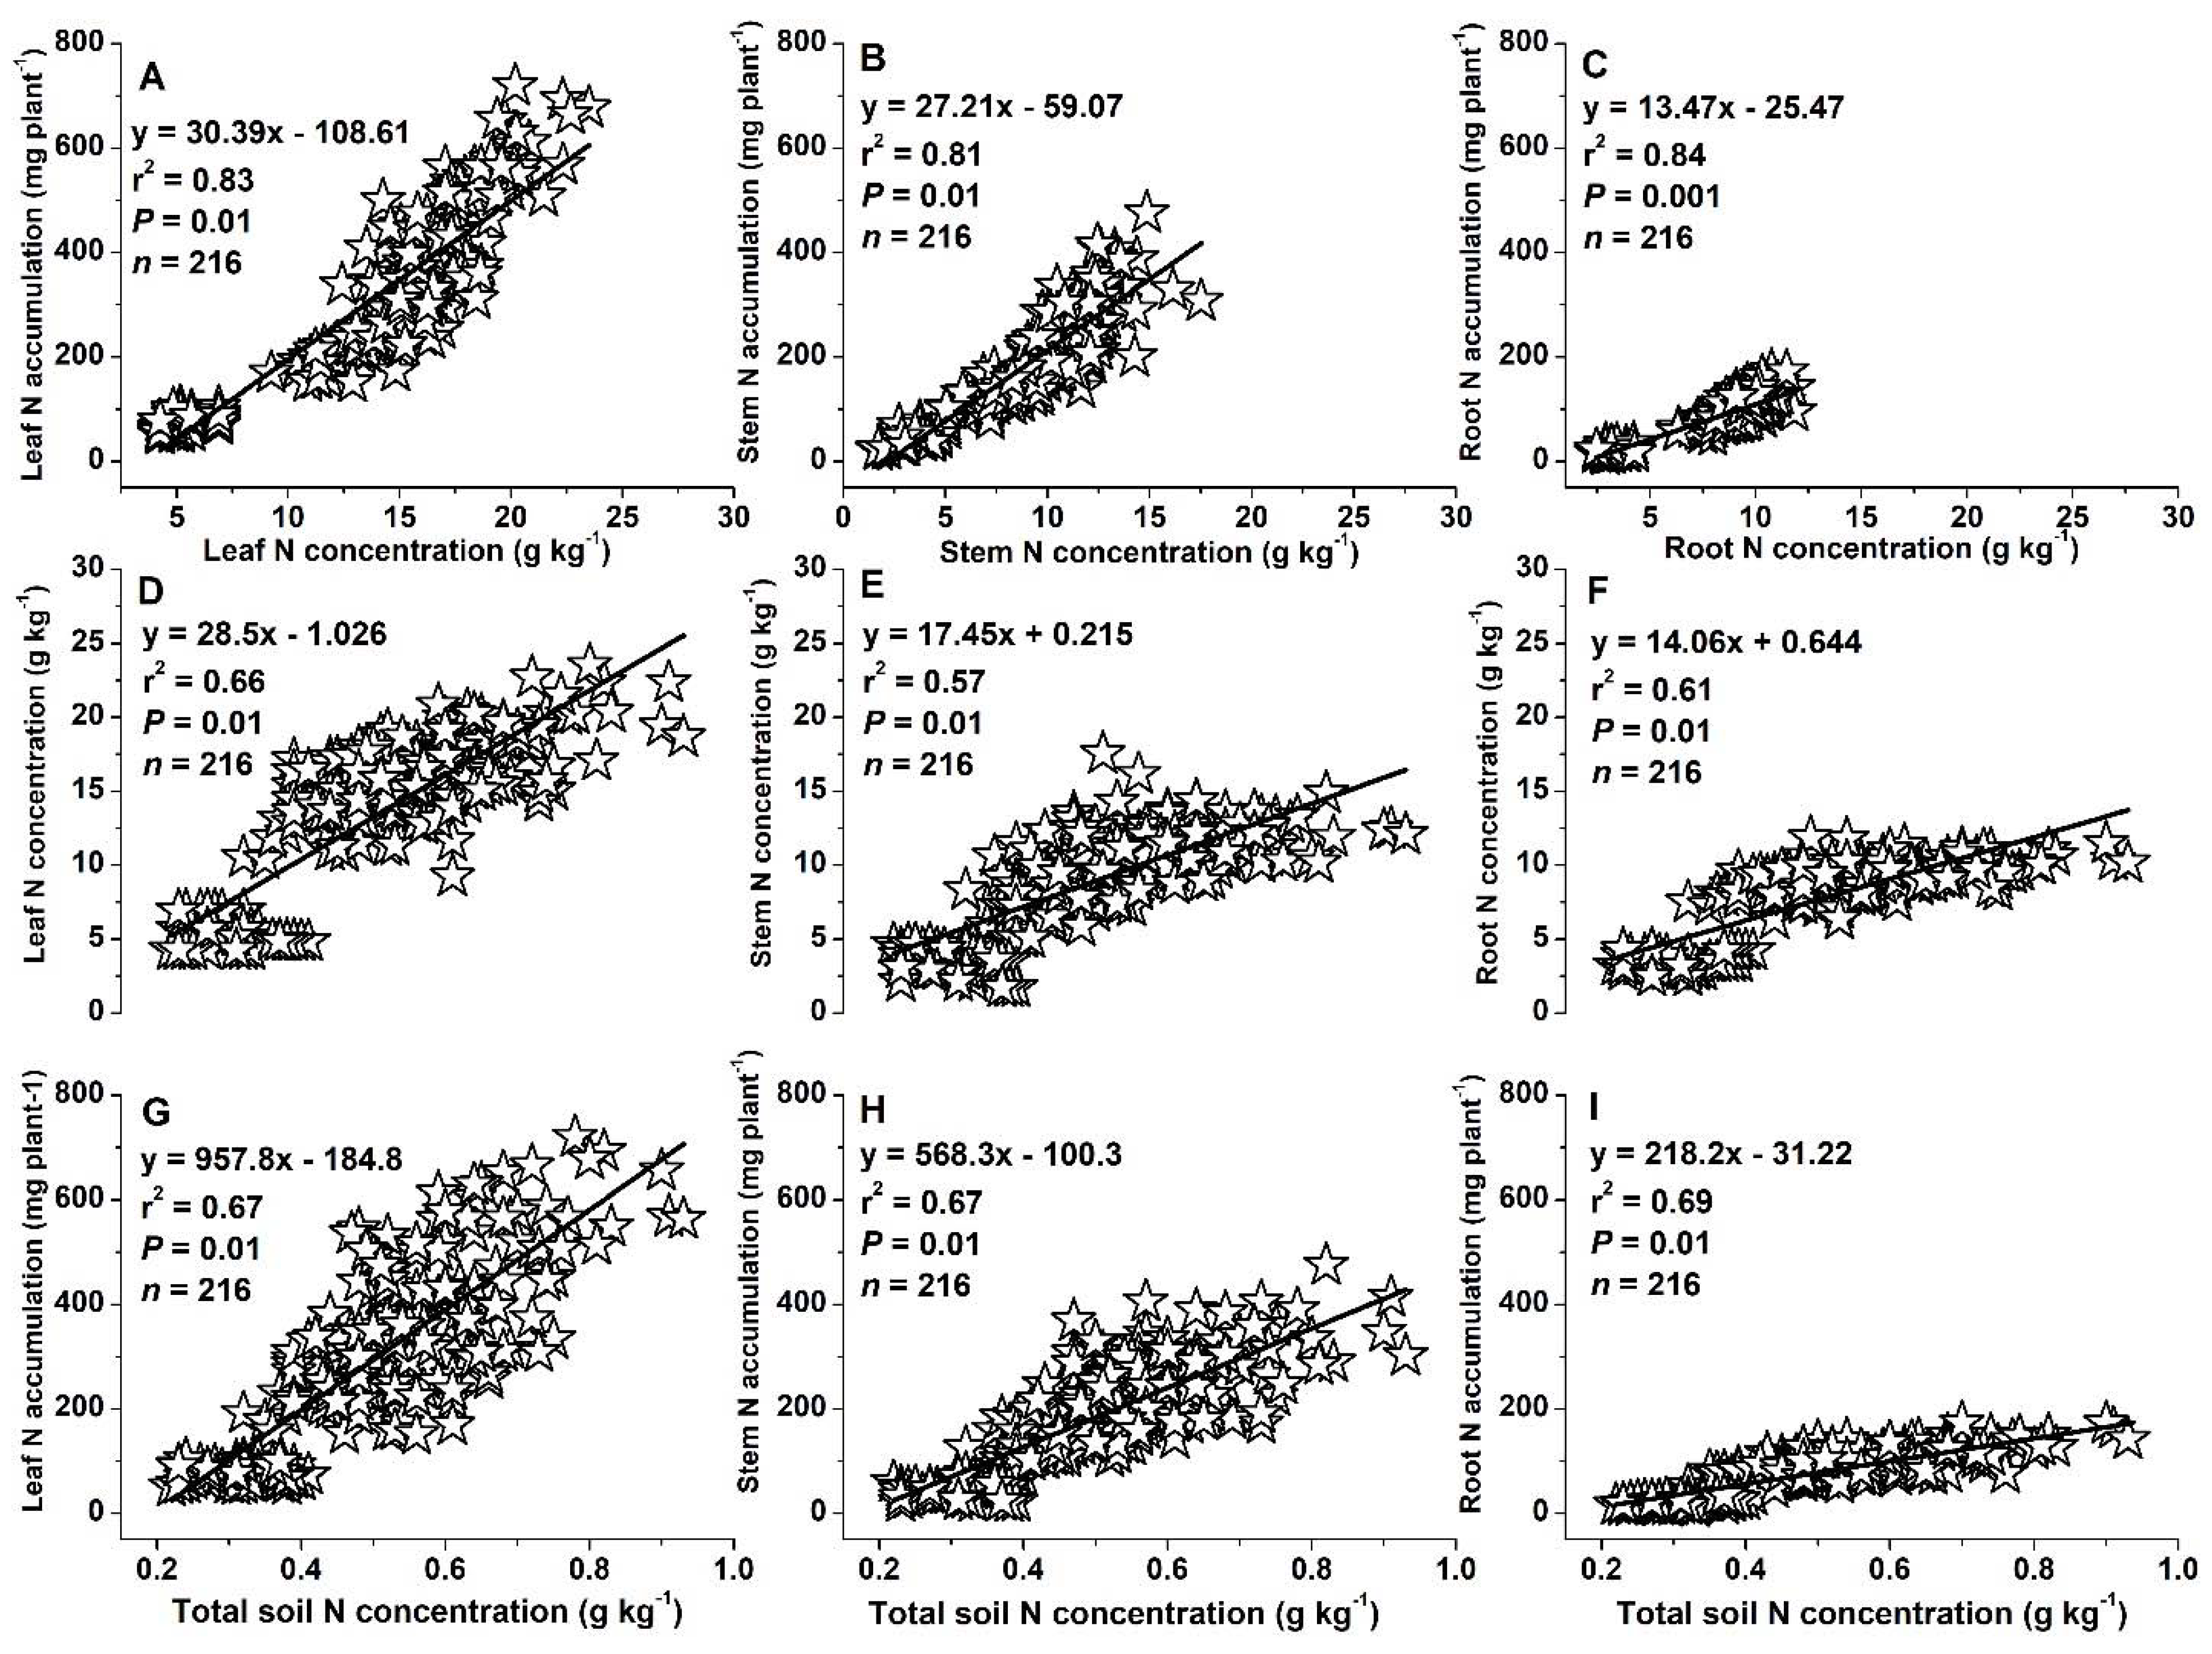
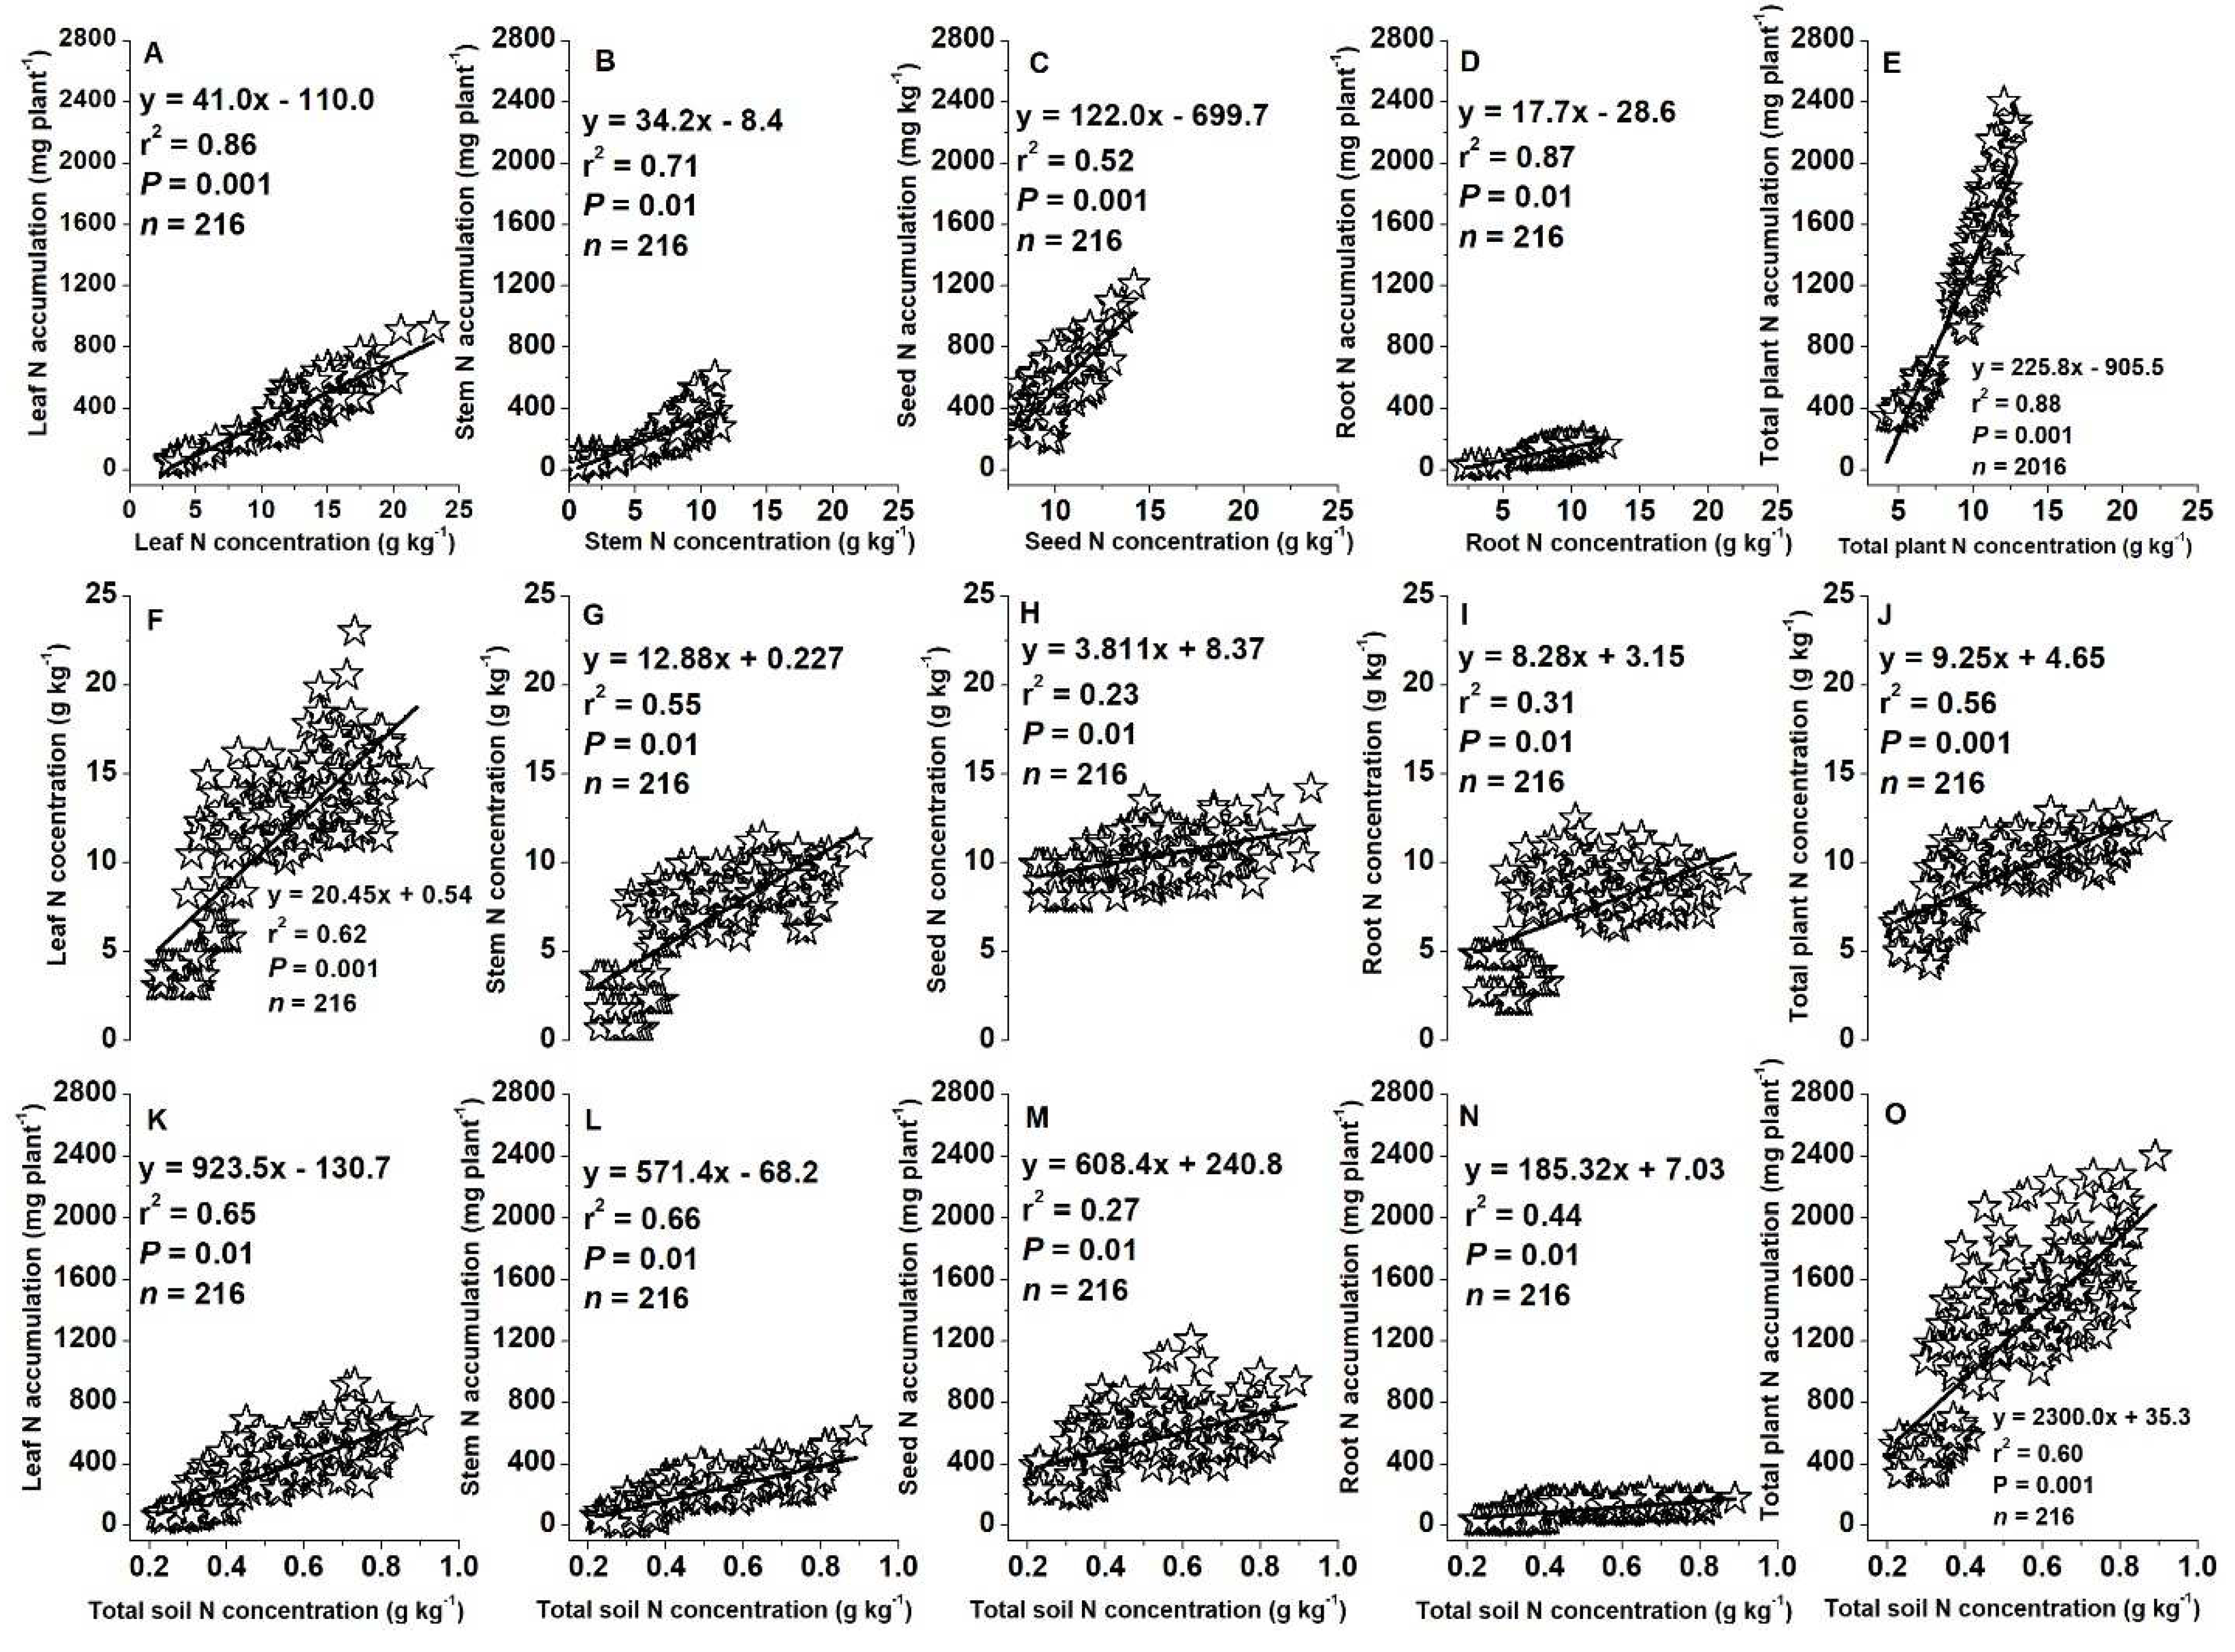
2.8. Relationships between Concentrations of Tissue N or Soil Total N and Plant N Accumulations
3. Discussion
3.1. Greater N Concentration under Deep Band
3.2. Greater Soil Total N Concentration under Deep Band
3.3. Greater N Accumulation and Yield Production under Deep Band
3.4. Greater N Use efficiency under Deep Band
3.5. Variations in Relationships between Concentrations of Tissue N or Soil N and Plant N Accumulations
4. Materials and Methods
4.1. Experimental site and weather condition
| Months | Precipitation (mm) |
Temperature (°C) | Humidity (%) | Precipitation (mm) |
Temperature (°C) | Humidity (%) |
|---|---|---|---|---|---|---|
| 2018 | 2019 | |||||
| May | 201.8 | 22.5 | 77.7 | 203.3 | 20.4 | 83.1 |
| June | 96.1 | 25.3 | 77.3 | 242.4 | 24.2 | 83.4 |
| July | 114.7 | 30.4 | 66.4 | 176.9 | 26.9 | 79.5 |
| August | 120.3 | 29.2 | 68.9 | 53.1 | 29.5 | 66.3 |
| September Means ± SD |
183.2 143.2 ± 46.3 |
22.7 26.0 ± 3.7 |
83.6 74.8 ± 7.0 |
109.7 157.1 ± 75.6 |
23.8 25.0 ± 3.4 |
77.3 77.9 ± 7.0 |
4.2. Experimental design and treatments
4.3. Crop management
4.4. Plant and soil sampling and chemical assay
4.5. Statistical analyses
5. Conclusion
Author Contributions
Funding
Informed Consent Statement
Data Availability Statement
Conflicts of Interest
References
- Hawkesford, M.; Horst, W.; Kichey, T.; Lambers, H.; Schjoerring, J.; Møller, I.S.; White, P. Functions of Macronutrients. In Marschner’s Mineral Nutrition of Higher Plants, 3rd ed.; Marschner, P., Ed.; Academic Press: London, 2012; pp. 135–189. [Google Scholar]
- Zhang, X.; Davidson, E.A.; Mauzerall, D.L.; Searchinger, T.D.; Dumas, P.; Shen, Y. Managing nitrogen for sustainable development. Nature 2015, 528, 51–59. [Google Scholar] [CrossRef] [PubMed]
- FAOSTAT. Land, Inputs and Sustainability – Fertilizers by Nutrient (Afghanistan or world agriculture use, nutrient nitrogen N, total). 2023. Available online: https://www.fao.org/faostat/en/#data (accessed on 6 August 2023).
- Bowles, T.M.; Atallah, S.S.; Campbell, E.E.; Gaudin, A.C.M.; Wieder, W.R.; Grandy, A.S. Addressing agricultural nitrogen losses in a changing climate. Nat. Sustain. 2018, 1, 399–408. [Google Scholar] [CrossRef]
- Quan, Z.; Zhang, X.; Davidson, E.A.; Feifei Zhu, F.F.; Li, S.L.; Zhao, X.H.; Chen, X.; Zhang, L.M.; He, J.Z.; Wei, W.X.; Fang, Y.T. Fates and use efficiency of nitrogen fertilizer in maize cropping systems and their responses to technologies and management practices: a global analysis on field 15N tracer studies. Earths Future 2021, 9, e2020EF001514. [Google Scholar] [CrossRef]
- Fageria, N.K. Nitrogen Management in Crop Production; CRC Press Taylor & Francis Group: New York, 2014; p. 315. [Google Scholar]
- National Statistics and Information Authority (NSIA). Statistical Yearbook. 2023. Available online: http://nsia.gov.af/library (accessed on 8 January 2023).
- FAOSTAT. Production – Crops and livestock products (Afghanistan, production or area harvested, maize (corn). 2023. Available online: https://www.fao.org/faostat/en/#data/QCL (accessed on 6 August 2023).
- Obaid, H.; Shivay, Y.S.; Jat, S.L.; Sharifi, S. Optimization of nitrogen and phosphorus fertilizers doses in hybrid maize (Zea mays) in Kandahar province of Afghanistan. Indian J. Agron. 2018, 63, 521–523. [Google Scholar]
- Husein, H.H.; Lucke, B.; Bäumler, R.; Sahwan, W. A. Contribution to soil fertility assessment for arid and semi-arid lands. Soil Syst. 2021, 5, 42. [Google Scholar] [CrossRef]
- Jilani, A.; Pearce, D.; Bailo, F. Australian Centre for International Agricultural Research (ACIAR) wheat and maize projects in Afghanistan; Australian Centre for International Agricultural Research: Canberra, 2013. [Google Scholar]
- Mozafari, S.H.; Dass, A.; Choudhary, A.K.; Raihan, O.; Rajanna, G.A. Effect of moisture conservation and integrated nutrient management on summer maize (Zea mays) in Kandahar, Afghanistan. Indian J. Agric. Sci. 2020, 90, 236–239. [Google Scholar] [CrossRef]
- Raihan, O.; Kaur, R.; Shivay, Y.S.; Dass, A.; Barai, S.M. Effect of crop-establishment methods and nitrogen levels on productivity and profitability of maize (Zea mays) in semi-arid region of Afghanistan. Indian J. Agron. 2017, 62, 08–110. [Google Scholar]
- Ahmadi, N.M.; Das, T.K.; Nasrat, N.; Rathore, S.S.; Paul, A.K. Effect of phosphorus on yield and economics of maize (Zea mays) under semi-arid conditions of Afghanistan. Indian J. Agric. Sci. 2020, 90, 439–441. [Google Scholar] [CrossRef]
- Nkebiwe, P.M.; Weinmann, M.; Bar-Tal, A.; Müller, T. Fertilizer placement to improve crop nutrient acquisition and yield: A review and meta-analysis. Field Crops Res. 2016, 196, 389–401. [Google Scholar] [CrossRef]
- Freiling, M.; Tucher, S.V.; Schmidhalter, U. Factors influencing phosphorus placement and effects on yield and yield parameters: A meta-analysis. Soil Tillage Res. 2022, 216, 105257. [Google Scholar] [CrossRef]
- Xie, H.; Zhang, Q.F.; Zeng, Q.X.; Li, Y.X.; Ma, Y.P.; Lin, H.Y.; Liu, Y.Y.; Yin, Y.F.; Chen, Y.M. Nitrogen application drivers the transformation of soil phosphorus fraction in Cunning-hamia lanceolata plantation by changing microbial biomass phosphorus. Chinese J. of Ecol. 2020, 39, 3934–3942. [Google Scholar]
- Drury, C.F.; Reynolds, W.D.; Tan, C.S.; Welacky, T.W.; Calder, W.; McLaughlin, N.B. Emissions of nitrous oxide and carbon dioxide: Influence of tillage type and nitrogen placement depth. Soil Sci. Soc. Am. J. 2006, 70, 570–581. [Google Scholar] [CrossRef]
- Liu, X.J.; Mosier, A.R.; Halvorson, A.D.; Zhang, F.S. The impact of nitrogen placement and tillage on NO, N2O, CH4 and CO2 fluxes from a clay loam soil. Plant Soil 2006, 280, 177–188. [Google Scholar] [CrossRef]
- Steusloff, T.W.; Nelson, K.A.; Motavalli, P.P.; Singh, G. Fertilizer placement affects corn and nitrogen use efficiency in a claypan soil. Agron J. 2019, 5, 2512–2522. [Google Scholar] [CrossRef]
- Szulc, P.; Barłóg, P.; Ambrozy-Deregowska, K.; Mejza, I.; Kobus-Cisowska, J. In-Soil application of NP mineral fertilizer as a method of improving nitrogen yielding efficieny. Agronomy 10, 1488. [CrossRef]
- Jiang, C.; Lu, D.; Zu, C.; Zhou, J.; Wang, H. Root-zone fertilization improves crop yields and minimizes nitrogen loss in summer maize in China. Sci. Rep. 8, 15139. [CrossRef]
- Mishra, J.S.; Patil, J.V. Nutrient-Use Efficiency in Sorghum. In Nutrient Use Efficiency: from Basics to Advances; Rakshit, A., Singh, H.B., Sen, A., Eds.; New Delhi Springer: India, 2015; pp. 297–315. [Google Scholar]
- Shapiro, C.; Attia, A.; Ulloa, S.; Mainz, M. Use of five nitrogen source and placement systems for improved nitrogen management of irrigated corn. Soil Sci. Soc. Am. J. 2016, 80, 1663–1674. [Google Scholar] [CrossRef]
- Quinn, D.J.; Lee, C.D.; Poffenbarger, H.J. Corn yield response to sub-surface banded starter fertilizer in the U.S.: A meta-analysis. Field Crops Res. 2020, 254, 107834. [Google Scholar] [CrossRef]
- Szulc, P.; Barłóg, P.; Ambroży-Deręgowska, K.; Mejza, I.; Kobus-Cisowska, J.; Ligaj, M. Effect of phosphorus application technique on effectiveness indices of its use in maize cultivation. Plant Soil Environ. 66, 500–505. [CrossRef]
- Jiang, C.; Lu, D.; Zu, C.; Shen, J.; Wang, S.; Guo, Z.; Zhou, J.; Wang, H. One-time root-zone N fertilization increases maize yield, NUE and reduces soil N losses in lime concretion black soil. Sci. Rep. 8, 10258. [CrossRef]
- Jiang, C.; Ren, X.; Wang, H.; Lu, D.; Zu, C.; Wang, S. Optimal nitrogen application rates of one-time root zone fertilization and the effect of reducing nitrogen application on summer maize. Sustainability 11, 2979. [CrossRef]
- Cheng, Y.; Wang, H.Q.; Liu, P.; Dong, S.T.; Zhang, J.W.; Zhao, B.; Re. , B.Z. Nitrogen placement at sowing affects root growth, grain yield formation, N use efficiency in maize. Plant Soil 2020, 457, 355–373. [Google Scholar] [CrossRef]
- Wang, X.; Wang, N.; Xing, Y.; Yun, J.; Zhang, H. Effects of plastic mulching and basal nitrogen application depth on nitrogen use efficiency and yield in maize. Front. Plant. Sci. 2018, 9, 1446. [Google Scholar] [CrossRef] [PubMed]
- Rychel, K.; Meurer, K.H.E.; Bo¨rjesson, G.; Stro¨mgren, M.; Getahun, G.T.; Kirchmann, H.; Ka¨tterer, T. Deep N fertilizer placement mitigated N2O emissions in a Swedish field trial with cereals. Nutr. Cycling Agroecosyst. 2020, 118, 133–148. [Google Scholar] [CrossRef]
- Schlegel, A.J.; Havlin, J.L. Corn yield and grain nutrient uptake from 50 Years of nitrogen and phosphorus fertilization. Agron J. 2017, 109, 335–342. [Google Scholar] [CrossRef]
- Ma, Q.; Sun, L.; Tian, H.; Rengel, Z.; Shen, J. Deep banding of phosphorus and nitrogen enhances Rosa multiflora growth and nutrient accumulation by improving root spatial distribution. Sci. Hortic. 2021, 277, 109800. [Google Scholar] [CrossRef]
- Liu, X.; Wang, H.; Zhou, J.; Chen, Z.; Lu, D.; Zhu, D.; Deng, P. Effect of nitrogen root zone fertilization on rice yield, uptake and utilization of macronutrient in lower reaches of Yangtze River, China. Paddy Water Environ. 2017, 15, 625–638. [Google Scholar] [CrossRef]
- Ma, Q.; Zhang, F.; Rengel, Z.; Shen, J. Localized application of NH4+-N plus P at the seedling and later growth stages enhances nutrient uptake and maize yield by inducing lateral root proliferation. Plant Soil 2013, 372, 65–80. [Google Scholar] [CrossRef]
- Wang, D.; Chang, Y.; Chunmei, X.; Zaiman, W.; Song, C.; Guang, C.; Xiufu, Z. Soil nitrogen distribution and plant nitrogen utilization in direct-seeded rice in response to deep placement of basal fertilizer-nitrogen. Reice Sci. 2019, 26, 404–415. [Google Scholar] [CrossRef]
- Sosulski, T.; Stepien, W.; Was, A.; Szymanska, M. N2O and CO2 emissions from bare soil: effect of fertilizer management. Agriculture 2020, 10, 602. [Google Scholar] [CrossRef]
- Wu, P.; Liua, F.; Li, H.; Cai, T.; Zhanga, P.; Jia, Z. Suitable fertilizer application depth can increase nitrogen use efficiency and maize yield by reducing gaseous nitrogen losses. Sci. Total Environ. 2021, 781, 146787. [Google Scholar] [CrossRef]
- Qiang, S.; Zhang, Y.; Zhao, H.; Fan, J.; Zhang, F.; Sun, M.; Gao, Z. Combined effects of urea type and placement depth on grain yield, water productivity and nitrogen use efficiency of rain-fed spring maize in northern China. Agric. Water Manag. 2022, 262, 107422. [Google Scholar] [CrossRef]
- Szulc, P.; Wilczewska, W.; Ambroży-Deręgowska, K.; Mejza, I.; Szymanowska, D.; Kobus-Cisowska, J. Influence of the depth of nitrogen-phosphorus fertiliser placement in soil on maize yielding. Plant Soil Environ. 66, 14–21. [CrossRef]
- Rees, R.M.; Roelcke, M.; Li, S.X.; Wang, X.Q.; Li, S.Q.; Stockdale, E.A.; Richter, J. The effect of fertilizer placement on nitrogen uptake and yield of wheat and maize in Chinese loess soils. Nutr. Cycling Agroecosyst. 1996, 47, 81–91. [Google Scholar] [CrossRef]
- López-Bellido, L.; López-Bellido, R.J.; López-Bellido, F.J. Fertilizer Nitrogen Efficiency in Durum wheat under rainfed Mediterranean conditions: Effect of split application. Agron J. 2006, 98, 55–62. [Google Scholar] [CrossRef]
- Weligama, C.; Tang, C.; Sale, P.W.G.; Conyers, M.K.; Liu, D.L. Localised nitrate and phosphate application enhances root proliferation by wheat and maximises rhizosphere alkalisation in acid subsoil. Plant Soil 2008, 312, 101–115. [Google Scholar] [CrossRef]
- Zhihui, W.; Jianbo, S.; Blackwell, M.; Haigang, L.; Bingqiang, Z.; Huimin, Y. Combined applications of nitrogen and phosphorus fertilizers with manure increase maize yield and nutrient uptake via stimulating root growth in a long-term experiment. Pedosphere 2016, 26, 62–73. [Google Scholar] [CrossRef]
- Havlin, J.L.; Tisdale, S.L.; Nelson, W.L.; Beaton, J.D. Soil Fertility and Fertilizers, 8th ed.; Pearson India Education Services: New, India, 2017; pp. 369–430. [Google Scholar]
- Wang, Y.; Wang, E.; Wang, D.; Huang, S.; Ma, Y.; Smith, C.J.; Wang, L. Crop productivity and nutrient use efficiency as affected by long-term fertilisation in North China Plain. Nutr. Cycling Agroecosyst. 86, 105–119. [CrossRef]
- Duan, Y.; Xu, M.; Wang, B.; Yang, X.; Huang, S.; Gao, S. Long-term evaluation of manure application on maize yield and nitrogen use efficiency in China. Soil Sci. Soc. Am. J. 2011, 75, 1562–1573. [Google Scholar] [CrossRef]
- Hopkins, B.G. Phosphorus. In Handbook of Plant Nutrition, 2 ed.; Barker, A.V., Pilbeam, D.J., Eds.; CRC Press: New York, 2015; pp. 66–111. [Google Scholar]
- Gu, X.D.; Zhang, F.J.; Wang, T.; Xie, X.W.; Jia, X.H.; Xu, X. Effects of nitrogen and phosphorus addition on growth and leaf nitrogen metabolism of alfalfa in alkaline soil in Yinchuan Plain of Hetao Basin. PeerJ 2022, 10, e13261. [Google Scholar] [CrossRef]
- De-Groot, C.C.; Marcelis, L.F.M.; Boogaard, R.V.D.; Kaiser, W.; Lambers, H. Interaction of nitrogen and phosphorus nutrition in determining growth. Plant Soil 2003, 248, 257–268. [Google Scholar] [CrossRef]
- Mitra, G. Essential plant nutrients and recent concepts about their uptake. In Essential Plant Nutrients. Uptake, Use efficiency, and Management; Naeem, M., Ansari, A.A., Singh Gill, S., Eds.; Springer: Switzerland, 2017; pp. 3–36. [Google Scholar]
- Zatylny, A.M.; St-Pierre, R.G. Nitrogen uptake, leaf nitrogen concentration, and growth of saskatoons in response to soil nitrogen fertility. J. Plant Nutr. 2006, 29, 209–2018. [Google Scholar] [CrossRef]
- Fageria, N.K. The Use of Nutrients in Crop Plants; CRC Press: New York, 2009. [Google Scholar]
- Zhang, A.; Wang, X.X.; Zhang, D.; Dong, Z.; Ji, H.; Li, H. Localized nutrient supply promotes maize growth and nutrient acquisition by shaping root morphology and physiology and mycorrhizal symbiosis. Soil Tillage Res 2023, 225, 105555. [Google Scholar] [CrossRef]
- Li, H.B.; Zhang, F. S; Shen. J. B. Contribution of root proliferation in nutrient-rich soil patches to nutrient uptake and growth of maize. Pedosphere 2012, 22, 776–784. [Google Scholar] [CrossRef]
- Wu, X.; Li, H.; Rengel, Z.; Whalley, W.R.; Li, H.; Zhang, F.; Shen, J.; Jin, K. Localized nutrient supply can facilitate root proliferation and increase nitrogen-use efficiency in compacted soil. Soil Tillage Res. 2022, 215, 105198. [Google Scholar] [CrossRef]
- Fageria, N.K.; Baligar, V.C.; Jones, C.A. Growth and Mineral Nutrition of Field Crops, 3rd ed.; CRC Press: New York, 2011. [Google Scholar]
- Asibi, A.E.; Chai, Q.; Coulter, J.A. Mechanisms of nitrogen use in maize. Agronomy 2019, 9, 123–138. [Google Scholar] [CrossRef]
- Singh, S.P.; Bargali, K.; Joshi, A.; Chaudhry, S. Nitrogen resorption in leaves of tree and shrub seedlings in response to increasing soil fertility. Curr. Sci. 2005, 89, 389–396. [Google Scholar]
- Wang, Y.; Janz, B.; Engedal, T.; Neergaard, A.d. Effect of irrigation regimes and nitrogen rates on water use efficiencyand nitrogen uptake in maize. Agric Water Manag 2017, 179, 271–276. [Google Scholar] [CrossRef]
- Pasley, H.R.; Camberato, J.J.; Cairns, J.E.; Zaman-Allah, M.; Das, B.; Vyn, T.J. Nitrogen rate impacts on tropical maize nitrogen use efficiency and soil nitrogen depletion in eastern and southern Africa. Nutr. Cycling Agroecosyst 2020, 116, 397–408. [Google Scholar] [CrossRef]
- Corcolesa, H.L.; Juanb, J.A.D.; Picornellb, M.R. Biomass production and yield in irrigated maize at different rates of nitrogen in a semi-arid climate. NJAS-Wagening. J. Life Sci. 2020, 92, 100321. [Google Scholar] [CrossRef]
- Duan, Y.H.; Shi, X.J.; Li, S.; Sun, X.; He, X.H. Nitrogen use efficiency as affected by phosphorus and potassium in long-term rice and wheat experiments. J. Integr. Agric. 2014, 13, 588–596. [Google Scholar] [CrossRef]
- Hammad, H.M.; Farhad, W.; Abbas, F.; Fahad, S.; Saeed, S.; Nasim, W.; Bakhat, H.F. Maize plant nitrogen uptake dynamics at limited irrigation water and nitrogen. Environ. Sci. Pollut. Res. 2017, 24, 2549–2557. [Google Scholar] [CrossRef] [PubMed]
- Bao, S. Agricultural Chemical Analysis of Soil (in Chinese); China Agriculture Press: Beijing, 2003. [Google Scholar]
- Sandhu, O.S.; Gupta, R.; Thind, H.S.; Mangi Lal, Jat; Singh, Y.; Sidhu, H.S. Evaluation of N fertilization management strategies for increasing crop yields and nitrogen use efficiency in furrowirrigated maize–wheat system under permanent raised bed planting. Arch. Agron. Soil Sci. 2019, 66, 1302–1317. [Google Scholar] [CrossRef]
- Dhakal, K.; Baral, B.R.; Pokhrel, K.R.; Pandit, N.R.; Gaihre, Y.K.; Vista, a.S.P. Optimizing N fertilization for increasing yield and profits of rainfed maize grown under sandy loam soil. Nitrogen. 2021, 2, 359–377. [Google Scholar] [CrossRef]
Disclaimer/Publisher’s Note: The statements, opinions and data contained in all publications are solely those of the individual author(s) and contributor(s) and not of MDPI and/or the editor(s). MDPI and/or the editor(s) disclaim responsibility for any injury to people or property resulting from any ideas, methods, instructions or products referred to in the content. |
© 2023 by the authors. Licensee MDPI, Basel, Switzerland. This article is an open access article distributed under the terms and conditions of the Creative Commons Attribution (CC BY) license (http://creativecommons.org/licenses/by/4.0/).


