
Submitted:
05 September 2023
Posted:
06 September 2023
You are already at the latest version
Abstract
Water resources planners and policymakers often ask questions about the future projections of drought characteristics (events, intensity, severity, duration, and peak) under different climatic scenarios. This study focused on quantifying the historical (1951-2005) and future (2026-2100) drought characteristics using the Standardized precipitation index (SPI) under RCP 4.5 and RCP 8.5 climate scenarios for the Balochistan province of Pakistan, an arid and drought-vulnerable region. Precipitation data of MPI-ESM-LR_RCA4 RCM was obtained from the Coordinated Regional Climate Downscaling Experiment South Asia (CORDEX-SA). The CORDEX-SA data was interpolated at 12-gauge stations and bias-corrected by the distribution mapping method using Asian Precipitation - Highly-Resolved Observational Data Integration towards Evaluation (APHRODITE) data. The drought characteristics were calculated based on standardized precipitation index (SPI), and intercompared between northern Balochistan (NB) and southern Balochistan (SB). It was found that the northern Balochistan (NB) region has suffered more droughts in the historical period and is also projected to have more severe and intense droughts than SB region. It was also found that with the increase of drought events, the duration reduces, which means that the higher the drought events at a station, the lower the drought duration. Government officials should focus more on managing the already few freshwater resources sustainably, given the increased likelihood of droughts in Balochistan due to climate change.
Keywords:
Balochistan
; Bias correction
; CORDEX‐SA
; droughts
; Pakistan
; standardized precipitation index (SPI)
1. Introduction
The Global Risk Report 2022 has reported that countries with dense populations and high agriculture dependence are more vulnerable to climate change [1]. Pakistan, the world’s 5th most populated country, has an arid to semi-arid climate and an average annual rainfall of around 300 mm [2]. The country is exposed to climate change, which has disturbed the precipitation patterns, affecting water resource availability [3]. Pakistan Council of Research in Water Resources (PCRWR) revealed that Pakistan had crossed the water stress line in 1990 and the water scarcity line in 2005, and it is projected that the country could face severe water shortages in 2025 [4].
In the north of Pakistan, summer precipitation contains two distinct phases, i.e., the pre-monsoon trough phase (July) and the trough monsoon phase (August) [5]. Weather stations across Pakistan show a decreasing trend in rainfall in the north, northwest, west, and coastal areas, resulting in worsening droughts [6]. Due to less rainfall, the high altitude of the mountain ranges, and more spatiotemporal variability, the southern part of Paki stan is more susceptible to drought [7]. The magnitude of the precipitation trends showed the highest variation during the summer and the lowest variation in the winter. It is observed that in the western part of the Northern sub-Himalayan region of Pakistan, the precipitation and the number of rain days are decreasing in the winter season, resulting in dry days, where a major part of total precipitation is received in the winter. This decrease in rainfall or water availability may cause more droughts, affecting the country’s hydrology [8]. Moreover, models agree about the future increase in temperature over this region but disagree about the precipitation [9].
Drought is a hydro-meteorological hazard with meteorological, agricultural, hydrological, and socio-economical aspects [10]. It is different from all natural hazards in many aspects [11]: for example, it is slow and persistent, and the world’s costliest, resulting in annual global damages of an average of $6 to $8 billion [12].
Balochistan (southwest Pakistan) is the center of China Pakistan Economic Corridor (CPEC). This region has an arid climate, and the annual precipitation ranges from 200 mm to 350 mm [13]. This region has suffered severe droughts in the past. In addition, it is projected that Balochistan will experience more droughts than other parts of Pakistan [13]. The effects of climate change are already evident in increased droughts, especially after 1960 [14]. Many researchers have analyzed drought trends over this region using standardized precipitation index (SPI) [3,13,15,16] and standardized precipitation evapotranspiration index (SPEI) [17] using reanalysis data. Regional drought monitoring based on the Drought severity index incorporated with MODIS (Moderate Resolution Imaging Spectroradiometer) derived normalized difference vegetation index (NDVI) was carried out over Pakistan [18]. To our knowledge, future drought projections based on Coordinated Regional Climate Downscaling Experiment South Asia (CORDEX-SA) simulation results are not currently available.
This study aims to analyze historical and to project the drought characteristics (frequency, severity, intensity, peak, and duration) for Balochistan Province, Pakistan using the bias-corrected MPI-ESM-LR_RCA4 (Max Planck Institute Earth System Model, low resolution, Rossby Centre regional atmospheric climate model) RCM from CORDEX-SA data. This analysis is carried out using the standardized precipitation index (SPI) for the historical (1951-2005) and two RCP scenarios (RCP 4.5 and RCP 8.5) for the period of seventy-five years (2026-2100). This research will help water resources managers and policymakers use adaptive water management strategies to respond to climate change in this region.
2. Methodology
2.1. Study Area
Balochistan is mountainous, dry, and the largest province of Pakistan. It covers about 44 percent of the total area of Pakistan, and includes 80 percent hills and 20 percent plains [19]. The province is located at 24oN to 32oN latitudes and 60oE to 71oE longitudes, as shown in Figure 1. This region receives a significant amount of precipitation in both the winter and summer seasons as snow and rainfall. The average yearly precipitation ranges from 200 mm to 350 mm, with large spatial variations in the province. Its southwest parts receive average yearly precipitation of 39 mm, whereas its northern region receives 439 mm of precipitation [15]. Balochistan comprises an extensive basin of rough land divided into several plateaus. The province is divided into four geographical zones: Upper Highlands, Lower Highlands, Plains, and Deserts [16]. Balochistan has semi-arid to hyperarid climates. The climate in the upper highlands has cold winters and mild summers. In lower highlands, winters vary from very cold to mild, while in plain areas, the summers are very hot, and winters are mild, with temperatures not falling below the freezing point [15]. The province has two main seasons, winter, and summer. The duration of these seasons is shown in Table 1.
2.2. Dataset
A long-term dataset of precipitation is required to get more reliable drought projections. For this purpose, the precipitation data based on daily time series for the historical period of 55 years, i.e., from 1951 to 2005, and for the future period of 75 years, i.e., from 2026 to 2100, is collected from the Coordinated Regional climate Downscaling Experiment for South Asia (CORDEX-SA) platform for the regional climate model (RCM), MPI-ESM-LR_RCA4. This RCM from the CORDEX-SA is selected for this study after all the dynamically downscaled climate projections available for our domain were checked [21] under various scenarios. They found MPI-ESM-LR_RCA4 performing better for the upper parts of the Indus Basin. The future dataset is obtained for two representative concentration pathway (RCP) scenarios, i.e., RCP 4.5 and RCP 8.5. A detailed schematic diagram showing the methodological framework is given in Figure 2.
The CORDEX-SA data is interpolated at twelve precipitation gauging stations (Table 2) operated by Pakistan Meteorological Department (PMD). These station points are analyzed for the further calculation of drought characteristics. The precipitation data obtained from RCMs still contains biases due to their coarser resolutions and cannot be directly used for modeling unless some bias correction is done [22]. The bias in the obtained RCM data was corrected using the APHRODITE (Asian Precipitation - Highly-Resolved Observational Data Integration towards Evaluation) dataset by the distribution Mapping Method.
2.3. Standardized Precipitation Index (SPI)
Different indices are available for the analysis of droughts. In this research standardized precipitation index (SPI) is used to estimate the drought characteristics. An analysis by [24] suggests that Pakistan's drought situation may be effectively tracked through the SPI. The SPI designed to be related to probability, and to be normally distributed; it can be used to monitor wet as well as dry periods [23]. SPI can be used in semi-arid, dry sub-humid, and semi-humid climate regions for drought monitoring, where there is variation in seasonal or yearly precipitation series [25]. Standardized precipitation is the difference in precipitation from the mean (for a specified period) divided by the standard deviation, i.e., mean and standard deviation are determined from previous records [23]. In this work, 3-month SPI is used on the historical and future periods that frequently experience drought events. The specified ranges of SPI values, along with their category, are shown in Table 3. The positive values of SPI show the wet conditions and the negative SPI values show the drought conditions.
Where, X = Precipitation at a station
Xm = Mean precipitation
σ = Standard deviation

Table 3.
SPI value ranges for different categories [23].
Table 3.
SPI value ranges for different categories [23].
| SPI | SPI category |
|---|---|
| ≥ 2.00 | Extremely wet |
| 1.50 to 1.99 | Severely wet |
| 1.00 to 1.49 | Moderately wet |
| 0 to 0.99 | Mildly wet |
| -0.99 to 0 | Mild drought |
| -1.49 to -1.00 | Moderate drought |
| -1.99 to -1.50 | Severe drought |
| ≤ -2.00 | Extreme drought |
2.4. Drought Characteristics
Drought parameters -- drought event numbers, duration, intensity, severity, and peak – were calculated from the SPI values. A drought event was defined to start when the SPI reaches a value of -1.0 or less. It ends with a positive SPI value [23]. Drought duration is the length of a drought event in months from the beginning of an event till the end. Drought severity is the sum of the SPI values of dry periods. Drought intensity is the ratio of drought severity to the drought duration of an event, while the drought peak is the lowest value of the index in an event.
where, j=Starting month of an event
n=Ending month on an event
Drought Intensity =
3. Results and Discussion
The results revealed that all the stations had experienced drought conditions in the past with variable intensity. However, the stations in northern Balochistan (NB) have experienced more severe and intense droughts than southern Balochistan (SB). Moreover, the NB region has faced more drought events with higher peaks, as shown in Figure 3. This is also evident from a related study [14], in which they found that the most severe and intense drought with maximum peak took place in zone-5 of the Balochistan, which lies in the north region of Balochistan.
The results projected that most drought characteristics could even worsen in the future under both scenarios (Figure 3). Relative to the historical period (1951-2005), drought severity, intensity, and peak are projected to decrease in NB under both RCP scenarios, while drought intensity and peak are projected to increase in future under RCP 8.5. Also, drought events are projected to increase in both future scenarios with reference to historical period. Under both RCP scenarios, drought severity, intensity, and peak are projected to increase in the NB region than SB region. However, the number of drought events in NB is projected to be the same as in the SB under both RCP scenarios. However, the model projected a decrease in the drought severity in the SB region under both scenarios.
The Mann-Kendall (MK) trend test [26], also known as Kendall's rank correlation test, is a non-parametric statistical method used to determine if there is a monotonic trend (either increasing or decreasing) present in a time series dataset. It is commonly employed in environmental sciences, hydrology, climatology, and other fields where analyzing trends over time is crucial [27,28,29]. The MK test is related to calculating the Kendall tau rank correlation coefficient, which examines the strength of the relationship between two variables. The steps to conduct the MK test include computing the Kendall tau rank correlation coefficient, evaluating the standard normal test statistic (Z) for the rank correlation coefficient, calculating the p-value of the test statistics by utilizing a normal distribution, and checking if the p-value is less than the significance level (commonly 0.05). The p-value less than the significance level is evidence of a trend in the time series. In this research study the MK test is applied to Historical, RCP 4.5, and RCP 8.5 over 12 stations in the Balochistan province of Pakistan as shown in Table 4. It can be inferred from the MK test that the Gawadar station experienced a statistically significant trend in terms of intensity and peak, and Lasbella and Uthal stations experienced a statistically significant trend in terms of SPI, in the past. Nokkundi station under RCP 4.5 and Lasbella, Turbat, Uthal, and Gwadar stations under RCP 8.5 are projected to experience statistically significant trend in terms of SPI. However, for the Uthal station, severity and peak were also statistically significant under historical droughts.
The station-wise comparison showed mixed results regarding projecting drought duration under both scenarios (see Figure 4 and Figure 5). At the four stations (Zhob, Quetta, and Dalbandin), the drought duration is projected to increase under both scenarios with reference to the historical period. However, under both RCP scenarios, the drought duration is projected to decrease at eight stations (Barkhan, Kalat, Nokkundi, Khuzdar, Lasbella, Turbat, Uthal, and Gwadar). Only one station (Zhob) shows that the drought duration is projected to increase (decrease) in the future under RCP 4.5 (RCP 8.5). In addition, the Turbat station showed a higher average drought duration (5 months) in the historical period.
The station-wise comparison showed that drought events are projected to increase at all stations under both scenarios w.r.t the historical period (Figure 6 and Figure 7). Under RCP 4.5, the drought events are projected to increase at Quetta, Kalat, Panjgur, Turbat, Uthal, and Gwadar stations. Moreover, under RCP 8.5, the drought events are projected to increase at Zhob, Barkhan, Nokkundi, Dalbandin, Khuzdar, and Lasbella stations. In addition, the number of drought events is indirectly proportional to the duration at all stations. As the number of drought events increases, the drought duration decreases and vice versa. This makes sense because the total number of drought months is limited to a certain range by the normal distribution of SPI. For example, Turbat station has a lower number of drought events with a higher duration during the historical period.
The drought severity plots showed that at four stations (Zhob, Quetta, Nokkundi, and Dalbandin), the drought severity is projected to increase under both scenarios with reference to the historical period (Figure 8 and Figure 9). Moreover, the drought severity is projected to increase (decrease) under RCP 4.5 (RCP 8.5) at Zhob station. However, drought severity is projected to decrease under both scenarios at Barkhan, Kalat, Panjgur, Lasbella, Turbat, Uthal, and Gwadar stations. Moreover, Dalbandin and Nokkundi stations experienced the most severe drought events in the past as highlighted in a related study [17]. They found that Turbat, Panjgur, Dalbandin, and Nokkundi suffered extreme drought severity in the past. However, it is projected that Zhob stations could get more severe droughts, and Quetta, Nokkundi, and Dalbandin stations could get less severe droughts in the future under RCP 4.5, and vice versa under RCP 8.5. In addition, Panjgur station is projected to face more severe droughts, and Uthal station is projected to face less severe droughts in the future under RCP 8.5.
The drought intensity plots (Figure 10 and Figure 11) showed the drought intensity was higher at Zhob, Barkhan, Quetta and Kalat stations during the reference period (1951-2005). These findings are consistent with a related study [14], wherein they found the most intense drought event had occurred in zone-5 in which Quetta station lies. In addition, it was found out in a previous study that the Barkhan station experienced more intense droughts in the past [3]. The drought intensity is projected to increase at three stations (Quetta, Nokkundi, and Gwadar) under both scenarios with reference to the historical period.
Moreover, only two stations (Zhob and Lasbella) showed that drought intensity is projected to increase (decrease) under RCP 4.5 (RCP 8.5). However, five stations (Barkhan, Kalat, Khuzdar, Panjgur, and Turbat) showed a decrease in the drought intensity under both scenarios. Additionally, Zhob, Quetta, Nokkundi, Dalbandin, Lasbella, Uthal, and Gwadar stations are projected to have more intense droughts under RCP 4.5. In addition, Quetta, Nokkundi, Dalbandin, Uthal, and Gwadar stations are projected to have more intense droughts under RCP 8.5. The drought peak plots (Figure 12 and Figure 13) showed that higher drought peaks were recorded at Barkhan, Kalat, Khuzdar, Panjgur and Turbat stations during the reference period (1951-2005). The results are consistent with a previous study [3] in which they also found that the drought with a higher peak appeared at Barkhan in 2001-2002. In addition, the drought peaks are projected to increase under both scenarios at six stations (Quetta, Nokkundi, Dalbandin, Lasbella, Uthal, and Gwadar). Moreover, only one station (Zhob) shows that the drought peaks are projected to increase (decrease) under RCP 4.5 (RCP 8.5). The results show that Zhob and Kalat stations experienced more drought peaks in the past. Moreover, Zhob, Quetta, Nokkundi, Dalbandin, Lasbella, Uthal, and Gwadar stations are projected to have more drought peaks under both future scenarios with reference to the historical period.
4. Conclusion
This study aimed to analyze the historical and future drought characteristics in the Balochistan province of Pakistan using Standardized Precipitation Index. The analysis involves precipitation data obtained from the platform of CORDEX-SA for historical (1951-2005) and future (2026-2100) data under two RCP scenarios (RCP 4.5 and RCP 8.5). The future model MPI-M-MPI-ESM-LR_RCA4 was used in this study. For analysis purposes, we divided the whole of Balochistan into two parts (i.e., northern Balochistan (NB) and southern Balochistan (SB)). In addition, we analyzed drought characteristics at each station. The following are the major conclusions of this study:
- All stations experienced numerous drought conditions in different years and are likely to suffer moderate, severe, and extremely dry conditions, in the future under both scenarios.
- The stations in the NB region faced higher droughts in the historical period. Moreover, droughts are projected to increase in the future under both scenarios. It shows that the drought characteristics (severity, intensity, and peaks) are projected to be more in the NB region under both scenarios.
- The drought duration seems to be reduced with an increase in the number of drought events and vice versa in the whole region.
- At most stations, the average drought duration for historical and future scenarios is calculated as 3-5 months.
In this research, bias-corrected and downscaled data of MPI-M-MPI-ESM-LR_RCA4 climate model from CORDEX-SA experiments was used. Adding as many models as possible based on the available computational resources is suggested, which will give more reliable projections. In addition, more updated models’ output is now officially available, known as CMIP6 (Coupled Model Intercomparison Project) which, particularly as downscaled by CORDEX, could be used in the future relevant to drought or other hydrological studies.
Author Contributions
“All authors contributed to the study conception and its design. NI, GHD, and KA performed material preparation, data collection, and analysis. NI wrote the first draft of the manuscript. MA performed trend analysis. NYK thoroughly analyzed and assisted in manuscript preparations. All authors commented on previous versions of the manuscript. All authors read and approved the final manuscript.”
Funding
“The authors declare this research received no external funding”.
Conflicts of Interest
"The authors declare no conflict of interest."
References
- GRR The Global Risks Report 2022; 2022; ISBN 9782940631094.
- Farooq, U.; Ahmad, M.; Jasra, A.W. Natural Resource Conservation, Poverty Alleviation, and Farmer Partnership. Pak. Dev. Rev. 2007, 46, 1023–1049. [CrossRef]
- Naz, F.; Dars, G.H.; Ansari, K.; Jamro, S.; Krakauer, N.Y. Drought Trends in Balochistan. Water (Switzerland) 2020, 12. [CrossRef]
- Shukla, V. Pakistan’s Alarming Water Crises: Country to Run Out of Clean Water By 2025. 2018.
- Wang, S.-Y.; Davies, R.E.; Huang, W.-R.; Gillies, R.R. Pakistan’s Two-Stage Monsoon and Links with the Recent Climate Change. J. Geophys. Res. Atmos. 2011, 116, 1–15. [CrossRef]
- Salma, S.; Rehman, S.; Shah, M.A. Rainfall Trends in Different Climate Zones of Pakistan. Pakistan J. Meteorol. 2012, 9, 37–47.
- Ullah, I.; Ma, X.; Yin, J.; Omer, A.; Habtemicheal, B.A.; Saleem, F.; Iyakaremye, V.; Syed, S.; Arshad, M.; Liu, M. Spatiotemporal Characteristics of Meteorological Drought Variability and Trends (1981–2020) over South Asia and the Associated Large-Scale Circulation Patterns. Clim. Dyn. 2022. [CrossRef]
- Iqbal, Z.; Shahid, S.; Ahmed, K.; Ismail, T.; Nawaz, N. Spatial Distribution of the Trends in Precipitation and Precipitation Extremes in the Sub-Himalayan Region of Pakistan. Theor. Appl. Climatol. 2019, 137, 2755–2769. [CrossRef]
- Dars, G.H.; Najafi, M.R.; Qureshi, A.L. Assessing the Impacts of Climate Change on Future Precipitation Trends Based on Downscaled CMIP5 Simulations Data. Mehran Univ. Res. J. Eng. Technol. 2017, 36, 385–394. [CrossRef]
- Wilhite, D.A.; Sivakumar, M.V.K.; Pulwarty, R. Managing Drought Risk in a Changing Climate: The Role of National Drought Policy. Weather Clim. Extrem. 2014, 3, 4–13. [CrossRef]
- Wilhite, D.A. Drought as a Natural Hazard: Concepts and Definitions. Droughts 2000, 33–33. [CrossRef]
- Keyantash, J. The Quantification of Drought: An Evaluation of Drought Indices. Am. Meteorol. Soc. 2002, 1167–1180.
- Lee, E.J.; Azam, M.; Rehman, S.U.; Waseem, M.; Anjum, M.N.; Afzal, A.; Cheema, M.J.M.; Mehtab, M.; Latif, M.; Ahmed, R.; et al. Spatio - Temporal Variability of Drought Characteristics across Pakistan. Paddy Water Environ. 2021. [CrossRef]
- Jamro, S.; Channa, F.N.; Dars, G.H.; Ansari, K.; Krakauer, N.Y. Exploring the Evolution of Drought Characteristics in Balochistan, Pakistan. Appl. Sci. 2020, 10. [CrossRef]
- Ashraf, M.; Routray, J.K. Spatio-Temporal Characteristics of Precipitation and Drought in Balochistan Province, Pakistan. Nat. Hazards 2015, 77, 229–254. [CrossRef]
- Ahmed, K.; Shahid, S.; Harun, S. bin; Wang, X. jun Characterization of Seasonal Droughts in Balochistan Province, Pakistan. Stoch. Environ. Res. Risk Assess. 2016, 30, 747–762. [CrossRef]
- Jamro, S.; Dars, G.H.; Ansari, K.; Krakauer, N.Y. Spatio-Temporal Variability of Drought in Pakistan Using Standardized Precipitation Evapotranspiration Index. Appl. Sci. 2019, 9. [CrossRef]
- Haroon, M.A.; Zhang, J.; Yao, F. Drought Monitoring and Performance Evaluation of MODIS-Based Drought Severity Index ( DSI ). Nat. Hazards 2016, 84, 1349–1366. [CrossRef]
- Bibi, T.; Ahmad, M.; Bakhsh Tareen, R.; Mohammad Tareen, N.; Jabeen, R.; Rehman, S.U.; Sultana, S.; Zafar, M.; Yaseen, G. Ethnobotany of Medicinal Plants in District Mastung of Balochistan Province-Pakistan. J. Ethnopharmacol. 2014, 157, 79–89. [CrossRef]
- Khan, S.; Shahab, S.; Fani, M.I.; Wahid, A.; Hassan, M.; Khan, A. Climate and Weather Condition of Balochistan Province Pakistan Climate and Weather Condition of Balochistan Province , Pakistan. Int. J. Econ. Environ. Geol. 2021, 12, 65–71.
- Khan, A.J.; Koch, M. Selecting and Downscaling a Set of Climate Models for Projecting Climatic Change for Impact Assessment in the Upper Indus Basin ( UIB ). 2018. [CrossRef]
- Sharma, D.; Gupta, A. Das; Babel, M.S. Spatial Disaggregation of Bias-Corrected GCM Precipitation for Improved Hydrologic Simulation: Ping River Basin, Thailand. Hydrol. Earth Syst. Sci. 2007, 11, 1373–1390. [CrossRef]
- Mckee, T.B.; Doesken, N.J.; Kleist, J. The Relationship of Drought Frequency and Duration to Time Scales. 1993, 17–22.
- Adnan, S.; Ullah, K.; Shuanglin, L.; Gao, S.; Khan, A.H.; Mahmood, R. Comparison of Various Drought Indices to Monitor Drought Status in Pakistan. Clim. Dyn. 2018, 51, 1885–1899. [CrossRef]
- Turkes, M.; Tath, H. Use of the Standardized Precipitation Index (SPI) and a Modified SPI for Shaping the Drought Probabilities over Turkey. Int. J. Climatol. 2009, 29, 2270–2282. [CrossRef]
- Mann, H.B. NONPARAMETRIC TESTS AGAINST TREND1 By HENRY B. MANN. 2013, 13, 245–259.
- Golian, S.; Mazdiyasni, O.; Aghakouchak, A. Trends in Meteorological and Agricultural Droughts in Iran. 2015, 679–688. [CrossRef]
- Wang, Y.; Liu, X.; Ren, G.; Yang, G.; Feng, Y. Agricultural and Forest Meteorology Analysis of the Spatiotemporal Variability of Droughts and the e Ff Ects of Drought on Potato Production in Northern China. Agric. For. Meteorol. 2019, 264, 334–342. [CrossRef]
- Baig, M.R.I.; Shahfahad; Waseem Naikoo, M.; Ansari, A.H.; Ahmed, S.; Rehman, A. Spatio - Temporal Analysis of Precipitation Pattern and Trend Using Standardized Precipitation Index and Mann – Kendall Test in Coastal Andhra Pradesh. Model. Earth Syst. Environ. 2022, 8, 2733–2752. [CrossRef]
Figure 1.
Map of study area.
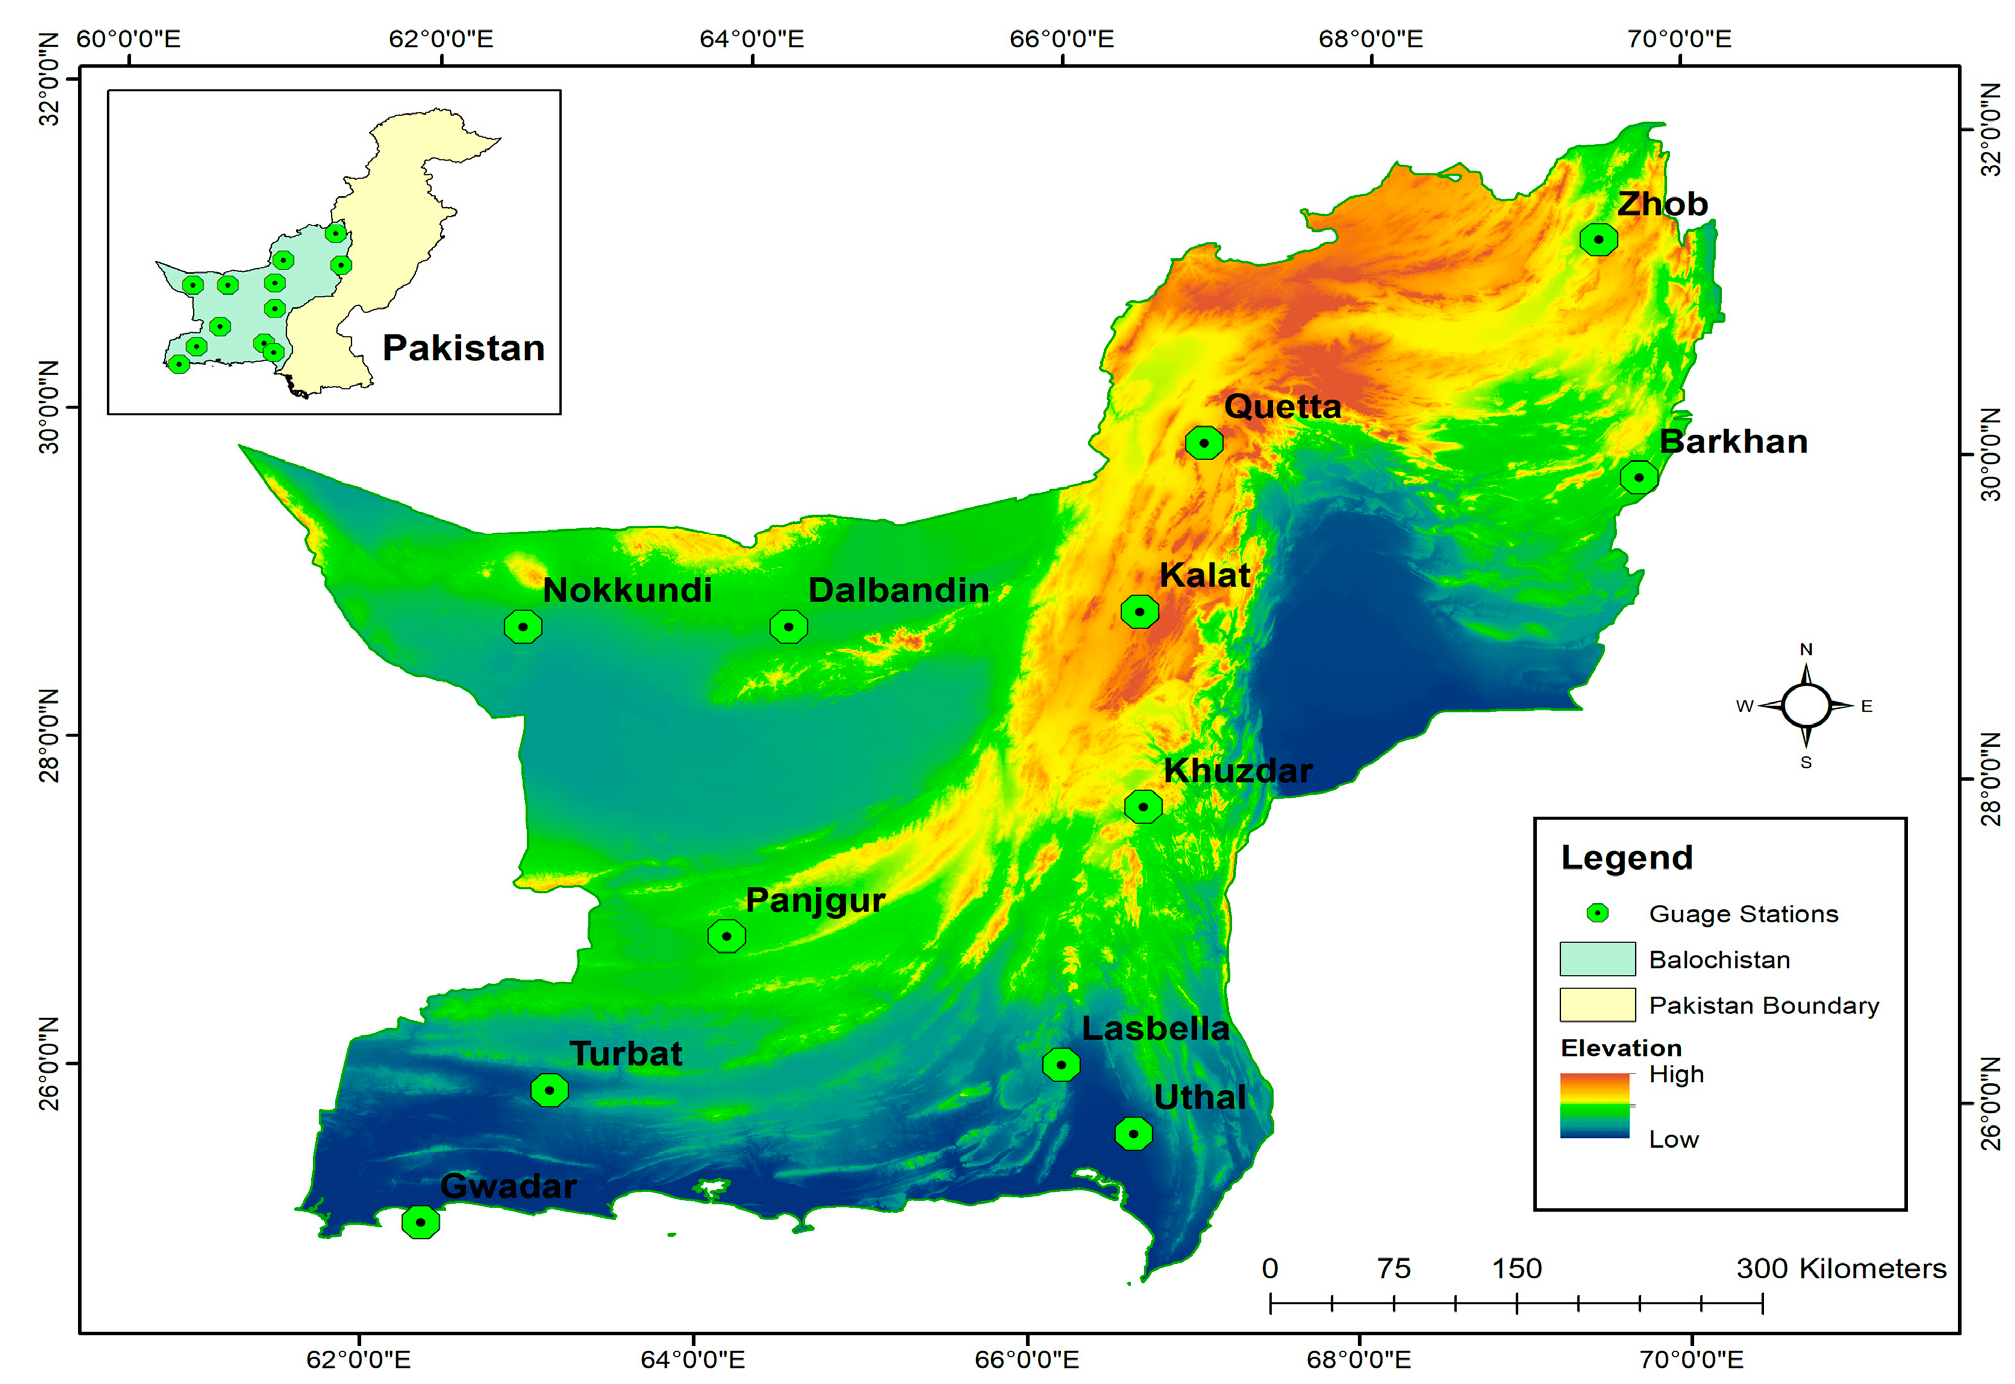
Figure 2.
Schematic diagram of methodological framework.
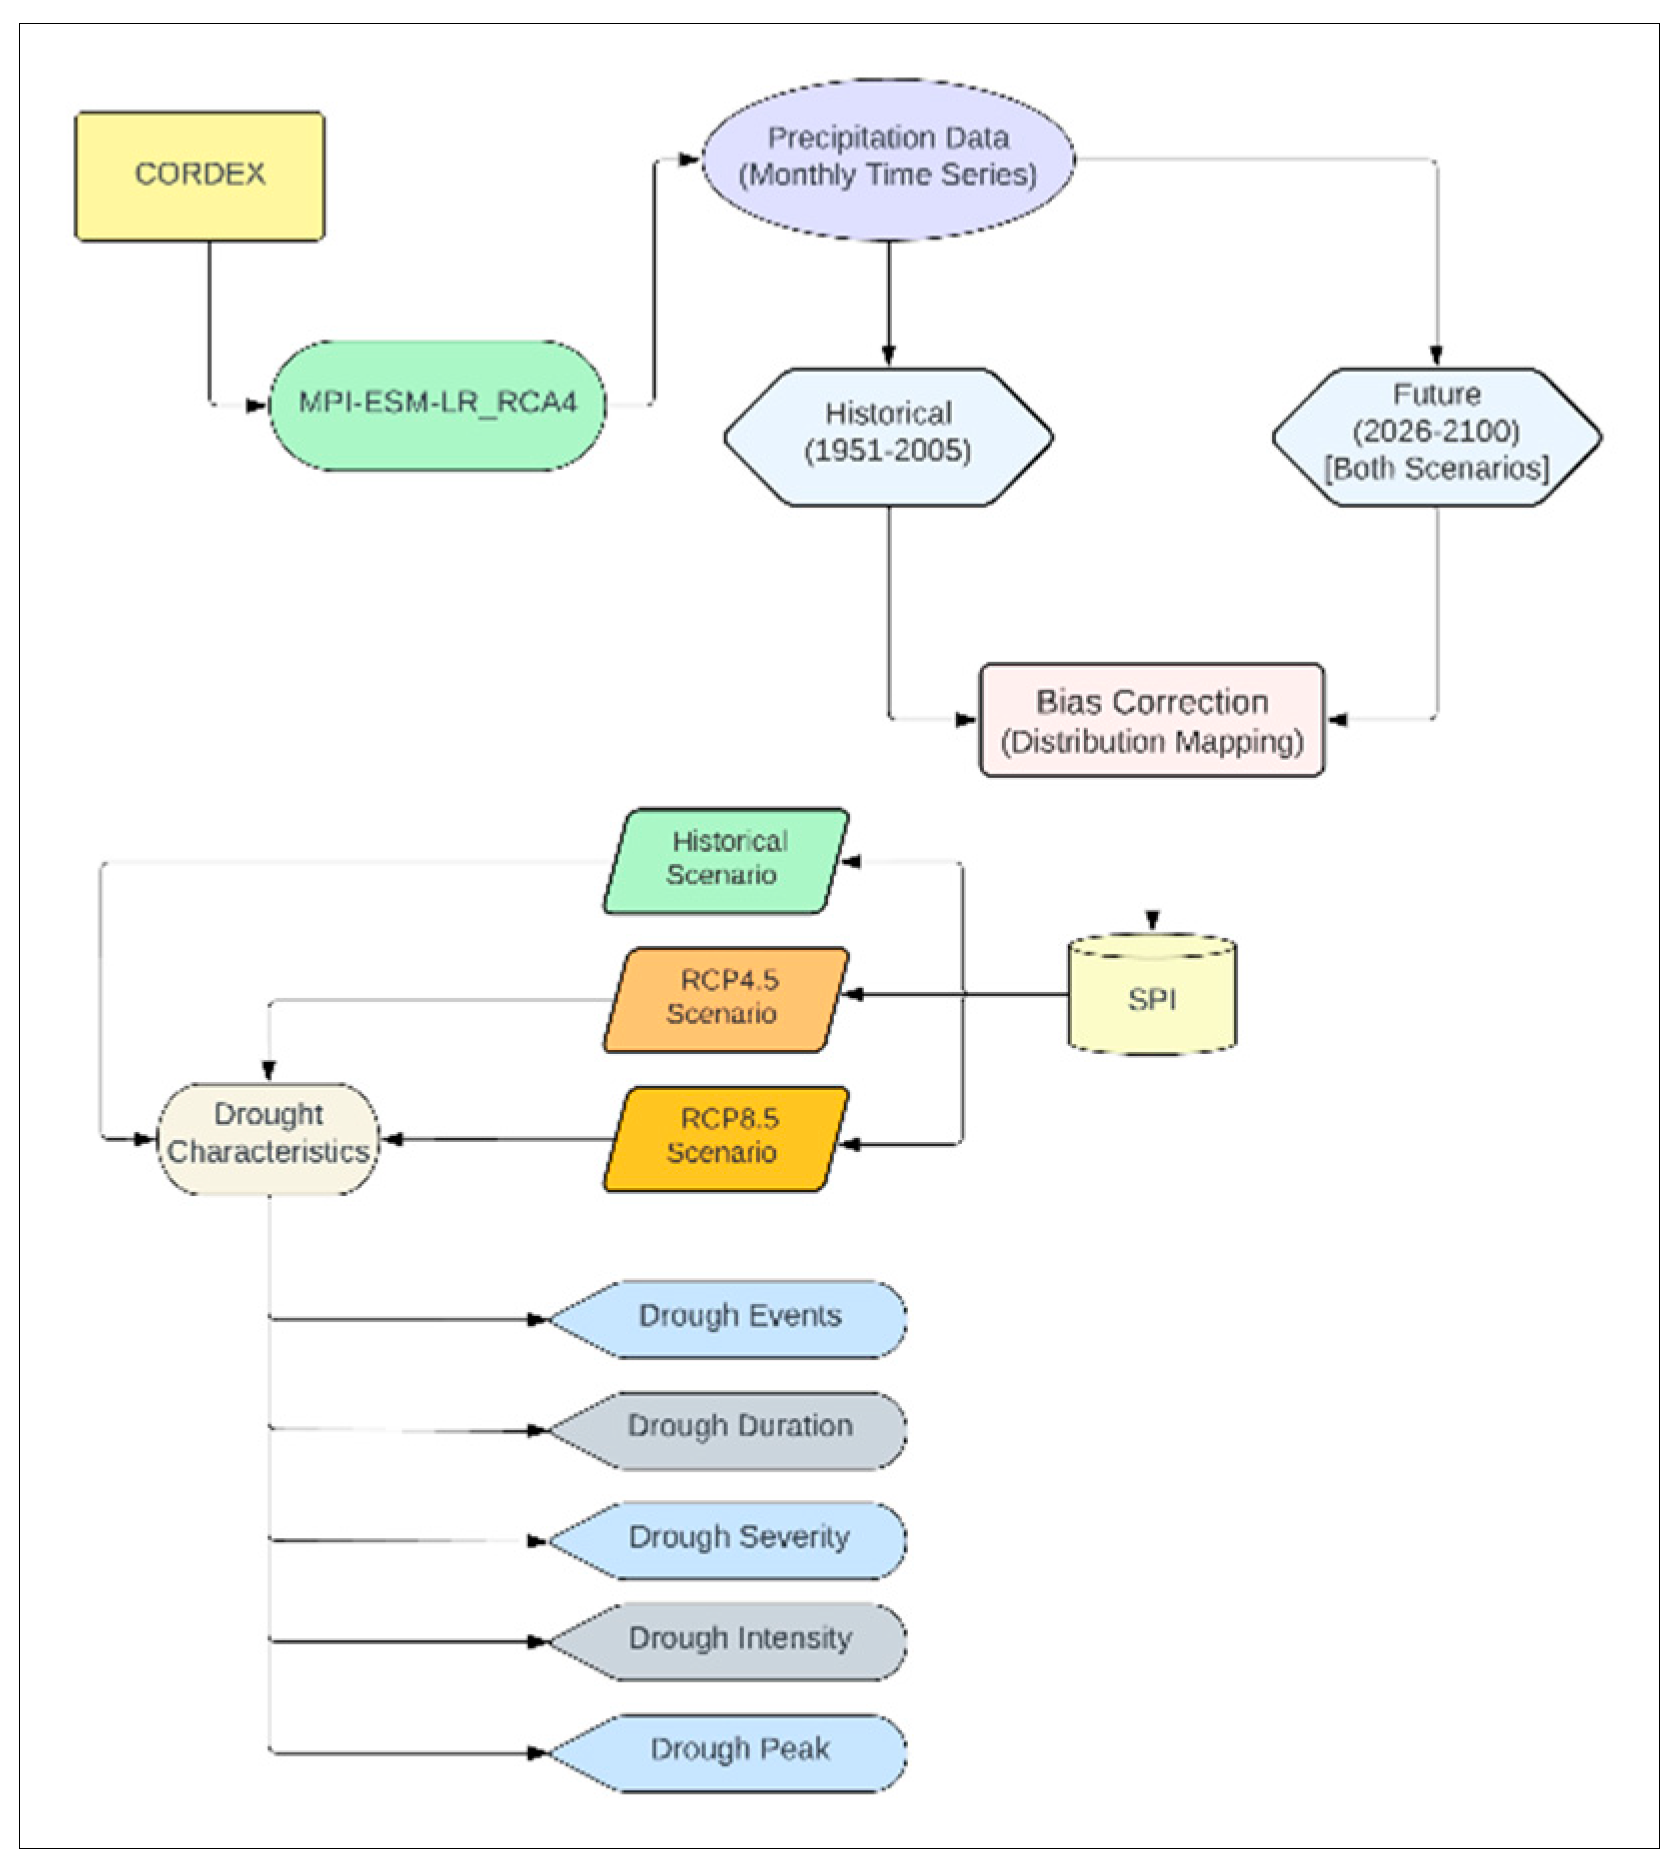
Figure 3.
Drought characteristics in northern and southern Balochistan.
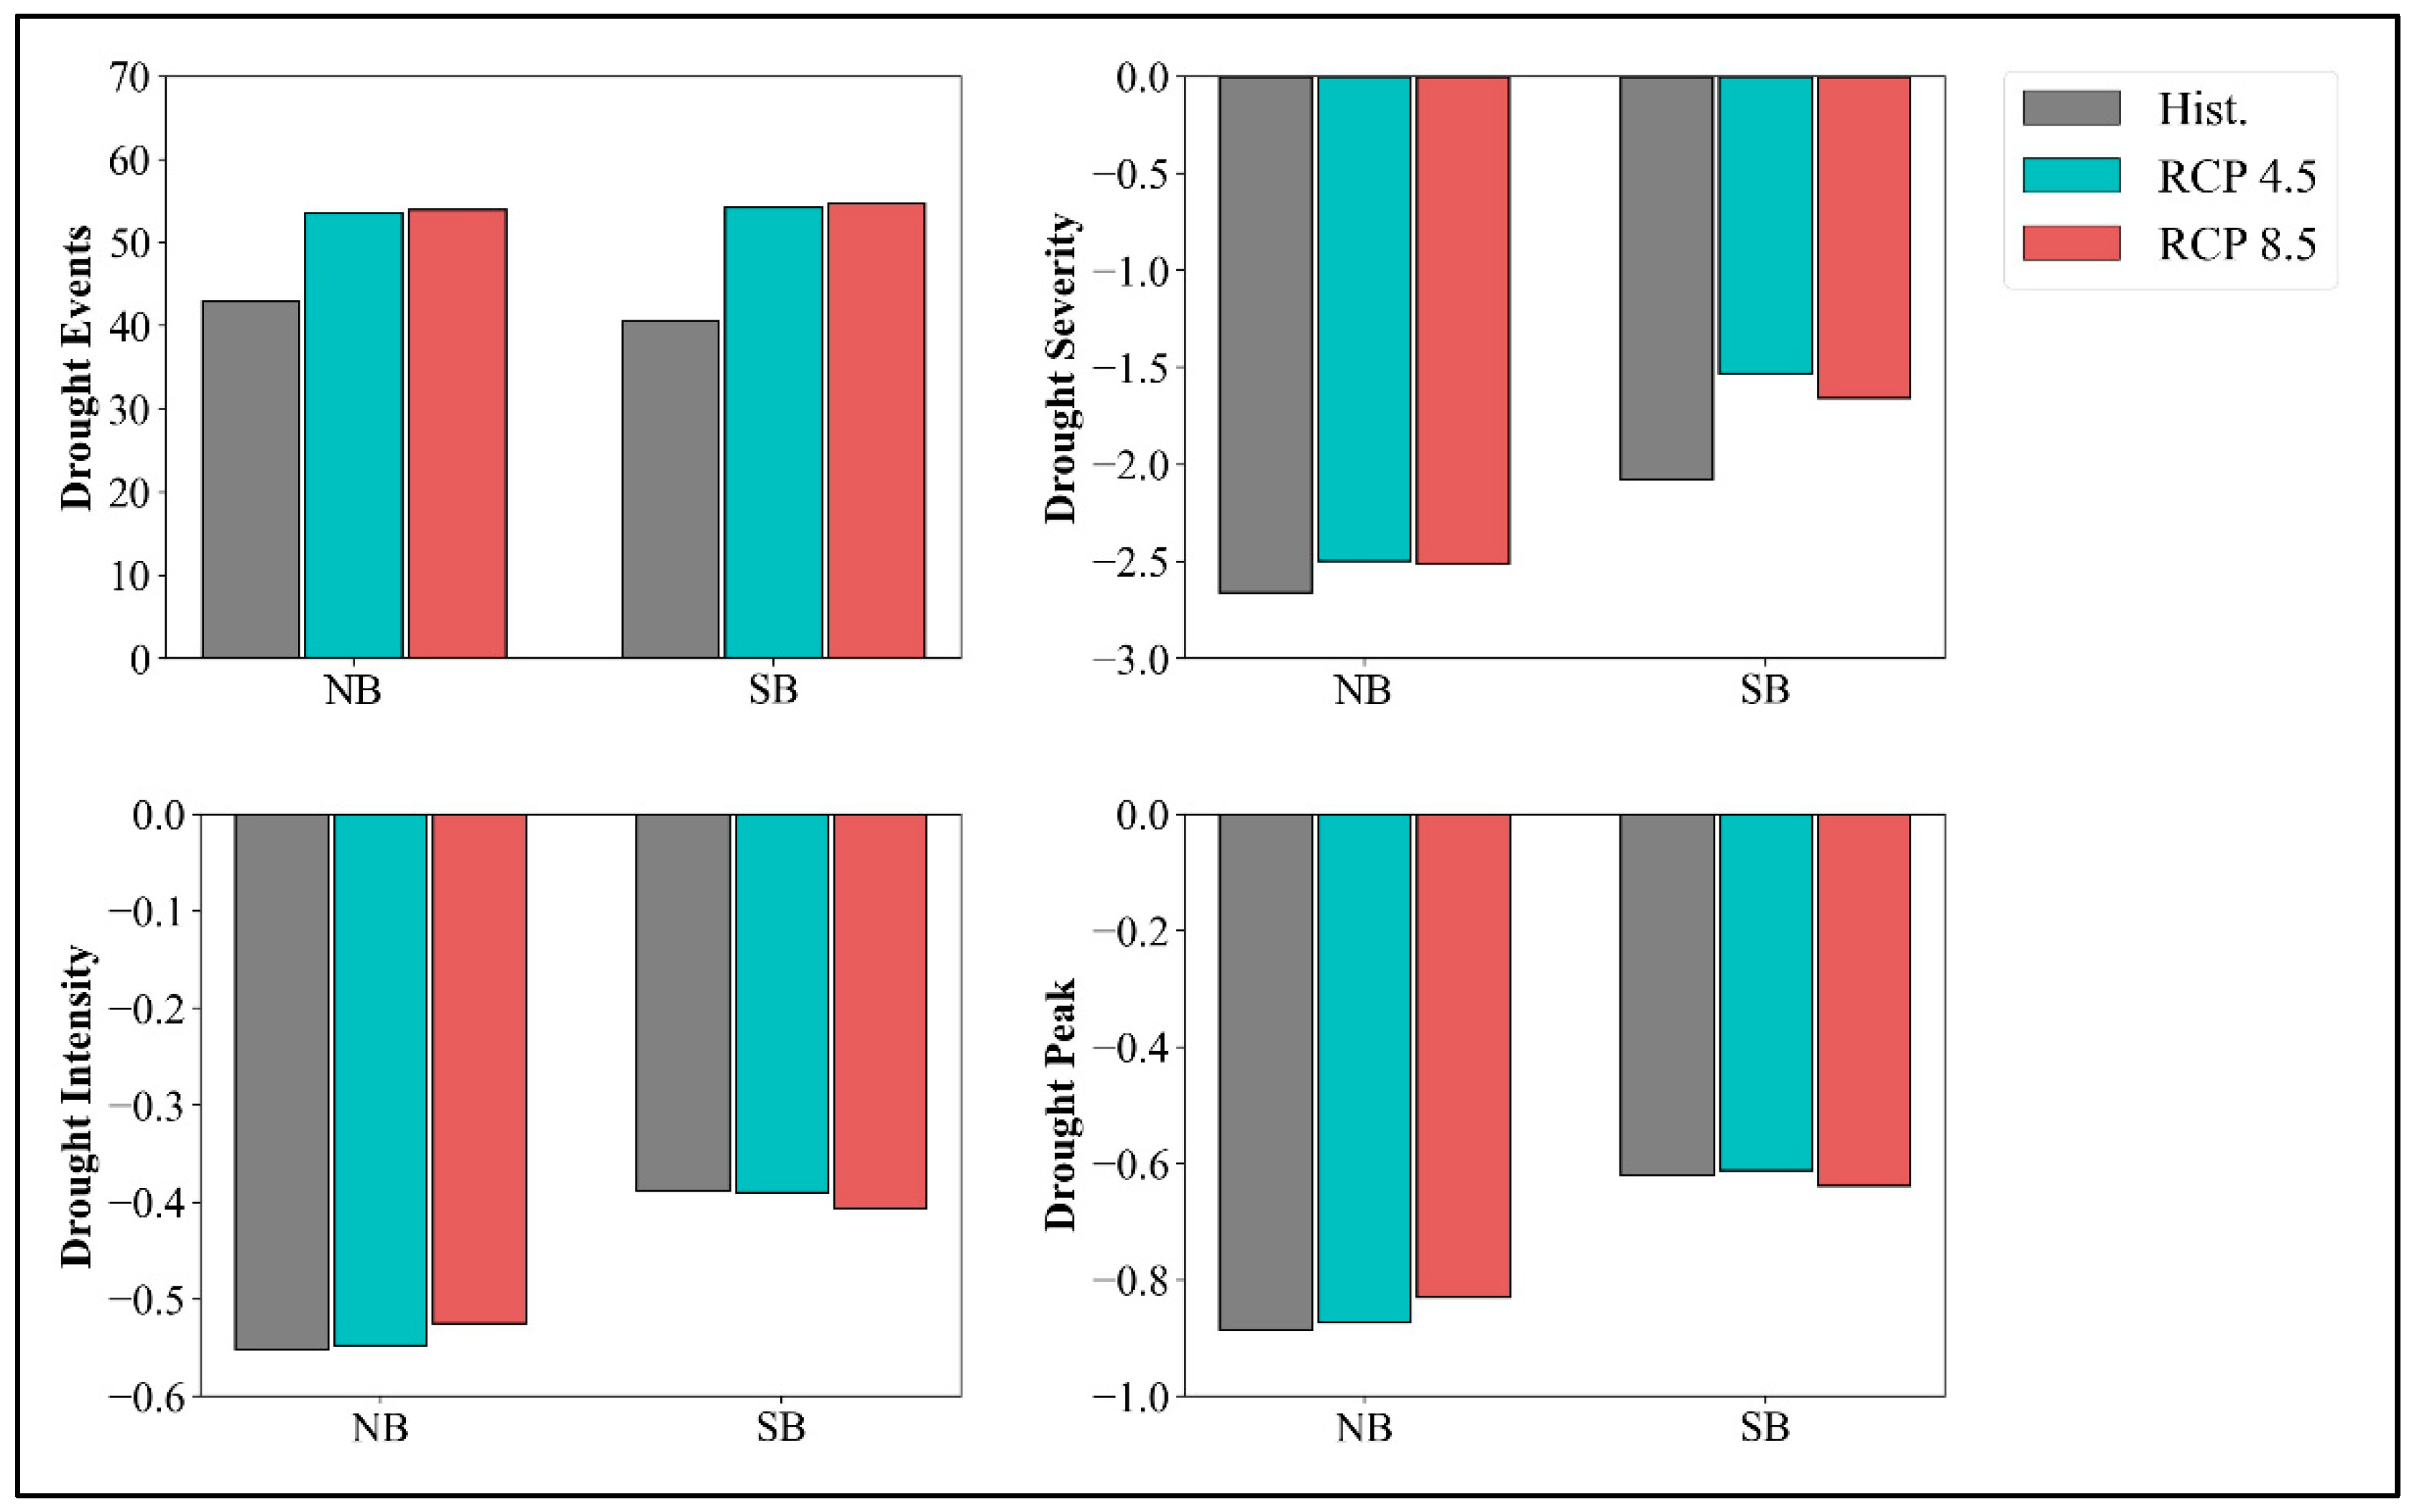
Figure 4.
Average drought duration (months) at all stations.
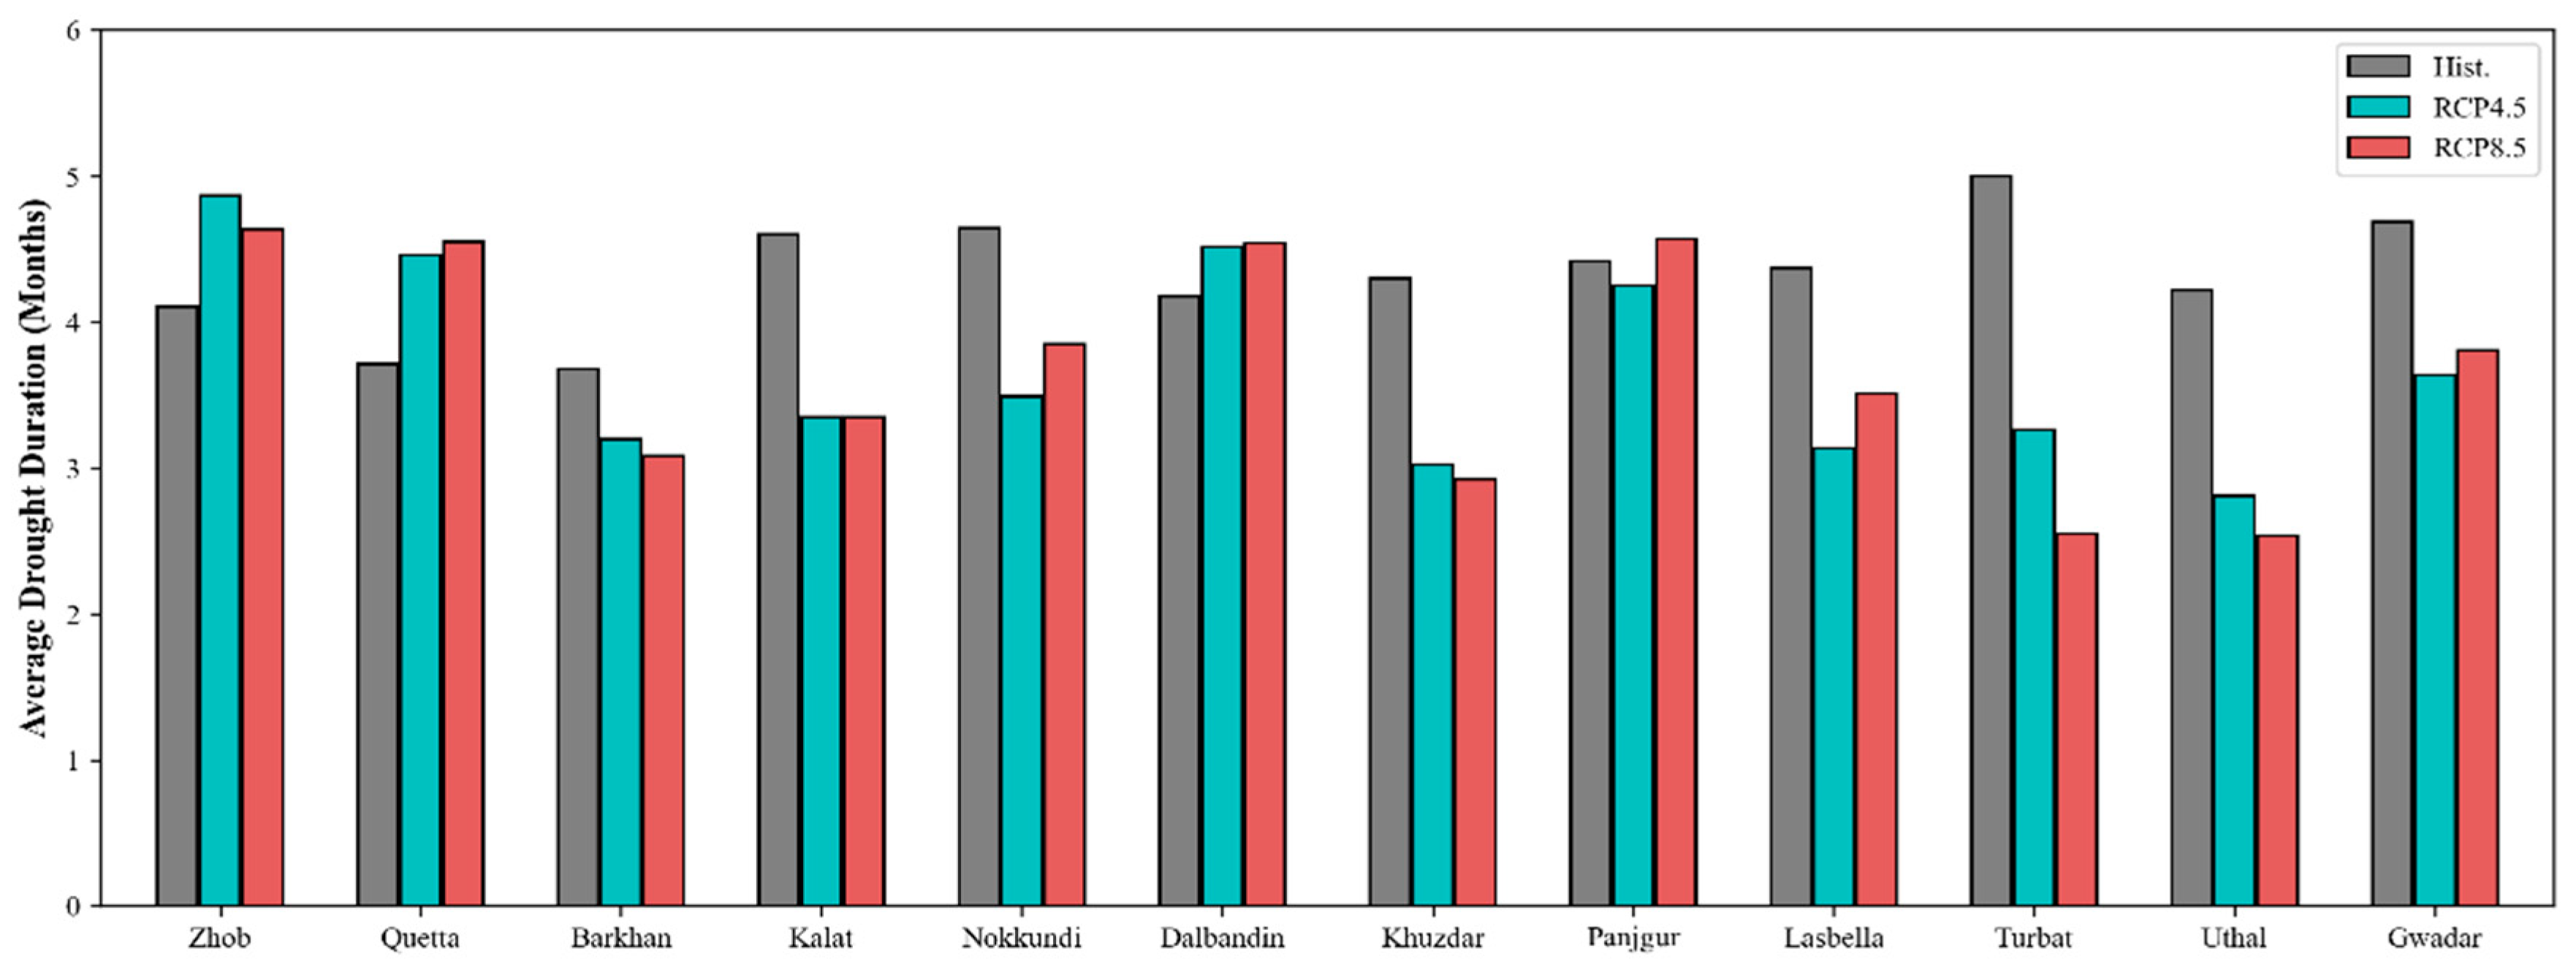
Figure 5.
Drought duration at all stations.
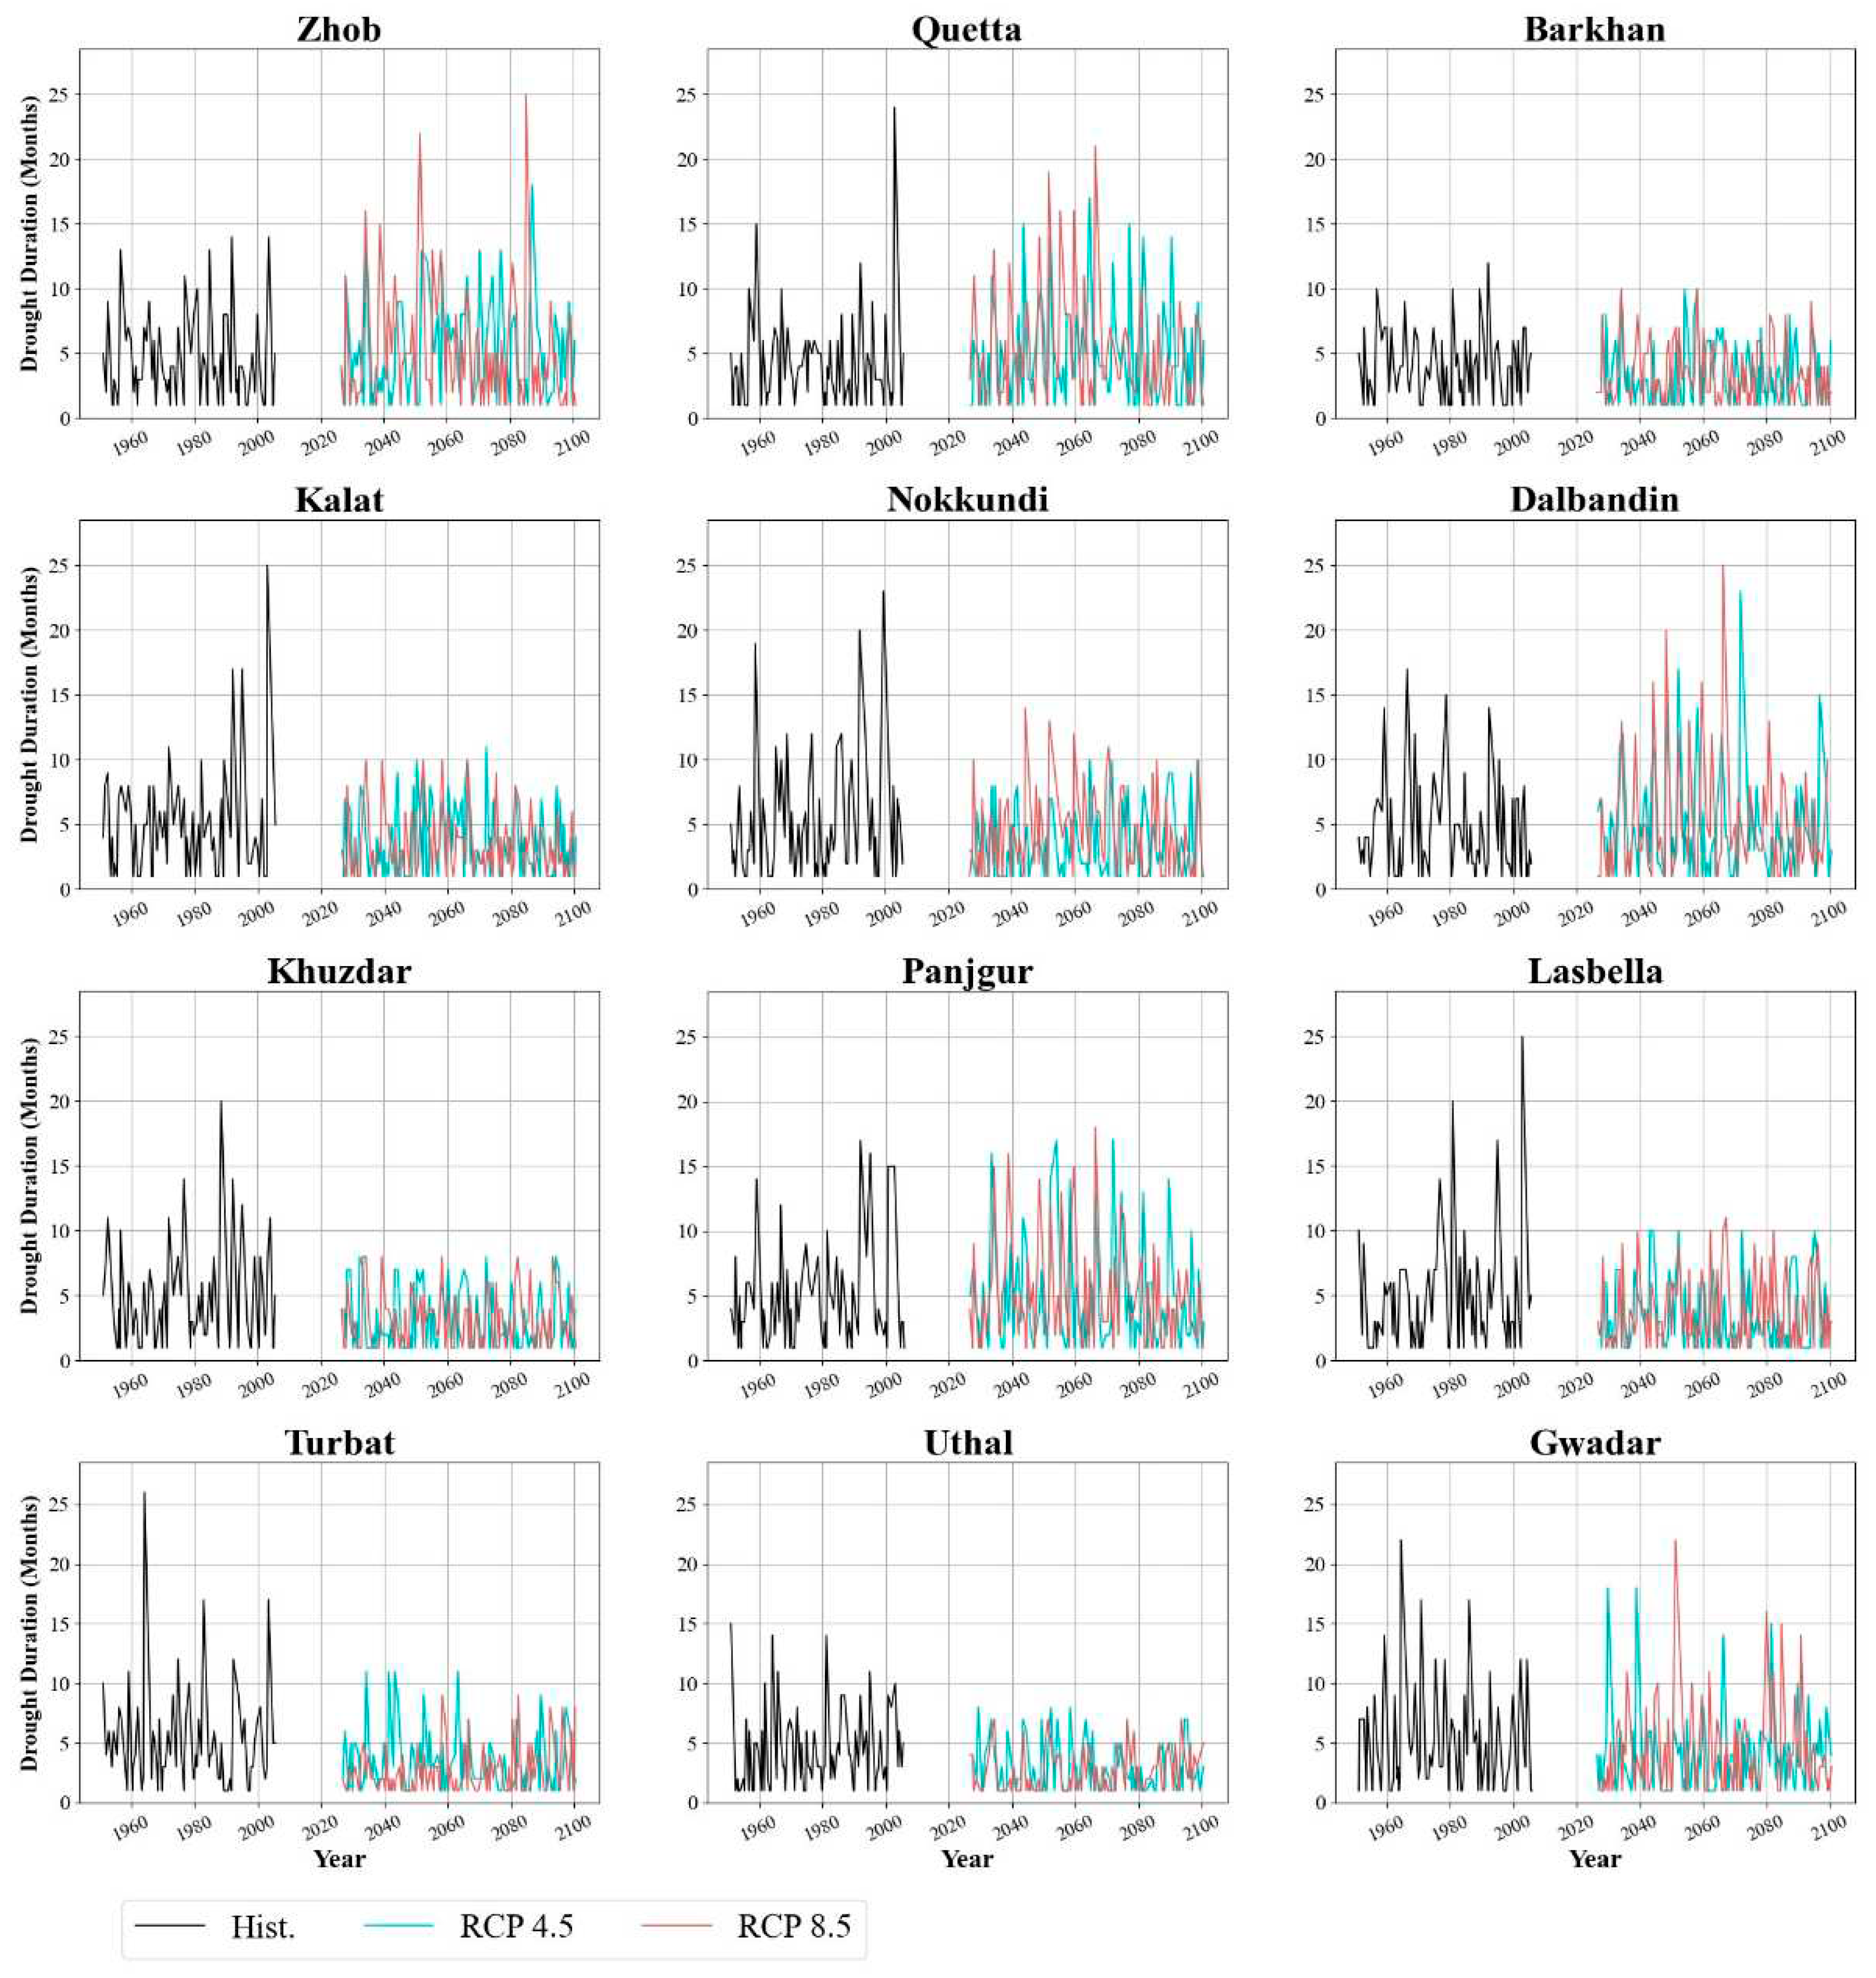
Figure 6.
Drought events at all stations.
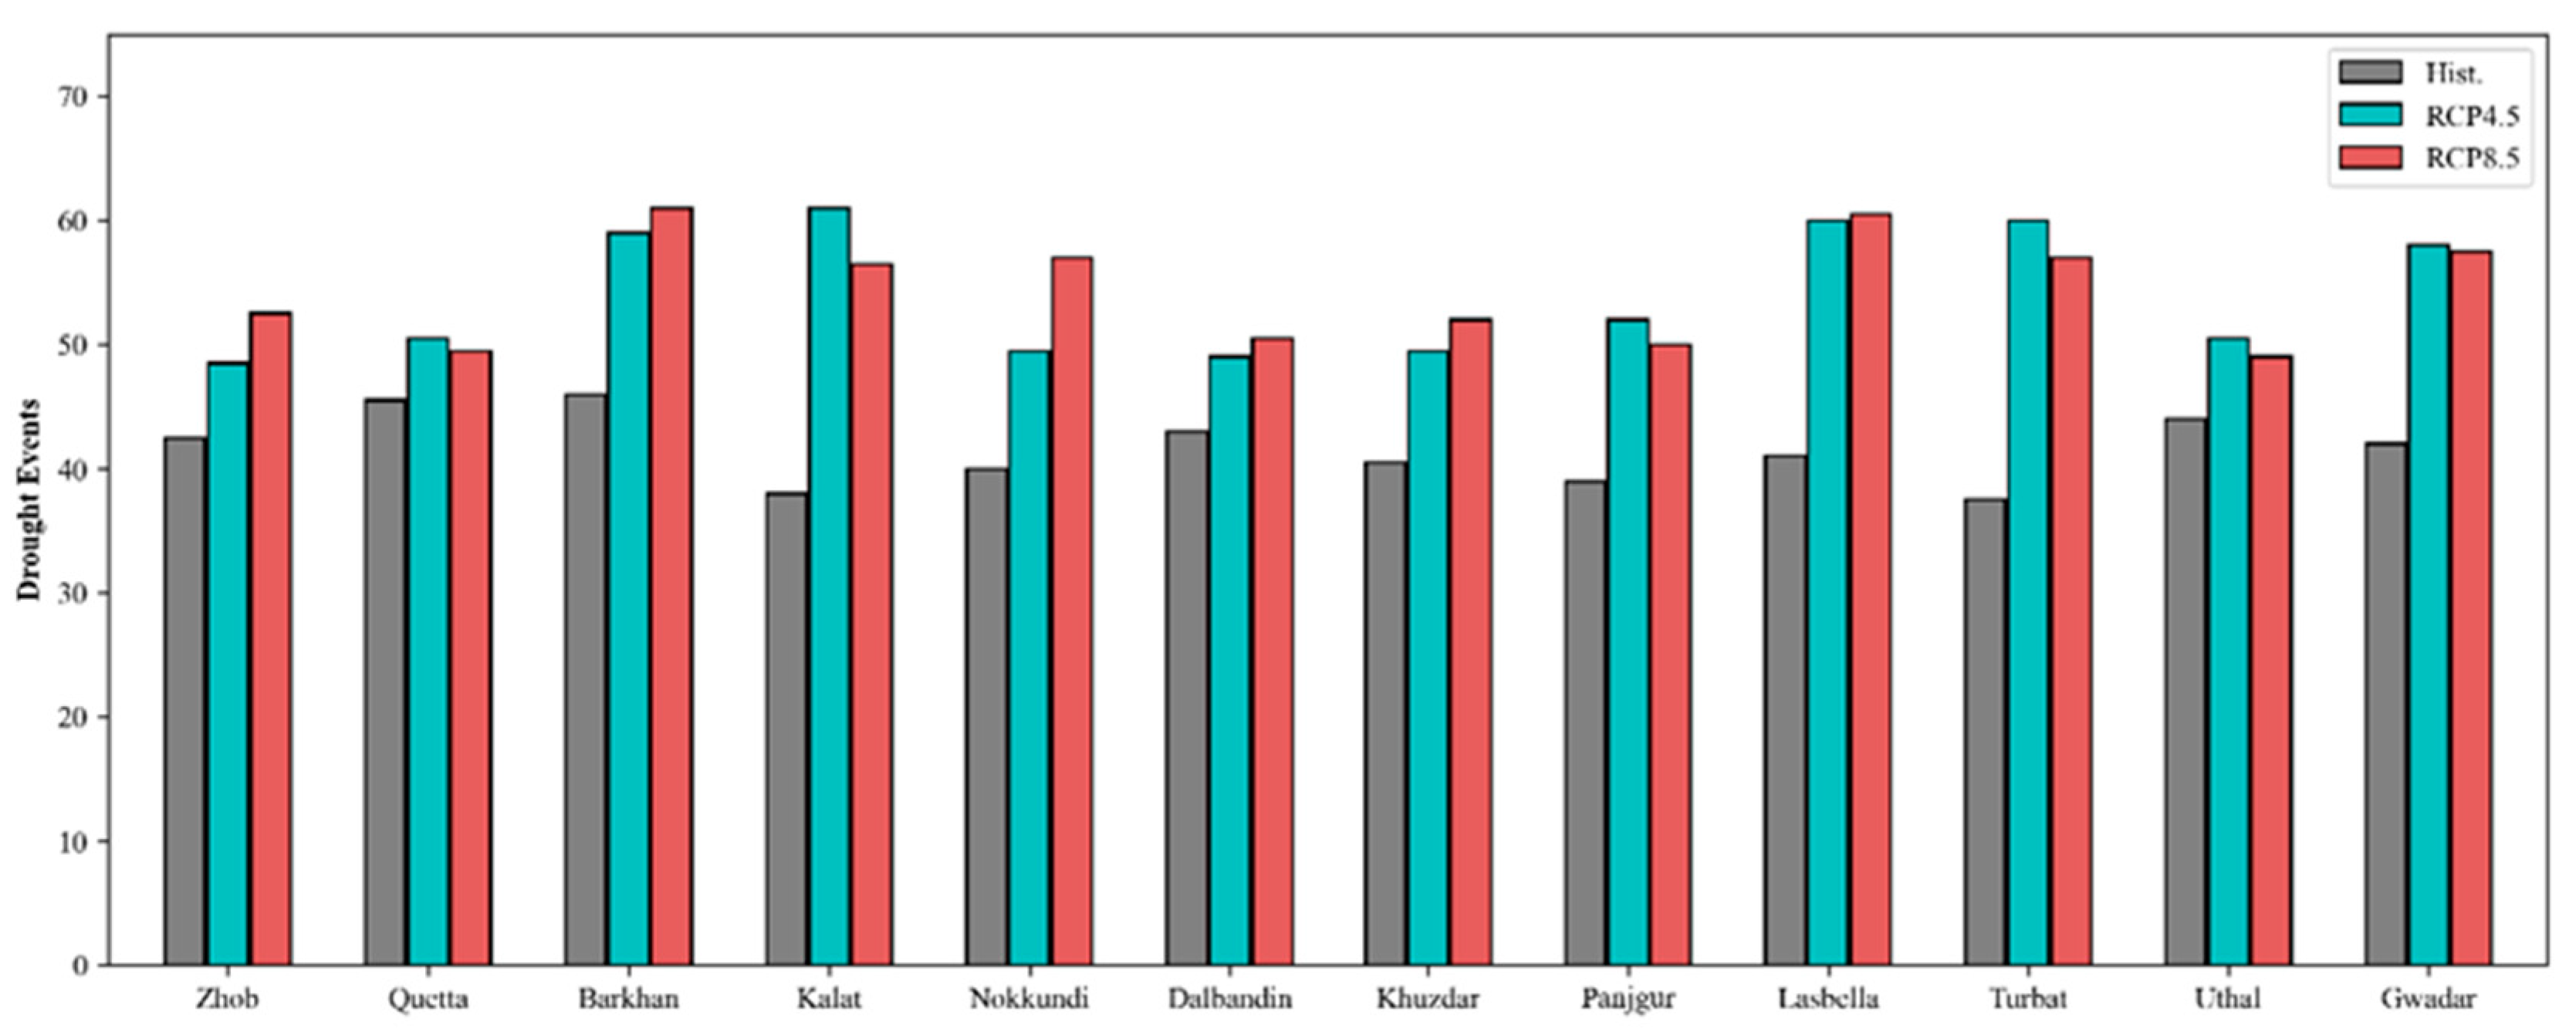
Figure 7.
Spatial distribution of drought events.
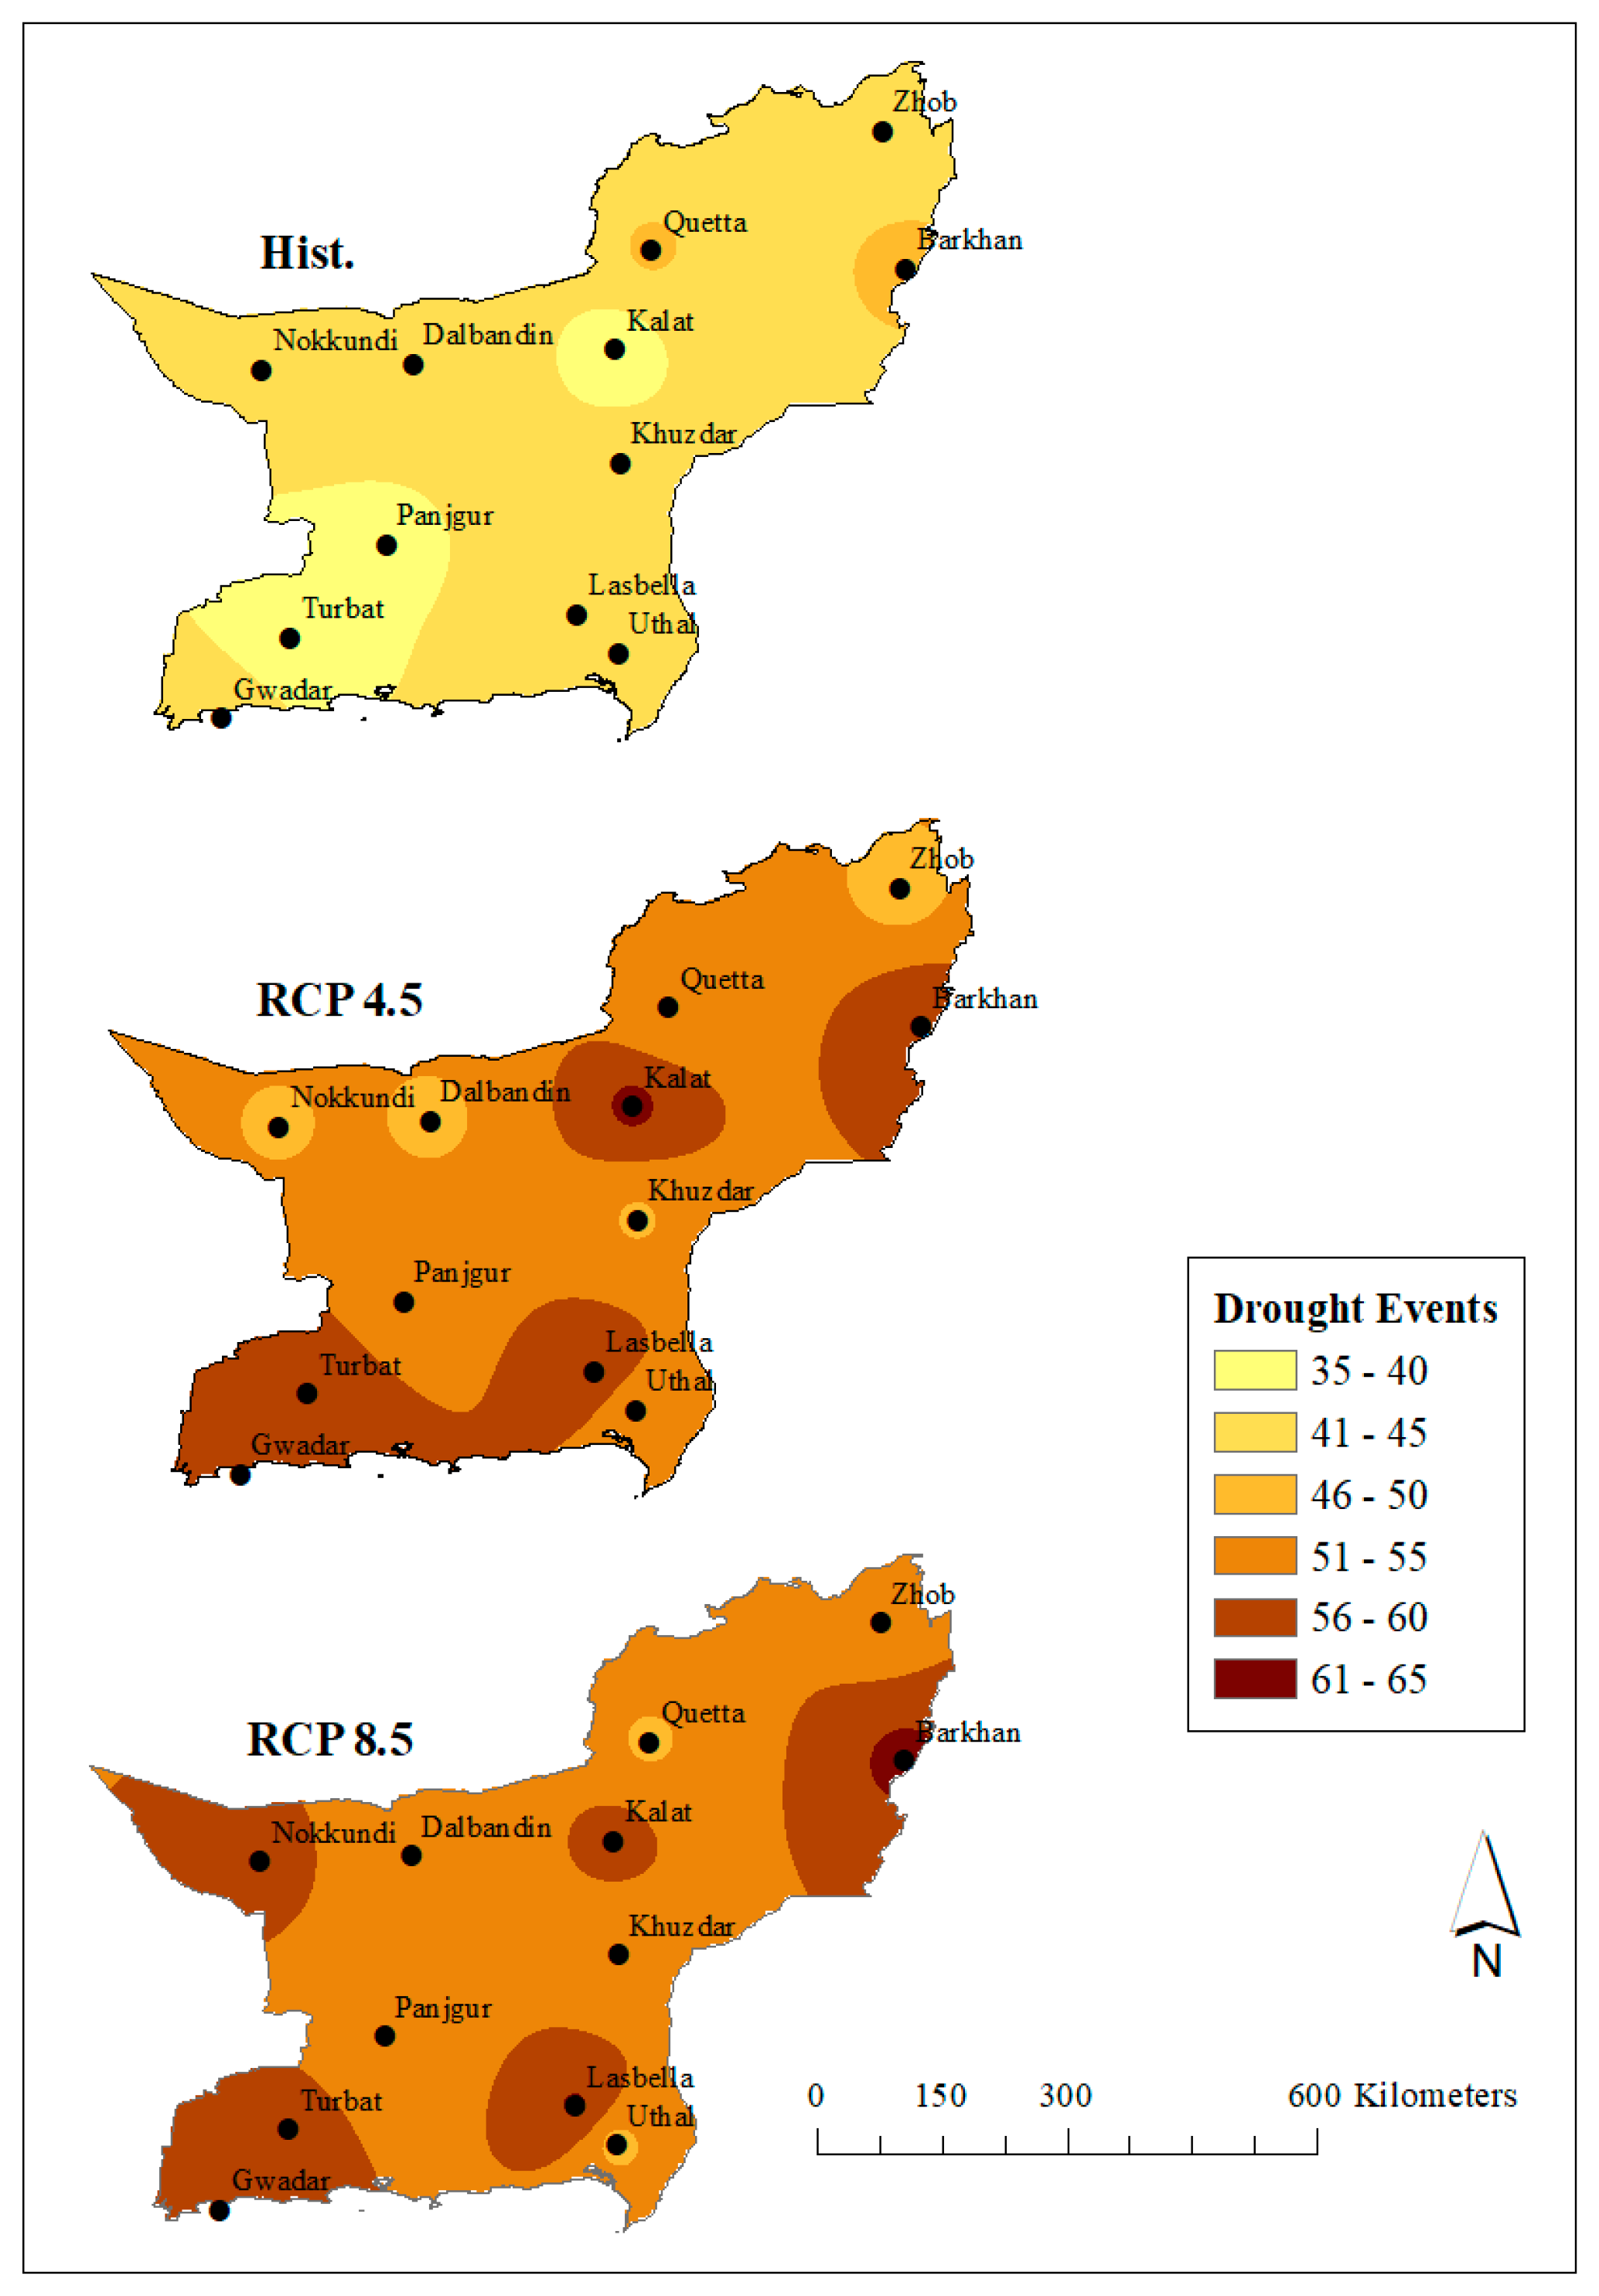
Figure 8.
Spatial plot of average drought severity at all stations.
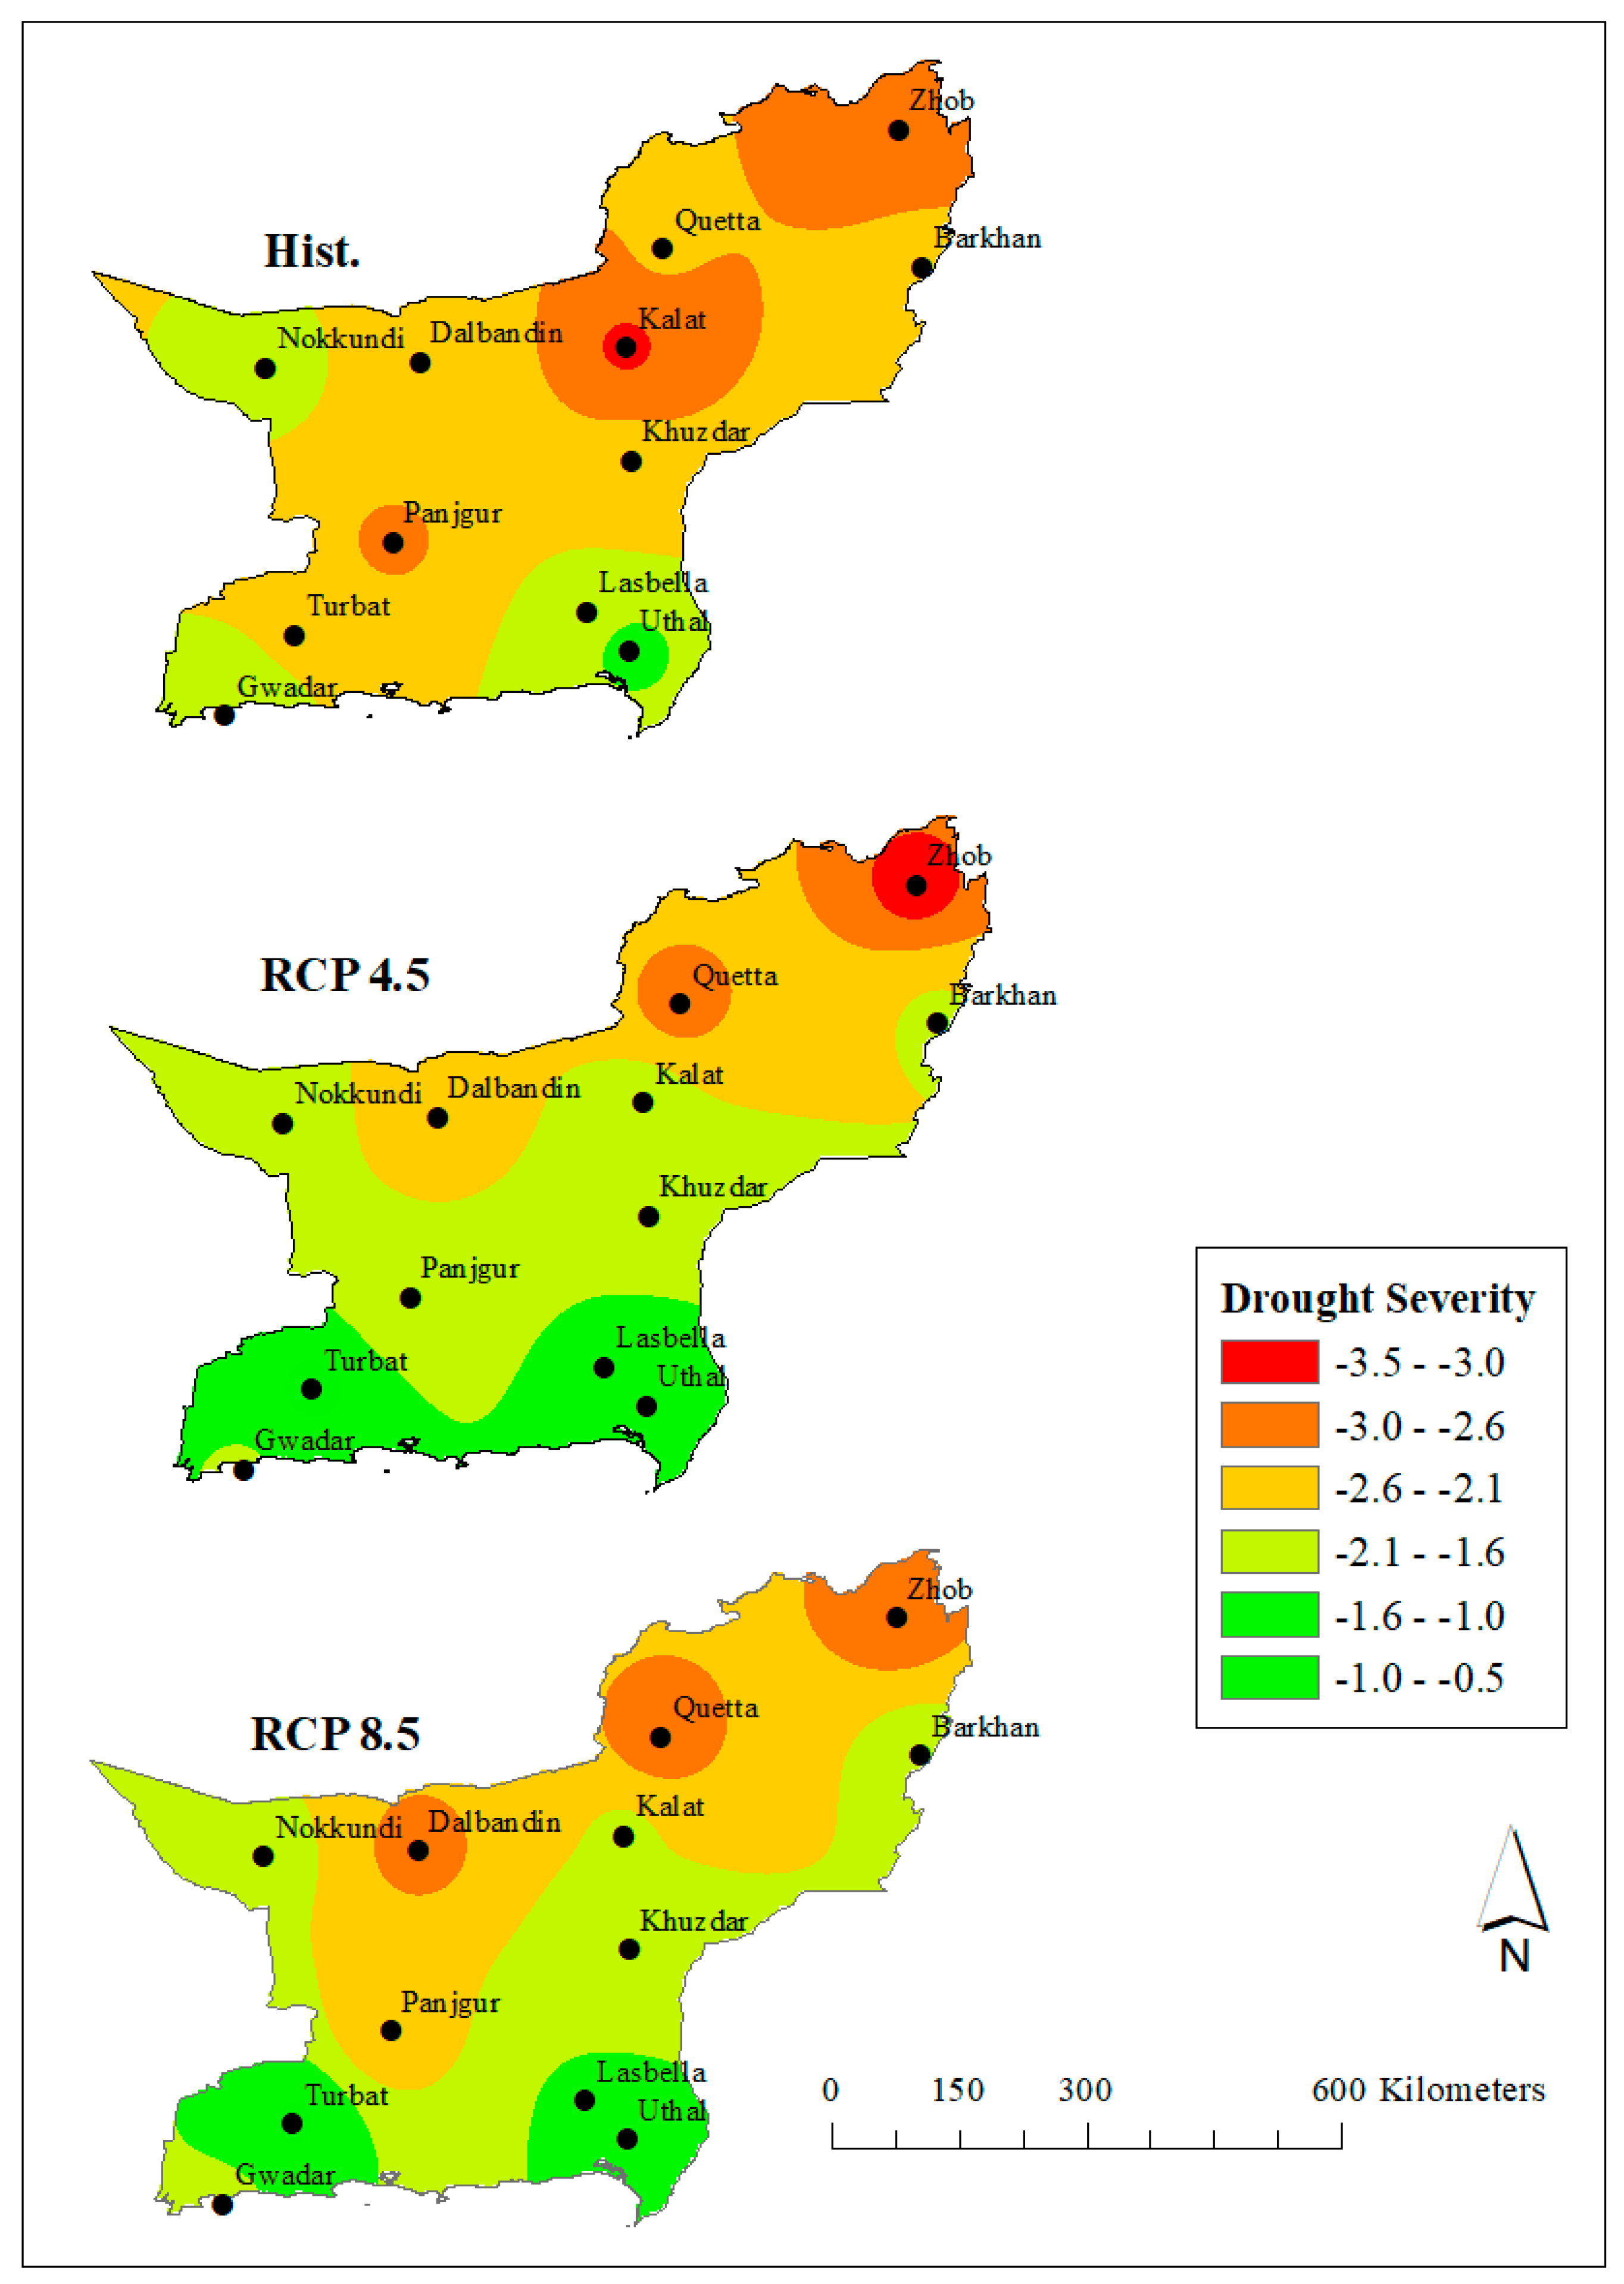
Figure 9.
Drought severity trends at all stations.
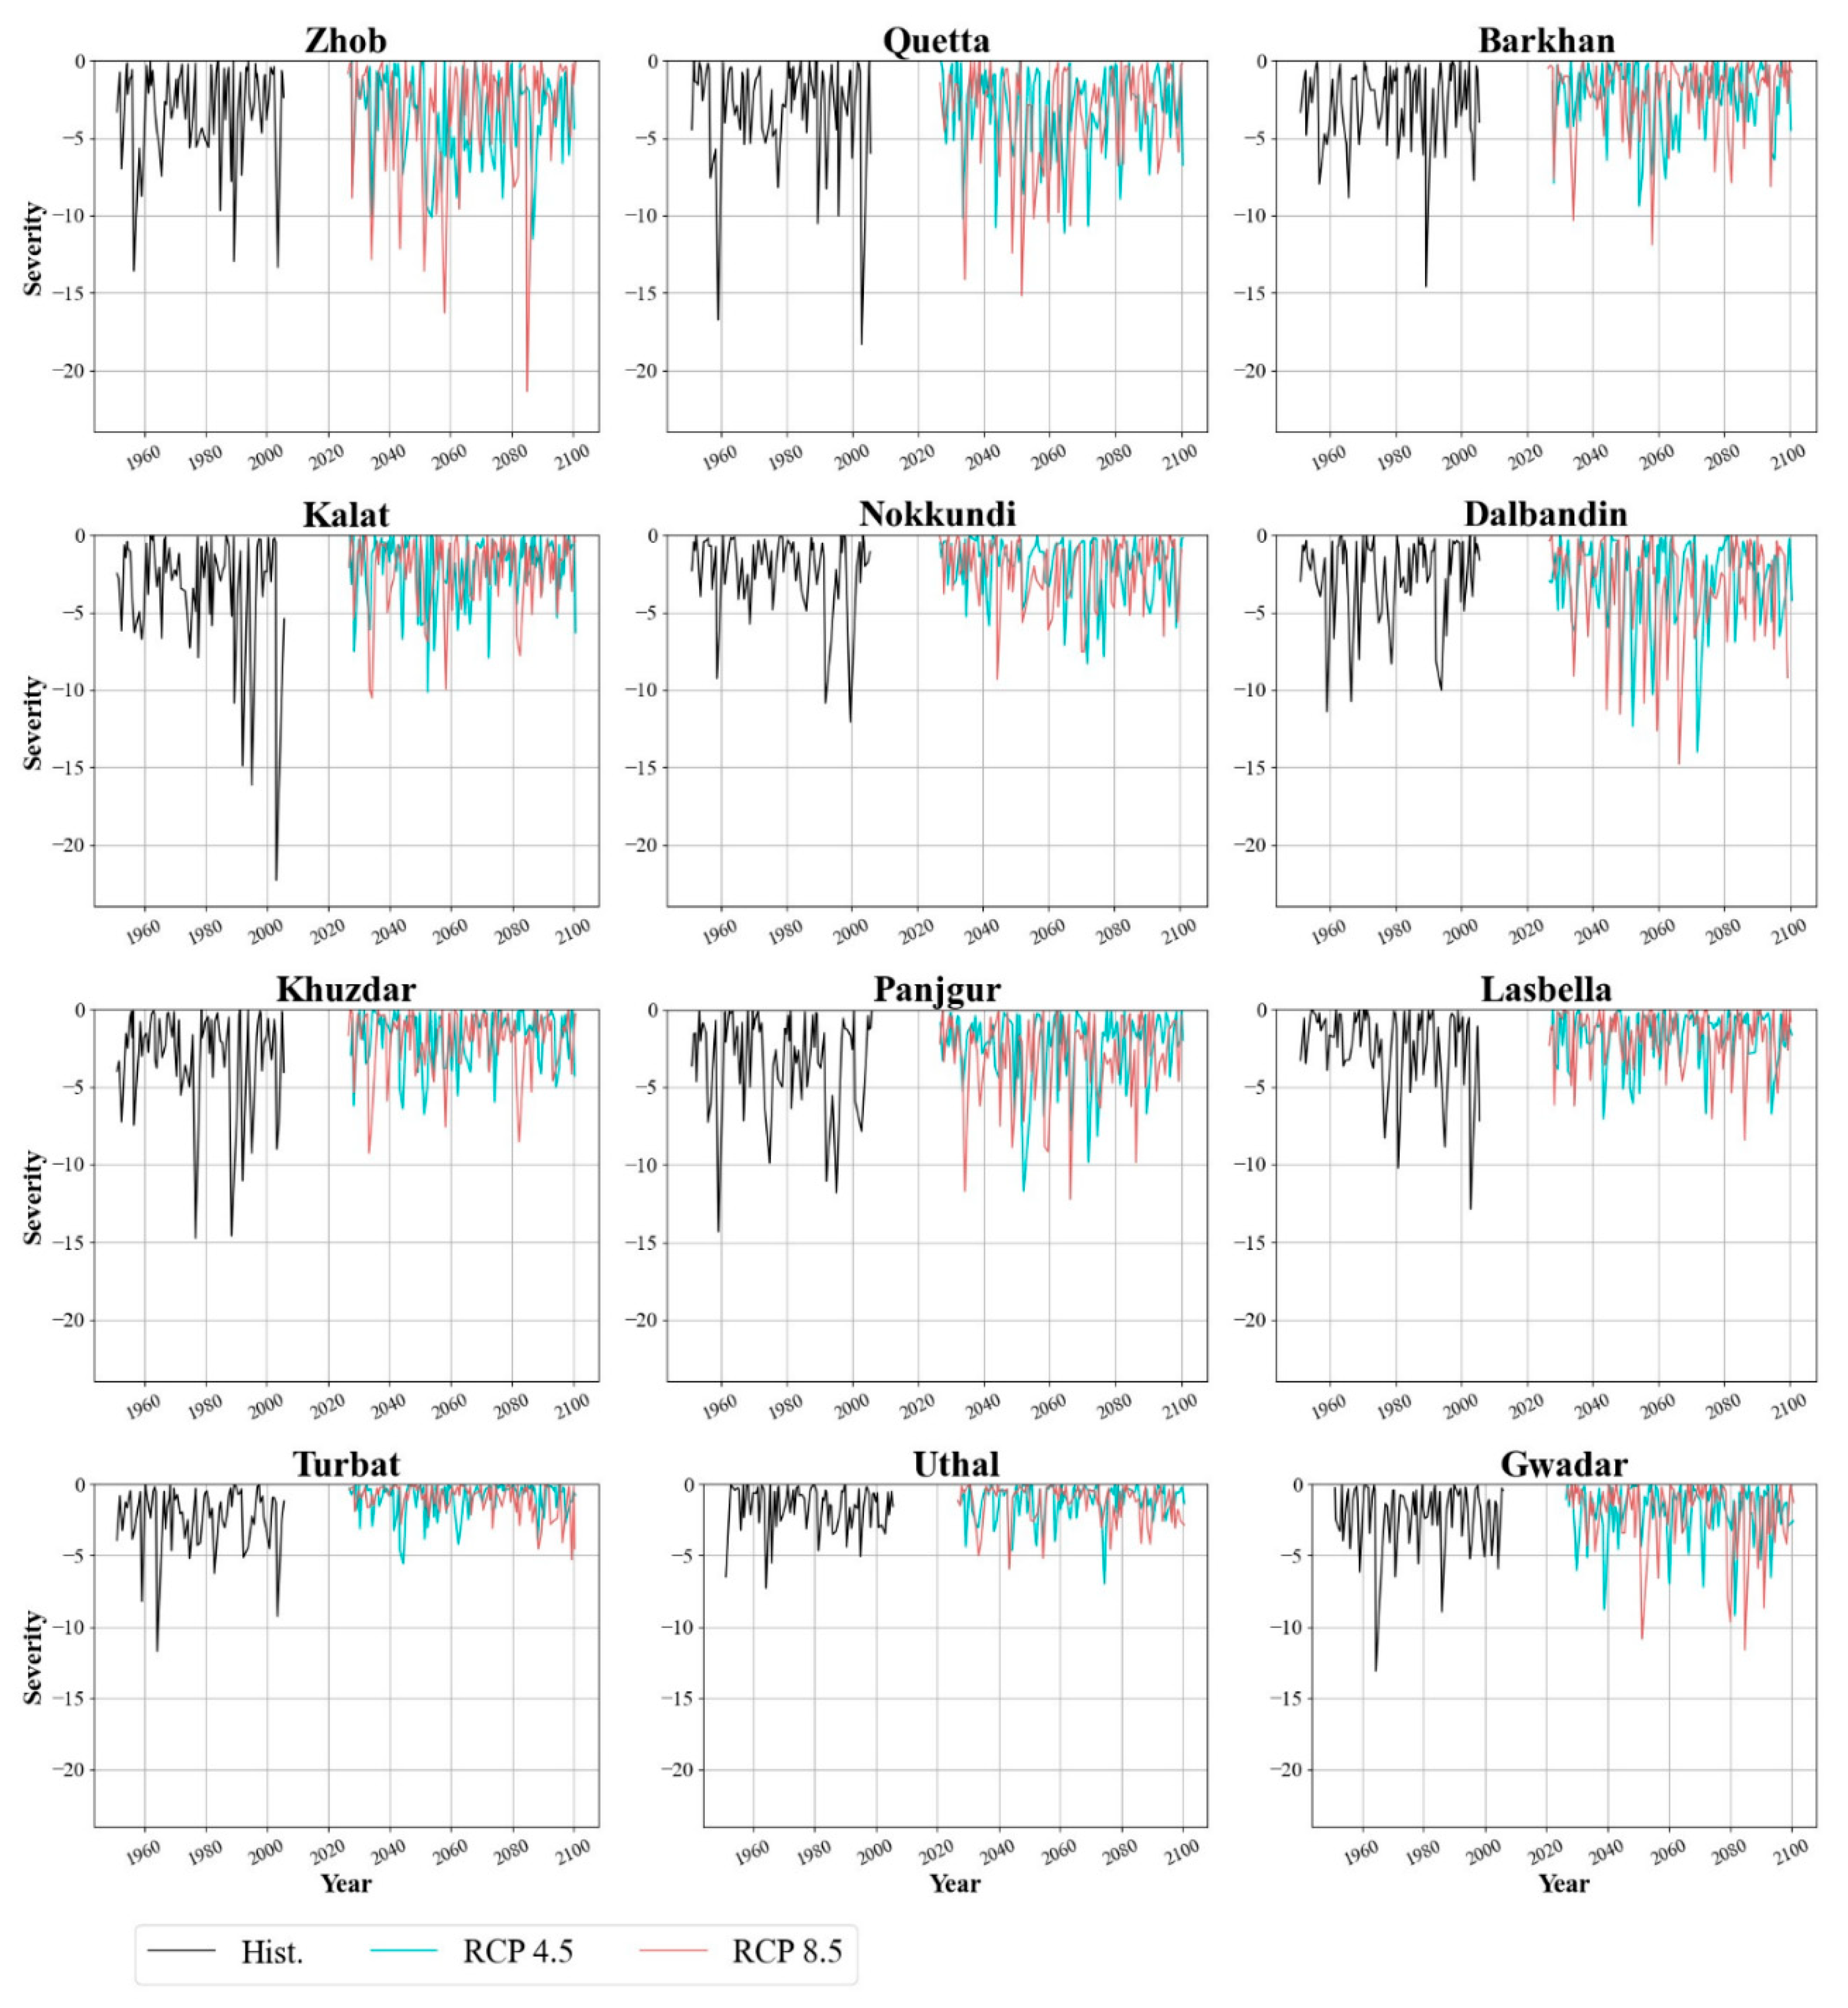
Figure 10.
Spatial plot of average drought intensity at all stations.
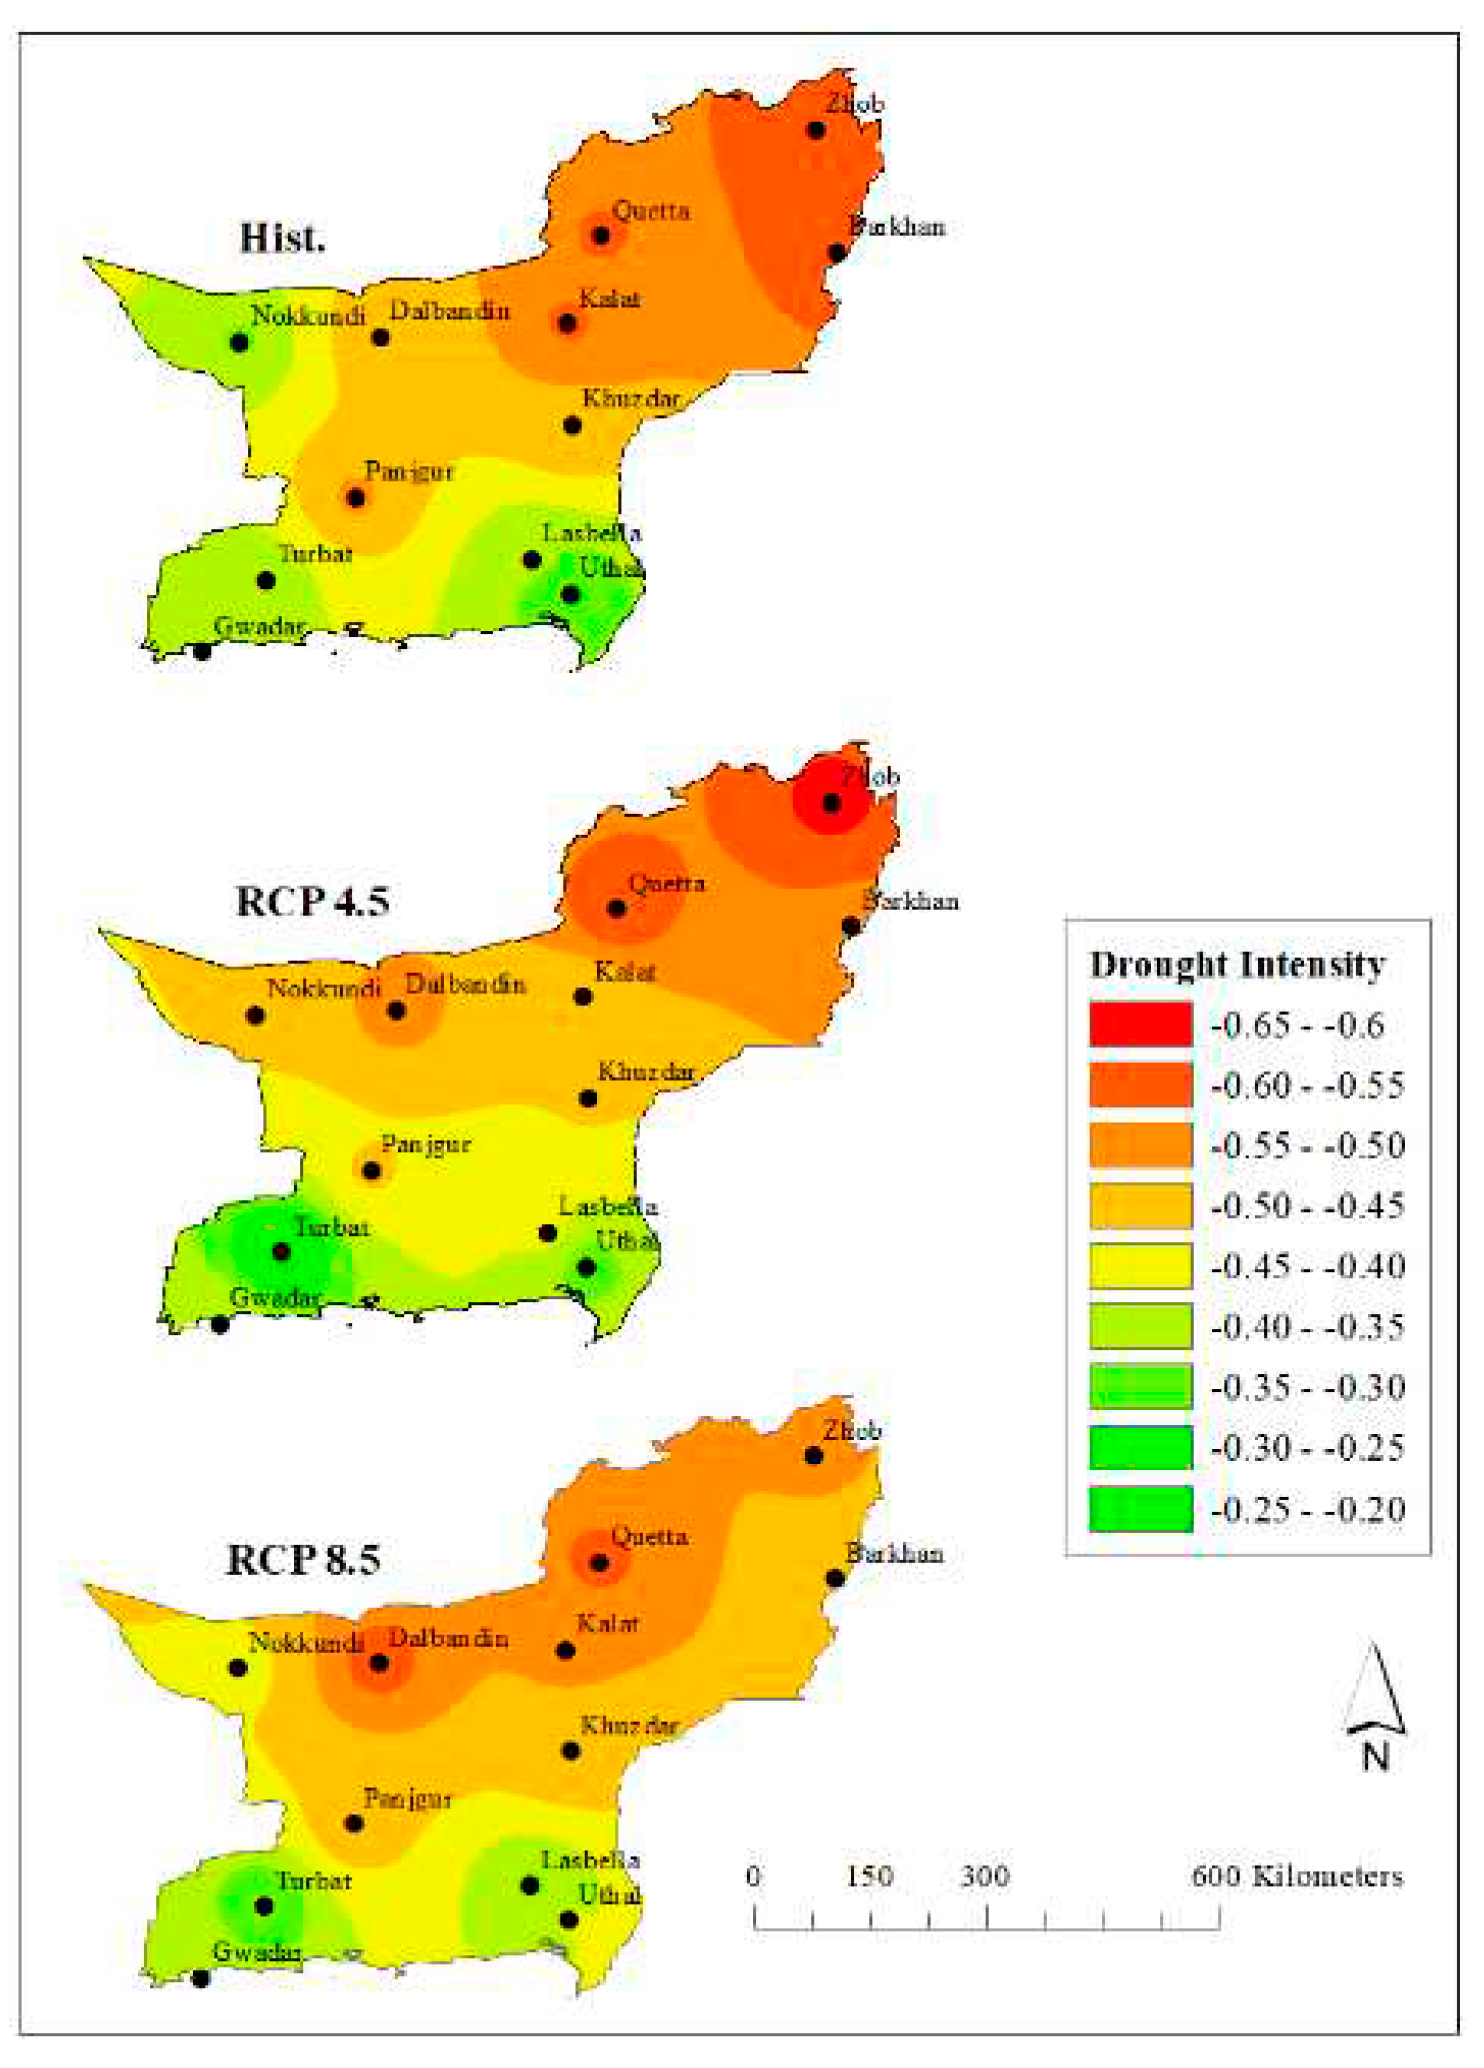
Figure 11.
Drought intensity trends at all stations.
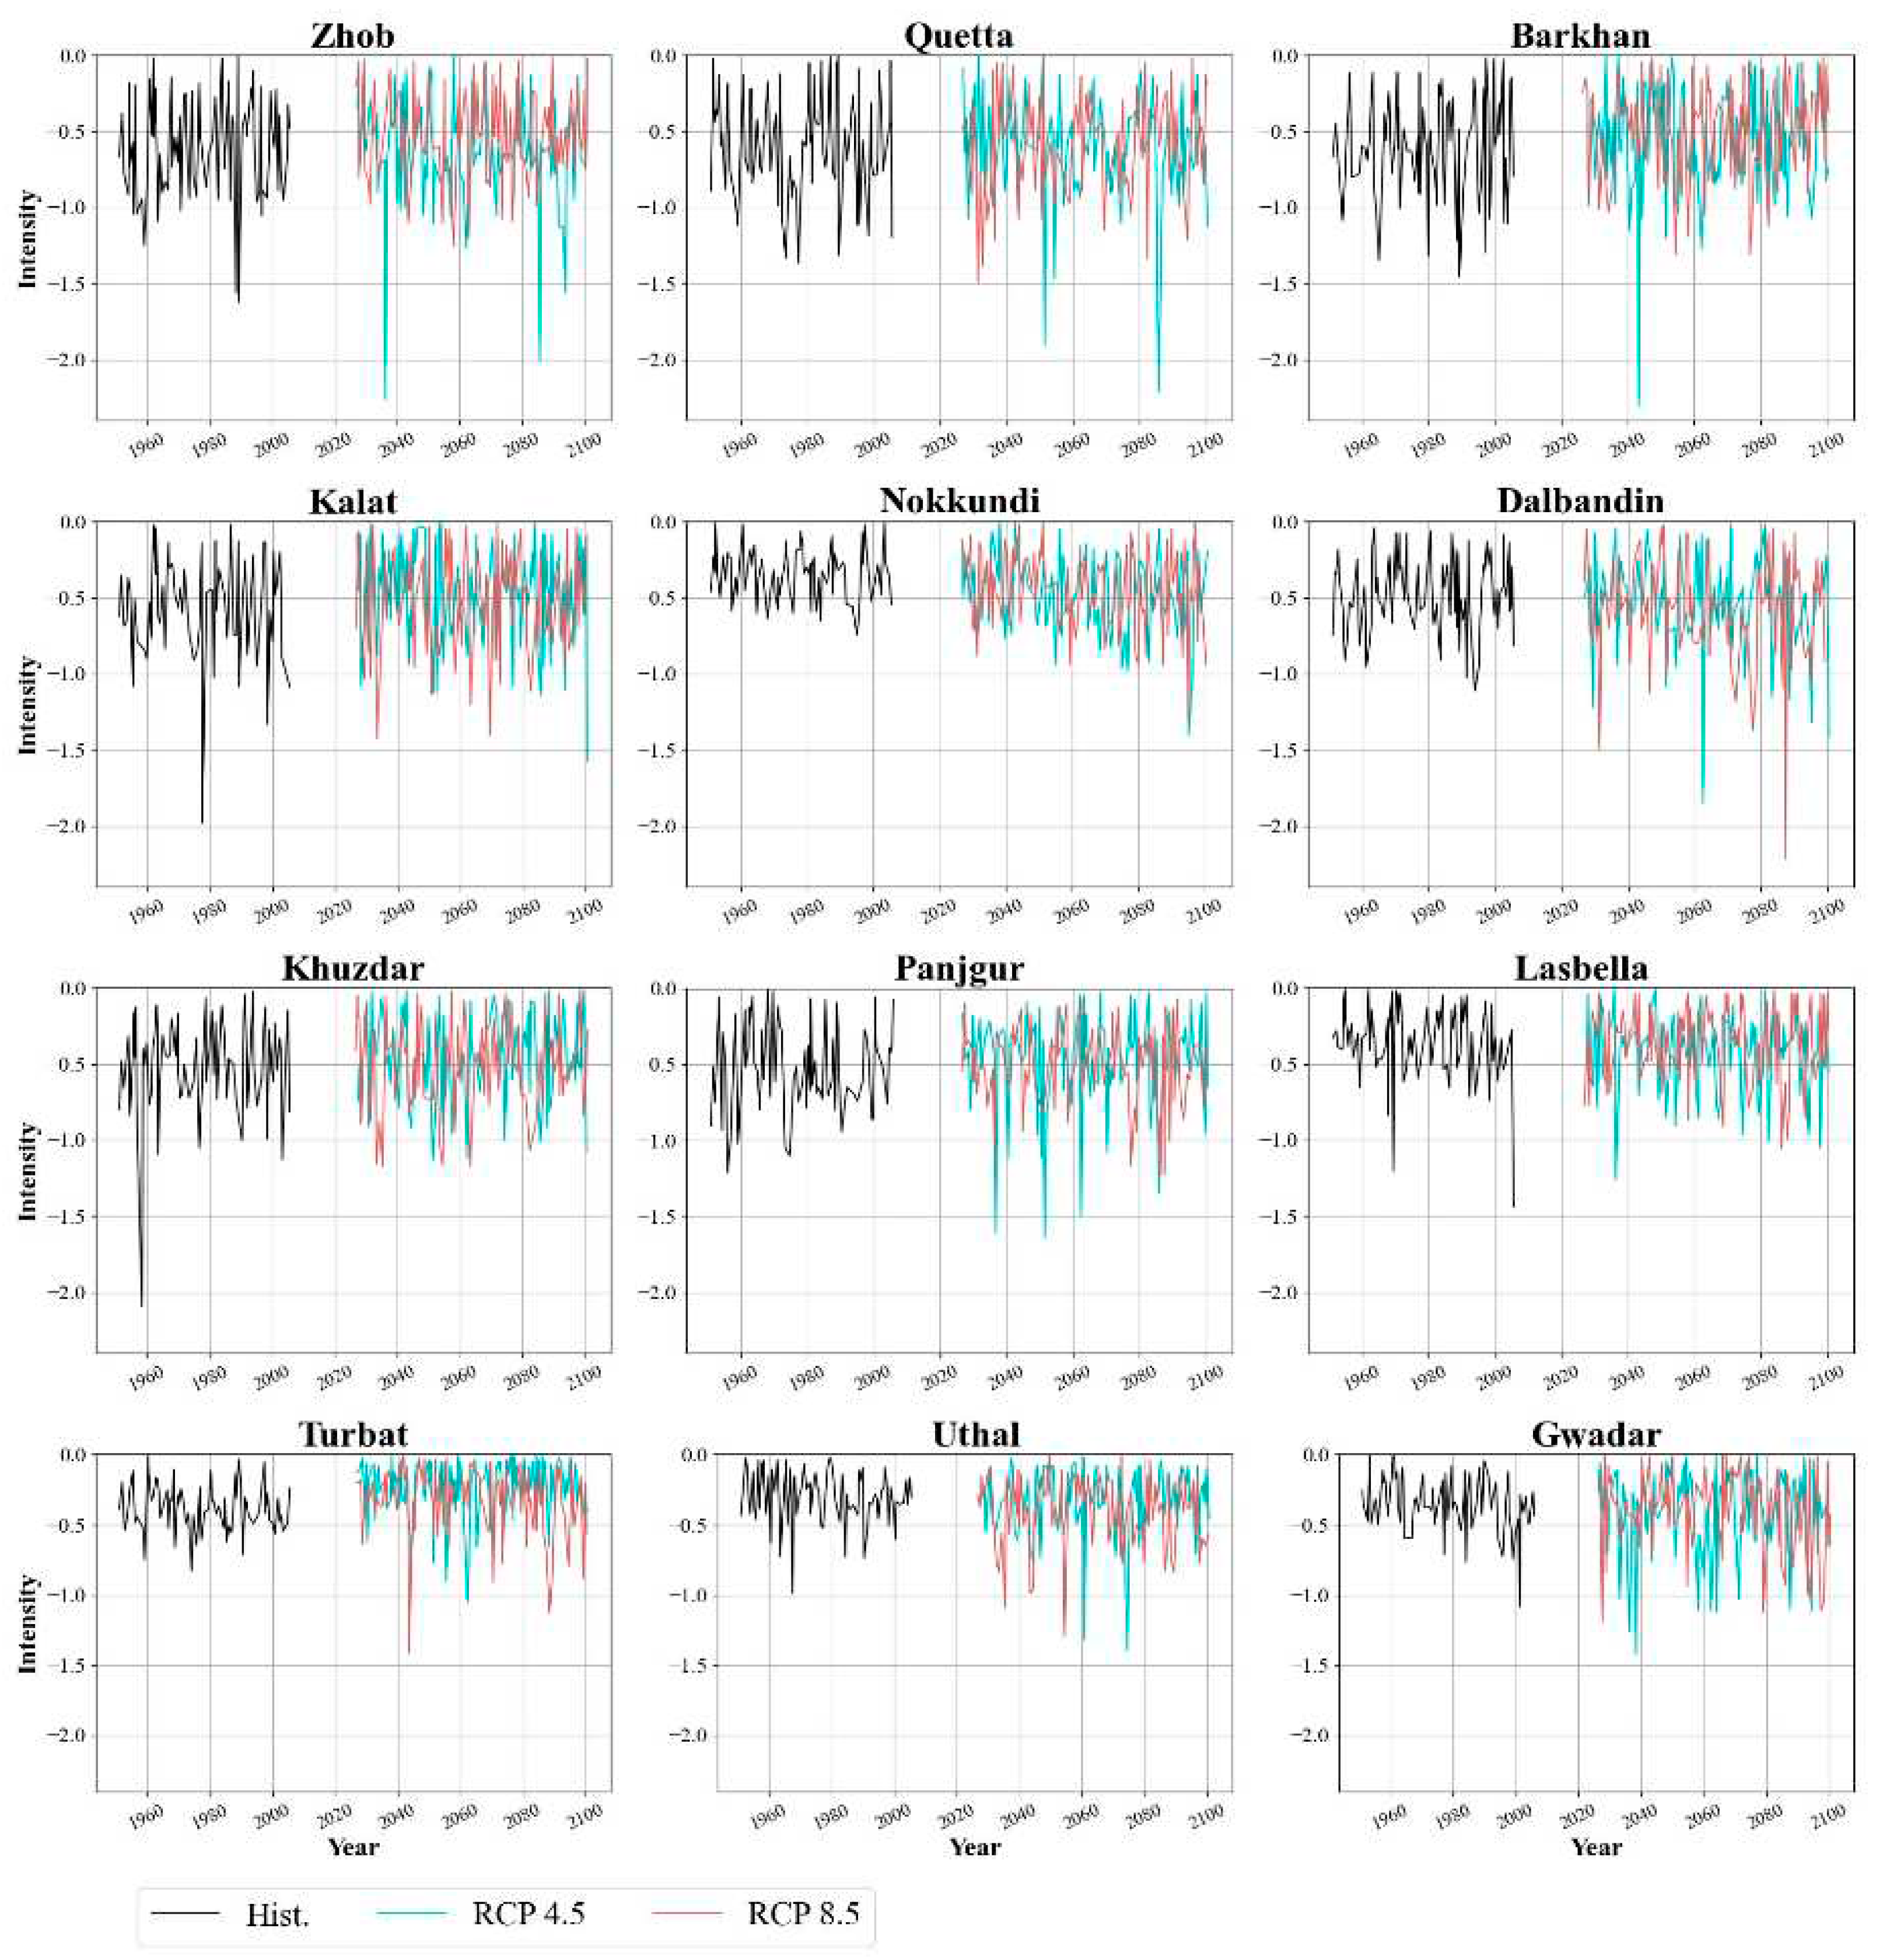
Figure 12.
Spatial plot of average drought peak at all stations.
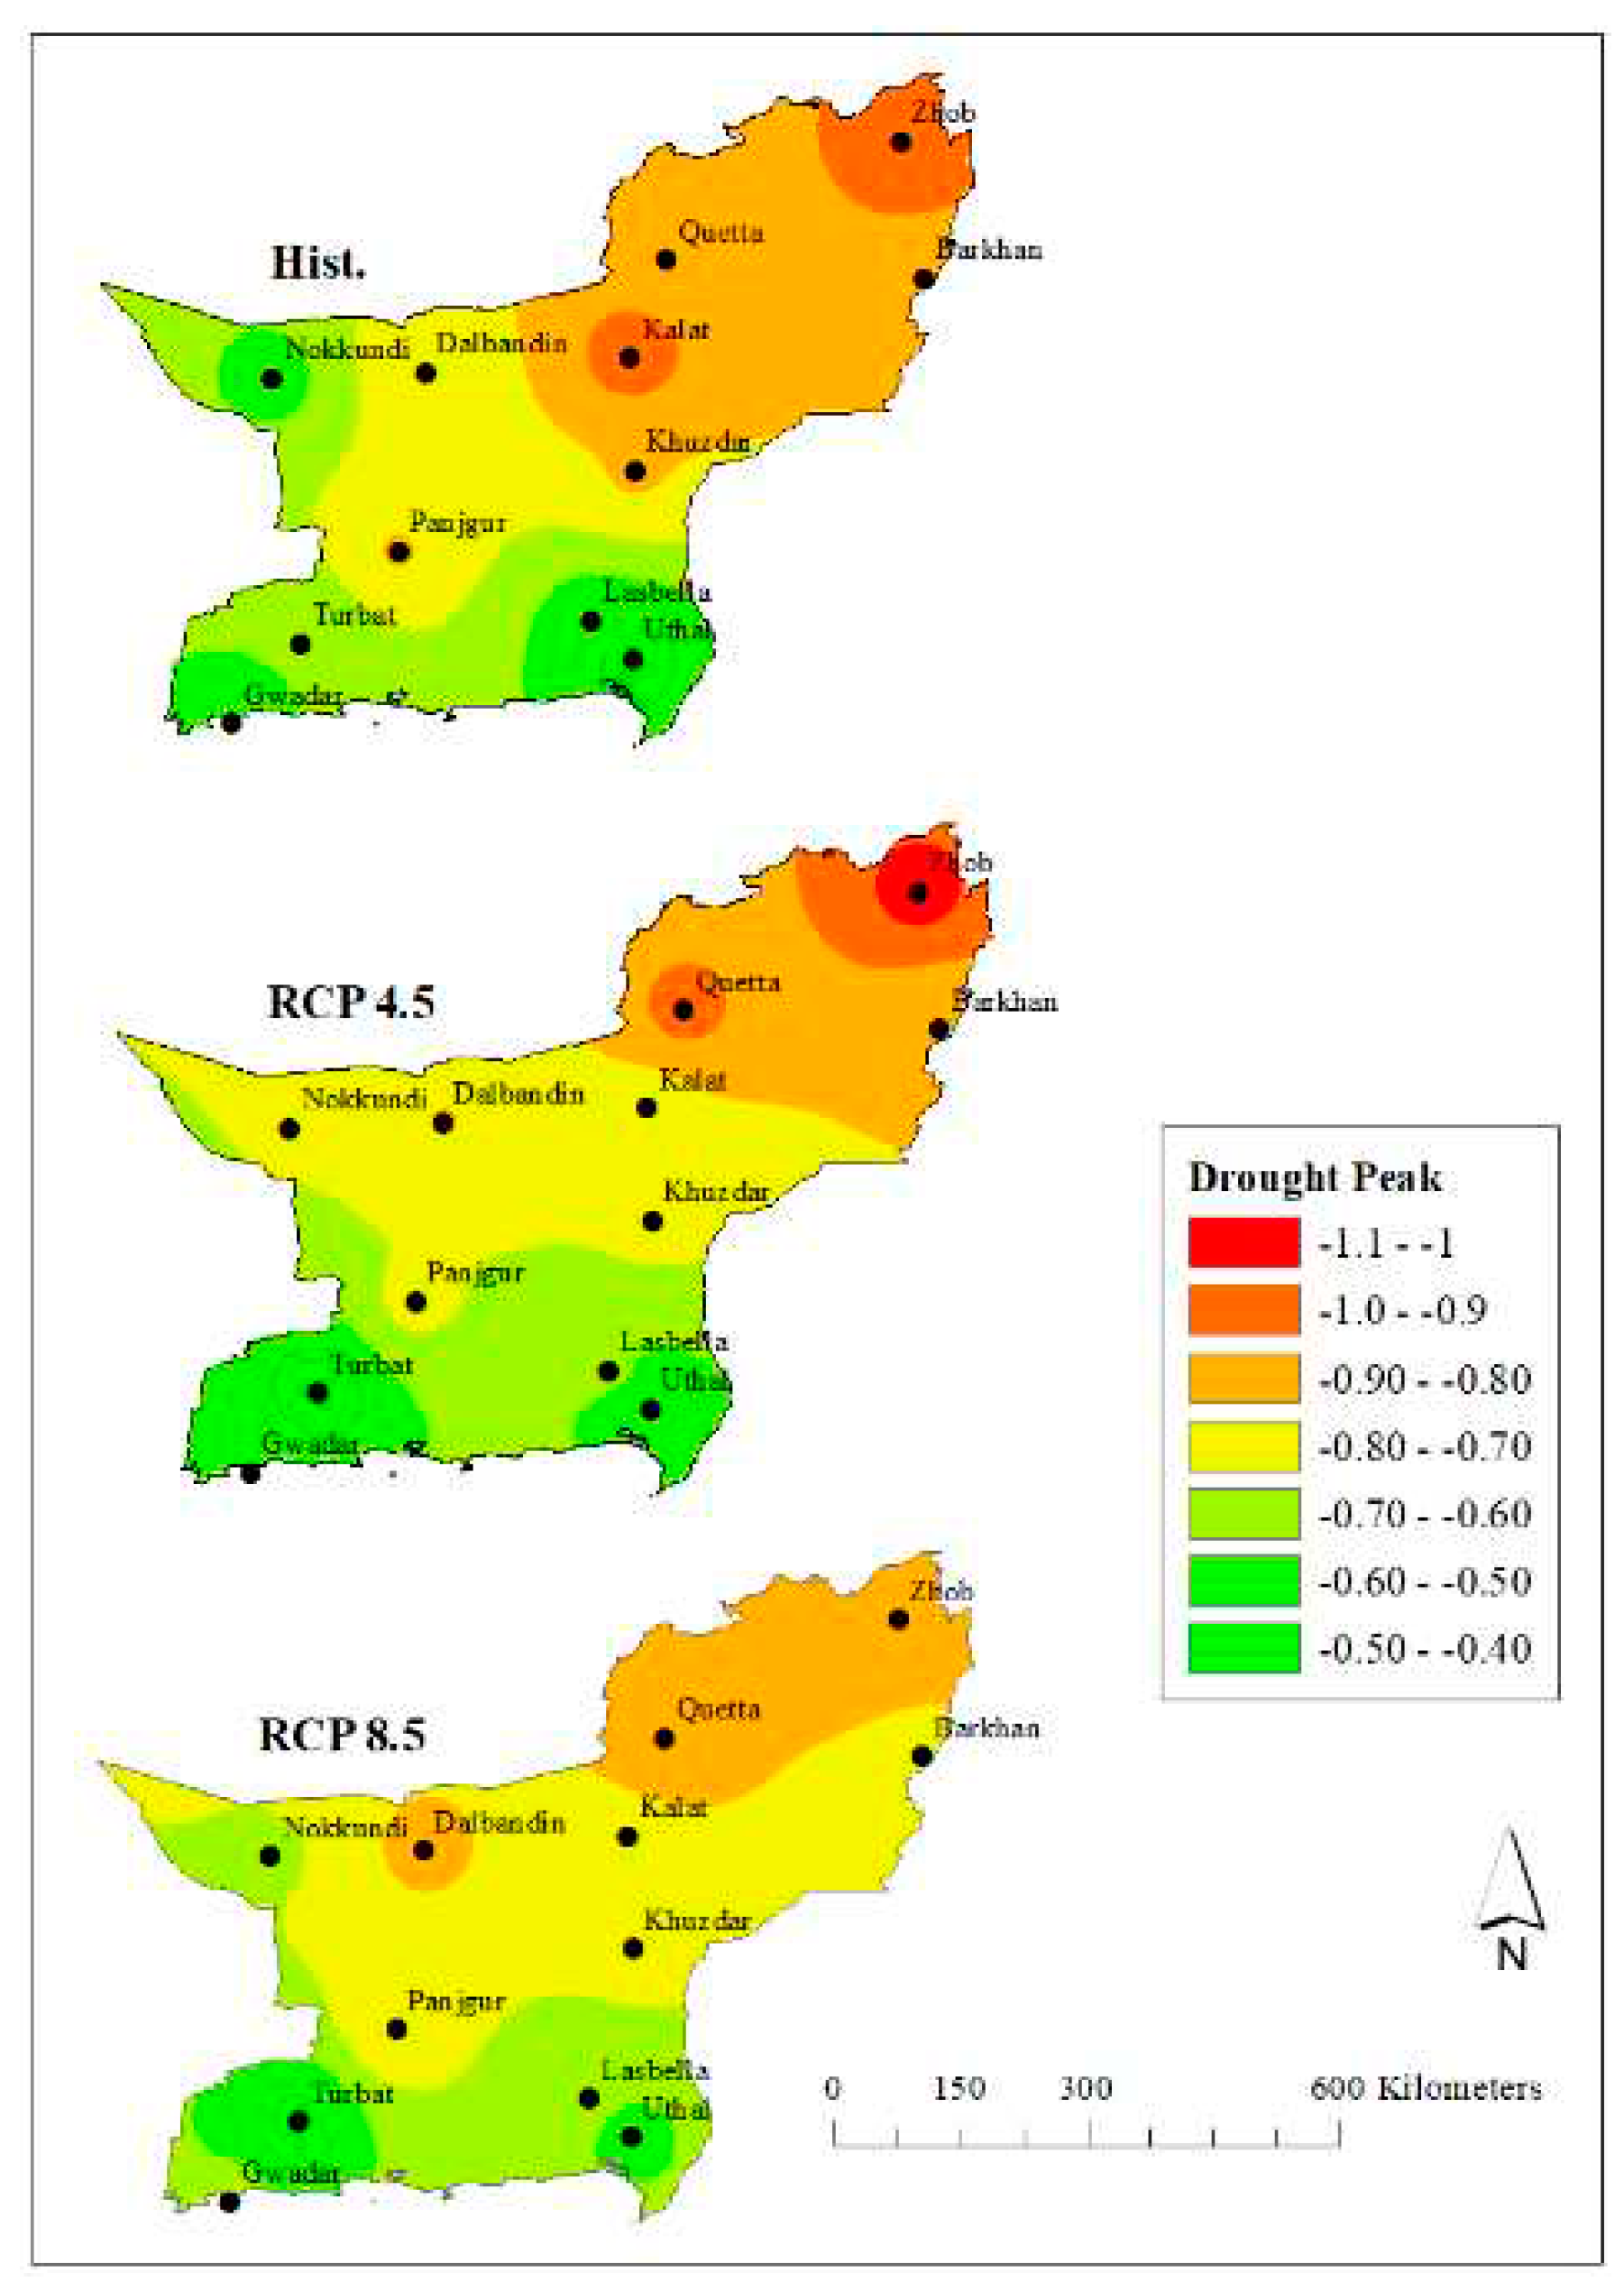
Figure 13.
Drought peak trends at all stations.
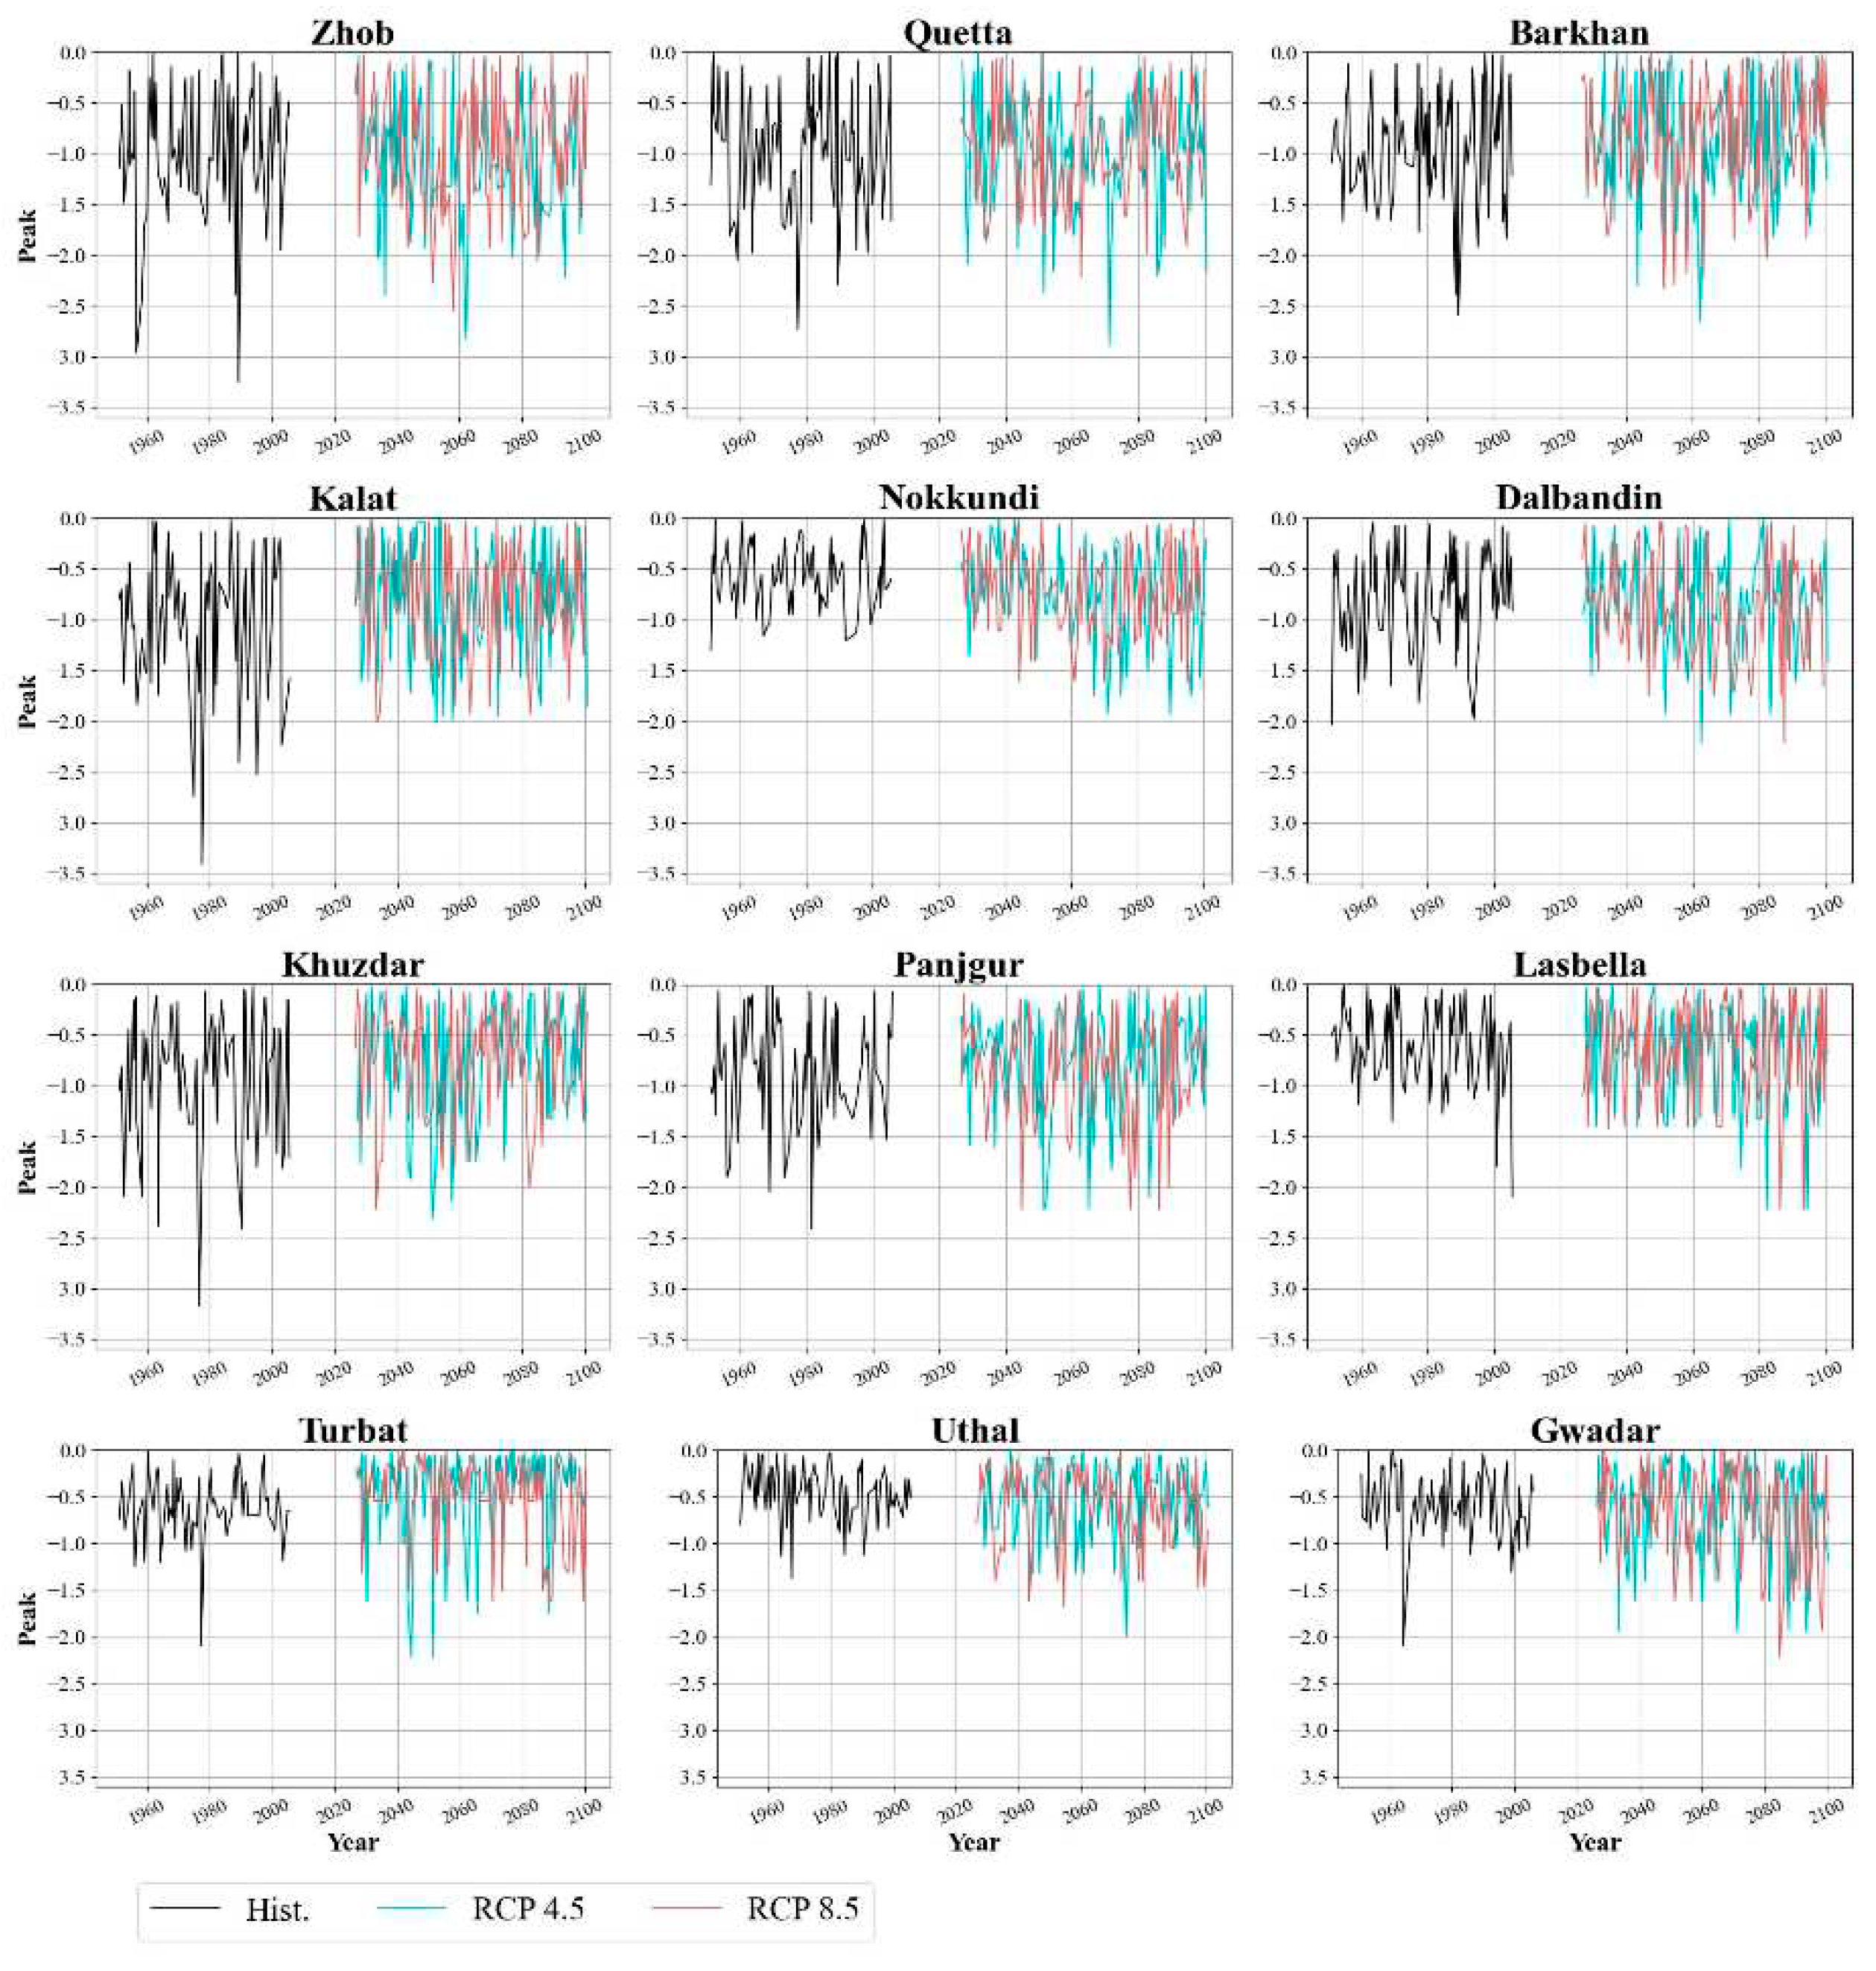
Table 1.
Duration of the seasons in different topography [20].
Table 1.
Duration of the seasons in different topography [20].
| Season | Topography | Duration |
|---|---|---|
| Winter | Hilly area | Seven months |
| Plain Area | Five months | |
| Summer | Hilly area | Five months |
| Plain Area | Seven months |
Table 2.
Gauge stations in Balochistan.
| S. No. |
Gauge Station |
Latitude (Degree) |
Longitude (Degree) |
|---|---|---|---|
| 1 | Zhob | 31.350 | 69.467 |
| 2 | Quetta | 30.083 | 66.967 |
| 3 | Barkhan | 29.883 | 69.717 |
| 4 | Kalat | 29.033 | 66.583 |
| 5 | Nokkundi | 28.817 | 62.750 |
| 6 | Dalbandin | 28.883 | 64.400 |
| 7 | Khuzdar | 27.833 | 66.633 |
| 8 | Panjgur | 26.967 | 64.100 |
| 9 | Lasbella | 26.233 | 66.167 |
| 10 | Turbat | 25.983 | 63.067 |
| 11 | Uthal | 25.817 | 66.617 |
| 12 | Gwadar | 25.133 | 62.333 |
Table 4.
Mann-Kendall Trend Test.
| Historical | RCP 4.5 | RCP 8.5 | |||||
|---|---|---|---|---|---|---|---|
| p-Value | Sen's Slope | p-Value | Sen's Slope | p-Value | Sen's Slope | ||
| Zhob | SPI | 0.51205 | -0.00012 | 0.68596 | -0.00005 | 0.48736 | -0.00008 |
| Duration | 0.58640 | 0.00000 | 0.24680 | 0.00000 | 0.06030 | -0.01060 | |
| Severity | 0.45130 | 0.00560 | 0.32490 | -0.00770 | 0.31870 | 0.00470 | |
| Intensity | 0.41940 | 0.00120 | 0.40520 | -0.00100 | 0.40520 | -0.00100 | |
| Peak | 0.33220 | 0.00280 | 0.29910 | -0.00210 | 0.74030 | 0.00060 | |
| Quetta | SPI | 0.14060 | -0.00028 | 0.47199 | -0.00008 | 0.98782 | 0.00000 |
| Duration | 0.98300 | 0.00000 | 0.66350 | 0.00000 | 0.69280 | 0.00000 | |
| Severity | 0.93330 | -0.00040 | 0.35130 | -0.00580 | 0.50740 | 0.00400 | |
| Intensity | 0.88910 | -0.00020 | 0.30700 | -0.00100 | 0.37670 | 0.00110 | |
| Peak | 0.93890 | -0.00020 | 0.46910 | -0.00110 | 0.44650 | 0.00160 | |
| Barkhan | SPI | 0.26518 | -0.00021 | 0.88722 | 0.00000 | 0.72998 | 0.00000 |
| Duration | 0.80180 | 0.00000 | 0.89470 | 0.00000 | 0.31360 | 0.00000 | |
| Severity | 0.75250 | 0.00150 | 0.99060 | 0.00000 | 0.25600 | 0.00240 | |
| Intensity | 0.34760 | 0.00120 | 0.69050 | -0.00030 | 0.40840 | 0.00050 | |
| Peak | 0.57160 | 0.00120 | 0.95490 | 0.00000 | 0.21530 | 0.00140 | |
| Kalat | SPI | 0.07669 | -0.00033 | 0.91634 | 0.00000 | 0.51402 | 0.00004 |
| Duration | 0.68240 | 0.00000 | 0.62070 | 0.00000 | 0.43800 | 0.00000 | |
| Severity | 0.95620 | 0.00060 | 0.97680 | 0.00000 | 0.65810 | 0.00140 | |
| Intensity | 0.92710 | 0.00020 | 0.53170 | -0.00040 | 0.95190 | 0.00010 | |
| Peak | 0.62130 | 0.00140 | 0.71970 | 0.00000 | 0.61490 | 0.00050 | |
| Noukkundi | SPI | 0.12863 | -0.00019 | 0.00841 | -0.00024 | 0.20181 | -0.00012 |
| Duration | 0.26790 | 0.00000 | 0.39780 | 0.00000 | 0.06090 | 0.00000 | |
| Severity | 0.33020 | -0.00540 | 0.41580 | -0.00280 | 0.56310 | 0.00150 | |
| Intensity | 0.59380 | -0.00040 | 0.31830 | -0.00080 | 0.29850 | -0.00080 | |
| Peak | 0.59670 | -0.00090 | 0.59670 | -0.00090 | 0.21980 | -0.00140 | |
| Dalbandin | SPI | 0.07734 | -0.00029 | 0.64722 | -0.00003 | 0.45909 | -0.00007 |
| Duration | 0.62460 | 0.00000 | 0.50990 | 0.00000 | 0.39460 | 0.00000 | |
| Severity | 0.67910 | 0.00220 | 0.57690 | -0.00250 | 0.39110 | -0.00480 | |
| Intensity | 0.99090 | 0.00000 | 0.07880 | -0.00170 | 0.41620 | -0.00100 | |
| Peak | 0.55380 | 0.00140 | 0.46720 | -0.00090 | 0.29700 | -0.00150 | |
| Khuzdar | SPI | 0.22427 | -0.00021 | 0.35833 | 0.00003 | 0.94483 | 0.00000 |
| Duration | 0.39940 | 0.00000 | 0.86800 | 0.00000 | 0.80450 | 0.00000 | |
| Severity | 0.90410 | -0.00070 | 0.71020 | 0.00073 | 0.79760 | -0.00051 | |
| Intensity | 0.66270 | 0.00070 | 0.58260 | 0.00040 | 0.80640 | -0.00020 | |
| Peak | 0.81920 | 0.00060 | 0.46260 | 0.00060 | 0.63810 | -0.00060 | |
| Panjgur | SPI | 0.36514 | -0.00016 | 0.19098 | -0.00011 | 0.94689 | 0.00000 |
| Duration | 0.73470 | 0.00000 | 0.22120 | 0.00000 | 0.40920 | 0.00000 | |
| Severity | 0.62540 | -0.00340 | 0.47800 | 0.00280 | 0.62000 | 0.00270 | |
| Intensity | 0.82250 | -0.00040 | 0.86200 | -0.00010 | 0.86560 | -0.00020 | |
| Peak | 0.98950 | 0.00010 | 0.83060 | 0.00000 | 0.94690 | 0.00000 | |
| Lasbella | SPI | 0.00319 | 0.00319 | 0.68805 | -0.00001 | 0.01517 | -0.00021 |
| Duration | 0.13500 | 0.00000 | 0.38010 | 0.00000 | 0.85660 | 0.00000 | |
| Severity | 0.08750 | -0.00840 | 0.75290 | 0.00060 | 0.90420 | 0.00000 | |
| Intensity | 0.12420 | -0.00150 | 0.26320 | -0.00050 | 0.70130 | 0.00010 | |
| Peak | 0.14880 | -0.00250 | 0.67560 | 0.00000 | 0.75570 | 0.00000 | |
| Turbat | SPI | 0.54739 | -0.00008 | 0.78605 | 0.00000 | 0.00005 | -0.00028 |
| Duration | 0.61780 | 0.00000 | 0.15460 | 0.00000 | 0.31060 | 0.00000 | |
| Severity | 0.86660 | -0.00170 | 0.37260 | 0.00080 | 0.15360 | -0.00140 | |
| Intensity | 0.19770 | -0.00120 | 0.87950 | 0.00000 | 0.28740 | -0.00040 | |
| Peak | 0.66430 | -0.00070 | 0.42610 | 0.00000 | 0.16480 | 0.00000 | |
| Uthal | SPI | 0.02714 | -0.00024 | 0.23098 | -0.00005 | 0.00015 | -0.00026 |
| Duration | 0.05550 | 0.01390 | 0.68760 | 0.00000 | 0.06230 | 0.00000 | |
| Severity | 0.02890 | -0.00720 | 0.58470 | 0.00010 | 0.06050 | -0.00490 | |
| Intensity | 0.12180 | -0.00130 | 0.67810 | 0.00000 | 0.15530 | -0.00090 | |
| Peak | 0.04450 | -0.00250 | 0.90000 | 0.00000 | 0.09320 | -0.00190 | |
| Gwadar | SPI | 0.48114 | -0.00009 | 0.40615 | -0.00006 | 0.00203 | -0.00027 |
| Duration | 0.78940 | 0.00000 | 0.45300 | 0.00000 | 0.49320 | 0.00000 | |
| Severity | 0.13920 | -0.00670 | 0.43640 | -0.00180 | 0.32250 | -0.00240 | |
| Intensity | 0.00860 | -0.00230 | 0.44210 | -0.00050 | 0.30140 | -0.00090 | |
| Peak | 0.01540 | -0.00360 | 0.58960 | -0.00030 | 0.14220 | -0.00180 | |
| Statistically Significant at 95% | |||||||
| Not Statistically Significant | |||||||
Disclaimer/Publisher’s Note: The statements, opinions and data contained in all publications are solely those of the individual author(s) and contributor(s) and not of MDPI and/or the editor(s). MDPI and/or the editor(s) disclaim responsibility for any injury to people or property resulting from any ideas, methods, instructions or products referred to in the content. |
© 2023 by the authors. Licensee MDPI, Basel, Switzerland. This article is an open access article distributed under the terms and conditions of the Creative Commons Attribution (CC BY) license (http://creativecommons.org/licenses/by/4.0/).
Copyright: This open access article is published under a Creative Commons CC BY 4.0 license, which permit the free download, distribution, and reuse, provided that the author and preprint are cited in any reuse.


