1. Introduction
Every year in the United States, about 63,000 infants are born with a very low birth weight (VLBW; ≤1500 g) [
1]. This group represents 1·5% of all live births and has increased gradually over the past decade due to increased survival (50-70%) [
2,
3]. Disability in this subset exceeds 50% in most studies [
1,
3], with neurocognitive delays in the later preterm population unaccounted for. In terms of neurologic impairments, preterm births account for cognitive, behavioral, attention or socialization deficits in 25–50% and major motor deficits (e.g., cerebral palsy) in 5–10 % [
3,
4]. The epiCURE study described structural brain disease in 17% of the extremely low birth weight (ELBW) babies, with parenchymal cysts and/or hydrocephalus [
5]. These impairments lead to reduced quality of life and productivity, increased healthcare services utilization, higher dependency and need for assisted living [
6,
7]. Insults to the central nervous system (CNS) account for over 40% of the disability adjusted life years (DALYs) in neonates, mainly because of prematurity and hypoxic ischemic encephalopathy (HIE) [
5,
6,
7].
Several animal studies have investigated mechanisms of injury that lead to increased neurologic morbidity [
8,
9,
10]. The effect from hypoxia/hypoxemia appears to be an important and dominant mechanism of injury [
11]. Current continuous recordings of oxygen saturation reveal a much higher frequency of intermittent hypoxia (IH) events that were previously un-documented in medical charts and provide insight to high-risk patterns associated with both short-term and long-term morbidity [
12,
13]. Although interpretation of absolute values of cerebral tissue oxygenation have yet to be determined, recent data have shown a greater adverse impact from IH than bradycardic events [
14]. Regarding hypoxia exposure, chronic IH (CIH) has been observed to cause greater extent and degree of damage to the premature brain than chronic continuous hypoxia (CCH) [
15,
16] due to increased inflammation as CCH is unlikely to stimulate adaptive responses in neurons [
17,
18]. Various regions in the CNS, such as the sub cortex and especially the hippocampus have been shown to be more vulnerable than others to hypoxic exposure [
18]. CIH can result in considerable damage to the hippocampal formation and IH exposure can lead to apoptosis in the hippocampal CA1 region [
18,
19,
20]. The atlas of brain maps has proven useful in several publications for illustrating and comparing the distribution patterns of neuroanatomical data on templates and providing detailed mapping results [
21]. As the pathology of brain injury becomes clearer, there is increased interest in developing methods to ameliorate it. The excessive production and release of proinflammatory cytokines are hallmarks of neuroinflammation and these cytokines serve as neurotoxic factors involved in the pathogenesis of white matter injury after IH in the immature brain [
22,
23]. Therapeutic approaches to protect the premature brain from inflammatory damage is of utmost importance.
Caffeine (Caff) and non-steroidal anti-inflammatory drugs (NSAIDs), such as Ibuprofen (Ibu) are often used concomitantly in ELBW babies for apnea of prematurity (AOP) and patent ductus arteriosus (PDA) closure, respectively [
24]. Caff is a respiratory stimulant that reduces the incidence of AOP, and ameliorates clinical symptoms associated with AOP [
25,
26] and has become the drug of choice in neonatal care for improvement of respiratory outcomes [
25]. Its use for neuroprotection in neonates and prevention of hypoxemic episodes has been investigated and proven effective [
27,
28]. Ibuprofen use has been shown to reduce inflammation in the brain of neonatal rats [
29] and growth restricted piglets [
23,
30] suggesting a potential therapeutic intervention to prevent white matter damage. However, its chronic use appears to worsen the outcomes [
31]. Ketorolac (Keto), another NSAID, is used to reduce the need for more traditional pain medication such as opioid analgesics [
32,
33,
34]. A systematic review involving preterm and term infants showed that Keto in appropriate doses is a viable analgesic and does not increase the risk of bleeding or adverse renal effects [
35]. Keto has been used in preterm infants to prevent retinopathy of prematurity (ROP), but the results were not consistent [
36,
37]. Both Ibu and Keto act by decreasing prostaglandin (PG) synthesis through non-selective inhibition of cyclooxygenase (COX)-1 and -2. However, there are no studies investigating whether Keto confers neuroprotection by reduction of inflammation, or the synergistic effects of Caff and NSAIDs for reduction of IH-induced neuroinflammation.
Using our neonatal IH model, which consistently produces oxidative stress in neonatal rats [
38,
39] we tested the hypothesis that early caffeine and/or NSAIDs confer superior therapeutic benefits for protection against IH-induced neuroinflammation than late treatment. Our hypothesis was tested with the following objectives: 1) To examine the effects of neonatal IH on inflammation in the neonatal rat brain; 2) To compare the effects of caffeine, ketorolac or ibuprofen given individually during neonatal IH on brain inflammation; 3) To establish whether Caff and/or NSAID co-treatment has synergistic effects for reducing brain inflammation and apoptosis; 4) To examine whether topical ocular Keto has effects in the brain; and 5) To investigate whether early treatment during IH exposure is more beneficial than late treatment during recovery/reoxygenation. The primary outcome was brain histopathology and morphometry, and the secondary outcomes were biomarkers of oxidative stress, inflammation, myelination, and apoptosis.
2. Materials and Methods
2.1. Animals
All experiments were approved by the State University of New York, Downstate Medical Center Institutional Animal Care and Use Committee, Brooklyn, NY (Protocol #11-10255). Certified infection-free, timed-pregnant Sprague Dawley rats were purchased from Charles River Laboratories (Wilmington, MA) at 18 days gestation. The animals were housed in an animal facility with a 12-hour-day/12-hour-night cycle and provided standard laboratory diet and water ad libitum until delivery of their pups.
2.2. Experimental Design
Within 2-4 hours of birth, newborn rat pups delivering on the same day were pooled and randomly assigned to expanded litters of 18 pups/litter (9 males and 9 females). Gender was identified by the anogenital distance. The expanded litter size was used to simulate poor nutrition and relative postnatal malnutrition of ELBW infants who are at increased risk for severe oxidative stress and need for caff and/or NSAIDs. Two phases of treatment were conducted: 1)
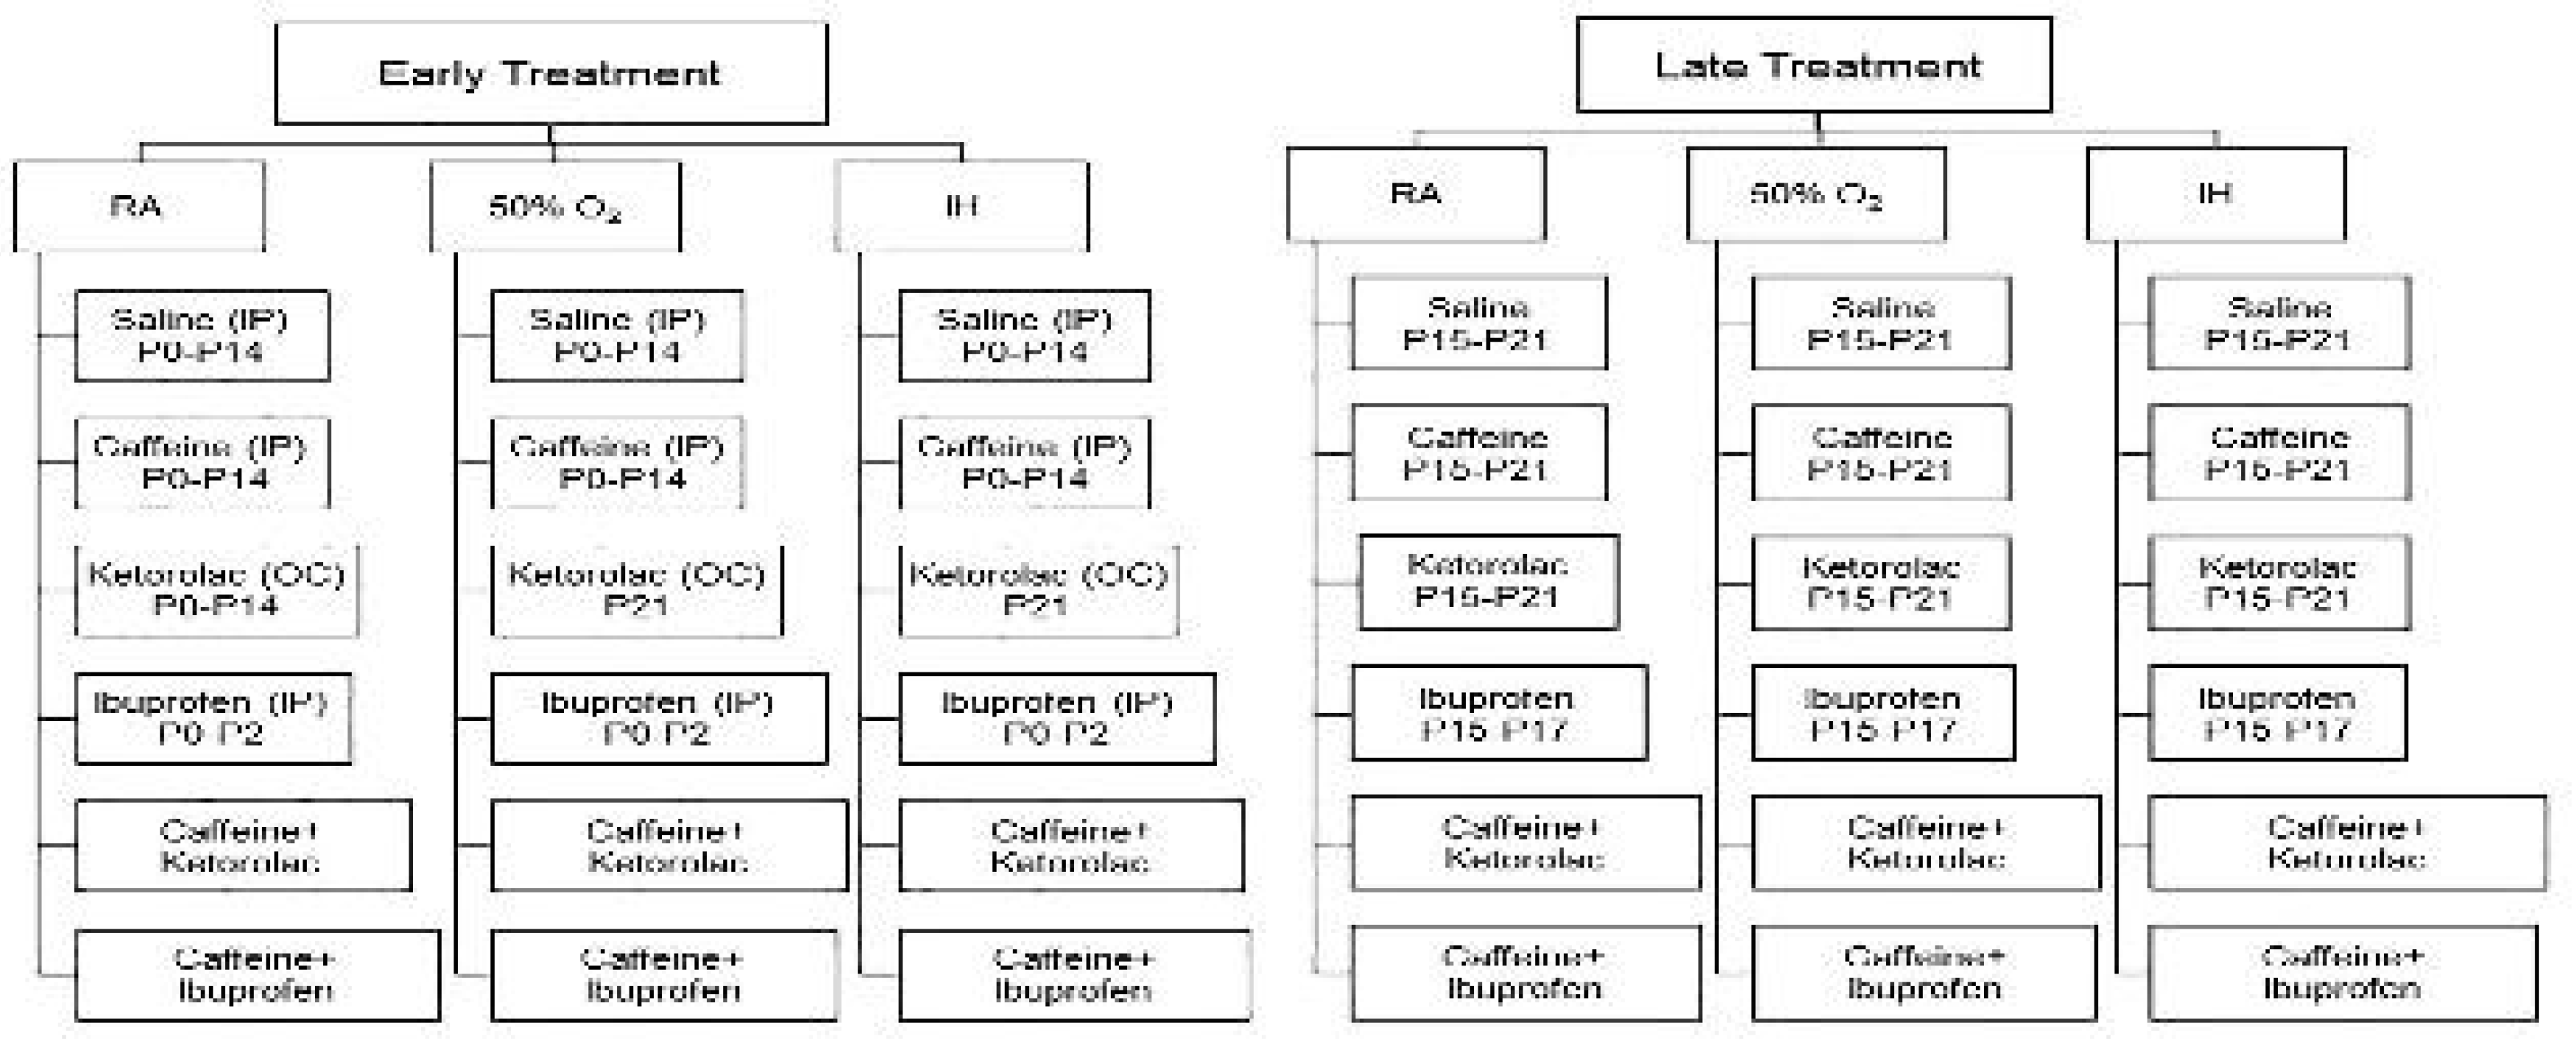
Early Treatment: Animals were exposed to IH from P0 to P14 and treated with either intraperitoneal (IP) and topical ocular saline (Sal/Sal), IP Caff, topical ocular Keto, IP Ibu, combined IP Caff and topical ocular Keto (Caff/Keto), or combined IP Caff and Ibu (Caff/Ibu). Treatment with Caff consisted of 20 mg/kg (diluted in sterile normal Sal) loading dose on P0 followed by 5 mg/kg/day from P1 to P14 (20 µL volume). Treatment of Keto consisted of a single drop of Acuvail (4% ocular solution), into both eyes from P0 to P14. Treatment with Ibu consisted of 10 mg/kg loading dose on P0 followed by 5 mg/kg/day on P1 and P2. Treatment with Caff/Keto consisted of equivalent doses and volumes of IP Caff and topical ocular Acuvail, and treatment with Caff/Ibu consisted of equivalent doses and volumes of Caff and Ibu. Treatment with Sal/Sal consisted of equivalent IP and topical ocular volumes from P0 to P14. Rats were allowed to recover in room air (RA) until P21 with no further treatment; and 2)
Late Treatment: Animals were exposed to IH from P0 to P14 after which they were removed from IH conditions and placed in RA until P21. The pups were administered doses as described above, of Sal, Caff, or Keto from P14 to P21, Ibu from P15 to P17, Caff/Keto from P15-P21; and Caff (P15-P17)/Ibu (P15-P17). A flow chart representing the early and late phases is presented in
Figure 1.
2.3. Neonatal Intermittent Hypoxia (IH) Profiles
Animals randomized to IH were placed with the dams in specialized oxygen chambers attached to an oxycycler (BioSpherix, NY, USA). The IH profile consisted of an initial exposure of hyperoxia (50% O
2) for 30 minutes followed by three brief, 1-minute, clustered hypoxic events (12% O
2), with a 10-minute re-oxygenation in 50% O
2 between each hypoxic event. Recovery from IH occurred in 50% O
2 following each clustered IH event for 2.5 hours for a total of 8 clustering IH episodes per day for 14 days, as previously described [
38,
39]. Oxygen saturation was confirmed on a sentinel un-anesthetized rat pup from each group using the MouseOx Pulse Oximeter and WinDaq Waveform Browser software (STARR Life Sciences Corp., Oakmont PA) before and after IH exposure.
2.4. Sample Collection & Processing
At euthanasia (P21), whole brains were removed, weighed and placed in 10% neutral buffered formalin (NBF). Fixed coronal sections were placed in cassettes and sent to the Histowiz, Inc. (Long Island City, NY USA) for processing, paraffin embedding, sectioning and hematoxylin and eosin (H&E) staining using standard laboratory techniques. Unstained sections were used for TUNEL (terminal deoxynucleotidyl transferase dUTP nick end labeling), Luxol fast blue, and immunohistochemistry (IHC). Fresh brain samples excised from the cerebral cortex (n=6 samples/group) were placed in sterile Lysing Matrix D 2.0 mL tubes containing 1.4 mm ceramic spheres (MP Biomedicals, Santa Ana, CA, USA) and 1.0 mL PBS then snap-frozen in liquid nitrogen. Samples were stored at -80oC until analysis of cytokines using enzyme-linked immunosorbent assay (ELISA).
2.5. Brain histopathology and Morphometry
H&E stained images were captured at 20X magnification (scale bar=20 µm) using an Olympus BX53 microscope, DP72 digital camera, and CellSens imaging software (Olympus, Center Valley, PA), attached to a Dell Precision T3500 computer (Dell, Round Rock, TX). Morphometric analyses included total brain width (frontal-occipital and inter-parietal); and width of layers I-VI of the cerebral cortex [
40]. Twelve sections were analyzed for each group. Measurements were made using the count and measure tool of the Olympus CellSens imaging software
2.6. Apoptosis (TUNEL Stain)
Apoptosis was determined in the unstained brain sections using the TUNEL assay kit purchased from Abcam (Waltham, MA, USA), according to the manufacturer’s protocol. Sections were counterstained with Methyl Green.
2.7. Myelin Stain
Myelination was determined using the Luxol fast blue (LFB) stain (VitroVivo Biotech, Rockville, MD, USA). Briefly, unstained cross-sections were de-paraffinized with xylenes and alcohols prior to overnight incubation with Luxol fast blue solution at 56oC. Slides were washed and differentiated in lithium carbonite solution and 70% ethanol, then counter stained with Cresyl Violet solution, washed and mounted with Permount. Images were captured at 40X magnification using an Olympus BX53 microscope, DP72 digital camera, and CellSens imaging software (Olympus, Center Valley, PA, USA), attached to a Dell Precision T3500 computer (Dell, Round Rock, TX, USA). Stain intensity was determined using the count and measure on region of interest tool of the CellSens imaging software (12 measurements/group).
2.8. IHC Assays
Unstained sections were used for IHC of phosphorylated (p) nuclear factor kappa B (NFkB), IkB, and pro-inflammatory cytokines, including interleukin-1(IL-1)β, IL-6, tumor necrosis factor (TNF)α, and IL-10. Unstained sections (2 sections per slide) were de-paraffinized with xylenes and alcohols prior to unmasking of antigens. Sections were washed several times in PBS containing triton X-100 (PBS-T) and incubated in blocking solution (Cell Signaling Technologies, Danvers, MA) for 1 hour. The blocking solution was removed and primary antibodies for cytokines (Santa Cruz Biotechnology, Inc., Dallas, TX) were added and sections were incubated overnight. The sections were washed and incubated with Signal Boost antibody serum secondary antibodies (Cell Signaling) for 1 hour. After washing, sections were counterstained with hematoxylin Images were captured at 20X magnification (scale bar=20 µm) using an Olympus BX53 microscope, DP72 digital camera, and CellSens imaging software (Olympus, Center Valley, PA), attached to a Dell Precision T3500 computer (Dell, Round Rock, TX). Twelve sections were analyzed for each group. Measurements were made using the count and measure tool of the Olympus CellSens imaging software.
2.9. ELISA Assays
All samples were analyzed on the same day. On the day of analyses, the tubes were allowed to defrost on ice and placed in a high-speed FastPrep-24 instrument (MP Biomedicals, Santa Ana, CA, USA), which utilizes a unique, optimized motion to efficiently homogenize biological samples within 40 seconds via multidirectional simultaneous beating of the Lysing Matrix ceramic beads on the tissue. The homogenates were then centrifuged at 4oC at 10,000 rpm for 20 minutes. The supernatant was filtered, and the filtrate was used for the assay of total cellular proteins, IL-1β, TNFα, IL-6, and IL-10 using commercially available kits purchased from Millipore Sigma Millipore-Sigma (St. Louis, MO, USA) and MyBioSource (San Diego, CA). All samples were processed and assayed according to the manufacturer’s protocol. A total of 6 samples per experimental group were analyzed. All data were standardized using total cellular protein levels.
2.10. Total Cellular Protein Levels
On the day of assays, an aliquot (10 µL) of the cerebral cortex homogenates was used for total cellular protein levels using the Bradford method (Bio-Rad, Hercules, CA USA) with bovine serum albumin as a standard.
2.11. Statistical Analysis
To determine differences among the treatment groups, a test for normality was first conducted using Bartlett’s test. Normally distributed data were analyzed using two-way analysis of variance (ANOVA) with Dunnett’s post-hoc tests. Non-normally distributed data were analyzed using Kruskall Wallis test with Dunn’s multiple comparison test. Data are presented as mean±standard error of the mean (SEM) and a p-value of <0.05 was considered as statistically significant, using SPSS version 26.0 (SPSS Inc., Chicago, IL, USA). Graphs were prepared using GraphPad Prizm version 7.03 (GraphPad, San Diego, CA, USA).
4. Discussion
The present study was conducted to address specific questions regarding: 1) the effects of early exposure of hyperoxia and neonatal IH on inflammation in the neonatal rat brain; 2) the comparative efficacy of Caff, Keto, or Ibu on inflammation in the neonatal rat brain; 3) synergistic effects of Caff and/or NSAID co-treatment for reducing hyperoxia- and IH-induced brain inflammation; 4) topical ocular Keto effects in the brain; and 5) whether early treatment during hyperoxia or IH exposure is more beneficial than late treatment during recovery/reoxygenation. We utilized a model of neonatal IH developed in our laboratory that consistently produces oxidative stress, as previously reported [
38,
39]. Using rodent models of brain injury, studies have shown that rodents at postnatal day 7-10 is developmentally similar to a term human infant [
41,
42,
43,
44]. For our experiments, we used newborn rats on the first day of life which corresponds to a very preterm infant brain. Early treatment correlated with the preterm infant brain and late treatment with the term infant brain. The major findings of these experiments were: 1) early exposure of the neonatal brain to either hyperoxia or neonatal IH impairs brain weight and development, and causes induced inflammation; 2) Given individually, Caff, and Keto, but not Ibu were most beneficial for reducing apoptosis and inflammation; 3) Caff/Keto demonstrated better synergistic effects for inducing IkB and reducing apoptosis and inflammation than Caff/Ibu; 4) topical ocular Keto enters the brain and confers beneficial effects with or without Caff; and 5) early treatment during exposure is more beneficial for inducing myelination, reducing apoptosis and overall improvement in neuro inflammation and cortical organization than late treatment during recovery/reoxygenation. These findings support our hypothesis and demonstrate that not only the choice of treatment also the timing of its administration has significant effects in the premature brain.
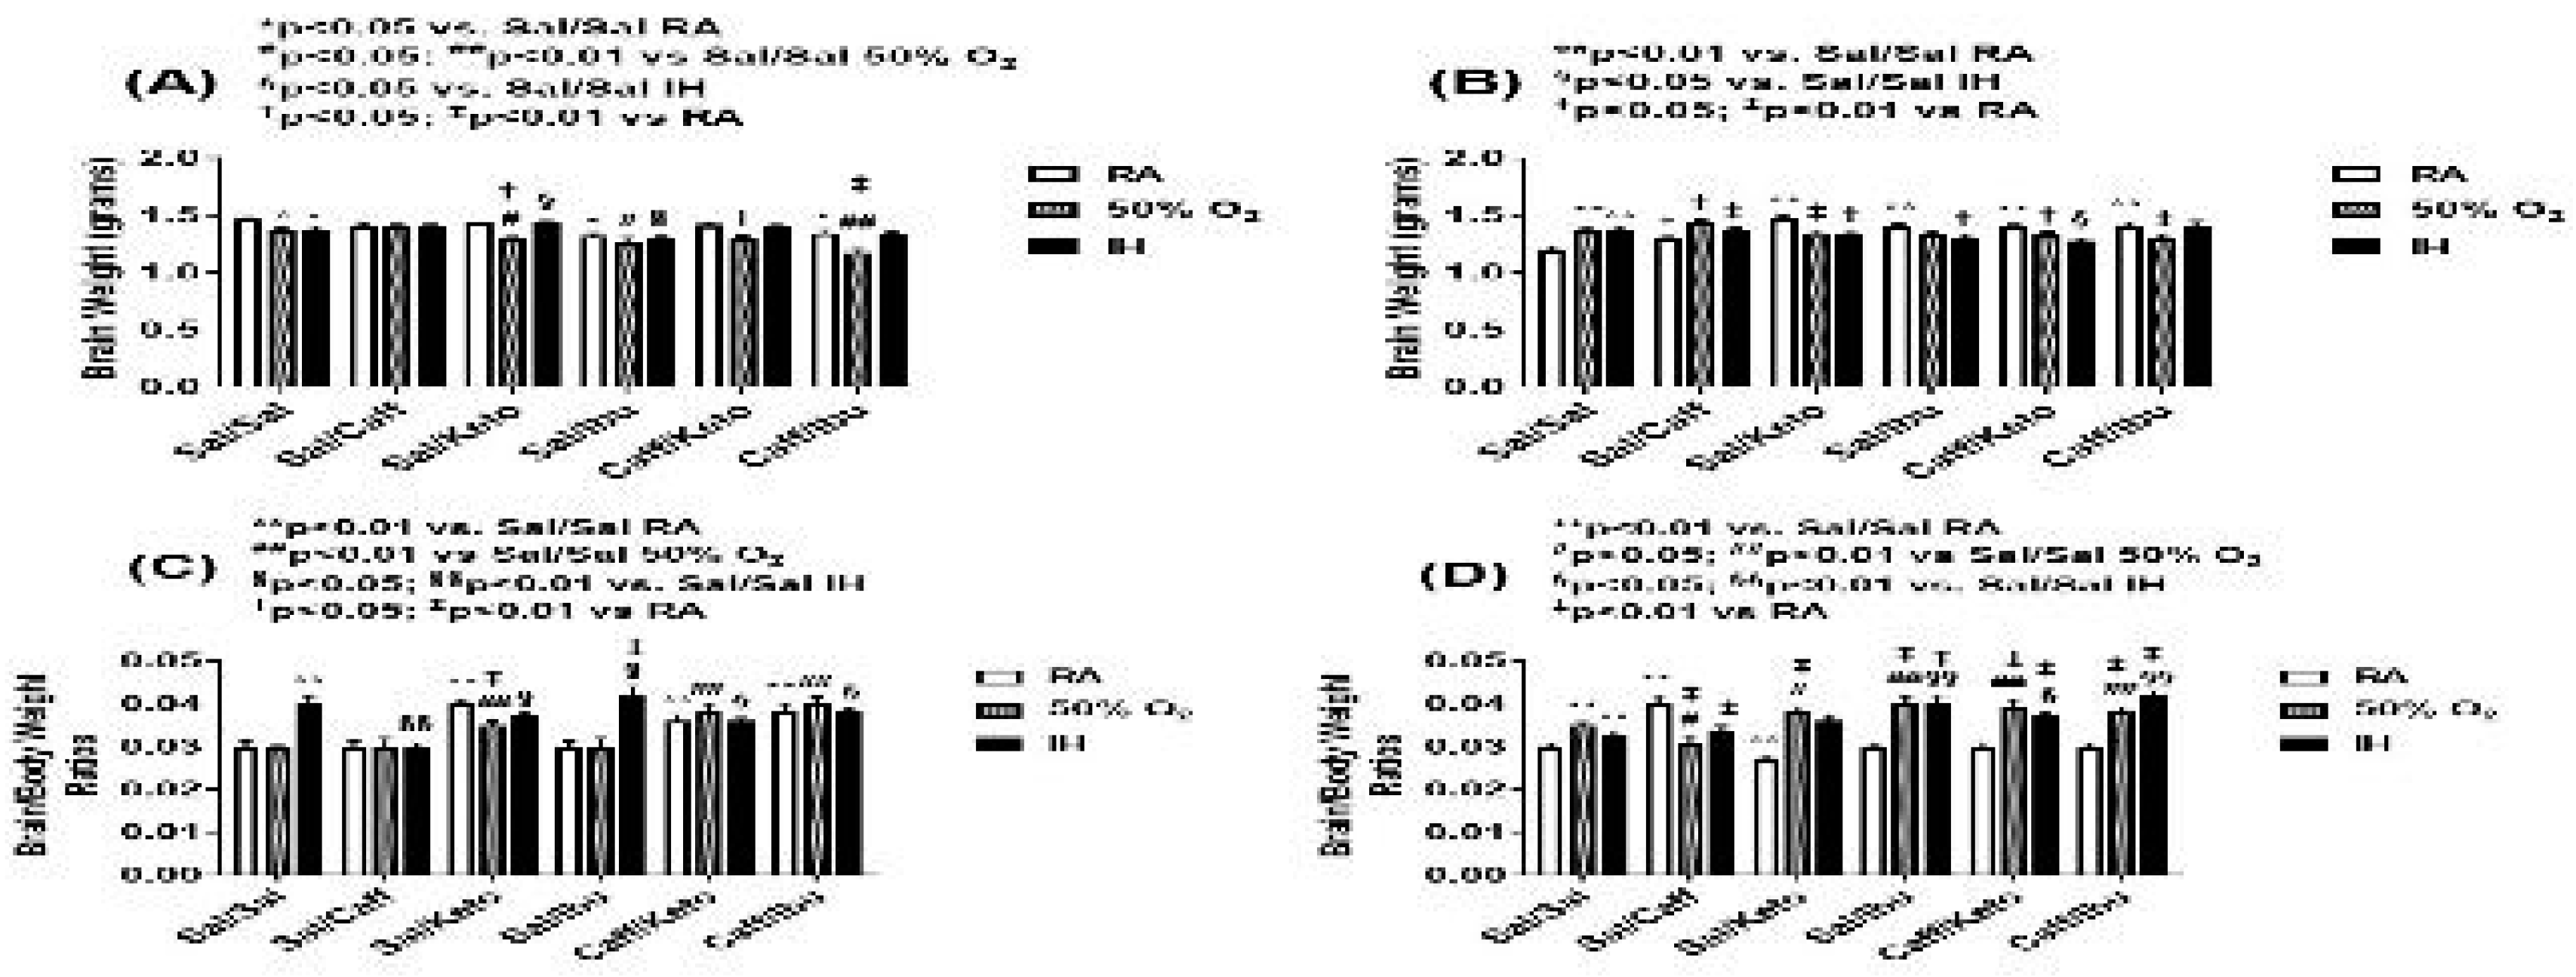
Exposure to hyperoxia and IH showed significant elevations in brain/body weight ratios, in all early groups except Caff and in late Ibu, Caff/Keto and Caff/Ibu groups. This may be due to the lower body weights in response to abnormal oxygenation [
45]. Organ weight is one of the most sensitive indicators of drug toxicity and organ weight relative to body weight accounts for changes in overall body weight [
46], and may suggest an overall physiological response to the drug. Regarding cerebral cortex organization, the RA groups showed an overall increase in cell differentiation and cortical thickness that was relatively preserved in the earlier cohort, however in the late treatment groups, the effects of increased thickness of layers I-V became less pronounced and only layer II in NSAID treatment groups remained prominent. Literature shows that layer 3 consists of pyramidal cells mainly and serves as association and commissural corticocortical fibers [
42]. With an ever-increasing body of evidence in favor of dysmaturation of white matter as the underlying mechanism of neurodysregulation of the ELGAN’s brain [
47,
48,
49]. Our findings shed further light on the effects of hyperoxia and neonatal IH on cortical cell organization and deserving further research. In the hyperoxia groups, all treatment groups were found to have increased brain volumes as shown by increased cross sectional diameters compared to RA counterparts, perhaps due to increased cellular proliferation attributable to higher oxygenation that persisted, albeit to a lesser extent, in the late treatment littermates. In cellular layer analysis, however, effects on layer 3 were largely positive in the early treatment cohort but less so in the later one. It remains to be seen whether this increase in cell mass was due to hypertrophy or hyperplasia, as this study did not aim to find the cytopathologic pathologic nature of hyperoxia-induced cell changes, but studies by Kato et. al [
9,
10] seem to suggest this.
In the IH exposed groups, gross size of the specimen was enlarged in both early and late groups even in controls, which seems to suggest that this effect was conferred by IH and not by the treatment. Further examination of the cell layers revealed that layer III remained mostly unchanged, however layers IV and VI became narrower in the early treatment groups but cell layers in late treatment cohort did not show appreciable changes from controls. This may suggest that early treatment, at a time when the brain is still developing, is detrimental to the internal granular layer. This layer, also known as the main input cortical station, receives sensory input from periphery, and layer VI or the fusiform/multiform layer comprised of axons of the fusiform cells which distribute commissural fibers and corticothalamic projections ending in the thalamus [
40]. As the early treatment coincides with cell migration stage in the preterm population, perhaps reduced cell migration and axonal projection lead to suppression of abnormal circuitry that contribute to sensory and emotional disturbances that are a hallmark of neonatal brain injury. Furthermore, late treatment did not produce similar cell layer findings suggesting that after migration, cells are less susceptible to the adverse effects of hyperoxia and/or IH.
The t½ of Caff is about 4 days, while Keto and Ibu are eliminated much faster, having a half-life of 4-6 hours. This would suggest that treatment with Ibu, as happens with PDA closure, would confer short term anti-inflammatory effects while Caff would provide more sustained and pervasive effects in the tissue. The findings from our study suggest however that the effect of the NSAID’s on brain differentiation is related more to the dosing being timed with stages of neural tissue development than their duration of action. The effects of topical ocular Keto alone and in conjunction with Caff indicate that the drug crosses the blood-ocular barrier and enters into the brain, and provides further evidence of a connection between the eye and the brain [
50].
Both early and late treatment with Keto and Caff/Keto reduced apoptosis or programmed cell death in all exposures, while Caff, Ibu or their combination was not effective. This seems to suggest that Caff may have diminished neuroprotective in chronic hyperoxia and IH even with Ibu co-treatment. This must also be seen in the context of apoptosis that occurs in later stages of preterm brain maturation as part of normal neuronal development once cells have reached their “programmed” destination in the brain [
49]. Many studies have shown that Caff alone [
51] and with morphine induces apoptosis [
52]. The mechanism of Caff induction of apoptosis even in RA conditions, remains to be determined.
Myelination is considered a proxy for white matter (WM) development and has been positively correlated with brain development [
53,
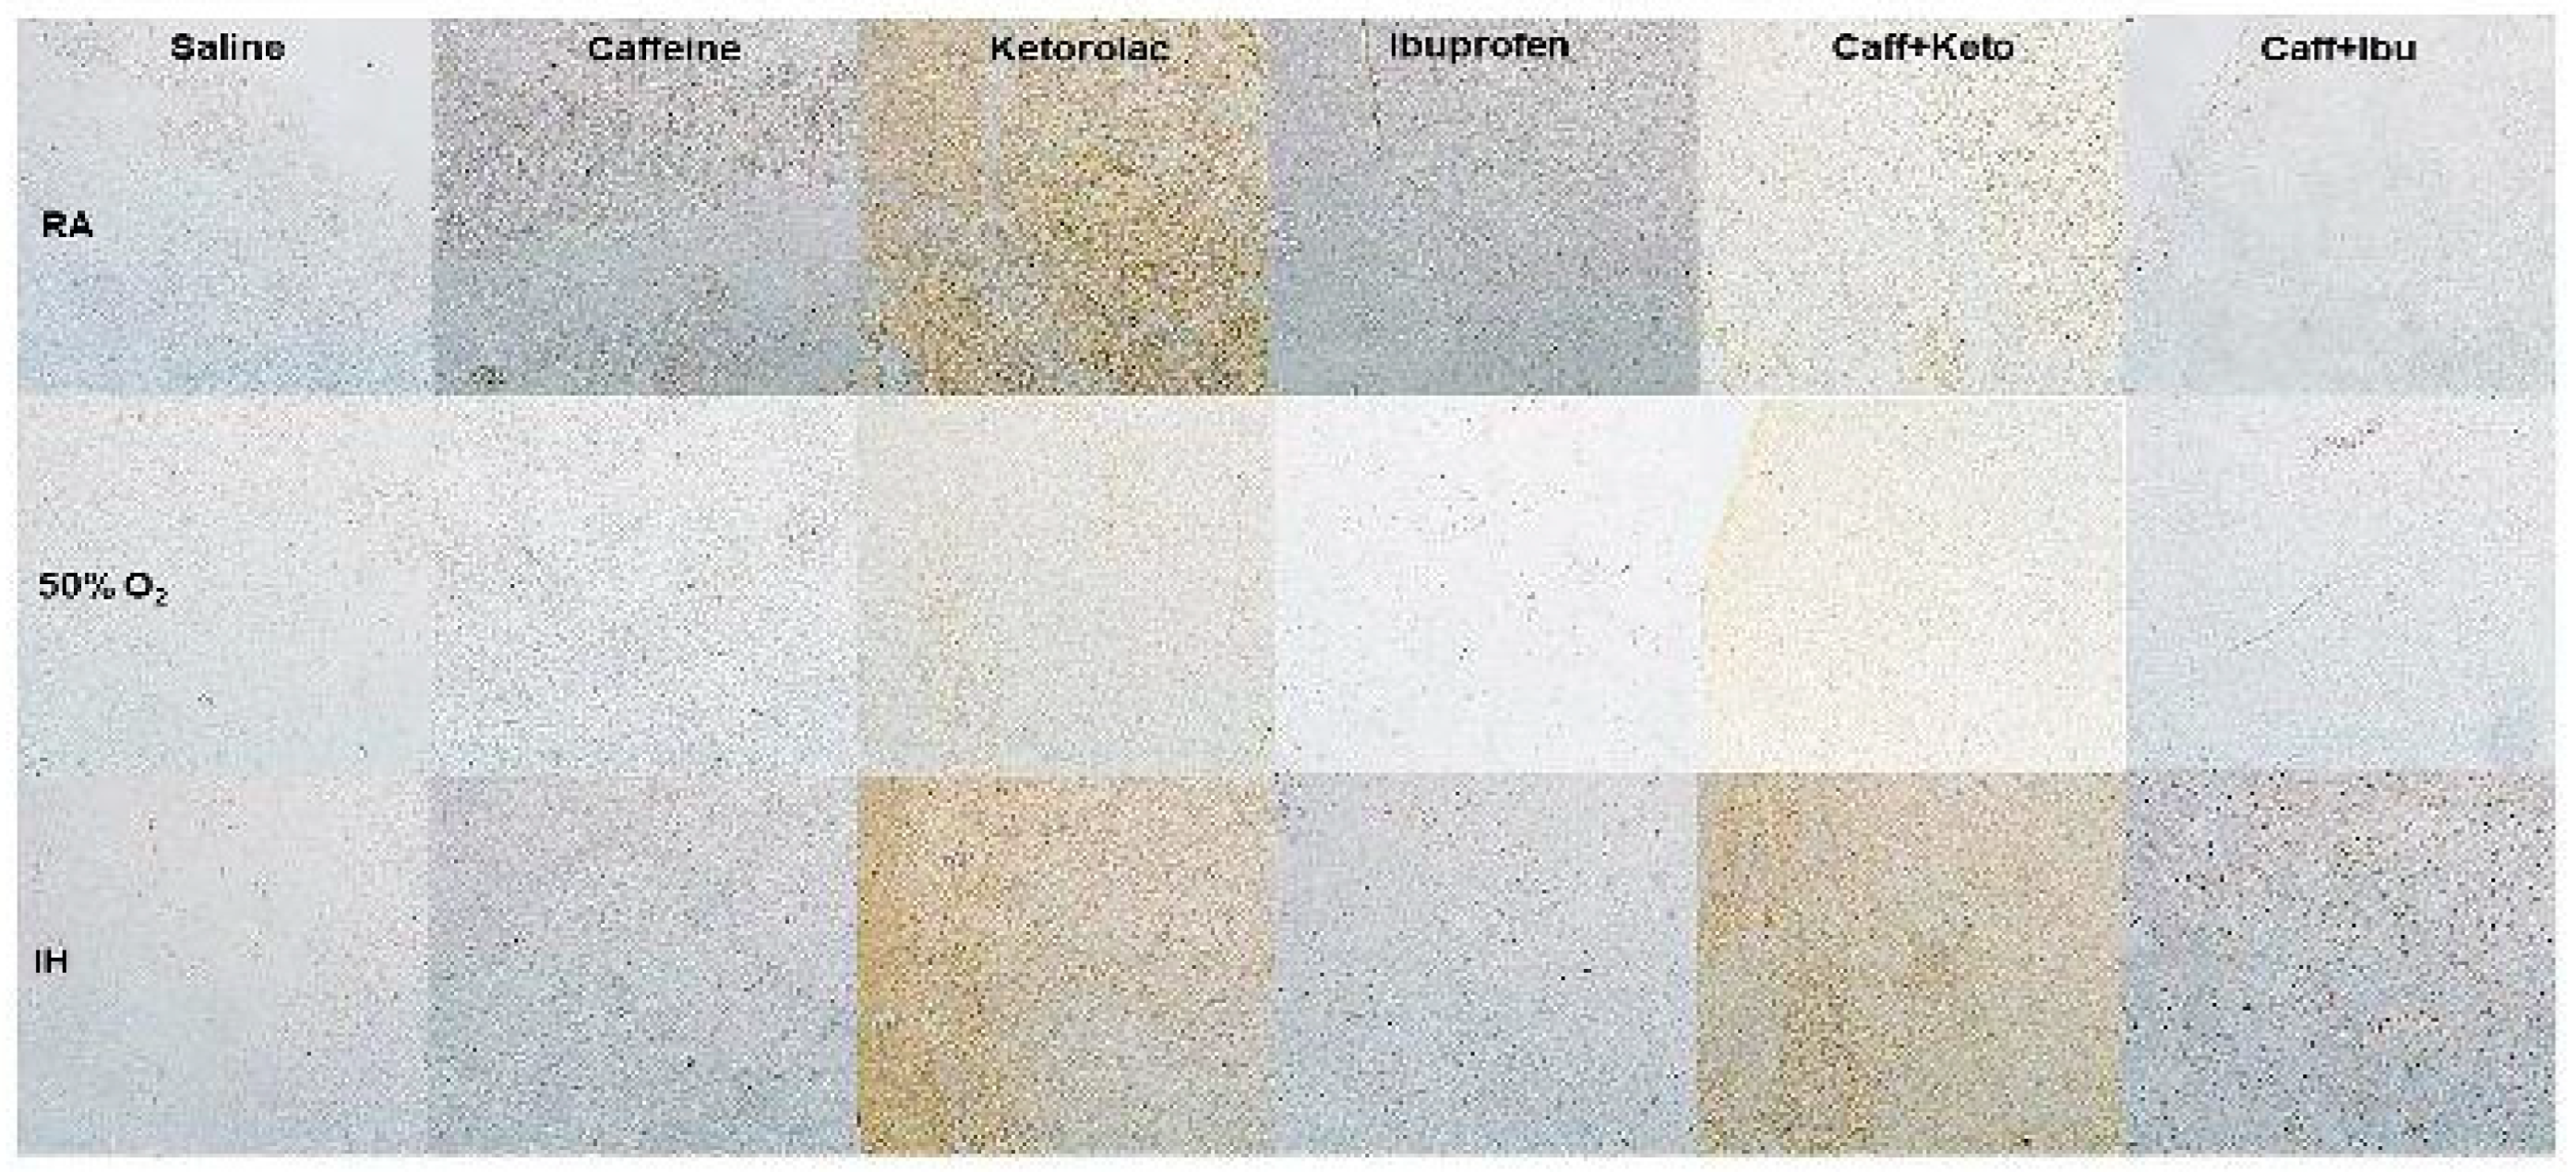
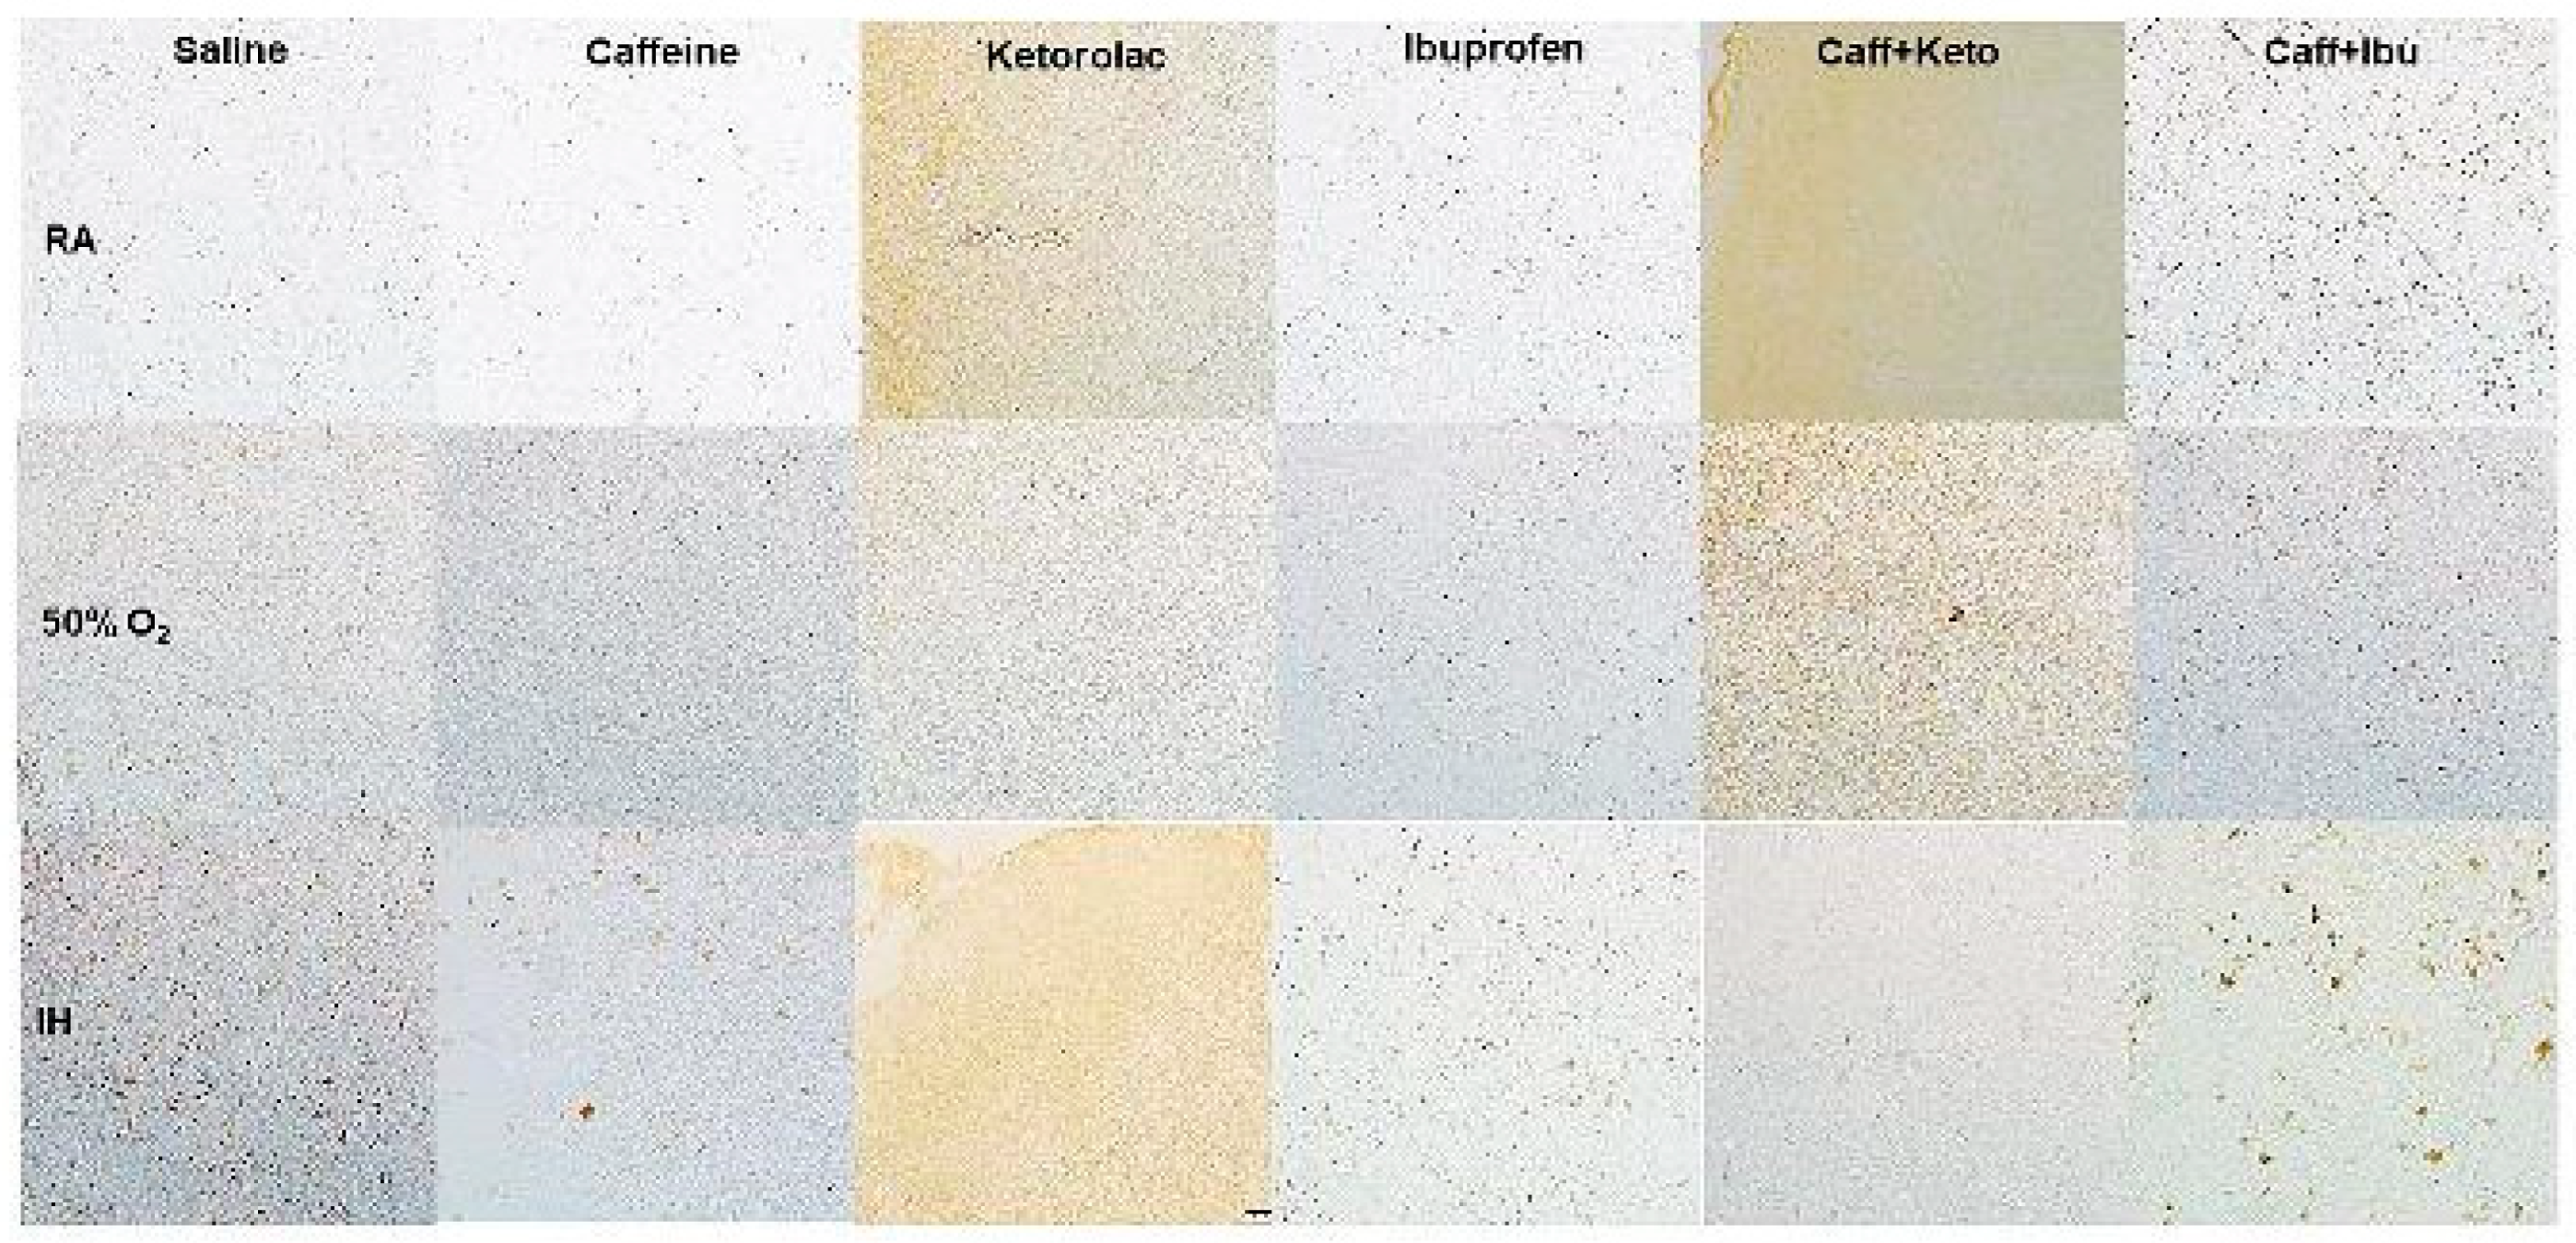
54]. In our study, early Ibu and Caff/Ibu in RA as well as hyperoxia seemed to favor, while late treatment caused reduced myelination. This confirms that late treatment may be more injurious. Overall, IH seems to negatively affect the process of myelination regardless of early or late treatment. This finding confirms previous reports which shows irreversible dysmyelination with chronic hypoxia and intermittent hypoxia [
55]. Although several of the treatment groups showed higher myelination, it is debatable whether function is correlated with these quantities. WM dysmaturation studies have shown that increased activity of pre-OL's is responsible for abnormal corticofugal tracks, helping the authors form the theory that perhaps better markers of “meaningful myelination” need to be found as predictors of brain development [
49].
Studies have shown that separate IkB molecules preferentially inhibit distinct Rel/NF-kB protein dimers [
56]. This interaction enables the IkB proteins to mask the nuclear localization signal and prevent nuclear translocation of Rel/NFkB protein dimers. Many aspects of the inflammatory responses are also controlled by NFkB including the production of acute-phase proteins such as serum amyloid A, angiotensinogen and factors of the complement cascade and the induction of pro- inflammatory cytokines such as IL-1 (both α and β) and TNFα [
57]. IkB is a the most studied inhibitor of NFkB. During activation of NFkB, numerous stimuli, including IL-1 and TNFα, activate a complex of IkB kinases to degrade IkB [
58]. While there were no appreciable differences in NFkB, we showed that Ibu alone and in combination with Caff induces IkB, although early treatment was more effective that late treatment. Since Ibu is a potent anti-inflammatory drug, it is likely that those effects may be in part due to induction of IkB. To our knowledge, this is the first report of Ibu effect on IkB in the brain, in the setting of hyperoxia or IH. However, studies have shown a suppressive effect of Ibu on NFkB in respiratory cells [
59].
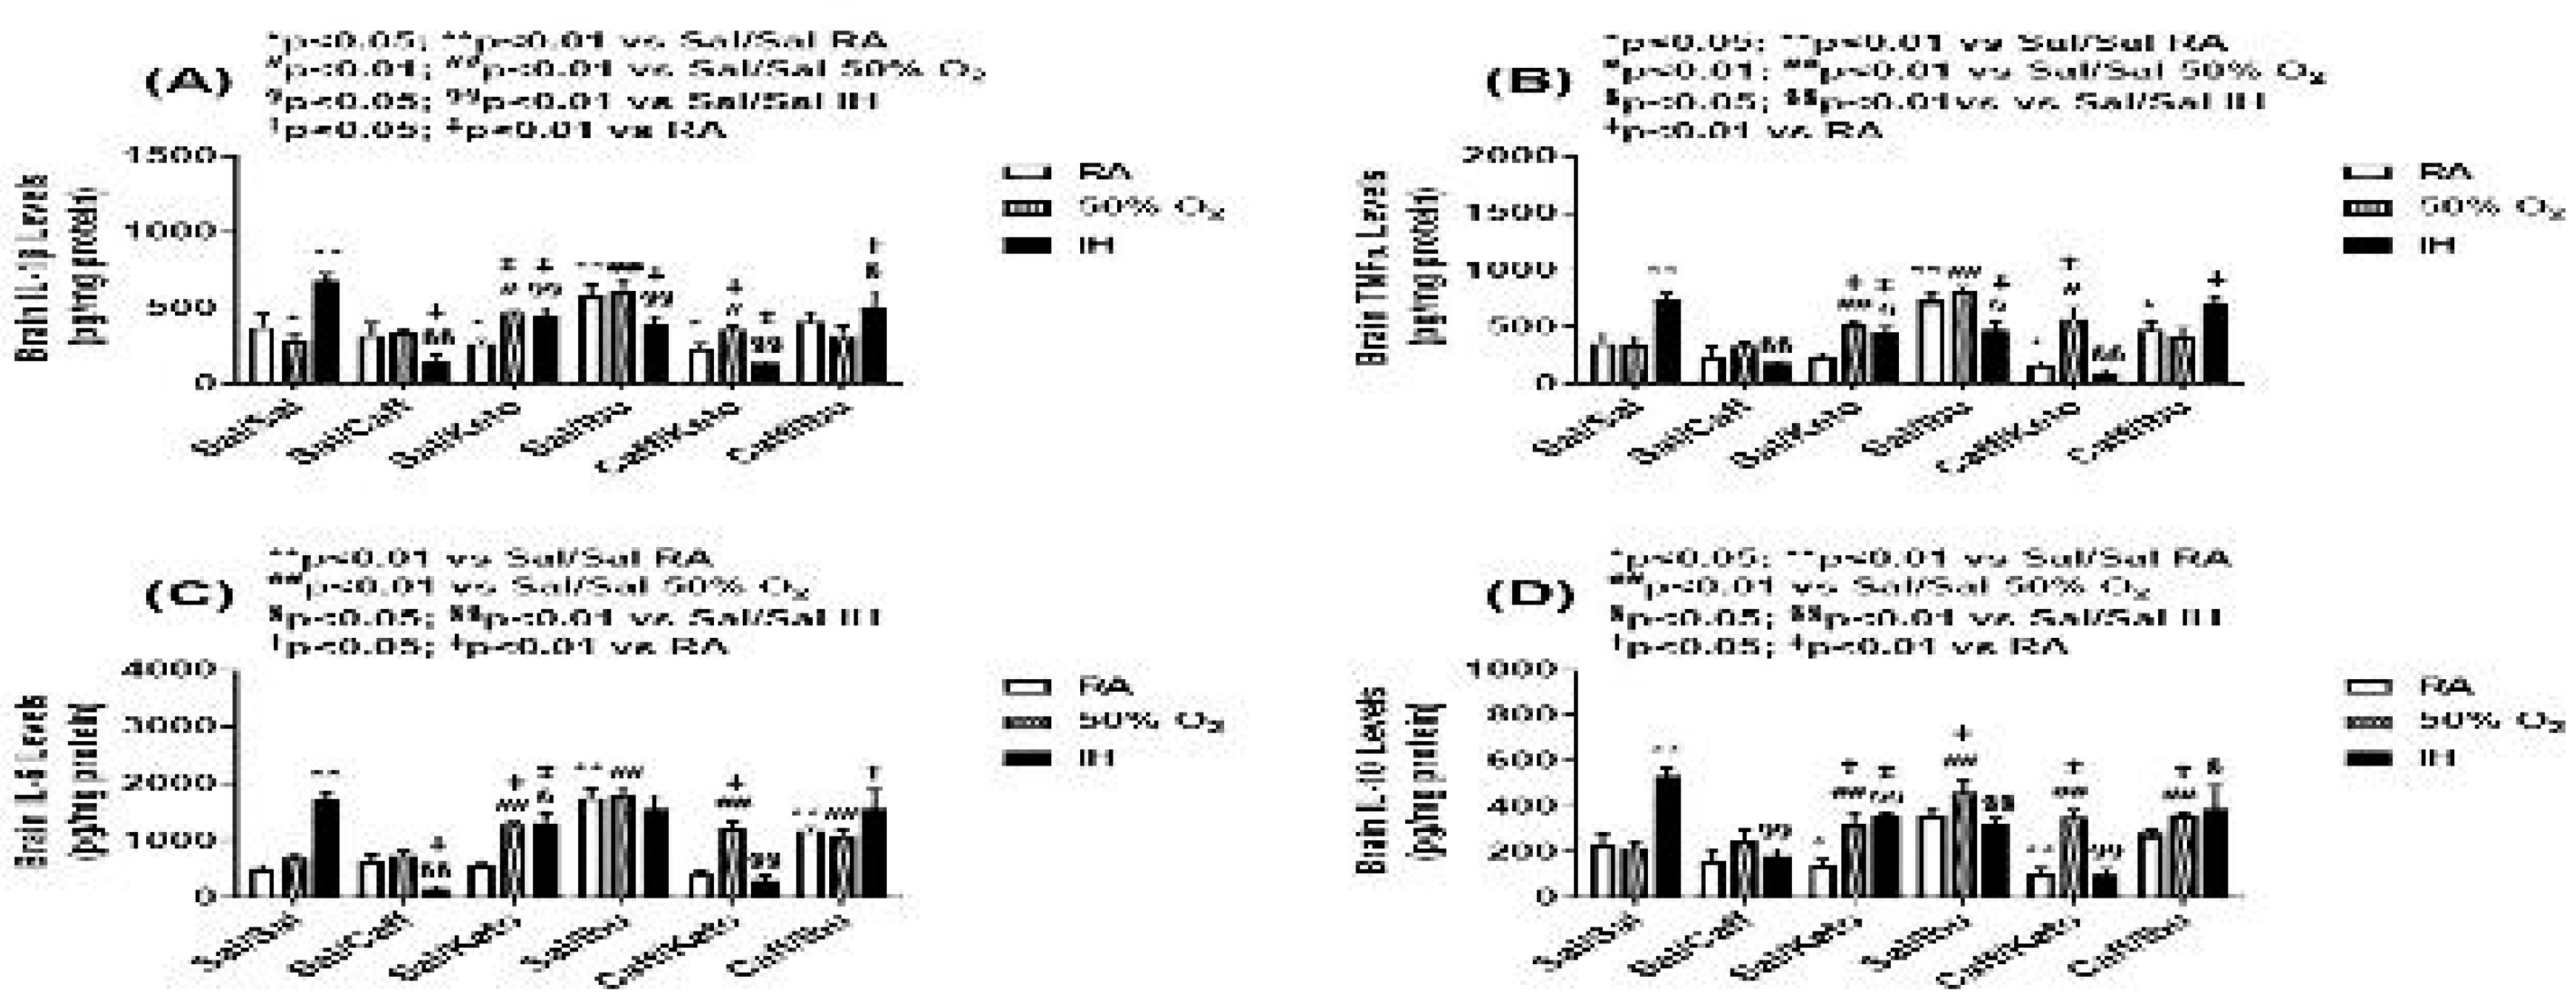
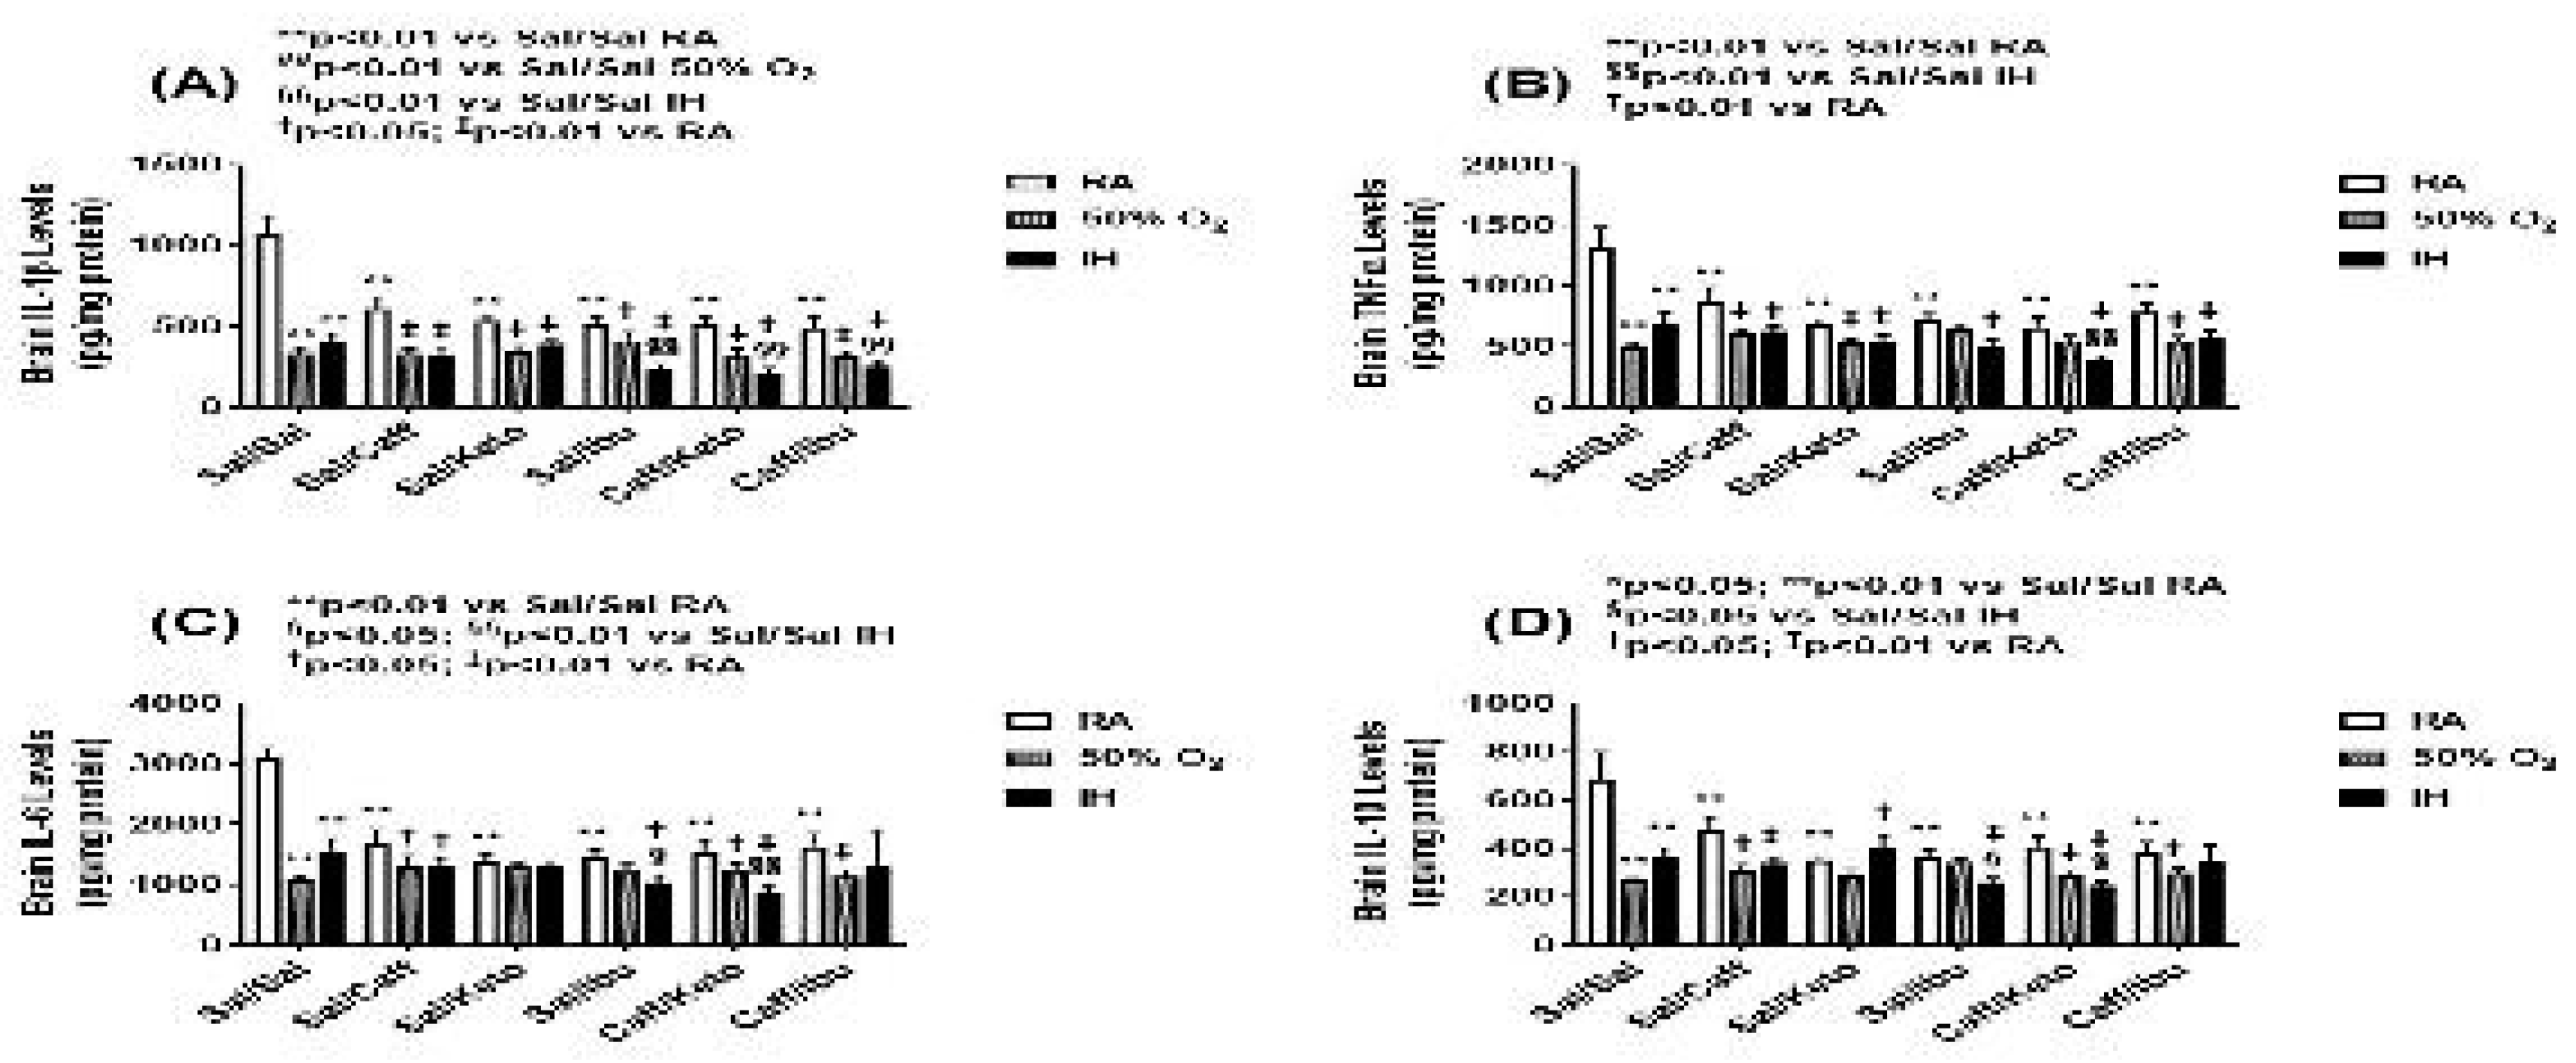
The other cytokines namely Il-1β, IL-6, and TNFα, seem to vary in their relationship as predictors of response to drug treatment in different oxygen environments. In the CNS, cytokines exert their function through both traditional engagement of their receptors, which are expressed by both glial and neuronal cells and through less traditional means such as modulation of neurotransmitter receptor function. For example, IL-1 modulates γ-aminobutyric acid-responsive neurotransmitter receptors to enhance inhibitory responses, and both IL-1 and IL-6 modulate synaptic plasticity through inhibiting formation of long-term potentiation [
60]. Excitotoxicity is a major pathway of neuronal cell death that is associated with ischemia, trauma, and neurodegenerative diseases and results from an uncontrolled elevation in intracellular calcium that enters the cell through chronically activated N-methyl-D-aspartatic acid receptors. Agents such as antioxidants, growth factors, and certain cytokines protect against excitotoxicity [
61]. In RA, IL-1β, IL-6, and TNF-α seem to show similar trends, with a reduction in both early and late NSAID treatment groups. In the presence of hyperoxia, Il-1β, and TNFα behave similarly and are reduced in response to early NSAID treatment, but IL-6 seems to rise, suggesting a mechanism of action different than the other 2. IL-6 has often been proposed as the “exercise factor” as it rises in response to strenuous exercise [
62]. Perhaps hyperoxia seems to affect IL-6 differently by virtue of its response to increased oxygen as seen in exercise and our hyperoxia model. Response to Caff is interesting in that all cytokines show an increase in early group, suggesting perhaps that Caff alone can work through cyclic AMP and adrenaline to increase their levels. In later treatment, this effect is seen in the Caff/Ibu group, suggesting decreased effect of Ibu and confirming beneficial synergism with Caff. In IH, all cytokines seem to decrease with treatment, suggesting a role for use these neuroprotective agents in IH.
Although the present study has clinical significance, there are limitations. We did not examine the responses at P14. This would have provided further information regarding immediate effects of the exposures with or without treatment. We also did not differentiate between the outcomes of male and female as gender may be confounding factor in response to neuroprotective therapies. Nevertheless, our study shows that the use of Caff and/or NSAIDs during early postnatal life appears to confer better neurologic outcomes in terms of cortical development and neuroinflammation, when given in the setting of hyperoxia or neonatal IH. In contrast, later treatment has reduced efficacy for promoting myelination and normal cortical development. These findings suggest that achieving better oxygenation to ensure desired effects of neonatal management with Caff and/or NSAIDs should remain a priority. We also showed that the developing brain responds to hypoxia by upregulating programmed cell death, confirming previous studies [
63,
64].
Author Contributions
For research articles with several authors, a short paragraph specifying their individual contributions must be provided. The following statements should be used “Conceptualization, M.B., J.V.A. and K.D.B.; methodology, M.B., C.L.C. and K.D.B.; validation, J.V.A and K.D.B.; formal analysis, M.B., C.L.C, K.D.B., investigation, M.B., C.L.C. and K.D.B.; resources, J.V.A. and K.D.B.; data curation, M.B. and K.D.B.; writing—original draft preparation, M.B.; writing—review and editing, M.B., C.L.C., J.V.A., and K.D.B.; visualization, M.B. and K.D.B.; supervision, J.V.A. and K.D.B; project administration, J.V.A. and K.D.B.; funding acquisition, J.V.A. All authors have read and agreed to the published version of the manuscript.
Figure 1.
Experimental Design of Early and Late Treatment. RA (room air); 50% O2 (50% oxygen); IH (intermittent hypoxia); IP (intraperitoneal), OC (topical ocular); P0-P2 (postnatal day 0 to postnatal day 2); P0-P14 (postnatal day 0 to postnatal day 14); P15-P17 (postnatal day 15 to postnatal day 17); P15-P21 (postnatal day 15 to postnatal day 21).
Figure 2.
Effect of neonatal intermittent hypoxia (IH) and early or late caffeine/NSAIDs treatment on brain weight and brain/body weight ratios. Panels A and C represent the early treatment, respectively; and panels B and C represent the late treatment, respectively. The solid white bar represents the groups exposed to room air (RA), the checked bar represents the groups exposed to 50% O2; and the solid black bar represents the groups exposed to neonatal IH. Groups are labeled as follows: Sal/Sal (ocular saline/IP saline); Sal/Caff (ocular saline/IP caffeine); Sal/Keto (IP saline/ocular ketorolac); Sal/Ibu (ocular saline/IP ibuprofen); Caff/Keto (IP caffeine/ocular ketorolac); and Caff/Ibu (IP caffeine/IP ibuprofen). Data are mean±SEM (n=18 samples per group).
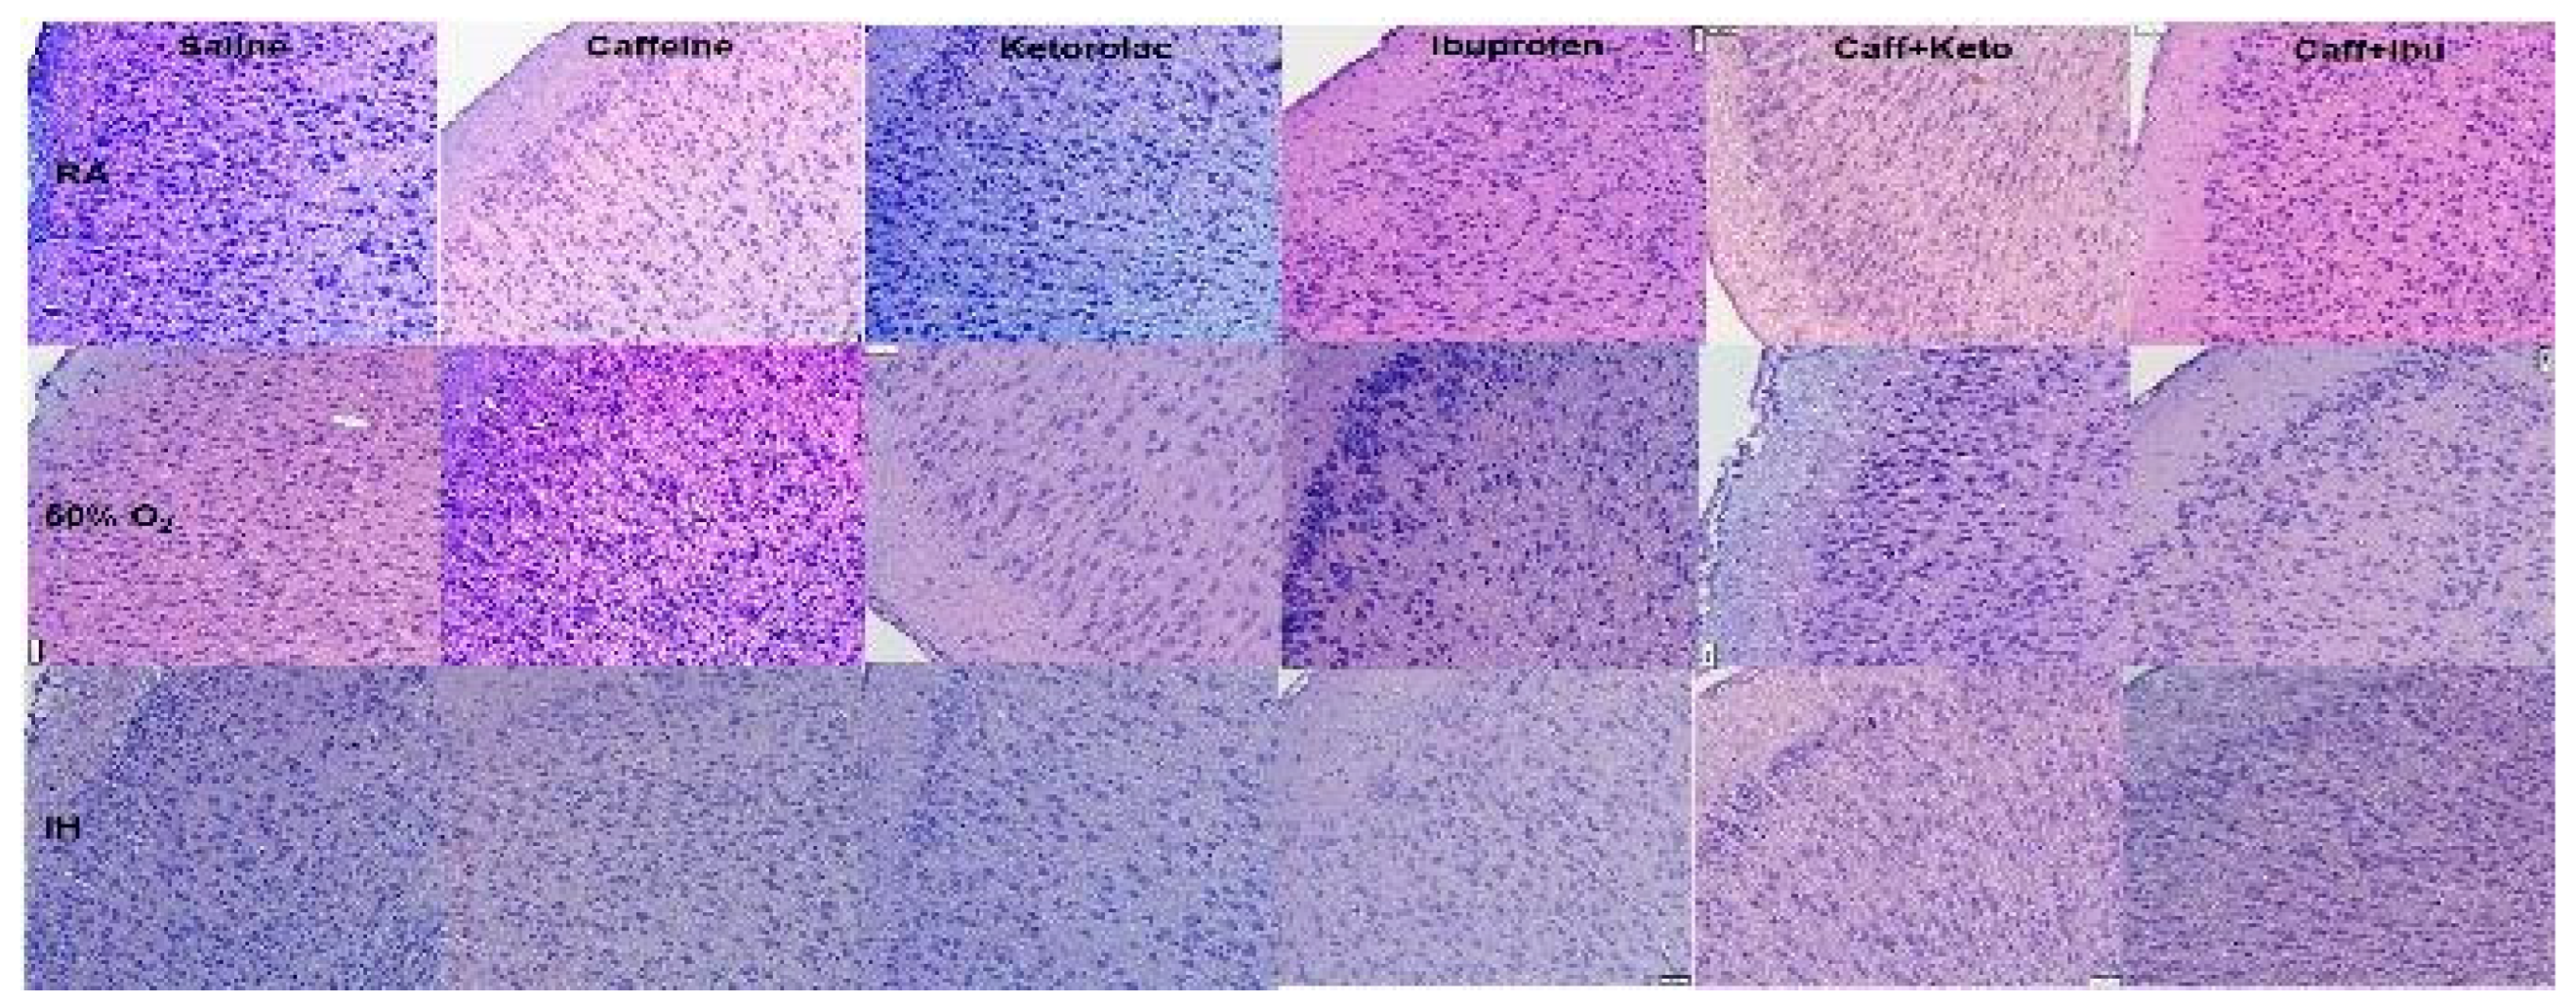
Figure 3.
Representations of the H&E stained cerebral cortex sections for the early treatment groups. The upper panels represent the groups exposed to RA; the middle panels represent the groups exposed to hyperoxia (50% O2); and the lower panels represent the groups exposed to neonatal IH. Images are 20X magnification, scale bar is 50 µm.
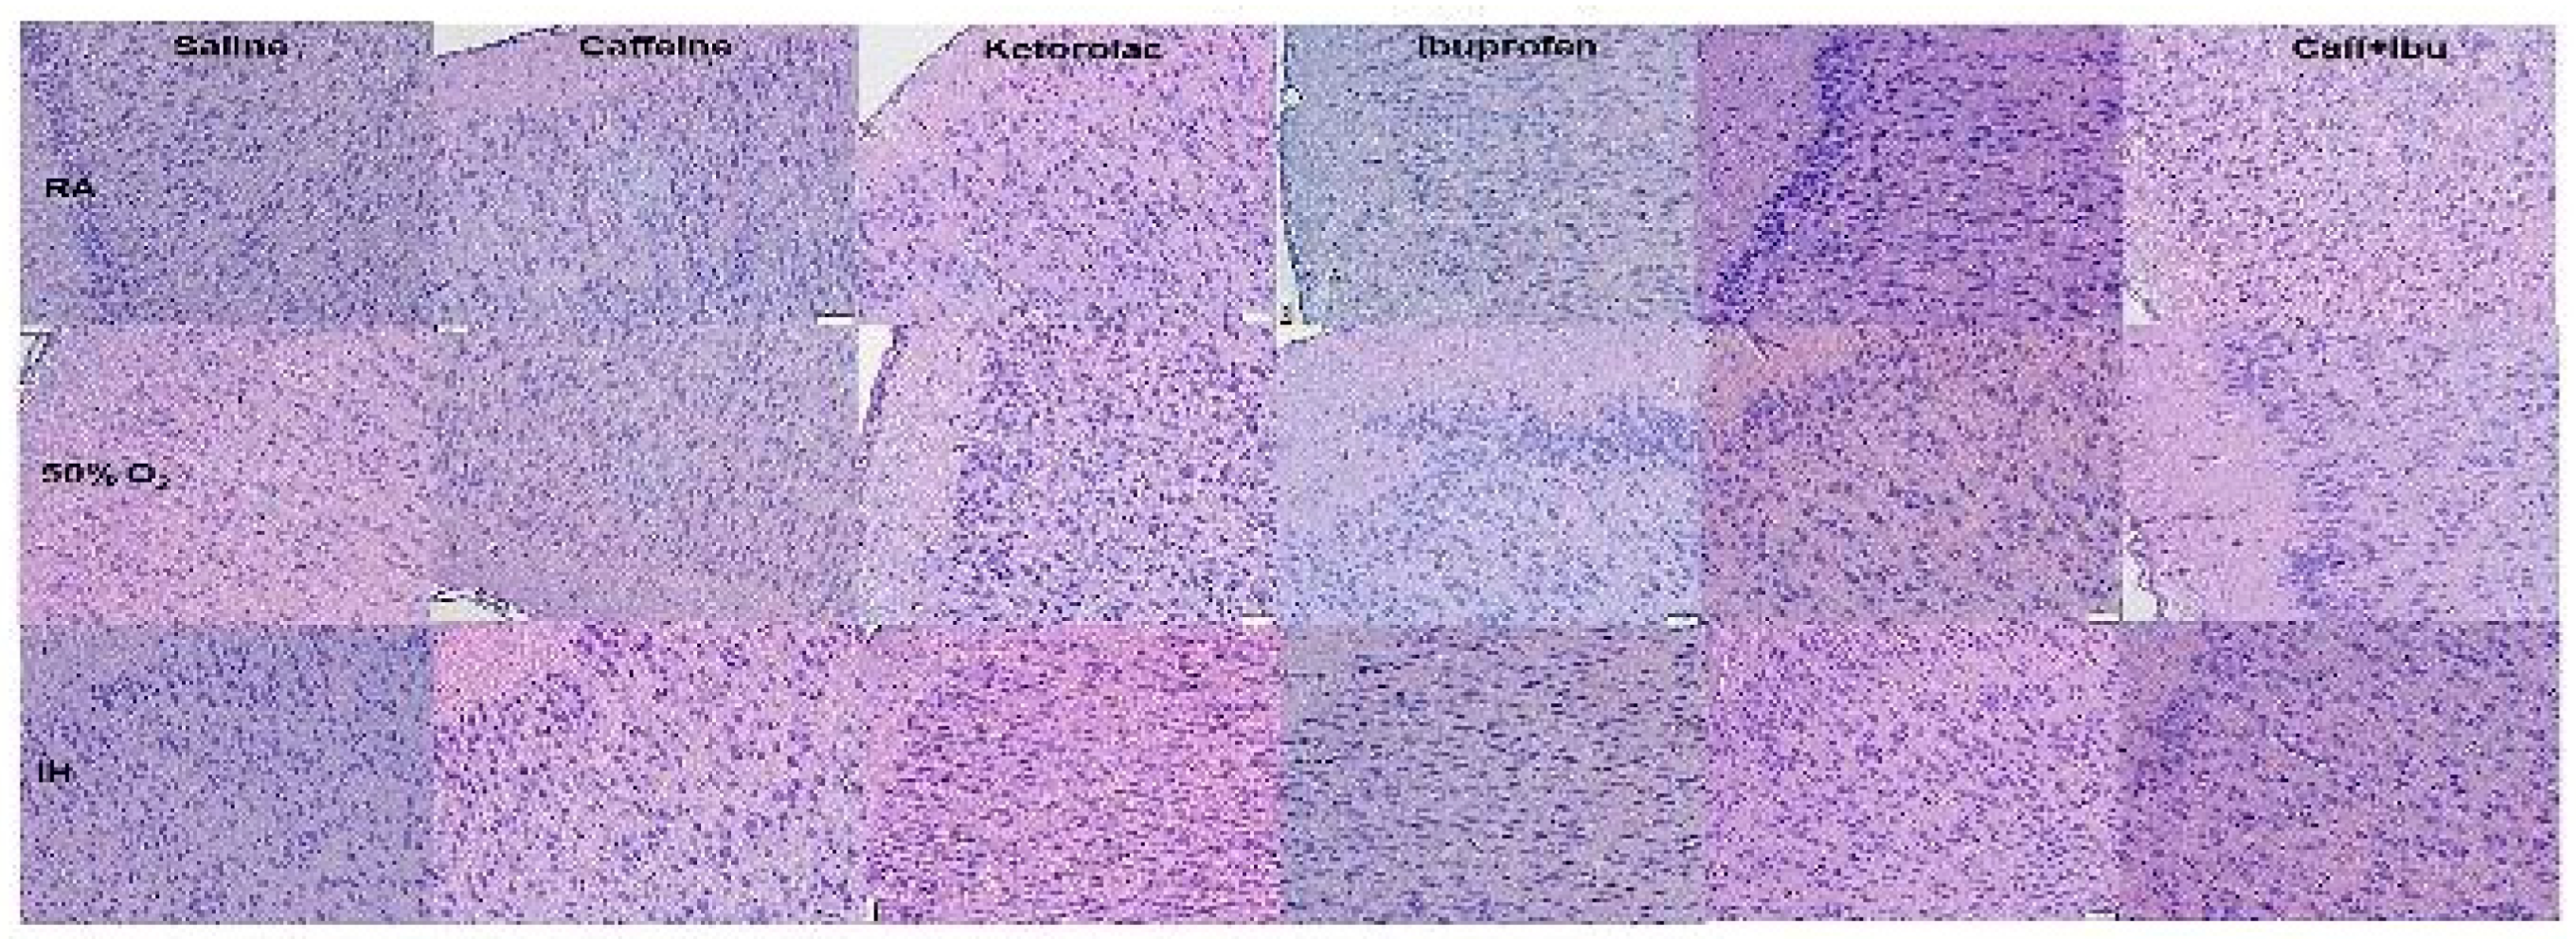
Figure 4.
Representations of the H&E stained cerebral cortex sections for the late treatment groups. The upper panels represent the groups exposed to RA; the middle panels represent the groups exposed to hyperoxia (50% O2); and the lower panels represent the groups exposed to neonatal IH. Images are 20X magnification, scale bar is 50 µm.
Figure 5.
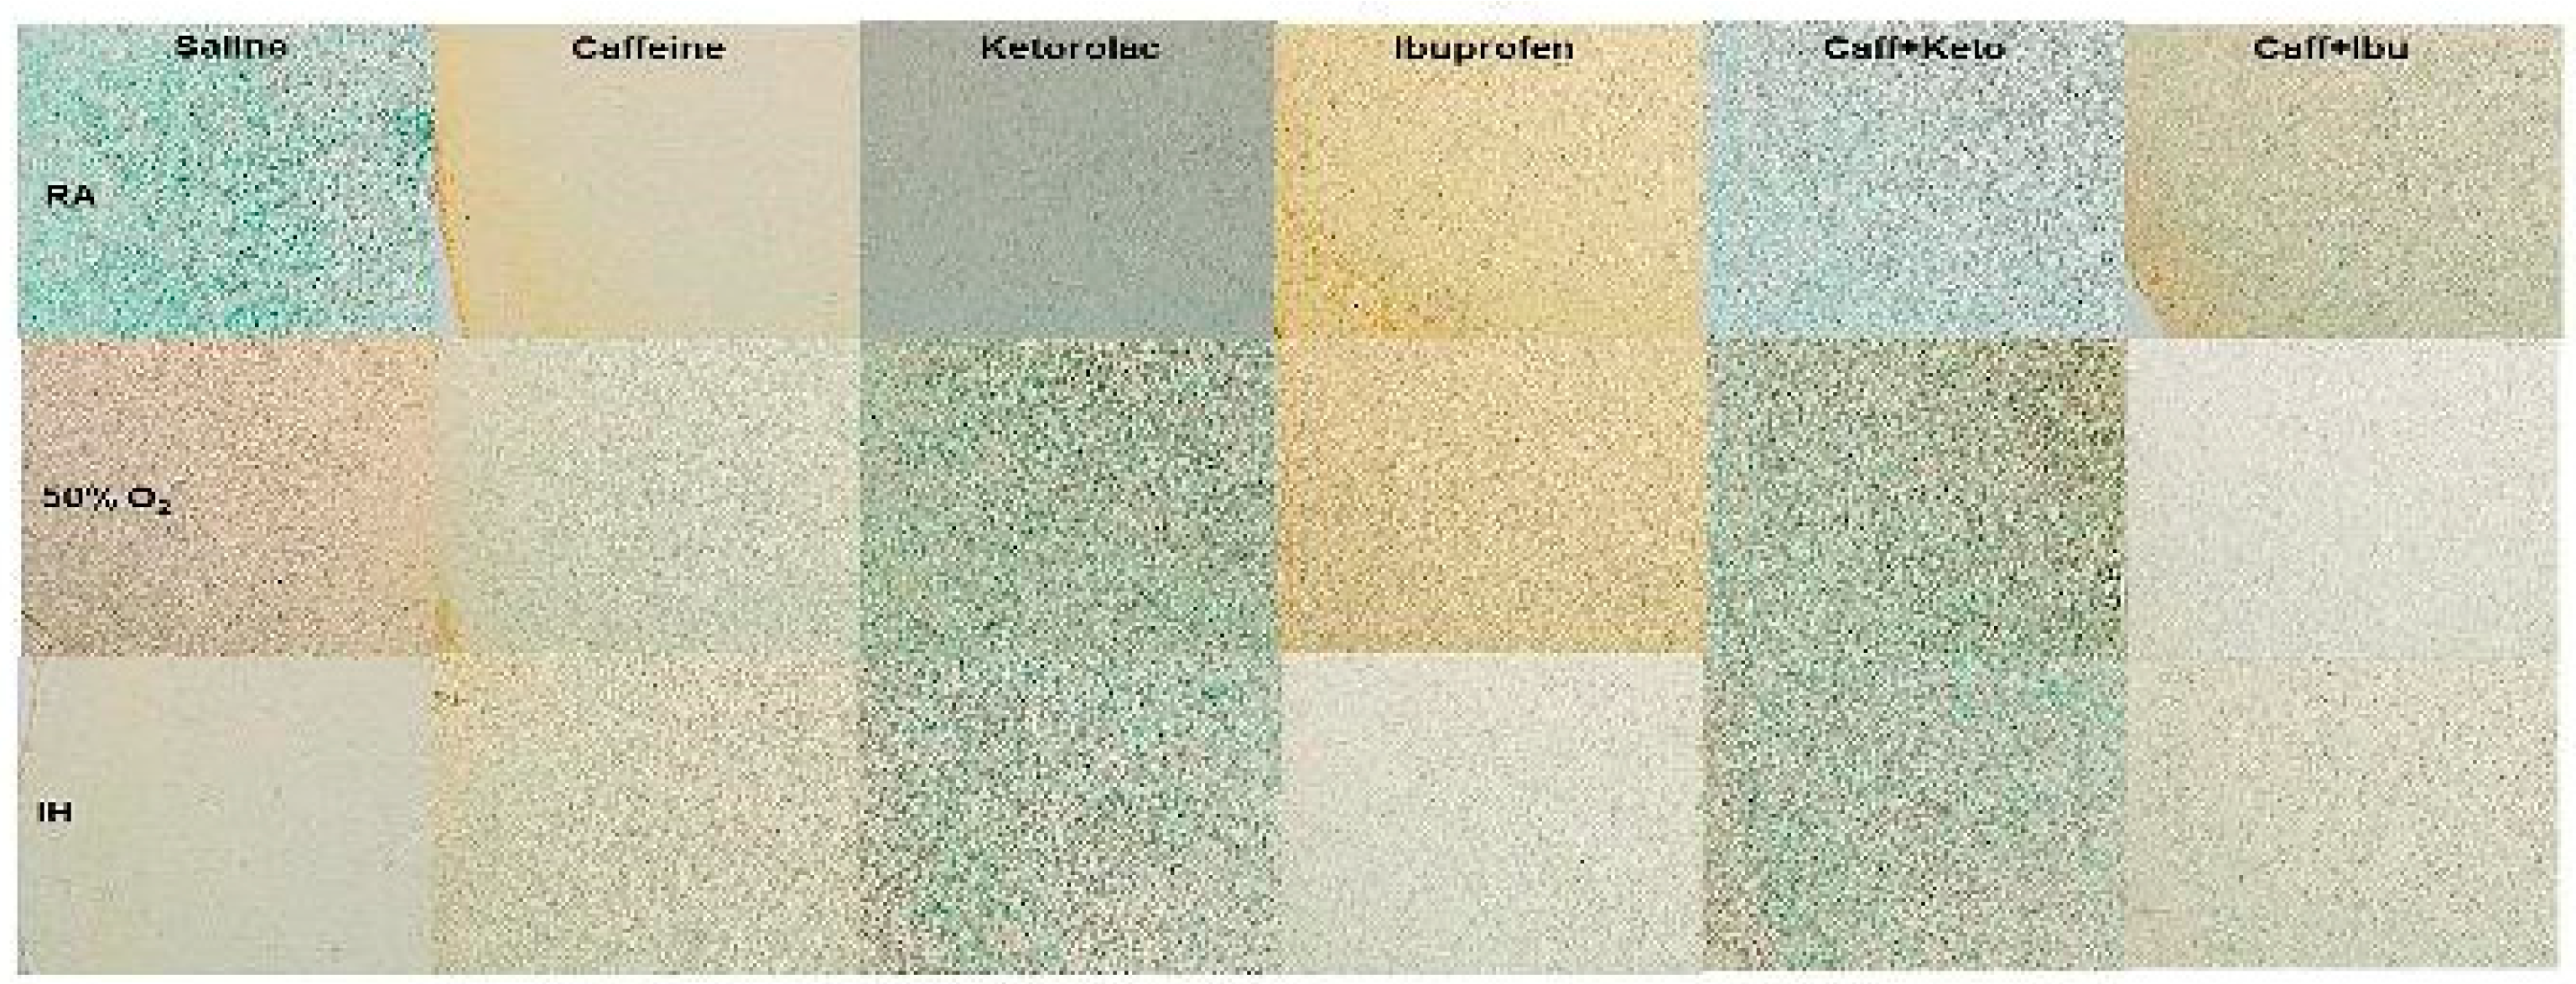
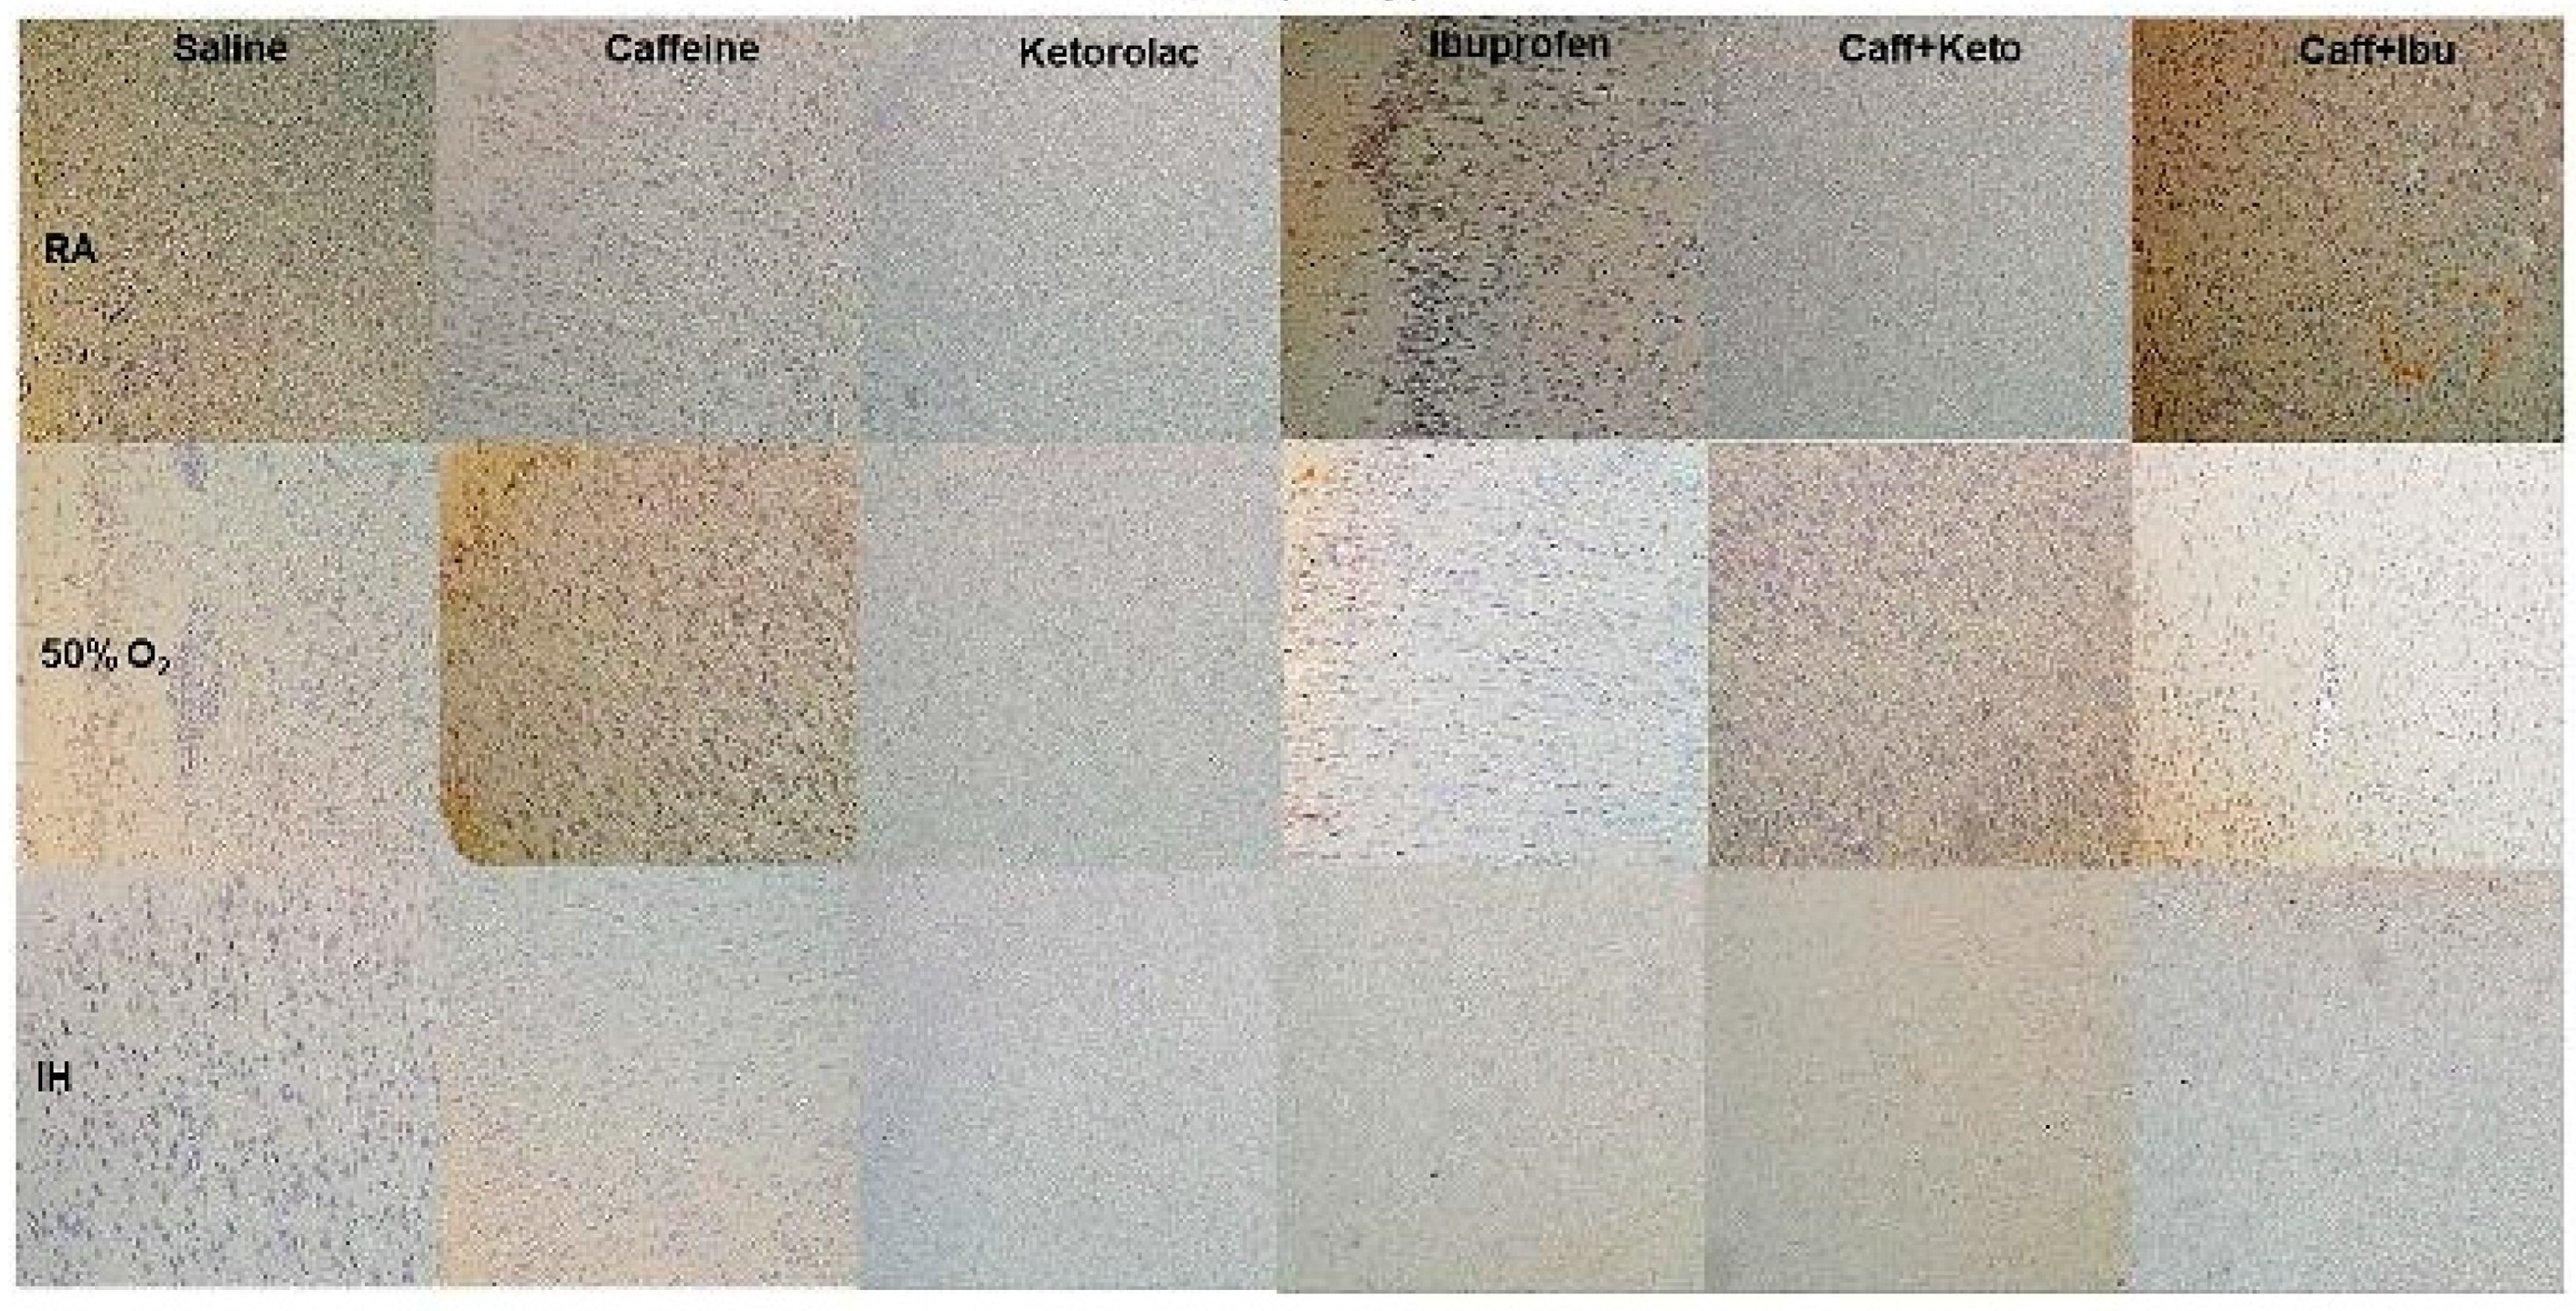
Representations of the TUNEL stained cerebral cortex sections for the early treatment groups. The upper panels represent the groups exposed to RA (room air); the middle panels represent the groups exposed to hyperoxia (50% O2); and the lower panels represent the groups exposed to neonatal IH (intermittent hypoxia). Caff (caffeine); Keto (ketorolac); Ibu (ibuprofen). Apoptosis is indicated by the brown stain. Sections were counter stained with methyl green which indicates negativity. Images are 20X magnification, scale bar is 50 µm.
Figure 6.
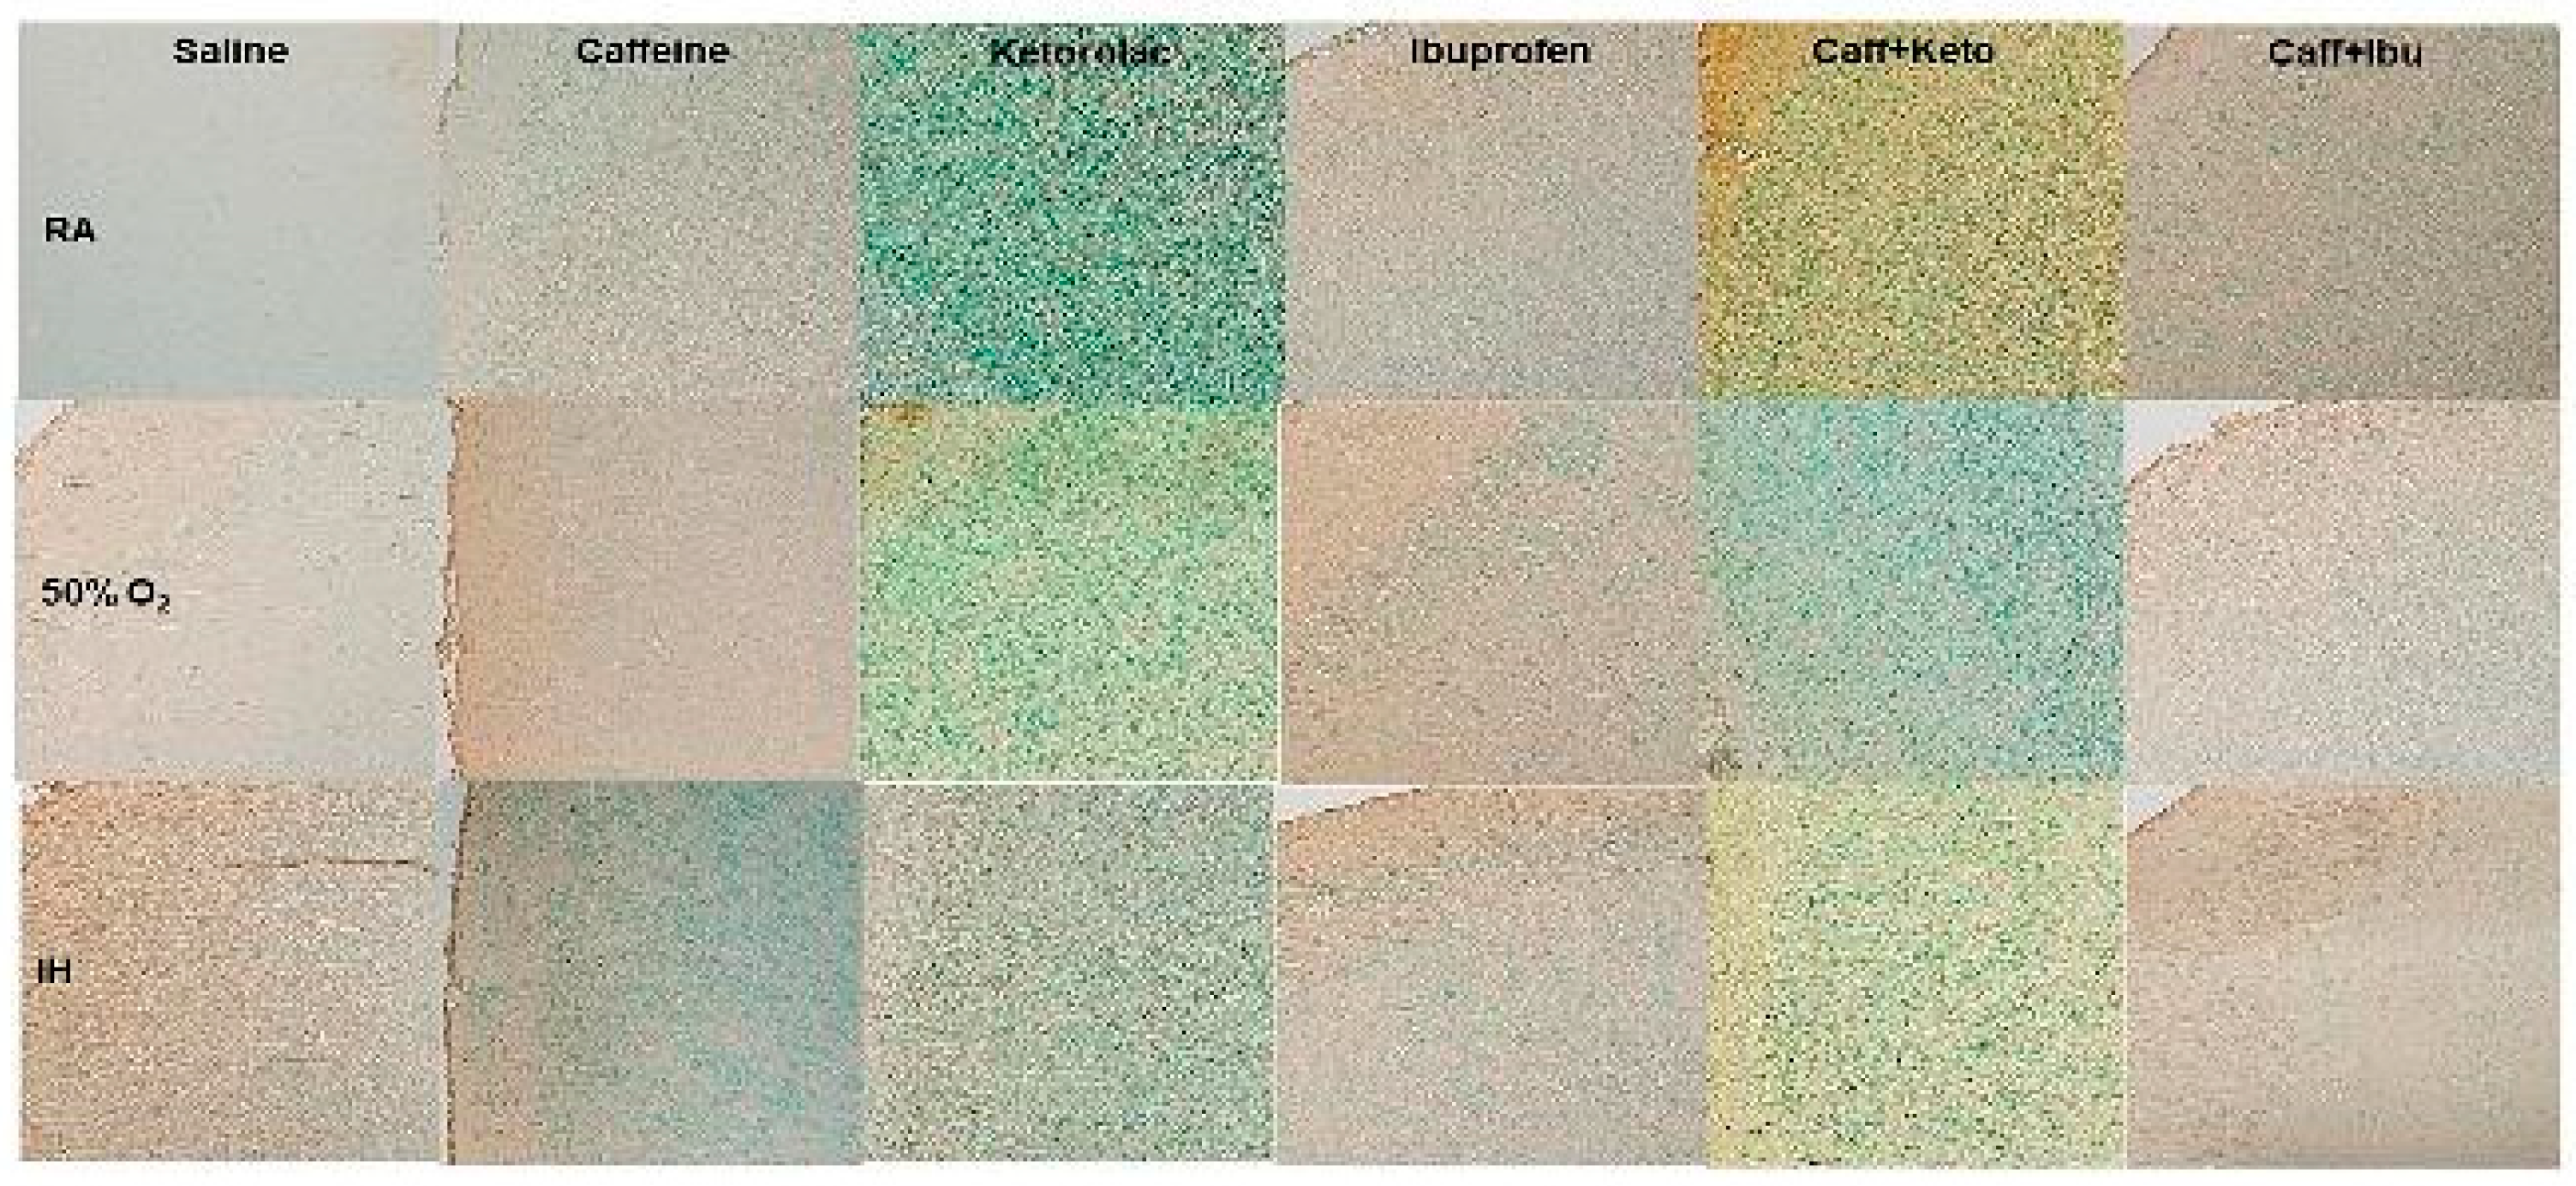
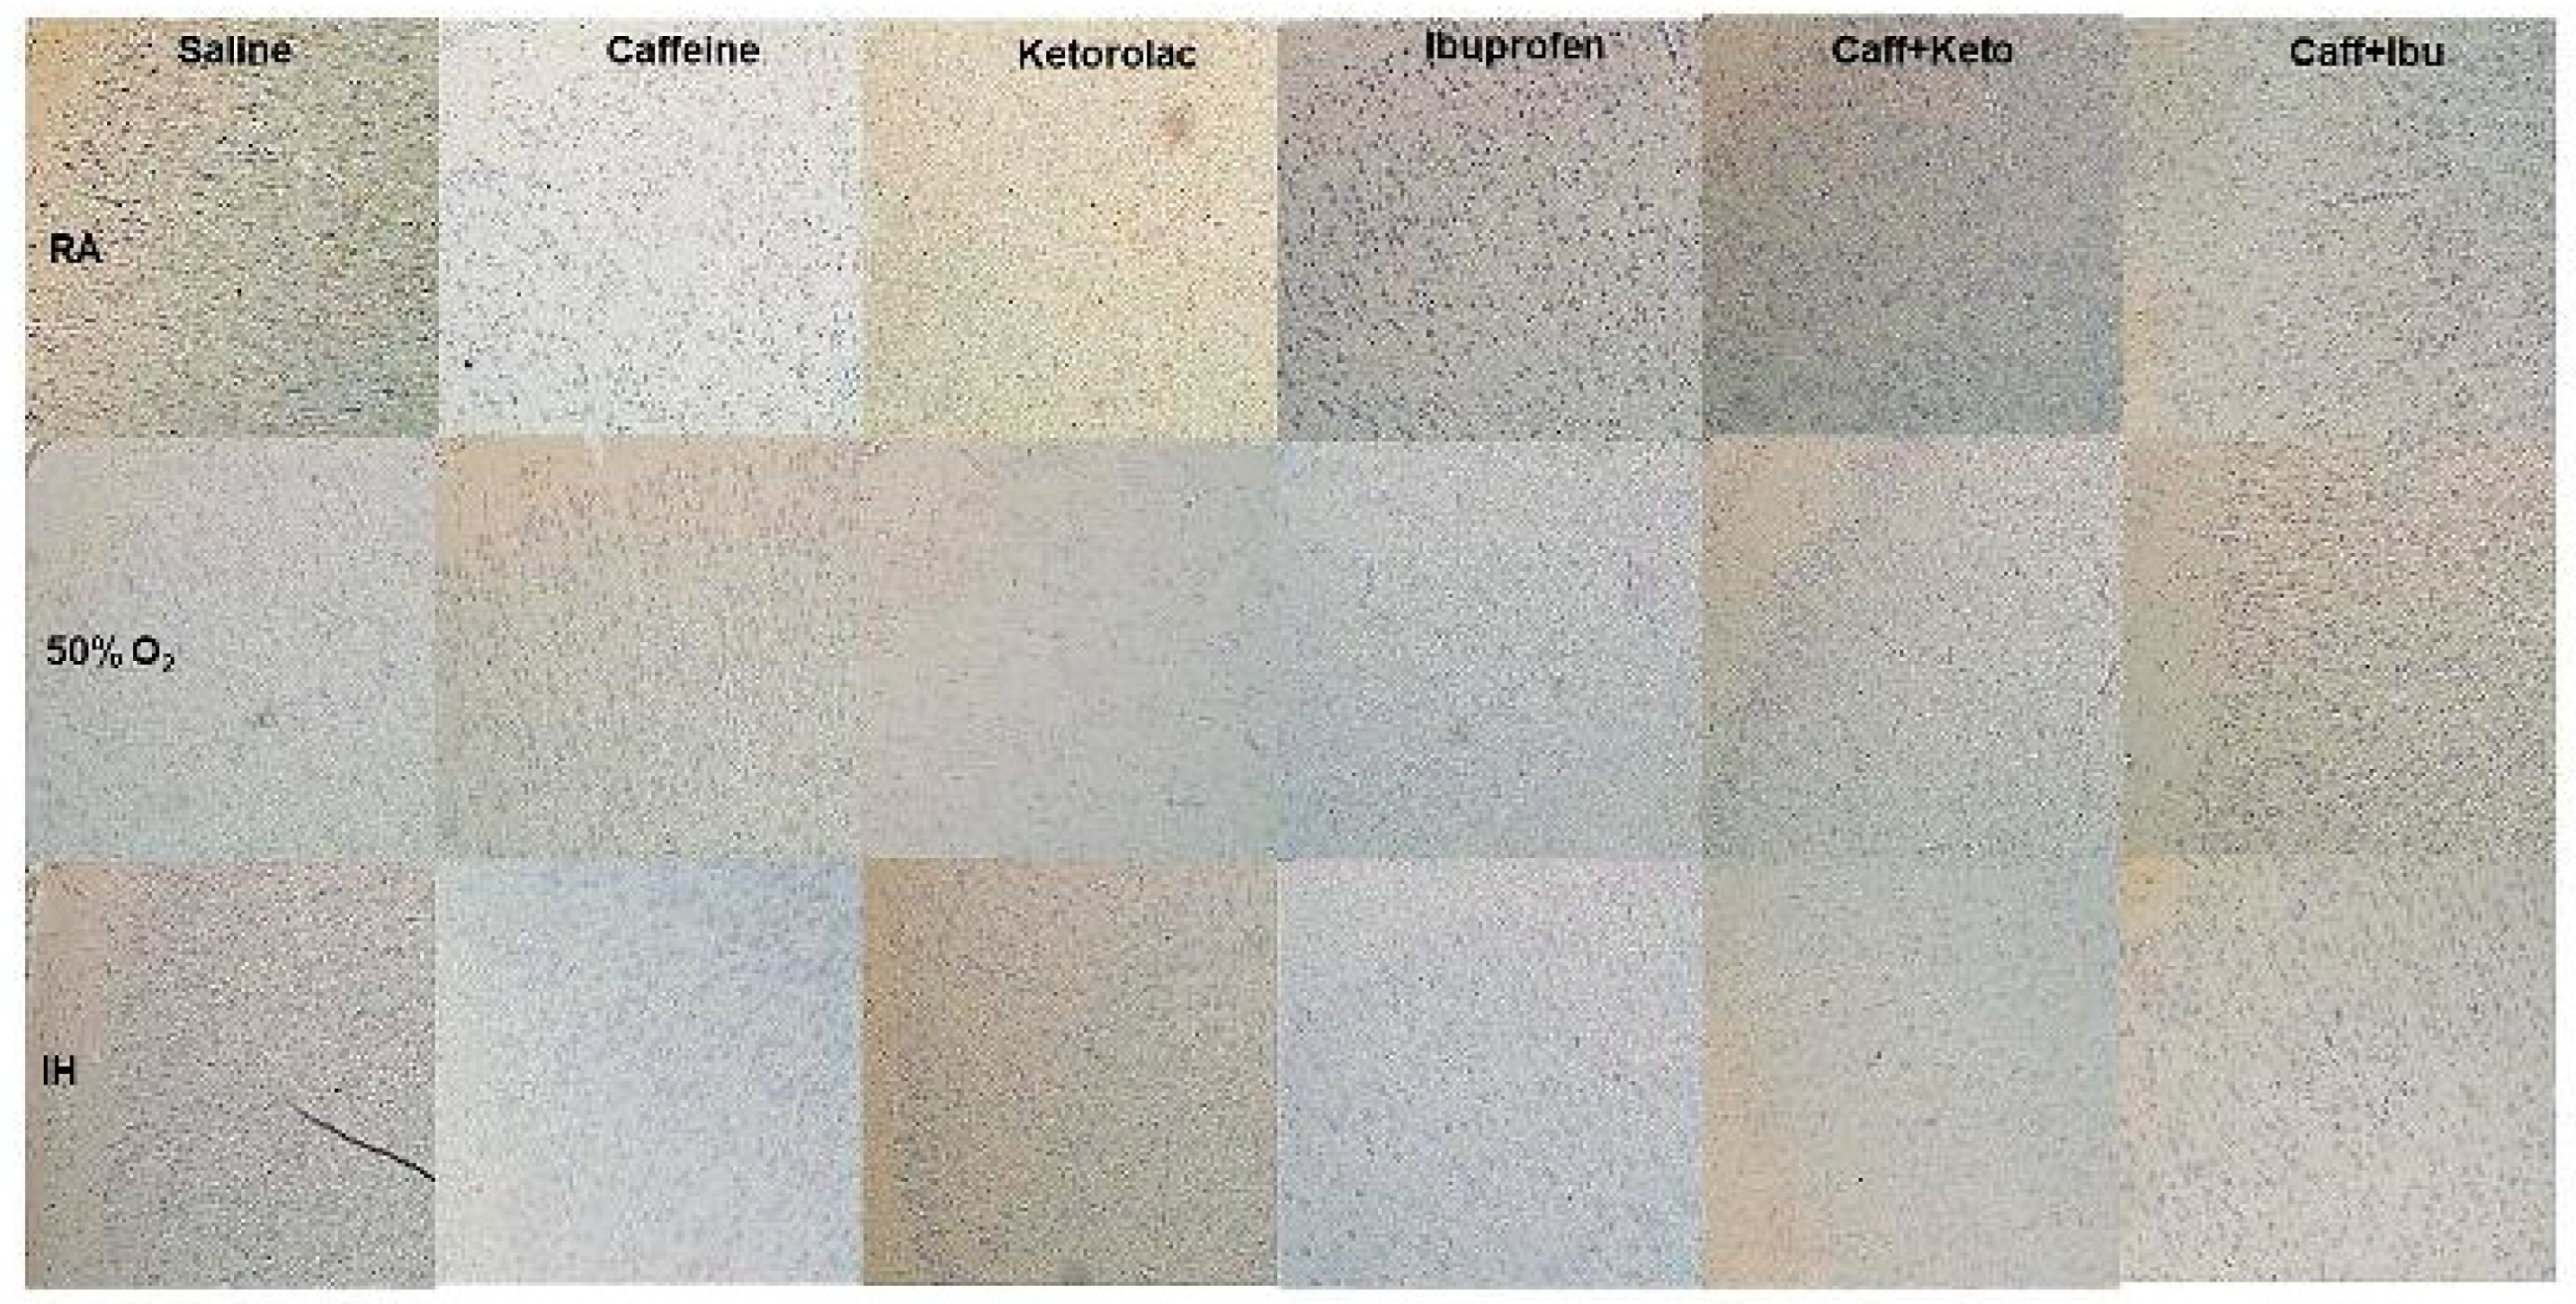
Representations of the TUNEL stained cerebral cortex sections for the late treatment groups. The upper panels represent the groups exposed to RA (room air); the middle panels represent the groups exposed to hyperoxia (50% O2); and the lower panels represent the groups exposed to neonatal IH (intermittent hypoxia). Apoptosis is indicated by the brown stain. Sections were counter stained with methyl green which indicates negativity. Images are 20X magnification, scale bar is 50 µm.
Figure 7.
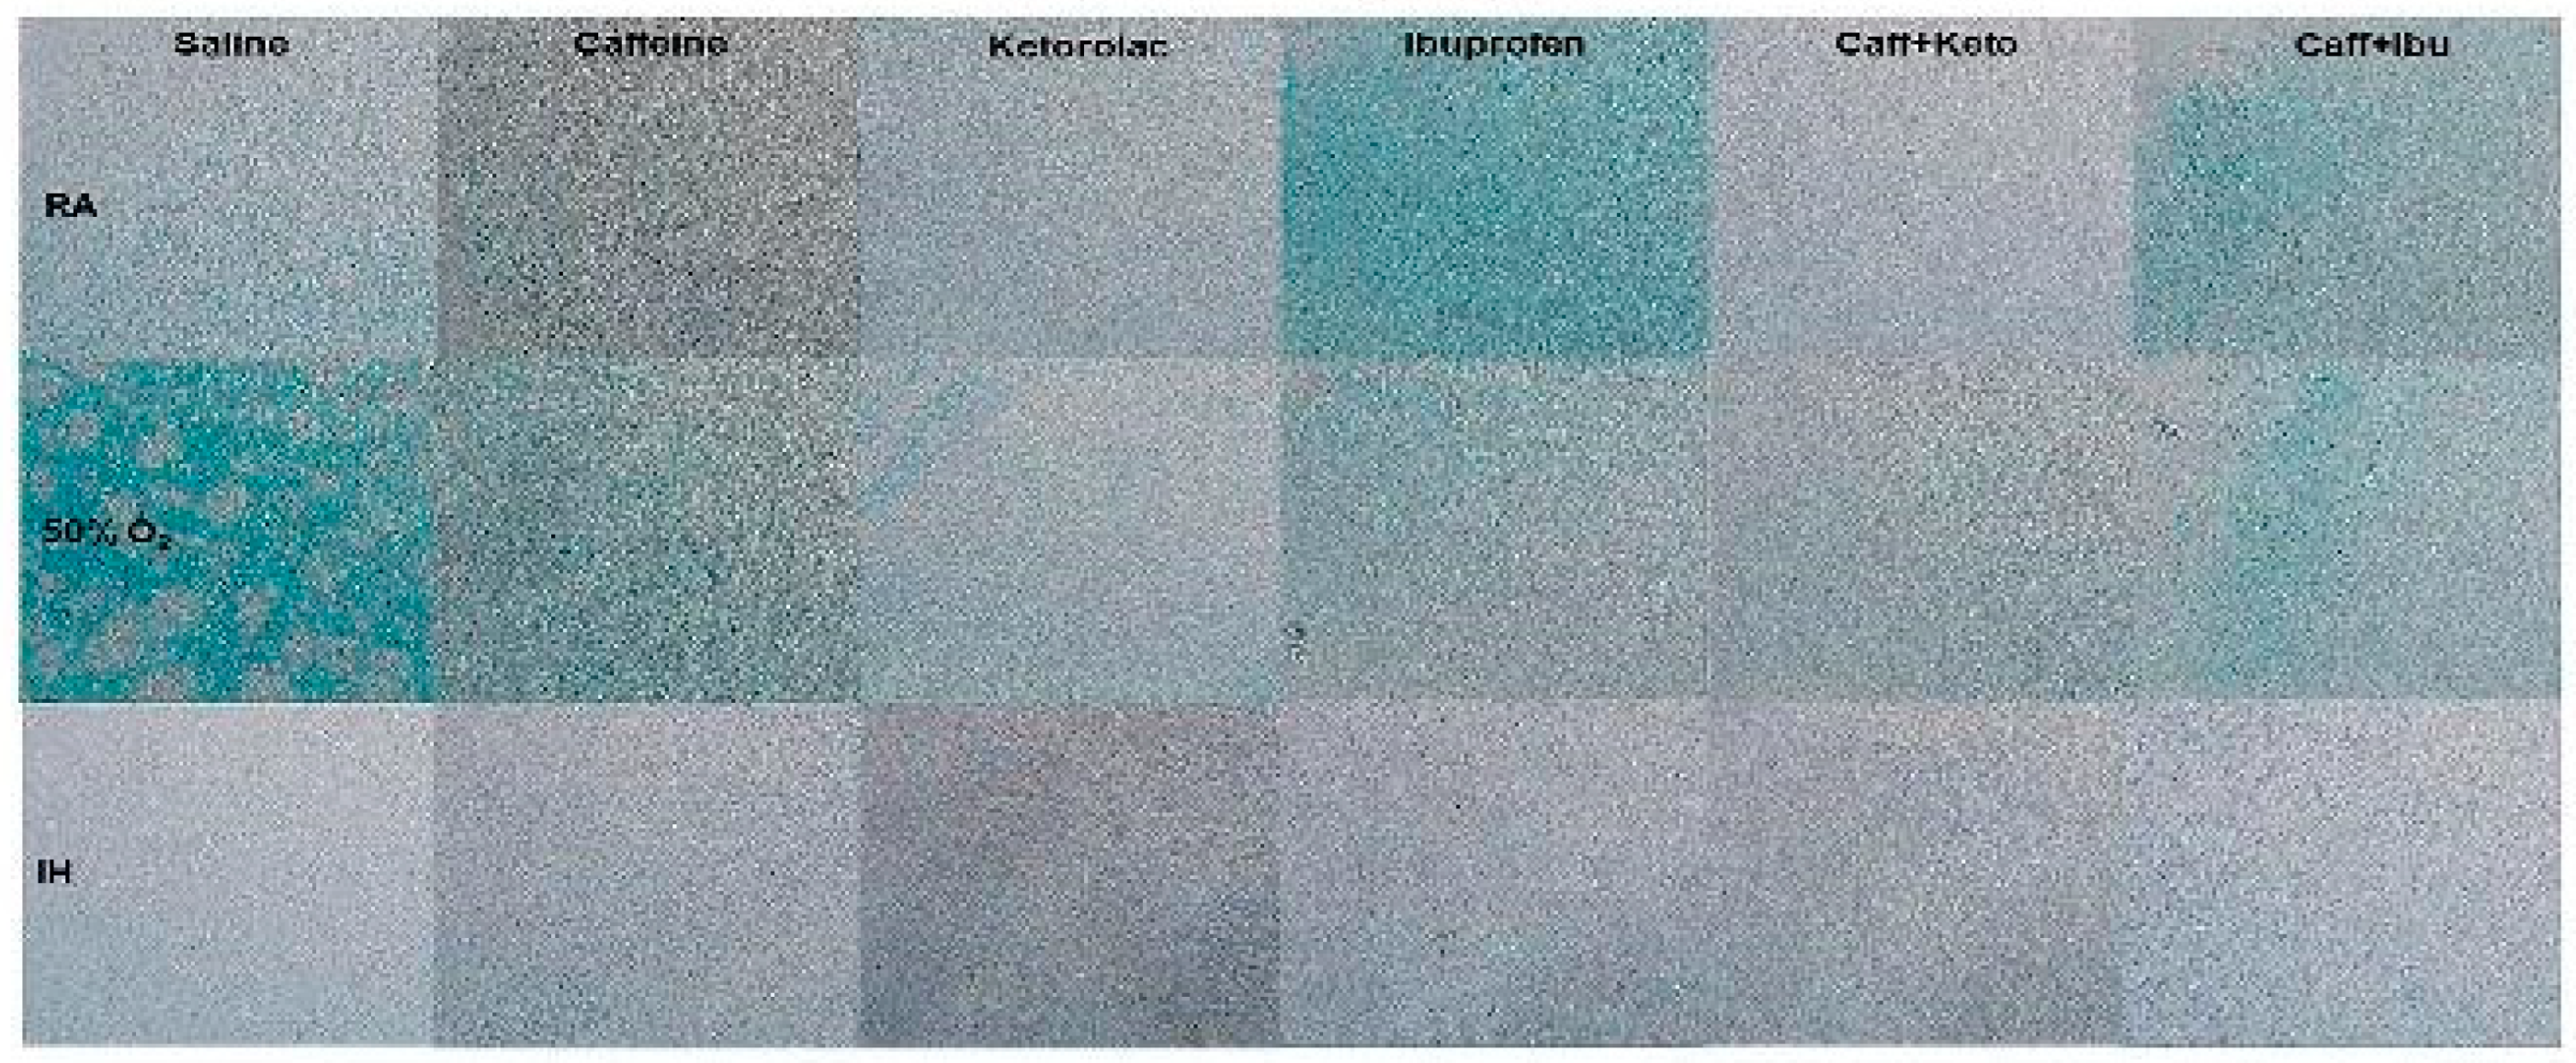
Representations of the Luxol fast blue (LFB) stained cerebral cortex sections indicating myelination, for the early treatment groups. The upper panels represent the groups exposed to RA (room air); the middle panels represent the groups exposed to hyperoxia (50% O2); and the lower panels represent the groups exposed to neonatal IH (intermittent hypoxia). Caff (caffeine); Keto (ketorolac); Ibu (ibuprofen). Myelination is indicated by the blue stain. Images are 20X magnification, scale bar is 50 µm.
Figure 8.
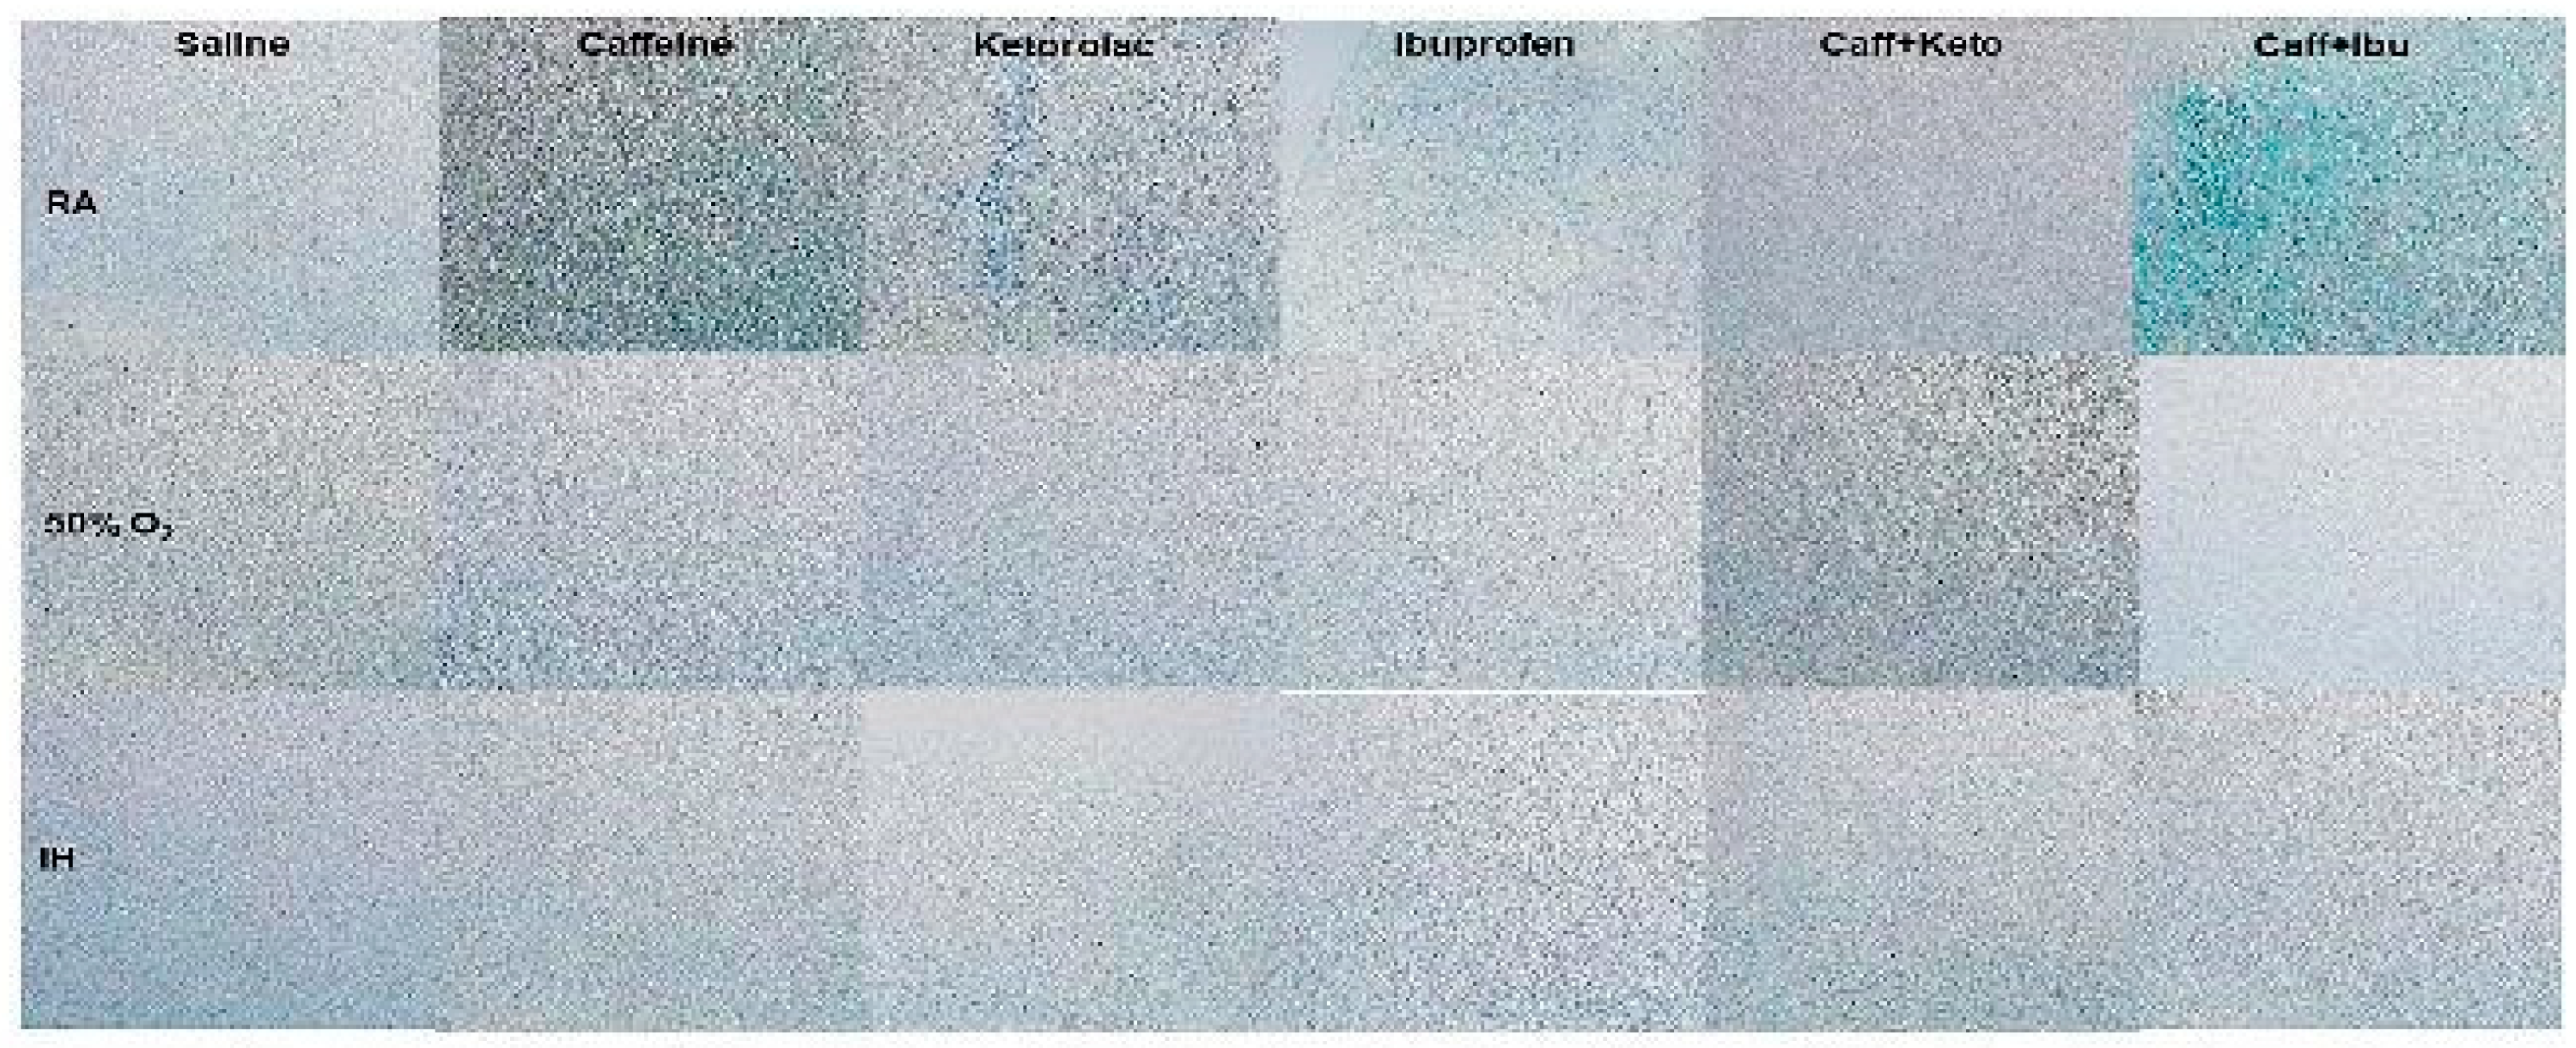
Representations of the Luxol fast blue (LFB) stained cerebral cortex sections indicating myelination, for the late treatment groups. The upper panels represent the groups exposed to RA (room air); the middle panels represent the groups exposed to hyperoxia (50% O2); and the lower panels represent the groups exposed to neonatal IH (intermittent hypoxia). Caff (caffeine); Keto (ketorolac); Ibu (ibuprofen). Myelination is indicated by the blue stain. Images are 20X magnification, scale bar is 50 µm.
Figure 9.
Effect of neonatal intermittent hypoxia (IH) and early caffeine/NSAIDs treatment on cytokines in the cerebral cortex homogenates. The groups are as described in
Figure 2. Data are mean±SEM (n=6 samples per group).
Figure 9.
Effect of neonatal intermittent hypoxia (IH) and early caffeine/NSAIDs treatment on cytokines in the cerebral cortex homogenates. The groups are as described in
Figure 2. Data are mean±SEM (n=6 samples per group).
Figure 10.
Effect of neonatal intermittent hypoxia (IH) and late caffeine/NSAIDs treatment on cytokines in the cerebral cortex homogenates. The groups are as described in
Figure 2. Data are mean±SEM (n=6 samples per group).
Figure 10.
Effect of neonatal intermittent hypoxia (IH) and late caffeine/NSAIDs treatment on cytokines in the cerebral cortex homogenates. The groups are as described in
Figure 2. Data are mean±SEM (n=6 samples per group).
Figure 11.
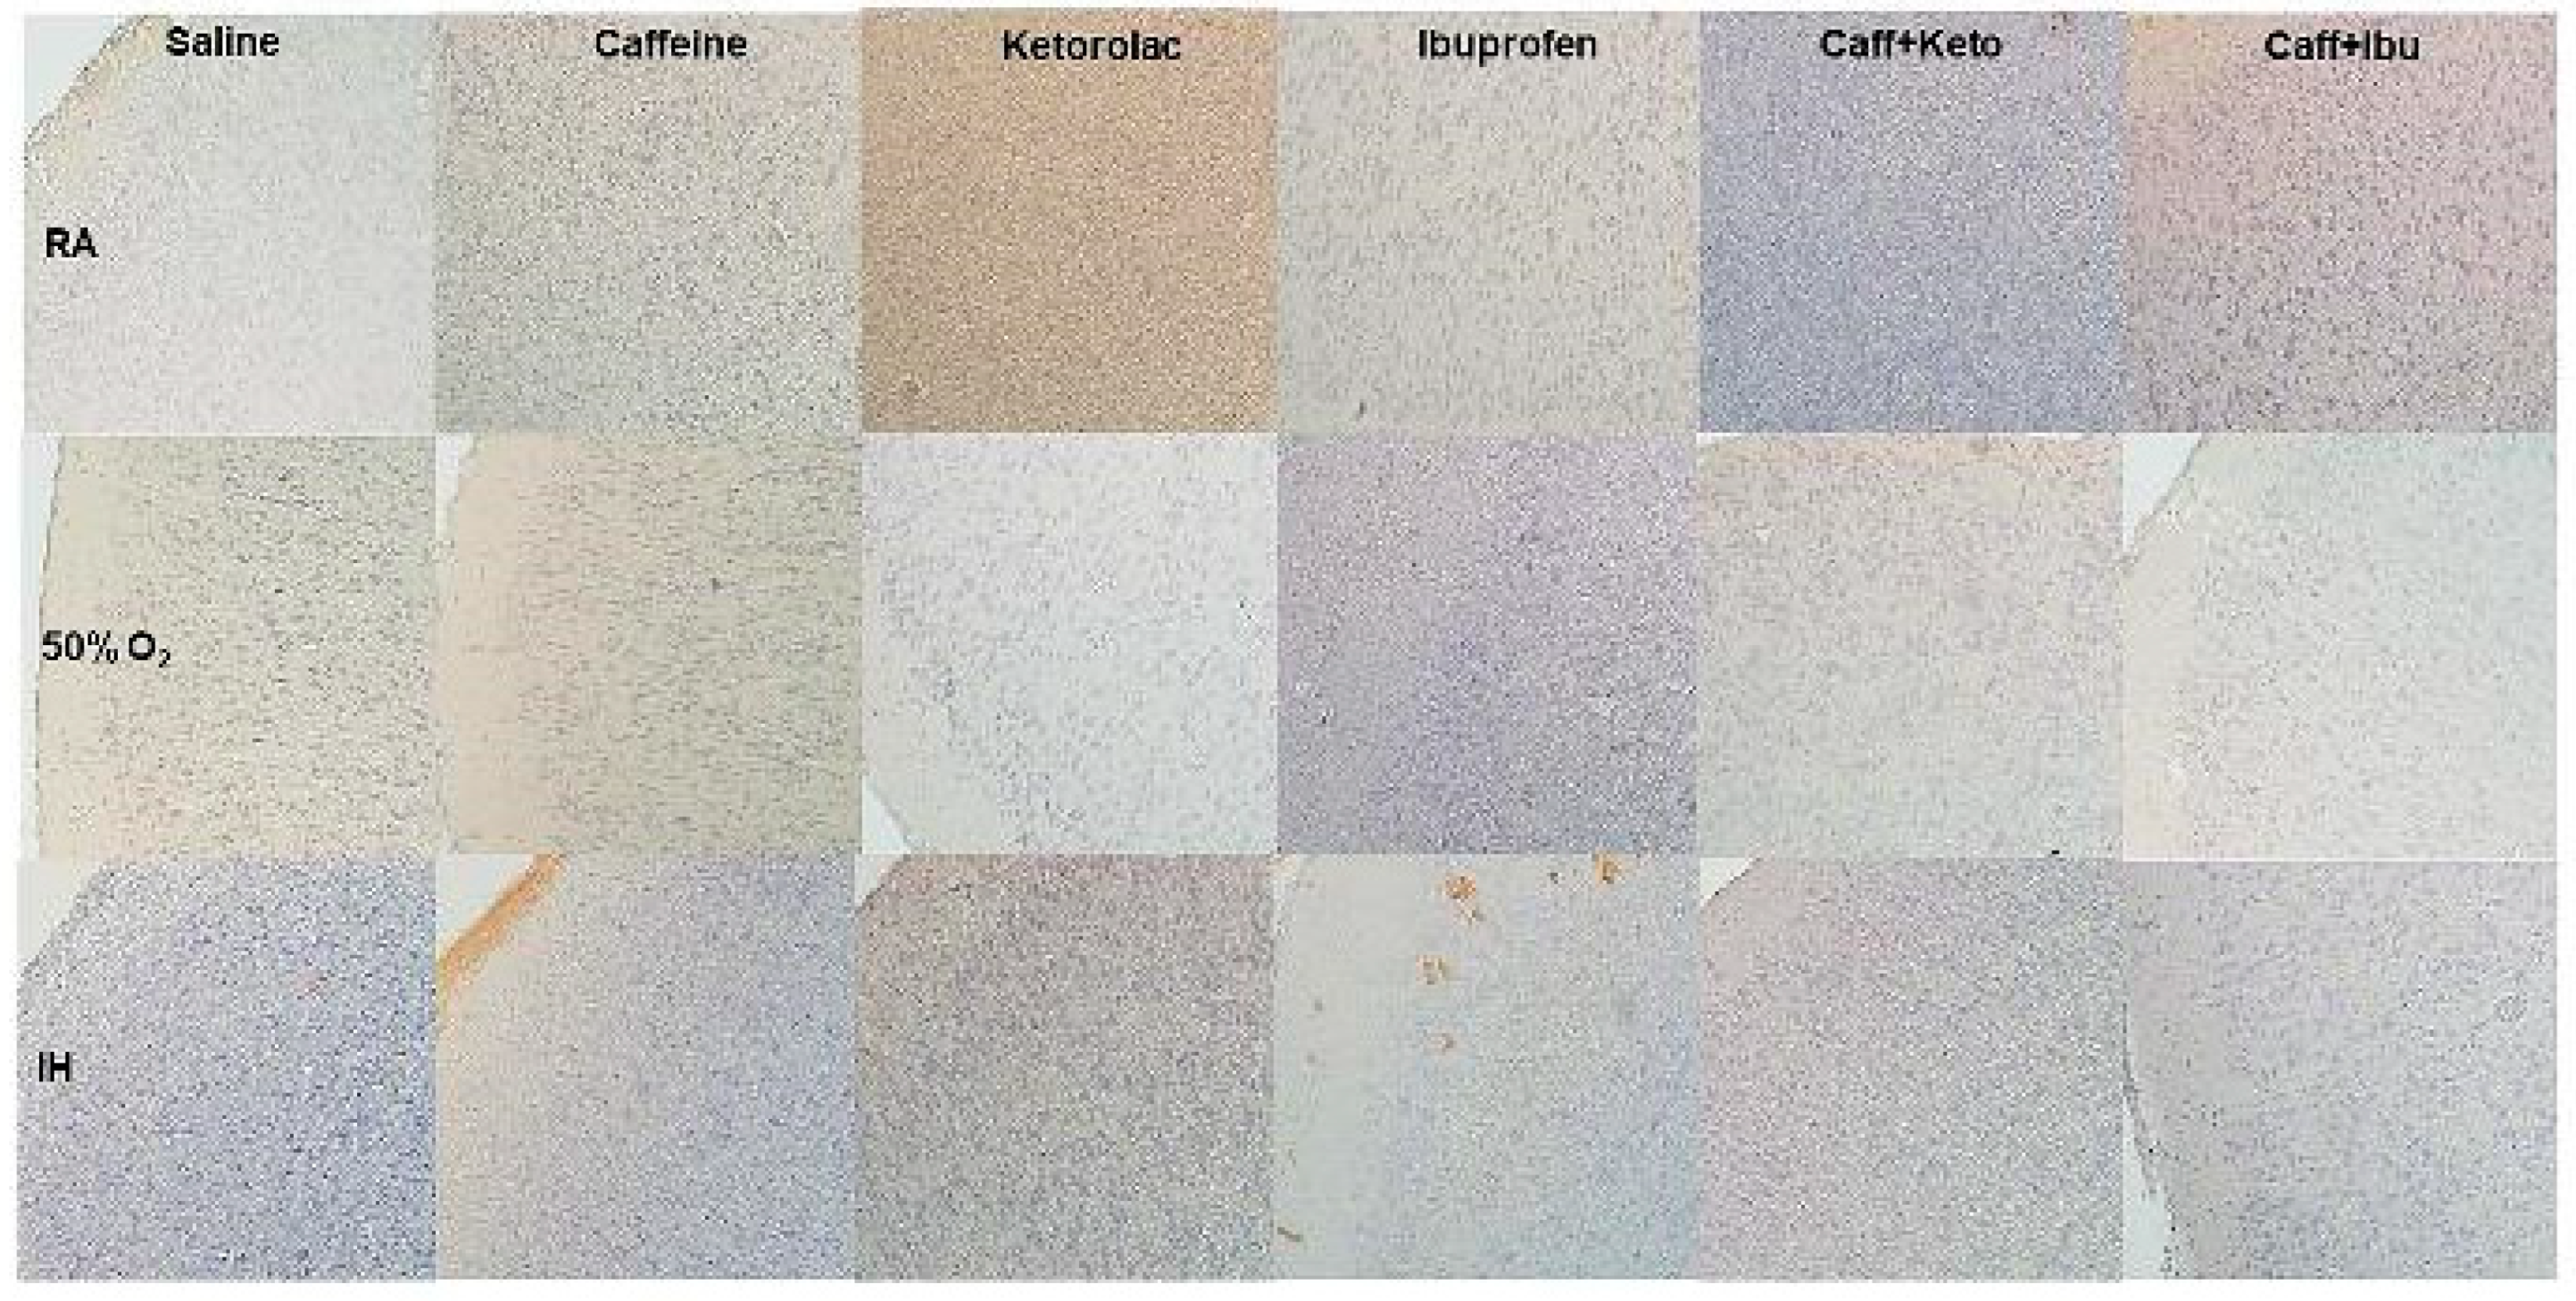
Representative image of immunoreactivity of IkB in the early treatment groups. IkB is indicated by the brown stain. The sections were counterstain with hematoxylin (blue). Images are 20X magnification, scale bar is 50 µm.
Figure 11.
Representative image of immunoreactivity of IkB in the early treatment groups. IkB is indicated by the brown stain. The sections were counterstain with hematoxylin (blue). Images are 20X magnification, scale bar is 50 µm.
Figure 12.
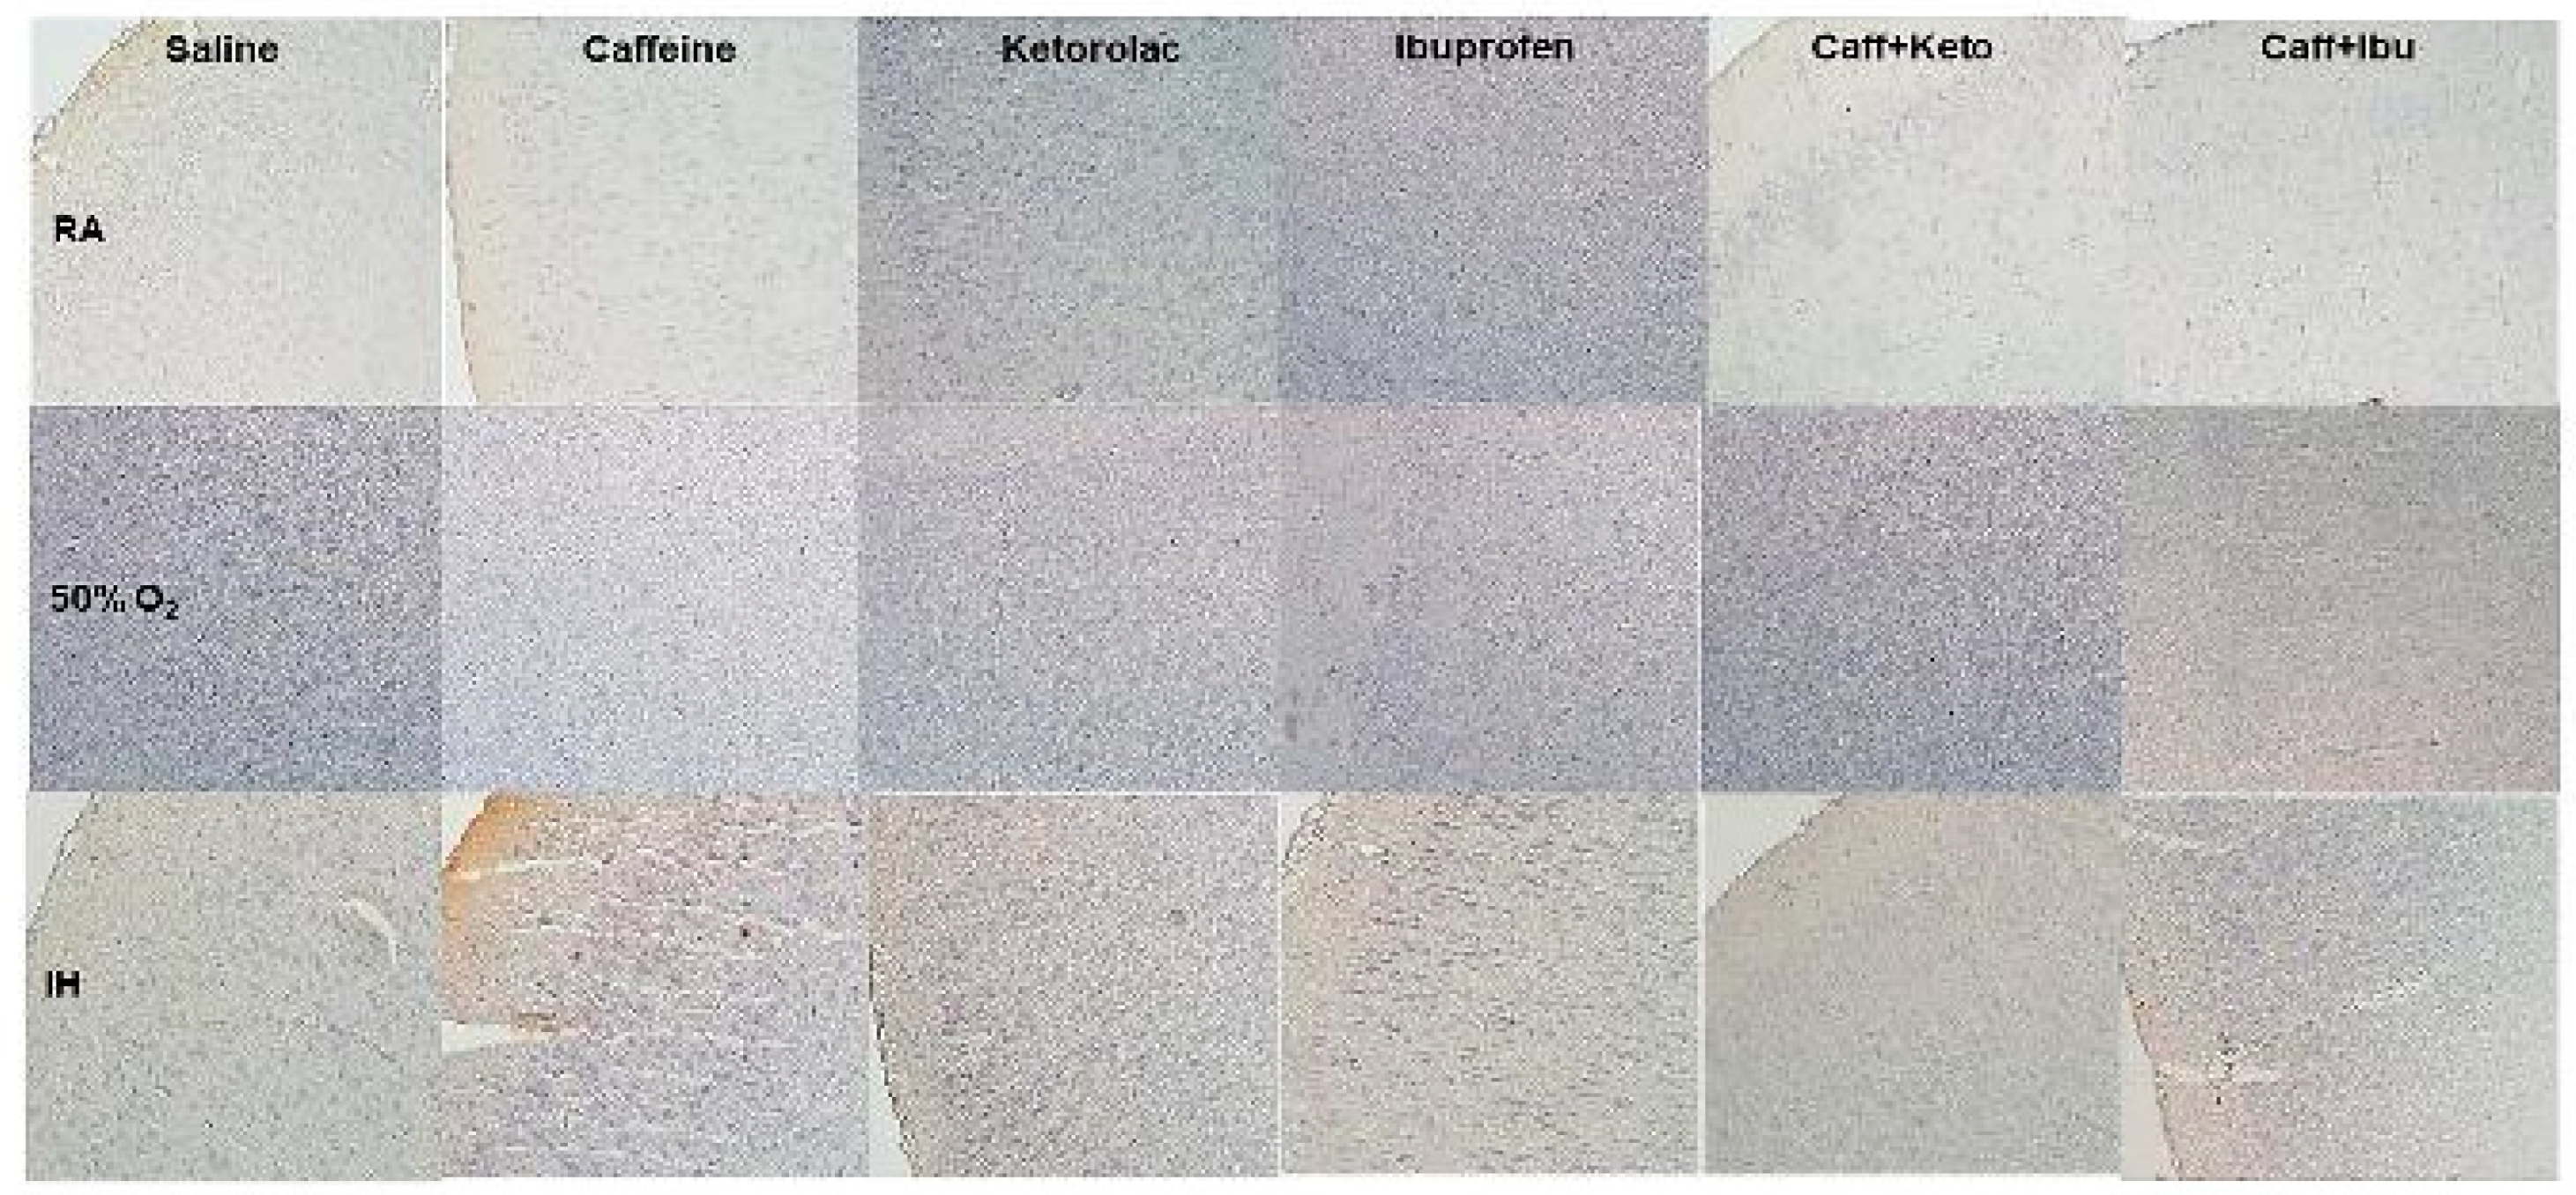
Representative image of immunoreactivity of IkB in the late treatment groups. IkB is indicated by the brown stain. The sections were counterstain with hematoxylin (blue). Images are 20X magnification, scale bar is 50 µm.
Figure 12.
Representative image of immunoreactivity of IkB in the late treatment groups. IkB is indicated by the brown stain. The sections were counterstain with hematoxylin (blue). Images are 20X magnification, scale bar is 50 µm.
Figure 13.
Representative image of immunoreactivity of IL-1β in the early treatment groups. IL-1β is indicated by the brown stain. The sections were counterstain with hematoxylin (blue). Images are 20X magnification, scale bar is 50 µm.
Figure 13.
Representative image of immunoreactivity of IL-1β in the early treatment groups. IL-1β is indicated by the brown stain. The sections were counterstain with hematoxylin (blue). Images are 20X magnification, scale bar is 50 µm.
Figure 14.
Representative image of immunoreactivity of IL-1β in the late treatment groups. IL-1β is indicated by the brown stain. The sections were counterstain with hematoxylin (blue). Images are 20X magnification, scale bar is 50 µm.
Figure 14.
Representative image of immunoreactivity of IL-1β in the late treatment groups. IL-1β is indicated by the brown stain. The sections were counterstain with hematoxylin (blue). Images are 20X magnification, scale bar is 50 µm.
Figure 15.
Representative image of immunoreactivity of TNFα in the early treatment groups. TNFα is indicated by the brown stain. The sections were counterstain with hematoxylin (blue). Images are 20X magnification, scale bar is 50 µm.
Figure 15.
Representative image of immunoreactivity of TNFα in the early treatment groups. TNFα is indicated by the brown stain. The sections were counterstain with hematoxylin (blue). Images are 20X magnification, scale bar is 50 µm.
Figure 16.
Representative image of immunoreactivity of TNFα in the late treatment groups. TNFα is indicated by the brown stain. The sections were counterstain with hematoxylin (blue). Images are 20X magnification, scale bar is 50 µm.
Figure 16.
Representative image of immunoreactivity of TNFα in the late treatment groups. TNFα is indicated by the brown stain. The sections were counterstain with hematoxylin (blue). Images are 20X magnification, scale bar is 50 µm.
Table 1.
Morphometric Analyses (Early).
Table 1.
Morphometric Analyses (Early).
| G |
Total Brain Width
(frontal-occipital) |
Total Brain Width
(inter-parietal) |
Layer I |
Layer II |
Layer III |
Layer IV |
Layer V |
Layer VI |
| RA: |
| Sal |
7836.6±88.0 |
12337.9±87.7 |
109.1±8.0 |
80.5±7.8 |
101.7±7.8 |
146.2±21.4 |
236.7±12.6 |
185.4±17.3 |
| Caff |
5591.1±7.1** |
10406.4±17.8
** |
134.9±7.4 |
63.4±6.9 |
109.3±9.0 |
130.3±9.2 |
120.1±7.9** |
137.7±12.2 |
| Keto |
8543.5±22.3** |
14631.0±289.0** |
182.6±15.4
** |
96.6±7.1** |
294.1±22.8** |
239.9±18.5
** |
133.2±8.4** |
155.4±15.7 |
| Ibu |
6794.7±45.4** |
10041.3±14.2
** |
136.9±10.4 |
101.0±7.1 |
142.4±26.3 |
120.8±20.1 |
223.3±20.4 |
143.6±10.8 |
| Caff+Keto |
8439.3±35.0** |
14048.7±397.4** |
150.8±10.1* |
76.9±5.2** |
228.8±23.3** |
242.4±13.1** |
125.9±10.5** |
155.1±18.0 |
| Caff+Ibu |
6310.7±57.3** |
10917.3±36.9
** |
123.5±3.4 |
82.6±9.8 |
133.0±20.3 |
142.6±13.9 |
150.3±17.0** |
113.3±12.9** |
50% O2:
|
| Sal |
5890.2±33.0** |
9471.5±159.4 |
109.0±11.3 |
71.5±1.8 |
174.0±18.7 |
241.5±17.0 |
198.0±28.9 |
137.3±11.1 |
| Caff |
5851.9±20.5† |
9312.3±23.7 |
1174.8±27.0##‡ |
2726.4±144.2
##‡ |
2000.5±214.6
##‡ |
1973.7±46.9##‡ |
1749.2±302.3
##‡ |
1327.3±118.4
**‡ |
| Keto |
8387.7±256.4## |
13652.5±915.8## |
214.9±13.9
## |
99.3±13.0 |
235.5±15.4 |
260.2±34.3 |
276.9±90.6 |
122.0±16.7 |
| Ibu |
7667.6±55.7
##‡ |
8820.2±1820.7‡ |
122.0±3.0 |
79.0±5.4 |
154.6±13.2† |
244.5±25.3‡ |
258.9±62.4 |
149.2±20.9 |
| Caff+Keto |
6894.5±92.7##‡ |
12334.0±145.3‡ |
153.4±8.4 |
82.5±7.5 |
238.8±0.87‡ |
323.8±9.6 |
122.5±8.0 |
153.4±8.4 |
| Caff+Ibu |
7313.6±33.0##‡ |
11509.6±70.7‡ |
121.5±5.40 |
88.9±4.7 |
170.4±13.0† |
244.0±25.5‡ |
165.3±15.0 |
144.6±10.6 |
Neonatal IH:
|
| Sal |
8270.1±25.2 |
11218.5±21.6 |
312.1±115.9 |
299.3±135.6* |
567.9±265.9 |
575.4±185.0 |
290.8±89.2 |
416.1±107.4* |
| Caff |
8063.0±116.2‡ |
12813.3±17.7‡ |
153.2±34.0 |
130.4±17.7 |
158.2±26.4‡ |
310.5±44.7
§§‡ |
228.3±55.8 |
147.6±36.3
§§ |
| Keto |
9106.0±136.5§§‡ |
13711.7±56.2 |
156.3±12.2 |
140.5±12.0 |
303.1±46.3 |
294.2±47.8
§§ |
210.5±41.5 |
150.0±36.0
§§ |
| Ibu |
8840.0±116.4§§‡ |
12924.0±79.5‡ |
144.4±8.6 |
122.3±13.3 |
186.3±9.9‡ |
273.4±47.8
§§‡ |
415.5±179.5 |
179.5±17.3
§§ |
| Caff+Keto |
6935.5±76.4
§§‡ |
12410.0±133.3‡ |
156.0±7.5 |
88.4±8.9 |
173.0±23.4
§§‡ |
182.9±17.6
§§ |
201.4±37.9 |
182.6±27.9
§§ |
| Caff+Ibu |
8711.1±116.6§‡ |
12730.0±42.4‡ |
158.9±14.6
§† |
87.2±24.9 |
160.3±26.8§ |
221.5±36.8
§§ |
314.3±53.5‡ |
188.7±15.1
§‡ |
Table 2.
Morphometric Analyses (Late).
Table 2.
Morphometric Analyses (Late).
| G |
Total Brain Width
(frontal-occipital) |
Total Brain Width
(inter-parietal) |
Layer I |
Layer II |
Layer III |
Layer IV |
Layer V |
Layer VI |
| RA: |
| Sal |
7705.2±67.0 |
13309.8±276.3 |
154.5±6.1 |
56.1±3.6 |
147.8±33.9 |
202.9±19.1 |
241.0±9.2 |
127.0±16.2 |
| Caff |
7651.1±109.7 |
11572.0±113.5** |
104.0±5.1** |
85.9±5.6** |
241.5±47.9 |
259.8±34.0 |
292.5±30.5 |
140.4±19.5 |
| Keto |
7595.6±219.0 |
12598.4±250.0 |
149.6±10.4 |
101.4±7.6** |
280.1±52.3* |
211.2±5.1 |
247.0±16.4 |
165.7±13.8 |
| Ibu |
8404.0±81.8** |
13263.0±530.0 |
166.6±12.9 |
87.2±5.1** |
180.9±15.6 |
258.3±25.0 |
234.4±25.9 |
145.3±12.2 |
| Caff+Keto |
7902.7±30.3 |
11506.7±88.2** |
133.7±7.5 |
70.7±5.1 |
205.0±26.8 |
181.5±30.2 |
186.5±25.0 |
158.4±7.3 |
| Caff+Ibu |
8281.1±207.2* |
13327.4±280.4 |
136.6±8.3 |
86.5±5.6** |
191.1±23.9 |
270.6±18.9 |
405.0±29.7** |
198.9±9.1** |
| 50% O2: |
| Sal |
8947.5±21.2** |
13534.8±255.2 |
179.8±15.2 |
102.4±10.4 |
243.0±23.4 |
237.8±33.6 |
192.5±18.5 |
151.3±7.0 |
| Caff |
9335.5±122.5##‡ |
14038.0±174.4‡ |
130.8±6.5#§ |
83.5±8.4 |
211.0±20.2 |
298.0±31.0 |
305.2±49.2 |
155.5±13.8 |
| Keto |
8773.5±195.7‡ |
11511.0±165.7##‡ |
141.8±2.4† |
100.0±6.8 |
222.0±12.2 |
277.3±16.9† |
190.8±39.0 |
164.0±17.5 |
| Ibu |
9093.5±76.8‡ |
13285.5±288.6 |
182.6±8.0 |
111.6±8.4 |
240.3±16.4† |
238.5±18.1 |
313.6±23.1 |
162.3±12.7 |
| Caff+Keto |
7656.5±7.1##† |
13158.5±297.0‡ |
161.1±6.6 |
126.9±8.0‡ |
240.3±23.4 |
253.4±18.5 |
218.5±24.9 |
132.6±10.0 |
| Caff+Ibu |
9272.0±36.4‡ |
13344.7±194.4 |
171.0±8.7‡ |
107.4±4.3‡ |
201.5±15.0 |
235.8±22.4 |
299.8±37.6† |
154.0±16.4 |
| Neonatal IH: |
| Sal |
8270.1±29.1** |
11218.5±217.6** |
187.7±57.9 |
163.8±65.6 |
367.6±118.3* |
369.8±98.4 |
284.9±41.8 |
260.9±65.0* |
| Caff |
8817.0±18.3
§§‡ |
13775.3±280.9
§§‡ |
178.6±7.7‡ |
114.5±19.6 |
324.5±42.2 |
243.4±56.9 |
242.3±32.1 |
178.9±8.5 |
| Keto |
7501.7±39.8§§ |
11466.0±160.1‡ |
141.4±10.8 |
90.3±5.8 |
275.5±47.9 |
254.3±24.0 |
240.6±27.1 |
171.8±25.9 |
| Ibu |
9481.3±68.4
§§‡ |
15107.3±280.5
§§‡ |
226.6±9.6‡ |
116.5±24.2 |
227.8±17.7 |
285.6±30.1 |
229.7±42.6 |
178.0±9.4 |
| Caff+Keto |
7461.7±93.7
§§‡ |
698.0±91.1§§‡ |
143.0±3.9 |
97.1±15.9 |
250.3±29.8 |
252.6±17.5 |
127.3±6.1§§ |
125.0±11.9§ |
| Caff+Ibu |
9465.5±206.6§§‡ |
14610.0±242.4
§§‡ |
124.4±2.2 |
93.4±3.5 |
325.0±32.1‡ |
256.0±17.1 |
169.7±20.8
§‡ |
180.4±23.1 |
Table 3.
IHC Quantification (Early).
Table 3.
IHC Quantification (Early).
| Group |
Apoptosis
(TUNEL) |
Myelin (LFB) |
pNFkB |
IkB |
IL-1β |
IL-6 |
TNFα |
| RA: |
| Sal |
489.5±178.2 |
1369.5±265.7 |
0.8±0.36 |
181.3±19.8 |
391.6±37.3 |
381.7±29.1 |
3134.4±193.9 |
| Caff |
4387.7±724.1** |
1038.7±106.5 |
2.3±1.3 |
51.1±5.2 |
61.6±15.5** |
1.5±0.3** |
88.2±21.6** |
| Keto |
225.3±17.5 |
2797.6±124.0** |
18.5±12.3 |
3277.7±470.2** |
29.6±7.5** |
20.3±5.6** |
1460.8±551.0** |
| Ibu |
6809.3±283.7** |
3374.5±203.0** |
3444.3±475.3** |
70.5±4.6 |
46.1±5.8** |
214.6±42.5 |
298.1±39.0** |
| Caff+Keto |
4462.7±594.3** |
27.8±2.0** |
196.5±61.3 |
25477.3±1440.6** |
56.8±20.4** |
63.3±10.3* |
795.7±131.0** |
| Caff+Ibu |
8517.8±182.8** |
2653.0±441.5** |
29.4±7.2 |
331.3±14.3 |
8.4±3.0** |
453.4±165.8 |
737.3±133.7** |
| 50% O2: |
| Sal |
2917.6±390.8** |
18.4±2.9** |
2049.9±952.0* |
195.2±19.8 |
72.4±11.4** |
19.0±6.1** |
131.7±43.8** |
| Caff |
6915.8±292.0##† |
4.9±1.5‡ |
144.8±31.0 |
51.7±8.2 |
29.7±3.8 |
34.5±7.2‡ |
2258.9±368.0##‡ |
| Keto |
1297.2±75.7##‡ |
26.0±14.4‡ |
711.9±77.9‡ |
467.0±92.1##‡ |
23.2±3.7 |
0.31±0.19 |
184.6±67.9† |
| Ibu |
3940.6±593.7‡ |
0±0##‡ |
2275.3±274.7† |
51.7±4.6 |
77.8±6.5 |
8.2±1.8‡ |
198.9±62.4 |
| Caff+Keto |
365.0±41.7##‡ |
0±0#‡ |
3068.9±320.3‡ |
1701.1±137.0‡ |
59.9±6.4 |
14.7±3.8‡ |
338.1±97.1 |
| Caff+Ibu |
5658.0±310.9##† |
0±0##‡ |
3225.3±699.0‡ |
60.9±7.2† |
330.8±40.7##‡ |
163.3±42.6## |
2556.8±300.0##‡ |
| Neonatal IH: |
| Sal |
306.4±63.1** |
0±0** |
1302.6±162.2 |
182.3±11.2 |
66.0±8.9** |
50.6±11.3** |
1688.9±186.6** |
| Caff |
2400.0±329.1‡ |
0±0‡ |
1026.7±111.0‡ |
85.8±13.8† |
77.7±8.9 |
5.5±1.6 |
10.6±3.4§§ |
| Keto |
777.3±73.7§‡ |
0±0‡ |
1379.3±202.6‡ |
885.8±89.4§§‡ |
61.4±22.5 |
209.4±49.2§§‡ |
805.1±289.4§§ |
| Ibu |
3670.5±582.7‡ |
0±0‡ |
149.2±20.6§§‡ |
204.8±29.6‡ |
189.7±40.3§§‡ |
41.4±25.3‡ |
3.2±0.57§§‡ |
| Caff+Keto |
1851.3±396.9‡ |
0±0‡ |
971.7±179.1 |
93.9±6.9‡ |
53.3±10.8 |
67.6±11.7 |
919.5±6.9§§ |
| Caff+Ibu |
8004.7±1326.2§§ |
0±0‡ |
369.0±53.1§§ |
905.1±134.4§§‡ |
22.5±3.6 |
56.7±8.8† |
382.8±66.8§§ |
Table 4.
IHC Quantification (Late).
Table 4.
IHC Quantification (Late).
| G |
Apoptosis
(TUNEL) |
Myelin (LFB) |
pNFkB |
IkB |
IL-1β |
IL-6 |
TNFα |
| RA: |
| Sal |
65.4±17.5 |
916.2±165.5 |
0.69±0.41 |
38.3±3.6 |
1699.9±230.6 |
43.5±9.8 |
4268.9±681.2 |
| Caff |
16.0±2.5 |
5027.7±723.4** |
253.8±66.4 |
93.9±5.6 |
2155.9±598.8** |
1691.8±502.1** |
1992.7±379.7** |
| Keto |
2315.2±462** |
1600.0±306.4 |
4425.4±990** |
1765.7±223.7** |
9113.9±419.7** |
13.2±1.8 |
256.2±116.8** |
| Ibu |
262.0±24.1 |
5576.5±470.0** |
24.3±4.4 |
174.5±15.0 |
52.0±12.6** |
423.4±203.1 |
524.2±235.1** |
| Caff+Keto |
1526.1±251.9** |
563.3±47.8 |
4751.7±607.3** |
653.9±79.9** |
4.9±0.87** |
50.7±7.0 |
281.5±43.7** |
| Caff+Ibu |
5.1±1.5 |
5495.0±693.9** |
29.4±4.3 |
34.8±6.3 |
205.8±32.2** |
41.4±5.8 |
2479.9±368.4** |
| 50% O2: |
| Sal |
876.2±108.4** |
13042.9±438.2** |
3239.5±800.3** |
30.0±2.8 |
1151.5±175.2* |
4.1±0.9 |
2742.2±746.7 |
| Caff |
33.5±8.7## |
4083.8±764.4## |
12668.9±2030 |
89.2±5.2 |
5365.3±531.0##‡ |
86.5±27.8#‡ |
5411.4±735.4##‡ |
| Keto |
106.8±23.7##‡ |
2348.2±579.3## |
2924.9±1037.3 |
869.2±202.6## |
1875.3±690.3‡ |
61.2±27.2 |
2522.4±202.6‡ |
| Ibu |
4.7±1.4##‡ |
1710.2±346.9##‡ |
2275.3±274.7‡ |
186.9±17.0 |
135.7±56.0 |
29.7±14.2† |
169.0±48.2## |
| Caff+Keto |
1116.6±54.7† |
1172.7±118.9##† |
22.1±3.6##‡ |
645.6±77.9## |
213.6±86.9 |
61.4±7.7# |
630.3±120.1## |
| Caff+Ibu |
44.2±15.6##† |
1692.1±370.8##‡ |
14.5±2.6## |
31.1±5.9 |
3.7±1.5‡ |
99.4±16.9## |
559.1±186.3##‡ |
| Neonatal IH: |
| Sal |
270.0±39.3 |
41.3±4.5 |
852.3±140.0 |
81.9±7.5** |
32.4±5.5** |
545.4±71.3* |
168.0±36.9* |
| Caff |
21.0±11.7 |
1279.1±229.4§§‡ |
1454.9±395.0 |
59.3±4.0‡ |
3731.0±481.4§§ |
312.6±51.9§§‡ |
643.4±234.3 |
| Keto |
543.3±135.5‡ |
1364.7±100.8§§ |
735.1±109.3‡ |
2139.4±398.3§§ |
123.3±15.4‡ |
4.1±1.1§§ |
17.3±6.9 |
| Ibu |
194.3±46.2 |
1744.7±153.3§§‡ |
343.1±54.4 |
71.0±6.1‡ |
18.1±4.7 |
5.5±2.2§§† |
1031.7±184.7§§ |
| Caff+Keto |
441.3±110.9‡ |
998.8±60.0§§ |
3363.9±234.0§§‡ |
3227.0±320.6§§‡ |
40.9±9.6 |
56.9±18.8§§ |
720.3±310.0 |
| Caff+Ibu |
75.4±5.8‡ |
993.0±87.2§§‡ |
579.9±53.5‡ |
210.6±12.2‡ |
50.6±38.0‡ |
319.4±50.1§§‡ |
254.3±83.3‡ |
