1. Introduction
The composition and pattern of ecosystem refers to its types, numbers, spatial distribution, and configuration of the constituent units of ecosystems, reflecting the spatial distribution patterns and spatial structural relationships of various ecosystems [
1,
2,
3]. The dynamics of ecosystem spatial patterns are closely linked to land use/land cover changes. The land use/land cover (LULC) pattern is a spatial arrangement and combination of various LULC types and represents the heterogeneity [
4,
5]. Reasonable LULC changes can generate positive ecological environmental effects, while excessive development of ecosystems can lead to desertification, vegetation degradation, and reduction of water areas, among other ecological environmental problems [
6,
7,
8,
9]. Landscape pattern mainly focuses on the analysis of landscape heterogeneity and the dynamics, and the landscape pattern index can quantitatively describe the changes of landscape pattern [
10,
11,
12,
13]. Therefore, studying the changes in land use/land cover and landscape patterns in a basin are crucial for understanding the changes of the ecological environment in the basin. Previous related studies mainly include using remote sensing to obtain spatial distribution changes of land use [
14,
15,
16,
17], the impact of land use changes on ecosystem services [
18,
19,
20,
21], scenario simulation of land use changes [
22,
23,
24,
25], as well as their potential impacts on ecosystems [
26,
27,
28].
In recent years, China has implemented policies for the protection and restoration of river basin ecosystems. The impact of these ecological policies and projects on the ecological environment has become a hot topic of concern for scholars. Zhang et al. pointed out that due to the implementation of wetland conservation measures, the landscape types in the Yellow River Delta wetland changed little from 2006 to 2018, with relatively balanced spatial distribution. GDP, population, precipitation, and temperature were the main reasons for changes in soil use types in the Yellow River Delta wetland [
29]. Yu et al. analyzed the spatiotemporal changes of ecosystem services in Xin’anjiang River Basin and found that the implementation of ecological compensation policies played a positive role in hydrological regulation functions, and the value of ecosystem services showed significant spatial variations [
30]. De Alban et al. studied LUCC dynamics in the Tanintharyi Region (Myanmar), and identified a regime shift from a forest-oriented state to an agricultural-oriented state. The results showed that the government policies and foreign direct investment enabling the establishment of large-scale agro-industrial concessions reinforced the new agriculture-oriented regime and prevented reversion to the original forest-dominated regime [
31]. Xiong et al. used a transition matrix, linear regression and partial correlation to analyze the change and trend of land use and vegetation cover in the Three Gorges Reservoir (TGR) intervening basin, but the climate change, ecological restoration measures, urbanization and reservoir impoundment did not significantly change the spatial distribution pattern of land use and the climate driving mechanism of vegetation growth in the TGR intervening basin [
32]. Bufebo and Elias investigated land use/land cover changes using remote sensing data to determine the drivers and consequences of land use/land cover changes in Shenkolla watershed, south central Ethiopia. The results showed that agricultural expansion, policy change and social unrest, population pressure, shortage of farm land, and biophysical factors were major driving forces of the LU/LC changes [
33]. Previous studies have mostly focused on the evolution of river basins, lacking comprehensive research on the overall ecological quality characteristics and changes of river basins. In addition, how to implement differentiated land and ecological protection policies based on regional characteristics is a key issue, but there is scarce of relevant quantitative research.
The Fenhe River Basin is located in the middle reaches of the Yellow River and is an important ecological functional area, densely populated area, grain and cotton production area, and economically developed area in Shanxi Province. With the ecological protection and high-quality development of the Yellow River Basin becoming a national strategy, the Fenhe River, as the second largest tributary of the Yellow River, and the changes in its ecological pattern and driving factors are also important components of the ecological protection and high-quality development of the Yellow River Basin [
34,
35]. In 2020, the Ministry of Finance issued the Whole Yellow River Basin Pilot Implementation Plan to support for Guiding the Establishment of Horizontal Ecological Compensation Mechanisms in the basin [
36]. Thus, the water quality in the Fenhe River Basin, which was severely polluted in the past, had been greatly improved. Nowadays, the water quality are stable that alter the ecological system pattern and water quality, and consequently impact the sustainable development of the regional economy and ecological environment. Therefore, based on land cover/ecosystem type data, this study takes the upper and middle reaches of the Fen River Basin as an example to explore the dynamic characteristics of the ecological system pattern from 2010 to 2020. It also examines the driving factors in combination with regional socio-economic factors and ecological security concepts. The aim is to provide scientific basis for the planning, construction, and management of ecological environmental governance and restoration projects in the Fenhe River Basin, and to provide application references for ecological protection and high-quality development practices in the Yellow River Basin.
2. Materials and Methods
2.1. Description of Study Area
The Fenhe River Basin is located in the central part of Shanxi Province (110°-113°E, 35°-39°N), flowing through 29 counties (districts) in 6 cities including Xinzhou, Taiyuan, Lvliang, Jinzhong, Linfen, and Yuncheng. It has a total length of 713 kilometers and a basin area of 39,721 square kilometers. The terrain in the basin generally slopes from the river valley to the east and west, and the elevation increases from south to north. The land cover types in the basin are diverse, mainly consisting of cultivated land in the Fenhe River valley, grassland, forests, and shrublands in the mountains and hills on both sides of the basin. The urban built-up area also accounts for a considerable proportion, mainly distributed along the banks [
37]. The Fenhe River Basin has a typical temperate continental semi-arid monsoon climate, with distinct four seasons. The average annual temperature ranges from 6 to 13 °C, and the average annual rainfall is 400 to 700 mm, with the rainy season accounting for 78.8% of the annual precipitation. The average annual evaporation is 2,008 mm. The study area is selected in the upper and middle reaches of the Fen River Basin (
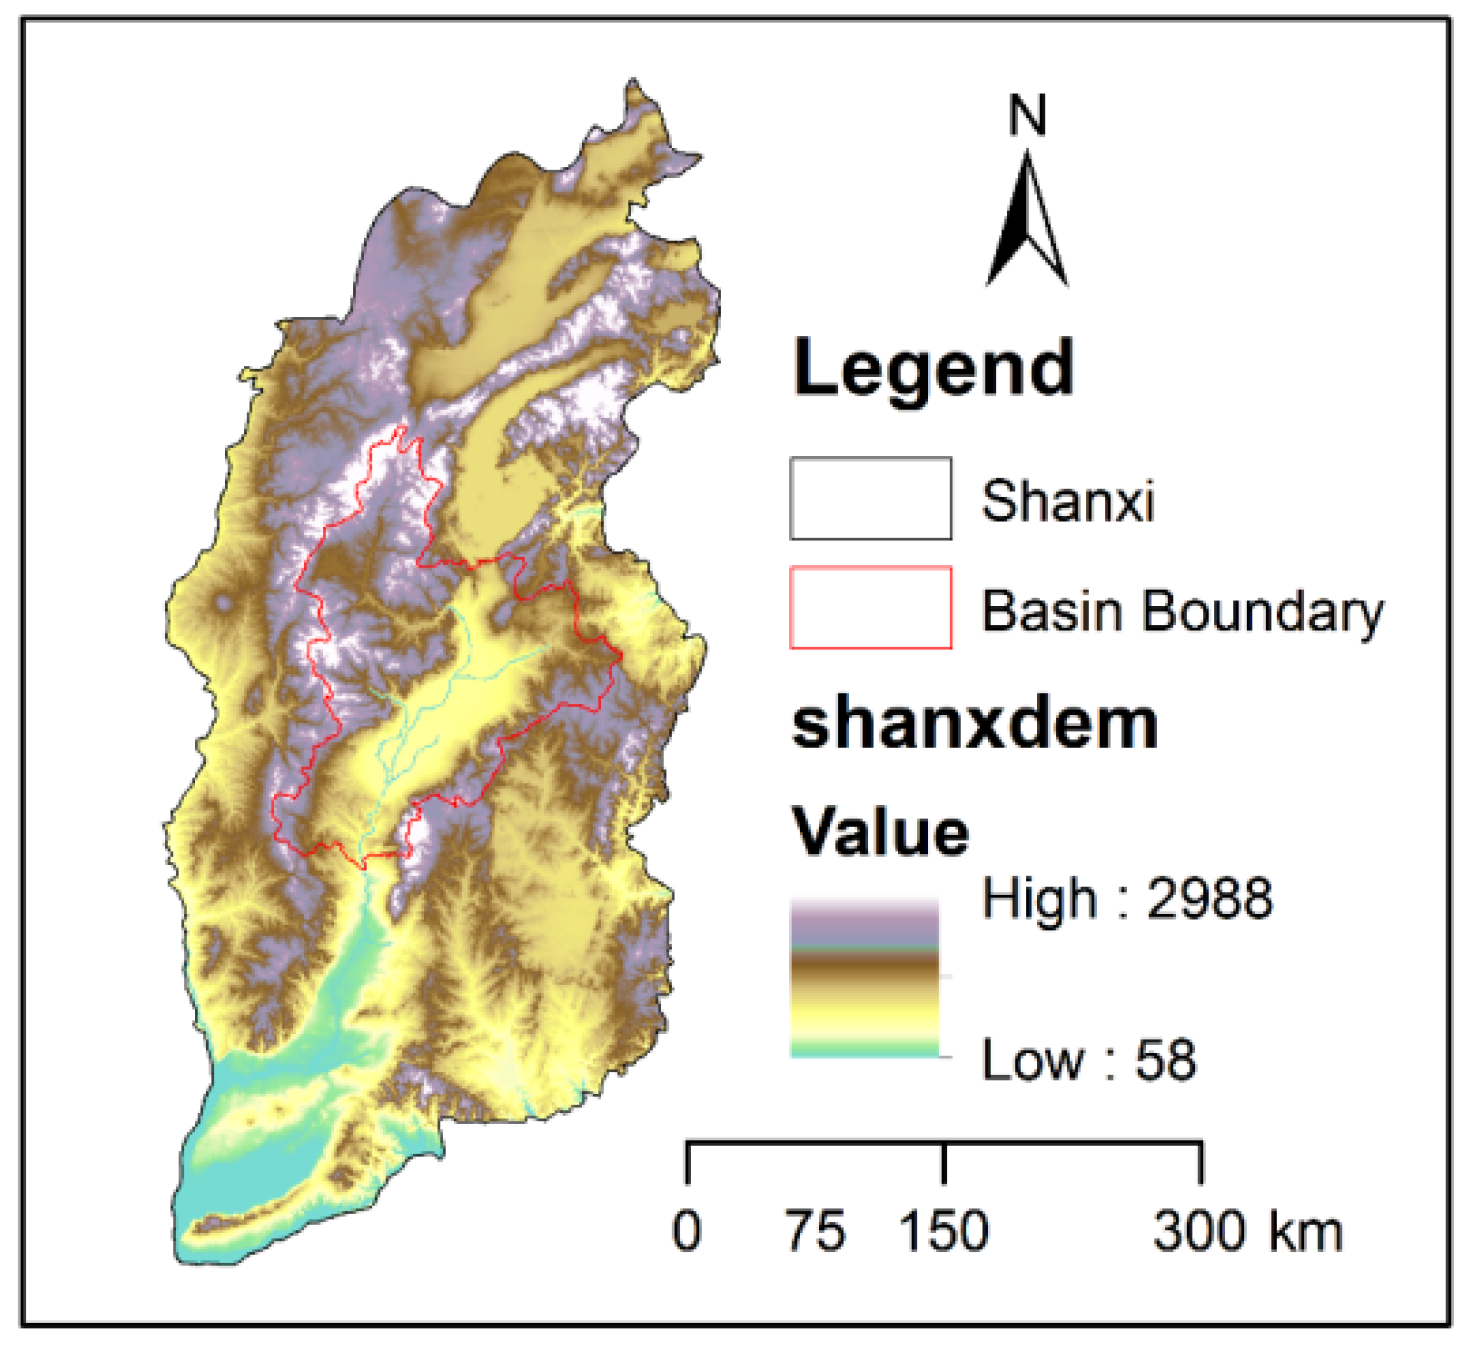
Figure 1). This region extends from the source of the Fen River at the foot of Censhan Mountain in Ningwu, to the Wangzhuang section in Lingshi. The basin covers an area of 26,210 km
2, accounting for 25.5% of the total provincial area. It passes through counties and cities including Ningwu, Jingle, and Lanxian in Xinzhou City; Jiaocheng, Wenshui, Fenyang, Xiaoyi, and Jiaokou in Lvliang City; Yangqu, Loufan, Qingshui, Jiancaoping, Wanbailin, Xinghualing, Xiaodian, and Jinyuan in Taiyuan City; and Xiyang, Heshun, Taigu, Qi, Pingyao, Jiexiu, and Lingshi in Jinzhong City.
2.2. Research methods
2.2.1. Data Sources
Normalized Difference Vegetation Index (NDVI), which characterizes the dynamic changes in vegetation within the basin. NDVI remote sensing data is derived from NASA MODIS data (MOD13A3), with a monthly scale and a spatial resolution of 1 km. The data covers a period from 2010 to 2020, totaling 132 data sets.
Land use/cover change (LUCC) remote sensing data (for the years 2010, 2015, and 2020) used to characterize the land cover and land use changes in the basin. This data is sourced from the Global Land Cover Types dataset published by the Remote Sensing Center of Tsinghua University. The spatial resolution of the data is 1 km. Land use types are categorized into six categories after spatial resampling and reclassification: Cultivated Land, Forest, Grass Land, Artificial Surfaces, Useless Land, and Water Wetland.
2.2.2. Spatial Statistical Methods
Spatial data was analyzed using ArcGIS 10.4 software and the R programming language platform for trend analysis and spatial overlay analysis. Trend analysis utilized the M-K Kendall statistical analysis with a significance level of 0.05, calculating statistical change slopes, change significance, and their spatial distribution. Land use transition analysis was conducted using ArcGIS to compute land use transition matrices, and data visualization was achieved using the R programming language platform.
2.2.3. Time Trend Analysis Methods
The trend analysis employed the non-parametric Mann-Kendall and Theil-Sen’s slope methods. The Mann-Kendall trend test is a non-parametric test that doesn’t require data to follow a specific distribution (such as Gaussian distribution), and it accommodates missing data. It is a widely used and practical method for trend analysis. The Theil-Sen’s slope is used to calculate the slope of the trend. The trend analysis was conducted using the “trend” package in the R programming language.
2.2.4. Landscape Index Analysis
Shannon’s Diversity Index (SHDI) was employed to reflect landscape heterogeneity. SHDI emphasizes the contribution of rare patch types to information. When comparing and analyzing diversity and heterogeneity changes in different landscapes or different time periods within the same landscape, SHDI serves as a sensitive indicator. Shannon’s Evenness Index (SHEI), calculated as SHDI divided by the maximum possible diversity given the landscape abundance, represents the even distribution of all patch types [
38,
39].
3. Results and Analysis
3.1. Spatiotemporal Dynamics of NDVI in the Upper and Middle Reaches of the Fen River Basin
Vegetation coverage, a crucial indicator for assessing surface vegetation conditions and a significant factor affecting soil erosion and sediment runoff, plays important roles for regional environmental change and monitoring studies [
40,
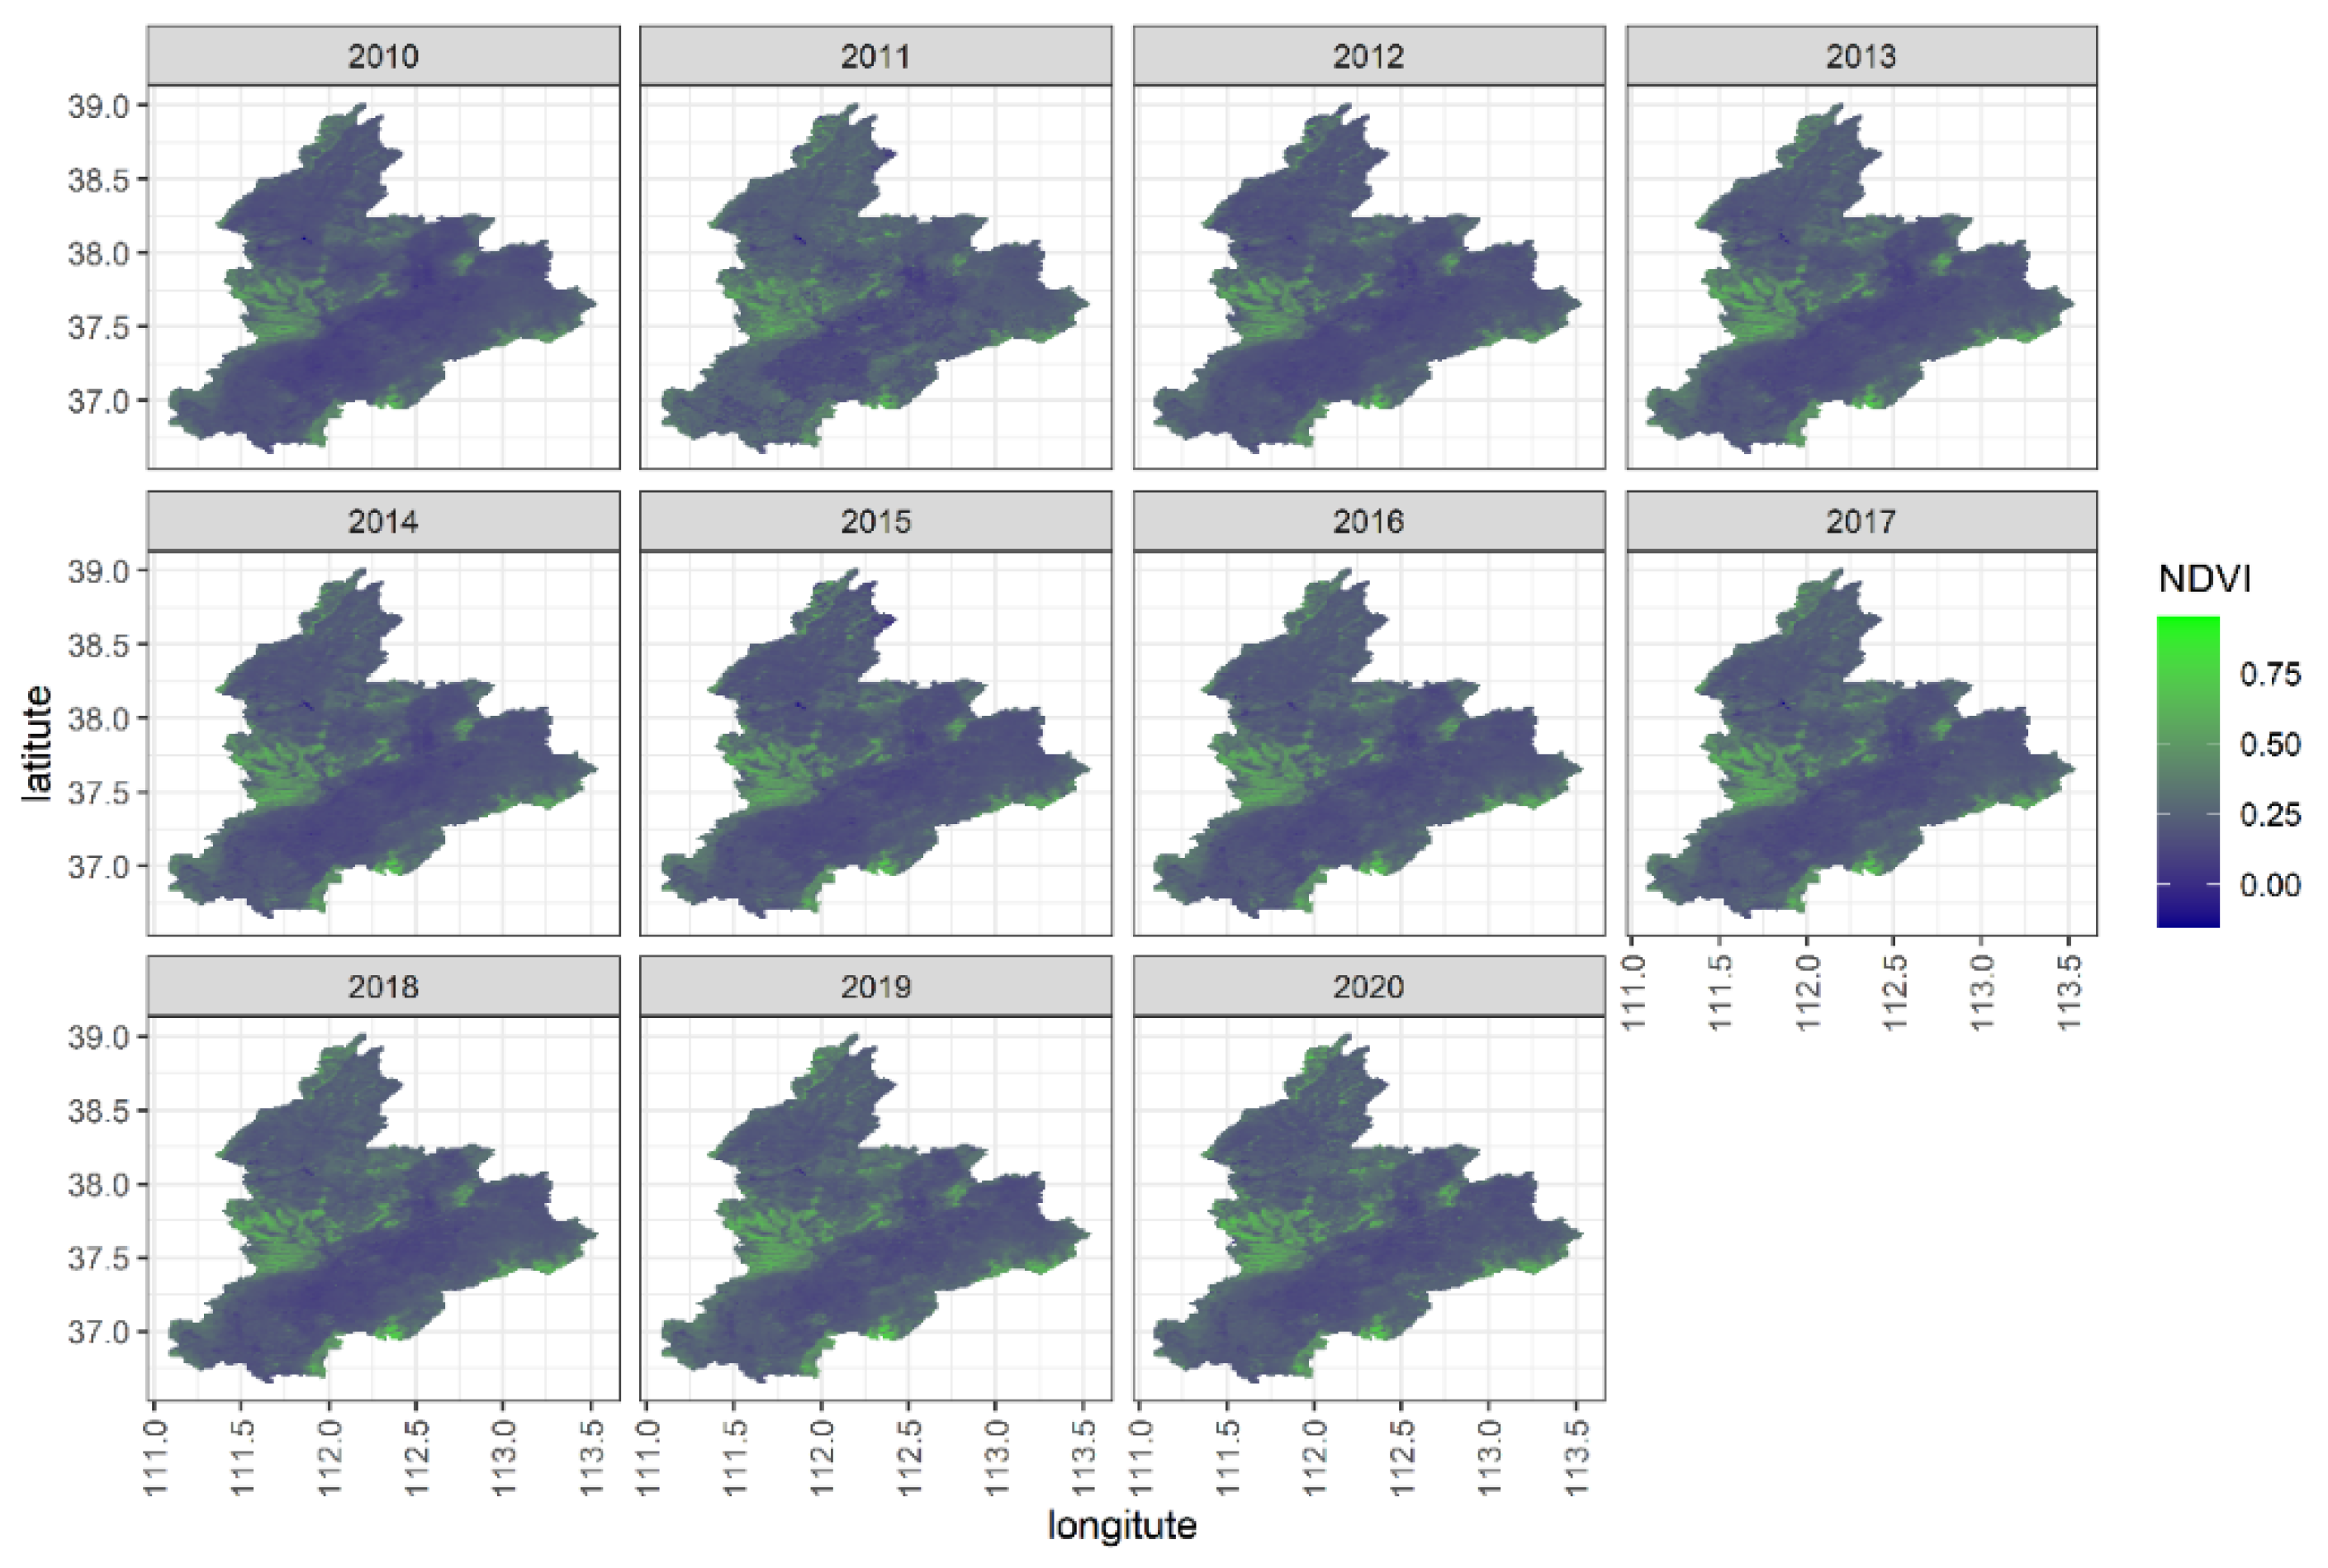
41]. A widely used and practical method for measuring vegetation coverage is the estimation through Normalized Difference Vegetation Index (NDVI). By combining remote sensing data interpretation, as depicted in the figure below (
Figure 2), regions with NDVI ≤ 0 represent non-vegetated areas, while areas with NDVI > 0 indicate vegetated regions. Regarding the spatial distribution of vegetation coverage, combining the digital elevation model (DEM) data from
Figure 1 reveal that areas with well-established vegetation coverage are primarily found in higher-altitude mountainous regions, whereas lower-altitude plains tend to be urban areas with relatively lower vegetation coverage. Analyzing the spatiotemporal changes in vegetation coverage over the past decade (2010–2020), there is a noticeable increasing trend in relatively higher average annual NDVI values (indicated by the green portion).
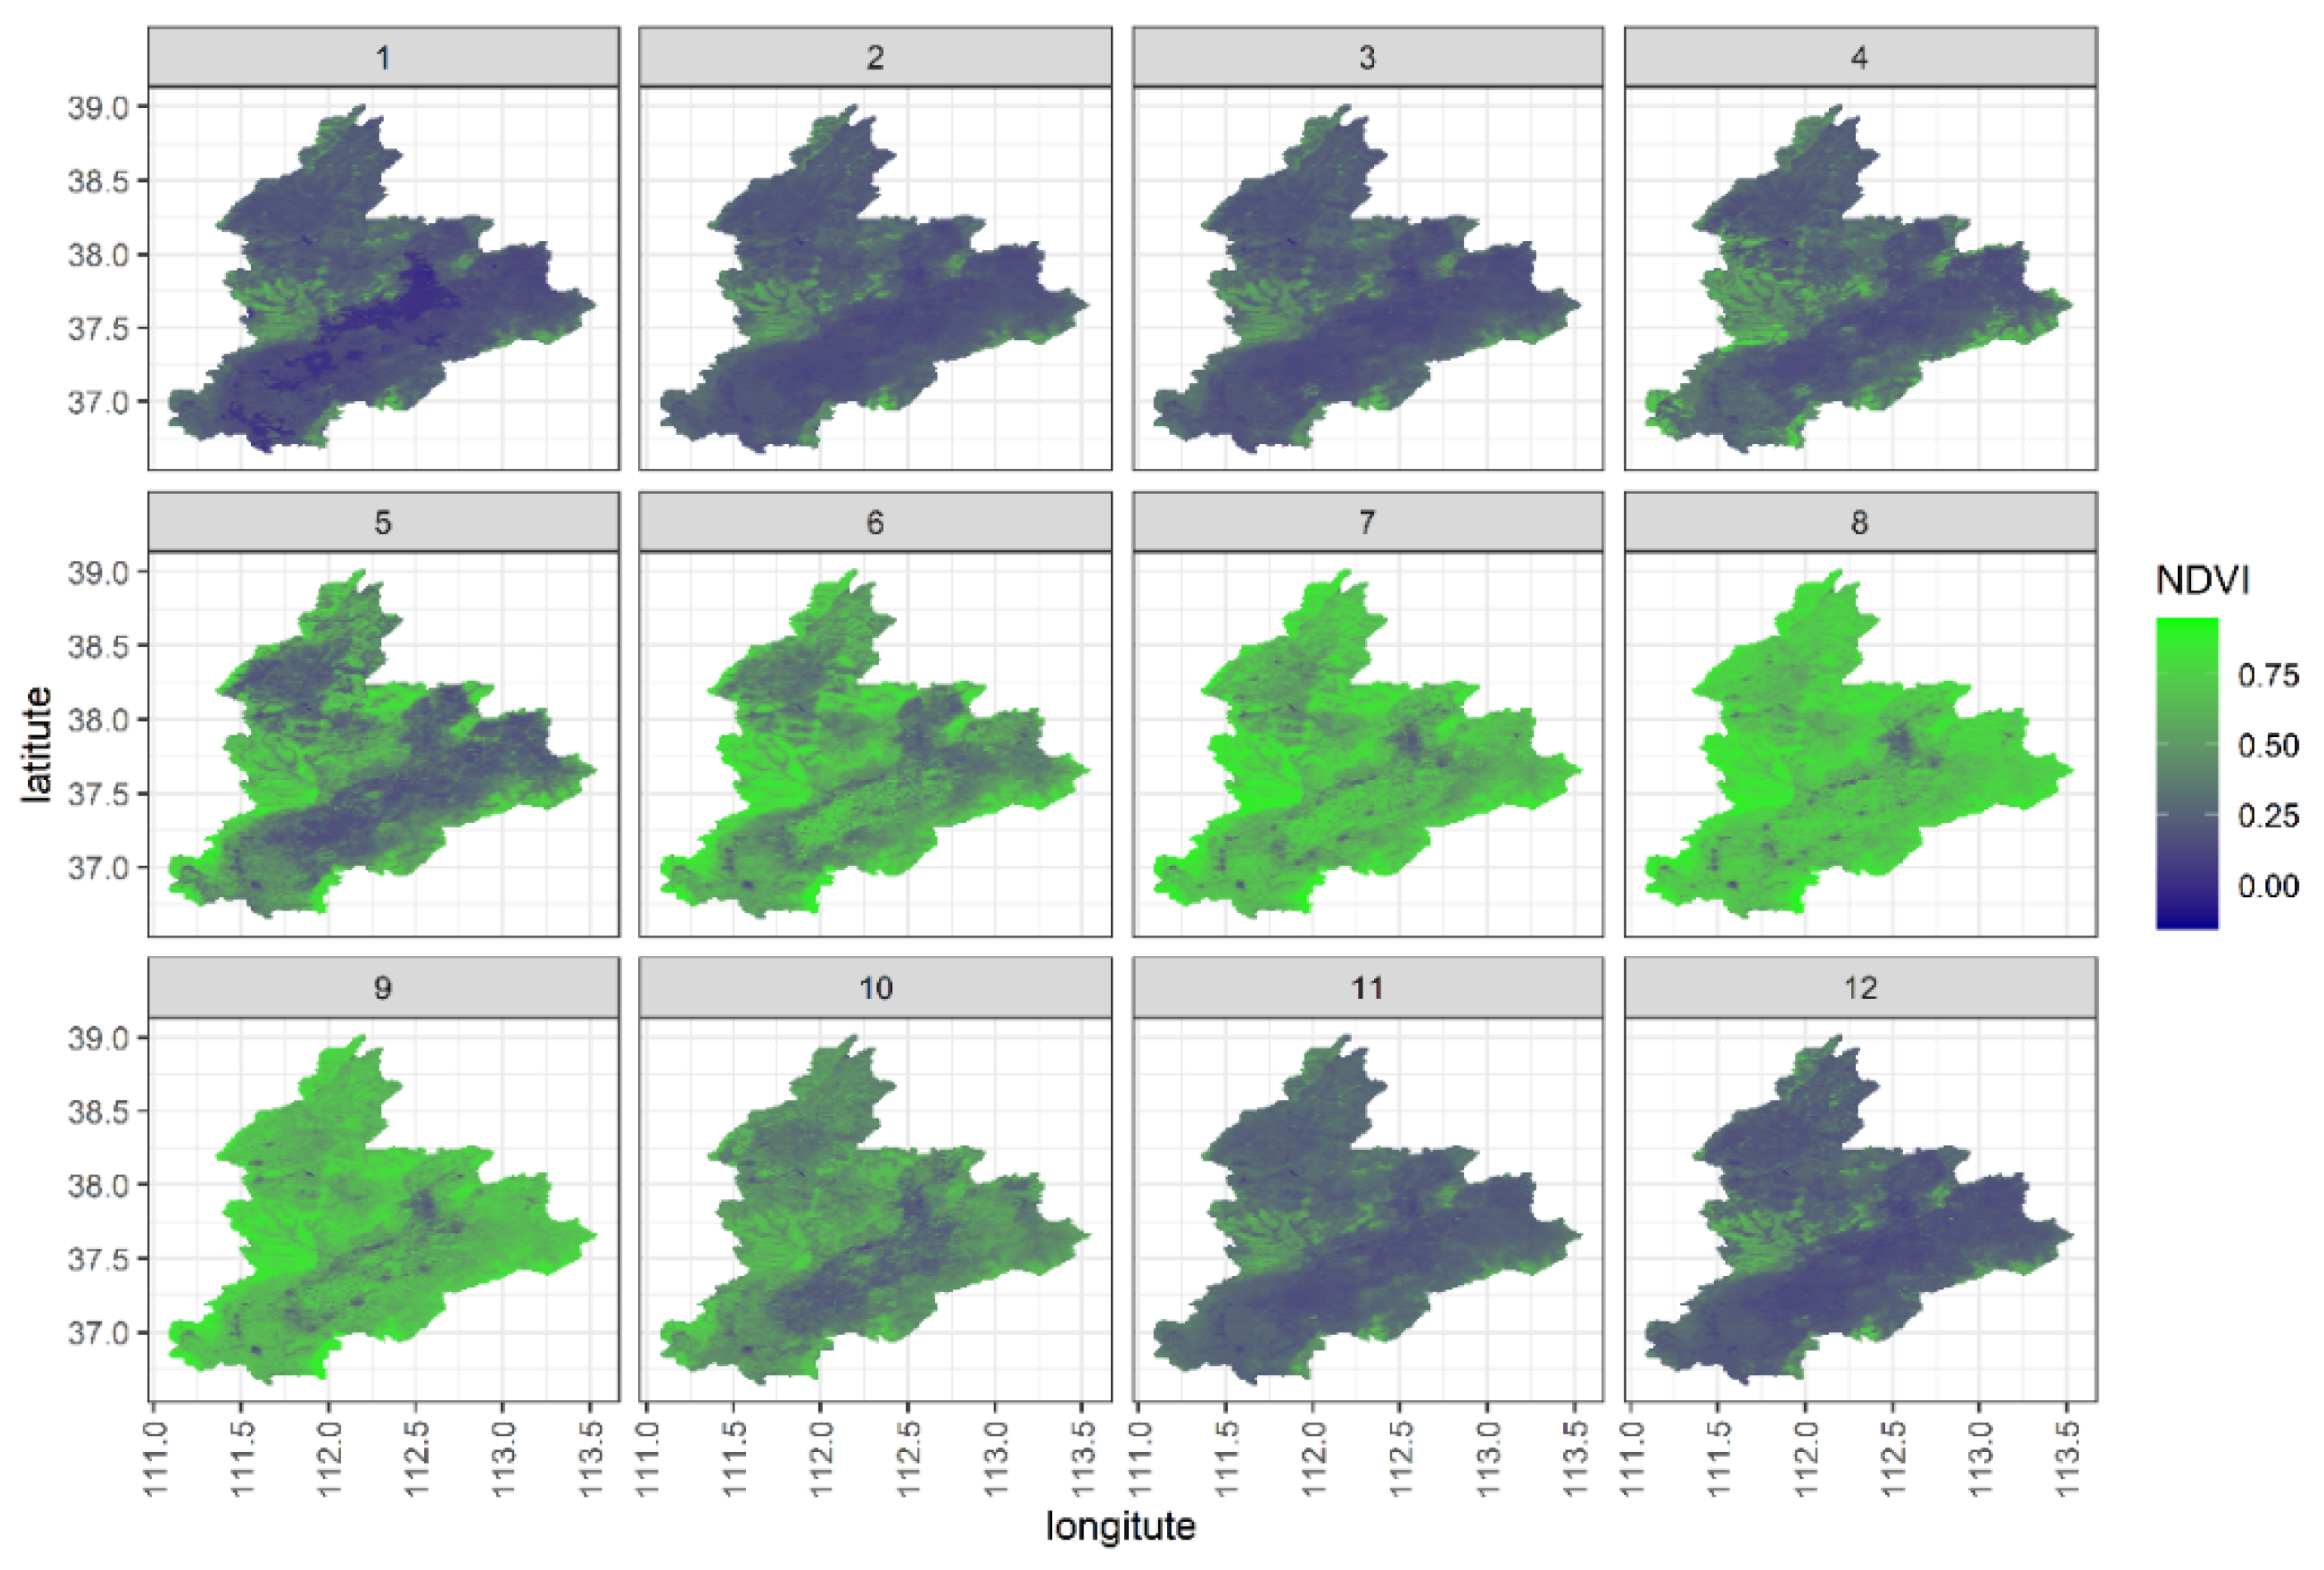
Throughout the period from 2010 to 2020, the monthly spatial variation of NDVI is illustrated in
Figure 3. NDVI values are relatively higher during the summer months (June to August) and lower during the winter months (December, January, and February).
Figure 4 illustrates the changing pattern of NDVI in the study area over the past decade. The annual trend chart indicates a clear upward linear regression trend, with an annual NDVI increment of 0.003 (
P < 0.001). The average monthly NDVI change over the 11 years in the upper and middle reaches of the Fen River Basin reveals that NDVI reaches its highest value in August (0.681) and its lowest value in January (0.214).
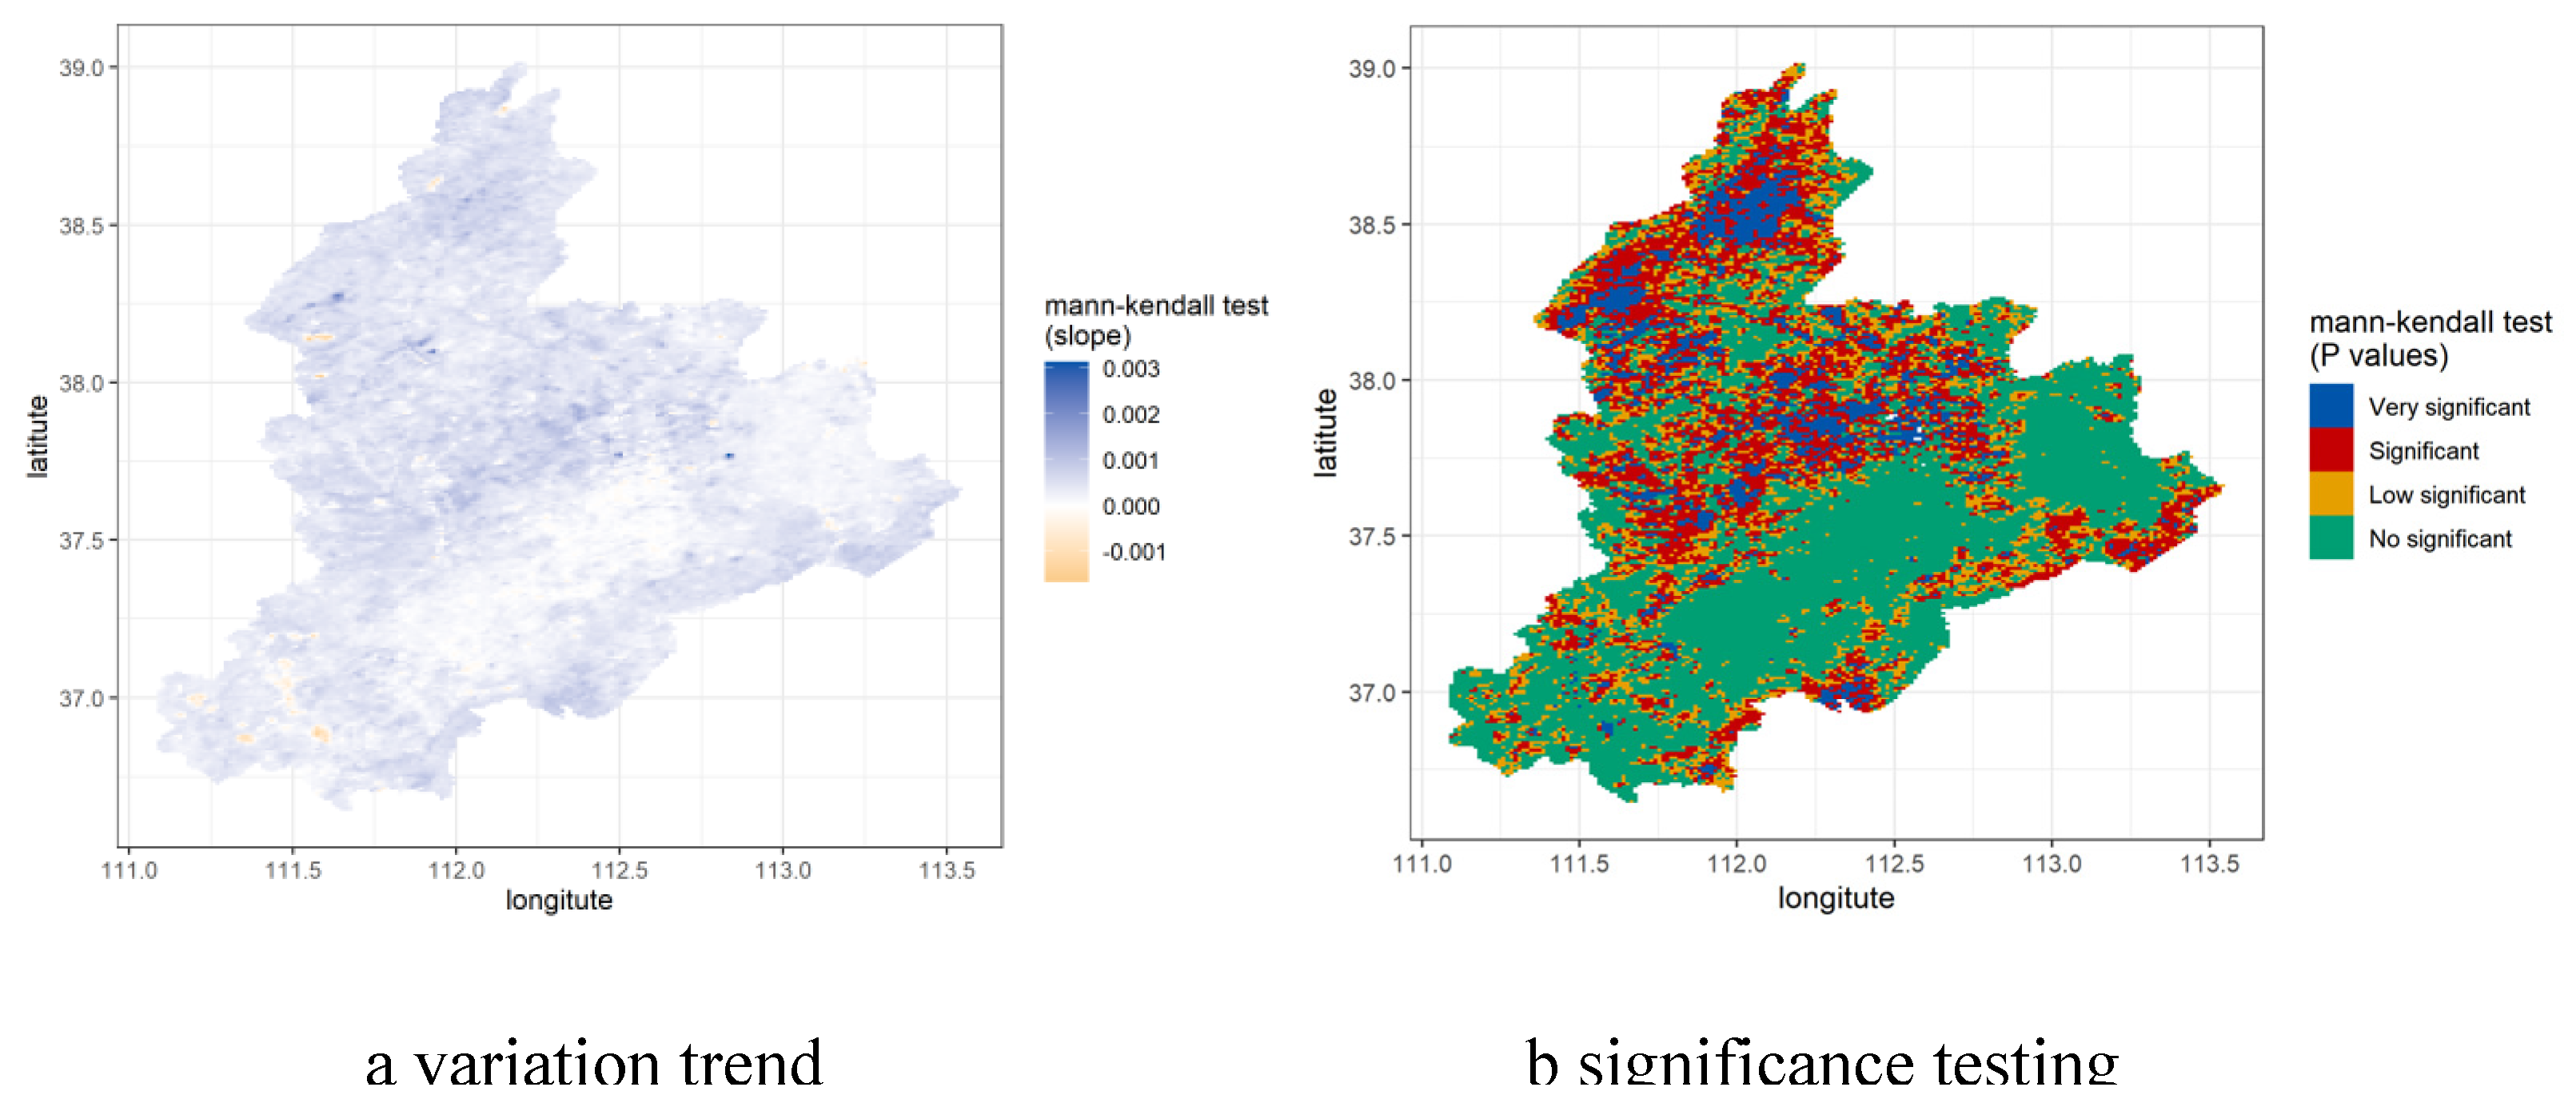
NDVI remote sensing data has a spatial resolution of 1 km. The spatial analysis of multi-year monthly NDVI at each grid point using the Mann-Kendall trend analysis and Sen’s slope analysis is shown in the figure below (
Figure 5a). The overall trend of NDVI slopes is positive, indicating an overall increase in NDVI and enhanced vegetation coverage. However, there are areas with negative slopes, primarily in low-altitude regions undergoing rapid urban development. The spatiotemporal distribution of NDVI trends at a 1 km resolution in the upper and middle reaches of the Fen River Basin is displayed in
Figure 5b. The spatial significance of NDVI changes is categorized into four classes: extremely significant (
P < 0.001), significant (
P < 0.05), slight change (
P < 0.1), and no significant change (
P > 0.1). Spatially, regions with extremely significant and significant changes are primarily located in high-altitude mountainous areas with relatively minimal human disturbance, where vegetation coverage is mostly forests or grasslands. Areas with no significant change are mainly concentrated in low-altitude urban areas.
3.2. Spatiotemporal Dynamics of Land Use and Land Cover Change (LUCC)
Urbanization stands as the most dominant force driving regional land use and land cover change [
42]. The LUCC change structure over multiple years, along with comparisons, can reveal the changing characteristics of land types in this area. Particularly, the changes in wetlands or water bodies within the Fen River Basin are of significant concern.
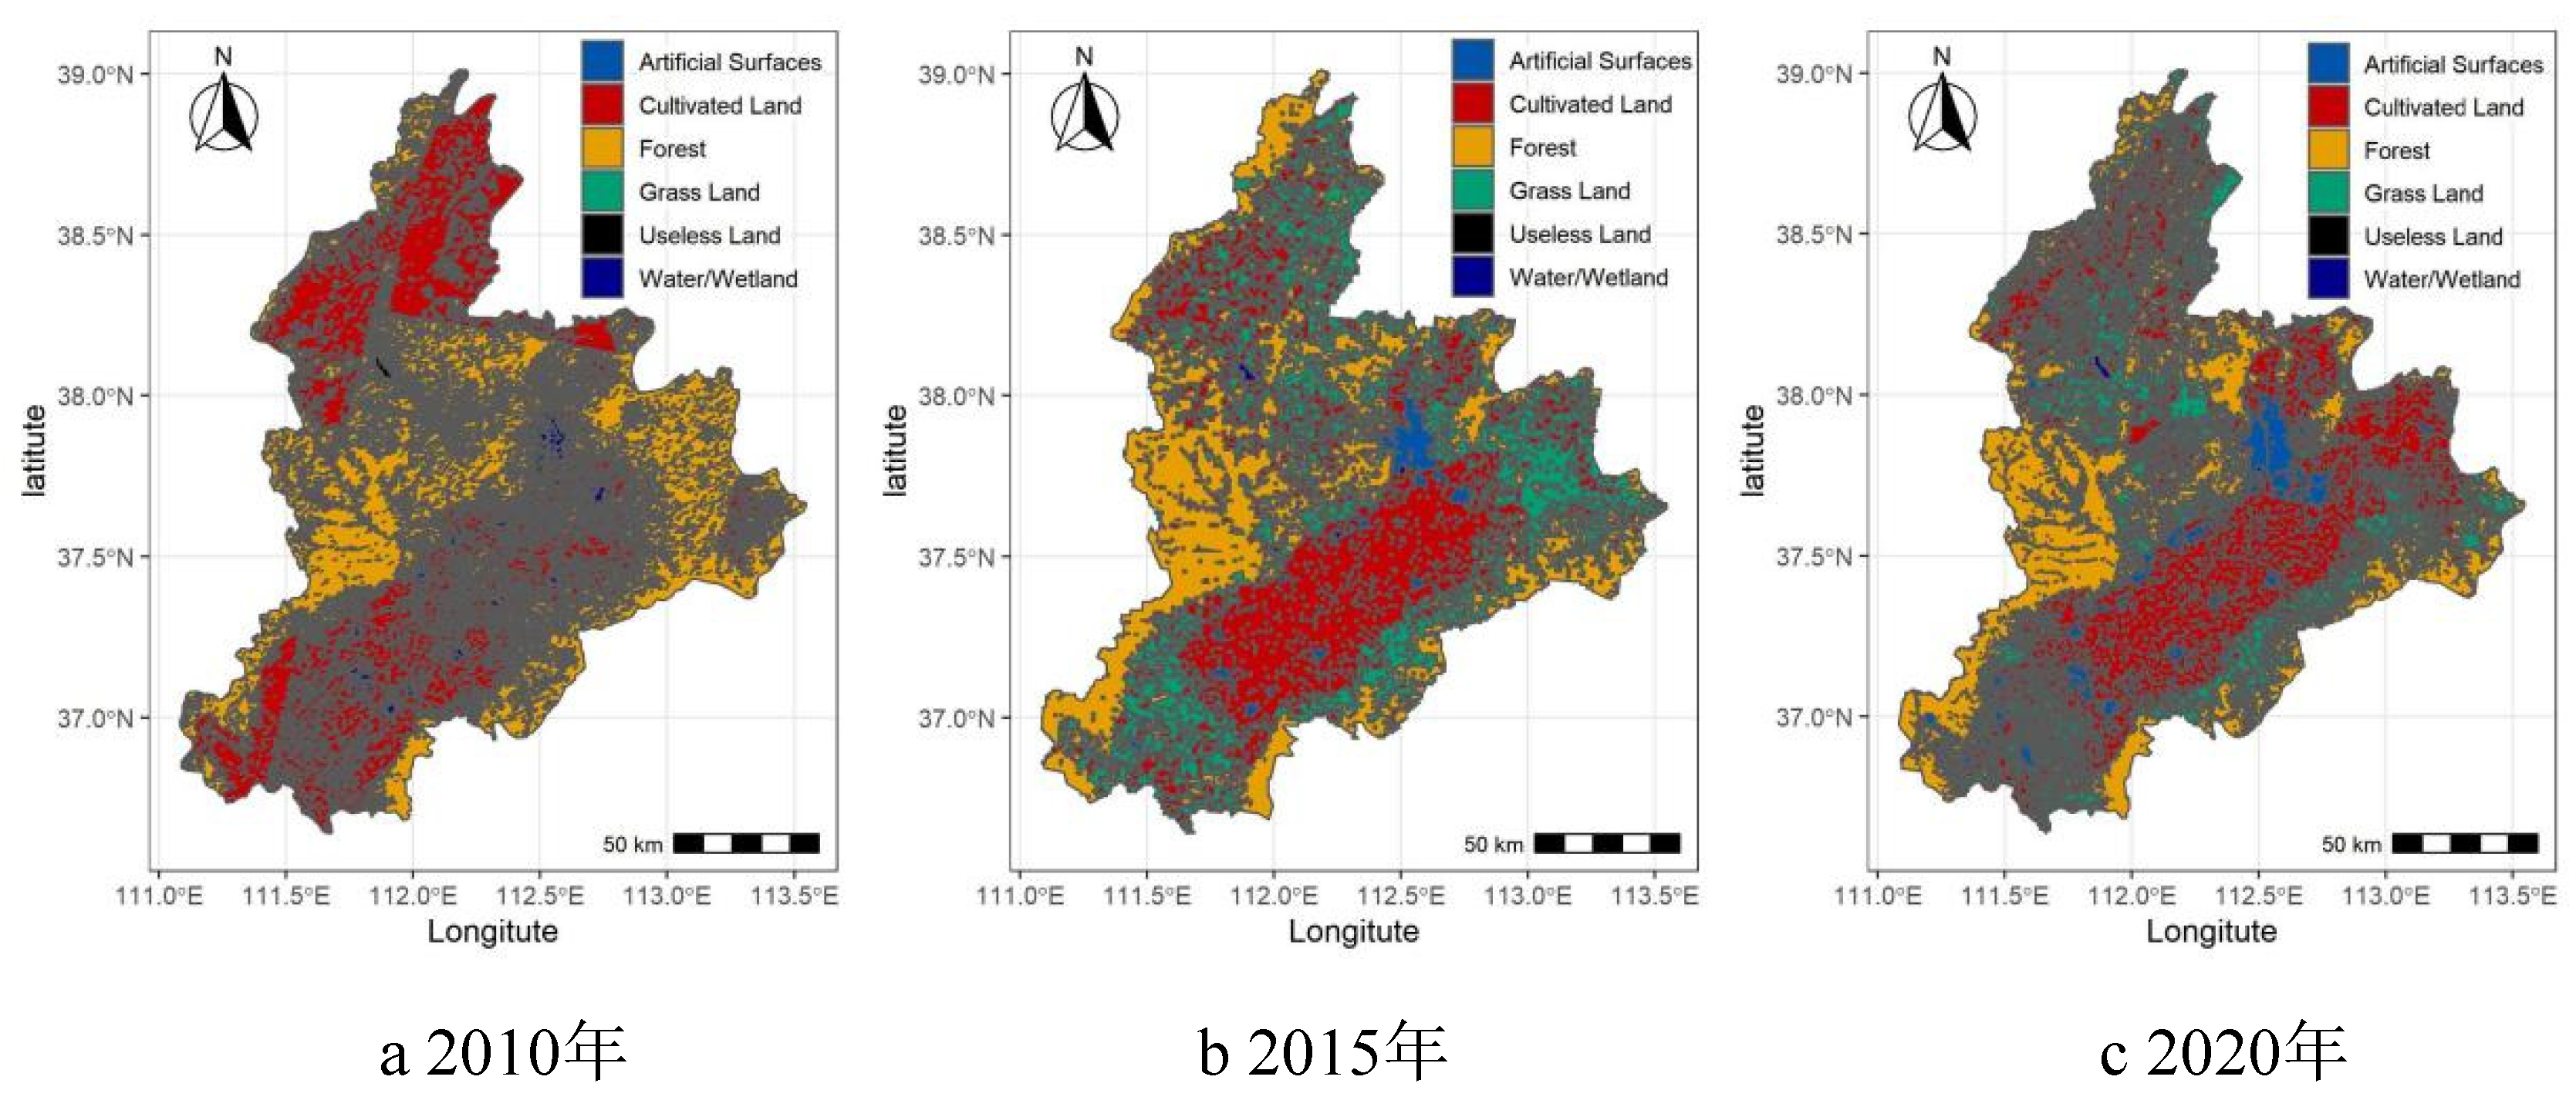
Figure 6 illustrates the LUCC remote sensing data for the upper and middle reaches of the Fen River Basin in the years 2010, 2015, and 2020, categorized into six land types after resampling.
The three phases of land use data reveal that forests dominate in high-altitude mountainous regions, while low-altitude areas are predominantly cultivated land. The results show that in 2010, cultivated land and forests accounted for the largest proportions, at approximately 43.0% and 43.2% of the total area, respectively. Water bodies or wetlands covered about 4.2% of the area. In 2015, the land use structure displayed that cultivated land and forests still constituted the largest proportions, at about 35.1% and 31.3% of the total area, respectively. Grassland, compared to 2010, increased from 7.6% to 28.7% of the area. However, water bodies or wetlands significantly decreased to only 0.7%. In 2020, the land use structure still showed cultivated land and forests as the dominant categories, accounting for approximately 37.7% and 30.2% of the total area, respectively. The proportion of grassland decreased from 28.7% in 2015 to 24.4% in 2020. The area of water bodies or wetlands further decreased to only 0.3%.
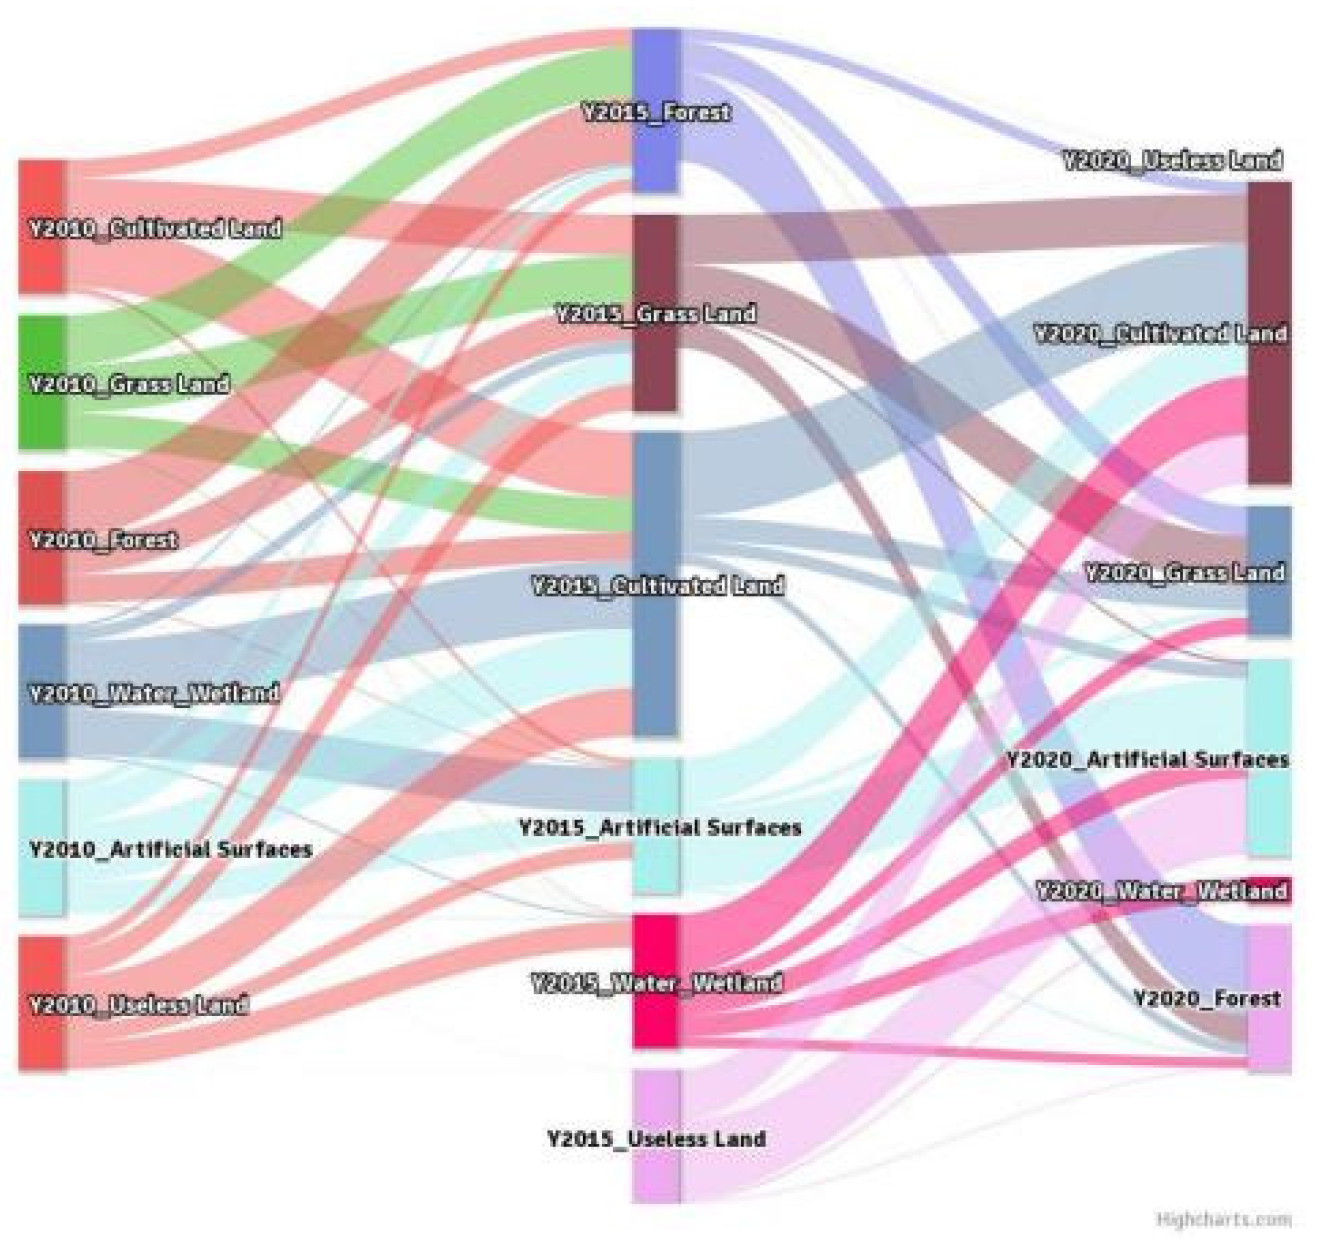
The land use transfer percentage Sankey diagram for the years 2010-2015-2020 in the upper and middle reaches of the Fenhe River Basin depicts the dynamic changes in different land use types (
Figure 7). From 2010 to 2015, water bodies or wetlands significantly decreased and were predominantly converted to cultivated land (51.3%), with some transforming into artificial surfaces (33.9%). Only a small proportion shifted to grassland or forests (2.2%), maintaining their original water body or wetland status. The changes in different land use types from 2015 to 2020 showed a significant reduction in water bodies or wetlands, mainly converting to cultivated land (44.0%) and artificial surfaces (18.4%). Areas that remained as wetlands or water bodies accounted for 16.3%.
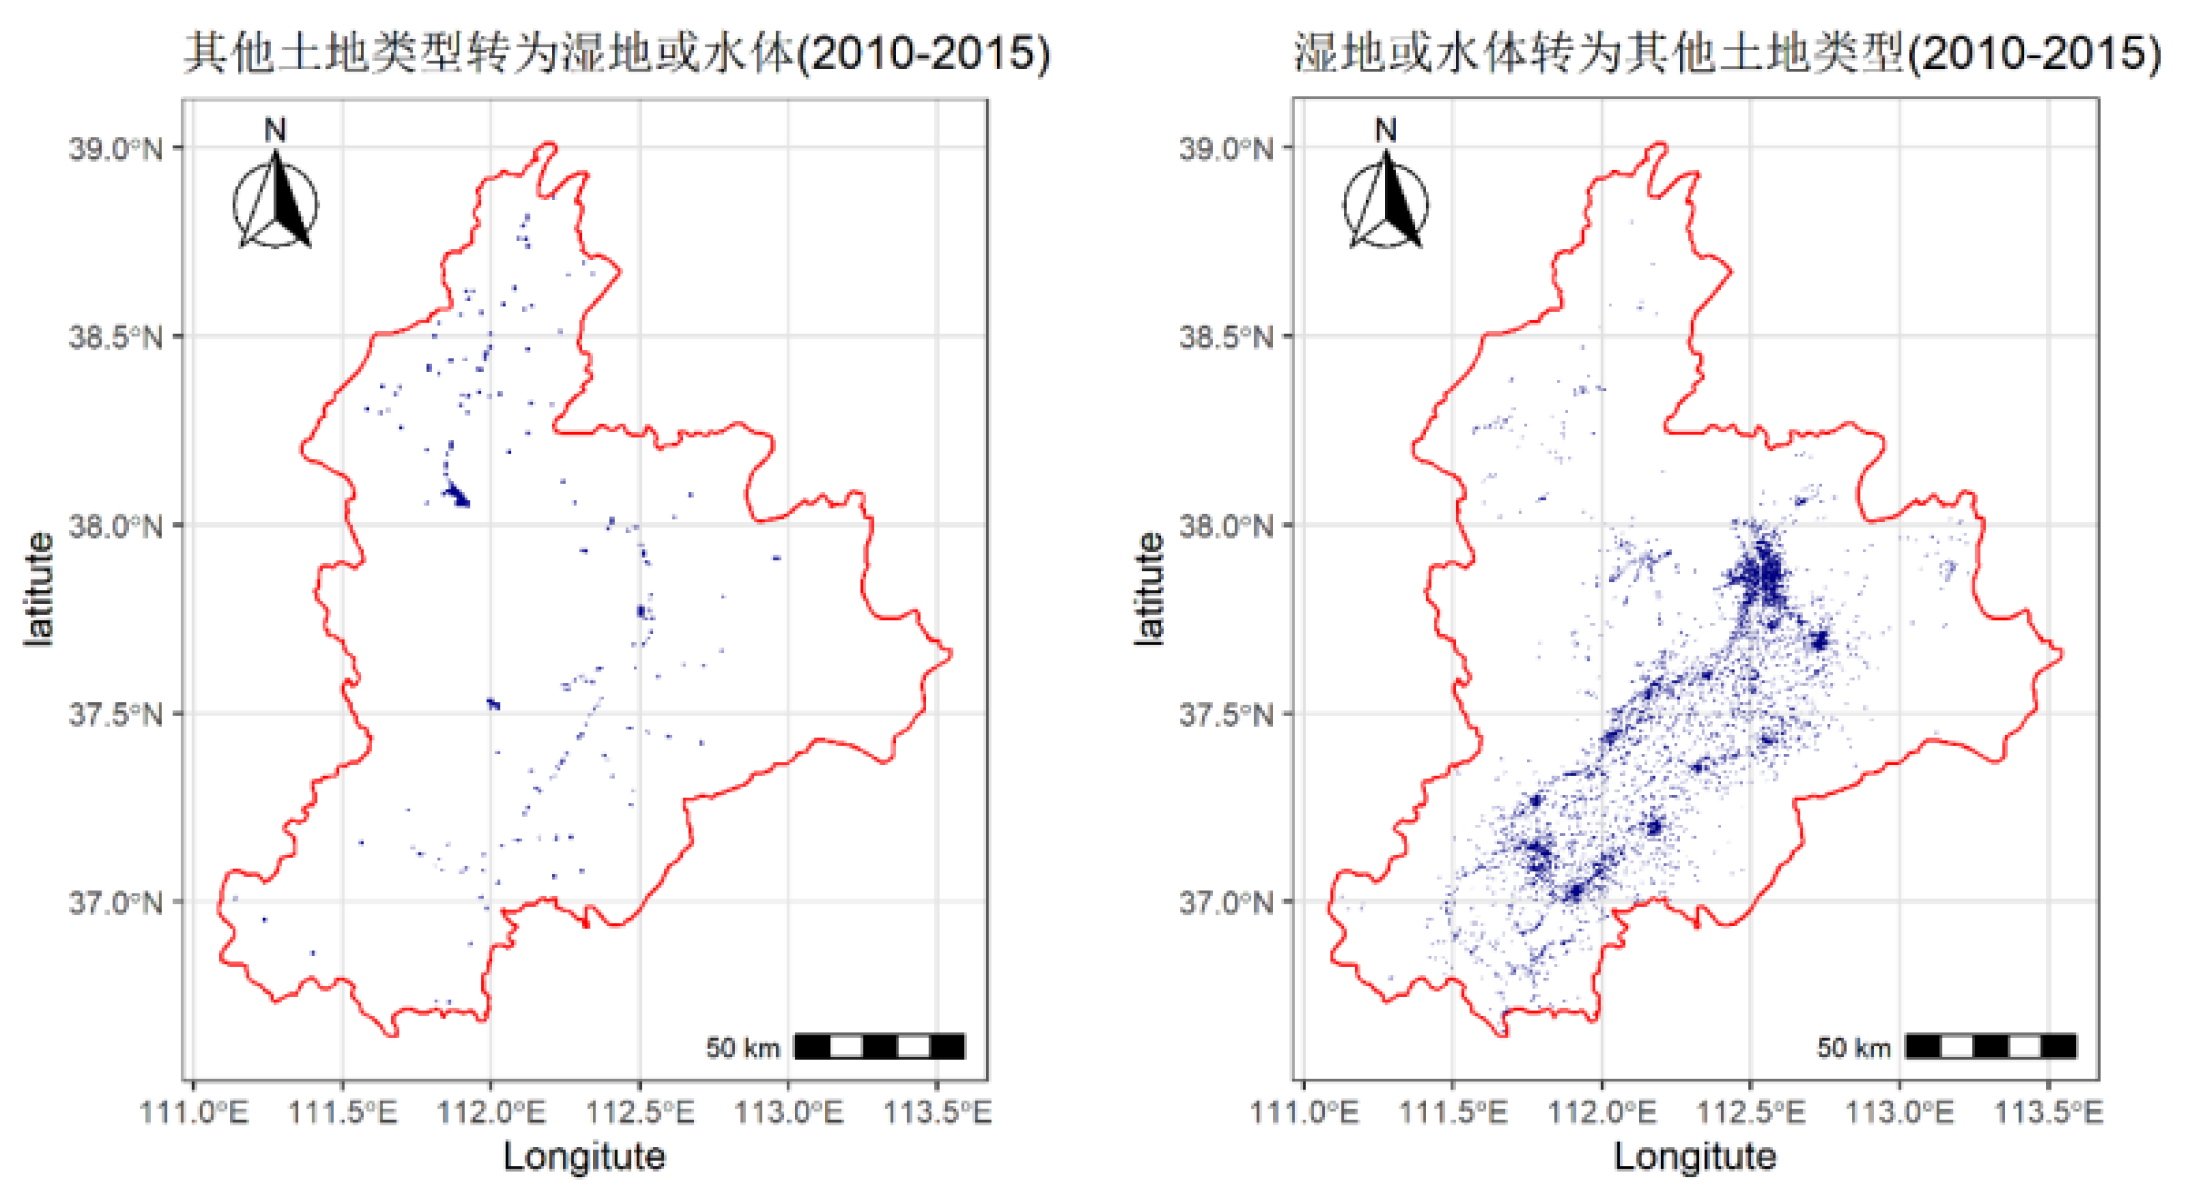
The changes in wetland or water body area from 2010 to 2015 are shown in
Figure 8. The wetland or water body area significantly decreased during this period, primarily due to their conversion to other land types. Additionally, the study results indicate that during 2010-2015 in the upper and middle reaches of the Fenhe River Basin, the most significant change was the conversion of unused land to water bodies or wetlands, followed by the transformation of artificial surfaces to water bodies or wetlands, accounting for 20.24% and 1.09% of their respective areas. This suggests that during this period, despite human activities intensifying the development of built-up areas and previously unused land into water bodies or wetlands, the overall proportion of water bodies and wetlands remained the lowest and notably decreased compared to 2010. The primary changes in water bodies or wetlands from 2010 were the conversion to cultivated land and artificial surfaces in 2015, accounting for 51.3% and 33.9%, respectively, totaling 85.2%. Grassland was the next most significant transition, accounting for 9.6%, and only 2.2% remained unchanged as water bodies or wetlands.
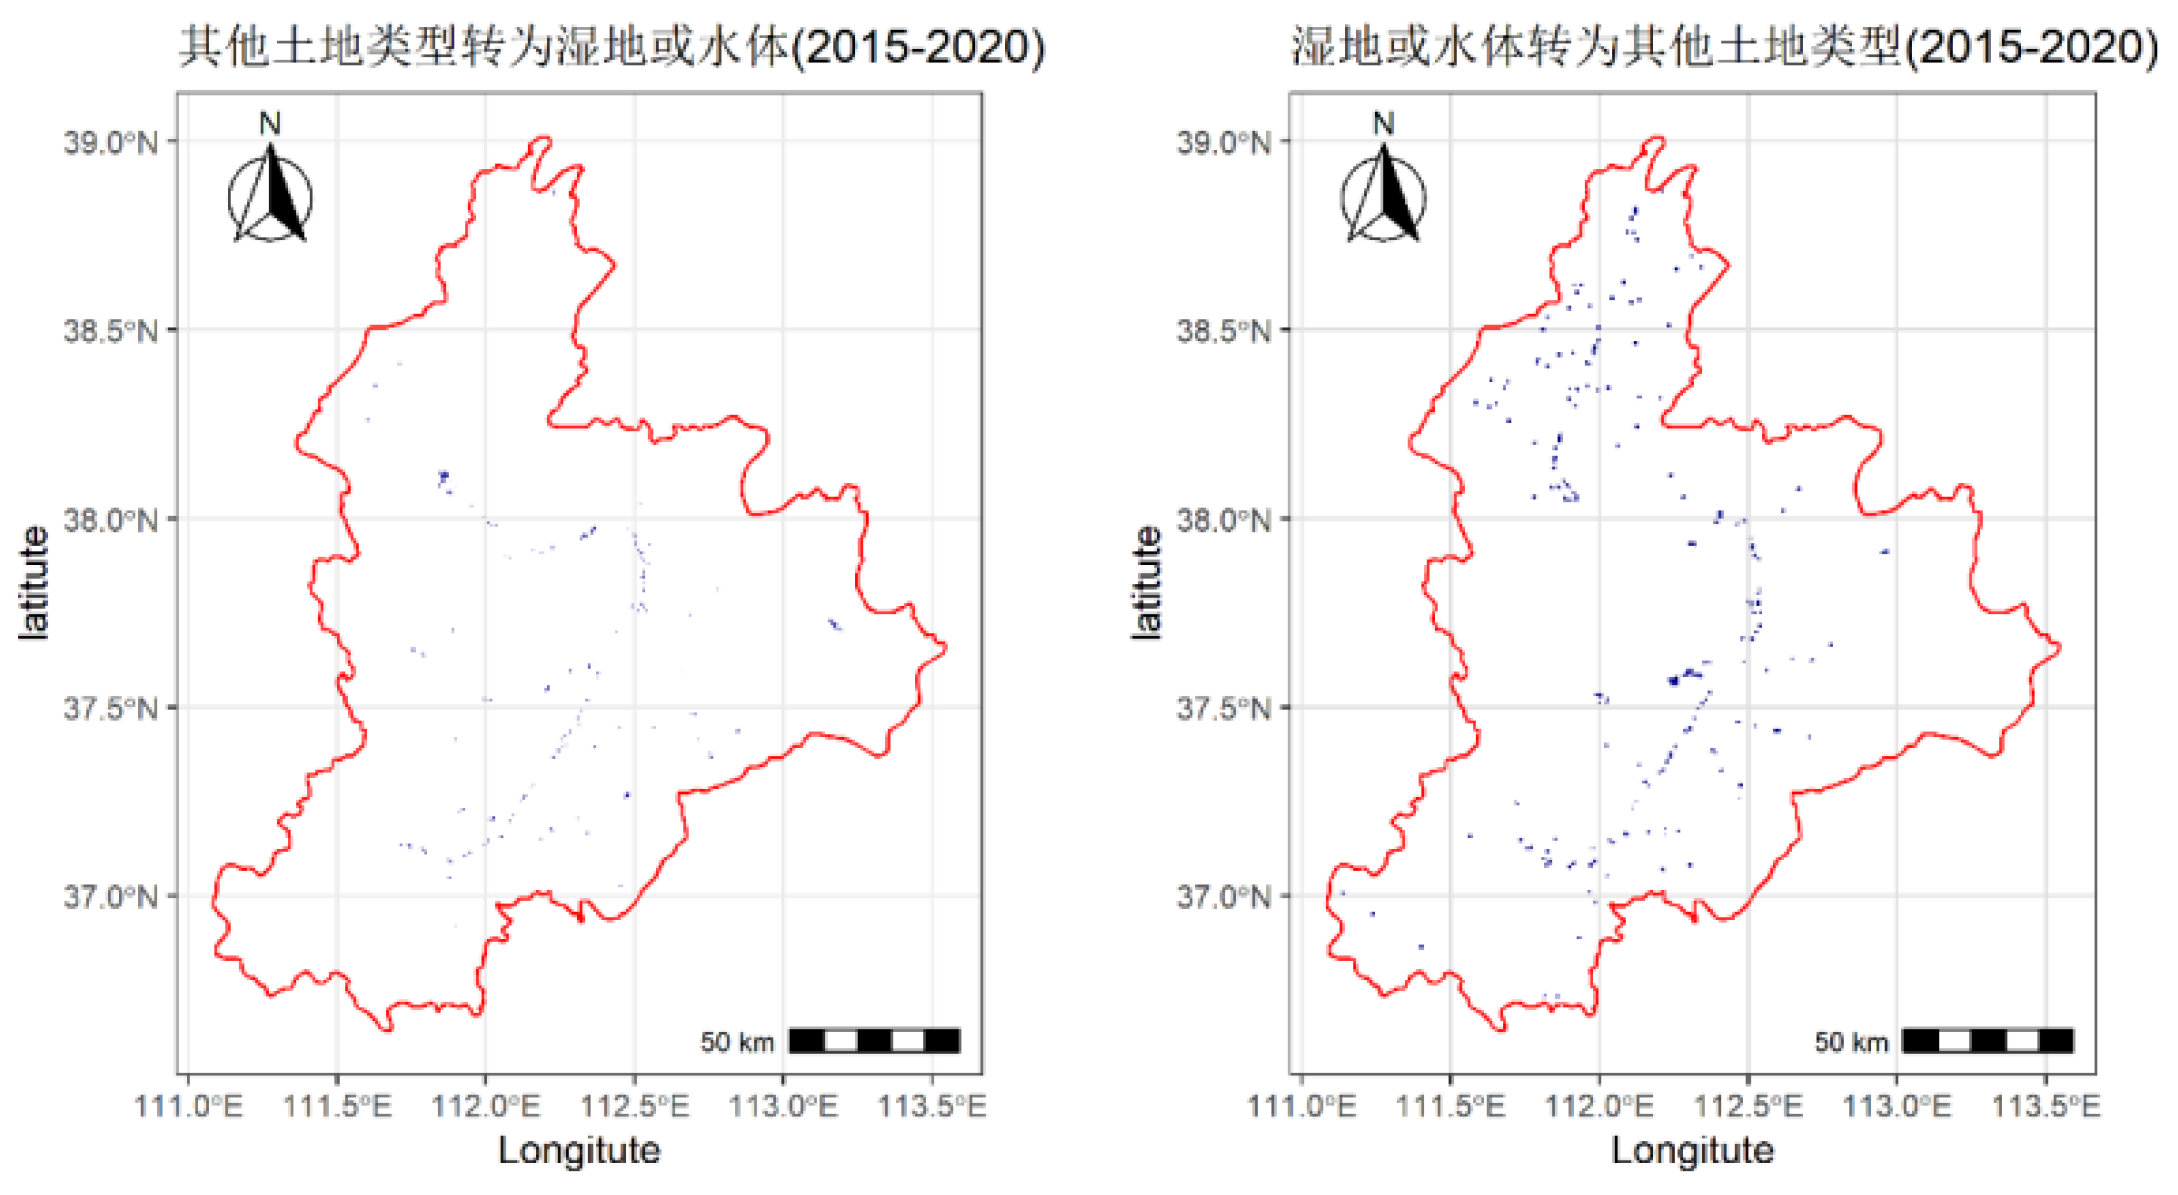
Figure 9 illustrates the changes in wetland or water body area from 2015 to 2020. The results show a significant reduction in wetland or water body area, mainly converting to other land types. However, compared to the period from 2010 to 2015, this area decreased significantly. Moreover, the changes in water bodies or wetlands in 2015 to cultivated land and artificial surfaces in 2020 remained the largest proportion, accounting for 44.0% and 18.6%, respectively (totaling 52.6%). The next significant transition was to grassland, accounting for 13.1%, and 16.33% remained unchanged as water bodies or wetlands. Compared to the 13
th Five-Year Plan period, the changes in water bodies or wetlands to cultivated land or artificial surfaces were 51.3% and 33.9% (totaling 85.2%), a decrease of over 30% in recent years.
3.3. Spatiotemporal Patterns of Landscape Spatial Structure Change
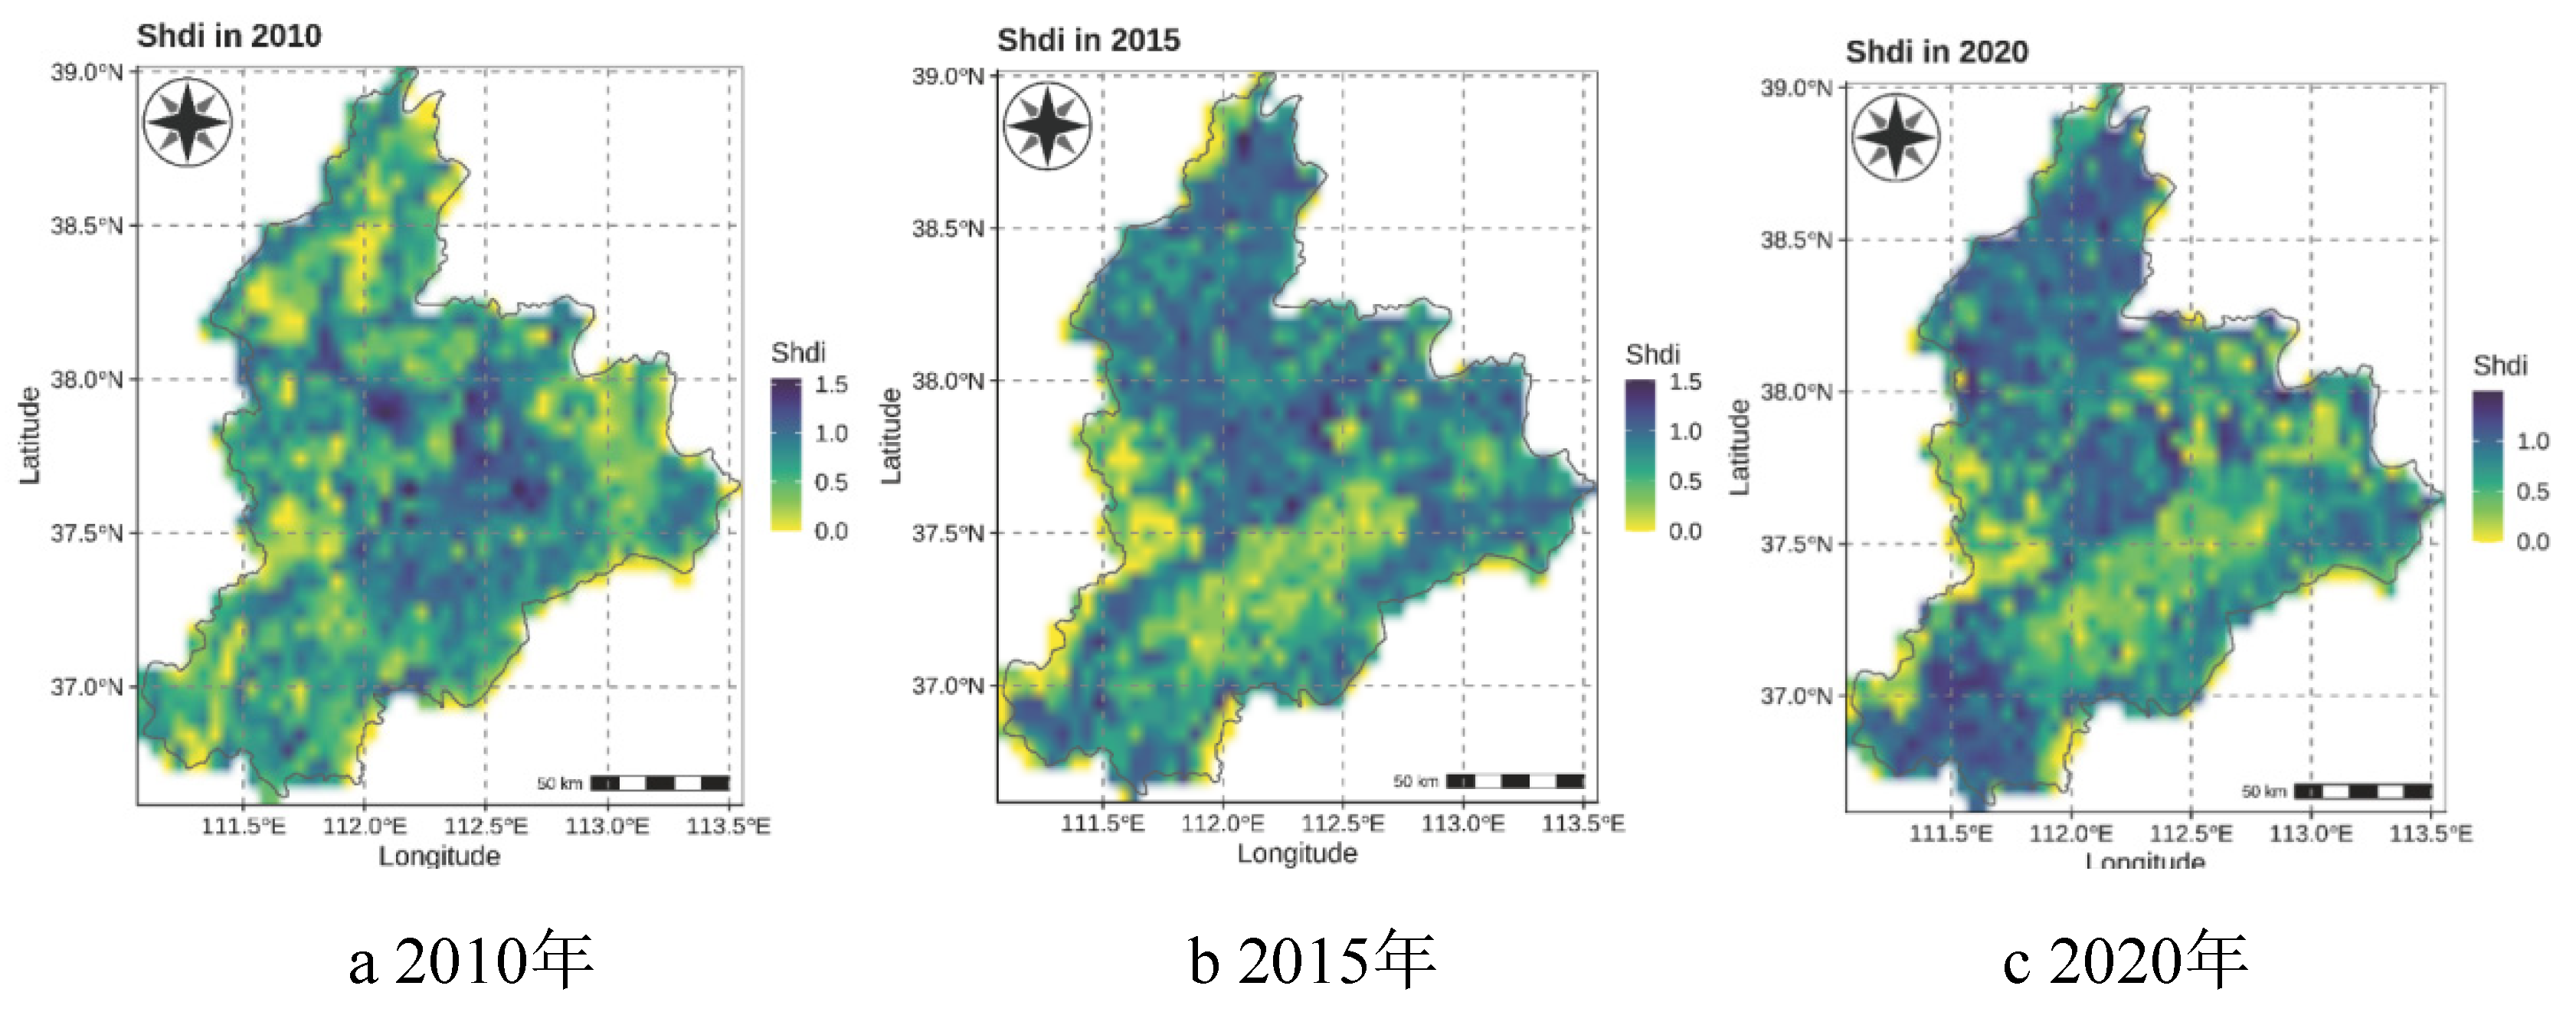
In 2010, the spatial diversity index (SHDI) of LUCC landscapes in the upper and middle reaches of the Fen River Basin, at a spatial resolution of 5 km, is illustrated in
Figure 10a. The SHDI values in the high-altitude boundary areas of the basin are below 1.0, and they are close to 0 near the boundaries. These regions with relatively low SHDI are associated with the specific land use types of the areas. These higher altitude regions have a uniform land use type, resulting in lower SHDI values. In contrast, areas with low altitudes, such as plains and urban regions with higher human activity, exhibit higher SHDI values, exceeding 1.0, with urban areas reaching over 1.5. This indicates a higher landscape diversity in these areas, with no dominant land use type. In 2015, the SHDI values in the high-altitude boundary areas remained below 1.0, and they were near 0 (
Figure 10b). Similar to 2010, the regions with lower SHDI were related to specific land use types in these areas, where the higher altitude regions have uniform land use types. Compared to 2010, in 2015, the regions with relatively high SHDI exhibited a tendency to radiate from urban clusters towards the surrounding areas, particularly with a northward shift (
Figure 10b). The regions with high SHDI, indicative of significant human activity in urban areas in 2010, generally decreased in 2015, suggesting a gradual homogenization of land use types in urban areas. The spatial shift of SHDI towards the north implies that during 2010-2015, the originally relatively homogeneous land use types in the northern areas diversified, possibly due to frequent human activities and economic and social development leading to more open land use changes. In 2020, the SHDI values in the high-altitude boundary areas remained below 1.0, and they were near 0 (
Figure 10c). Similar to previous years, these regions with relatively low SHDI were related to specific land use types, higher altitudes, and uniform land use types. Compared to 2015, in 2020, the regions with relatively high SHDI exhibited a tendency to cluster in the south (
Figure 10c), indicating an increase in landscape uniformity due to human activity impacts on LUCC. The regions with lower SHDI values in urban areas with significant human activity in 2015 saw minimal changes in 2020, suggesting a maintained land use type uniformity. The spatial shift of SHDI towards the south implies that during 2015-2020, the originally relatively diverse land use types in the southern areas gradually became more uniform, likely due to increased human activities and the resultant land use changes. Overall, the spatial distribution of SHDI for LUCC landscapes showed higher values in the northern parts and lower values in the southern parts, with significant influences from urbanization and human activities on LUCC landscapes.
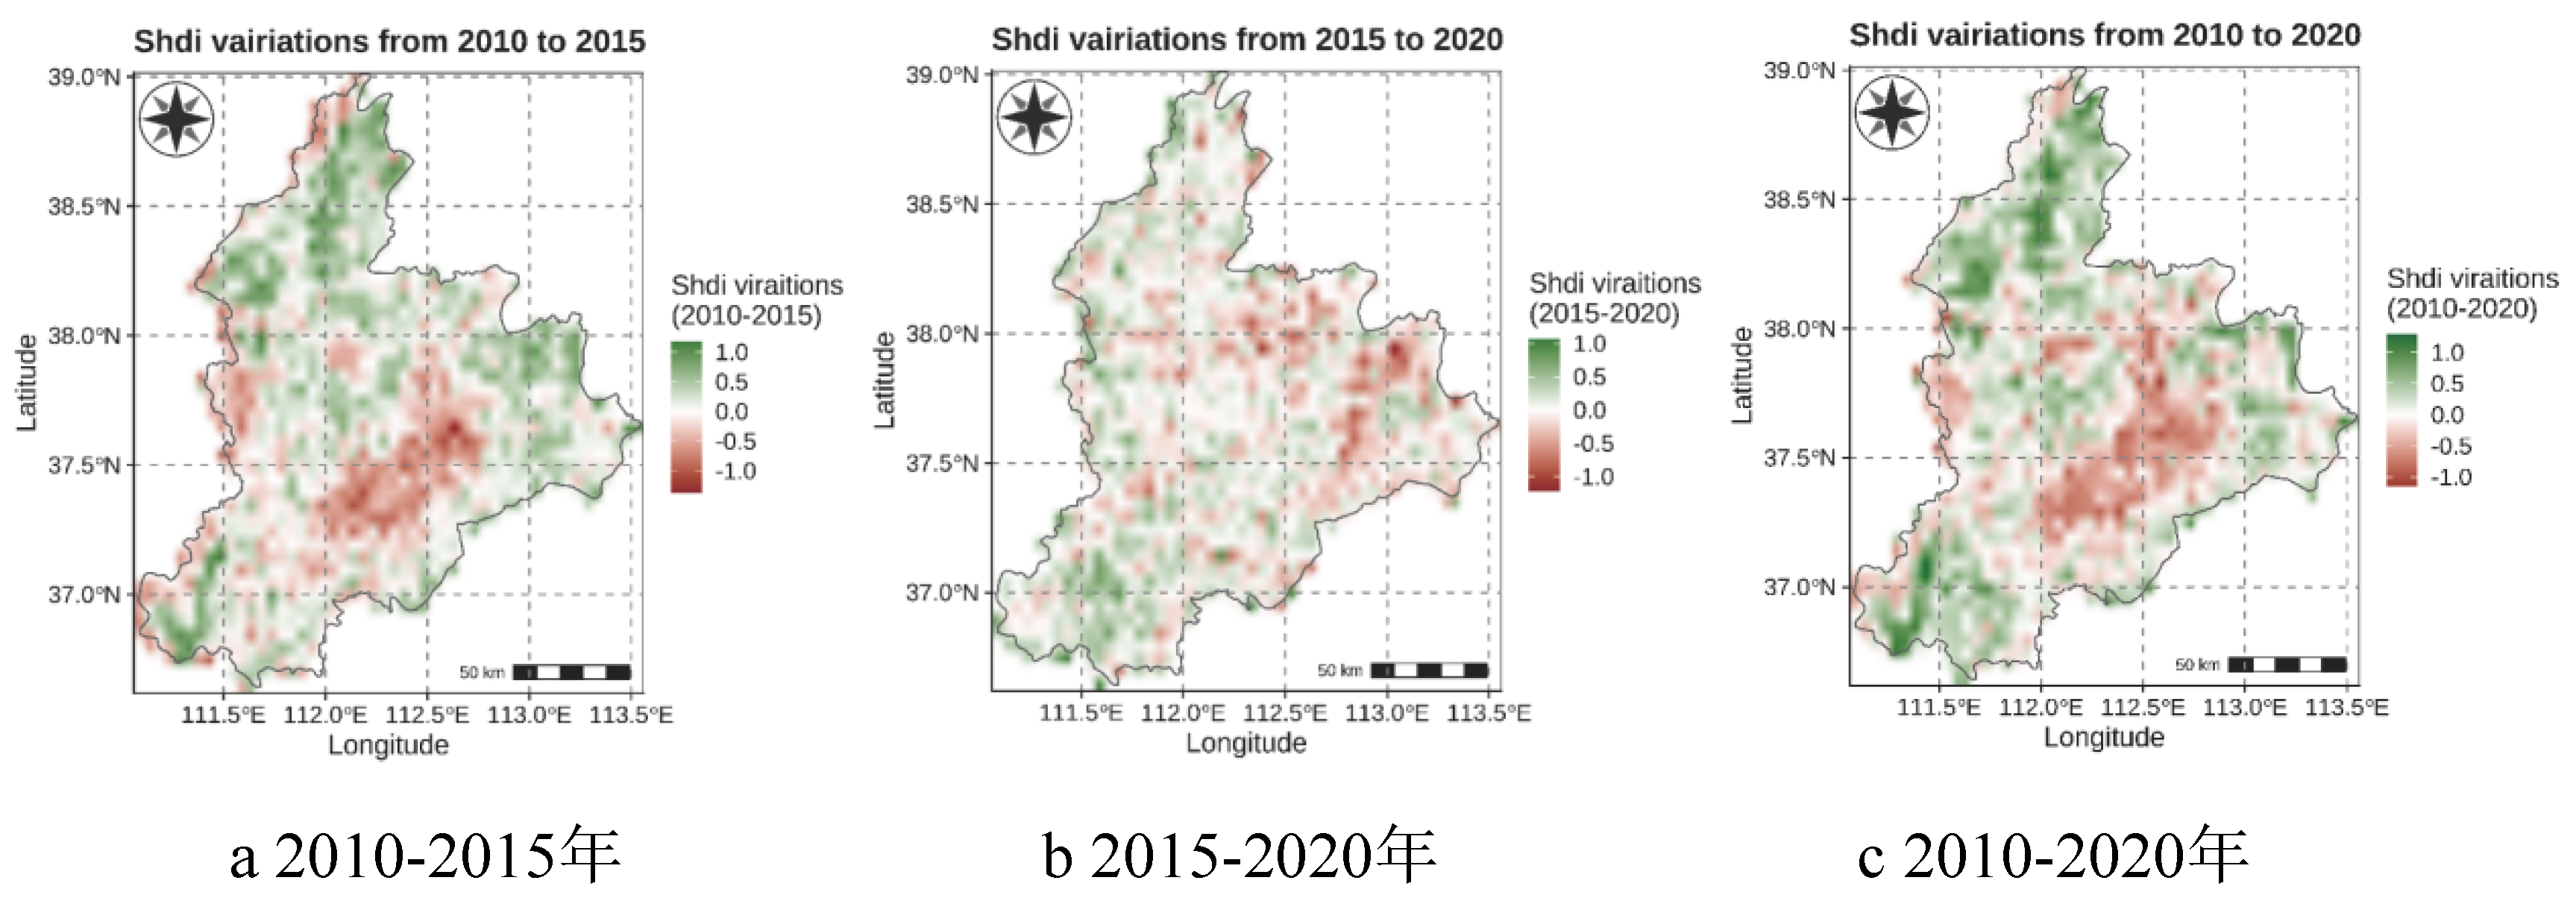
During the period from 2010 to 2015, areas with relatively higher SHDI were predominantly located in the northern region and a small portion in the far southern region. This indicates an enhancement in land use and land cover (LUCC) type diversity in these regions. However, the SHDI values in urban areas and the central part of the watershed, as shown in
Figure 11a, experienced negative changes. This suggests that in regions with higher human population density, the diversity of LUCC landscape types decreased significantly. This phenomenon can be attributed to the homogenization of LUCC types in urban areas after scaling up urbanization, leading to relatively minor changes. Therefore, during the period from 2010 to 2015, the spatial distribution of the Shannon Diversity Index (SHDI) for LUCC landscapes was higher in the northern region and lower in the southern region, with significant impacts from urbanization and human activities, particularly in the central part of the watershed. From 2015 to 2020, the areas experiencing a reduction in LUCC landscape diversity covered almost the entire watershed, as illustrated in
Figure 11b. This indicates that over the past five years, human activities have exerted a more intensive influence on land use and land cover types throughout the watershed. Only a small region in the southern part of the watershed saw a slight increase in LUCC diversity, suggesting an increase in land type diversity in these areas. Additionally, the SHDI in the eastern part of the watershed exhibited a noticeable decrease, signifying a gradual eastward expansion of human activities. Hence, the spatial reduction in LUCC landscape diversity in the study area from 2015 to 2020 is evident, with only a slight increase observed in the southern part of the watershed. This decrease in LUCC landscape diversity is also apparent in the eastern part of the watershed, indicating a trend of eastward human activity expansion. Overall, from 2010 to 2020, the spatial changes in LUCC landscape diversity were heterogeneous (
Figure 11c). Areas with significant reductions in diversity were mainly concentrated in the central part of the watershed, where urbanization and human activities were most intensive. In contrast, the changes in LUCC diversity were relatively minor in the northern and southern regions of the watershed. In summary, the reduction in LUCC landscape diversity in spatial distribution during the period from 2010 to 2020 was primarily driven by urbanization processes radiating outward from urban centers, resulting in a homogenization of land use types and a decrease in diversity. This highlights the significant impact of human activities on LUCC landscapes.
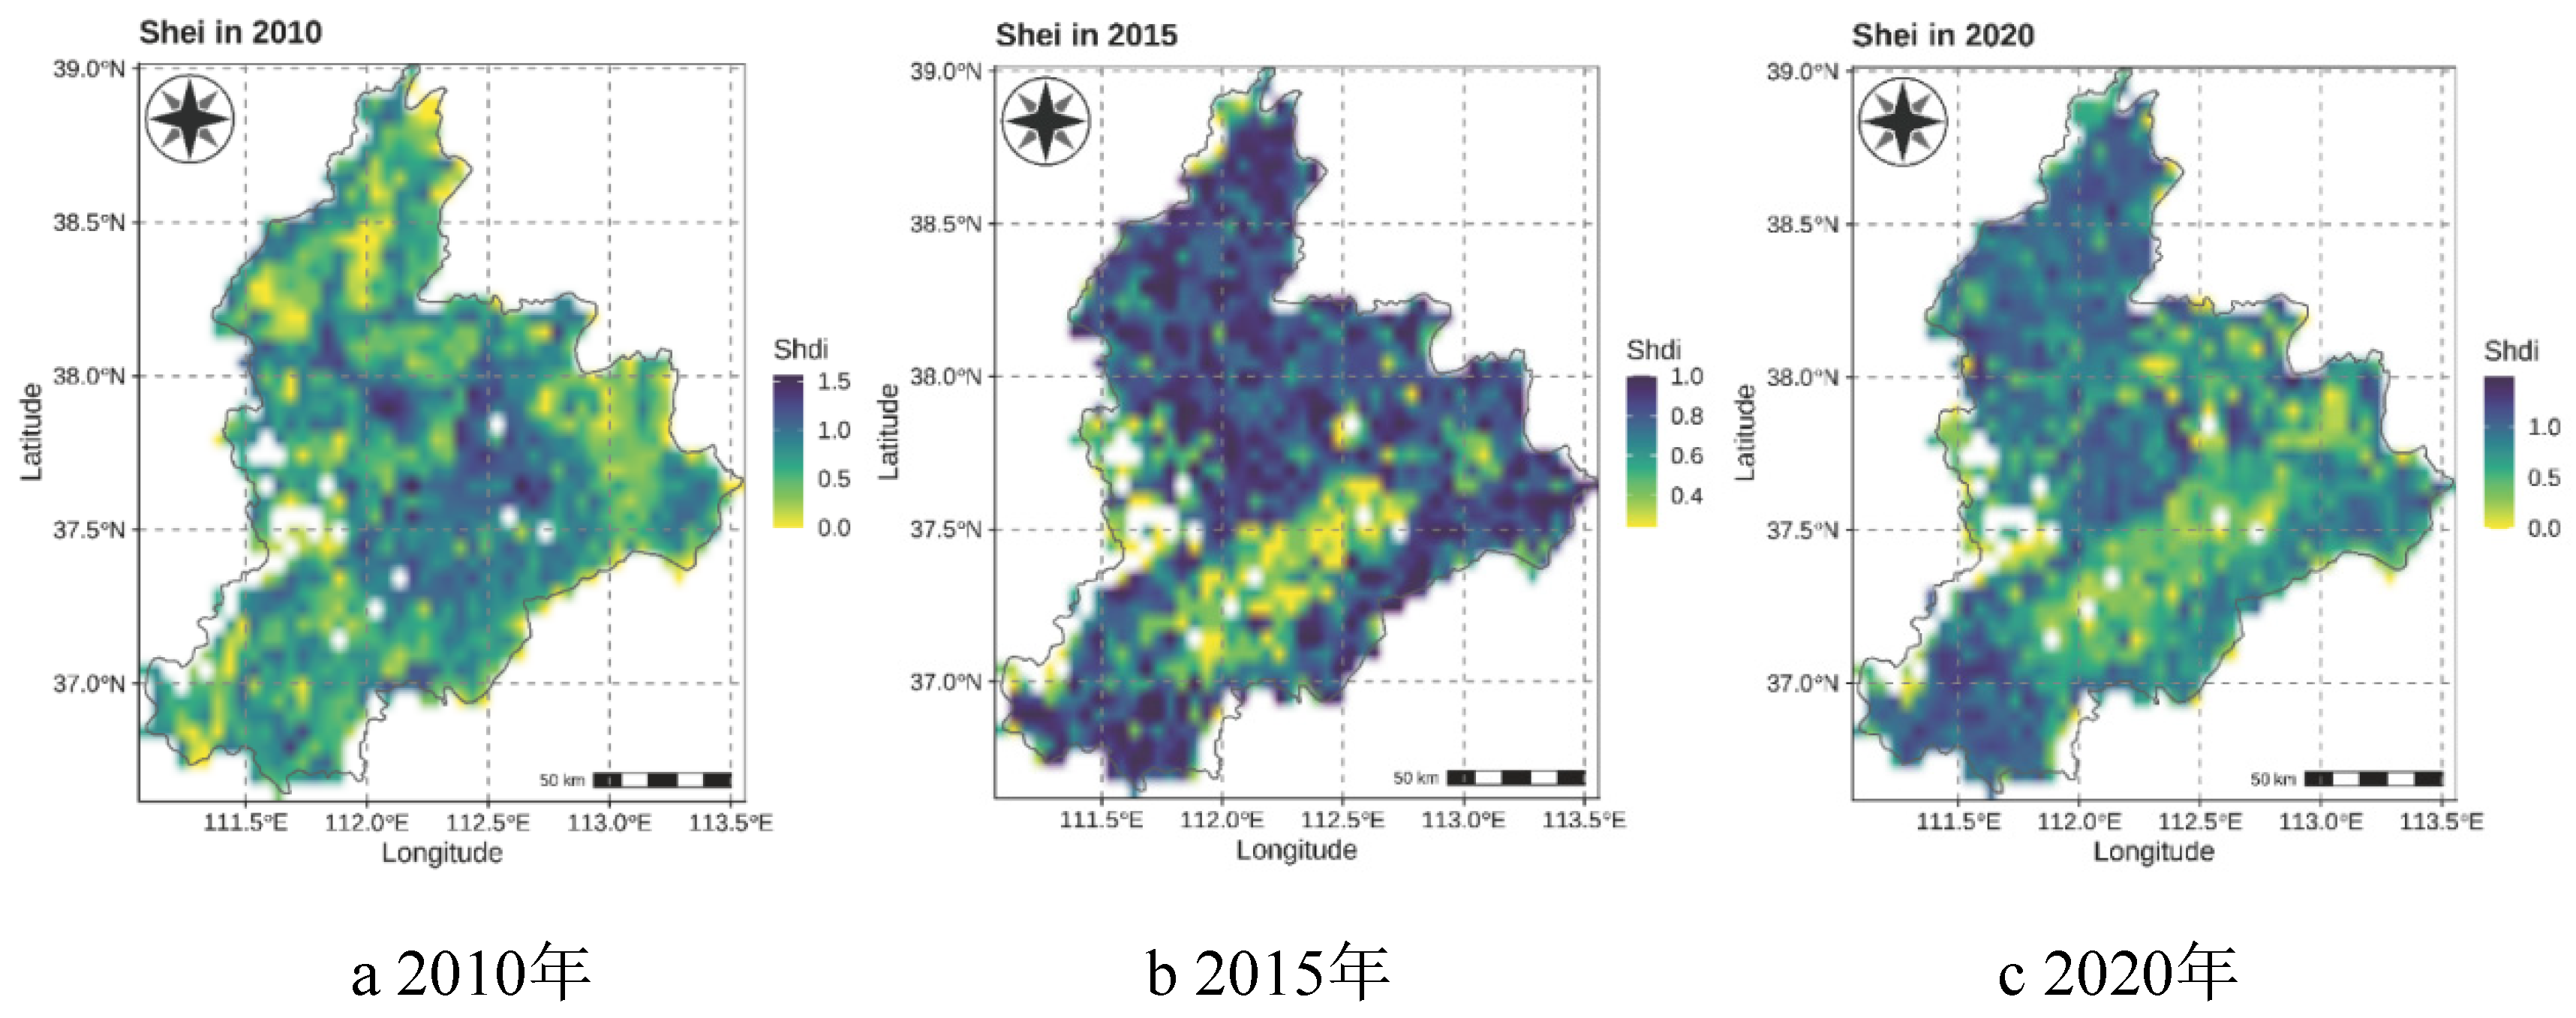
In the year 2010, the Land Use and Land Cover (LUCC) landscape in the upper and middle reaches of the Fen River Basin at a spatial resolution of 5 kilometers exhibited the SHEI as shown in
Figure 12a. In the high-altitude regions near the basin’s boundary, the SHEI values were below 1.0, and in areas close to the boundary, they were essentially around 0. These areas with relatively lower SHEI values were associated with the classification of land use types in their respective regions. This indicated the presence of dominant land cover types in these areas, leading to a lack of uniformity in land use types and a noticeable dominance of a specific type. In contrast, the SHEI values were higher in the low-altitude plain urban areas and regions with relatively frequent human activities. In these areas, the SHEI values were all above 1.0, and in urban areas, they could even exceed 1.5. This indicated a high degree of uniformity in LUCC in these regions, without any significant dominant land use types. Compared to the year 2010, areas with relatively higher Shannon Diversity Index (SHDI) values in 2015 exhibited a spatial trend radiating from urban clusters toward the surrounding areas, especially showing a northward shift, as depicted in
Figure 12b. In 2010, areas with low SHEI values, indicating relatively high human activity disturbance in urban areas, generally increased in 2015. This suggested a gradual homogenization of land use types in urban areas, with one dominant land cover type becoming prevalent. Furthermore, the SHEI values shifted significantly northward spatially, indicating that from 2010 to 2015, the originally relatively uniform land use types in the northern region gradually became more diverse. This could be related to frequent human activities and land use opening associated with economic and social development, overall increasing the uniformity of LUCC landscapes. In comparison to 2015, areas with relatively higher SHEI values in 2020 exhibited a spatial trend of clustering and shifting southward, as shown in
Figure 12c. This indicated an increase in LUCC landscape uniformity in these areas, closely related to the impact of human activity disturbance on LUCC. In 2015, areas with low SHEI values, indicating relatively high human activity disturbance in urban areas, did not change significantly in 2020. This suggested a continuation of land use type homogenization and poor uniformity in urban areas. However, the SHEI values shifted southward spatially, indicating that from 2015 to 2020, the originally relatively diverse land cover in the southern region gradually became more uniform with decreasing uniformity. In summary, the spatial distribution of the SHEI for LUCC landscapes in the Fenhe River Basin showed relatively higher values in the northern and southern regions, while the central region had lower SHEI values, indicating poor uniformity in LUCC landscapes. This observed non-uniformity was largely influenced by urbanization processes and human activities.
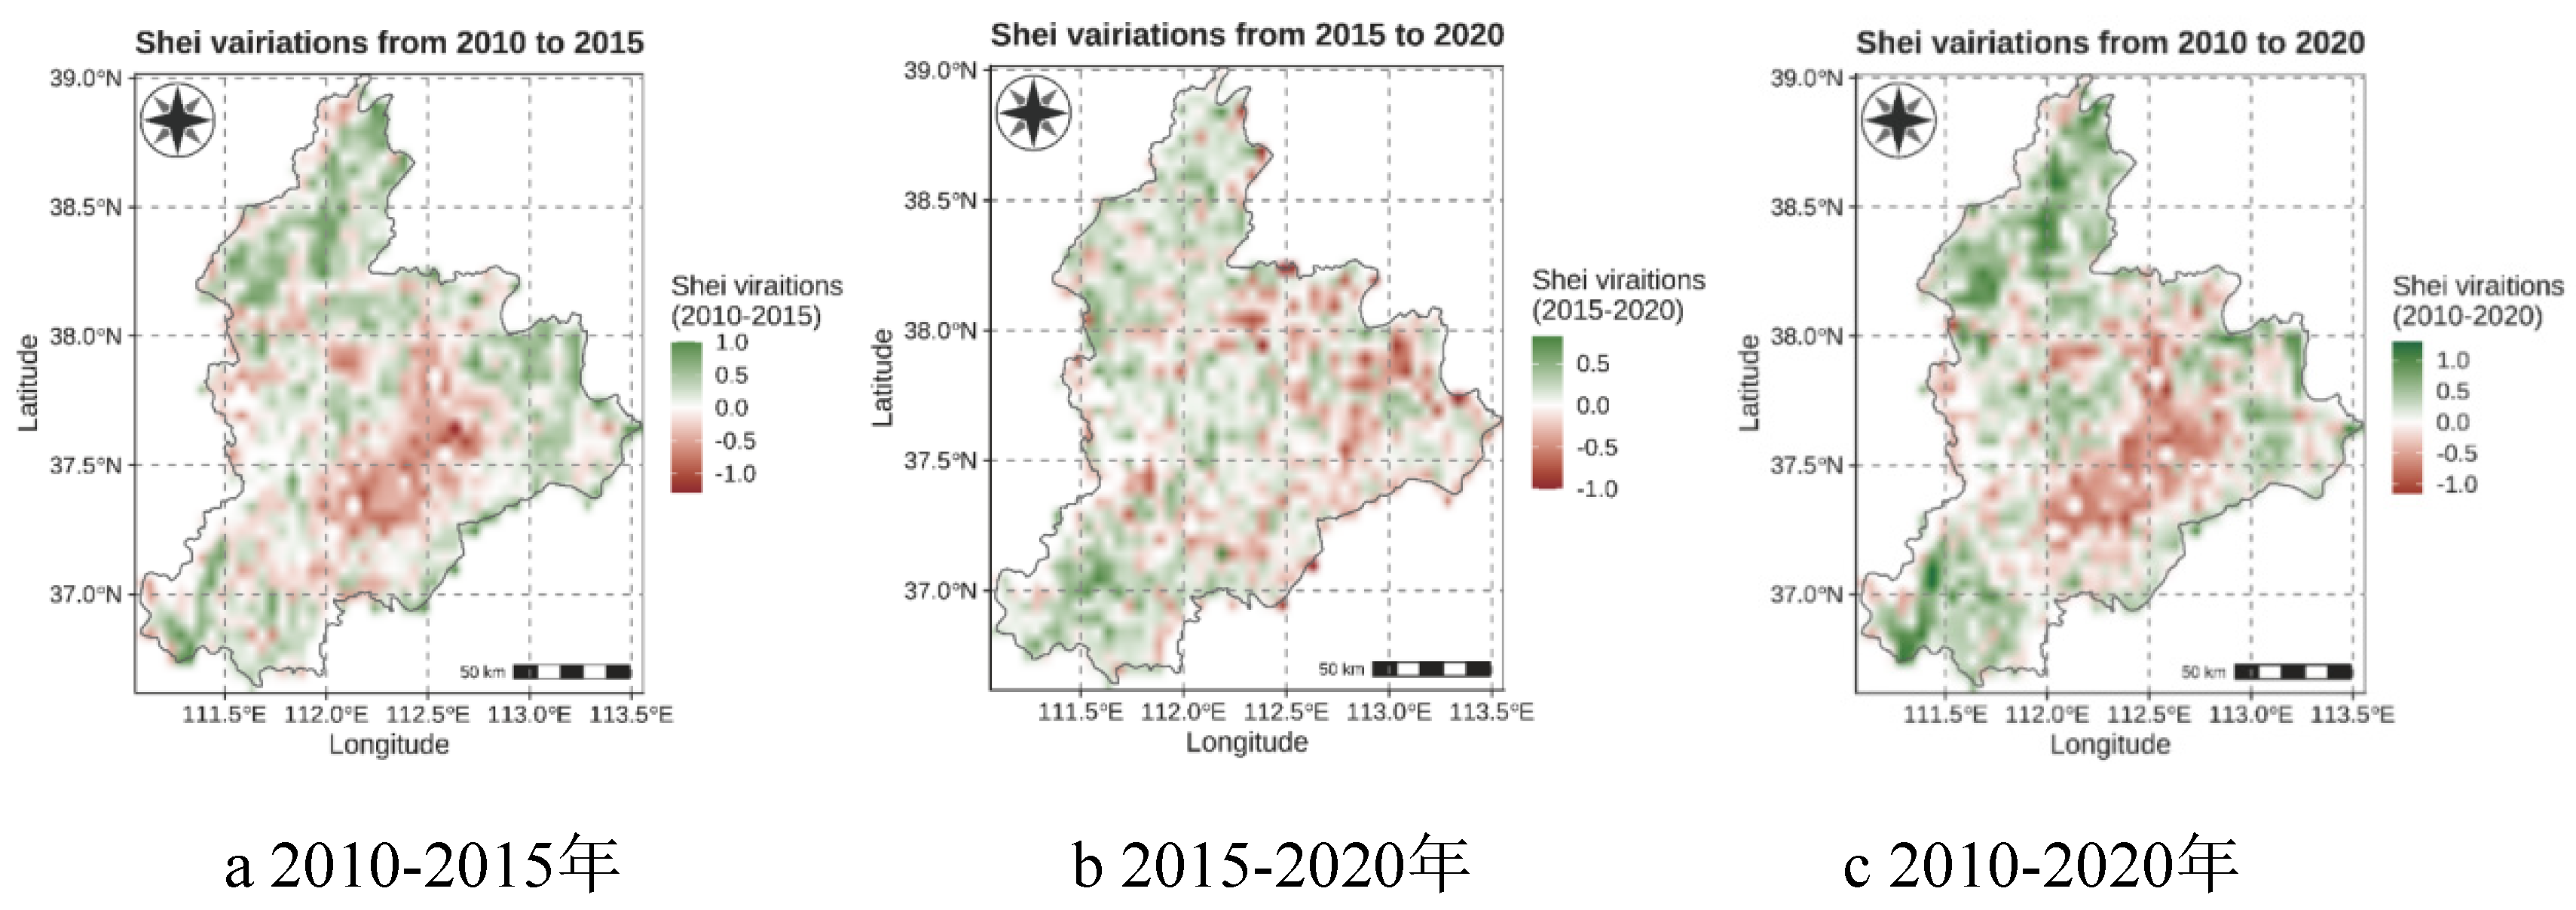
During 2010-2015, the spatial pattern of SHEI changes is presented in
Figure 13a. The results showed that the increased SHEI regions mainly distributed in the northern and southern regions, where LUCC changed significantly. The increased landscape diversity and SHEI showed no obvious LUCC occurred. The negative SHEI changes in the boundary and central urban areas suggested a more uniform and less diverse landscape, likely related to the homogenization of land use types in these urbanized regions. Therefore, during 2010-2015, the spatial distribution of SHEI in LUCC landscapes showed higher values in the northern parts and lower values in the southern parts, with significant influences from urbanization and human activities on LUCC landscapes. During 2015-2020, the regions with reduced SHEI covered almost the entire basin (
Figure 13b). This suggests that the impacts of human activities on LUCC types have intensified over the past five years, resulting in landscape changes occurring more frequently. Only a small area in the southern region saw a slight increase in landscape uniformity, indicating an increase in land use type diversity. However, a significant decrease in SHEI was observed in the eastern region, indicating that human activities have gradually extended in this direction. From 2010 to 2020, the spatial change in SHEI exhibited heterogeneous features (
Figure 13c). The regions with significantly decreased landscape uniformity were mainly located in the central urban clusters, where human activities were most intense and frequent. The decrease in landscape uniformity was also pronounced in the eastern region. On the other hand, small areas in both the northern and southern parts of the basin saw a slight increase in landscape uniformity, corresponding to increased land use type diversity. The significant decrease in SHEI in the eastern region indicated the eastward extension of human activities. Overall, during 2010-2020, the spatial changes in SHEI reflected a decrease in landscape uniformity, with urbanization at its core and radiating towards the periphery, resulting in a more uniform and less diverse LUCC landscape. This reveals a significant influence of human activities on LUCC landscapes.
4. Discussion
The changes in ecological patterns are complex and occur over a long-term dynamic process, influenced by both natural and human influence factors. Natural factors determine the fundamental structure of regional ecosystem patterns and exert long-term effects on landscape pattern changes. Human activities can drive rapid changes in regional ecosystem patterns over short periods [
43,
44,
45]. The NDVI changes in the study area from 2010 to 2020 exhibited a clear increasing trend. In different regions within the basin, high-altitude mountain areas showed a notable increase in NDVI, possibly due to limited human activity and the suitability for afforestation, resulting in an increase in forest area. In low-altitude urban clusters, NDVI remained relatively unchanged, primarily due to the high level of urbanization and developed agricultural activities in these areas, which encroached on substantial forest and grassland areas [
46]. The seasonal trend of vegetation NDVI growth intensity in the Fenhe River Basin over the past 11 years followed the order of summer > autumn > spring > winter, in accordance with vegetation phenology. Additionally, the basin’s favorable water and thermal conditions during summer facilitated rapid vegetation recovery and growth, while the lowest vegetation survival rates in winter influenced NDVI changes.
The three-period LUCC data from 2010 to 2020 revealed that forest dominated in high-altitude mountain areas, while cropland prevailed in low-altitude regions. The most prominent change occurred between 2015 and 2020, where previously unused land converted into water bodies or wetlands, and the extent of water bodies and wetlands decreased. This suggests that ecological restoration or construction achieved certain results during this period. Considering the context of basin governance, before 2015, the basin’s governance primarily focused on small-scale interventions, mainly involving coal mine closures, relocation of polluting enterprises, and vegetation construction in the main stream. These interventions were not part of large-scale land improvement projects, resulting in relatively weak drivers for land use changes. Since 2015, Shanxi Province government successively introduced projects such as the “Fenhe River Basin Ecological Restoration Plan (2015-2030)” and the “Overall Plan for Ecological Protection and Restoration of the ‘Seven Rivers,’ with a Focus on the Fen River.” These projects increased the comprehensive regulation and ecological restoration efforts in the basin’s land and space, intensifying the impact of human activities on undeveloped land, and contributing to the increase in water bodies and wetlands, with the proportion of maintaining the original types reaching 16.33%, compared to 2.2% in the 13th Five-Year Plan period. This indicates a significant improvement in ecological restoration and protection. Additionally, to promote the basin’s sustainable development, the government has strengthened the construction of wetlands, protective forest belts, and landscape parks, implemented the Wanjiazhai Yellow River Diversion Project to divert water to the Fenhe River Basin, alleviated water demand pressure in the basin, and ensured a balance between resource development and ecological restoration.
During the period from 2010 to 2020, the spatially decreased Landscape Spatial Diversity Index (SHDI) and Landscape Spatial Evenness Index (SHEI) were primarily associated with urbanization at their core, radiating outwards, resulting in a more uniform and less diverse land use pattern. This indicates a significant impact of human activities on LUCC landscapes. Although government policies such as “Grain-to-Green,” “Forest Closures,” and “Afforestation” have had positive effects on ecological restoration, disturbances caused by urbanization and agricultural development still persist, and there is a trend of expansion towards the eastern region of the study area. Therefore, there is a need to enhance the maintenance and improvement of natural ecosystem connectivity, continue strengthening the protection and construction of the basin’s ecological environment during the urbanization process, establish timely ecological compensation mechanisms, and minimize the impact of human activities on the basin’s ecosystem.
5. Conclusion
From 2010 to 2020, there was an increase in vegetation cover in the upper and middle reaches of the Fenhe River Basin, with an annual NDVI increment of 0.003 (P<0.001). Spatially, there was a trend of increased NDVI, indicating an overall increase in vegetation cover. Areas with decreased vegetation were primarily observed in low-altitude rapidly urbanizing regions. Vegetation changes in high-altitude mountain areas were highly significant and statistically significant. The vegetation cover in these areas mainly consisted of forests or grasslands, while areas with no significant changes were concentrated in low-altitude urban clusters.
The land use data from 2010 to 2020 indicated a significant decrease in water body or wetland areas. Conversion from water bodies or wetlands to other land types, mainly cropland and partially construction land, was prominent. The proportion of water bodies or wetlands maintained a very low level. The trend of water body or wetland area change relatively slowed down between 2015 and 2020, but the overall proportion continued to decrease. The area conversion from water bodies or wetlands to other land types decreased by over 14% from 2015 to 2020 compared to 2010-2015. This proportion increased by over 30% compared to the 13th Five-Year Plan period.
From 2010 to 2020, the spatial changes in Landscape Spatial Diversity Index (LUCC) and Landscape Spatial Evenness Index (LSEC) exhibited heterogeneous characteristics. Areas with significantly reduced LUCC diversity were mainly concentrated in the central part of the basin, where urban clusters or areas with intensive human activities were present. The reduction in diversity was also prominent in the eastern part of the basin. Human activities, centered around urbanization processes, radiated outward, impacting the surrounding land use cover types, leading to a trend of uniformity and decreased diversity in land use cover types. The spatial changes in LUCC landscapes highlighted the significant impact of human activities on land cover patterns.
Author Contributions
Conceptualization, methodology, writing—original draft preparation, funding acquisition, Z.Y.; software, validation, formal analysis, data curation, writing—review and editing, funding acquisition, W.F. All authors have read and agreed to the published version of the manuscript.
Funding
This research was funded by the Key Research and Development Project of Shanxi Province (Nos. 201803D221002-4 and 201903D321069), and the Fund for Shanxi”Higher Education Teaching Reform and Innovation Project”(No.2022-31).
Data Availability Statement
Not applicable.
Acknowledgments
The authors are grateful to the editors and the anonymous reviewers for their insightful comments and helpful suggestions.
Conflicts of Interest
The authors declare no conflict of interest.
References
- Fu, B.; Wang, S.; Su, C. Forsius, M. Linking ecosystem processes and ecosystem services. Curr. Opin. Env. Sust. 2013, 5(1), 4-10. [CrossRef]
- Jiang, L.; Liu, Y.; Wu. S.; Yang, C. Analyzing ecological environment change and associated driving factors in China based on NDVI time series data. Ecol. Indic. 2021, 129: 107933. [CrossRef]
- Wang, S.; Cui, C.; Dai, Q. Contributions of Vegetation Greening and Climate Change to Evapotranspiration Trend after Large-Scale Vegetation Restoration on the Loess Plateau, China. Water. 2021, 13, 1755. [CrossRef]
- Duarte, G.T.; Santos, P.M.; Cornelissen, T.G.; Ribeiro, M.C.; Paglia, A.P. The effects of landscape patterns on ecosystem services: metaanalyses of landscape services. Landscape Ecol. 2018, 33, 1247–1257. [CrossRef]
- Joorabian Shooshtari, S.; Silva, T.; Raheli Namin, B.; Shayesteh, K. Land use and cover change assessment and dynamic spatial modeling in the Ghara-su Basin, Northeastern Iran. J Indian Soc Remote. 2020, 48:81–95. [CrossRef]
- Guo, L.H.; Zuo, L.Y.; Gao, J.B.; Jiang, Y.; Zhang, Y. L.; Ma, S.C.; Zou, Y.F.; Wu, S.H. Revealing the fingerprint of climate change in interannual NDVI variability among Biomes in Inner Mongolia, China. Remote Sens-Basel. 2020, 12(8): 1332. [CrossRef]
- Plakidas, K.; Schall, D.; Zdun, U. Evolution of the R software ecosystem: Metrics, relationships, and their impact on qualities. J Syst Software. 2017, 132: 119-146. [CrossRef]
- Hou, L.; Wu, F.; Xie, X. The spatial characteristics and relationships between landscape pattern and ecosystem service value along an urban-rural gradient in Xi’an city. China. Ecol. Indic. 2020, 108:105720. [CrossRef]
- Statuto, D.; Cillis, G.; Picuno, P. GIS-based analysis of temporal evolution of rural landscape: a case study in Southern Italy. Nat. Resour. Res.2019, 28:61–75. [CrossRef]
- Li, B.; Liang, Z.; Bao, Z.; Wang, J.; Hu, Y. Changes in streamflow and sediment for a planned large reservoir in the middle Yellow River. Land Degrad. Dev. 2019, 30: 878–893. [CrossRef]
- Li, K.; Liang, Z.; Yang, S.; Chen, Z.; Wang, H.; Lin, Z. Performance analyses of differential evolution algorithm based on dynamic fitness landscape. Int. J. Cogn. Ergon. 2019, 13, 36–61. [CrossRef]
- Seidl, N. P.; Golobic, M. Quantitative assessment of agricultural landscape heterogeneity. Ecol. Indic. 2020, 112, 106115. [CrossRef]
- Zhang, L.; Hou, G.; Li, F. Dynamics of landscape pattern and connectivity of wetlands in Western Jilin Province, China. Environ Dev Sustain. 2020, 22, 2517–2528. [CrossRef]
- Baniya, B.; Tang, Q.; Huang, Z.; Sun, S.; Techato, K.-a. Spatial and Temporal Variation of NDVI in Response to Climate Change and the Implication for Carbon Dynamics in Nepal. Forests. 2018, 9, 329. [CrossRef]
- Cheng, Y.; Zhang, L.; Zhang, Z.; Li, X.; Wang, H.; Xi, X. Spatiotemporal variation and influence factors of vegetation cover in the Yellow River Basin (1982–2021) based on GIMMS NDVI and MOD13A1. Water. 2022, 14, 3274. [CrossRef]
- Li, P.; Wang, J.; Liu, M.M.; Xue, Z.H.;Bagherzadeh, A.; Liu, M.Y. Spatio-temporal variation characteristics of NDVI and its response to climate on the Loess Plateau from 1985 to 2015. CATENA. 2021, 203, 105331. [CrossRef]
- Guo, L.; Zuo, L.; Gao, J.; Jiang, Y.; Zhang, Y.; Ma, S.; Zou, Y.; Wu, S. Revealing the Fingerprint of Climate Change in Interannual NDVI Variability among Biomes in Inner Mongolia, China. Remote Sens. 2020, 12, 1332. [CrossRef]
- Khoshnood, S.; Lotfata, A.; Mombeni, M.; Daneshi, A.; Verrelst, J.; Ghorbani, K. A spatial and temporal correlation between remotely sensing evapotranspiration with land use and land cover. Water, 2023, 15, 1068. [CrossRef]
- Liu, W.; Zhan, J.Y.; Zhao, Fen.; Yan, H.M.; Zhang, F.; Wei, X.Q. Impacts of urbanization-induced land-use changes on ecosystem services: A case study of the Pearl River Delta Metropolitan Region, China. Ecol. Indic. 2020, 98, 228-238. [CrossRef]
- Fang, Z.; Ding, T.H.; Chen, J.Y.; Xue, S.; Zhou, Q.; Wang, Y.D.; Wang, Y.X.; Huang, Z.D.; Yang, S.L. Impacts of land use/land cover changes on ecosystem services in ecologically fragile regions. Sci. Total Environ. 2022, 831, 154967. [CrossRef]
- Li, Y.; Liu, W.; Feng, Q.; Zhu, M.; Yang, L.S.; Zhang, J. T.; Yin, X. W. The role of land use change in affecting ecosystem services and the ecological security pattern of the Hexi Regions, Northwest China. Sci. Total Environ. 2023 , 855: 158940. [CrossRef]
- Kindu, M.; Schneider, T.; Döllerer, M.; Teketay, D.; Knoke, T. Scenario modelling of land use/land cover changes in Munessa-Shashemene landscape of the Ethiopian highlands. Sci. Total Environ. 2018, 622, 534-546. [CrossRef]
- Chang, X.; Zhang, F.; Cong, K.; Liu, X.J. Scenario simulation of land use and land cover change in mining area. Sci. Rep. 2021, 11, 12910. [CrossRef]
- Lou, Y.; Yang, D.; Zhang, P.; Zhang, Y.; Song, M.; Huang, Y.; Jing, W. Multi-scenario simulation of land use changes with ecosystem service value in the Yellow River Basin. Land, 2022, 11, 992. [CrossRef]
- Cao, M.; Chang, L.;Ma, S.;Zhao, Z.; Wu, K.; Hu, X.; Gu, Q.; Lü, G.; Chen M. Multi-scenario simulation of land use for sustainable development goals. IEEE J-STARS. 2022, 15, 2119-2127. [CrossRef]
- Afuye, G.A.; Kalumba, A.M.; Orimoloye, I. R. Characterization of vegetation response to climate change: A Review. Sustainability, 2021,13(13): 7265-7287. [CrossRef]
- Wang, F.; Yuan, X.Z.; Xie, X.P. Dynamic change of land use/land cover patterns and driving factors of Nansihu Lake Basin in Shandong Province, China. Environ. Earth. Sci. 2021, 80:180. [CrossRef]
- Huang, F.; Chunyu, X.; Zhang, D.; Chen, X.; Ochoa, C. G. A framework to assess the impact of ecological water conveyance on groundwater-dependent terrestrial ecosystems in arid inland river basins. Sci. Total Environ. 2020, 709, 136155. [CrossRef]
- Zhang, X.; Wang, G.; Xue, B.; Zhang, M.; Tan, Z. Dynamic landscapes and the driving forces in the Yellow River Delta wetland region in the past four decades. Sci. Total Environ. 2021, 787, 147644. [CrossRef]
- Yu H, Chen C, Shao, C. Spatial and temporal changes in ecosystem service driven by ecological compensation in the Xin’an River Basin, China. Ecol. Indic. 2023,146, 109798. [CrossRef]
- De Alban, J.D.T.; Prescott, G.W.; Woods, K.M.; Jamaludin, J.; Latt, K.T.; Lim, C.L.; Maung, A.C.; Webb, E.L. Integrating Analytical Frameworks to Investigate Land-Cover Regime Shifts in Dynamic Landscapes. Sustainability. 2019, 11, 1139. [CrossRef]
- Xiong, Y.; Zhou, J.; Chen, L.; Jia, B.; Sun, N.; Tian, M.; Hu, G. Land use pattern and vegetation cover dynamics in the Three Gorges Reservoir (TGR) intervening basin. Water. 2020, 12, 2036. [CrossRef]
- Bufebo, B.; Elias, E. Land use/land cover change and its driving forces in Shenkolla watershed, south Central Ethiopia. The Scientific World Journal, 2021, 13. [CrossRef]
- Zhang, L.; Li, S.; Wu, Z.; Fan, X.; Li, H.; Meng, Q.; Wang, J. Variation in runoff, suspended sediment load, and their inter-relationships in response to climate change and anthropogenic activities over the last 60 years: A Case Study of the Upper Fenhe River Basin, China. Water, 2020, 12, 1757. [CrossRef]
- Zhao, Y.; Dang, J.; Wang, F. Sources of Nitrogen Pollution in Upstream of Fenhe River Reservoir Based on the Nitrogen and Oxygen Stable Isotope. Journal of Chemistry, 2020, 1-8. [CrossRef]
- Yu, H.; Chen, C.; Shao, C. F. Spatial and temporal changes in ecosystem service driven by ecological compensation in the Xin’an River Basin, China. Ecol. Indic. 2023, 146: 109798. [CrossRef]
- Shao, W.; Cai, J.; Liu, J.; Luan, Q.; Mao, X.; Yang, G.; Wang, J.; Zhang, H.; Zhang, J. Impact of Water Scarcity on the Fenhe River Basin and Mitigation Strategies. Water, 2017, 9, 30. [CrossRef]
- Su, S.; Xiao, R.; Li, D.; Hu, Y. Impacts of Transportation Routes on Landscape Diversity: A Comparison of Different Route Types and Their Combined Effects. Environ. Manage. 2014, 53, 636–647. [CrossRef]
- Iskin, E.P.; Wohl E. Quantifying floodplain heterogeneity with field observation, remote sensing, and landscape ecology: Methods and metrics. River Res. Appl. 2023, 39, 911-929. [CrossRef]
- Wang, P.; Li, R.; Liu, D.J.; Wu, Y. M. Dynamic characteristics and responses of ecosystem services under land use/land cover change scenarios in the Huangshui River Basin, China. Ecol. Indic. 2022, 144: 109539. [CrossRef]
- Younes, N.; Joyce, K. E.; Northfield, T. D.; Maier, S. W. The effects of water depth on estimating Fractional Vegetation Cover in mangrove forests. Int. J Appl. Earth Obs. 2019, 83, 101924. [CrossRef]
- Zhu, L.; Meng, J.; Zhu, L. Applying Geodetector to disentangle the contributions of natural and anthropogenic factors to NDVI variations in the middle reaches of the Heihe River Basin. Ecol. Indic. 2020, 117: 106545. [CrossRef]
- Liu, Y.; Tian, J.; Liu, R.; Ding, L. Influences of climate change and human activities on NDVI changes in China. Remote Sens-Basel. 2021, 13: 4326. [CrossRef]
- Gonçalves, R. M.; Saleem, A.; Queiroz, H. A.; Awange, J. L. A fuzzy model integrating shoreline changes, NDVI and settlement influences for coastal zone human impact classification. Appl. Geogr. 2019, 113: 102093. [CrossRef]
- Peng, W.; Kuang, T.; Tao, S. Quantifying influences of natural factors on vegetation NDVI changes based on geographical detector in Sichuan, western China. J Clean Prod. 2019, 233, 353-367. [CrossRef]
- Jia, L.; Li, Z. B.; Xu, G. C.; Ren, Z. P.; Li, P.; Cheng, Y. T.; Zhang, Y. X.; Wang, B.; Zhang, J. X.; Yu, S. Dynamic change of vegetation and its response to climate and topographic factors in the Xijiang River basin, China. Environ. Sci. Pollut. R. 2020, 27, 11637-11648. [CrossRef]
|
Disclaimer/Publisher’s Note: The statements, opinions and data contained in all publications are solely those of the individual author(s) and contributor(s) and not of MDPI and/or the editor(s). MDPI and/or the editor(s) disclaim responsibility for any injury to people or property resulting from any ideas, methods, instructions or products referred to in the content. |
© 2023 by the authors. Licensee MDPI, Basel, Switzerland. This article is an open access article distributed under the terms and conditions of the Creative Commons Attribution (CC BY) license (http://creativecommons.org/licenses/by/4.0/).
