Submitted:
07 September 2023
Posted:
11 September 2023
You are already at the latest version
Abstract
Keywords:
1. Introduction
2. Materials and methods
2.1 Animals, sample collection and phenotype measurement
2.2 Sample selection
2.3 RNA extraction, library construction, and sequencing
2.4 Identification of DEGs
2.5 Functional annotation and enrichment analysis
2.6 WGCNA
2.7 Identification of candidate and hub genes related to IFC and a* value
3. Results
3.1 Phenotypes and sequencing data
3.2 DEGs
3.3 Functional enrichment analysis
3.4 Co-expressed gene modules associated with IFC and a* value
3.5 Functional enrichment analysis for the four key modules
3.6 Identification of candidate genes related to IFC and a* value
3.7 Hub genes
4. Discussion
5. Conclusions
Supplementary Materials
Author Contributions
Funding
Institutional Review Board Statement
Informed Consent Statement
Data Availability Statement
Conflicts of Interest
References
- Duan, S.; Tang, X.; Li, W.; Huang, X. Analysis of the Differences in Volatile Organic Compounds in Different Muscles of Pork by GC-IMS. Molecules 2023, 28, 1726. [Google Scholar] [CrossRef] [PubMed]
- Moeller, S.J.; Miller, R.K.; Edwards, K.K.; Zerby, H.N.; Logan, K.E.; Aldredge, T.L.; Stahl, C.A.; Boggess, M.; Box-Steffensmeier, J.M. Consumer Perceptions of Pork Eating Quality as Affected by Pork Quality Attributes and End-Point Cooked Temperature. Meat Sci. 2010, 84, 14–22. [Google Scholar] [CrossRef] [PubMed]
- Liu, S.; Huang, J.; Wang, X.; Ma, Y. Transcription Factors Regulate Adipocyte Differentiation in Beef Cattle. Anim. Genet. 2020, 51, 351–357. [Google Scholar] [CrossRef]
- Sun, X.; Young, J.; Liu, J.H.; Bachmeier, L.; Somers, R.M.; Chen, K.J.; Newman, D. Prediction of Pork Color Attributes Using Computer Vision System. Meat Sci. 2016, 113, 62–64. [Google Scholar] [CrossRef] [PubMed]
- Wang, B.; Li, P.; Hou, L.; Zhou, W.; Tao, W.; Liu, C.; Liu, K.; Niu, P.; Zhang, Z.; Li, Q.; et al. Genome-Wide Association Study and Genomic Prediction for Intramuscular Fat Content in Suhuai Pigs Using Imputed Whole-Genome Sequencing Data. Evol. Appl. 2022, 15, 2054–2066. [Google Scholar] [CrossRef] [PubMed]
- Cabling, M.M.; Kang, H.S.; Lopez, B.M.; Jang, M.; Kim, H.S.; Nam, K.C.; Choi, J.G.; Seo, K.S. Estimation of Genetic Associations between Production and Meat Quality Traits in Duroc Pigs. Asian-Australasian J. Anim. Sci. 2015, 28, 1061–1065. [Google Scholar] [CrossRef] [PubMed]
- Shi-Zheng, G.; Su-Mei, Z. Physiology, Affecting Factors and Strategies for Control of Pig Meat Intramuscular Fat. Recent Pat. Food. Nutr. Agric. 2009, 1, 59–74. [Google Scholar] [CrossRef]
- Fernandez, X.; Monin, G.; Talmant, A.; Mourot, J.; Lebret, B. Influence of Intramuscular Fat Content on the Quality of Pig Meat — 1 Composition of the Lipid Fraction and Sensory Characteristics of m Longissimus Lumborum. Meat Sci. 1999, 53, 59–65. [Google Scholar] [CrossRef]
- Kim, G.-D.; Jeong, J.-Y.; Hur, S.-J.; Yang, H.-S.; Jeon, J.-T.; Joo, S.-T. The Relationship between Meat Color (CIE L* and A*), Myoglobin Content, and Their Influence on Muscle Fiber Characteristics and Pork Quality. Food Sci. Anim. Resour. 2010, 30, 626–633. [Google Scholar] [CrossRef]
- Mortimer, S.I.; van der Werf, J.H.J.; Jacob, R.H.; Hopkins, D.L.; Pannier, L.; Pearce, K.L.; Gardner, G.E.; Warner, R.D.; Geesink, G.H.; Hocking Edwards, J.E.; et al. Genetic Parameters for Meat Quality Traits of Australian Lamb Meat. Meat Sci. 2014, 96, 1016–1024. [Google Scholar] [CrossRef]
- Zhang, X.; Liu, C.; Kong, Y.; Li, F.; Yue, X. Effects of Intramuscular Fat on Meat Quality and Its Regulation Mechanism in Tan Sheep. Front. Nutr. 2022, 9, 1–13. [Google Scholar] [CrossRef] [PubMed]
- Cardoso, T.F.; Cánovas, A.; Canela-Xandri, O.; González-Prendes, R.; Amills, M.; Quintanilla, R. RNA-Seq Based Detection of Differentially Expressed Genes in the Skeletal Muscle of Duroc Pigs with Distinct Lipid Profiles. Sci. Rep. 2017, 7, 40005. [Google Scholar] [CrossRef] [PubMed]
- Xing, K.; Liu, H.; Zhang, F.; Liu, Y.; Shi, Y.; Ding, X.; Wang, C. Identification of Key Genes Affecting Porcine Fat Deposition Based on Co-Expression Network Analysis of Weighted Genes. J. Anim. Sci. Biotechnol. 2021, 12, 1–16. [Google Scholar] [CrossRef]
- Fernández-Barroso, M.Á.; García-Casco, J.M.; Núñez, Y.; Ramírez-Hidalgo, L.; Matos, G.; Muñoz, M. Understanding the Role of Myoglobin Content in Iberian Pigs Fattened in an Extensive System through Analysis of the Transcriptome Profile. Anim. Genet. 2022, 53, 352–367. [Google Scholar] [CrossRef] [PubMed]
- Xing, K.; Liu, H.; Zhang, F.; Liu, Y.; Shi, Y.; Ding, X.; Wang, C. Identification of Key Genes Affecting Porcine Fat Deposition Based on Co-Expression Network Analysis of Weighted Genes. J. Anim. Sci. Biotechnol. 2021, 12, 100. [Google Scholar] [CrossRef] [PubMed]
- Barabasi, A.-L.; Oltvai, Z.N. Network Biology: Understanding the Cell’s Functional Organization. Nat. Rev. Genet. 2004, 5, 101–113. [Google Scholar] [CrossRef]
- Talukdar, H.A.; Asl, H.F.; Jain, R.K.; Ermel, R.; Ruusalepp, A.; Franzén, O.; Kidd, B.A.; Readhead, B.; Giannarelli, C.; Kovacic, J.C. Cross-Tissue Regulatory Gene Networks in Coronary Artery Disease. Cell Syst. 2016, 2, 196–208. [Google Scholar] [CrossRef]
- Zhang, B.; Horvath, S. A General Framework for Weighted Gene Co-Expression Network Analysis. Stat. Appl. Genet. Mol. Biol. 2005, 4. [Google Scholar] [CrossRef]
- Zhao, X.; Wang, C.; Wang, Y.; Zhou, L.; Hu, H.; Bai, L.; Wang, J. Weighted Gene Co-Expression Network Analysis Reveals Potential Candidate Genes Affecting Drip Loss in Pork. Anim. Genet. 2020, 51, 855–865. [Google Scholar] [CrossRef]
- Wu, Z.; Gao, Z.; Liang, H.; Fang, T.; Wang, Y.; Du, Z.; Yang, C. Network Analysis Reveals Different Hub Genes and Molecular Pathways for Pig in Vitro Fertilized Early Embryos and Parthenogenotes. Reprod. Domest. Anim. 2022, 57, 1544–1553. [Google Scholar] [CrossRef]
- Supakankul, P.; Mekchay, S. Association of NLK Polymorphisms with Intramuscular Fat Content and Fatty Acid Composition Traits in Pigs. Meat Sci. 2016, 118, 61–65. [Google Scholar] [CrossRef] [PubMed]
- Bolger, A.M.; Lohse, M.; Usadel, B. Trimmomatic: A Flexible Trimmer for Illumina Sequence Data. Bioinformatics 2014, 30, 2114–2120. [Google Scholar] [CrossRef] [PubMed]
- Dobin, A.; Davis, C.A.; Schlesinger, F.; Drenkow, J.; Zaleski, C.; Jha, S.; Batut, P.; Chaisson, M.; Gingeras, T.R. STAR: Ultrafast Universal RNA-Seq Aligner. Bioinformatics 2013, 29, 15–21. [Google Scholar] [CrossRef] [PubMed]
- Liao, Y.; Smyth, G.K.; Shi, W. FeatureCounts: An Efficient General Purpose Program for Assigning Sequence Reads to Genomic Features. Bioinformatics 2014, 30, 923–930. [Google Scholar] [CrossRef] [PubMed]
- Love, M.I.; Huber, W.; Anders, S. Moderated Estimation of Fold Change and Dispersion for RNA-Seq Data with DESeq2. Genome Biol. 2014, 15, 550. [Google Scholar] [CrossRef] [PubMed]
- Ritchie, M.E.; Phipson, B.; Wu, D.I.; Hu, Y.; Law, C.W.; Shi, W.; Smyth, G.K. Limma Powers Differential Expression Analyses for RNA-Sequencing and Microarray Studies. Nucleic Acids Res. 2015, 43, 4. [Google Scholar] [CrossRef]
- Robinson, M.D.; McCarthy, D.J.; Smyth, G.K. EdgeR: A Bioconductor Package for Differential Expression Analysis of Digital Gene Expression Data. Bioinformatics 2010, 26, 139–140. [Google Scholar] [CrossRef]
- Haider, S.; Ballester, B.; Smedley, D.; Zhang, J.; Rice, P.; Kasprzyk, A. BioMart Central Portal—Unified Access to Biological Data. Nucleic Acids Res. 2009, 37, 23–27. [Google Scholar] [CrossRef]
- Wu, T.; Hu, E.; Xu, S.; Chen, M.; Guo, P.; Dai, Z.; Feng, T.; Zhou, L.; Tang, W.; Zhan, L. ClusterProfiler 40: A Universal Enrichment Tool for Interpreting Omics Data. Innov. 2021, 2, 100141. [Google Scholar] [CrossRef]
- Langfelder, P.; Horvath, S. WGCNA: An R Package for Weighted Correlation Network Analysis. BMC Bioinformatics 2008, 9, 559. [Google Scholar] [CrossRef]
- Szklarczyk, D.; Franceschini, A.; Wyder, S.; Forslund, K.; Heller, D.; Huerta-Cepas, J.; Simonovic, M.; Roth, A.; Santos, A.; Tsafou, K.P.; et al. STRING V10: Protein–Protein Interaction Networks, Integrated over the Tree of Life. Nucleic Acids Res. 2015, 43, 447–452. [Google Scholar] [CrossRef] [PubMed]
- Shannon, P.; Markiel, A.; Ozier, O.; Baliga, N.S.; Wang, J.T.; Ramage, D.; Amin, N.; Schwikowski, B.; Ideker, T. Cytoscape: A Software Environment for Integrated Models of Biomolecular Interaction Networks. Genome Res. 2003, 13, 2498–2504. [Google Scholar] [CrossRef] [PubMed]
- Chen, W.; Zeng, Q.; Xu, H.; Fang, G.; Wang, S.; Li, C.; Wang, Y.; Wang, H.; Zeng, Y. Comparison and Relationship between Meat Colour and Antioxidant Capacity of Different Pig Breeds. Anim. Prod. Sci. 2018, 58, 2152–2157. [Google Scholar] [CrossRef]
- Wang, H.; Wang, J.; Yang, D.; Liu, Z.; Zeng, Y.; Chen, W. Expression of Lipid Metabolism Genes Provides New Insights into Intramuscular Fat Deposition in Laiwu Pigs. Asian-Australasian J. Anim. Sci. 2020, 33, 390–397. [Google Scholar] [CrossRef] [PubMed]
- Liu, S.; Wang, Z.; Zhu, R.; Wang, F.; Cheng, Y.; Liu, Y. Three Differential Expression Analysis Methods for RNA Sequencing: Limma, EdgeR, DESeq2. JoVE Journal Vis. Exp. 2021, e62528. [Google Scholar] [CrossRef]
- Subramanian, A.; Tamayo, P.; Mootha, V.K.; Mukherjee, S.; Ebert, B.L.; Gillette, M.A.; Paulovich, A.; Pomeroy, S.L.; Golub, T.R.; Lander, E.S. Gene Set Enrichment Analysis: A Knowledge-Based Approach for Interpreting Genome-Wide Expression Profiles. Proc. Natl. Acad. Sci. 2005, 102, 15545–15550. [Google Scholar] [CrossRef] [PubMed]
- Liu, Y.; Long, H.; Feng, S.; Ma, T.; Wang, M.; Niu, L.; Zhang, X.; Wang, L.; Lei, Y.; Chen, Y.; et al. Trait Correlated Expression Combined with EQTL and ASE Analyses Identified Novel Candidate Genes Affecting Intramuscular Fat. BMC Genomics 2021, 22, 805. [Google Scholar] [CrossRef]
- Kim, S.-M.; Markkandan, K.; Lee, J.-Y.; Kim, G.-W.; Yoo, J.Y. Transcriptome Profiling Associated with Carcass Quality of Loin Muscles in Crossbred Pigs. Animals 2020, 10. [Google Scholar] [CrossRef]
- Gong, Y.; He, J.; Li, B.; Xiao, Y.; Zeng, Q.; Xu, K.; Duan, Y.; He, J.; Ma, H. Integrated Analysis of Lncrna and Mrna in Subcutaneous Adipose Tissue of Ningxiang Pig. Biology (Basel). 2021, 10, 1–22. [Google Scholar] [CrossRef]
- Liu, X.; Zhang, J.; Xiong, X.; Chen, C.; Xing, Y.; Duan, Y.; Xiao, S.; Yang, B.; Ma, J. An Integrative Analysis of Transcriptome and GWAS Data to Identify Potential Candidate Genes Influencing Meat Quality Traits in Pigs. Front. Genet. 2021, 12, 1–13. [Google Scholar] [CrossRef]
- Wang, H.; Wang, X.; Li, M.; Wang, S.; Chen, Q.; Lu, S. Identification of Key Sex-Specific Pathways and Genes in the Subcutaneous Adipose Tissue from Pigs Using WGCNA Method. BMC Genomic Data 2022, 23, 1–13. [Google Scholar] [CrossRef] [PubMed]
- Zhang, P.; Li, Q.; Wu, Y.; Zhang, Y.; Zhang, B.; Zhang, H. Identification of Candidate Genes That Specifically Regulate Subcutaneous and Intramuscular Fat Deposition Using Transcriptomic and Proteomic Profiles in Dingyuan Pigs. Sci. Rep. 2022, 12, 1–13. [Google Scholar] [CrossRef] [PubMed]
- Zappaterra, M.; Gioiosa, S.; Chillemi, G.; Zambonelli, P.; Davoli, R. Muscle Transcriptome Analysis Identifies Genes Involved in Ciliogenesis and the Molecular Cascade Associated with Intramuscular Fat Content in Large White Heavy Pigs. PLoS One 2020, 15, 1–29. [Google Scholar] [CrossRef] [PubMed]
- Liu, X.; Zhou, L.; Xie, X.; Wu, Z.; Xiong, X.; Zhang, Z.; Yang, J.; Xiao, S.; Zhou, M.; Ma, J.; et al. Muscle Glycogen Level and Occurrence of Acid Meat in Commercial Hybrid Pigs Are Regulated by Two Low-Frequency Causal Variants with Large Effects and Multiple Common Variants with Small Effects. Genet. Sel. Evol. 2019, 51, 1–16. [Google Scholar] [CrossRef] [PubMed]
- Freitas, A.A. Investigating the Role of Simpson’s Paradox in the Analysis of Top-Ranked Features in High-Dimensional Bioinformatics Datasets. Brief. Bioinform. 2020, 21, 421–428. [Google Scholar] [CrossRef]
- Lee, S.; Dong, H.H. FoxO Integration of Insulin Signaling with Glucose and Lipid Metabolism. J. Endocrinol. 2017, 233, 67–79. [Google Scholar] [CrossRef]
- Chen, S.; Lu, Z.; Jia, H.; Yang, B.; Liu, C.; Yang, Y.; Zhang, S.; Wang, Z.; Yang, L.; Li, S.; et al. Hepatocyte-Specific Mas Activation Enhances Lipophagy and Fatty Acid Oxidation to Protect against Acetaminophen-Induced Hepatotoxicity in Mice. J. Hepatol. 2023, 78, 543–557. [Google Scholar] [CrossRef]
- Egan, B.; Zierath, J.R. Exercise Metabolism and the Molecular Regulation of Skeletal Muscle Adaptation. Cell Metab. 2013, 17, 162–184. [Google Scholar] [CrossRef]
- Gu, H.; Li, J.; Ying, F.; Zuo, B.; Xu, Z. Analysis of Differential Gene Expression of the Transgenic Pig with Overexpression of PGC1α in Muscle. Mol. Biol. Rep. 2019, 46, 3427–3435. [Google Scholar] [CrossRef]
- Jorge, M.L.M.P.; de Oliveira, V.N.; Resende, N.M.; Paraiso, L.F.; Calixto, A.; Diniz, A.L.D.; Resende, E.S.; Ropelle, E.R.; Carvalheira, J.B.; Espindola, F.S.; et al. The Effects of Aerobic, Resistance, and Combined Exercise on Metabolic Control, Inflammatory Markers, Adipocytokines, and Muscle Insulin Signaling in Patients with Type 2 Diabetes Mellitus. Metabolism 2011, 60, 1244–1252. [Google Scholar] [CrossRef]
- Bost, F.; Aouadi, M.; Caron, L.; Even, P.; Belmonte, N.; Prot, M.; Dani, C.; Hofman, P.; Pagès, G.; Pouysségur, J.; et al. The Extracellular Signal–Regulated Kinase Isoform ERK1 Is Specifically Required for In Vitro and In Vivo Adipogenesis. Diabetes 2005, 54, 402–411. [Google Scholar] [CrossRef] [PubMed]
- Zhang, Q.; Sun, X.; Xiao, X.; Zheng, J.; Li, M.; Yu, M.; Ping, F.; Wang, Z.; Qi, C.; Wang, T.; et al. Effects of Maternal Chromium Restriction on the Long-Term Programming in MAPK Signaling Pathway of Lipid Metabolism in Mice. Nutrients 2016, 8. [Google Scholar] [CrossRef] [PubMed]
- Xu, L.; Zhang, H.; Yue, H.; Wu, S.; Yang, H.; Wang, Z.; Qi, G. Gas Stunning with CO2 Affected Meat Color, Lipid Peroxidation, Oxidative Stress, and Gene Expression of Mitogen-Activated Protein Kinases, Glutathione S-Transferases, and Cu/Zn-Superoxide Dismutase in the Skeletal Muscles of Broilers. J. Anim. Sci. Biotechnol. 2018, 9, 37. [Google Scholar] [CrossRef] [PubMed]
- Zhang, W.; Han, B.; Zhang, H.; Fu, R.; Lu, Y.; Zhang, G. Integrated Transcriptomic and Metabolomic Analysis of Cortical Neurons Reveals Dysregulated Lipid Metabolism, Enhanced Glycolysis and Activated HIF-1 Signaling Pathways in Acute Hypoxia. Heliyon 2023, 9, e14949. [Google Scholar] [CrossRef]
- Elkholi, I.E.; Elsherbiny, M.E.; Emara, M. Myoglobin: From Physiological Roles to Potential Implications in Cancer. Biochim. Biophys. Acta - Rev. Cancer 2022, 1877, 188706. [Google Scholar] [CrossRef]
- Gold, E.S.; Ramsey, S.A.; Sartain, M.J.; Selinummi, J.; Podolsky, I.; Rodriguez, D.J.; Moritz, R.L.; Aderem, A. ATF3 Protects against Atherosclerosis by Suppressing 25-Hydroxycholesterol–Induced Lipid Body Formation. J. Exp. Med. 2012, 209, 807–817. [Google Scholar] [CrossRef]
- Heinonen, S.E.; Kivelä, A.M.; Huusko, J.; Dijkstra, M.H.; Gurzeler, E.; Mäkinen, P.I.; Leppänen, P.; Olkkonen, V.M.; Eriksson, U.; Jauhiainen, M.; et al. The Effects of VEGF-A on Atherosclerosis, Lipoprotein Profile, and Lipoprotein Lipase in Hyperlipidaemic Mouse Models. Cardiovasc. Res. 2013, 99, 716–723. [Google Scholar] [CrossRef]
- Stathopoulou, M.G.; Bonnefond, A.; Ndiaye, N.C.; Azimi-Nezhad, M.; El Shamieh, S.; Saleh, A.; Rancier, M.; Siest, G.; Lamont, J.; Fitzgerald, P. A Common Variant Highly Associated with Plasma VEGFA Levels Also Contributes to the Variation of Both LDL-C and HDL-C. J. Lipid Res. 2013, 54, 535–541. [Google Scholar] [CrossRef]
- Al-Khalili, L.; Bouzakri, K.; Glund, S.; Lönnqvist, F.; Koistinen, H.A.; Krook, A. Signaling Specificity of Interleukin-6 Action on Glucose and Lipid Metabolism in Skeletal Muscle. Mol. Endocrinol. 2006, 20, 3364–3375. [Google Scholar] [CrossRef]
- Carey, A.L.; Steinberg, G.R.; Macaulay, S.L.; Thomas, W.G.; Holmes, A.G.; Ramm, G.; Prelovsek, O.; Hohnen-Behrens, C.; Watt, M.J.; James, D.E. Interleukin-6 Increases Insulin-Stimulated Glucose Disposal in Humans and Glucose Uptake and Fatty Acid Oxidation in Vitro via AMP-Activated Protein Kinase. Diabetes 2006, 55, 2688–2697. [Google Scholar] [CrossRef]
- Mohtar, O.; Ozdemir, C.; Roy, D.; Shantaram, D.; Emili, A.; Kandror, K. V Egr1 Mediates the Effect of Insulin on Leptin Transcription in Adipocytes. J. Biol. Chem. 2019, 294, 5784–5789. [Google Scholar] [CrossRef] [PubMed]
- Yan, P.; Zhou, B.; Ma, Y.; Wang, A.; Hu, X.; Luo, Y.; Yuan, Y.; Wei, Y.; Pang, P.; Mao, J. Tracking the Important Role of JUNB in Hepatocellular Carcinoma by Single-cell Sequencing Analysis. Oncol Lett 2020, 19, 1478–1486. [Google Scholar] [CrossRef] [PubMed]
- Ballester, M.; Revilla, M.; Puig-Oliveras, A.; Marchesi, J.A.P.; Castelló, A.; Corominas, J.; Fernández, A.I.; Folch, J.M. Analysis of the Porcine APOA2 Gene Expression in Liver, Polymorphism Identification and Association with Fatty Acid Composition Traits. Anim. Genet. 2016, 47, 552–559. [Google Scholar] [CrossRef]
- Lefebvre, P.; Chinetti, G.; Fruchart, J.-C.; Staels, B. Sorting out the Roles of PPARα in Energy Metabolism and Vascular Homeostasis. J. Clin. Invest. 2006, 116, 571–580. [Google Scholar] [CrossRef]
- Kong, P.; Gonzalez-Quesada, C.; Li, N.; Cavalera, M.; Lee, D.-W.; Frangogiannis, N.G. Thrombospondin-1 Regulates Adiposity and Metabolic Dysfunction in Diet-Induced Obesity Enhancing Adipose Inflammation and Stimulating Adipocyte Proliferation. Am. J. Physiol. Metab. 2013, 305, 439–450. [Google Scholar] [CrossRef] [PubMed]
- Tamura, Y.; Kawao, N.; Okada, K.; Yano, M.; Okumoto, K.; Matsuo, O.; Kaji, H. Plasminogen Activator Inhibitor-1 Is Involved in Streptozotocin-Induced Bone Loss in Female Mice. Diabetes 2013, 62, 3170–3179. [Google Scholar] [CrossRef]
- Hu, Q.; Peng, J.; Chen, X.; Li, H.; Song, M.; Cheng, B.; Wu, T. Obesity and Genes Related to Lipid Metabolism Predict Poor Survival in Oral Squamous Cell Carcinoma. Oral Oncol. 2019, 89, 14–22. [Google Scholar] [CrossRef]
- Yang, X.; Jia, J.; Yu, Z.; Duanmu, Z.; He, H.; Chen, S.; Qu, C. Inhibition of JAK2/STAT3/SOCS3 Signaling Attenuates Atherosclerosis in Rabbit. BMC Cardiovasc. Disord. 2020, 20, 133. [Google Scholar] [CrossRef]
- Fang, S.; Feng, J.; Zhang, H.; Li, P.; Zhang, Y.; Zeng, Y.; Cai, Y.; Lin, X.; Xue, Y.; Guan, M. MiR-455 Targeting SOCS3 Improve Liver Lipid Disorders in Diabetic Mice. Adipocyte 2020, 9, 179–188. [Google Scholar] [CrossRef]
- Liu, Z.; Gan, L.; Yang, X.; Zhang, Z.; Sun, C. Hydrodynamic Tail Vein Injection of SOCS3 Eukaryotic Expression Vector in Vivo Promoted Liver Lipid Metabolism and Hepatocyte Apoptosis in Mouse. Biochem. Cell Biol. 2014, 92, 119–125. [Google Scholar] [CrossRef]
- Flach, R.J.R.; Qin, H.; Zhang, L.; Bennett, A.M. Loss of Mitogen-Activated Protein Kinase Phosphatase-1 Protects from Hepatic Steatosis by Repression of Cell Death-Inducing DNA Fragmentation Factor A (DFFA)-like Effector C (CIDEC)/Fat-Specific Protein 27*. J. Biol. Chem. 2011, 286, 22195–22202. [Google Scholar] [CrossRef]
- Roth, R.J.; Le, A.M.; Zhang, L.; Kahn, M.; Samuel, V.T.; Shulman, G.I.; Bennett, A.M. MAPK Phosphatase-1 Facilitates the Loss of Oxidative Myofibers Associated with Obesity in Mice. J. Clin. Invest. 2009, 119, 3817–3829. [Google Scholar] [CrossRef] [PubMed]
- Chakrabarti, P.; Kandror, K. V FoxO1 Controls Insulin-Dependent Adipose Triglyceride Lipase (ATGL) Expression and Lipolysis in Adipocytes*. J. Biol. Chem. 2009, 284, 13296–13300. [Google Scholar] [CrossRef] [PubMed]
- Chakrabarti, P.; English, T.; Karki, S.; Qiang, L.; Tao, R.; Kim, J.; Luo, Z.; Farmer, S.R.; Kandror, K. V SIRT1 Controls Lipolysis in Adipocytes via FOXO1-Mediated Expression of ATGL. J. Lipid Res. 2011, 52, 1693–1701. [Google Scholar] [CrossRef] [PubMed]
- Song, Y.; Zhang, J.; Jiang, C.; Song, X.; Wu, H.; Zhang, J.; Raza, S.H.A.; Zhang, L.; Zhang, L.; Cai, B.; et al. FOXO1 Regulates the Formation of Bovine Fat by Targeting CD36 and STEAP4. Int. J. Biol. Macromol. 2023, 248, 126025. [Google Scholar] [CrossRef]
- Hall, Z.; Wilson, C.H.; Burkhart, D.L.; Ashmore, T.; Evan, G.I.; Griffin, J.L. Myc Linked to Dysregulation of Cholesterol Transport and Storage in Nonsmall Cell Lung Cancer. J. Lipid Res. 2020, 61, 1390–1399. [Google Scholar] [CrossRef]
- Wei, X.; Zhang, Y.; Li, C.; Ai, K.; Li, K.; Li, H.; Yang, J. The Evolutionarily Conserved MAPK/Erk Signaling Promotes Ancestral T-Cell Immunity in Fish via c-Myc–Mediated Glycolysis. J. Biol. Chem. 2020, 295, 3000–3016. [Google Scholar] [CrossRef]
- Karczewska-Kupczewska, M.; Stefanowicz, M.; Matulewicz, N.; Nikołajuk, A.; Strączkowski, M. Wnt Signaling Genes in Adipose Tissue and Skeletal Muscle of Humans With Different Degrees of Insulin Sensitivity. J. Clin. Endocrinol. Metab. 2016, 101, 3079–3087. [Google Scholar] [CrossRef]
- Du, Q.; Tan, Z.; Shi, F.; Tang, M.; Xie, L.; Zhao, L.; Li, Y.; Hu, J.; Zhou, M.; Bode, A.; et al. PGC1α/CEBPB/CPT1A Axis Promotes Radiation Resistance of Nasopharyngeal Carcinoma through Activating Fatty Acid Oxidation. Cancer Sci. 2019, 110, 2050–2062. [Google Scholar] [CrossRef]
- Wu, H.; Liu, B.; Chen, Z.; Li, G.; Zhang, Z. MSC-Induced LncRNA HCP5 Drove Fatty Acid Oxidation through MiR-3619-5p/AMPK/PGC1α/CEBPB Axis to Promote Stemness and Chemo-Resistance of Gastric Cancer. Cell Death Dis. 2020, 11, 233. [Google Scholar] [CrossRef]
- Akiyama, H. Control of Chondrogenesis by the Transcription Factor Sox9. Mod. Rheumatol. 2008, 18, 213–219. [Google Scholar] [CrossRef] [PubMed]
- Wang, Y.; Sul, H.S. Pref-1 Regulates Mesenchymal Cell Commitment and Differentiation through Sox9. Cell Metab. 2009, 9, 287–302. [Google Scholar] [CrossRef] [PubMed]
- Gödecke, A. Myoglobin: safeguard of myocardial oxygen supply during systolic compression? Cardiovasc. Res. 2010, 87, 4–5. [Google Scholar] [CrossRef] [PubMed]
- Schlater, A.E.; De Miranda Jr, M.A.; Frye, M.A.; Trumble, S.J.; Kanatous, S.B. Changing the Paradigm for Myoglobin: A Novel Link between Lipids and Myoglobin. J. Appl. Physiol. 2014, 117, 307–315. [Google Scholar] [CrossRef] [PubMed]
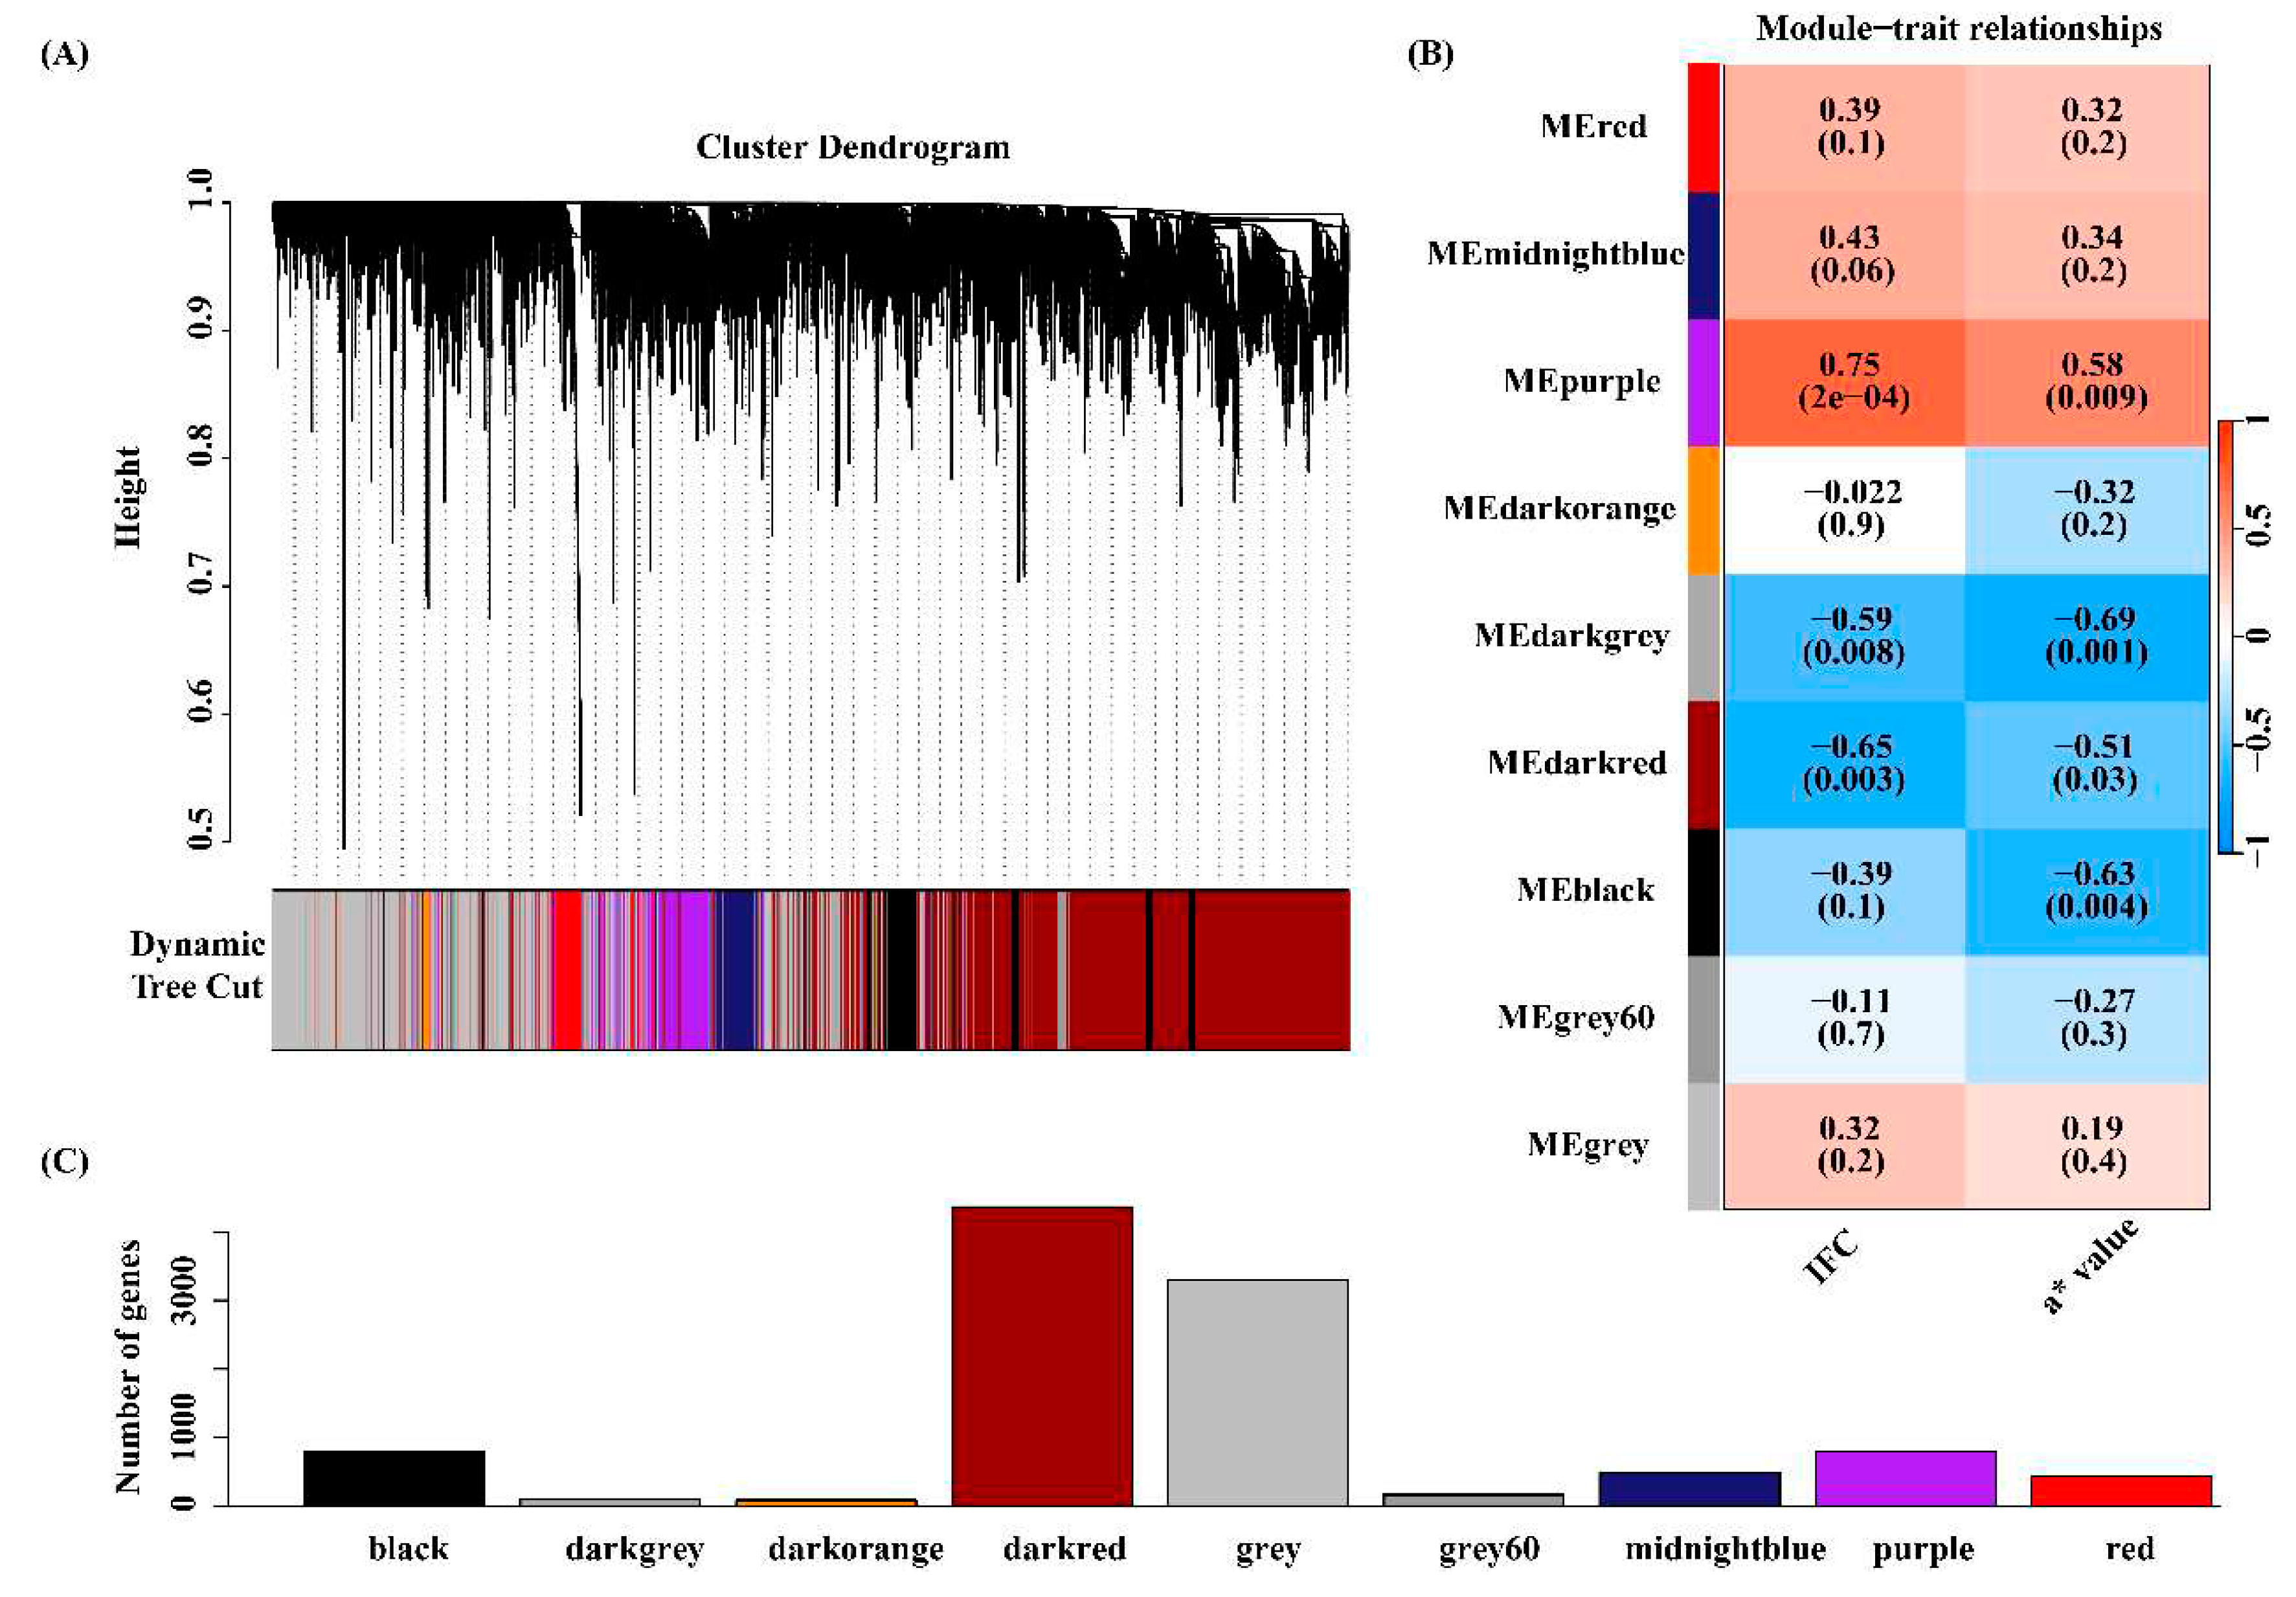
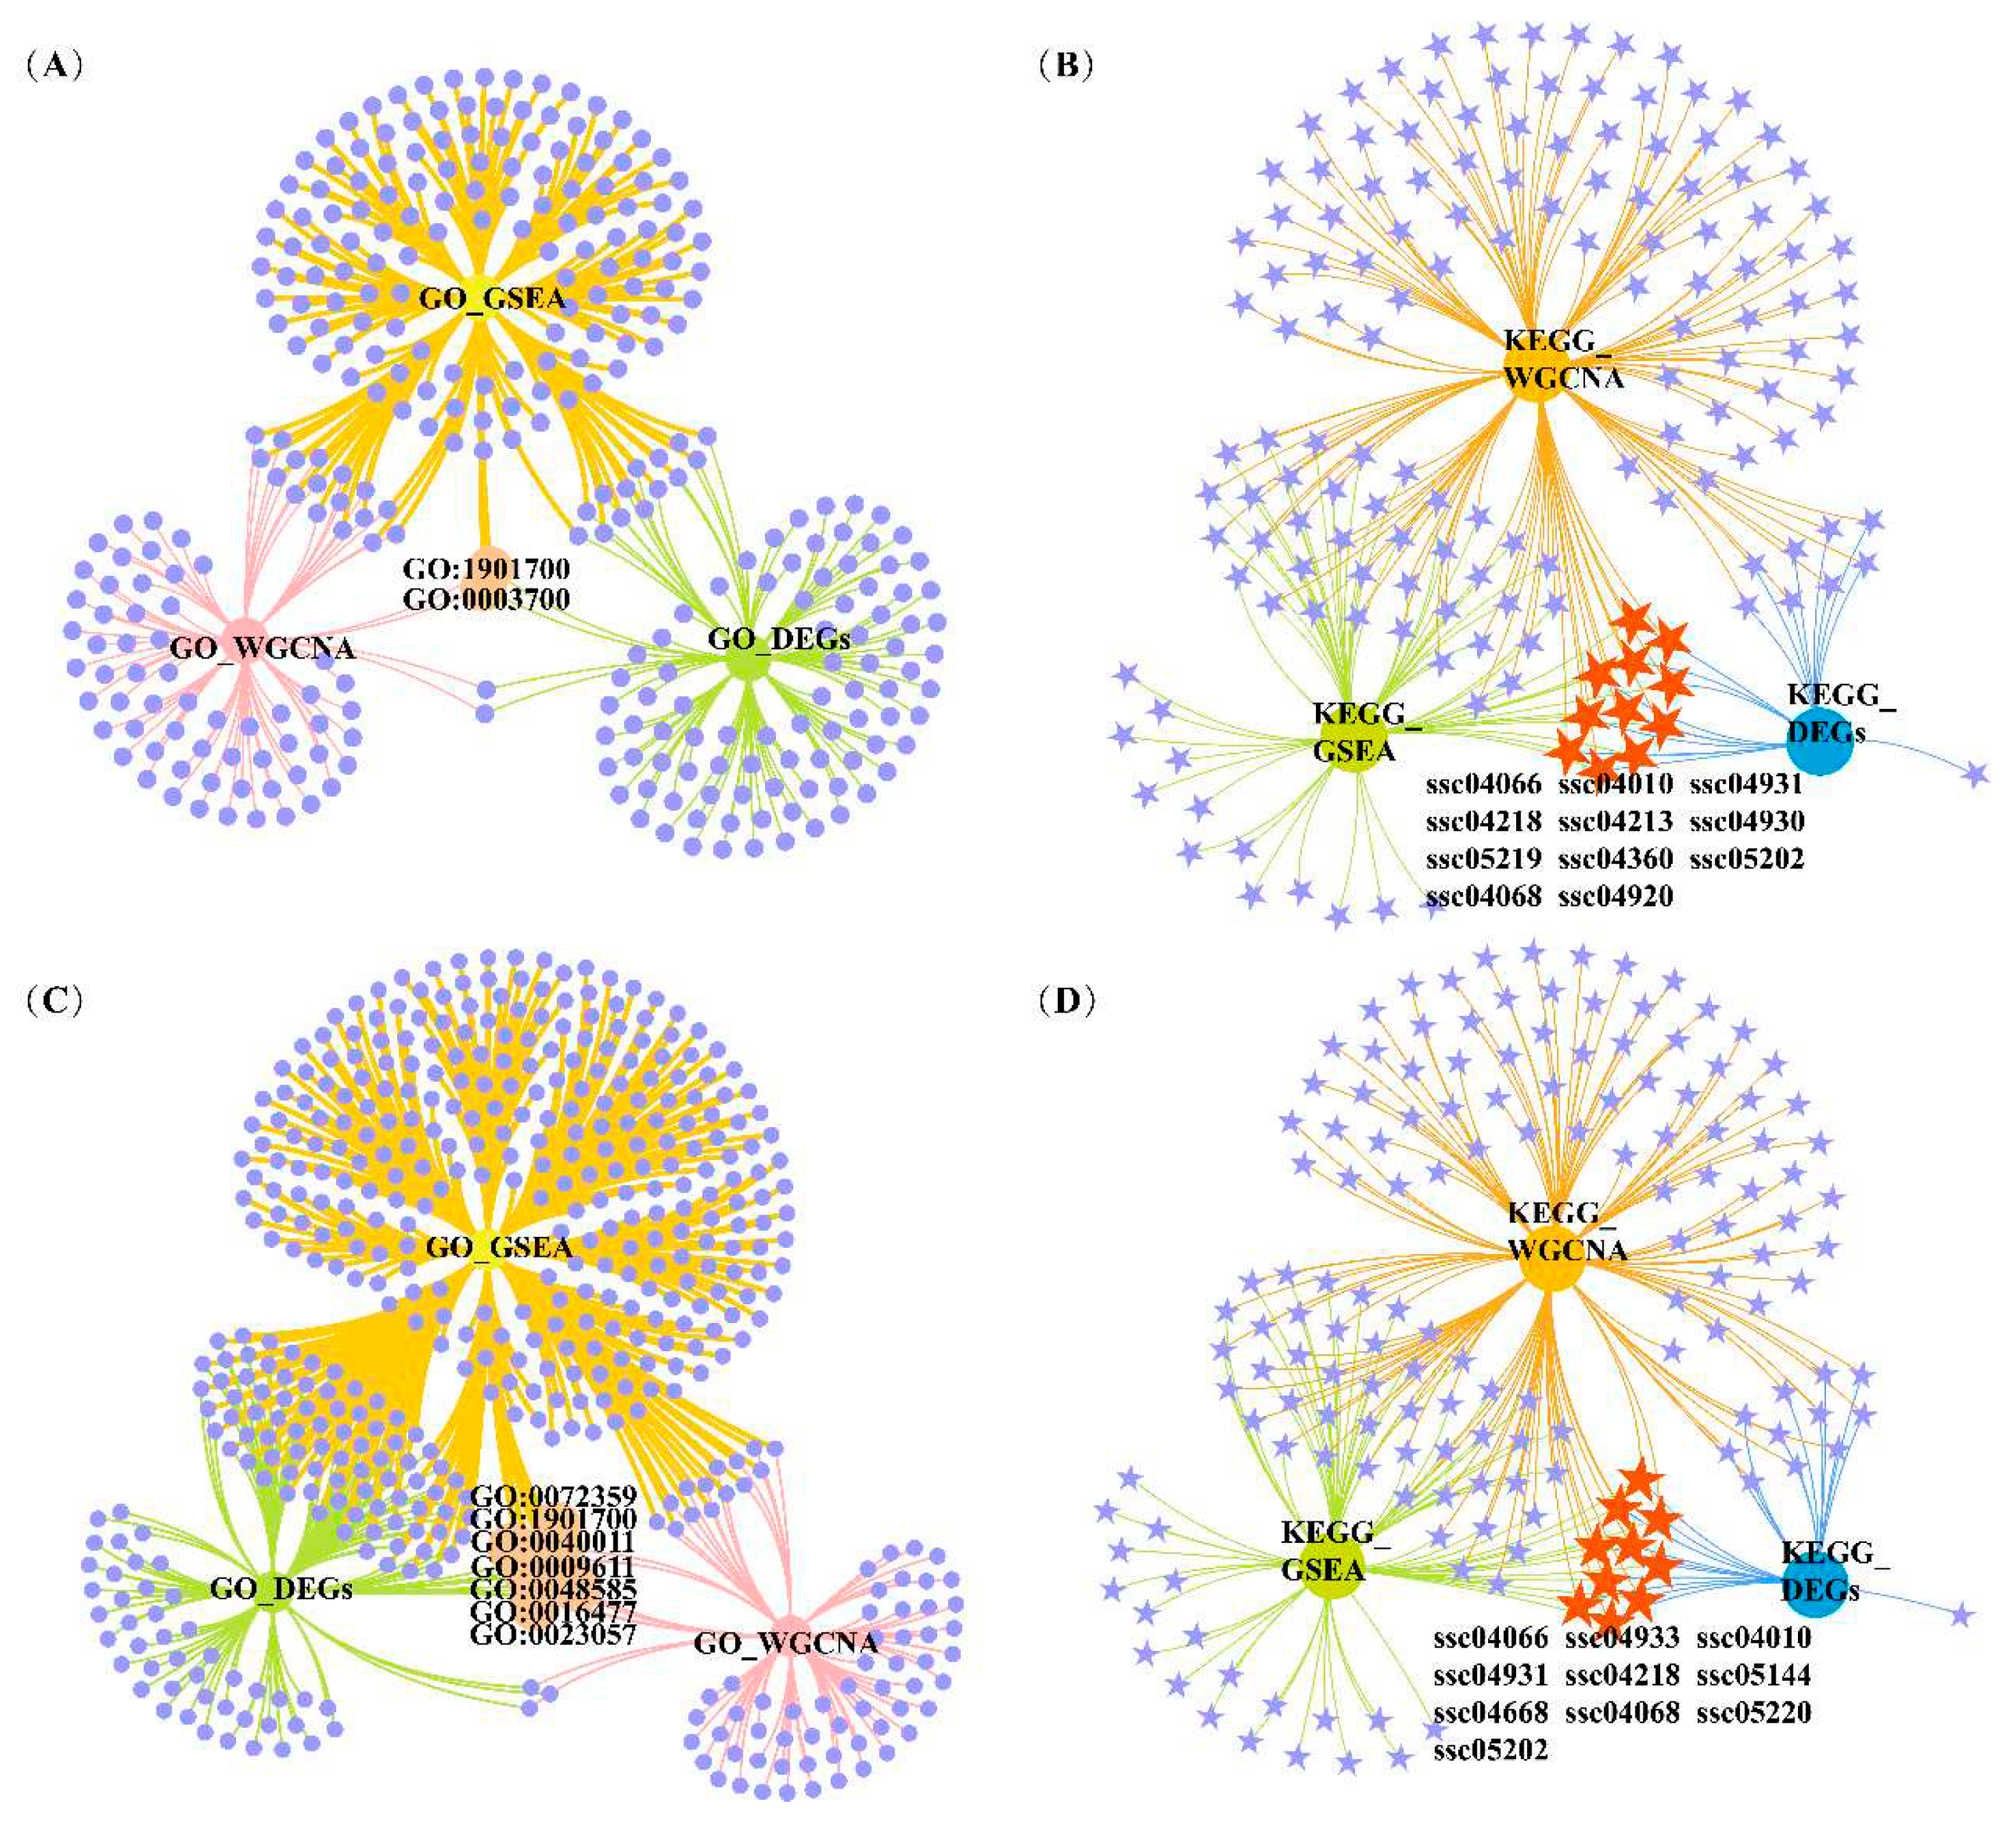
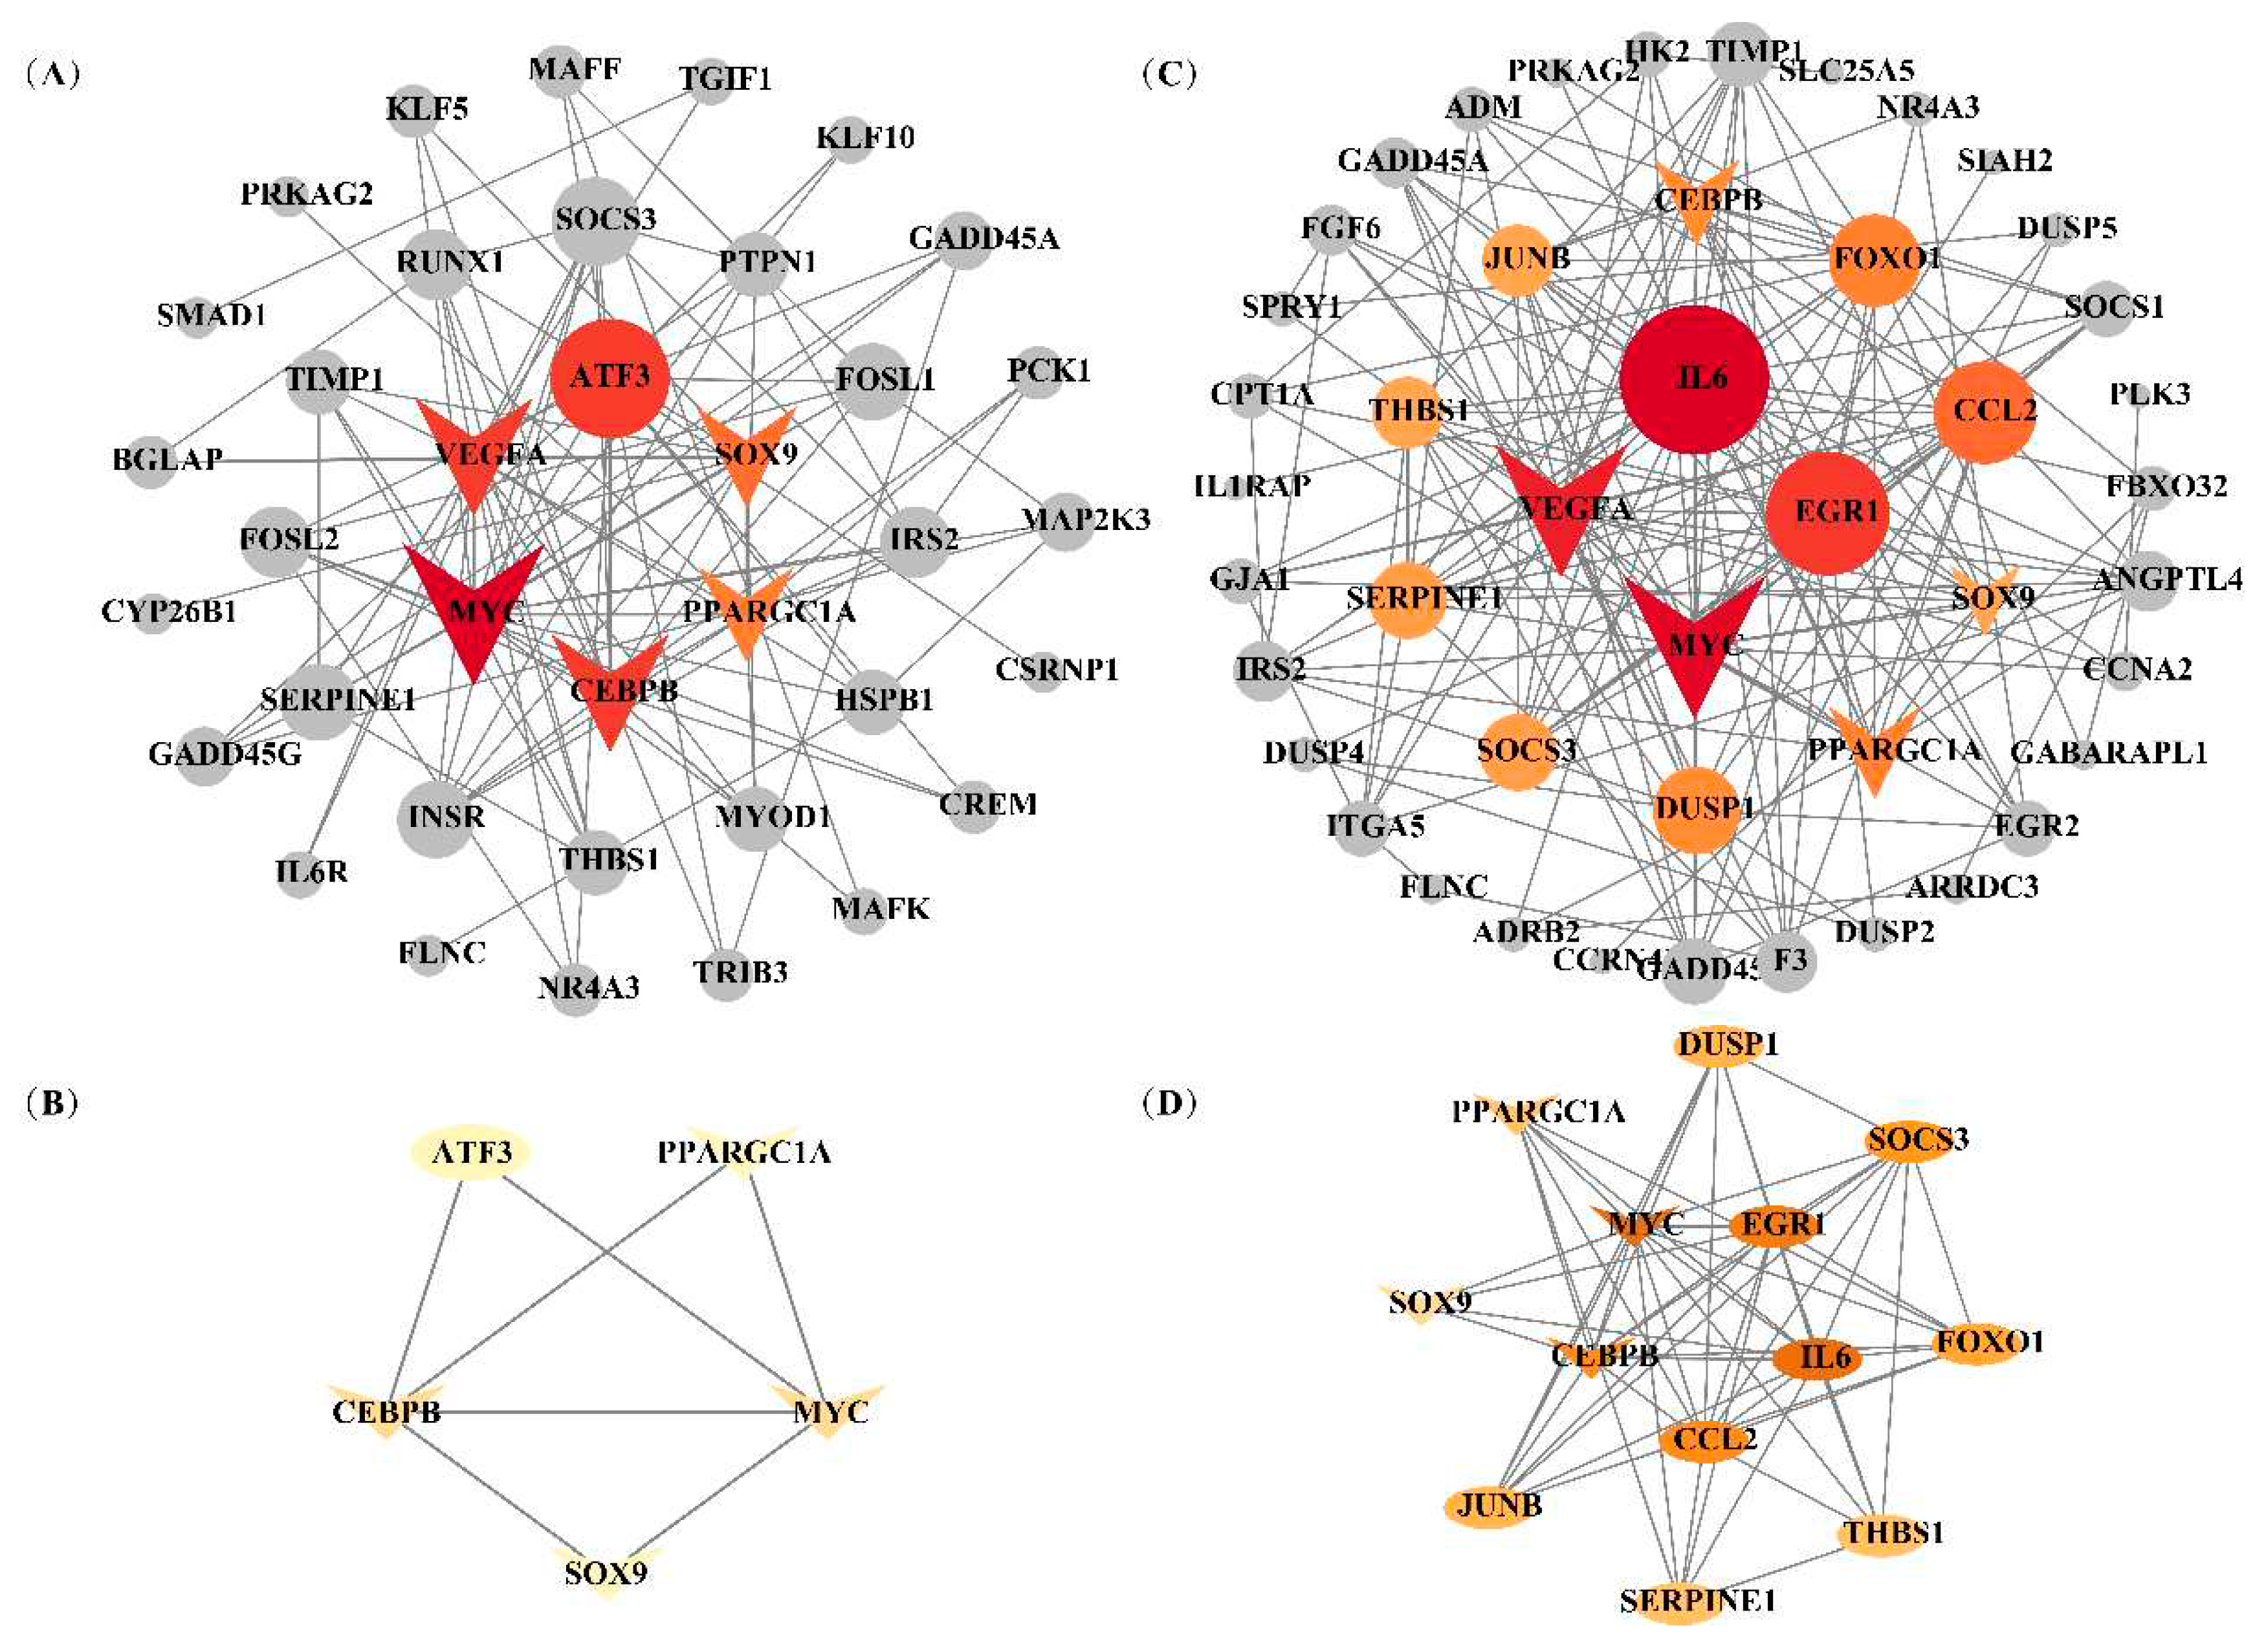
| Trait | GO ID | Description | GO_DEGsq value | GO_GSEAq value | GO_WGCNAq value | Overlapping DEGs |
| IMF | GO:1901700 | response to oxygen-containing compound | 0.069 | 0.047 | 0.005 | APOD, INHBB, CEBPB, NR4A3, SOX9, MYOD1, CYP26B1, BGLAP, PANX1, THBS1, PCK1 |
| GO:0003700 | DNA-binding transcription factor activity | 0.078 | 0.001 | 0.050 | TGIF1, RUNX1, FOSL2, KLF10, MAFK, SMAD1, MAFF, CSRNP1, CEBPB, NR4A3, SIM1, ATF3, SOX9, MYOD1, CREM, ZSCAN20, KLF5, FOSL1 | |
| a* | GO:1901700 | response to oxygen-containing compound | 0.023 | <0.001 | 0.005 | THBS1, INHBB, FOXO1, EGR1, PLSCR4, PLK3, CEBPB, SOCS1, SOX9, GJA1, SLC25A33, SLC11A1, NOCT, CCL2, SLC1A1, APOD |
| GO:0023057 | negative regulation of signaling | 0.034 | 0.004 | 0.012 | ADRB2, THBS1, SLC25A5, ADM, SIAH2, SPRY1, SOCS3, INHBB, EGR1, ARRDC3, DUSP5, SOCS1, SOX9, GJA1, APOD | |
| GO:0009611 | response to wounding | 0.043 | 0.001 | 0.035 | CCN1, PPL, SERPINE1, THBS1, F3, INHBB, SLC1A1, ITGA5, APOD | |
| GO:0072359 | circulatory system development | 0.043 | <0.001 | <0.001 | CCN1, SERPINE1, JUNB, THBS1, ADM, VEGFA, TIPARP, ITGA5, ANGPTL4, F3, EGR2, SOX9, GJA1, SLC1A1 |
| Trait | KEGG ID | Description | KEGG_DEGsq value | KEGG_GSEAq value | KEGG_WGCNAq value | Overlapping DEGs |
| IFC | ssc04931 | Insulin resistance | <0.001 | 0.07 | <0.001 | INSR, PPARGC1A, PTPN1, TRIB3, IRS2, PRKAG2, SOCS3, GFPT2 |
| ssc04010 | MAPK signaling pathway | 0.002 | 0.052 | <0.001 | MAP2K3, FLNC, VEGFA, GADD45A, INSR, HSPB1, MAP3K8, GADD45G, MYC, IL1RAP | |
| ssc04920 | Adipocytokine signaling pathway | 0.002 | 0.071 | <0.001 | PPARGC1A, IRS2, PRKAG2, SOCS3 | |
| ssc04066 | HIF-1 signaling pathway | 0.006 | 0.021 | <0.001 | VEGFA, INSR, IL6R, SERPINE1, HK3, TIMP1 | |
| ssc04068 | FoxO signaling pathway | 0.02 | 0.029 | <0.001 | GADD45A, INSR, GABARAPL1, IRS2, PRKAG2, GADD45G | |
| a* | ssc04068 | FoxO signaling pathway | 0.002 | <0.001 | <0.001 | GADD45A, GABARAPL1, IRS2, PRKAG2, GADD45B, FOXO1, IL6, PLK3, FBXO32 |
| ssc04920 | Adipocytokine signaling pathway | 0.005 | 0.097 | <0.001 | PPARGC1A, IRS2, PRKAG2, CPT1A, SOCS3 | |
| ssc04010 | MAPK signaling pathway | 0.043 | 0.013 | <0.001 | GADD45A, FLNC, GADD45B, VEGFA, FGF6, DUSP1, IL1RAP, DUSP4, MYC, DUSP5, DUSP2 | |
| ssc04066 | HIF-1 signaling pathway | 0.074 | 0.021 | <0.001 | SERPINE1, VEGFA, TIMP1, IL6, HK2 |
Disclaimer/Publisher’s Note: The statements, opinions and data contained in all publications are solely those of the individual author(s) and contributor(s) and not of MDPI and/or the editor(s). MDPI and/or the editor(s) disclaim responsibility for any injury to people or property resulting from any ideas, methods, instructions or products referred to in the content. |
© 2023 by the authors. Licensee MDPI, Basel, Switzerland. This article is an open access article distributed under the terms and conditions of the Creative Commons Attribution (CC BY) license (https://creativecommons.org/licenses/by/4.0/).


