
You are currently viewing a beta version of our website. If you spot anything unusual, kindly let us know.
Preprint
Article
Construction of Co-expression Network affecting Intramuscular Fat Content and Meat Color Redness Based on Transcriptome Analysis
Altmetrics
Downloads
107
Views
42
Comments
0
A peer-reviewed article of this preprint also exists.


This version is not peer-reviewed
Abstract
Intramuscular fat content (IFC) and meat color are vital indicators affecting pork quality. A significant positive correlation between IFC and redness meat color (a* value) indicates that these two traits are likely to be regulated by shared molecular pathways. To identify candidate genes, hub genes, and signaling pathways that regulate these two traits, we measured the IFC and a* value in 147 hybrid pigs and selected individuls with extreme phenotypes for transcriptome analysis. The results revealed 485 and 394 overlapping differentially expressed genes (DEGs) using DESeq2, limma, and edgeR packages affecting IFC and a* value, respectively. Weighted gene co-expression network analysis (WGCNA) identified four modules significantly correlated with IFC and a* value. Moreover, we integrated functional enrichment analysis results based on DEGs, GSEA, and WGCNA conditions to identify candidate genes, and identified 47 and 53 candidate genes affecting IFC and a* value, respectively. The protein-protein interaction (PPI) network analysis of candidate genes showed that 6 and 14 hub genes affecting IFC and a* value, respectively. These genes mainly participated in various pathways related to lipid metabolism and redox reactions. Notably, four crucial hub genes (MYC, SOX9, CEBPB, and PPAGRC1A) were shared for these two traits. After functional annotation of these four hub genes, we hypothesized that the SOX9/CEBPB/PPARGC1A axis could co-regulate lipid metabolism and myoglobin redox response. Further research on these hub genes, especially the SOX9/CEBPB/PPARGC1A axis, will help to understand the molecular mechanism of the co-regulation of IFC and a* value, which will provide the theoretical basis for improving pork quality.
Keywords:
Subject: Biology and Life Sciences - Animal Science, Veterinary Science and Zoology
1. Introduction
Pork is a significant and extensively utilized animal resource, that has emerged as a principal protein source within human diets. In recent years, China’s yearly pork production has surpassed 50 million tons. Notably, Duroc × (Landrace × Yorkshire) (DLY) pigs have accounted for over 90% of the pork market due to their rapid growth and high lean meat rate [1]. With improved living standards, an increased pursuit of enhanced pork quality arises among individuals. Meat quality is a crucial indicator for assessing pork production and quality. Essential indicators of meat quality encompass intramuscular fat content (IFC), meat color, tenderness, and dripping loss, which can directly impact pork quality and market competitiveness [2]. Consumers favor snowflake meat, and IFC deposition is the main cause of snowflake meat [3]. Notably, meat color is also one of the most direct sensory indicators of pork quality for consumers and directly affects their consumption behavior. A present finding has indicated that the phenotypic score of the meat color manifested a stronger correlation with the meat color redness (a*) value (R = 0.8) [4]. Despite DLY pork effectively meeting the quantitative demand, its muscle quality falls short of eliciting satisfaction. Both IFC and a* value are traits with relatively high heritability [5,6] and are the most intuitive indicators of high-quality pork. Consequently, increasing the IFC and a* value through genetic improvement is a major research focal point for pig breeding enterprises.
IFC refers to the amount of fat accumulating between muscle fibers or within muscle cells, mainly composed of phospholipids and triglycerides [7]. Due to the relatively fixed phospholipid content, changes in IFC were primarily caused by triglyceride changes [8]. It is widely accepted that changes in meat color in muscles are due to changes in myoglobin levels. This may be due to higher myoglobin levels in slow/oxidative myofibers (red muscle fibers) than in fast/glycolytic myofibers (white muscle fibers). When there is a high proportion of red muscle fibers in muscle tissue, its muscle color exhibits a more distinct red characteristic [9]. This phenomenon is closely related to the biochemical markers of meat, such as oxidation state, cytochrome content, and redox forms. Previous studies have shown a significant correlation (R = 0.260 ~ 0.323) between IFC and meat redness (a*) [10,11]. Therefore, we speculated that these two traits might have similar genetic backgrounds, but the underlying genetic basis was largely unknown.
It is generally believed that the difference in phenotype is caused by changes in gene expression levels. Therefore, the variation in IFC and a* value within a population is thought to be driven by differences in the expression levels of critical genes involved in regulating these two traits. With the development of next-generation sequencing technologies, the emergence of transcriptome sequencing (RNA-seq) allows us to detect the expression levels of all genes across the entire genome. Researchers usually used individuals with extreme phenotypes of IFC and a * value to perform RNA-seq, which could obtain many candidate genes and signaling pathways related to IFC and a* value [12,13,14].
However, organisms are complex systems with interconnected genes regulating biological activities, forming intricate network systems. Therefore, it is crucial to consider the interrelationships between thousands of genes when studying phenotypic variation. Differential expression analysis may not capture critical biological pathways or gene-gene interactions relevant to target traits, as it focuses on the impact of individual genes rather than the influence of gene networks [15]. Coexpressed genes often form densely connected subgraphs in networks, representing functionally related gene groups or signaling pathways, and exhibit specific biological functions by developing local substructure modules [16]. These modules reveal interactions among genes at a systems level, aiding researchers in further understanding the mechanisms underlying gene interactions and identifying regulatory hubs of coexpressed genes [17]. Weighted gene co-expression network analysis (WGCNA) is an efficient and accurate method for describing the correlation among all genes or modules within the whole genome with traits. It is particularly advantageous for simultaneously identifying key genes of multiple complex traits [18], such as fat deposition [13], meat quality [19], and reproductive performance [20].
Based on transcriptomic data, the present study aimed to gain molecular insights into the hub genes and metabolic pathways that coregulated the variations in IFC and a* value. We collected individuals with divergent IFC and a* value for RNA-seq. Subsequently, we identified the differentially expressed genes (DEGs), and performed the gene set enrichment analysis (GSEA), WGCNA, and protein-protein interaction (PPI) analysis. We identified the candidate genes and modules significantly related to these two traits. Through systematic integration of the above results, we identified the hub genes and pathways that could co-regulate the changes in IFC and a* values. These findings can contribute to understanding the genetic mechanisms of co-regulation changes in IFC and a* value. Moreover, the identified hub genes may serve as potential biomarkers for the synergistic improvement of IFC and meat color in pigs.
2. Materials and methods
2.1 Animals, sample collection and phenotype measurement
A total of 147 commercial DLY pigs, consisting of 70 Castrated boars and 77 females, were selected for this study. The experimental pigs were reared under standardized indoor conditions and provided ad libitum access to feed and water at Jiangsu Kangle Pig Breeding Farm (Changzhou, China). All experimental protocols involving animals were approved by the Nanjing Agricultural University Animal Care and Use Committee (Certification No.: SYXK (Su) 2022-0031). The pigs were slaughtered as six batch at the same slaughterhouse at an average live weight of 122.49 ± 16.54 kg (mean ± standard deviation). Following slaughter, LD muscle from the last third and fourth thoracic vertebrae was collected for each pig. Approximately 0.5 g of LD muscle was placed into a 1.5 ml tube and frozen at −80 °C for RNA extraction. Meat color redness value of LD muscle was assessed three times at 24 hours post-mortem using a CR-410 hand-held colorimeter (Kinica Minolta Sensing Inc., Shanghai, China). The mean of the three measurements was the final a* value. Approximately 300 g of LD muscle was utilized for determining IFC using the Soxhlet extraction method [21].
2.2 Sample selection
Based on the measurements of IFC, 12 individuals with similar body weights were selected. Six had extremely high IFC (H_IFC), and six had extremely low IFC (L_IFC) for subsequent transcriptome sequencing. Similarly, based on the measurement results of a* value, six samples with extremely high a* value (H_a*) and six samples with extremely low a* value (L_a*) were selected. It is important to note that there were some duplicate samples among the selected four groups, thus resulting in a final total of 19 unique individuals for transcriptome sequencing. The means of IFC and a* value in high and low groups were caculated by two-tailed Student’s t-test. All analysis were conducted using SPSS (v22.0) software (SPSS Inc., Chicago, IL, USA).
2.3 RNA extraction, library construction, and sequencing
Total RNA was extracted from 100 mg of frozen LD muscle using TRIzol reagent (Invitrogen, Carlsbad, CA, USA). Total RNA obtained was quantified and quality controlled using Qubit 2.0 and Agilent 2100. The Illumina NovaSeq 6000 platform (Illumina, San Diego, CA, USA) was used for transcriptome sequencing based on the high-quality cDNA library, and the sequencing read length was paired-end 150 bp.
2.4 Identification of DEGs
The obtained raw data were filtered to clean data with FastQC (v0.11.5) and Trimmomatic (v0.38) software [22] by removing reads containing adapters, low-quality reads, and reads with an N content > 5%. Clean reads were mapped to the Sus scrofa 11.1 genome from Ensembl 101 using STAR (v2.7.2) software [23] for alignment. Finally, a transcriptome gene expression count file was converted using featureCounts (v2.0.0) software [24]. The DESeq2 (v1.25.9) [25], limma [26], and edgeR packages in R (v4.1) [27] software were used to identify DEGs between the groups. DEGs were defined as those with a false discovery rate (FDR) < 0.05 and |log2 fold change|≥ 1. Furthermore, overlapping DEGs detected by the DESeq2, limma, and edgeR packages were considered true DEGs and used for subsequent functional enrichment analysis.
2.5 Functional annotation and enrichment analysis
To better understand the functions of overlapping DEGs, the R package BioMart (http://www.biomarbiomart.org/) [28] was used to annotate genes using the reference genome Sus scrofa 11.1. The Gene Ontology (GO) terms and Kyoto Encyclopedia of Genes and Genomes (KEGG) pathways of overlapping DEGs were subjected to functional enrichment analysis using the R package clusterProfiler (v4.6.2) [29] with a significance cutoff criterion of q value < 0.10. The overlapping DEGs were visualized as a heatmap plot using the R function pheatmap. Additionally, considering the GSEA does not require an arbitrary cut-off for differential gene expression and it has a more extensive functional range, we also performed GSEA in our datasets based on whole genes of IFC and a* groups using the clusterProfiler package (v4.6.2) [29], respectively. The threshold of significantly enriched GO terms and KEGG pathways was q value < 0.10.
2.6 WGCNA
To construct a co-expression network, we performed WGCNA, a package from R (1.72.1) [30], with RNA-seq data (n = 19) with their counts normalized by transcript per million (TPM). After the expression matrix input, genes with TPM values > 1 in more than 10 individuals were selected for a coexpression network setting. The clean expression matrix underwent hierarchical clustering using the group average method to identify outliers, which are samples deviating significantly from the others. The results of the hierarchical cluster analysis revealed that three samples were outliers. After excluding the outliers, the final expression matrix contained 10,512 genes and 19 individuals for establishing an unsigned coexpression network based on the step-by-step method.
The co-expression network construction involved the calculation of an adjacency matrix, denoted as matrix "a," using the formula aij = |sij|β, where sij represents the absolute value of the correlation coefficient between gene i and gene j, and β is a soft-power threshold. This study selected the power of 18 based on the scale-free topology criterion, resulting in a scale-free topology index (R2) of 0.90. To enhance the robustness of the network against spurious connections or missing connections, the topological overlap matrix (TOM) was introduced. TOM measures the overlap in shared neighbors between genes and aids in identifying modules of highly coexpressed genes. The dissimilarity TOM, obtained by subtracting the TOM from 1, was used as input for the dendrogram. Genes were clustered into distinct modules using hierarchical clustering and dynamic tree-cutting methods. The hybrid dynamic tree-cutting approach employed a minimum module size of 30 as the default and commonly used value. To characterize the module expression, module eigengenes (MEs) were calculated as the first principal component of the expression matrix. MEs represent weighted average expression profiles for each module. The WGCNA approach facilitates the identification of biologically significant modules and potential critical modules for further analysis by defining the module-trait relationships (MTRs) and gene significance (GS) of each module. The MTRs were estimated by calculating pearson correlations between the MEs and phenotypes. At the same time, the GS was determined by examining the correlation between the expression profiles and phenotypes. The mean value of GS for the genes within a module represented the module significance (MS). To select candidate modules for functional enrichment analysis, modules with MTRs greater than 0.35 and MS exceeding 0.25 were considered based on the criteria reported in previous studies. The GO and KEGG pathway terms of all genes within the critical module were subjected to functional enrichment analysis using the clusterProfiler package (v4.6.2) [29] with a significance cutoff criterion of q value < 0.10.
2.7 Identification of candidate and hub genes related to IFC and a* value
To further identify candidate genes affecting IFC and a* value, we performed overlap analysis of significantly enriched GO terms and KEGG pathways derived from overlapping DEGs, GESA, and WGCNA, respectively. DEGs located in the overlapping GO terms and KEGG pathways were considered candidate genes and used for subsequent PPI analysis.
The construction of a PPI network was employed to analyze the interactions between genes encoding proteins in candidate genes based on the Search Tool for the Retrieval of Interacting Genes (STRING) database (v11.5) [31]. Cytoscape software (v3.8.0) [32] was employed to visualize the entire PPI network. This analysis allows the connection patterns between genes in PPI networks to be explored and visualized. Highly connected genes, also known as hub genes, may play an essential role in influencing the target traits of these candidate genes. The criterion for selecting the hub gene was that its degree of connectivity was greater than 10.
3. Results
3.1 Phenotypes and sequencing data
The phenotypes of IFC and a* value in 147 DLY pigs are shown in Figure 1A. The mean and standard error of IFC and a* value were 3.20%±0.10% and 2.86%±0.13%, respectively. IFC and a* value showed a highly significant positive correlation (R = 0.309, P < 0.001) (Figure 1B).
Based on the IFC and a* value, the LD muscle samples were divided into high IFC (H_IFC, n = 6), low IFC (L_IFC, n = 6), high a* value (H_a*, n = 6) and low a* value (L_a*, n = 6) groups. The phenotypic values of selected individuals are shown in Figure 2 and Table S1. The mean IFC of the high and low groups were 5.92% and 1.45%, respectively. The mean a* values of the high and low groups were 4.30 and 1.72, respectively. In addition, the IFC or a* value in the high groups (H_IFC and H_a*) was significantly higher than that in the low groups (L_IFC and L_a*) (Figure 2C).
Concerning the RNA-Seq data, 18.74–25.32 million raw reads per sample were generated. After filtering approximately 1.39% of raw reads, an average of 21.45 million clean reads were used for the following analysis. The mean Q30 and GC percentage values of these clean data were 95.19% and 52.53%, respectively. After alignment using STAR software, 87.53% of clean reads were uniquely mapped to the Sus scrofa 11.1 genome (Table S1). Before DEGs detection, low expression levels or non-expressed genes were removed based on gene expression counts. The remaining 16,453 for IFC and 16,249 for a* were analyzed for the differential expression analysis.
3.2 DEGs
The present study identified 723, 569, and 608 DEGs between the H_IFC and L_IFC groups using DESeq2, limma, and edgeR, respectively (Figure 3A). A total of 485 overlapping DEGs were detected, including 190 up-regulated and 295 down-regulated DEGs in the H_IFC group, respectively. For a* value, 590, 481, and 455 DEGs were identified using DESeq2, limma, and edgeR, respectively (Figure 3C). Three hundred and ninety-four DEGs were shared among the three methods, including 153 up-regulated and 241 down-regulated DEGs in the H_a* group. Figure 3B and 3D exhibit the heatmap of these overlapping DEGs, from which it can be seen that the expression patterns of overlapped DEGs were consistent within groups and different between groups. Moreover, 201 DEGs were shared between these two traits.
3.3 Functional enrichment analysis
There were 106 significantly enriched GO (GO_DEGs) terms (Table S4, Figure 4A) and 20 significantly enriched KEGG (KEGG_DEGs) pathways (Table S5, Figure 4B) based on overlapping DEGs between H_IFC and L_IFC groups. Among these 106 enriched GO_DEGs terms, most belonged to the biological process (BP) category, and only 1 and 6 terms belonged to the cellular component (CC) and molecular function (MF) categories, respectively. In terms of KEGG_DEGs pathways, more than half of the 20 significantly enriched pathways were closely associated with lipid metabolism and lipolysis, such as the adipocytokine signaling pathway (ssc04920), MAPK signaling pathway (ssc04010), PI3K-Akt signaling pathway (ssc04151) and regulation of lipolysis in adipocytes (ssc04923). For a* value, 138 significantly enriched GO_DEGs terms (Table S6, Figure 4C) and 22 significantly enriched KEGG_DEGs pathways (Table S7, Figure 4D) were detected. Similarly, most of these enriched GO_DEGs terms belonged to the BP category. KEGG_DEGs enrichment analysis revealed that 9 of 12 significant pathways were strongly associated with redox and antioxidant responses, such as the insulin signaling pathway (ssc04910), AMPK signaling pathway (ssc04152), FoxO signaling pathway (ssc04068), adipocytokine signaling pathway (ssc04920), and MAPK signaling pathway (ssc04010). Furthermore, 12 of these 22 significantly enriched pathways were shared with the significantly enriched pathways found in the IFC group. This suggests that there was some similarity in the genetic background between IFC and a* value.
To further understand the mechanisms of genetic differences between high and low groups, GSEA was conducted. The results showed that 168 significantly enriched GO_GSEA terms (Table S8) and 61 significantly enriched KEGG_GSEA pathways (Table S9) were identified between H_IFC and L_IFC groups. Among these enriched GO_GSEA terms, the top 5 were related to mitochondrial metabolism and organismal oxidoreductase activity. In terms of KEGG_GSEA, several significant pathways associated with lipid and fatty acid metabolism were enriched, such as oxidative phosphorylation (ssc00190), fatty acid metabolism (ssc01212), adipocytokine signaling pathway (ssc04920) and ether lipid metabolism (ssc00565). For a* value, 390 significantly enriched GO_GSEA terms (Table S10) and 76 significantly enriched KEGG_GSEA pathways (Table S11) were identified between the H_a* and L_a* groups. Redox reactions are an essential factor influencing a* value; the top 5 of significantly enriched GO_GSEA terms were mainly related to the cellular response to an organic substance, oxidoreductase activity, and positive regulation of the developmental process. KEGG_GSEA results showed that more than 60% of the significantly enriched pathways in the H_a* and L_a* groups were consistent with those significantly enriched in the high and low IFC groups. These overlapping pathways included the above-mentioned lipid metabolic pathways, such as ssc00190, ssc01212, and ssc00565. These results predicted that lipid and fatty acid metabolism were essential factors influencing changes in a* value.
3.4 Co-expressed gene modules associated with IFC and a* value
The expression matrix containing 10,512 genes from 19 individuals was used to WGCNA. Hierarchical cluster analysis revealed no outliers among 19 samples (Figure S1A). To build a scale-free network, we choose a soft threshold = 18, with a scale-free topology fitting index R2 > 0.90 (Figure S1B). In this study, nine gene coexpression modules were identified (Figure 5A). The module with the minimum number of genes among these modules was the dark orange module, containing 82 genes, while the maximum number of genes was in the dark red module, including 4,367 genes (Figure 5B). Correlation analysis between module eigengene and IFC or a* value was performed, and four modules, including purple, dark grey, dark red, and black, were significantly correlated with IFC and a* value (Figure 5C, Figure S2, Figure S3). Notely, among these four significant modules, the purple module positively correlated with both IFC and a* value. In contrast, the dark grey, dark red, and black modules exhibited negative correlations with IFC and a* value. These four modules contained a total of 6,045 genes encoding proteins. Subsequently, we focused on 6,045 genes for subsequent functional enrichment analysis. Details of 6,045 genes are shown in Table S12.
3.5 Functional enrichment analysis for the four key modules
The significant GO_WGCNA terms and KEGG_WGCNA pathways (q value < 0.10) are presented in Tables S13 and S14. The GO_WGCNA results showthat genes in the black red module were significantly enriched in 35 GO terms, which were mainly related to IFC and a*, such as regulation of catabolic process (GO:0009894), RNA binding (GO:0003723), negative regulation of lipid localization (GO:1905953) and oxidoreduction-driven active transmembrane transporter activity (GO:0015453). From KEGG_WGCNA analysis results, 156 pathways were significantly enriched, and most of the significant pathways were related to lipid deposition, decomposition, and oxidation-reduction reactions. These pathways were critical in the regulation of both IFC and a*, such as the adipocytokine signaling pathway (ssc04920), FoxO signaling pathway (ssc04068), MAPK signaling pathway (ssc04010), and oxidative phosphorylation (ssc00190).
In the black module, the functional enrichment results showed that 41 GO_WGCNA terms and 86 pathways were significantly enriched. These significant GO_WGCNA terms were mainly involved in phosphorylation (GO:0016310), response to oxygen-containing compound (GO:1901700), actin cytoskeleton (GO:0015629), and calcium ion binding (GO:0005509). The significant pathways related to lipid metabolism and oxidative reactions mainly included regulation of lipolysis in adipocytes (ssc04923), glycerolipid metabolism (ssc00561), PI3K-Akt signaling pathway (ssc04151), MAPK signaling pathway (ssc04010), and Wnt signaling pathway (ssc04310).
Genes in the purple module were significantly enriched with 6 GO_WGCNA terms and 14 KEGG_WGCNA pathways. These GO terms were mainly involved in extracellular matrix organization (GO:0030198) and collagen binding (GO:0005518). Among these significant KEGG_WGCNA pathways, four were associated with IFC, such as fatty acid metabolism (ssc01212), insulin resistance (ssc04931), calcium signaling pathway (ssc04020), and fatty acid degradation (ssc00071). Genes in the black grey modules were not significantly enriched in GO terms and KEGG pathway might be due to the limitation of the number of genes in this module.
3.6 Identification of candidate genes related to IFC and a* value
To determine the candidate genes affecting IFC and a* value, we first screened the overlapping GO terms and KEGG pathways for each trait based on the functional enrichment analysis results of overlapping DEGs, GSEA, and WGCNA. The DEGs in the overlapping GO terms and KEGG pathways were selected as candidate genes. Finally, hub genes with connectivity exceeding ten were obtained by constructinga PPI network of candidate genes. For IFC, 2 overlapping GO terms, and 11 overlapping pathways were identified (Figure 6A,B). Most of these overlapping GO terms and pathways were involved in lipid metabolism, such as response to oxygen-containing compound (GO:1901700), DNA-binding transcription factor activity (GO:0003700), insulin resistance (ssc04931), MAPK signaling pathway (ssc04010), adipocytokine signaling pathway (ssc04920), HIF-1 signaling pathway (ssc04066), and FoxO signaling pathway (ssc04068). For a* value, 7 overlapping GO terms, and 10 overlapping pathways were identified (Figure 6C,D). Most of these overlapping GO terms and pathways were involved in oxidative phosphorylation, system development, and lipid metabolism, such as response to oxygen-containing compound (GO:1901700), negative regulation of signaling (GO:0023057), response to wounding (GO:0009611), circulatory system development (GO:0072359), FoxO signaling pathway (ssc04068), adipocytokine signaling pathway (ssc04920), MAPK signaling pathway (ssc04010), and HIF-1 signaling pathway (ssc04066).
We selected terms and pathways associated with lipid metabolism and redox in overlapping GO terms and KEGG pathways, and DEGs located in these terms and pathways were considered candidate genes. The selected GO terms and KEGG pathways for IFC and a* value are shown in Table 1 and Table 2. The results showed that 47 and 53 genes were considered candidate genes for IFC and a* value, respectively. These candidate genes were used for subsequent PPI network construction. It was worth noting that among these two traits, there was one GO term (response to oxygenated compounds) and three KEGG pathways (adipocyte cytokine signaling pathway, MAPK signaling pathway, and HIF-1 signaling pathway) that were consistent, and these two traits shared 18 candidate genes.
3.7 Hub genes
The interaction relationships of candidate genes affecting IFC and a* value were obtained by constructing PPI networks. A PPI network, including 32 nodes and 101 edges, was constructed for IFC, and the minimum interaction score requirement was more significant than 0.4 (Figure 7A). According to the degree of connectivity, six genes (ATF3, SOX9, PPARGC1A, CEBPB, MYC, and VEGFA) with connectivity greater than 10 were identified as hub genes. The interactive subnetwork, including the five hub genes, was extracted and established from the whole PPI network (Figure 7B). Functional enrichment analysis showed that CEBPB, SOX9, and PPARGC1A were mainly involved in the transcriptional regulation of white adipocyte differentiation and the regulation of fatty acid oxidation.
For a* value, a PPI network, including 38 nodes and 174 edges, was constructed, and the minimum interaction score requirement was > 0.4 (Figure 7C). According to the degree of connectivity, 14 genes (IL6, VEGFA, MYC, EGR1, CEBPB, JUNB, THBS1, SERPINE1, SOCS3, DUSP1, SOX9, PPARGC1A, CCL2, and FOXO1) with the connectivity greater than ten were identified as hub genes. The interactive subnetwork, including the 13 hub genes, was extracted and established from the whole PPI network (Figure 7D). Functional enrichment analysis showed that SOCS3, IL6, FOXO1, CEBPB, SOX9, and PPARGC1A were mainly involved in the adipocytokine signaling pathway, insulin resistance, FoxO signaling pathway, AMPK signaling pathway, and PI3K-Akt signaling pathway. Notably, MYC, CEBPB, SOX9, and PPARGC1A were considered hub genes (transcription factors) affecting both traits, and their expression levels were significantly higher in the low group than in the high group. Subsequently, we queried the functions of these four hub genes on the GeneCard and PubMed website, and found that MYC, SOX9, and CEBPB are transcription factors. Meanwhile, it was found that SOX9 could bind to the CEBPB promoter, and CEBPB could bind to PPARGC1A to form a complex, thereby regulating fatty acid beta-oxidation. Thus, we hypothesized that the SOX9/CEBPB/PPARGC1A axis could co-regulate lipid metabolism and myoglobin redox response.
4. Discussion
DLY pork is dominated in the pork industry, however, its IFC is low, and the meat exhibits a paler color, resulting in limited competitiveness within the premium pork market segment [33,34]. As a result, breeders are eager to undertake genetic improvements in both IFC and redness (a*) meat color concurrently to cater to consumer market demands. In this study, a highly significant positive correlation (R = 0.309, P < 0.001) between IFC and the a* value was observed, which is similar to previous reports by Mortimer et al. [10] and Zhang et al. [11], where they discovered the correlation coefficients of IFC and a* value were 0.260 and 0.323, respectively. Those suggest that there might be similarities in the genetic background regulating changes in both IFC and redness value. Consequently, transcriptome analysis was conducted using the individuls with extreme IFC and a* value to identify hub genes and metabolic pathways co-regulating IFC and rendess of prok.
In the present study, we analyzed DEGs using three R packages, DESeq2, limma, and edgeR, in the H_IFC (H_a) and L_IFC (L_a) groups. We found that the number of DEGs obtained by these three methods was different, with the DESeq2 method obtaining the highest count of DEGs (723 and 590 DEGs in the IFC and a* groups, respectively), while the number of DEGs obtained by the limma and edgeR methods was similar. All three methods, limma, edgeR, and DESeq2, are widely used and well-established tools in transcriptome analysis. However, these three methods may yield different sets of DEGs due to variations in their statistical model, methods, and assumptions [35]. DESeq2 uses a negative binomial distribution [25], edgeR uses a negative binomial model with a dispersion parameter [27], and limma employs an empirical Bayes approach with linear modeling [26]. All methods could handle various experimental designs; limma was particularly well-suited for experiments with complex structures and might offer faster computation for medium to large datasets. DESeq2 and edgeR were well-suited for experiments with fewer replicates and small-sample size data. Moreover, each software employs its normalization methods. For example, DESeq2 used the "size factors" approach, edgeR used the "trimmed mean of M-values" (TMM), and limma employed a linear modeling-based approach [35]. Although there are some differences among the DEGs obtained by these three methods, the genes that contribute to the phenotypic variations should be stable and genuine rather than affected by variations in the detection methods. Consequently, we focused on the overlapping DEGs that were consistently detected by all three methods for subsequent functional enrichment analysis.
We performed functional enrichment analysis using the overlapping DEGs described above, which were closely related to lipolysis, adipocytokines, redox, and antioxidant responses, such as the adipocytokine signaling pathway, regulation of lipolysis in adipocytes, MAPK signaling pathway, and FoxO signaling pathway. These significantly enriched pathways played a crucial role in the process of IFC deposition and a* value changes. Because conventional functional enrichment analysis focuses only on DEGs, it might not provide a holistic view of the broader biological landscape. GSEA provided a comprehensive and holistic perspective on transcriptomic changes. By considering all genes rather than DEGs, GSEA offered the advantage of capturing subtle but coordinated expression patterns across the entire transcriptome. This approach helps identify biological pathways and processes that might contribute to observed changes, including those involving non-differentially expressed genes [36]. Compared to functional enrichment analysis based on DEGs, GSEA analysis specifically identified several enriched pathways associated with IFC deposition and a* value, such as fatty acid metabolism, glycosphingolipid biosynthesis, oxidoreductase activity, and oxidative phosphorylation. Similar to our results, Liu et al. [37] and Kim et al. [38] conducted GSEA in pigs and found significantly enriched pathways related to IFC and meat color, including the oxidative phosphorylation, AMPK, and MAPK signaling pathways.
WGCNA is a bioinformatics analysis technique utilized to depict gene correlation patterns among distinct samples, and facilitates clustering genes with highly similar expression patterns into specific modules, subsequently analyzing the associations between modules and particular traits or phenotypes [30]. This method has been successfully applied in the genetic analysis of various essential economic traits in pigs [13,39,40,41,42,43]. In this study, WGCNA was performed to detect the vital genes and modules associated with IFC and a* values using transcriptome data from 19 samples. The results of the WGCNA showed that the purple module demonstrated a positive correlation with both IFC and a* value. In contrast, the dark grey, dark red, and black modules exhibited negative correlations with IFC and a* value. These four modules contained a total of 6,045 genes encoding proteins. Based on the overlap analysis between the DEGs (DEGs of IFC and DEGs of a* value) and the WGCNA results, more than 70% of the DEGs could be detected by the WGCNA, indicating the similarity between these two analysis methods and further proving the reliability of the results of this study. However, some genes associated with IFC and a* value identified by WGCNA did not exhibit differential expression in high and low groups. This observation suggests that WGCNA could recognize additional information by establishing interconnected networks between genes, aligning well with the foundational principles of WGCNA. This was consistent with the findings of Xing et al. [13].
Both IFC and a* values are complex quantitative traits that may be regulated by multiple small-effect genes [44]. In the present study, differential gene expression analysis, WGCNA, and functional enrichment analysis under various conditions were performed. A large number of genes significantly associated with IFC and a* values were identified. However, as these two traits are both of medium to high heritability [5,6], it is hypothesized that large-effect genes regulating them may be existed. Furthermore, due to the significant correlation between these two traits, it is likely that there may also be molecular pathways that regulate them simultaneously. To effectively reduce the number of genes associated with IFC and a* values, we performed overlap analysis of significantly enriched GO terms and KEGG pathways derived from overlapping DEGs, GESA, and WGCNA. DEGs located in the overlapping GO terms and KEGG pathways affecting IFC and a* value were considered candidate genes. Two overlapping GO terms and eleven overlapping KEGG pathways were identified for IFC. Similarly, for the a* value, seven overlapping GO terms and ten overlapping KEGG pathways were identified. We focused on GO terms and pathways that may be involved in IFC deposition and a* value alterations, as shown in Table 2 and Table 3. Response to oxygen-containing compound (GO:1901700) was a GO term that was significantly enriched for both traits (Table 2). This biological process entails a modification in the state or activity of a cell or organism (involving aspects such as movement, secretion, enzyme production, gene expression, etc.) due to stimulation by an oxygen-containing compound. This process may directly or indirectly affect the oxidation of fatty acids and the redox reaction of myoglobin [45].
The IFC and a* value groups shared four significantly enriched pathways: the FoxO signaling pathway (ssc04068), adipocytokine signaling pathway (ssc04920), MAPK signaling pathway (ssc04010), and HIF-1 signaling pathway (ssc04066) (Table 3). The FoxO signaling pathway governs glucose and lipid metabolism by controlling genes associated with gluconeogenesis, glycogenolysis, and lipid metabolism [46]. It also impacts fatty acid oxidation and storage across diverse tissues [47]. Although the direct connection between the FoxO pathway and myoglobin oxidation is not extensively documented, it is conceivable that this pathway indirectly influences oxidative processes by regulating energy metabolism and responses to oxidative stress [48]. The adipocytokine signaling pathway is linked with adipocyte-related functions and metabolism. It modulates insulin sensitivity, glucose uptake, and lipid metabolism, affecting the release of adipokines that influence lipid homeostasis and inflammation [49]. This pathway likely indirectly affects myoglobin oxidation by influencing factors connected to metabolism and inflammation, thus potentially impacting oxidative processes in muscle tissues [50]. The MAPK signaling pathway is integral to various cellular processes, encompassing cell growth, differentiation, and metabolism. It can impact lipid metabolism by regulating genes related to lipogenesis, lipolysis, and fatty acid oxidation [51,52]. This pathway may contribute to muscle oxidative processes by mediating cellular reactions to stress, lipid peroxidation, and growth cues, thereby influencing myoglobin oxidation under specific conditions [53]. Activated in response to low oxygen levels, the HIF-1 signaling pathway orchestrates adaptive responses to hypoxia. It influences glycolysis, lipid, and energy metabolism when oxygen levels are low [54]. The HIF-1 pathway can affect myoglobin oxidation by regulating the response to hypoxia, potentially influencing oxidative metabolism and the role of myoglobin in oxygen transport and storage [55]. In summary, these pathways may play pivotal roles in both fatty acid metabolism and myoglobin oxidation.
The DEGs in Table 2 and Table 3 were considered candidate genes influencing IFC and a* values, and the PPI network was constructed (Figure 5), respectively. Based on the degree of connectivity, six genes (ATF3, SOX9, PPARGC1A, CEBPB, MYC, and VEGFA) with connectivity exceeding ten were regarded as hub genes potentially influencing IFC. Similarly, fourteen hub genes impacting the a* value were identified, including IL6, VEGFA, MYC, EGR1, CEBPB, JUNB, THBS1, SERPINE1, SOCS3, DUSP1, SOX9, PPARGC1A, CCL2, and FOXO1. ATF3 (activating transcription factor 3), a member of the CREB family of basic leucine zipper transcription factors (TFs), has been found that the deletion of ATF3 resulted in increased lipid body accumulation and ATF3 directly regulates transcription of the gene encoding cholesterol 25-hydroxylase [56]. VEGFA (vascular endothelial growth factor A) is crucial in vascular development in physiological and pathological processes. Increasing data suggest that VEGFA regulates lipid metabolism, but further studies are needed to elucidate the specific mechanisms [57,58]. IL6 (interleukin-6) is a pivotal regulatory factor for lipolysis and beta-oxidation. Numerous in vitro studies have substantiated that treatment with IL6 enhances lipolysis and beta-oxidation in both myotubes and adipocytes [59,60]. EGR1 (Early growth response 1) is a transcription factor. Mohtar et al. found that insulin/mTORC1-inducible EGR1 binds to the leptin promoter and activates leptin expression in 3T3-L1 adipocytes, regulating lipid metabolism [61]. The results of Yan et al. suggested that inhibition of JUNB might be a key indicator of the regulation of the APOA2-associated PPARα pathway [62]. APOA2 is a well-known member of the apolipoprotein family [63], and the PPARα pathway is also a key pathway in regulating lipid metabolism [64]. THBS1 (thrombospondin-1) is a prototypical matricellular protein. THBS1-null mice exhibited elevated free fatty acids and triglycerides compared to wild-type mice, suggesting impaired fatty acid uptake [65]. SERPINE1 (Serpin Family E Member 1), also known as plasminogen activator inhibitor type 1 (PAI-1), is a member of the serine proteinase inhibitor (serpin) superfamily. Several findings have shown that PAI-1 might promote the differentiation of mesenchymal stem cells toward adipogenesis, and PAI-1 deficiency attenuates changes in the levels of adipogenic genes such as PPARγ and aP2 [66,67]. SOCS3 (suppressor of cytokine signaling 3) plays an important role in regulating energy metabolism processes. In recent years, researchers have found that SOCS3 is involved in the AMPK signaling pathway, insulin resistance, adipocytokine signaling pathway, and JAK/STAT pathway and activated/triggered by leptin signal plays important roles in lipid metabolism processes [68,69,70]. DUSPs (dual-specificity phosphatases) are the key phosphatases in the MAPK pathway. Recently, DUSP1 was suggested to play a critical role in the switch from oxidative to glycolytic myofibers [71] and could regulate fatty acid oxidation [72]. CCL2 (chemokine ligand 2) is a member of the C–C motif family of chemokines. Kang et al. found that after CCL2 binds to its receptor CCR2, it could reduce lipid peroxidation by inhibiting CCR2, indicating its important regulatory role in lipid oxidation metabolism [72]. Current studies suggest that the transcription factor FOXO1 (forkhead box protein O1) is involved in lipid metabolism and lipolysis in adipocytes [73,74]. Song et al. found that interfering with FOXO1 negatively regulated the expression of adipogenic differentiation marker genes and lipid anabolism marker genes, thus reducing triglyceride content and inhibiting the generation of lipid droplets in bovine adipocytes [75].
It is worth noting that these two traits share four hub genes: MYC, CEBPB, SOX9, and PPARGC1A. MYC is a transcription factor that regulates cell proliferation and differentiation in healthy cellular processes. Hall et al. revealed that the activation of MYC led to the accumulation of cholesteryl esters stored in lipid droplets [76]. A previous study found that MYC was involved in the MAPK signaling pathway, promoting the glycolysis process in fish T cells [77]. In addition, MYC is involved in the WNT signaling pathway and serves as a target gene/transcriptome factor for WNT, regulating myogenesis [78]. CEBPB (CCAAT/enhancer binding protein β) is a member of the transcription factor family of CEBP. Several studies have reported that PPARGC1A (PPAR coactivator-1α, also known as PGC1α), a transcriptional co-activator of PPARγ, could bind to CEBPB and form a transcription complex. This complex could promote the transcription of CPT1A (carnitine palmitoyl transferase 1 A) and activate fatty acid β-oxidation [79,80]. SOX9 (Sex-determining region Y-type box-9) is a member of the Sox supergene family and has been proven to be an essential transcription factor in cartilage formation during chondrocyte proliferation [81]. Wang et al. confirmed that SOX9 could directly bind to the promoters of CEBPB and CEBPD, inhibit their promoter activity, and prevent adipocyte differentiation [82]. This evidence indicated that the SOX9/CEBPB/PPARGC1A axis might play an essential regulatory role in fatty acid β-oxidation. Myoglobin is an oxygen-binding hemeprotein generally localized to oxidative muscle and functions as an oxygen store and reactive oxygen species scavenger [83]. Schlater et al. confirmed that an increase in lipids could stimulate an increase in myoglobin content in muscle cells of C2C12 mice, which was closely related to fatty acid beta oxidation [84]. In summary, we speculated that the SOX9/CEBPB/PPARGC1A axis played a vital role in the co-regulation of IFC deposition and changes in redness of meat color. The expression levels of the upstream gene STAT3 (signal transducer and activator of transcription 3) and downstream CPT1A genes in the SOX9/CEBPB/PPARGC1A axis were also significantly different in both the high and low groups in this study, further supporting the importance of this pathway in the synergistic regulation of lipid and myoglobin metabolism. Thererore, it is particularly interesting to investigate the co-regulatory mechanism of the SOX9/CEBPB/PPARGC1A axis in IFC and a* value traits in further studies.
5. Conclusions
In this study, we identified six hub genes influencing IFC and 14 hub genes affecting a* value through integrating differential gene expression analysis, WGCNA, functional enrichment under various conditions, and PPI network analysis. These genes maninly participate in multiple lipid and myoglobin metabolism pathways. Moreover, we discovered that the SOX9/CEBPB/PPARGC1A axis is the potential pathway co-regulating lipid deposition and myoglobin redox reaction. These hub genes and the SOX9/CEBPB/PPARGC1A axis may critical for IFC and a* value, however, the functions and regulatory mechanism of these hub genes, particularly the SOX9/CEBPB/PPARGC1A axis, are still need to be further elucidated.
Supplementary Materials
The following supporting information can be downloaded at the website of this paper posted on Preprints.org.
Author Contributions
Writing – original draft preparation, B.W.; conceptualization, Z.X. and W.W.; investigation, B.W. and W.Y.; methodology and data analysis, B.W.; writing – review & editing, L.H., X.M., Z.X., and W.W. All authors have read and agreed to the published version of the manuscript.
Funding
This work was financially supported by the National Natural Science Foundation of China (grant no. 32302695), the Project of Seed Industry Revitalization in Jiangsu Province (JBGS2021024), the Zhejiang Science and Technology Major Program on Agricultural New Variety Breeding (2021C02068), the Key R & D projects of Zhejiang Province (2021C02007), and the China Agriculture Research System of MOF and MARA (CARS36).
Institutional Review Board Statement
All experimental protocols involving animals were approved by the Nanjing Agricultural University Animal Care and Use Committee (Certification No.: SYXK (Su) 2022-0031).
Informed Consent Statement
Not applicable.
Data Availability Statement
Not applicable.
Conflicts of Interest
The authors declare no conflict of interest.
References
- Duan, S.; Tang, X.; Li, W.; Huang, X. Analysis of the Differences in Volatile Organic Compounds in Different Muscles of Pork by GC-IMS. Molecules 2023, 28, 1726. [Google Scholar] [CrossRef] [PubMed]
- Moeller, S.J.; Miller, R.K.; Edwards, K.K.; Zerby, H.N.; Logan, K.E.; Aldredge, T.L.; Stahl, C.A.; Boggess, M.; Box-Steffensmeier, J.M. Consumer Perceptions of Pork Eating Quality as Affected by Pork Quality Attributes and End-Point Cooked Temperature. Meat Sci. 2010, 84, 14–22. [Google Scholar] [CrossRef] [PubMed]
- Liu, S.; Huang, J.; Wang, X.; Ma, Y. Transcription Factors Regulate Adipocyte Differentiation in Beef Cattle. Anim. Genet. 2020, 51, 351–357. [Google Scholar] [CrossRef]
- Sun, X.; Young, J.; Liu, J.H.; Bachmeier, L.; Somers, R.M.; Chen, K.J.; Newman, D. Prediction of Pork Color Attributes Using Computer Vision System. Meat Sci. 2016, 113, 62–64. [Google Scholar] [CrossRef] [PubMed]
- Wang, B.; Li, P.; Hou, L.; Zhou, W.; Tao, W.; Liu, C.; Liu, K.; Niu, P.; Zhang, Z.; Li, Q.; et al. Genome-Wide Association Study and Genomic Prediction for Intramuscular Fat Content in Suhuai Pigs Using Imputed Whole-Genome Sequencing Data. Evol. Appl. 2022, 15, 2054–2066. [Google Scholar] [CrossRef] [PubMed]
- Cabling, M.M.; Kang, H.S.; Lopez, B.M.; Jang, M.; Kim, H.S.; Nam, K.C.; Choi, J.G.; Seo, K.S. Estimation of Genetic Associations between Production and Meat Quality Traits in Duroc Pigs. Asian-Australasian J. Anim. Sci. 2015, 28, 1061–1065. [Google Scholar] [CrossRef] [PubMed]
- Shi-Zheng, G.; Su-Mei, Z. Physiology, Affecting Factors and Strategies for Control of Pig Meat Intramuscular Fat. Recent Pat. Food. Nutr. Agric. 2009, 1, 59–74. [Google Scholar] [CrossRef]
- Fernandez, X.; Monin, G.; Talmant, A.; Mourot, J.; Lebret, B. Influence of Intramuscular Fat Content on the Quality of Pig Meat — 1 Composition of the Lipid Fraction and Sensory Characteristics of m Longissimus Lumborum. Meat Sci. 1999, 53, 59–65. [Google Scholar] [CrossRef]
- Kim, G.-D.; Jeong, J.-Y.; Hur, S.-J.; Yang, H.-S.; Jeon, J.-T.; Joo, S.-T. The Relationship between Meat Color (CIE L* and A*), Myoglobin Content, and Their Influence on Muscle Fiber Characteristics and Pork Quality. Food Sci. Anim. Resour. 2010, 30, 626–633. [Google Scholar] [CrossRef]
- Mortimer, S.I.; van der Werf, J.H.J.; Jacob, R.H.; Hopkins, D.L.; Pannier, L.; Pearce, K.L.; Gardner, G.E.; Warner, R.D.; Geesink, G.H.; Hocking Edwards, J.E.; et al. Genetic Parameters for Meat Quality Traits of Australian Lamb Meat. Meat Sci. 2014, 96, 1016–1024. [Google Scholar] [CrossRef]
- Zhang, X.; Liu, C.; Kong, Y.; Li, F.; Yue, X. Effects of Intramuscular Fat on Meat Quality and Its Regulation Mechanism in Tan Sheep. Front. Nutr. 2022, 9, 1–13. [Google Scholar] [CrossRef] [PubMed]
- Cardoso, T.F.; Cánovas, A.; Canela-Xandri, O.; González-Prendes, R.; Amills, M.; Quintanilla, R. RNA-Seq Based Detection of Differentially Expressed Genes in the Skeletal Muscle of Duroc Pigs with Distinct Lipid Profiles. Sci. Rep. 2017, 7, 40005. [Google Scholar] [CrossRef] [PubMed]
- Xing, K.; Liu, H.; Zhang, F.; Liu, Y.; Shi, Y.; Ding, X.; Wang, C. Identification of Key Genes Affecting Porcine Fat Deposition Based on Co-Expression Network Analysis of Weighted Genes. J. Anim. Sci. Biotechnol. 2021, 12, 1–16. [Google Scholar] [CrossRef]
- Fernández-Barroso, M.Á.; García-Casco, J.M.; Núñez, Y.; Ramírez-Hidalgo, L.; Matos, G.; Muñoz, M. Understanding the Role of Myoglobin Content in Iberian Pigs Fattened in an Extensive System through Analysis of the Transcriptome Profile. Anim. Genet. 2022, 53, 352–367. [Google Scholar] [CrossRef] [PubMed]
- Xing, K.; Liu, H.; Zhang, F.; Liu, Y.; Shi, Y.; Ding, X.; Wang, C. Identification of Key Genes Affecting Porcine Fat Deposition Based on Co-Expression Network Analysis of Weighted Genes. J. Anim. Sci. Biotechnol. 2021, 12, 100. [Google Scholar] [CrossRef] [PubMed]
- Barabasi, A.-L.; Oltvai, Z.N. Network Biology: Understanding the Cell’s Functional Organization. Nat. Rev. Genet. 2004, 5, 101–113. [Google Scholar] [CrossRef]
- Talukdar, H.A.; Asl, H.F.; Jain, R.K.; Ermel, R.; Ruusalepp, A.; Franzén, O.; Kidd, B.A.; Readhead, B.; Giannarelli, C.; Kovacic, J.C. Cross-Tissue Regulatory Gene Networks in Coronary Artery Disease. Cell Syst. 2016, 2, 196–208. [Google Scholar] [CrossRef]
- Zhang, B.; Horvath, S. A General Framework for Weighted Gene Co-Expression Network Analysis. Stat. Appl. Genet. Mol. Biol. 2005, 4. [Google Scholar] [CrossRef]
- Zhao, X.; Wang, C.; Wang, Y.; Zhou, L.; Hu, H.; Bai, L.; Wang, J. Weighted Gene Co-Expression Network Analysis Reveals Potential Candidate Genes Affecting Drip Loss in Pork. Anim. Genet. 2020, 51, 855–865. [Google Scholar] [CrossRef]
- Wu, Z.; Gao, Z.; Liang, H.; Fang, T.; Wang, Y.; Du, Z.; Yang, C. Network Analysis Reveals Different Hub Genes and Molecular Pathways for Pig in Vitro Fertilized Early Embryos and Parthenogenotes. Reprod. Domest. Anim. 2022, 57, 1544–1553. [Google Scholar] [CrossRef]
- Supakankul, P.; Mekchay, S. Association of NLK Polymorphisms with Intramuscular Fat Content and Fatty Acid Composition Traits in Pigs. Meat Sci. 2016, 118, 61–65. [Google Scholar] [CrossRef] [PubMed]
- Bolger, A.M.; Lohse, M.; Usadel, B. Trimmomatic: A Flexible Trimmer for Illumina Sequence Data. Bioinformatics 2014, 30, 2114–2120. [Google Scholar] [CrossRef] [PubMed]
- Dobin, A.; Davis, C.A.; Schlesinger, F.; Drenkow, J.; Zaleski, C.; Jha, S.; Batut, P.; Chaisson, M.; Gingeras, T.R. STAR: Ultrafast Universal RNA-Seq Aligner. Bioinformatics 2013, 29, 15–21. [Google Scholar] [CrossRef] [PubMed]
- Liao, Y.; Smyth, G.K.; Shi, W. FeatureCounts: An Efficient General Purpose Program for Assigning Sequence Reads to Genomic Features. Bioinformatics 2014, 30, 923–930. [Google Scholar] [CrossRef] [PubMed]
- Love, M.I.; Huber, W.; Anders, S. Moderated Estimation of Fold Change and Dispersion for RNA-Seq Data with DESeq2. Genome Biol. 2014, 15, 550. [Google Scholar] [CrossRef] [PubMed]
- Ritchie, M.E.; Phipson, B.; Wu, D.I.; Hu, Y.; Law, C.W.; Shi, W.; Smyth, G.K. Limma Powers Differential Expression Analyses for RNA-Sequencing and Microarray Studies. Nucleic Acids Res. 2015, 43, 4. [Google Scholar] [CrossRef]
- Robinson, M.D.; McCarthy, D.J.; Smyth, G.K. EdgeR: A Bioconductor Package for Differential Expression Analysis of Digital Gene Expression Data. Bioinformatics 2010, 26, 139–140. [Google Scholar] [CrossRef]
- Haider, S.; Ballester, B.; Smedley, D.; Zhang, J.; Rice, P.; Kasprzyk, A. BioMart Central Portal—Unified Access to Biological Data. Nucleic Acids Res. 2009, 37, 23–27. [Google Scholar] [CrossRef]
- Wu, T.; Hu, E.; Xu, S.; Chen, M.; Guo, P.; Dai, Z.; Feng, T.; Zhou, L.; Tang, W.; Zhan, L. ClusterProfiler 40: A Universal Enrichment Tool for Interpreting Omics Data. Innov. 2021, 2, 100141. [Google Scholar] [CrossRef]
- Langfelder, P.; Horvath, S. WGCNA: An R Package for Weighted Correlation Network Analysis. BMC Bioinformatics 2008, 9, 559. [Google Scholar] [CrossRef]
- Szklarczyk, D.; Franceschini, A.; Wyder, S.; Forslund, K.; Heller, D.; Huerta-Cepas, J.; Simonovic, M.; Roth, A.; Santos, A.; Tsafou, K.P.; et al. STRING V10: Protein–Protein Interaction Networks, Integrated over the Tree of Life. Nucleic Acids Res. 2015, 43, 447–452. [Google Scholar] [CrossRef] [PubMed]
- Shannon, P.; Markiel, A.; Ozier, O.; Baliga, N.S.; Wang, J.T.; Ramage, D.; Amin, N.; Schwikowski, B.; Ideker, T. Cytoscape: A Software Environment for Integrated Models of Biomolecular Interaction Networks. Genome Res. 2003, 13, 2498–2504. [Google Scholar] [CrossRef] [PubMed]
- Chen, W.; Zeng, Q.; Xu, H.; Fang, G.; Wang, S.; Li, C.; Wang, Y.; Wang, H.; Zeng, Y. Comparison and Relationship between Meat Colour and Antioxidant Capacity of Different Pig Breeds. Anim. Prod. Sci. 2018, 58, 2152–2157. [Google Scholar] [CrossRef]
- Wang, H.; Wang, J.; Yang, D.; Liu, Z.; Zeng, Y.; Chen, W. Expression of Lipid Metabolism Genes Provides New Insights into Intramuscular Fat Deposition in Laiwu Pigs. Asian-Australasian J. Anim. Sci. 2020, 33, 390–397. [Google Scholar] [CrossRef] [PubMed]
- Liu, S.; Wang, Z.; Zhu, R.; Wang, F.; Cheng, Y.; Liu, Y. Three Differential Expression Analysis Methods for RNA Sequencing: Limma, EdgeR, DESeq2. JoVE Journal Vis. Exp. 2021, e62528. [Google Scholar] [CrossRef]
- Subramanian, A.; Tamayo, P.; Mootha, V.K.; Mukherjee, S.; Ebert, B.L.; Gillette, M.A.; Paulovich, A.; Pomeroy, S.L.; Golub, T.R.; Lander, E.S. Gene Set Enrichment Analysis: A Knowledge-Based Approach for Interpreting Genome-Wide Expression Profiles. Proc. Natl. Acad. Sci. 2005, 102, 15545–15550. [Google Scholar] [CrossRef] [PubMed]
- Liu, Y.; Long, H.; Feng, S.; Ma, T.; Wang, M.; Niu, L.; Zhang, X.; Wang, L.; Lei, Y.; Chen, Y.; et al. Trait Correlated Expression Combined with EQTL and ASE Analyses Identified Novel Candidate Genes Affecting Intramuscular Fat. BMC Genomics 2021, 22, 805. [Google Scholar] [CrossRef]
- Kim, S.-M.; Markkandan, K.; Lee, J.-Y.; Kim, G.-W.; Yoo, J.Y. Transcriptome Profiling Associated with Carcass Quality of Loin Muscles in Crossbred Pigs. Animals 2020, 10. [Google Scholar] [CrossRef]
- Gong, Y.; He, J.; Li, B.; Xiao, Y.; Zeng, Q.; Xu, K.; Duan, Y.; He, J.; Ma, H. Integrated Analysis of Lncrna and Mrna in Subcutaneous Adipose Tissue of Ningxiang Pig. Biology (Basel). 2021, 10, 1–22. [Google Scholar] [CrossRef]
- Liu, X.; Zhang, J.; Xiong, X.; Chen, C.; Xing, Y.; Duan, Y.; Xiao, S.; Yang, B.; Ma, J. An Integrative Analysis of Transcriptome and GWAS Data to Identify Potential Candidate Genes Influencing Meat Quality Traits in Pigs. Front. Genet. 2021, 12, 1–13. [Google Scholar] [CrossRef]
- Wang, H.; Wang, X.; Li, M.; Wang, S.; Chen, Q.; Lu, S. Identification of Key Sex-Specific Pathways and Genes in the Subcutaneous Adipose Tissue from Pigs Using WGCNA Method. BMC Genomic Data 2022, 23, 1–13. [Google Scholar] [CrossRef] [PubMed]
- Zhang, P.; Li, Q.; Wu, Y.; Zhang, Y.; Zhang, B.; Zhang, H. Identification of Candidate Genes That Specifically Regulate Subcutaneous and Intramuscular Fat Deposition Using Transcriptomic and Proteomic Profiles in Dingyuan Pigs. Sci. Rep. 2022, 12, 1–13. [Google Scholar] [CrossRef] [PubMed]
- Zappaterra, M.; Gioiosa, S.; Chillemi, G.; Zambonelli, P.; Davoli, R. Muscle Transcriptome Analysis Identifies Genes Involved in Ciliogenesis and the Molecular Cascade Associated with Intramuscular Fat Content in Large White Heavy Pigs. PLoS One 2020, 15, 1–29. [Google Scholar] [CrossRef] [PubMed]
- Liu, X.; Zhou, L.; Xie, X.; Wu, Z.; Xiong, X.; Zhang, Z.; Yang, J.; Xiao, S.; Zhou, M.; Ma, J.; et al. Muscle Glycogen Level and Occurrence of Acid Meat in Commercial Hybrid Pigs Are Regulated by Two Low-Frequency Causal Variants with Large Effects and Multiple Common Variants with Small Effects. Genet. Sel. Evol. 2019, 51, 1–16. [Google Scholar] [CrossRef] [PubMed]
- Freitas, A.A. Investigating the Role of Simpson’s Paradox in the Analysis of Top-Ranked Features in High-Dimensional Bioinformatics Datasets. Brief. Bioinform. 2020, 21, 421–428. [Google Scholar] [CrossRef]
- Lee, S.; Dong, H.H. FoxO Integration of Insulin Signaling with Glucose and Lipid Metabolism. J. Endocrinol. 2017, 233, 67–79. [Google Scholar] [CrossRef]
- Chen, S.; Lu, Z.; Jia, H.; Yang, B.; Liu, C.; Yang, Y.; Zhang, S.; Wang, Z.; Yang, L.; Li, S.; et al. Hepatocyte-Specific Mas Activation Enhances Lipophagy and Fatty Acid Oxidation to Protect against Acetaminophen-Induced Hepatotoxicity in Mice. J. Hepatol. 2023, 78, 543–557. [Google Scholar] [CrossRef]
- Egan, B.; Zierath, J.R. Exercise Metabolism and the Molecular Regulation of Skeletal Muscle Adaptation. Cell Metab. 2013, 17, 162–184. [Google Scholar] [CrossRef]
- Gu, H.; Li, J.; Ying, F.; Zuo, B.; Xu, Z. Analysis of Differential Gene Expression of the Transgenic Pig with Overexpression of PGC1α in Muscle. Mol. Biol. Rep. 2019, 46, 3427–3435. [Google Scholar] [CrossRef]
- Jorge, M.L.M.P.; de Oliveira, V.N.; Resende, N.M.; Paraiso, L.F.; Calixto, A.; Diniz, A.L.D.; Resende, E.S.; Ropelle, E.R.; Carvalheira, J.B.; Espindola, F.S.; et al. The Effects of Aerobic, Resistance, and Combined Exercise on Metabolic Control, Inflammatory Markers, Adipocytokines, and Muscle Insulin Signaling in Patients with Type 2 Diabetes Mellitus. Metabolism 2011, 60, 1244–1252. [Google Scholar] [CrossRef]
- Bost, F.; Aouadi, M.; Caron, L.; Even, P.; Belmonte, N.; Prot, M.; Dani, C.; Hofman, P.; Pagès, G.; Pouysségur, J.; et al. The Extracellular Signal–Regulated Kinase Isoform ERK1 Is Specifically Required for In Vitro and In Vivo Adipogenesis. Diabetes 2005, 54, 402–411. [Google Scholar] [CrossRef] [PubMed]
- Zhang, Q.; Sun, X.; Xiao, X.; Zheng, J.; Li, M.; Yu, M.; Ping, F.; Wang, Z.; Qi, C.; Wang, T.; et al. Effects of Maternal Chromium Restriction on the Long-Term Programming in MAPK Signaling Pathway of Lipid Metabolism in Mice. Nutrients 2016, 8. [Google Scholar] [CrossRef] [PubMed]
- Xu, L.; Zhang, H.; Yue, H.; Wu, S.; Yang, H.; Wang, Z.; Qi, G. Gas Stunning with CO2 Affected Meat Color, Lipid Peroxidation, Oxidative Stress, and Gene Expression of Mitogen-Activated Protein Kinases, Glutathione S-Transferases, and Cu/Zn-Superoxide Dismutase in the Skeletal Muscles of Broilers. J. Anim. Sci. Biotechnol. 2018, 9, 37. [Google Scholar] [CrossRef] [PubMed]
- Zhang, W.; Han, B.; Zhang, H.; Fu, R.; Lu, Y.; Zhang, G. Integrated Transcriptomic and Metabolomic Analysis of Cortical Neurons Reveals Dysregulated Lipid Metabolism, Enhanced Glycolysis and Activated HIF-1 Signaling Pathways in Acute Hypoxia. Heliyon 2023, 9, e14949. [Google Scholar] [CrossRef]
- Elkholi, I.E.; Elsherbiny, M.E.; Emara, M. Myoglobin: From Physiological Roles to Potential Implications in Cancer. Biochim. Biophys. Acta - Rev. Cancer 2022, 1877, 188706. [Google Scholar] [CrossRef]
- Gold, E.S.; Ramsey, S.A.; Sartain, M.J.; Selinummi, J.; Podolsky, I.; Rodriguez, D.J.; Moritz, R.L.; Aderem, A. ATF3 Protects against Atherosclerosis by Suppressing 25-Hydroxycholesterol–Induced Lipid Body Formation. J. Exp. Med. 2012, 209, 807–817. [Google Scholar] [CrossRef]
- Heinonen, S.E.; Kivelä, A.M.; Huusko, J.; Dijkstra, M.H.; Gurzeler, E.; Mäkinen, P.I.; Leppänen, P.; Olkkonen, V.M.; Eriksson, U.; Jauhiainen, M.; et al. The Effects of VEGF-A on Atherosclerosis, Lipoprotein Profile, and Lipoprotein Lipase in Hyperlipidaemic Mouse Models. Cardiovasc. Res. 2013, 99, 716–723. [Google Scholar] [CrossRef]
- Stathopoulou, M.G.; Bonnefond, A.; Ndiaye, N.C.; Azimi-Nezhad, M.; El Shamieh, S.; Saleh, A.; Rancier, M.; Siest, G.; Lamont, J.; Fitzgerald, P. A Common Variant Highly Associated with Plasma VEGFA Levels Also Contributes to the Variation of Both LDL-C and HDL-C. J. Lipid Res. 2013, 54, 535–541. [Google Scholar] [CrossRef]
- Al-Khalili, L.; Bouzakri, K.; Glund, S.; Lönnqvist, F.; Koistinen, H.A.; Krook, A. Signaling Specificity of Interleukin-6 Action on Glucose and Lipid Metabolism in Skeletal Muscle. Mol. Endocrinol. 2006, 20, 3364–3375. [Google Scholar] [CrossRef]
- Carey, A.L.; Steinberg, G.R.; Macaulay, S.L.; Thomas, W.G.; Holmes, A.G.; Ramm, G.; Prelovsek, O.; Hohnen-Behrens, C.; Watt, M.J.; James, D.E. Interleukin-6 Increases Insulin-Stimulated Glucose Disposal in Humans and Glucose Uptake and Fatty Acid Oxidation in Vitro via AMP-Activated Protein Kinase. Diabetes 2006, 55, 2688–2697. [Google Scholar] [CrossRef]
- Mohtar, O.; Ozdemir, C.; Roy, D.; Shantaram, D.; Emili, A.; Kandror, K. V Egr1 Mediates the Effect of Insulin on Leptin Transcription in Adipocytes. J. Biol. Chem. 2019, 294, 5784–5789. [Google Scholar] [CrossRef] [PubMed]
- Yan, P.; Zhou, B.; Ma, Y.; Wang, A.; Hu, X.; Luo, Y.; Yuan, Y.; Wei, Y.; Pang, P.; Mao, J. Tracking the Important Role of JUNB in Hepatocellular Carcinoma by Single-cell Sequencing Analysis. Oncol Lett 2020, 19, 1478–1486. [Google Scholar] [CrossRef] [PubMed]
- Ballester, M.; Revilla, M.; Puig-Oliveras, A.; Marchesi, J.A.P.; Castelló, A.; Corominas, J.; Fernández, A.I.; Folch, J.M. Analysis of the Porcine APOA2 Gene Expression in Liver, Polymorphism Identification and Association with Fatty Acid Composition Traits. Anim. Genet. 2016, 47, 552–559. [Google Scholar] [CrossRef]
- Lefebvre, P.; Chinetti, G.; Fruchart, J.-C.; Staels, B. Sorting out the Roles of PPARα in Energy Metabolism and Vascular Homeostasis. J. Clin. Invest. 2006, 116, 571–580. [Google Scholar] [CrossRef]
- Kong, P.; Gonzalez-Quesada, C.; Li, N.; Cavalera, M.; Lee, D.-W.; Frangogiannis, N.G. Thrombospondin-1 Regulates Adiposity and Metabolic Dysfunction in Diet-Induced Obesity Enhancing Adipose Inflammation and Stimulating Adipocyte Proliferation. Am. J. Physiol. Metab. 2013, 305, 439–450. [Google Scholar] [CrossRef] [PubMed]
- Tamura, Y.; Kawao, N.; Okada, K.; Yano, M.; Okumoto, K.; Matsuo, O.; Kaji, H. Plasminogen Activator Inhibitor-1 Is Involved in Streptozotocin-Induced Bone Loss in Female Mice. Diabetes 2013, 62, 3170–3179. [Google Scholar] [CrossRef]
- Hu, Q.; Peng, J.; Chen, X.; Li, H.; Song, M.; Cheng, B.; Wu, T. Obesity and Genes Related to Lipid Metabolism Predict Poor Survival in Oral Squamous Cell Carcinoma. Oral Oncol. 2019, 89, 14–22. [Google Scholar] [CrossRef]
- Yang, X.; Jia, J.; Yu, Z.; Duanmu, Z.; He, H.; Chen, S.; Qu, C. Inhibition of JAK2/STAT3/SOCS3 Signaling Attenuates Atherosclerosis in Rabbit. BMC Cardiovasc. Disord. 2020, 20, 133. [Google Scholar] [CrossRef]
- Fang, S.; Feng, J.; Zhang, H.; Li, P.; Zhang, Y.; Zeng, Y.; Cai, Y.; Lin, X.; Xue, Y.; Guan, M. MiR-455 Targeting SOCS3 Improve Liver Lipid Disorders in Diabetic Mice. Adipocyte 2020, 9, 179–188. [Google Scholar] [CrossRef]
- Liu, Z.; Gan, L.; Yang, X.; Zhang, Z.; Sun, C. Hydrodynamic Tail Vein Injection of SOCS3 Eukaryotic Expression Vector in Vivo Promoted Liver Lipid Metabolism and Hepatocyte Apoptosis in Mouse. Biochem. Cell Biol. 2014, 92, 119–125. [Google Scholar] [CrossRef]
- Flach, R.J.R.; Qin, H.; Zhang, L.; Bennett, A.M. Loss of Mitogen-Activated Protein Kinase Phosphatase-1 Protects from Hepatic Steatosis by Repression of Cell Death-Inducing DNA Fragmentation Factor A (DFFA)-like Effector C (CIDEC)/Fat-Specific Protein 27*. J. Biol. Chem. 2011, 286, 22195–22202. [Google Scholar] [CrossRef]
- Roth, R.J.; Le, A.M.; Zhang, L.; Kahn, M.; Samuel, V.T.; Shulman, G.I.; Bennett, A.M. MAPK Phosphatase-1 Facilitates the Loss of Oxidative Myofibers Associated with Obesity in Mice. J. Clin. Invest. 2009, 119, 3817–3829. [Google Scholar] [CrossRef] [PubMed]
- Chakrabarti, P.; Kandror, K. V FoxO1 Controls Insulin-Dependent Adipose Triglyceride Lipase (ATGL) Expression and Lipolysis in Adipocytes*. J. Biol. Chem. 2009, 284, 13296–13300. [Google Scholar] [CrossRef] [PubMed]
- Chakrabarti, P.; English, T.; Karki, S.; Qiang, L.; Tao, R.; Kim, J.; Luo, Z.; Farmer, S.R.; Kandror, K. V SIRT1 Controls Lipolysis in Adipocytes via FOXO1-Mediated Expression of ATGL. J. Lipid Res. 2011, 52, 1693–1701. [Google Scholar] [CrossRef] [PubMed]
- Song, Y.; Zhang, J.; Jiang, C.; Song, X.; Wu, H.; Zhang, J.; Raza, S.H.A.; Zhang, L.; Zhang, L.; Cai, B.; et al. FOXO1 Regulates the Formation of Bovine Fat by Targeting CD36 and STEAP4. Int. J. Biol. Macromol. 2023, 248, 126025. [Google Scholar] [CrossRef]
- Hall, Z.; Wilson, C.H.; Burkhart, D.L.; Ashmore, T.; Evan, G.I.; Griffin, J.L. Myc Linked to Dysregulation of Cholesterol Transport and Storage in Nonsmall Cell Lung Cancer. J. Lipid Res. 2020, 61, 1390–1399. [Google Scholar] [CrossRef]
- Wei, X.; Zhang, Y.; Li, C.; Ai, K.; Li, K.; Li, H.; Yang, J. The Evolutionarily Conserved MAPK/Erk Signaling Promotes Ancestral T-Cell Immunity in Fish via c-Myc–Mediated Glycolysis. J. Biol. Chem. 2020, 295, 3000–3016. [Google Scholar] [CrossRef]
- Karczewska-Kupczewska, M.; Stefanowicz, M.; Matulewicz, N.; Nikołajuk, A.; Strączkowski, M. Wnt Signaling Genes in Adipose Tissue and Skeletal Muscle of Humans With Different Degrees of Insulin Sensitivity. J. Clin. Endocrinol. Metab. 2016, 101, 3079–3087. [Google Scholar] [CrossRef]
- Du, Q.; Tan, Z.; Shi, F.; Tang, M.; Xie, L.; Zhao, L.; Li, Y.; Hu, J.; Zhou, M.; Bode, A.; et al. PGC1α/CEBPB/CPT1A Axis Promotes Radiation Resistance of Nasopharyngeal Carcinoma through Activating Fatty Acid Oxidation. Cancer Sci. 2019, 110, 2050–2062. [Google Scholar] [CrossRef]
- Wu, H.; Liu, B.; Chen, Z.; Li, G.; Zhang, Z. MSC-Induced LncRNA HCP5 Drove Fatty Acid Oxidation through MiR-3619-5p/AMPK/PGC1α/CEBPB Axis to Promote Stemness and Chemo-Resistance of Gastric Cancer. Cell Death Dis. 2020, 11, 233. [Google Scholar] [CrossRef]
- Akiyama, H. Control of Chondrogenesis by the Transcription Factor Sox9. Mod. Rheumatol. 2008, 18, 213–219. [Google Scholar] [CrossRef] [PubMed]
- Wang, Y.; Sul, H.S. Pref-1 Regulates Mesenchymal Cell Commitment and Differentiation through Sox9. Cell Metab. 2009, 9, 287–302. [Google Scholar] [CrossRef] [PubMed]
- Gödecke, A. Myoglobin: safeguard of myocardial oxygen supply during systolic compression? Cardiovasc. Res. 2010, 87, 4–5. [Google Scholar] [CrossRef] [PubMed]
- Schlater, A.E.; De Miranda Jr, M.A.; Frye, M.A.; Trumble, S.J.; Kanatous, S.B. Changing the Paradigm for Myoglobin: A Novel Link between Lipids and Myoglobin. J. Appl. Physiol. 2014, 117, 307–315. [Google Scholar] [CrossRef] [PubMed]
Figure 1.
Statistical analysis of intramuscular fat content (IFC) and meat color redness (a*) values. (A) Phenotypic values of IFC and a* value. (B) Correlation analysis of IFC and a* value.
Figure 1.
Statistical analysis of intramuscular fat content (IFC) and meat color redness (a*) values. (A) Phenotypic values of IFC and a* value. (B) Correlation analysis of IFC and a* value.
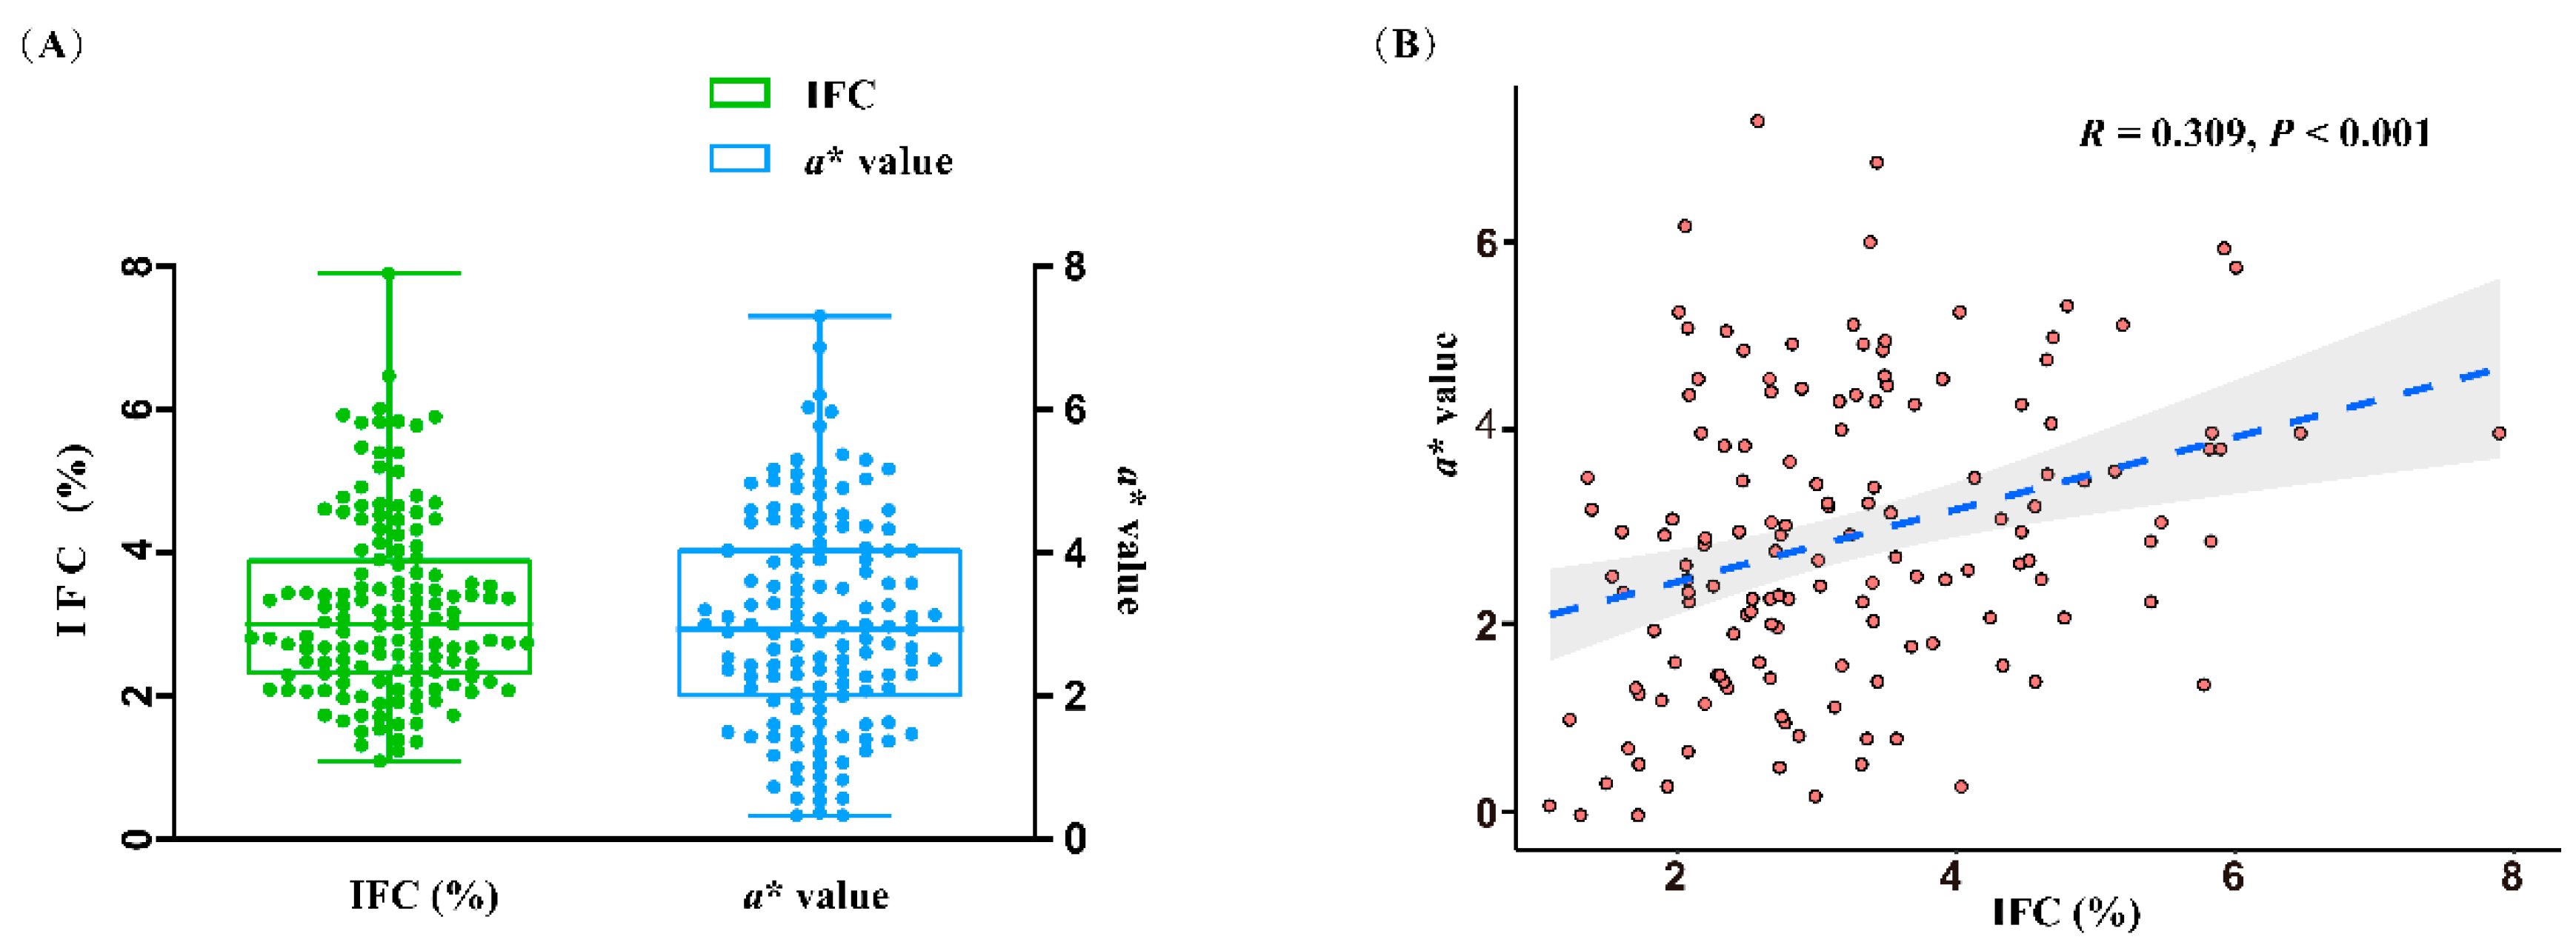
Figure 2.
IFC and a* value comparasion between the high and low groups. (A) Representative plots of latissimus dorsi (LD) tissue and H&E staining of shared samples from the low IFC group and low a* group. (B) Representative plots of LD tissue and H&E staining of shared samples from the high IFC group and high a* group. (C) Comparasion of IFC and a* value in different groups. Error bars represent standard deviation (SD), where yellow bar represents IFC and blue bar represents a* value. *P < 0.05, **P < 0.01, ***P < 0.001, two-tailed Student’s t-test.
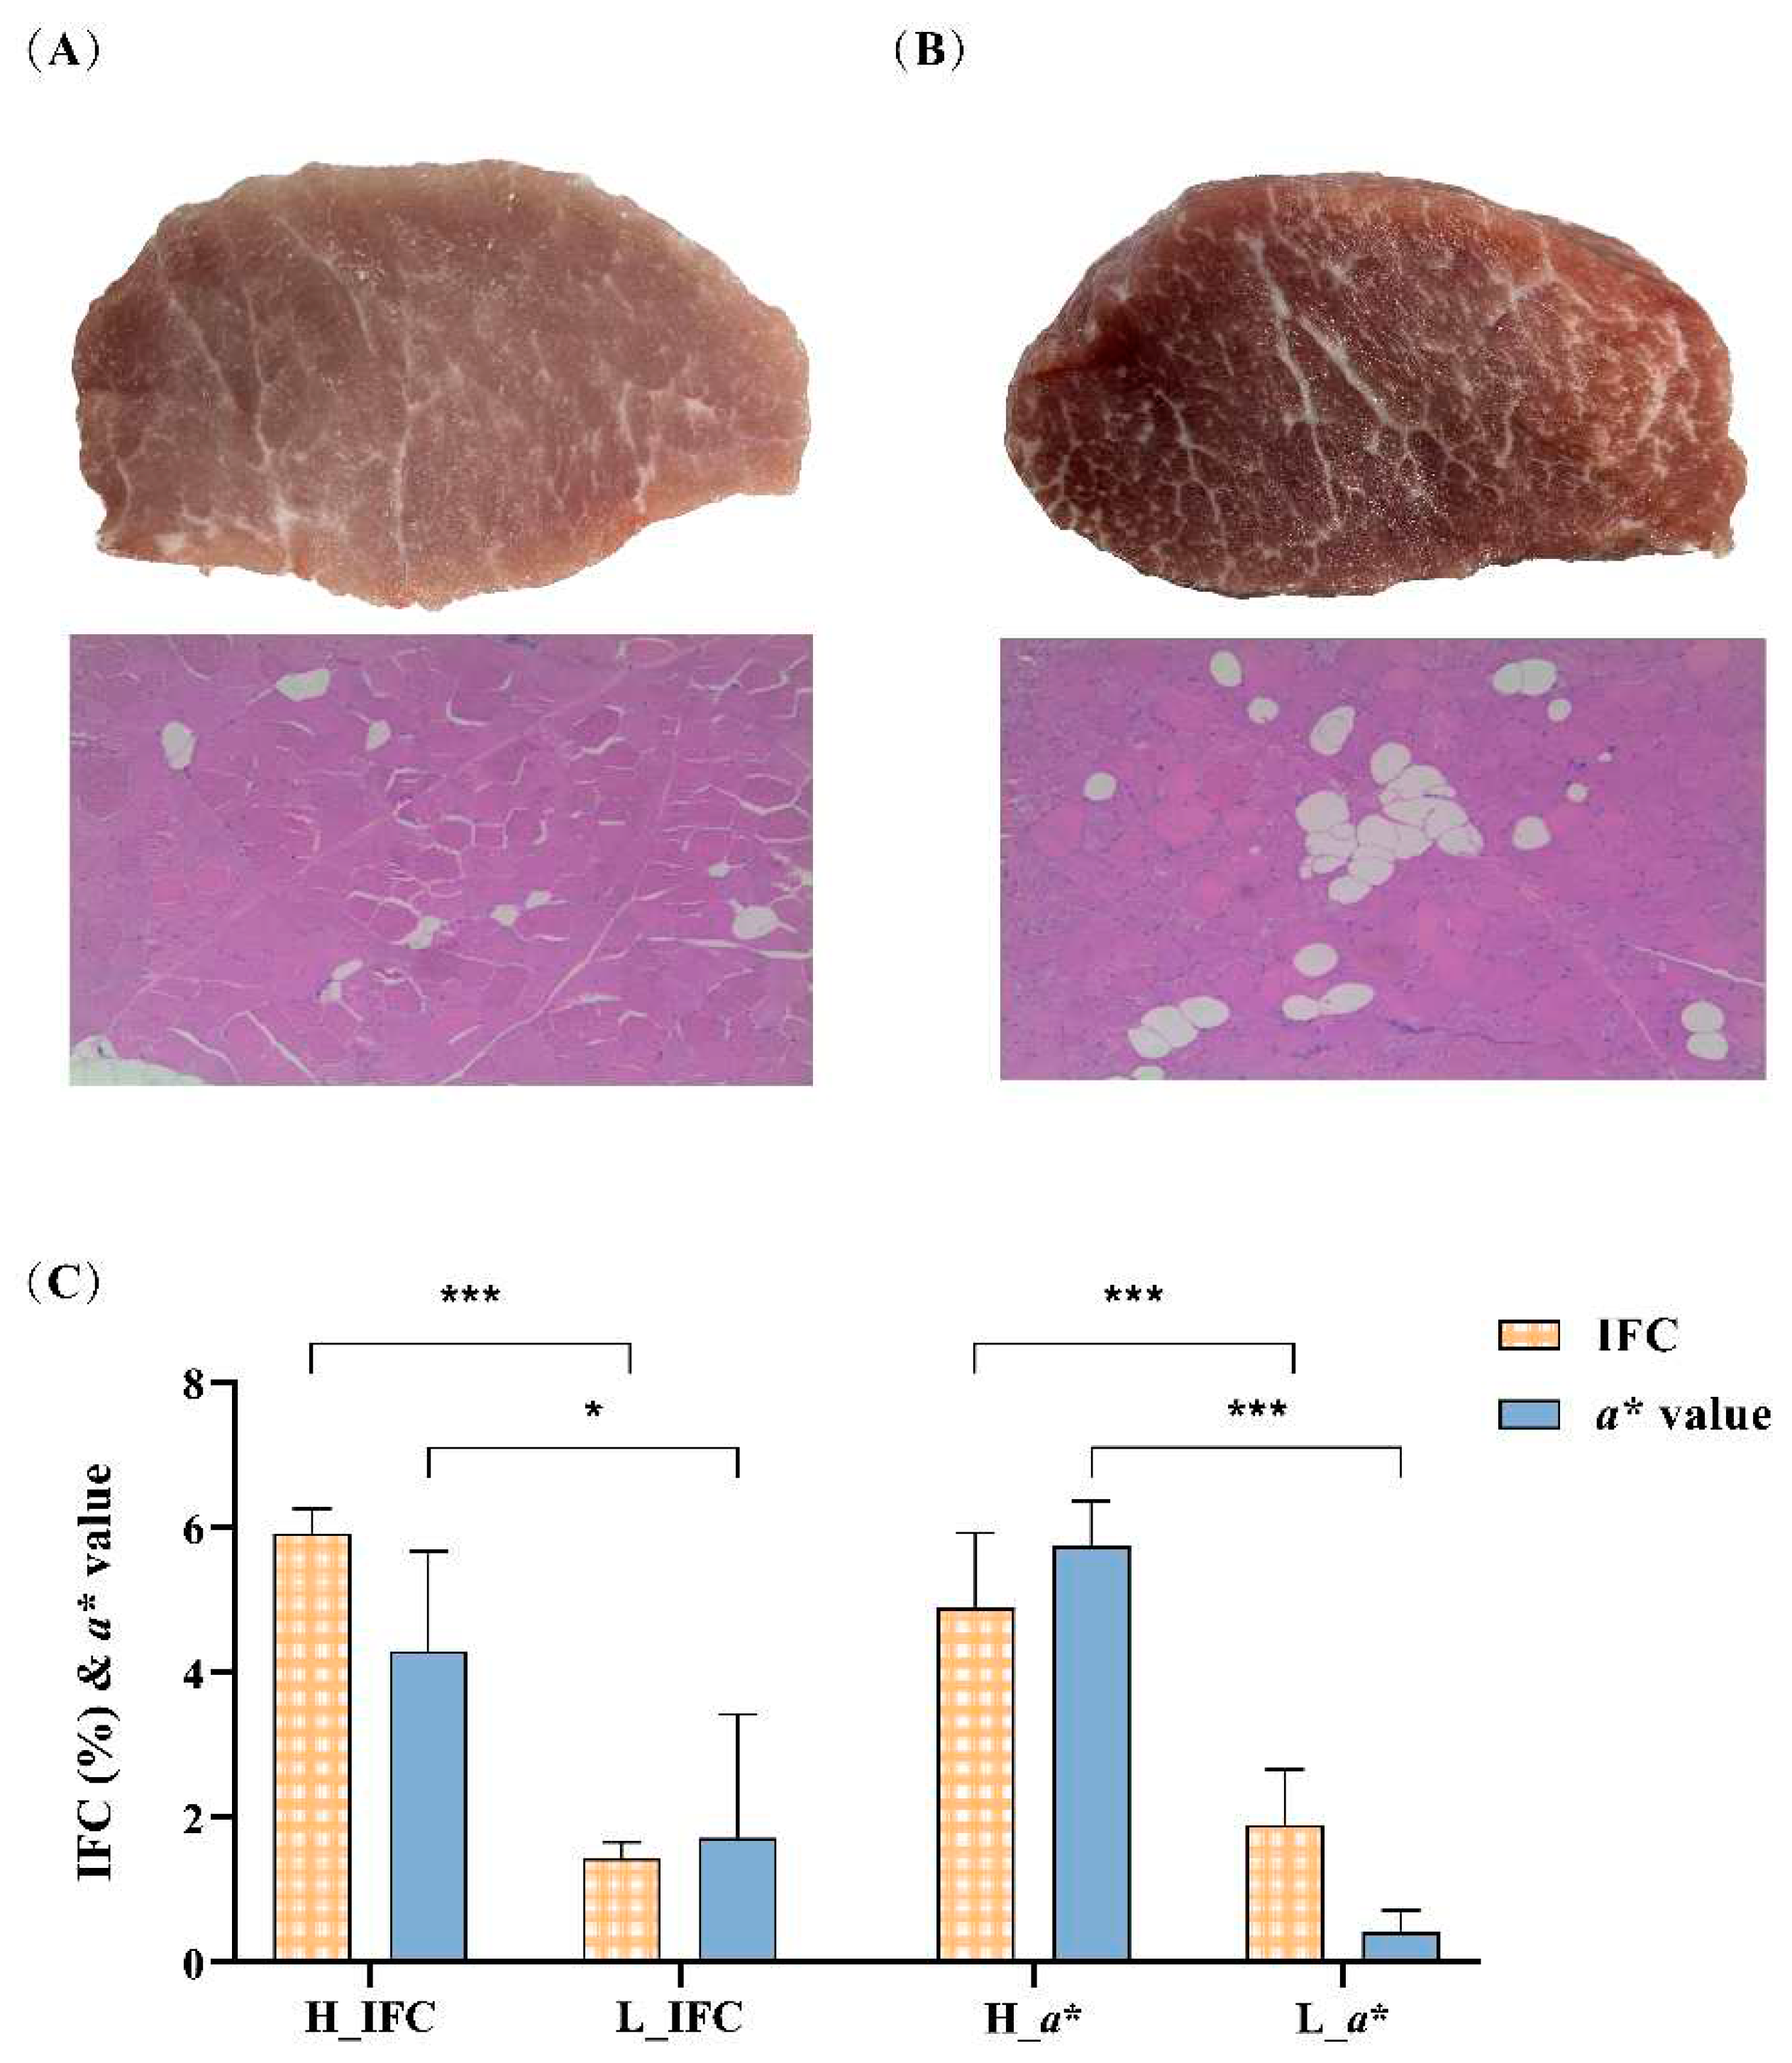
Figure 3.
Identification of differentially expressed genes (DEGs). (A) Venn diagram of DEGs identified using the DESeq2, limma, and edgeR packages for IFC. (B) Heatmap of overlapping DEGs between the H_IFC and L_IFC groups. (C) Venn diagram of DEGs identified using the DESeq2, limma, and edgeR packages for a* value. (D) Heatmap of overlapping DEGs between the H_a* and L_a* groups.
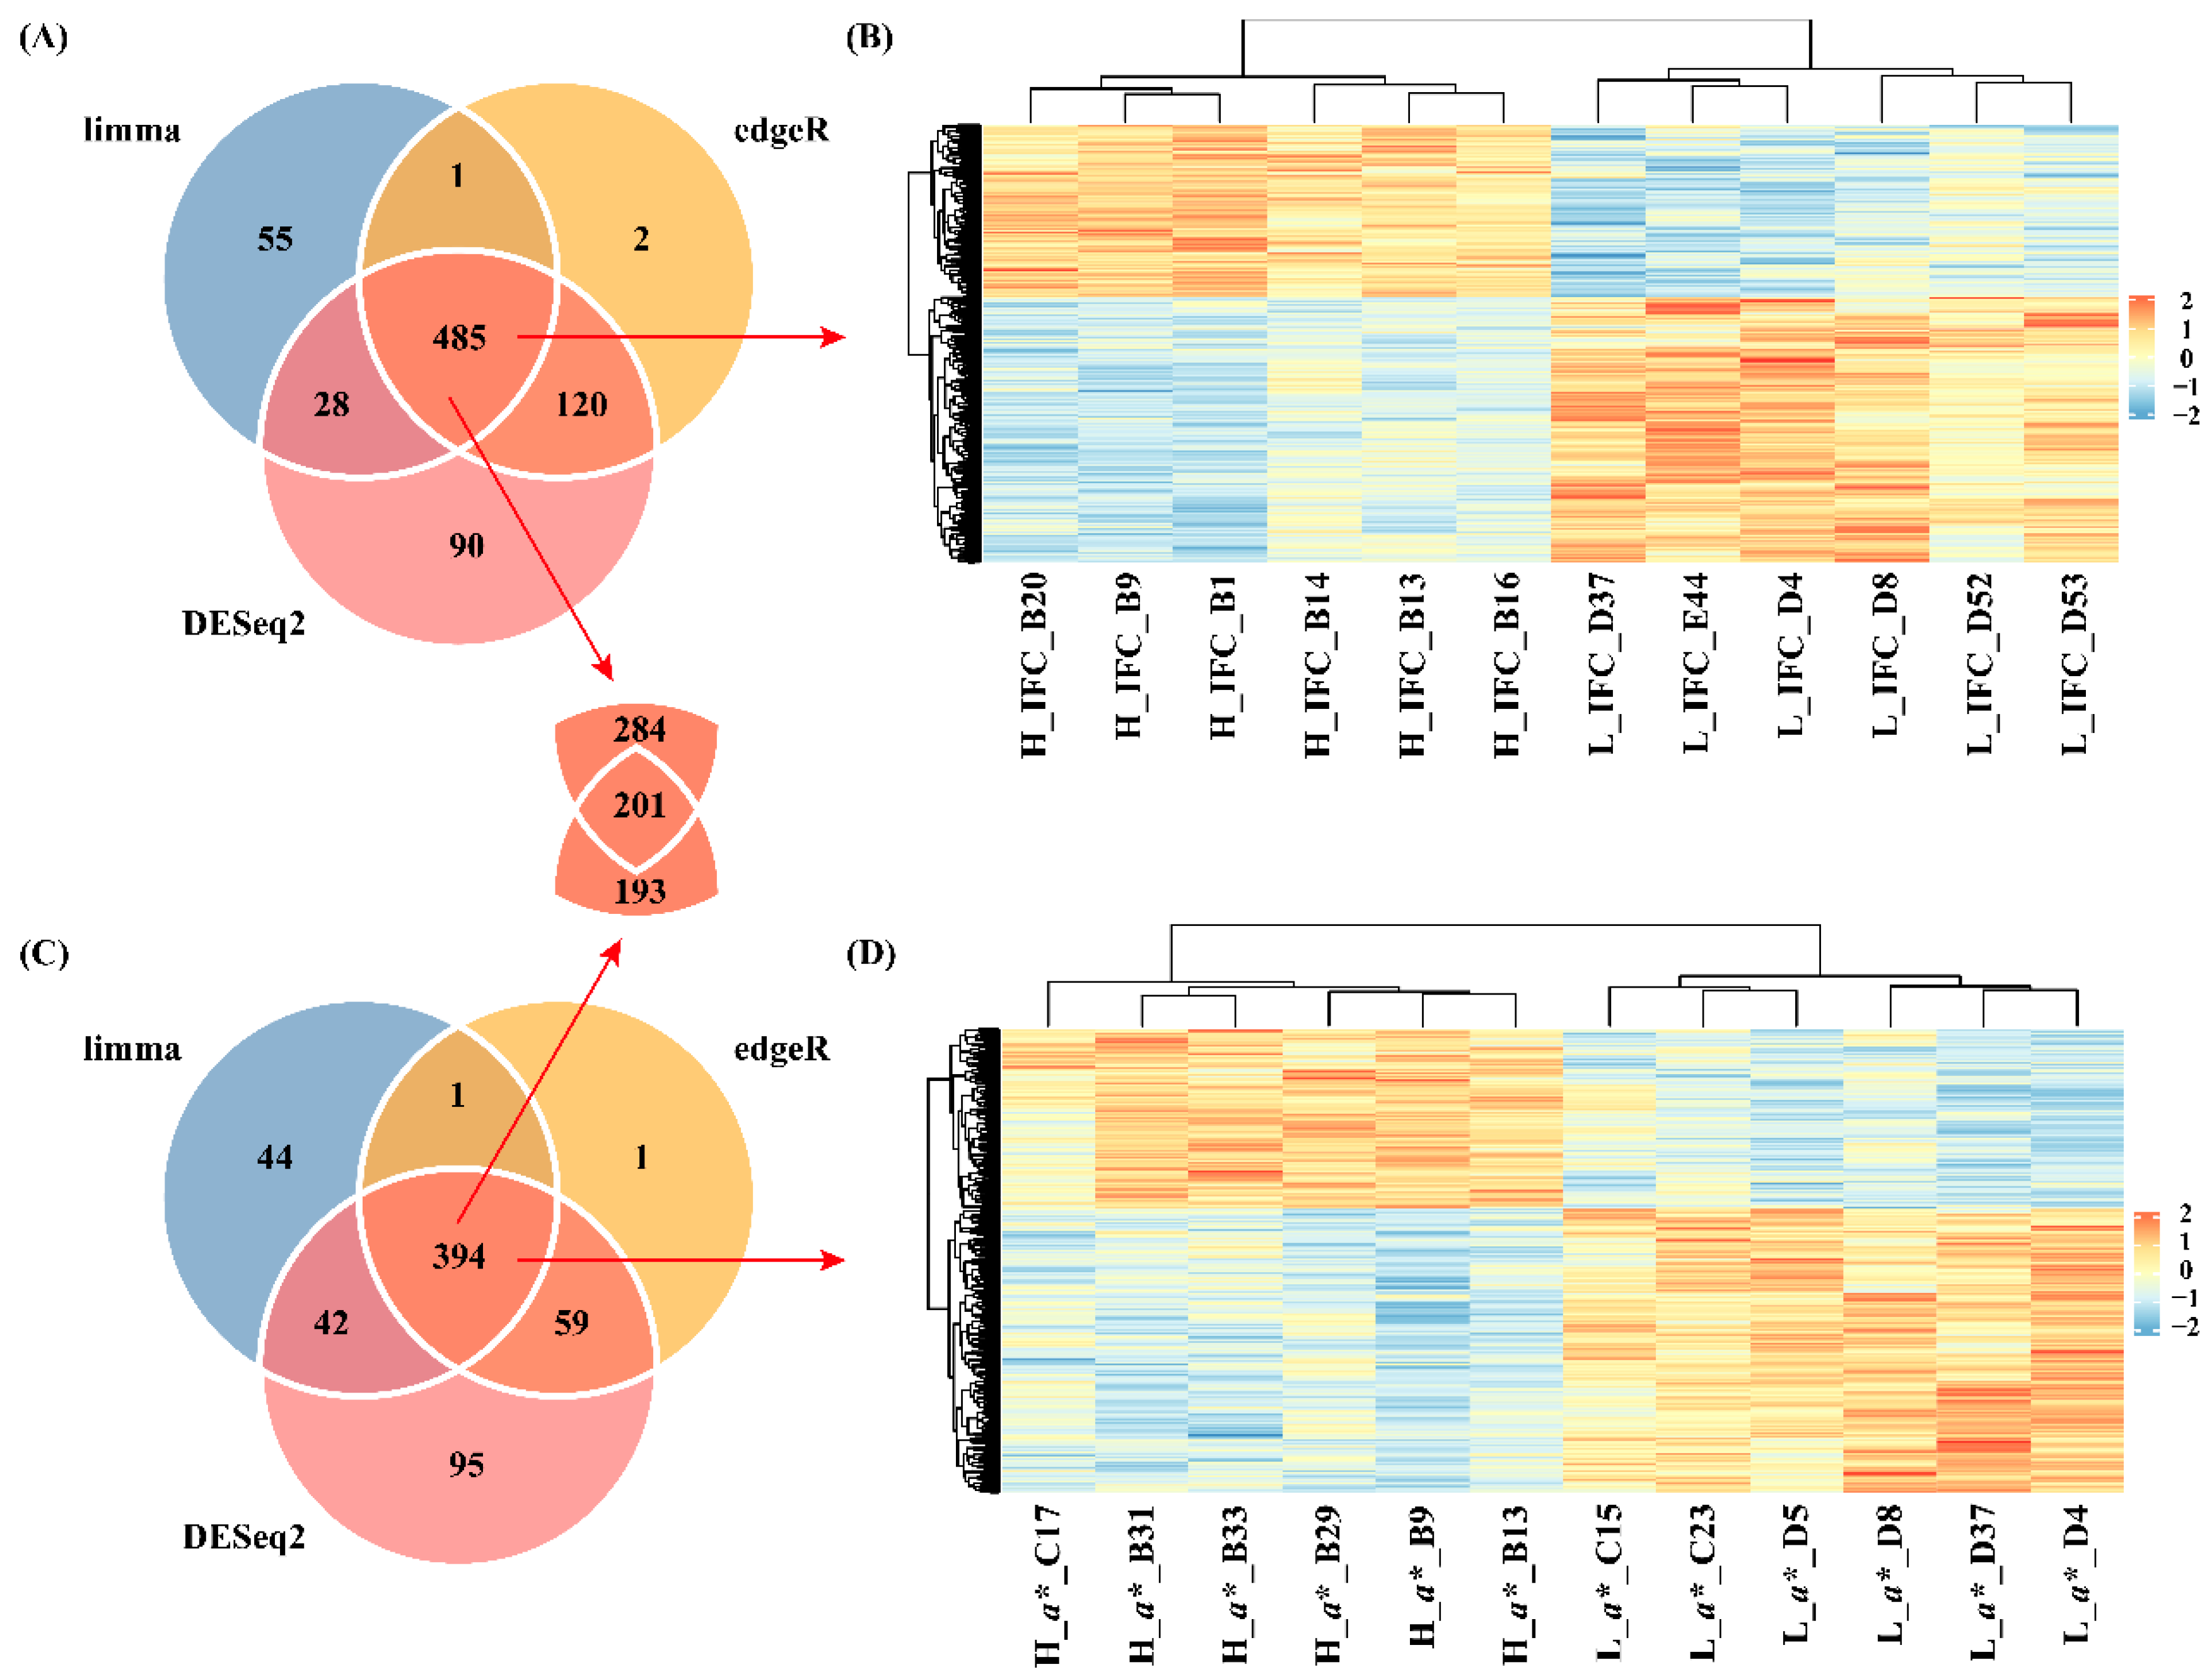
Figure 4.
GO and KEGG enrichment analysis of overlapping DEGs. (A) Top 5 GO terms of overlapping DEGs for IFC in the BP, CC and MF categories. (B) Significantly enriched KEGG pathways of overlapping DEGs for IFC. (C) Top 5 GO terms of overlapping DEGs for a* value in BP, CC and MF categories. (B) Significantly enriched KEGG pathways of overlapping DEGs for a* value.
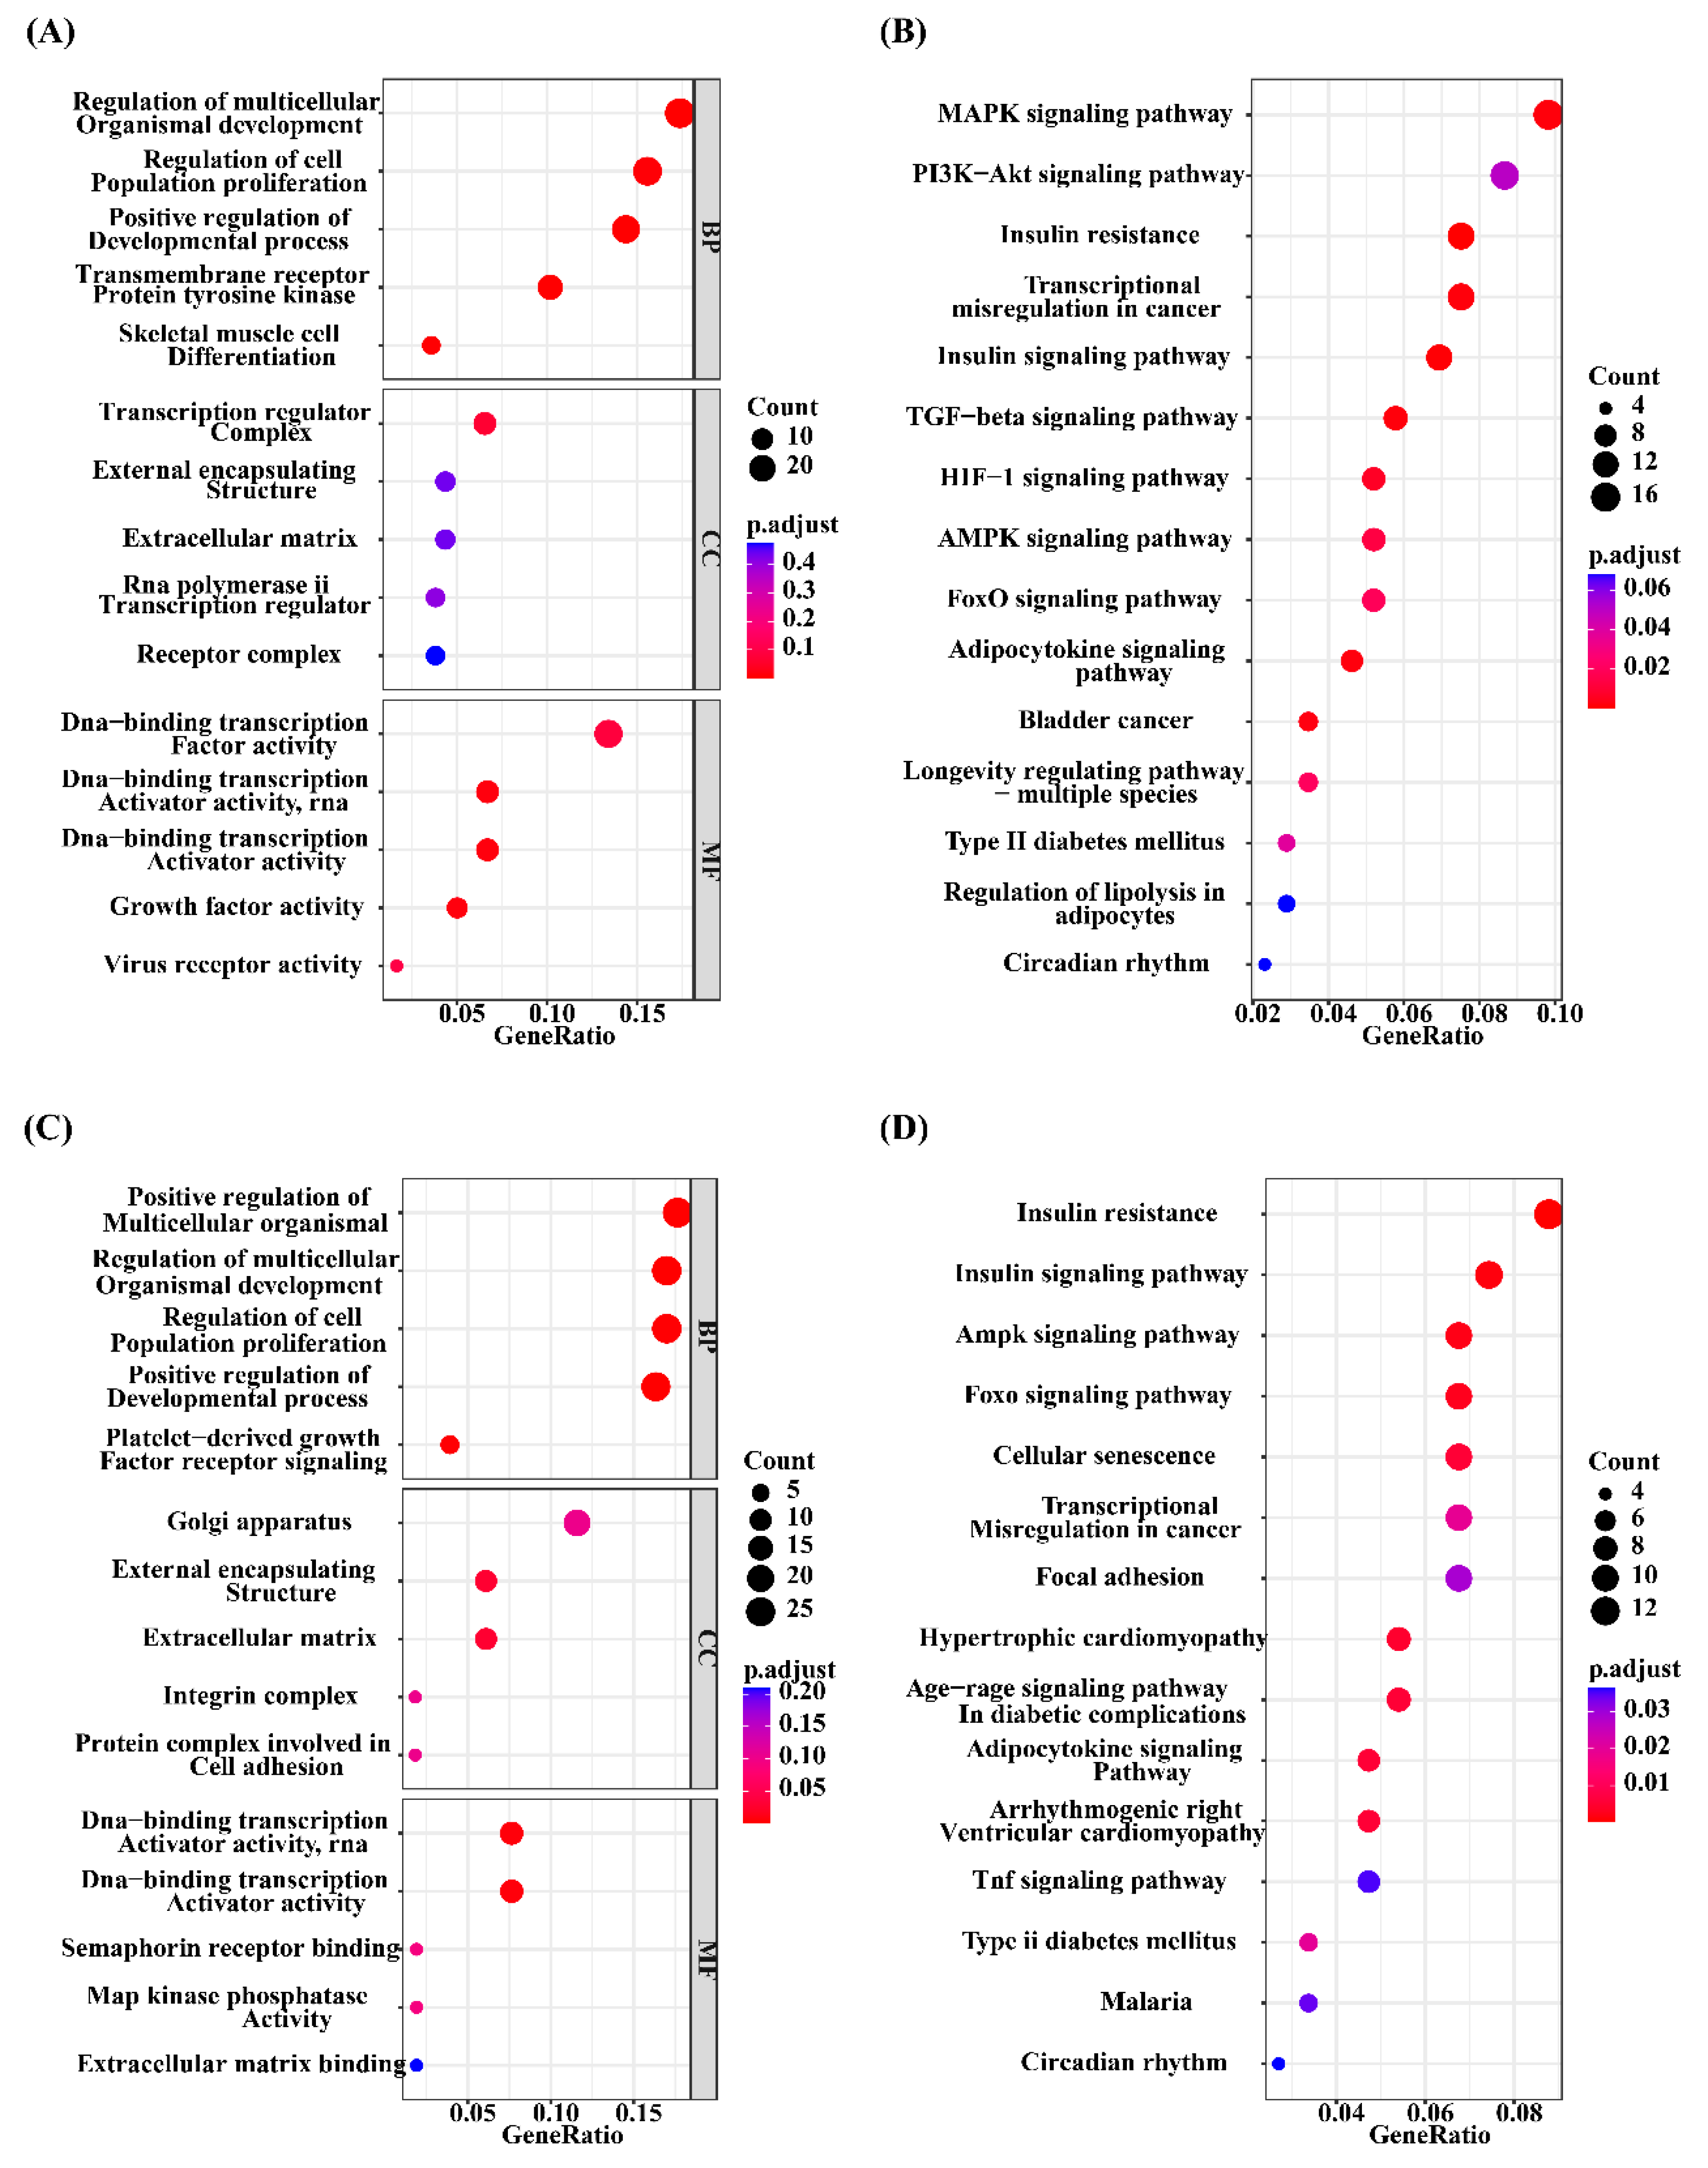
Figure 5.
Weighted gene co-expression network analysis (WGCNA). (A) Gene dendrogram was obtained by clustering the dissimilarity based on consensus Topological Overlap with the corresponding module colors indicated by the color row. (B) The number of genes contained in each module. (C) Matrix with module-trait relationships (MTRs) and corresponding P values between the detected modules on the y-axis and traits (IFC and a* value) on the x-axis.
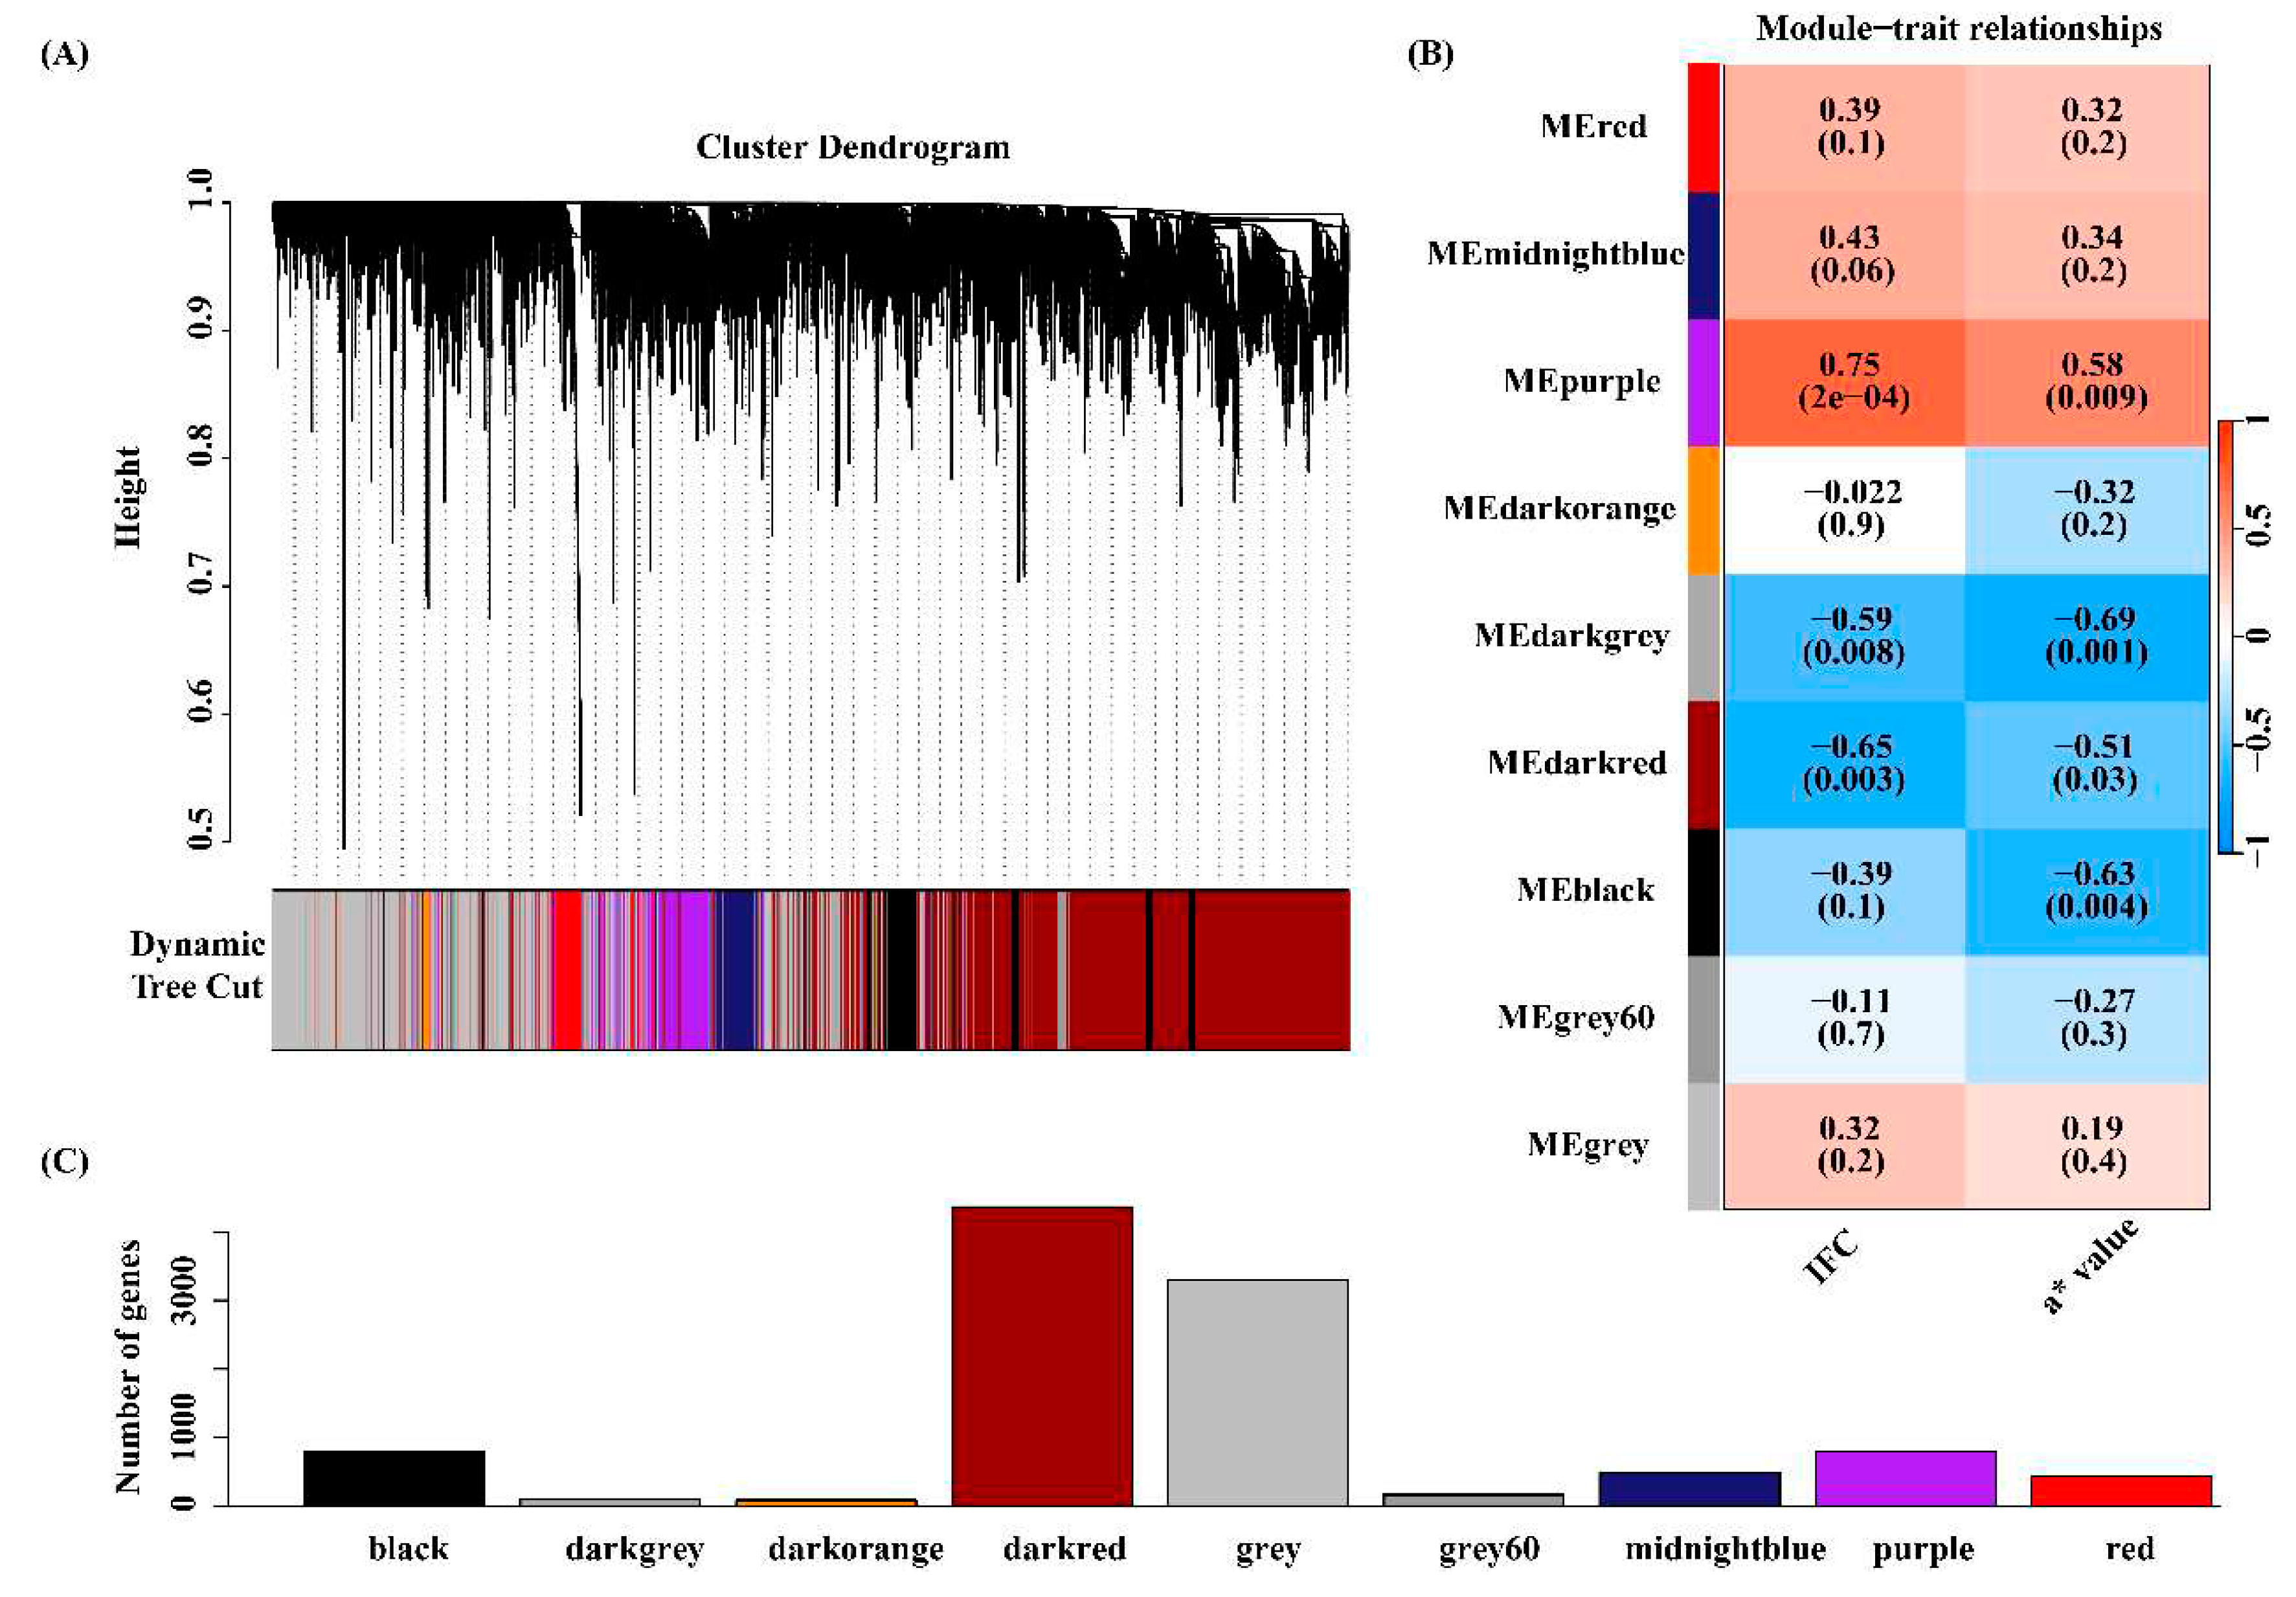
Figure 6.
Venn diagrams of significantly enriched GO terms and KEGG pathways based on DEGs, GSEA and WGCNA conditions. (A) Venn diagrams of significantly enriched GO terms under three conditions for IFC. (B) Venn diagrams of significantly enriched KEGG pathways under three conditions for IFC. (C) Venn diagrams of significantly enriched GO terms under three conditions for a* value. (D) Venn diagrams of significantly enriched KEGG pathways under three conditions for a* value.
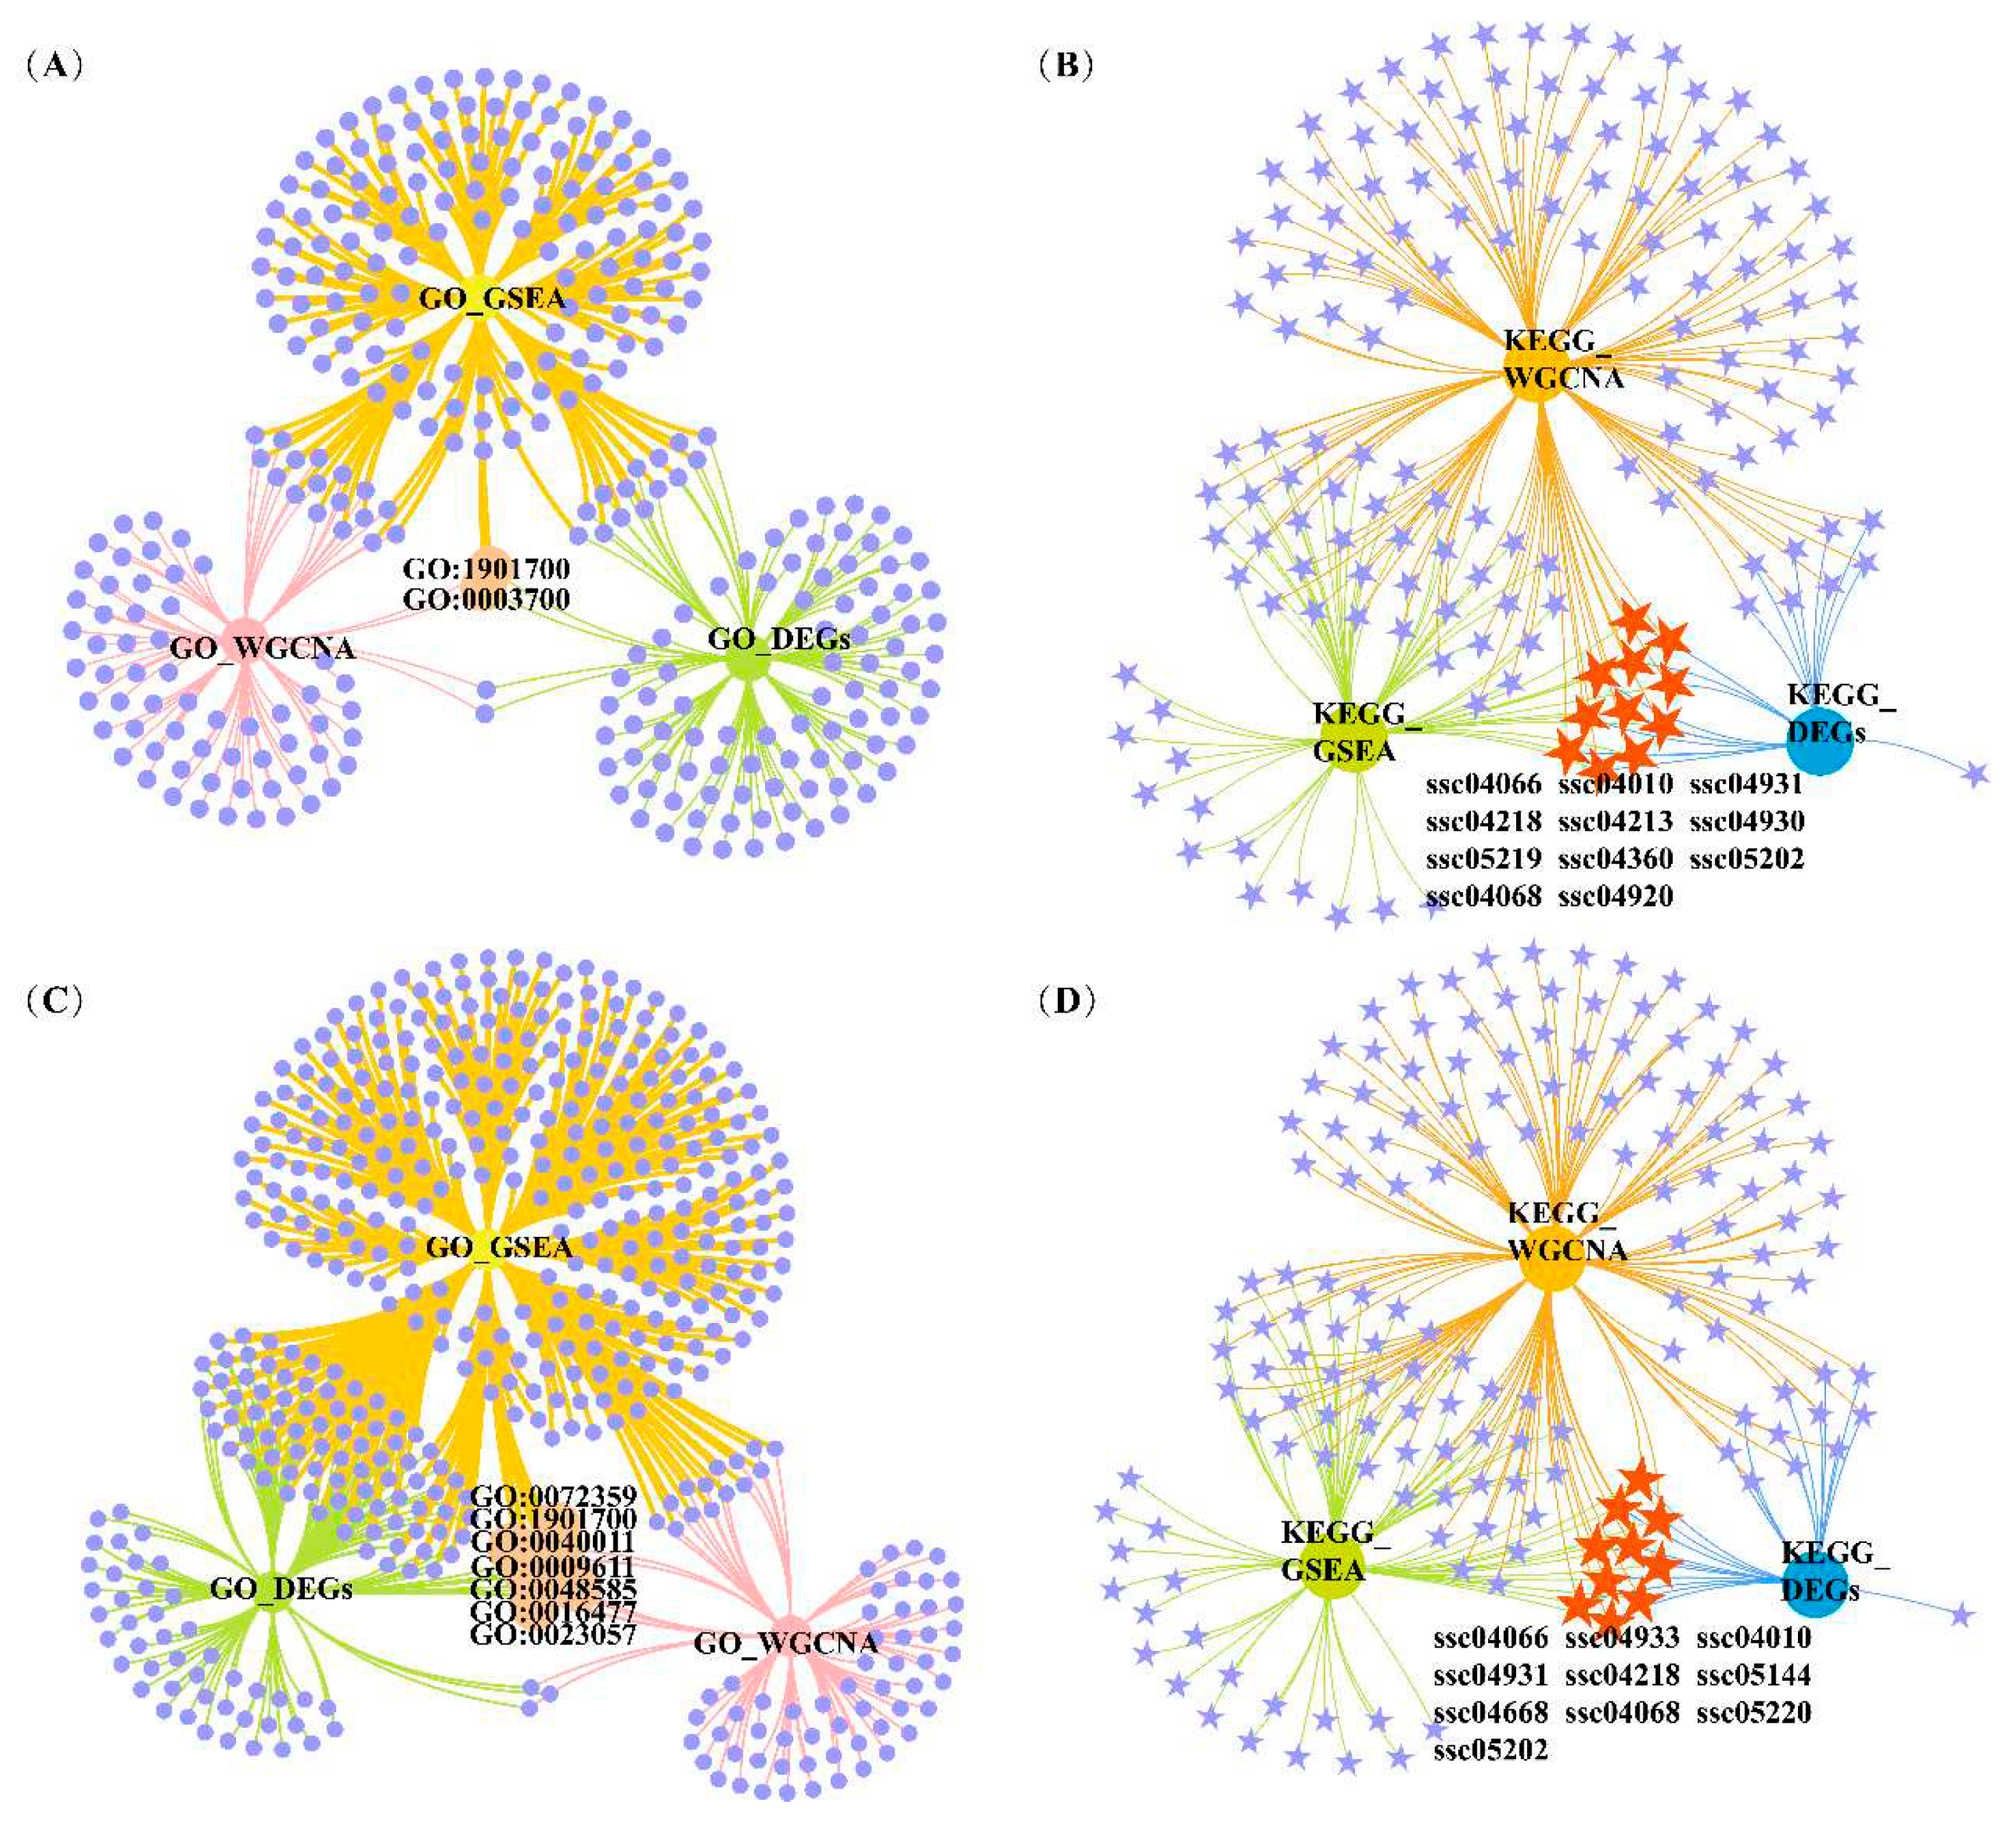
Figure 7.
Protein-protein interaction (PPI) network for the candidate genes affecting IFC and a* value. (A) and (C) represented the whole PPI network of candidate genes affecting IFC and a* value, respectively. Edges (gray lines) between nodes indicate the interaction of genes in the network. Gray circles represente DEGs with connectivity less than 10. Red circles represente DEGs with connectivity greater than 10 and are considered hub genes. The hub gene shared by IFC and a* value is represented by a V-shape. (B) and (D) represente the PPI subnetwork of hub genes affecting IFC and a* value, respectively. The hub gene shared by IFC and a* value is represented by a V-shape.
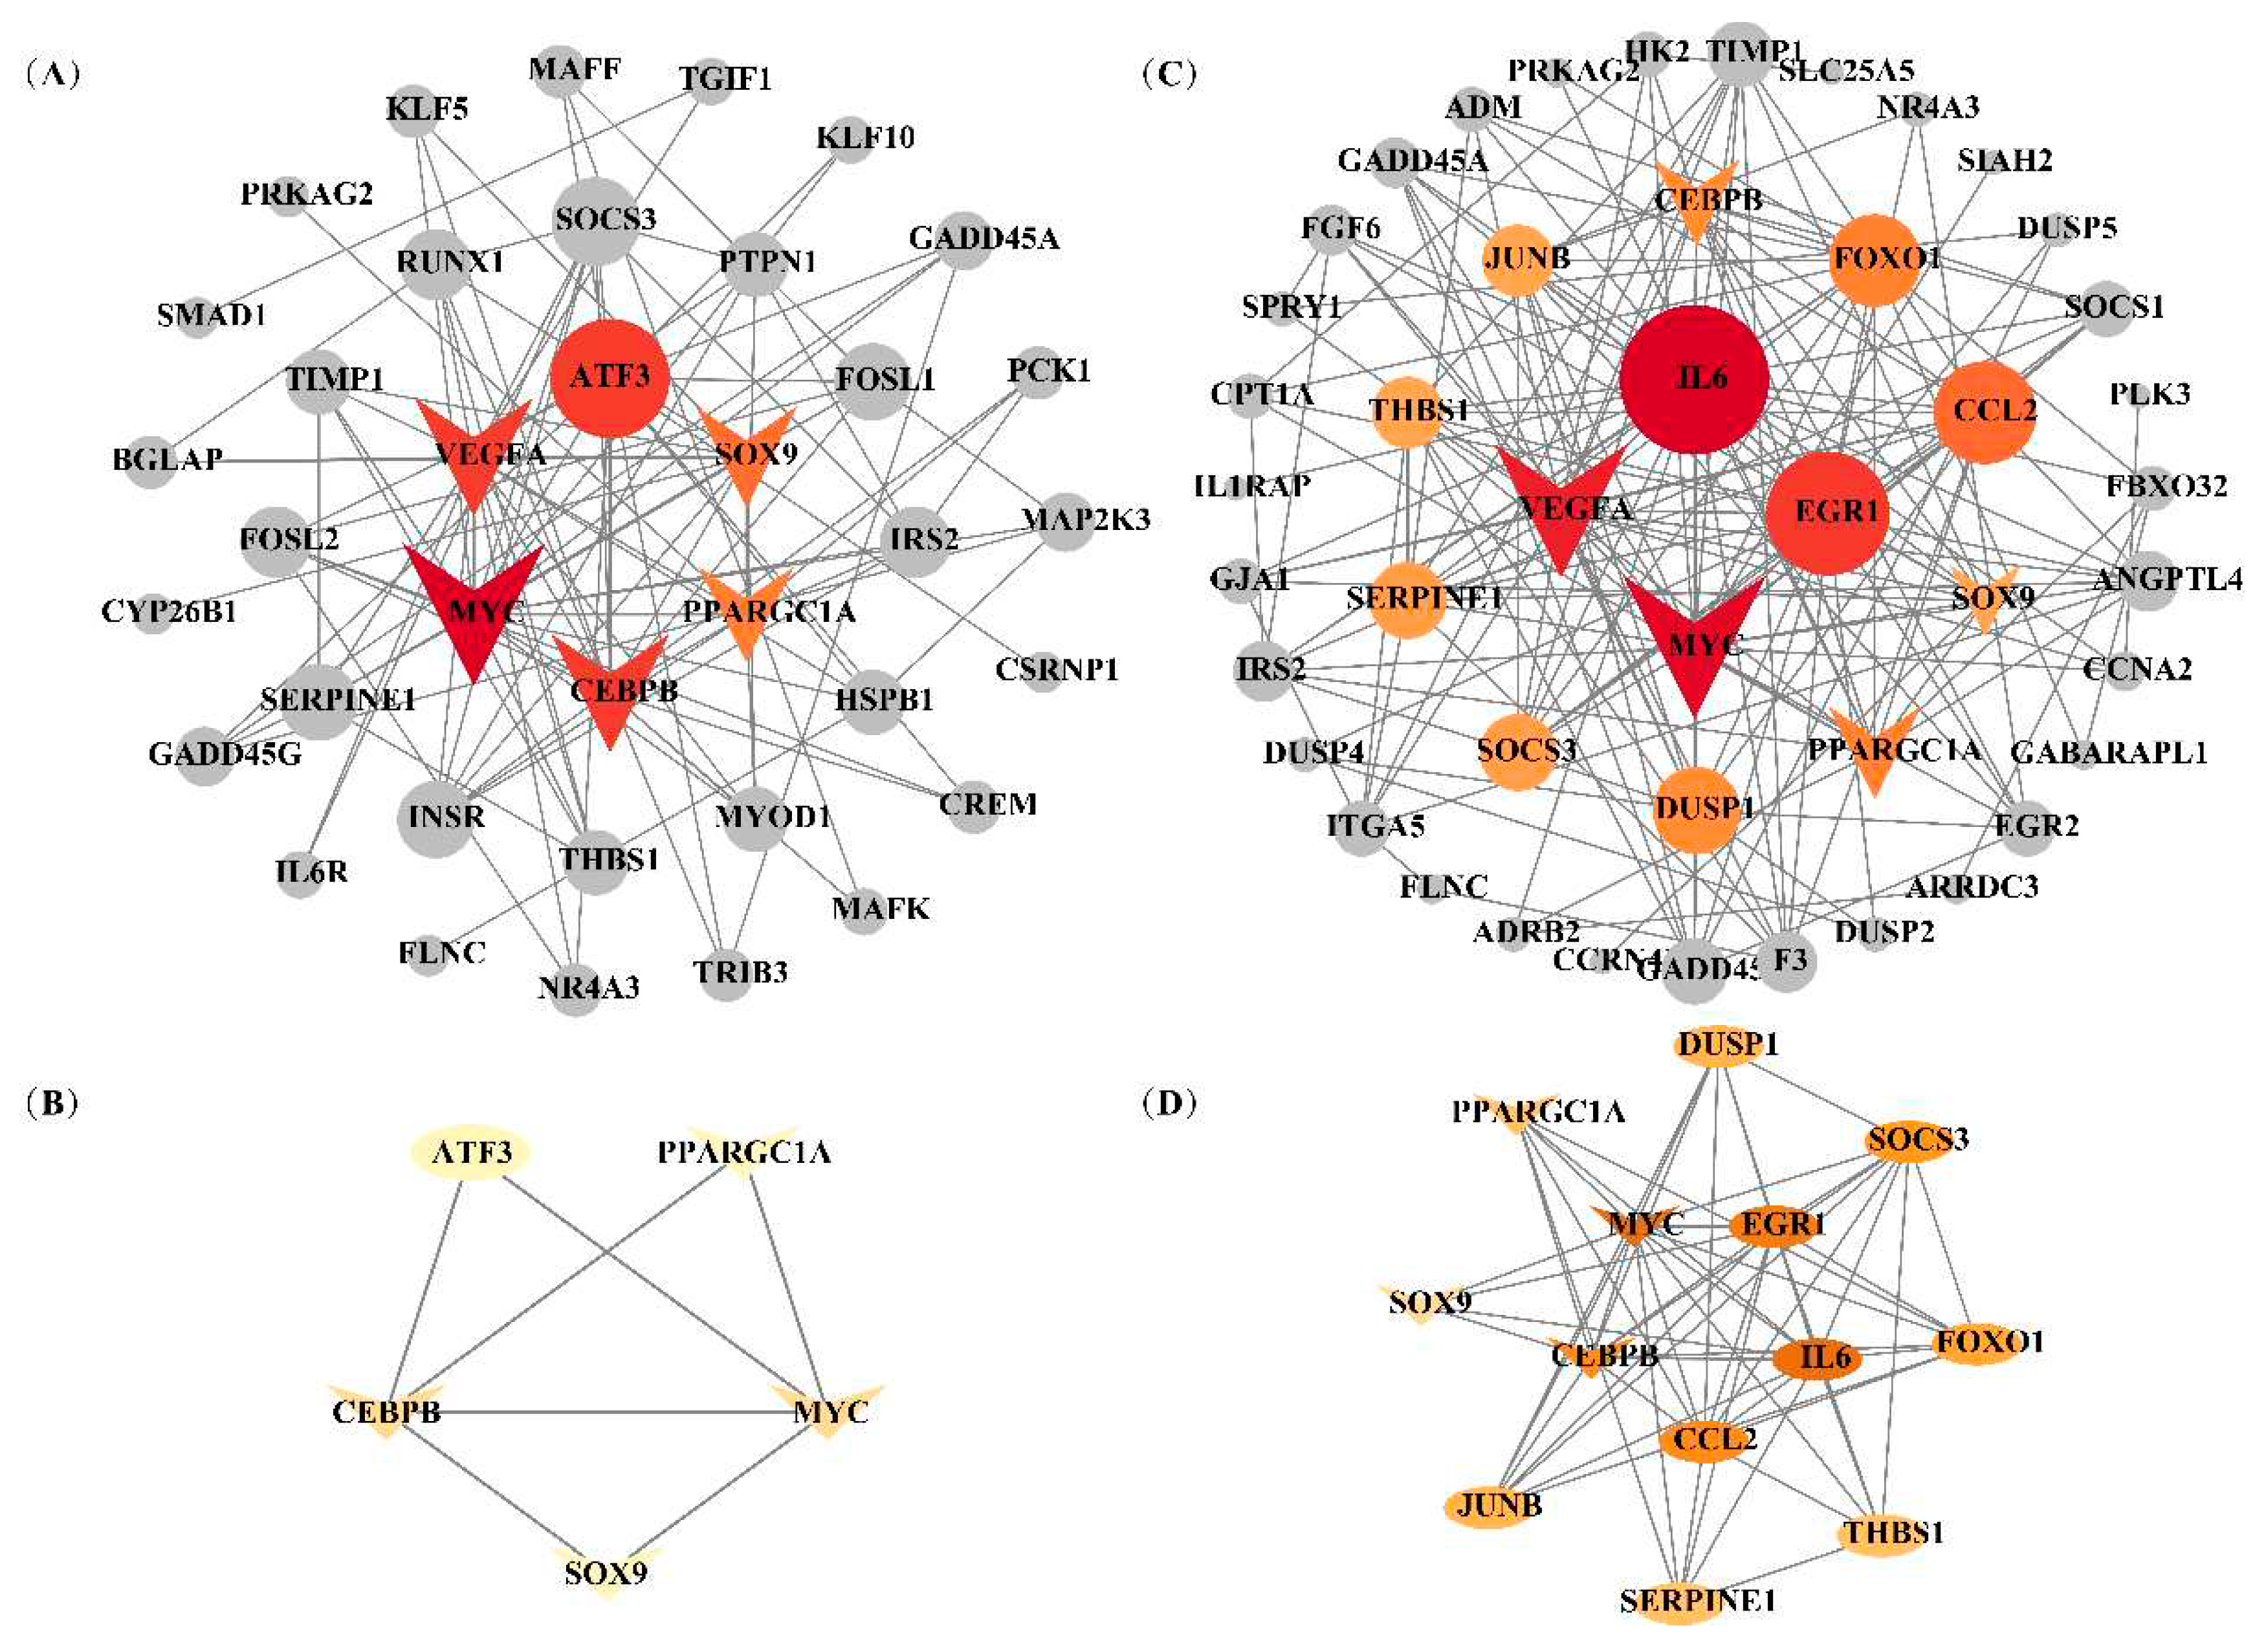

Table 1.
Overlapping significantly enriched GO terms based on GO enrichment of DEGs, GSEA and WGCNA.
Table 1.
Overlapping significantly enriched GO terms based on GO enrichment of DEGs, GSEA and WGCNA.
| Trait | GO ID | Description | GO_DEGsq value | GO_GSEAq value | GO_WGCNAq value | Overlapping DEGs |
| IMF | GO:1901700 | response to oxygen-containing compound | 0.069 | 0.047 | 0.005 | APOD, INHBB, CEBPB, NR4A3, SOX9, MYOD1, CYP26B1, BGLAP, PANX1, THBS1, PCK1 |
| GO:0003700 | DNA-binding transcription factor activity | 0.078 | 0.001 | 0.050 | TGIF1, RUNX1, FOSL2, KLF10, MAFK, SMAD1, MAFF, CSRNP1, CEBPB, NR4A3, SIM1, ATF3, SOX9, MYOD1, CREM, ZSCAN20, KLF5, FOSL1 | |
| a* | GO:1901700 | response to oxygen-containing compound | 0.023 | <0.001 | 0.005 | THBS1, INHBB, FOXO1, EGR1, PLSCR4, PLK3, CEBPB, SOCS1, SOX9, GJA1, SLC25A33, SLC11A1, NOCT, CCL2, SLC1A1, APOD |
| GO:0023057 | negative regulation of signaling | 0.034 | 0.004 | 0.012 | ADRB2, THBS1, SLC25A5, ADM, SIAH2, SPRY1, SOCS3, INHBB, EGR1, ARRDC3, DUSP5, SOCS1, SOX9, GJA1, APOD | |
| GO:0009611 | response to wounding | 0.043 | 0.001 | 0.035 | CCN1, PPL, SERPINE1, THBS1, F3, INHBB, SLC1A1, ITGA5, APOD | |
| GO:0072359 | circulatory system development | 0.043 | <0.001 | <0.001 | CCN1, SERPINE1, JUNB, THBS1, ADM, VEGFA, TIPARP, ITGA5, ANGPTL4, F3, EGR2, SOX9, GJA1, SLC1A1 |
Table 2.
Overlapping significantly enriched KEGG pathways based on KEGG enrichment of DEGs, GSEA and WGCNA.
Table 2.
Overlapping significantly enriched KEGG pathways based on KEGG enrichment of DEGs, GSEA and WGCNA.
| Trait | KEGG ID | Description | KEGG_DEGsq value | KEGG_GSEAq value | KEGG_WGCNAq value | Overlapping DEGs |
| IFC | ssc04931 | Insulin resistance | <0.001 | 0.07 | <0.001 | INSR, PPARGC1A, PTPN1, TRIB3, IRS2, PRKAG2, SOCS3, GFPT2 |
| ssc04010 | MAPK signaling pathway | 0.002 | 0.052 | <0.001 | MAP2K3, FLNC, VEGFA, GADD45A, INSR, HSPB1, MAP3K8, GADD45G, MYC, IL1RAP | |
| ssc04920 | Adipocytokine signaling pathway | 0.002 | 0.071 | <0.001 | PPARGC1A, IRS2, PRKAG2, SOCS3 | |
| ssc04066 | HIF-1 signaling pathway | 0.006 | 0.021 | <0.001 | VEGFA, INSR, IL6R, SERPINE1, HK3, TIMP1 | |
| ssc04068 | FoxO signaling pathway | 0.02 | 0.029 | <0.001 | GADD45A, INSR, GABARAPL1, IRS2, PRKAG2, GADD45G | |
| a* | ssc04068 | FoxO signaling pathway | 0.002 | <0.001 | <0.001 | GADD45A, GABARAPL1, IRS2, PRKAG2, GADD45B, FOXO1, IL6, PLK3, FBXO32 |
| ssc04920 | Adipocytokine signaling pathway | 0.005 | 0.097 | <0.001 | PPARGC1A, IRS2, PRKAG2, CPT1A, SOCS3 | |
| ssc04010 | MAPK signaling pathway | 0.043 | 0.013 | <0.001 | GADD45A, FLNC, GADD45B, VEGFA, FGF6, DUSP1, IL1RAP, DUSP4, MYC, DUSP5, DUSP2 | |
| ssc04066 | HIF-1 signaling pathway | 0.074 | 0.021 | <0.001 | SERPINE1, VEGFA, TIMP1, IL6, HK2 |
Disclaimer/Publisher’s Note: The statements, opinions and data contained in all publications are solely those of the individual author(s) and contributor(s) and not of MDPI and/or the editor(s). MDPI and/or the editor(s) disclaim responsibility for any injury to people or property resulting from any ideas, methods, instructions or products referred to in the content. |
© 2023 by the authors. Licensee MDPI, Basel, Switzerland. This article is an open access article distributed under the terms and conditions of the Creative Commons Attribution (CC BY) license (https://creativecommons.org/licenses/by/4.0/).
Copyright: This open access article is published under a Creative Commons CC BY 4.0 license, which permit the free download, distribution, and reuse, provided that the author and preprint are cited in any reuse.
supplementary.zip (6.35MB )
Submitted:
07 September 2023
Posted:
11 September 2023
You are already at the latest version
Alerts
A peer-reviewed article of this preprint also exists.
supplementary.zip (6.35MB )
This version is not peer-reviewed
Submitted:
07 September 2023
Posted:
11 September 2023
You are already at the latest version
Alerts
Abstract
Intramuscular fat content (IFC) and meat color are vital indicators affecting pork quality. A significant positive correlation between IFC and redness meat color (a* value) indicates that these two traits are likely to be regulated by shared molecular pathways. To identify candidate genes, hub genes, and signaling pathways that regulate these two traits, we measured the IFC and a* value in 147 hybrid pigs and selected individuls with extreme phenotypes for transcriptome analysis. The results revealed 485 and 394 overlapping differentially expressed genes (DEGs) using DESeq2, limma, and edgeR packages affecting IFC and a* value, respectively. Weighted gene co-expression network analysis (WGCNA) identified four modules significantly correlated with IFC and a* value. Moreover, we integrated functional enrichment analysis results based on DEGs, GSEA, and WGCNA conditions to identify candidate genes, and identified 47 and 53 candidate genes affecting IFC and a* value, respectively. The protein-protein interaction (PPI) network analysis of candidate genes showed that 6 and 14 hub genes affecting IFC and a* value, respectively. These genes mainly participated in various pathways related to lipid metabolism and redox reactions. Notably, four crucial hub genes (MYC, SOX9, CEBPB, and PPAGRC1A) were shared for these two traits. After functional annotation of these four hub genes, we hypothesized that the SOX9/CEBPB/PPARGC1A axis could co-regulate lipid metabolism and myoglobin redox response. Further research on these hub genes, especially the SOX9/CEBPB/PPARGC1A axis, will help to understand the molecular mechanism of the co-regulation of IFC and a* value, which will provide the theoretical basis for improving pork quality.
Keywords:
Subject: Biology and Life Sciences - Animal Science, Veterinary Science and Zoology
1. Introduction
Pork is a significant and extensively utilized animal resource, that has emerged as a principal protein source within human diets. In recent years, China’s yearly pork production has surpassed 50 million tons. Notably, Duroc × (Landrace × Yorkshire) (DLY) pigs have accounted for over 90% of the pork market due to their rapid growth and high lean meat rate [1]. With improved living standards, an increased pursuit of enhanced pork quality arises among individuals. Meat quality is a crucial indicator for assessing pork production and quality. Essential indicators of meat quality encompass intramuscular fat content (IFC), meat color, tenderness, and dripping loss, which can directly impact pork quality and market competitiveness [2]. Consumers favor snowflake meat, and IFC deposition is the main cause of snowflake meat [3]. Notably, meat color is also one of the most direct sensory indicators of pork quality for consumers and directly affects their consumption behavior. A present finding has indicated that the phenotypic score of the meat color manifested a stronger correlation with the meat color redness (a*) value (R = 0.8) [4]. Despite DLY pork effectively meeting the quantitative demand, its muscle quality falls short of eliciting satisfaction. Both IFC and a* value are traits with relatively high heritability [5,6] and are the most intuitive indicators of high-quality pork. Consequently, increasing the IFC and a* value through genetic improvement is a major research focal point for pig breeding enterprises.
IFC refers to the amount of fat accumulating between muscle fibers or within muscle cells, mainly composed of phospholipids and triglycerides [7]. Due to the relatively fixed phospholipid content, changes in IFC were primarily caused by triglyceride changes [8]. It is widely accepted that changes in meat color in muscles are due to changes in myoglobin levels. This may be due to higher myoglobin levels in slow/oxidative myofibers (red muscle fibers) than in fast/glycolytic myofibers (white muscle fibers). When there is a high proportion of red muscle fibers in muscle tissue, its muscle color exhibits a more distinct red characteristic [9]. This phenomenon is closely related to the biochemical markers of meat, such as oxidation state, cytochrome content, and redox forms. Previous studies have shown a significant correlation (R = 0.260 ~ 0.323) between IFC and meat redness (a*) [10,11]. Therefore, we speculated that these two traits might have similar genetic backgrounds, but the underlying genetic basis was largely unknown.
It is generally believed that the difference in phenotype is caused by changes in gene expression levels. Therefore, the variation in IFC and a* value within a population is thought to be driven by differences in the expression levels of critical genes involved in regulating these two traits. With the development of next-generation sequencing technologies, the emergence of transcriptome sequencing (RNA-seq) allows us to detect the expression levels of all genes across the entire genome. Researchers usually used individuals with extreme phenotypes of IFC and a * value to perform RNA-seq, which could obtain many candidate genes and signaling pathways related to IFC and a* value [12,13,14].
However, organisms are complex systems with interconnected genes regulating biological activities, forming intricate network systems. Therefore, it is crucial to consider the interrelationships between thousands of genes when studying phenotypic variation. Differential expression analysis may not capture critical biological pathways or gene-gene interactions relevant to target traits, as it focuses on the impact of individual genes rather than the influence of gene networks [15]. Coexpressed genes often form densely connected subgraphs in networks, representing functionally related gene groups or signaling pathways, and exhibit specific biological functions by developing local substructure modules [16]. These modules reveal interactions among genes at a systems level, aiding researchers in further understanding the mechanisms underlying gene interactions and identifying regulatory hubs of coexpressed genes [17]. Weighted gene co-expression network analysis (WGCNA) is an efficient and accurate method for describing the correlation among all genes or modules within the whole genome with traits. It is particularly advantageous for simultaneously identifying key genes of multiple complex traits [18], such as fat deposition [13], meat quality [19], and reproductive performance [20].
Based on transcriptomic data, the present study aimed to gain molecular insights into the hub genes and metabolic pathways that coregulated the variations in IFC and a* value. We collected individuals with divergent IFC and a* value for RNA-seq. Subsequently, we identified the differentially expressed genes (DEGs), and performed the gene set enrichment analysis (GSEA), WGCNA, and protein-protein interaction (PPI) analysis. We identified the candidate genes and modules significantly related to these two traits. Through systematic integration of the above results, we identified the hub genes and pathways that could co-regulate the changes in IFC and a* values. These findings can contribute to understanding the genetic mechanisms of co-regulation changes in IFC and a* value. Moreover, the identified hub genes may serve as potential biomarkers for the synergistic improvement of IFC and meat color in pigs.
2. Materials and methods
2.1 Animals, sample collection and phenotype measurement
A total of 147 commercial DLY pigs, consisting of 70 Castrated boars and 77 females, were selected for this study. The experimental pigs were reared under standardized indoor conditions and provided ad libitum access to feed and water at Jiangsu Kangle Pig Breeding Farm (Changzhou, China). All experimental protocols involving animals were approved by the Nanjing Agricultural University Animal Care and Use Committee (Certification No.: SYXK (Su) 2022-0031). The pigs were slaughtered as six batch at the same slaughterhouse at an average live weight of 122.49 ± 16.54 kg (mean ± standard deviation). Following slaughter, LD muscle from the last third and fourth thoracic vertebrae was collected for each pig. Approximately 0.5 g of LD muscle was placed into a 1.5 ml tube and frozen at −80 °C for RNA extraction. Meat color redness value of LD muscle was assessed three times at 24 hours post-mortem using a CR-410 hand-held colorimeter (Kinica Minolta Sensing Inc., Shanghai, China). The mean of the three measurements was the final a* value. Approximately 300 g of LD muscle was utilized for determining IFC using the Soxhlet extraction method [21].
2.2 Sample selection
Based on the measurements of IFC, 12 individuals with similar body weights were selected. Six had extremely high IFC (H_IFC), and six had extremely low IFC (L_IFC) for subsequent transcriptome sequencing. Similarly, based on the measurement results of a* value, six samples with extremely high a* value (H_a*) and six samples with extremely low a* value (L_a*) were selected. It is important to note that there were some duplicate samples among the selected four groups, thus resulting in a final total of 19 unique individuals for transcriptome sequencing. The means of IFC and a* value in high and low groups were caculated by two-tailed Student’s t-test. All analysis were conducted using SPSS (v22.0) software (SPSS Inc., Chicago, IL, USA).
2.3 RNA extraction, library construction, and sequencing
Total RNA was extracted from 100 mg of frozen LD muscle using TRIzol reagent (Invitrogen, Carlsbad, CA, USA). Total RNA obtained was quantified and quality controlled using Qubit 2.0 and Agilent 2100. The Illumina NovaSeq 6000 platform (Illumina, San Diego, CA, USA) was used for transcriptome sequencing based on the high-quality cDNA library, and the sequencing read length was paired-end 150 bp.
2.4 Identification of DEGs
The obtained raw data were filtered to clean data with FastQC (v0.11.5) and Trimmomatic (v0.38) software [22] by removing reads containing adapters, low-quality reads, and reads with an N content > 5%. Clean reads were mapped to the Sus scrofa 11.1 genome from Ensembl 101 using STAR (v2.7.2) software [23] for alignment. Finally, a transcriptome gene expression count file was converted using featureCounts (v2.0.0) software [24]. The DESeq2 (v1.25.9) [25], limma [26], and edgeR packages in R (v4.1) [27] software were used to identify DEGs between the groups. DEGs were defined as those with a false discovery rate (FDR) < 0.05 and |log2 fold change|≥ 1. Furthermore, overlapping DEGs detected by the DESeq2, limma, and edgeR packages were considered true DEGs and used for subsequent functional enrichment analysis.
2.5 Functional annotation and enrichment analysis
To better understand the functions of overlapping DEGs, the R package BioMart (http://www.biomarbiomart.org/) [28] was used to annotate genes using the reference genome Sus scrofa 11.1. The Gene Ontology (GO) terms and Kyoto Encyclopedia of Genes and Genomes (KEGG) pathways of overlapping DEGs were subjected to functional enrichment analysis using the R package clusterProfiler (v4.6.2) [29] with a significance cutoff criterion of q value < 0.10. The overlapping DEGs were visualized as a heatmap plot using the R function pheatmap. Additionally, considering the GSEA does not require an arbitrary cut-off for differential gene expression and it has a more extensive functional range, we also performed GSEA in our datasets based on whole genes of IFC and a* groups using the clusterProfiler package (v4.6.2) [29], respectively. The threshold of significantly enriched GO terms and KEGG pathways was q value < 0.10.
2.6 WGCNA
To construct a co-expression network, we performed WGCNA, a package from R (1.72.1) [30], with RNA-seq data (n = 19) with their counts normalized by transcript per million (TPM). After the expression matrix input, genes with TPM values > 1 in more than 10 individuals were selected for a coexpression network setting. The clean expression matrix underwent hierarchical clustering using the group average method to identify outliers, which are samples deviating significantly from the others. The results of the hierarchical cluster analysis revealed that three samples were outliers. After excluding the outliers, the final expression matrix contained 10,512 genes and 19 individuals for establishing an unsigned coexpression network based on the step-by-step method.
The co-expression network construction involved the calculation of an adjacency matrix, denoted as matrix "a," using the formula aij = |sij|β, where sij represents the absolute value of the correlation coefficient between gene i and gene j, and β is a soft-power threshold. This study selected the power of 18 based on the scale-free topology criterion, resulting in a scale-free topology index (R2) of 0.90. To enhance the robustness of the network against spurious connections or missing connections, the topological overlap matrix (TOM) was introduced. TOM measures the overlap in shared neighbors between genes and aids in identifying modules of highly coexpressed genes. The dissimilarity TOM, obtained by subtracting the TOM from 1, was used as input for the dendrogram. Genes were clustered into distinct modules using hierarchical clustering and dynamic tree-cutting methods. The hybrid dynamic tree-cutting approach employed a minimum module size of 30 as the default and commonly used value. To characterize the module expression, module eigengenes (MEs) were calculated as the first principal component of the expression matrix. MEs represent weighted average expression profiles for each module. The WGCNA approach facilitates the identification of biologically significant modules and potential critical modules for further analysis by defining the module-trait relationships (MTRs) and gene significance (GS) of each module. The MTRs were estimated by calculating pearson correlations between the MEs and phenotypes. At the same time, the GS was determined by examining the correlation between the expression profiles and phenotypes. The mean value of GS for the genes within a module represented the module significance (MS). To select candidate modules for functional enrichment analysis, modules with MTRs greater than 0.35 and MS exceeding 0.25 were considered based on the criteria reported in previous studies. The GO and KEGG pathway terms of all genes within the critical module were subjected to functional enrichment analysis using the clusterProfiler package (v4.6.2) [29] with a significance cutoff criterion of q value < 0.10.
2.7 Identification of candidate and hub genes related to IFC and a* value
To further identify candidate genes affecting IFC and a* value, we performed overlap analysis of significantly enriched GO terms and KEGG pathways derived from overlapping DEGs, GESA, and WGCNA, respectively. DEGs located in the overlapping GO terms and KEGG pathways were considered candidate genes and used for subsequent PPI analysis.
The construction of a PPI network was employed to analyze the interactions between genes encoding proteins in candidate genes based on the Search Tool for the Retrieval of Interacting Genes (STRING) database (v11.5) [31]. Cytoscape software (v3.8.0) [32] was employed to visualize the entire PPI network. This analysis allows the connection patterns between genes in PPI networks to be explored and visualized. Highly connected genes, also known as hub genes, may play an essential role in influencing the target traits of these candidate genes. The criterion for selecting the hub gene was that its degree of connectivity was greater than 10.
3. Results
3.1 Phenotypes and sequencing data
The phenotypes of IFC and a* value in 147 DLY pigs are shown in Figure 1A. The mean and standard error of IFC and a* value were 3.20%±0.10% and 2.86%±0.13%, respectively. IFC and a* value showed a highly significant positive correlation (R = 0.309, P < 0.001) (Figure 1B).
Based on the IFC and a* value, the LD muscle samples were divided into high IFC (H_IFC, n = 6), low IFC (L_IFC, n = 6), high a* value (H_a*, n = 6) and low a* value (L_a*, n = 6) groups. The phenotypic values of selected individuals are shown in Figure 2 and Table S1. The mean IFC of the high and low groups were 5.92% and 1.45%, respectively. The mean a* values of the high and low groups were 4.30 and 1.72, respectively. In addition, the IFC or a* value in the high groups (H_IFC and H_a*) was significantly higher than that in the low groups (L_IFC and L_a*) (Figure 2C).
Concerning the RNA-Seq data, 18.74–25.32 million raw reads per sample were generated. After filtering approximately 1.39% of raw reads, an average of 21.45 million clean reads were used for the following analysis. The mean Q30 and GC percentage values of these clean data were 95.19% and 52.53%, respectively. After alignment using STAR software, 87.53% of clean reads were uniquely mapped to the Sus scrofa 11.1 genome (Table S1). Before DEGs detection, low expression levels or non-expressed genes were removed based on gene expression counts. The remaining 16,453 for IFC and 16,249 for a* were analyzed for the differential expression analysis.
3.2 DEGs
The present study identified 723, 569, and 608 DEGs between the H_IFC and L_IFC groups using DESeq2, limma, and edgeR, respectively (Figure 3A). A total of 485 overlapping DEGs were detected, including 190 up-regulated and 295 down-regulated DEGs in the H_IFC group, respectively. For a* value, 590, 481, and 455 DEGs were identified using DESeq2, limma, and edgeR, respectively (Figure 3C). Three hundred and ninety-four DEGs were shared among the three methods, including 153 up-regulated and 241 down-regulated DEGs in the H_a* group. Figure 3B and 3D exhibit the heatmap of these overlapping DEGs, from which it can be seen that the expression patterns of overlapped DEGs were consistent within groups and different between groups. Moreover, 201 DEGs were shared between these two traits.
3.3 Functional enrichment analysis
There were 106 significantly enriched GO (GO_DEGs) terms (Table S4, Figure 4A) and 20 significantly enriched KEGG (KEGG_DEGs) pathways (Table S5, Figure 4B) based on overlapping DEGs between H_IFC and L_IFC groups. Among these 106 enriched GO_DEGs terms, most belonged to the biological process (BP) category, and only 1 and 6 terms belonged to the cellular component (CC) and molecular function (MF) categories, respectively. In terms of KEGG_DEGs pathways, more than half of the 20 significantly enriched pathways were closely associated with lipid metabolism and lipolysis, such as the adipocytokine signaling pathway (ssc04920), MAPK signaling pathway (ssc04010), PI3K-Akt signaling pathway (ssc04151) and regulation of lipolysis in adipocytes (ssc04923). For a* value, 138 significantly enriched GO_DEGs terms (Table S6, Figure 4C) and 22 significantly enriched KEGG_DEGs pathways (Table S7, Figure 4D) were detected. Similarly, most of these enriched GO_DEGs terms belonged to the BP category. KEGG_DEGs enrichment analysis revealed that 9 of 12 significant pathways were strongly associated with redox and antioxidant responses, such as the insulin signaling pathway (ssc04910), AMPK signaling pathway (ssc04152), FoxO signaling pathway (ssc04068), adipocytokine signaling pathway (ssc04920), and MAPK signaling pathway (ssc04010). Furthermore, 12 of these 22 significantly enriched pathways were shared with the significantly enriched pathways found in the IFC group. This suggests that there was some similarity in the genetic background between IFC and a* value.
To further understand the mechanisms of genetic differences between high and low groups, GSEA was conducted. The results showed that 168 significantly enriched GO_GSEA terms (Table S8) and 61 significantly enriched KEGG_GSEA pathways (Table S9) were identified between H_IFC and L_IFC groups. Among these enriched GO_GSEA terms, the top 5 were related to mitochondrial metabolism and organismal oxidoreductase activity. In terms of KEGG_GSEA, several significant pathways associated with lipid and fatty acid metabolism were enriched, such as oxidative phosphorylation (ssc00190), fatty acid metabolism (ssc01212), adipocytokine signaling pathway (ssc04920) and ether lipid metabolism (ssc00565). For a* value, 390 significantly enriched GO_GSEA terms (Table S10) and 76 significantly enriched KEGG_GSEA pathways (Table S11) were identified between the H_a* and L_a* groups. Redox reactions are an essential factor influencing a* value; the top 5 of significantly enriched GO_GSEA terms were mainly related to the cellular response to an organic substance, oxidoreductase activity, and positive regulation of the developmental process. KEGG_GSEA results showed that more than 60% of the significantly enriched pathways in the H_a* and L_a* groups were consistent with those significantly enriched in the high and low IFC groups. These overlapping pathways included the above-mentioned lipid metabolic pathways, such as ssc00190, ssc01212, and ssc00565. These results predicted that lipid and fatty acid metabolism were essential factors influencing changes in a* value.
3.4 Co-expressed gene modules associated with IFC and a* value
The expression matrix containing 10,512 genes from 19 individuals was used to WGCNA. Hierarchical cluster analysis revealed no outliers among 19 samples (Figure S1A). To build a scale-free network, we choose a soft threshold = 18, with a scale-free topology fitting index R2 > 0.90 (Figure S1B). In this study, nine gene coexpression modules were identified (Figure 5A). The module with the minimum number of genes among these modules was the dark orange module, containing 82 genes, while the maximum number of genes was in the dark red module, including 4,367 genes (Figure 5B). Correlation analysis between module eigengene and IFC or a* value was performed, and four modules, including purple, dark grey, dark red, and black, were significantly correlated with IFC and a* value (Figure 5C, Figure S2, Figure S3). Notely, among these four significant modules, the purple module positively correlated with both IFC and a* value. In contrast, the dark grey, dark red, and black modules exhibited negative correlations with IFC and a* value. These four modules contained a total of 6,045 genes encoding proteins. Subsequently, we focused on 6,045 genes for subsequent functional enrichment analysis. Details of 6,045 genes are shown in Table S12.
3.5 Functional enrichment analysis for the four key modules
The significant GO_WGCNA terms and KEGG_WGCNA pathways (q value < 0.10) are presented in Tables S13 and S14. The GO_WGCNA results showthat genes in the black red module were significantly enriched in 35 GO terms, which were mainly related to IFC and a*, such as regulation of catabolic process (GO:0009894), RNA binding (GO:0003723), negative regulation of lipid localization (GO:1905953) and oxidoreduction-driven active transmembrane transporter activity (GO:0015453). From KEGG_WGCNA analysis results, 156 pathways were significantly enriched, and most of the significant pathways were related to lipid deposition, decomposition, and oxidation-reduction reactions. These pathways were critical in the regulation of both IFC and a*, such as the adipocytokine signaling pathway (ssc04920), FoxO signaling pathway (ssc04068), MAPK signaling pathway (ssc04010), and oxidative phosphorylation (ssc00190).
In the black module, the functional enrichment results showed that 41 GO_WGCNA terms and 86 pathways were significantly enriched. These significant GO_WGCNA terms were mainly involved in phosphorylation (GO:0016310), response to oxygen-containing compound (GO:1901700), actin cytoskeleton (GO:0015629), and calcium ion binding (GO:0005509). The significant pathways related to lipid metabolism and oxidative reactions mainly included regulation of lipolysis in adipocytes (ssc04923), glycerolipid metabolism (ssc00561), PI3K-Akt signaling pathway (ssc04151), MAPK signaling pathway (ssc04010), and Wnt signaling pathway (ssc04310).
Genes in the purple module were significantly enriched with 6 GO_WGCNA terms and 14 KEGG_WGCNA pathways. These GO terms were mainly involved in extracellular matrix organization (GO:0030198) and collagen binding (GO:0005518). Among these significant KEGG_WGCNA pathways, four were associated with IFC, such as fatty acid metabolism (ssc01212), insulin resistance (ssc04931), calcium signaling pathway (ssc04020), and fatty acid degradation (ssc00071). Genes in the black grey modules were not significantly enriched in GO terms and KEGG pathway might be due to the limitation of the number of genes in this module.
3.6 Identification of candidate genes related to IFC and a* value
To determine the candidate genes affecting IFC and a* value, we first screened the overlapping GO terms and KEGG pathways for each trait based on the functional enrichment analysis results of overlapping DEGs, GSEA, and WGCNA. The DEGs in the overlapping GO terms and KEGG pathways were selected as candidate genes. Finally, hub genes with connectivity exceeding ten were obtained by constructinga PPI network of candidate genes. For IFC, 2 overlapping GO terms, and 11 overlapping pathways were identified (Figure 6A,B). Most of these overlapping GO terms and pathways were involved in lipid metabolism, such as response to oxygen-containing compound (GO:1901700), DNA-binding transcription factor activity (GO:0003700), insulin resistance (ssc04931), MAPK signaling pathway (ssc04010), adipocytokine signaling pathway (ssc04920), HIF-1 signaling pathway (ssc04066), and FoxO signaling pathway (ssc04068). For a* value, 7 overlapping GO terms, and 10 overlapping pathways were identified (Figure 6C,D). Most of these overlapping GO terms and pathways were involved in oxidative phosphorylation, system development, and lipid metabolism, such as response to oxygen-containing compound (GO:1901700), negative regulation of signaling (GO:0023057), response to wounding (GO:0009611), circulatory system development (GO:0072359), FoxO signaling pathway (ssc04068), adipocytokine signaling pathway (ssc04920), MAPK signaling pathway (ssc04010), and HIF-1 signaling pathway (ssc04066).
We selected terms and pathways associated with lipid metabolism and redox in overlapping GO terms and KEGG pathways, and DEGs located in these terms and pathways were considered candidate genes. The selected GO terms and KEGG pathways for IFC and a* value are shown in Table 1 and Table 2. The results showed that 47 and 53 genes were considered candidate genes for IFC and a* value, respectively. These candidate genes were used for subsequent PPI network construction. It was worth noting that among these two traits, there was one GO term (response to oxygenated compounds) and three KEGG pathways (adipocyte cytokine signaling pathway, MAPK signaling pathway, and HIF-1 signaling pathway) that were consistent, and these two traits shared 18 candidate genes.
3.7 Hub genes
The interaction relationships of candidate genes affecting IFC and a* value were obtained by constructing PPI networks. A PPI network, including 32 nodes and 101 edges, was constructed for IFC, and the minimum interaction score requirement was more significant than 0.4 (Figure 7A). According to the degree of connectivity, six genes (ATF3, SOX9, PPARGC1A, CEBPB, MYC, and VEGFA) with connectivity greater than 10 were identified as hub genes. The interactive subnetwork, including the five hub genes, was extracted and established from the whole PPI network (Figure 7B). Functional enrichment analysis showed that CEBPB, SOX9, and PPARGC1A were mainly involved in the transcriptional regulation of white adipocyte differentiation and the regulation of fatty acid oxidation.
For a* value, a PPI network, including 38 nodes and 174 edges, was constructed, and the minimum interaction score requirement was > 0.4 (Figure 7C). According to the degree of connectivity, 14 genes (IL6, VEGFA, MYC, EGR1, CEBPB, JUNB, THBS1, SERPINE1, SOCS3, DUSP1, SOX9, PPARGC1A, CCL2, and FOXO1) with the connectivity greater than ten were identified as hub genes. The interactive subnetwork, including the 13 hub genes, was extracted and established from the whole PPI network (Figure 7D). Functional enrichment analysis showed that SOCS3, IL6, FOXO1, CEBPB, SOX9, and PPARGC1A were mainly involved in the adipocytokine signaling pathway, insulin resistance, FoxO signaling pathway, AMPK signaling pathway, and PI3K-Akt signaling pathway. Notably, MYC, CEBPB, SOX9, and PPARGC1A were considered hub genes (transcription factors) affecting both traits, and their expression levels were significantly higher in the low group than in the high group. Subsequently, we queried the functions of these four hub genes on the GeneCard and PubMed website, and found that MYC, SOX9, and CEBPB are transcription factors. Meanwhile, it was found that SOX9 could bind to the CEBPB promoter, and CEBPB could bind to PPARGC1A to form a complex, thereby regulating fatty acid beta-oxidation. Thus, we hypothesized that the SOX9/CEBPB/PPARGC1A axis could co-regulate lipid metabolism and myoglobin redox response.
4. Discussion
DLY pork is dominated in the pork industry, however, its IFC is low, and the meat exhibits a paler color, resulting in limited competitiveness within the premium pork market segment [33,34]. As a result, breeders are eager to undertake genetic improvements in both IFC and redness (a*) meat color concurrently to cater to consumer market demands. In this study, a highly significant positive correlation (R = 0.309, P < 0.001) between IFC and the a* value was observed, which is similar to previous reports by Mortimer et al. [10] and Zhang et al. [11], where they discovered the correlation coefficients of IFC and a* value were 0.260 and 0.323, respectively. Those suggest that there might be similarities in the genetic background regulating changes in both IFC and redness value. Consequently, transcriptome analysis was conducted using the individuls with extreme IFC and a* value to identify hub genes and metabolic pathways co-regulating IFC and rendess of prok.
In the present study, we analyzed DEGs using three R packages, DESeq2, limma, and edgeR, in the H_IFC (H_a) and L_IFC (L_a) groups. We found that the number of DEGs obtained by these three methods was different, with the DESeq2 method obtaining the highest count of DEGs (723 and 590 DEGs in the IFC and a* groups, respectively), while the number of DEGs obtained by the limma and edgeR methods was similar. All three methods, limma, edgeR, and DESeq2, are widely used and well-established tools in transcriptome analysis. However, these three methods may yield different sets of DEGs due to variations in their statistical model, methods, and assumptions [35]. DESeq2 uses a negative binomial distribution [25], edgeR uses a negative binomial model with a dispersion parameter [27], and limma employs an empirical Bayes approach with linear modeling [26]. All methods could handle various experimental designs; limma was particularly well-suited for experiments with complex structures and might offer faster computation for medium to large datasets. DESeq2 and edgeR were well-suited for experiments with fewer replicates and small-sample size data. Moreover, each software employs its normalization methods. For example, DESeq2 used the "size factors" approach, edgeR used the "trimmed mean of M-values" (TMM), and limma employed a linear modeling-based approach [35]. Although there are some differences among the DEGs obtained by these three methods, the genes that contribute to the phenotypic variations should be stable and genuine rather than affected by variations in the detection methods. Consequently, we focused on the overlapping DEGs that were consistently detected by all three methods for subsequent functional enrichment analysis.
We performed functional enrichment analysis using the overlapping DEGs described above, which were closely related to lipolysis, adipocytokines, redox, and antioxidant responses, such as the adipocytokine signaling pathway, regulation of lipolysis in adipocytes, MAPK signaling pathway, and FoxO signaling pathway. These significantly enriched pathways played a crucial role in the process of IFC deposition and a* value changes. Because conventional functional enrichment analysis focuses only on DEGs, it might not provide a holistic view of the broader biological landscape. GSEA provided a comprehensive and holistic perspective on transcriptomic changes. By considering all genes rather than DEGs, GSEA offered the advantage of capturing subtle but coordinated expression patterns across the entire transcriptome. This approach helps identify biological pathways and processes that might contribute to observed changes, including those involving non-differentially expressed genes [36]. Compared to functional enrichment analysis based on DEGs, GSEA analysis specifically identified several enriched pathways associated with IFC deposition and a* value, such as fatty acid metabolism, glycosphingolipid biosynthesis, oxidoreductase activity, and oxidative phosphorylation. Similar to our results, Liu et al. [37] and Kim et al. [38] conducted GSEA in pigs and found significantly enriched pathways related to IFC and meat color, including the oxidative phosphorylation, AMPK, and MAPK signaling pathways.
WGCNA is a bioinformatics analysis technique utilized to depict gene correlation patterns among distinct samples, and facilitates clustering genes with highly similar expression patterns into specific modules, subsequently analyzing the associations between modules and particular traits or phenotypes [30]. This method has been successfully applied in the genetic analysis of various essential economic traits in pigs [13,39,40,41,42,43]. In this study, WGCNA was performed to detect the vital genes and modules associated with IFC and a* values using transcriptome data from 19 samples. The results of the WGCNA showed that the purple module demonstrated a positive correlation with both IFC and a* value. In contrast, the dark grey, dark red, and black modules exhibited negative correlations with IFC and a* value. These four modules contained a total of 6,045 genes encoding proteins. Based on the overlap analysis between the DEGs (DEGs of IFC and DEGs of a* value) and the WGCNA results, more than 70% of the DEGs could be detected by the WGCNA, indicating the similarity between these two analysis methods and further proving the reliability of the results of this study. However, some genes associated with IFC and a* value identified by WGCNA did not exhibit differential expression in high and low groups. This observation suggests that WGCNA could recognize additional information by establishing interconnected networks between genes, aligning well with the foundational principles of WGCNA. This was consistent with the findings of Xing et al. [13].
Both IFC and a* values are complex quantitative traits that may be regulated by multiple small-effect genes [44]. In the present study, differential gene expression analysis, WGCNA, and functional enrichment analysis under various conditions were performed. A large number of genes significantly associated with IFC and a* values were identified. However, as these two traits are both of medium to high heritability [5,6], it is hypothesized that large-effect genes regulating them may be existed. Furthermore, due to the significant correlation between these two traits, it is likely that there may also be molecular pathways that regulate them simultaneously. To effectively reduce the number of genes associated with IFC and a* values, we performed overlap analysis of significantly enriched GO terms and KEGG pathways derived from overlapping DEGs, GESA, and WGCNA. DEGs located in the overlapping GO terms and KEGG pathways affecting IFC and a* value were considered candidate genes. Two overlapping GO terms and eleven overlapping KEGG pathways were identified for IFC. Similarly, for the a* value, seven overlapping GO terms and ten overlapping KEGG pathways were identified. We focused on GO terms and pathways that may be involved in IFC deposition and a* value alterations, as shown in Table 2 and Table 3. Response to oxygen-containing compound (GO:1901700) was a GO term that was significantly enriched for both traits (Table 2). This biological process entails a modification in the state or activity of a cell or organism (involving aspects such as movement, secretion, enzyme production, gene expression, etc.) due to stimulation by an oxygen-containing compound. This process may directly or indirectly affect the oxidation of fatty acids and the redox reaction of myoglobin [45].
The IFC and a* value groups shared four significantly enriched pathways: the FoxO signaling pathway (ssc04068), adipocytokine signaling pathway (ssc04920), MAPK signaling pathway (ssc04010), and HIF-1 signaling pathway (ssc04066) (Table 3). The FoxO signaling pathway governs glucose and lipid metabolism by controlling genes associated with gluconeogenesis, glycogenolysis, and lipid metabolism [46]. It also impacts fatty acid oxidation and storage across diverse tissues [47]. Although the direct connection between the FoxO pathway and myoglobin oxidation is not extensively documented, it is conceivable that this pathway indirectly influences oxidative processes by regulating energy metabolism and responses to oxidative stress [48]. The adipocytokine signaling pathway is linked with adipocyte-related functions and metabolism. It modulates insulin sensitivity, glucose uptake, and lipid metabolism, affecting the release of adipokines that influence lipid homeostasis and inflammation [49]. This pathway likely indirectly affects myoglobin oxidation by influencing factors connected to metabolism and inflammation, thus potentially impacting oxidative processes in muscle tissues [50]. The MAPK signaling pathway is integral to various cellular processes, encompassing cell growth, differentiation, and metabolism. It can impact lipid metabolism by regulating genes related to lipogenesis, lipolysis, and fatty acid oxidation [51,52]. This pathway may contribute to muscle oxidative processes by mediating cellular reactions to stress, lipid peroxidation, and growth cues, thereby influencing myoglobin oxidation under specific conditions [53]. Activated in response to low oxygen levels, the HIF-1 signaling pathway orchestrates adaptive responses to hypoxia. It influences glycolysis, lipid, and energy metabolism when oxygen levels are low [54]. The HIF-1 pathway can affect myoglobin oxidation by regulating the response to hypoxia, potentially influencing oxidative metabolism and the role of myoglobin in oxygen transport and storage [55]. In summary, these pathways may play pivotal roles in both fatty acid metabolism and myoglobin oxidation.
The DEGs in Table 2 and Table 3 were considered candidate genes influencing IFC and a* values, and the PPI network was constructed (Figure 5), respectively. Based on the degree of connectivity, six genes (ATF3, SOX9, PPARGC1A, CEBPB, MYC, and VEGFA) with connectivity exceeding ten were regarded as hub genes potentially influencing IFC. Similarly, fourteen hub genes impacting the a* value were identified, including IL6, VEGFA, MYC, EGR1, CEBPB, JUNB, THBS1, SERPINE1, SOCS3, DUSP1, SOX9, PPARGC1A, CCL2, and FOXO1. ATF3 (activating transcription factor 3), a member of the CREB family of basic leucine zipper transcription factors (TFs), has been found that the deletion of ATF3 resulted in increased lipid body accumulation and ATF3 directly regulates transcription of the gene encoding cholesterol 25-hydroxylase [56]. VEGFA (vascular endothelial growth factor A) is crucial in vascular development in physiological and pathological processes. Increasing data suggest that VEGFA regulates lipid metabolism, but further studies are needed to elucidate the specific mechanisms [57,58]. IL6 (interleukin-6) is a pivotal regulatory factor for lipolysis and beta-oxidation. Numerous in vitro studies have substantiated that treatment with IL6 enhances lipolysis and beta-oxidation in both myotubes and adipocytes [59,60]. EGR1 (Early growth response 1) is a transcription factor. Mohtar et al. found that insulin/mTORC1-inducible EGR1 binds to the leptin promoter and activates leptin expression in 3T3-L1 adipocytes, regulating lipid metabolism [61]. The results of Yan et al. suggested that inhibition of JUNB might be a key indicator of the regulation of the APOA2-associated PPARα pathway [62]. APOA2 is a well-known member of the apolipoprotein family [63], and the PPARα pathway is also a key pathway in regulating lipid metabolism [64]. THBS1 (thrombospondin-1) is a prototypical matricellular protein. THBS1-null mice exhibited elevated free fatty acids and triglycerides compared to wild-type mice, suggesting impaired fatty acid uptake [65]. SERPINE1 (Serpin Family E Member 1), also known as plasminogen activator inhibitor type 1 (PAI-1), is a member of the serine proteinase inhibitor (serpin) superfamily. Several findings have shown that PAI-1 might promote the differentiation of mesenchymal stem cells toward adipogenesis, and PAI-1 deficiency attenuates changes in the levels of adipogenic genes such as PPARγ and aP2 [66,67]. SOCS3 (suppressor of cytokine signaling 3) plays an important role in regulating energy metabolism processes. In recent years, researchers have found that SOCS3 is involved in the AMPK signaling pathway, insulin resistance, adipocytokine signaling pathway, and JAK/STAT pathway and activated/triggered by leptin signal plays important roles in lipid metabolism processes [68,69,70]. DUSPs (dual-specificity phosphatases) are the key phosphatases in the MAPK pathway. Recently, DUSP1 was suggested to play a critical role in the switch from oxidative to glycolytic myofibers [71] and could regulate fatty acid oxidation [72]. CCL2 (chemokine ligand 2) is a member of the C–C motif family of chemokines. Kang et al. found that after CCL2 binds to its receptor CCR2, it could reduce lipid peroxidation by inhibiting CCR2, indicating its important regulatory role in lipid oxidation metabolism [72]. Current studies suggest that the transcription factor FOXO1 (forkhead box protein O1) is involved in lipid metabolism and lipolysis in adipocytes [73,74]. Song et al. found that interfering with FOXO1 negatively regulated the expression of adipogenic differentiation marker genes and lipid anabolism marker genes, thus reducing triglyceride content and inhibiting the generation of lipid droplets in bovine adipocytes [75].
It is worth noting that these two traits share four hub genes: MYC, CEBPB, SOX9, and PPARGC1A. MYC is a transcription factor that regulates cell proliferation and differentiation in healthy cellular processes. Hall et al. revealed that the activation of MYC led to the accumulation of cholesteryl esters stored in lipid droplets [76]. A previous study found that MYC was involved in the MAPK signaling pathway, promoting the glycolysis process in fish T cells [77]. In addition, MYC is involved in the WNT signaling pathway and serves as a target gene/transcriptome factor for WNT, regulating myogenesis [78]. CEBPB (CCAAT/enhancer binding protein β) is a member of the transcription factor family of CEBP. Several studies have reported that PPARGC1A (PPAR coactivator-1α, also known as PGC1α), a transcriptional co-activator of PPARγ, could bind to CEBPB and form a transcription complex. This complex could promote the transcription of CPT1A (carnitine palmitoyl transferase 1 A) and activate fatty acid β-oxidation [79,80]. SOX9 (Sex-determining region Y-type box-9) is a member of the Sox supergene family and has been proven to be an essential transcription factor in cartilage formation during chondrocyte proliferation [81]. Wang et al. confirmed that SOX9 could directly bind to the promoters of CEBPB and CEBPD, inhibit their promoter activity, and prevent adipocyte differentiation [82]. This evidence indicated that the SOX9/CEBPB/PPARGC1A axis might play an essential regulatory role in fatty acid β-oxidation. Myoglobin is an oxygen-binding hemeprotein generally localized to oxidative muscle and functions as an oxygen store and reactive oxygen species scavenger [83]. Schlater et al. confirmed that an increase in lipids could stimulate an increase in myoglobin content in muscle cells of C2C12 mice, which was closely related to fatty acid beta oxidation [84]. In summary, we speculated that the SOX9/CEBPB/PPARGC1A axis played a vital role in the co-regulation of IFC deposition and changes in redness of meat color. The expression levels of the upstream gene STAT3 (signal transducer and activator of transcription 3) and downstream CPT1A genes in the SOX9/CEBPB/PPARGC1A axis were also significantly different in both the high and low groups in this study, further supporting the importance of this pathway in the synergistic regulation of lipid and myoglobin metabolism. Thererore, it is particularly interesting to investigate the co-regulatory mechanism of the SOX9/CEBPB/PPARGC1A axis in IFC and a* value traits in further studies.
5. Conclusions
In this study, we identified six hub genes influencing IFC and 14 hub genes affecting a* value through integrating differential gene expression analysis, WGCNA, functional enrichment under various conditions, and PPI network analysis. These genes maninly participate in multiple lipid and myoglobin metabolism pathways. Moreover, we discovered that the SOX9/CEBPB/PPARGC1A axis is the potential pathway co-regulating lipid deposition and myoglobin redox reaction. These hub genes and the SOX9/CEBPB/PPARGC1A axis may critical for IFC and a* value, however, the functions and regulatory mechanism of these hub genes, particularly the SOX9/CEBPB/PPARGC1A axis, are still need to be further elucidated.
Supplementary Materials
The following supporting information can be downloaded at the website of this paper posted on Preprints.org.
Author Contributions
Writing – original draft preparation, B.W.; conceptualization, Z.X. and W.W.; investigation, B.W. and W.Y.; methodology and data analysis, B.W.; writing – review & editing, L.H., X.M., Z.X., and W.W. All authors have read and agreed to the published version of the manuscript.
Funding
This work was financially supported by the National Natural Science Foundation of China (grant no. 32302695), the Project of Seed Industry Revitalization in Jiangsu Province (JBGS2021024), the Zhejiang Science and Technology Major Program on Agricultural New Variety Breeding (2021C02068), the Key R & D projects of Zhejiang Province (2021C02007), and the China Agriculture Research System of MOF and MARA (CARS36).
Institutional Review Board Statement
All experimental protocols involving animals were approved by the Nanjing Agricultural University Animal Care and Use Committee (Certification No.: SYXK (Su) 2022-0031).
Informed Consent Statement
Not applicable.
Data Availability Statement
Not applicable.
Conflicts of Interest
The authors declare no conflict of interest.
References
- Duan, S.; Tang, X.; Li, W.; Huang, X. Analysis of the Differences in Volatile Organic Compounds in Different Muscles of Pork by GC-IMS. Molecules 2023, 28, 1726. [Google Scholar] [CrossRef] [PubMed]
- Moeller, S.J.; Miller, R.K.; Edwards, K.K.; Zerby, H.N.; Logan, K.E.; Aldredge, T.L.; Stahl, C.A.; Boggess, M.; Box-Steffensmeier, J.M. Consumer Perceptions of Pork Eating Quality as Affected by Pork Quality Attributes and End-Point Cooked Temperature. Meat Sci. 2010, 84, 14–22. [Google Scholar] [CrossRef] [PubMed]
- Liu, S.; Huang, J.; Wang, X.; Ma, Y. Transcription Factors Regulate Adipocyte Differentiation in Beef Cattle. Anim. Genet. 2020, 51, 351–357. [Google Scholar] [CrossRef]
- Sun, X.; Young, J.; Liu, J.H.; Bachmeier, L.; Somers, R.M.; Chen, K.J.; Newman, D. Prediction of Pork Color Attributes Using Computer Vision System. Meat Sci. 2016, 113, 62–64. [Google Scholar] [CrossRef] [PubMed]
- Wang, B.; Li, P.; Hou, L.; Zhou, W.; Tao, W.; Liu, C.; Liu, K.; Niu, P.; Zhang, Z.; Li, Q.; et al. Genome-Wide Association Study and Genomic Prediction for Intramuscular Fat Content in Suhuai Pigs Using Imputed Whole-Genome Sequencing Data. Evol. Appl. 2022, 15, 2054–2066. [Google Scholar] [CrossRef] [PubMed]
- Cabling, M.M.; Kang, H.S.; Lopez, B.M.; Jang, M.; Kim, H.S.; Nam, K.C.; Choi, J.G.; Seo, K.S. Estimation of Genetic Associations between Production and Meat Quality Traits in Duroc Pigs. Asian-Australasian J. Anim. Sci. 2015, 28, 1061–1065. [Google Scholar] [CrossRef] [PubMed]
- Shi-Zheng, G.; Su-Mei, Z. Physiology, Affecting Factors and Strategies for Control of Pig Meat Intramuscular Fat. Recent Pat. Food. Nutr. Agric. 2009, 1, 59–74. [Google Scholar] [CrossRef]
- Fernandez, X.; Monin, G.; Talmant, A.; Mourot, J.; Lebret, B. Influence of Intramuscular Fat Content on the Quality of Pig Meat — 1 Composition of the Lipid Fraction and Sensory Characteristics of m Longissimus Lumborum. Meat Sci. 1999, 53, 59–65. [Google Scholar] [CrossRef]
- Kim, G.-D.; Jeong, J.-Y.; Hur, S.-J.; Yang, H.-S.; Jeon, J.-T.; Joo, S.-T. The Relationship between Meat Color (CIE L* and A*), Myoglobin Content, and Their Influence on Muscle Fiber Characteristics and Pork Quality. Food Sci. Anim. Resour. 2010, 30, 626–633. [Google Scholar] [CrossRef]
- Mortimer, S.I.; van der Werf, J.H.J.; Jacob, R.H.; Hopkins, D.L.; Pannier, L.; Pearce, K.L.; Gardner, G.E.; Warner, R.D.; Geesink, G.H.; Hocking Edwards, J.E.; et al. Genetic Parameters for Meat Quality Traits of Australian Lamb Meat. Meat Sci. 2014, 96, 1016–1024. [Google Scholar] [CrossRef]
- Zhang, X.; Liu, C.; Kong, Y.; Li, F.; Yue, X. Effects of Intramuscular Fat on Meat Quality and Its Regulation Mechanism in Tan Sheep. Front. Nutr. 2022, 9, 1–13. [Google Scholar] [CrossRef] [PubMed]
- Cardoso, T.F.; Cánovas, A.; Canela-Xandri, O.; González-Prendes, R.; Amills, M.; Quintanilla, R. RNA-Seq Based Detection of Differentially Expressed Genes in the Skeletal Muscle of Duroc Pigs with Distinct Lipid Profiles. Sci. Rep. 2017, 7, 40005. [Google Scholar] [CrossRef] [PubMed]
- Xing, K.; Liu, H.; Zhang, F.; Liu, Y.; Shi, Y.; Ding, X.; Wang, C. Identification of Key Genes Affecting Porcine Fat Deposition Based on Co-Expression Network Analysis of Weighted Genes. J. Anim. Sci. Biotechnol. 2021, 12, 1–16. [Google Scholar] [CrossRef]
- Fernández-Barroso, M.Á.; García-Casco, J.M.; Núñez, Y.; Ramírez-Hidalgo, L.; Matos, G.; Muñoz, M. Understanding the Role of Myoglobin Content in Iberian Pigs Fattened in an Extensive System through Analysis of the Transcriptome Profile. Anim. Genet. 2022, 53, 352–367. [Google Scholar] [CrossRef] [PubMed]
- Xing, K.; Liu, H.; Zhang, F.; Liu, Y.; Shi, Y.; Ding, X.; Wang, C. Identification of Key Genes Affecting Porcine Fat Deposition Based on Co-Expression Network Analysis of Weighted Genes. J. Anim. Sci. Biotechnol. 2021, 12, 100. [Google Scholar] [CrossRef] [PubMed]
- Barabasi, A.-L.; Oltvai, Z.N. Network Biology: Understanding the Cell’s Functional Organization. Nat. Rev. Genet. 2004, 5, 101–113. [Google Scholar] [CrossRef]
- Talukdar, H.A.; Asl, H.F.; Jain, R.K.; Ermel, R.; Ruusalepp, A.; Franzén, O.; Kidd, B.A.; Readhead, B.; Giannarelli, C.; Kovacic, J.C. Cross-Tissue Regulatory Gene Networks in Coronary Artery Disease. Cell Syst. 2016, 2, 196–208. [Google Scholar] [CrossRef]
- Zhang, B.; Horvath, S. A General Framework for Weighted Gene Co-Expression Network Analysis. Stat. Appl. Genet. Mol. Biol. 2005, 4. [Google Scholar] [CrossRef]
- Zhao, X.; Wang, C.; Wang, Y.; Zhou, L.; Hu, H.; Bai, L.; Wang, J. Weighted Gene Co-Expression Network Analysis Reveals Potential Candidate Genes Affecting Drip Loss in Pork. Anim. Genet. 2020, 51, 855–865. [Google Scholar] [CrossRef]
- Wu, Z.; Gao, Z.; Liang, H.; Fang, T.; Wang, Y.; Du, Z.; Yang, C. Network Analysis Reveals Different Hub Genes and Molecular Pathways for Pig in Vitro Fertilized Early Embryos and Parthenogenotes. Reprod. Domest. Anim. 2022, 57, 1544–1553. [Google Scholar] [CrossRef]
- Supakankul, P.; Mekchay, S. Association of NLK Polymorphisms with Intramuscular Fat Content and Fatty Acid Composition Traits in Pigs. Meat Sci. 2016, 118, 61–65. [Google Scholar] [CrossRef] [PubMed]
- Bolger, A.M.; Lohse, M.; Usadel, B. Trimmomatic: A Flexible Trimmer for Illumina Sequence Data. Bioinformatics 2014, 30, 2114–2120. [Google Scholar] [CrossRef] [PubMed]
- Dobin, A.; Davis, C.A.; Schlesinger, F.; Drenkow, J.; Zaleski, C.; Jha, S.; Batut, P.; Chaisson, M.; Gingeras, T.R. STAR: Ultrafast Universal RNA-Seq Aligner. Bioinformatics 2013, 29, 15–21. [Google Scholar] [CrossRef] [PubMed]
- Liao, Y.; Smyth, G.K.; Shi, W. FeatureCounts: An Efficient General Purpose Program for Assigning Sequence Reads to Genomic Features. Bioinformatics 2014, 30, 923–930. [Google Scholar] [CrossRef] [PubMed]
- Love, M.I.; Huber, W.; Anders, S. Moderated Estimation of Fold Change and Dispersion for RNA-Seq Data with DESeq2. Genome Biol. 2014, 15, 550. [Google Scholar] [CrossRef] [PubMed]
- Ritchie, M.E.; Phipson, B.; Wu, D.I.; Hu, Y.; Law, C.W.; Shi, W.; Smyth, G.K. Limma Powers Differential Expression Analyses for RNA-Sequencing and Microarray Studies. Nucleic Acids Res. 2015, 43, 4. [Google Scholar] [CrossRef]
- Robinson, M.D.; McCarthy, D.J.; Smyth, G.K. EdgeR: A Bioconductor Package for Differential Expression Analysis of Digital Gene Expression Data. Bioinformatics 2010, 26, 139–140. [Google Scholar] [CrossRef]
- Haider, S.; Ballester, B.; Smedley, D.; Zhang, J.; Rice, P.; Kasprzyk, A. BioMart Central Portal—Unified Access to Biological Data. Nucleic Acids Res. 2009, 37, 23–27. [Google Scholar] [CrossRef]
- Wu, T.; Hu, E.; Xu, S.; Chen, M.; Guo, P.; Dai, Z.; Feng, T.; Zhou, L.; Tang, W.; Zhan, L. ClusterProfiler 40: A Universal Enrichment Tool for Interpreting Omics Data. Innov. 2021, 2, 100141. [Google Scholar] [CrossRef]
- Langfelder, P.; Horvath, S. WGCNA: An R Package for Weighted Correlation Network Analysis. BMC Bioinformatics 2008, 9, 559. [Google Scholar] [CrossRef]
- Szklarczyk, D.; Franceschini, A.; Wyder, S.; Forslund, K.; Heller, D.; Huerta-Cepas, J.; Simonovic, M.; Roth, A.; Santos, A.; Tsafou, K.P.; et al. STRING V10: Protein–Protein Interaction Networks, Integrated over the Tree of Life. Nucleic Acids Res. 2015, 43, 447–452. [Google Scholar] [CrossRef] [PubMed]
- Shannon, P.; Markiel, A.; Ozier, O.; Baliga, N.S.; Wang, J.T.; Ramage, D.; Amin, N.; Schwikowski, B.; Ideker, T. Cytoscape: A Software Environment for Integrated Models of Biomolecular Interaction Networks. Genome Res. 2003, 13, 2498–2504. [Google Scholar] [CrossRef] [PubMed]
- Chen, W.; Zeng, Q.; Xu, H.; Fang, G.; Wang, S.; Li, C.; Wang, Y.; Wang, H.; Zeng, Y. Comparison and Relationship between Meat Colour and Antioxidant Capacity of Different Pig Breeds. Anim. Prod. Sci. 2018, 58, 2152–2157. [Google Scholar] [CrossRef]
- Wang, H.; Wang, J.; Yang, D.; Liu, Z.; Zeng, Y.; Chen, W. Expression of Lipid Metabolism Genes Provides New Insights into Intramuscular Fat Deposition in Laiwu Pigs. Asian-Australasian J. Anim. Sci. 2020, 33, 390–397. [Google Scholar] [CrossRef] [PubMed]
- Liu, S.; Wang, Z.; Zhu, R.; Wang, F.; Cheng, Y.; Liu, Y. Three Differential Expression Analysis Methods for RNA Sequencing: Limma, EdgeR, DESeq2. JoVE Journal Vis. Exp. 2021, e62528. [Google Scholar] [CrossRef]
- Subramanian, A.; Tamayo, P.; Mootha, V.K.; Mukherjee, S.; Ebert, B.L.; Gillette, M.A.; Paulovich, A.; Pomeroy, S.L.; Golub, T.R.; Lander, E.S. Gene Set Enrichment Analysis: A Knowledge-Based Approach for Interpreting Genome-Wide Expression Profiles. Proc. Natl. Acad. Sci. 2005, 102, 15545–15550. [Google Scholar] [CrossRef] [PubMed]
- Liu, Y.; Long, H.; Feng, S.; Ma, T.; Wang, M.; Niu, L.; Zhang, X.; Wang, L.; Lei, Y.; Chen, Y.; et al. Trait Correlated Expression Combined with EQTL and ASE Analyses Identified Novel Candidate Genes Affecting Intramuscular Fat. BMC Genomics 2021, 22, 805. [Google Scholar] [CrossRef]
- Kim, S.-M.; Markkandan, K.; Lee, J.-Y.; Kim, G.-W.; Yoo, J.Y. Transcriptome Profiling Associated with Carcass Quality of Loin Muscles in Crossbred Pigs. Animals 2020, 10. [Google Scholar] [CrossRef]
- Gong, Y.; He, J.; Li, B.; Xiao, Y.; Zeng, Q.; Xu, K.; Duan, Y.; He, J.; Ma, H. Integrated Analysis of Lncrna and Mrna in Subcutaneous Adipose Tissue of Ningxiang Pig. Biology (Basel). 2021, 10, 1–22. [Google Scholar] [CrossRef]
- Liu, X.; Zhang, J.; Xiong, X.; Chen, C.; Xing, Y.; Duan, Y.; Xiao, S.; Yang, B.; Ma, J. An Integrative Analysis of Transcriptome and GWAS Data to Identify Potential Candidate Genes Influencing Meat Quality Traits in Pigs. Front. Genet. 2021, 12, 1–13. [Google Scholar] [CrossRef]
- Wang, H.; Wang, X.; Li, M.; Wang, S.; Chen, Q.; Lu, S. Identification of Key Sex-Specific Pathways and Genes in the Subcutaneous Adipose Tissue from Pigs Using WGCNA Method. BMC Genomic Data 2022, 23, 1–13. [Google Scholar] [CrossRef] [PubMed]
- Zhang, P.; Li, Q.; Wu, Y.; Zhang, Y.; Zhang, B.; Zhang, H. Identification of Candidate Genes That Specifically Regulate Subcutaneous and Intramuscular Fat Deposition Using Transcriptomic and Proteomic Profiles in Dingyuan Pigs. Sci. Rep. 2022, 12, 1–13. [Google Scholar] [CrossRef] [PubMed]
- Zappaterra, M.; Gioiosa, S.; Chillemi, G.; Zambonelli, P.; Davoli, R. Muscle Transcriptome Analysis Identifies Genes Involved in Ciliogenesis and the Molecular Cascade Associated with Intramuscular Fat Content in Large White Heavy Pigs. PLoS One 2020, 15, 1–29. [Google Scholar] [CrossRef] [PubMed]
- Liu, X.; Zhou, L.; Xie, X.; Wu, Z.; Xiong, X.; Zhang, Z.; Yang, J.; Xiao, S.; Zhou, M.; Ma, J.; et al. Muscle Glycogen Level and Occurrence of Acid Meat in Commercial Hybrid Pigs Are Regulated by Two Low-Frequency Causal Variants with Large Effects and Multiple Common Variants with Small Effects. Genet. Sel. Evol. 2019, 51, 1–16. [Google Scholar] [CrossRef] [PubMed]
- Freitas, A.A. Investigating the Role of Simpson’s Paradox in the Analysis of Top-Ranked Features in High-Dimensional Bioinformatics Datasets. Brief. Bioinform. 2020, 21, 421–428. [Google Scholar] [CrossRef]
- Lee, S.; Dong, H.H. FoxO Integration of Insulin Signaling with Glucose and Lipid Metabolism. J. Endocrinol. 2017, 233, 67–79. [Google Scholar] [CrossRef]
- Chen, S.; Lu, Z.; Jia, H.; Yang, B.; Liu, C.; Yang, Y.; Zhang, S.; Wang, Z.; Yang, L.; Li, S.; et al. Hepatocyte-Specific Mas Activation Enhances Lipophagy and Fatty Acid Oxidation to Protect against Acetaminophen-Induced Hepatotoxicity in Mice. J. Hepatol. 2023, 78, 543–557. [Google Scholar] [CrossRef]
- Egan, B.; Zierath, J.R. Exercise Metabolism and the Molecular Regulation of Skeletal Muscle Adaptation. Cell Metab. 2013, 17, 162–184. [Google Scholar] [CrossRef]
- Gu, H.; Li, J.; Ying, F.; Zuo, B.; Xu, Z. Analysis of Differential Gene Expression of the Transgenic Pig with Overexpression of PGC1α in Muscle. Mol. Biol. Rep. 2019, 46, 3427–3435. [Google Scholar] [CrossRef]
- Jorge, M.L.M.P.; de Oliveira, V.N.; Resende, N.M.; Paraiso, L.F.; Calixto, A.; Diniz, A.L.D.; Resende, E.S.; Ropelle, E.R.; Carvalheira, J.B.; Espindola, F.S.; et al. The Effects of Aerobic, Resistance, and Combined Exercise on Metabolic Control, Inflammatory Markers, Adipocytokines, and Muscle Insulin Signaling in Patients with Type 2 Diabetes Mellitus. Metabolism 2011, 60, 1244–1252. [Google Scholar] [CrossRef]
- Bost, F.; Aouadi, M.; Caron, L.; Even, P.; Belmonte, N.; Prot, M.; Dani, C.; Hofman, P.; Pagès, G.; Pouysségur, J.; et al. The Extracellular Signal–Regulated Kinase Isoform ERK1 Is Specifically Required for In Vitro and In Vivo Adipogenesis. Diabetes 2005, 54, 402–411. [Google Scholar] [CrossRef] [PubMed]
- Zhang, Q.; Sun, X.; Xiao, X.; Zheng, J.; Li, M.; Yu, M.; Ping, F.; Wang, Z.; Qi, C.; Wang, T.; et al. Effects of Maternal Chromium Restriction on the Long-Term Programming in MAPK Signaling Pathway of Lipid Metabolism in Mice. Nutrients 2016, 8. [Google Scholar] [CrossRef] [PubMed]
- Xu, L.; Zhang, H.; Yue, H.; Wu, S.; Yang, H.; Wang, Z.; Qi, G. Gas Stunning with CO2 Affected Meat Color, Lipid Peroxidation, Oxidative Stress, and Gene Expression of Mitogen-Activated Protein Kinases, Glutathione S-Transferases, and Cu/Zn-Superoxide Dismutase in the Skeletal Muscles of Broilers. J. Anim. Sci. Biotechnol. 2018, 9, 37. [Google Scholar] [CrossRef] [PubMed]
- Zhang, W.; Han, B.; Zhang, H.; Fu, R.; Lu, Y.; Zhang, G. Integrated Transcriptomic and Metabolomic Analysis of Cortical Neurons Reveals Dysregulated Lipid Metabolism, Enhanced Glycolysis and Activated HIF-1 Signaling Pathways in Acute Hypoxia. Heliyon 2023, 9, e14949. [Google Scholar] [CrossRef]
- Elkholi, I.E.; Elsherbiny, M.E.; Emara, M. Myoglobin: From Physiological Roles to Potential Implications in Cancer. Biochim. Biophys. Acta - Rev. Cancer 2022, 1877, 188706. [Google Scholar] [CrossRef]
- Gold, E.S.; Ramsey, S.A.; Sartain, M.J.; Selinummi, J.; Podolsky, I.; Rodriguez, D.J.; Moritz, R.L.; Aderem, A. ATF3 Protects against Atherosclerosis by Suppressing 25-Hydroxycholesterol–Induced Lipid Body Formation. J. Exp. Med. 2012, 209, 807–817. [Google Scholar] [CrossRef]
- Heinonen, S.E.; Kivelä, A.M.; Huusko, J.; Dijkstra, M.H.; Gurzeler, E.; Mäkinen, P.I.; Leppänen, P.; Olkkonen, V.M.; Eriksson, U.; Jauhiainen, M.; et al. The Effects of VEGF-A on Atherosclerosis, Lipoprotein Profile, and Lipoprotein Lipase in Hyperlipidaemic Mouse Models. Cardiovasc. Res. 2013, 99, 716–723. [Google Scholar] [CrossRef]
- Stathopoulou, M.G.; Bonnefond, A.; Ndiaye, N.C.; Azimi-Nezhad, M.; El Shamieh, S.; Saleh, A.; Rancier, M.; Siest, G.; Lamont, J.; Fitzgerald, P. A Common Variant Highly Associated with Plasma VEGFA Levels Also Contributes to the Variation of Both LDL-C and HDL-C. J. Lipid Res. 2013, 54, 535–541. [Google Scholar] [CrossRef]
- Al-Khalili, L.; Bouzakri, K.; Glund, S.; Lönnqvist, F.; Koistinen, H.A.; Krook, A. Signaling Specificity of Interleukin-6 Action on Glucose and Lipid Metabolism in Skeletal Muscle. Mol. Endocrinol. 2006, 20, 3364–3375. [Google Scholar] [CrossRef]
- Carey, A.L.; Steinberg, G.R.; Macaulay, S.L.; Thomas, W.G.; Holmes, A.G.; Ramm, G.; Prelovsek, O.; Hohnen-Behrens, C.; Watt, M.J.; James, D.E. Interleukin-6 Increases Insulin-Stimulated Glucose Disposal in Humans and Glucose Uptake and Fatty Acid Oxidation in Vitro via AMP-Activated Protein Kinase. Diabetes 2006, 55, 2688–2697. [Google Scholar] [CrossRef]
- Mohtar, O.; Ozdemir, C.; Roy, D.; Shantaram, D.; Emili, A.; Kandror, K. V Egr1 Mediates the Effect of Insulin on Leptin Transcription in Adipocytes. J. Biol. Chem. 2019, 294, 5784–5789. [Google Scholar] [CrossRef] [PubMed]
- Yan, P.; Zhou, B.; Ma, Y.; Wang, A.; Hu, X.; Luo, Y.; Yuan, Y.; Wei, Y.; Pang, P.; Mao, J. Tracking the Important Role of JUNB in Hepatocellular Carcinoma by Single-cell Sequencing Analysis. Oncol Lett 2020, 19, 1478–1486. [Google Scholar] [CrossRef] [PubMed]
- Ballester, M.; Revilla, M.; Puig-Oliveras, A.; Marchesi, J.A.P.; Castelló, A.; Corominas, J.; Fernández, A.I.; Folch, J.M. Analysis of the Porcine APOA2 Gene Expression in Liver, Polymorphism Identification and Association with Fatty Acid Composition Traits. Anim. Genet. 2016, 47, 552–559. [Google Scholar] [CrossRef]
- Lefebvre, P.; Chinetti, G.; Fruchart, J.-C.; Staels, B. Sorting out the Roles of PPARα in Energy Metabolism and Vascular Homeostasis. J. Clin. Invest. 2006, 116, 571–580. [Google Scholar] [CrossRef]
- Kong, P.; Gonzalez-Quesada, C.; Li, N.; Cavalera, M.; Lee, D.-W.; Frangogiannis, N.G. Thrombospondin-1 Regulates Adiposity and Metabolic Dysfunction in Diet-Induced Obesity Enhancing Adipose Inflammation and Stimulating Adipocyte Proliferation. Am. J. Physiol. Metab. 2013, 305, 439–450. [Google Scholar] [CrossRef] [PubMed]
- Tamura, Y.; Kawao, N.; Okada, K.; Yano, M.; Okumoto, K.; Matsuo, O.; Kaji, H. Plasminogen Activator Inhibitor-1 Is Involved in Streptozotocin-Induced Bone Loss in Female Mice. Diabetes 2013, 62, 3170–3179. [Google Scholar] [CrossRef]
- Hu, Q.; Peng, J.; Chen, X.; Li, H.; Song, M.; Cheng, B.; Wu, T. Obesity and Genes Related to Lipid Metabolism Predict Poor Survival in Oral Squamous Cell Carcinoma. Oral Oncol. 2019, 89, 14–22. [Google Scholar] [CrossRef]
- Yang, X.; Jia, J.; Yu, Z.; Duanmu, Z.; He, H.; Chen, S.; Qu, C. Inhibition of JAK2/STAT3/SOCS3 Signaling Attenuates Atherosclerosis in Rabbit. BMC Cardiovasc. Disord. 2020, 20, 133. [Google Scholar] [CrossRef]
- Fang, S.; Feng, J.; Zhang, H.; Li, P.; Zhang, Y.; Zeng, Y.; Cai, Y.; Lin, X.; Xue, Y.; Guan, M. MiR-455 Targeting SOCS3 Improve Liver Lipid Disorders in Diabetic Mice. Adipocyte 2020, 9, 179–188. [Google Scholar] [CrossRef]
- Liu, Z.; Gan, L.; Yang, X.; Zhang, Z.; Sun, C. Hydrodynamic Tail Vein Injection of SOCS3 Eukaryotic Expression Vector in Vivo Promoted Liver Lipid Metabolism and Hepatocyte Apoptosis in Mouse. Biochem. Cell Biol. 2014, 92, 119–125. [Google Scholar] [CrossRef]
- Flach, R.J.R.; Qin, H.; Zhang, L.; Bennett, A.M. Loss of Mitogen-Activated Protein Kinase Phosphatase-1 Protects from Hepatic Steatosis by Repression of Cell Death-Inducing DNA Fragmentation Factor A (DFFA)-like Effector C (CIDEC)/Fat-Specific Protein 27*. J. Biol. Chem. 2011, 286, 22195–22202. [Google Scholar] [CrossRef]
- Roth, R.J.; Le, A.M.; Zhang, L.; Kahn, M.; Samuel, V.T.; Shulman, G.I.; Bennett, A.M. MAPK Phosphatase-1 Facilitates the Loss of Oxidative Myofibers Associated with Obesity in Mice. J. Clin. Invest. 2009, 119, 3817–3829. [Google Scholar] [CrossRef] [PubMed]
- Chakrabarti, P.; Kandror, K. V FoxO1 Controls Insulin-Dependent Adipose Triglyceride Lipase (ATGL) Expression and Lipolysis in Adipocytes*. J. Biol. Chem. 2009, 284, 13296–13300. [Google Scholar] [CrossRef] [PubMed]
- Chakrabarti, P.; English, T.; Karki, S.; Qiang, L.; Tao, R.; Kim, J.; Luo, Z.; Farmer, S.R.; Kandror, K. V SIRT1 Controls Lipolysis in Adipocytes via FOXO1-Mediated Expression of ATGL. J. Lipid Res. 2011, 52, 1693–1701. [Google Scholar] [CrossRef] [PubMed]
- Song, Y.; Zhang, J.; Jiang, C.; Song, X.; Wu, H.; Zhang, J.; Raza, S.H.A.; Zhang, L.; Zhang, L.; Cai, B.; et al. FOXO1 Regulates the Formation of Bovine Fat by Targeting CD36 and STEAP4. Int. J. Biol. Macromol. 2023, 248, 126025. [Google Scholar] [CrossRef]
- Hall, Z.; Wilson, C.H.; Burkhart, D.L.; Ashmore, T.; Evan, G.I.; Griffin, J.L. Myc Linked to Dysregulation of Cholesterol Transport and Storage in Nonsmall Cell Lung Cancer. J. Lipid Res. 2020, 61, 1390–1399. [Google Scholar] [CrossRef]
- Wei, X.; Zhang, Y.; Li, C.; Ai, K.; Li, K.; Li, H.; Yang, J. The Evolutionarily Conserved MAPK/Erk Signaling Promotes Ancestral T-Cell Immunity in Fish via c-Myc–Mediated Glycolysis. J. Biol. Chem. 2020, 295, 3000–3016. [Google Scholar] [CrossRef]
- Karczewska-Kupczewska, M.; Stefanowicz, M.; Matulewicz, N.; Nikołajuk, A.; Strączkowski, M. Wnt Signaling Genes in Adipose Tissue and Skeletal Muscle of Humans With Different Degrees of Insulin Sensitivity. J. Clin. Endocrinol. Metab. 2016, 101, 3079–3087. [Google Scholar] [CrossRef]
- Du, Q.; Tan, Z.; Shi, F.; Tang, M.; Xie, L.; Zhao, L.; Li, Y.; Hu, J.; Zhou, M.; Bode, A.; et al. PGC1α/CEBPB/CPT1A Axis Promotes Radiation Resistance of Nasopharyngeal Carcinoma through Activating Fatty Acid Oxidation. Cancer Sci. 2019, 110, 2050–2062. [Google Scholar] [CrossRef]
- Wu, H.; Liu, B.; Chen, Z.; Li, G.; Zhang, Z. MSC-Induced LncRNA HCP5 Drove Fatty Acid Oxidation through MiR-3619-5p/AMPK/PGC1α/CEBPB Axis to Promote Stemness and Chemo-Resistance of Gastric Cancer. Cell Death Dis. 2020, 11, 233. [Google Scholar] [CrossRef]
- Akiyama, H. Control of Chondrogenesis by the Transcription Factor Sox9. Mod. Rheumatol. 2008, 18, 213–219. [Google Scholar] [CrossRef] [PubMed]
- Wang, Y.; Sul, H.S. Pref-1 Regulates Mesenchymal Cell Commitment and Differentiation through Sox9. Cell Metab. 2009, 9, 287–302. [Google Scholar] [CrossRef] [PubMed]
- Gödecke, A. Myoglobin: safeguard of myocardial oxygen supply during systolic compression? Cardiovasc. Res. 2010, 87, 4–5. [Google Scholar] [CrossRef] [PubMed]
- Schlater, A.E.; De Miranda Jr, M.A.; Frye, M.A.; Trumble, S.J.; Kanatous, S.B. Changing the Paradigm for Myoglobin: A Novel Link between Lipids and Myoglobin. J. Appl. Physiol. 2014, 117, 307–315. [Google Scholar] [CrossRef] [PubMed]
Figure 1.
Statistical analysis of intramuscular fat content (IFC) and meat color redness (a*) values. (A) Phenotypic values of IFC and a* value. (B) Correlation analysis of IFC and a* value.
Figure 1.
Statistical analysis of intramuscular fat content (IFC) and meat color redness (a*) values. (A) Phenotypic values of IFC and a* value. (B) Correlation analysis of IFC and a* value.
Figure 2.
IFC and a* value comparasion between the high and low groups. (A) Representative plots of latissimus dorsi (LD) tissue and H&E staining of shared samples from the low IFC group and low a* group. (B) Representative plots of LD tissue and H&E staining of shared samples from the high IFC group and high a* group. (C) Comparasion of IFC and a* value in different groups. Error bars represent standard deviation (SD), where yellow bar represents IFC and blue bar represents a* value. *P < 0.05, **P < 0.01, ***P < 0.001, two-tailed Student’s t-test.
Figure 3.
Identification of differentially expressed genes (DEGs). (A) Venn diagram of DEGs identified using the DESeq2, limma, and edgeR packages for IFC. (B) Heatmap of overlapping DEGs between the H_IFC and L_IFC groups. (C) Venn diagram of DEGs identified using the DESeq2, limma, and edgeR packages for a* value. (D) Heatmap of overlapping DEGs between the H_a* and L_a* groups.
Figure 4.
GO and KEGG enrichment analysis of overlapping DEGs. (A) Top 5 GO terms of overlapping DEGs for IFC in the BP, CC and MF categories. (B) Significantly enriched KEGG pathways of overlapping DEGs for IFC. (C) Top 5 GO terms of overlapping DEGs for a* value in BP, CC and MF categories. (B) Significantly enriched KEGG pathways of overlapping DEGs for a* value.
Figure 5.
Weighted gene co-expression network analysis (WGCNA). (A) Gene dendrogram was obtained by clustering the dissimilarity based on consensus Topological Overlap with the corresponding module colors indicated by the color row. (B) The number of genes contained in each module. (C) Matrix with module-trait relationships (MTRs) and corresponding P values between the detected modules on the y-axis and traits (IFC and a* value) on the x-axis.
Figure 6.
Venn diagrams of significantly enriched GO terms and KEGG pathways based on DEGs, GSEA and WGCNA conditions. (A) Venn diagrams of significantly enriched GO terms under three conditions for IFC. (B) Venn diagrams of significantly enriched KEGG pathways under three conditions for IFC. (C) Venn diagrams of significantly enriched GO terms under three conditions for a* value. (D) Venn diagrams of significantly enriched KEGG pathways under three conditions for a* value.
Figure 7.
Protein-protein interaction (PPI) network for the candidate genes affecting IFC and a* value. (A) and (C) represented the whole PPI network of candidate genes affecting IFC and a* value, respectively. Edges (gray lines) between nodes indicate the interaction of genes in the network. Gray circles represente DEGs with connectivity less than 10. Red circles represente DEGs with connectivity greater than 10 and are considered hub genes. The hub gene shared by IFC and a* value is represented by a V-shape. (B) and (D) represente the PPI subnetwork of hub genes affecting IFC and a* value, respectively. The hub gene shared by IFC and a* value is represented by a V-shape.
Table 1.
Overlapping significantly enriched GO terms based on GO enrichment of DEGs, GSEA and WGCNA.
Table 1.
Overlapping significantly enriched GO terms based on GO enrichment of DEGs, GSEA and WGCNA.
| Trait | GO ID | Description | GO_DEGsq value | GO_GSEAq value | GO_WGCNAq value | Overlapping DEGs |
| IMF | GO:1901700 | response to oxygen-containing compound | 0.069 | 0.047 | 0.005 | APOD, INHBB, CEBPB, NR4A3, SOX9, MYOD1, CYP26B1, BGLAP, PANX1, THBS1, PCK1 |
| GO:0003700 | DNA-binding transcription factor activity | 0.078 | 0.001 | 0.050 | TGIF1, RUNX1, FOSL2, KLF10, MAFK, SMAD1, MAFF, CSRNP1, CEBPB, NR4A3, SIM1, ATF3, SOX9, MYOD1, CREM, ZSCAN20, KLF5, FOSL1 | |
| a* | GO:1901700 | response to oxygen-containing compound | 0.023 | <0.001 | 0.005 | THBS1, INHBB, FOXO1, EGR1, PLSCR4, PLK3, CEBPB, SOCS1, SOX9, GJA1, SLC25A33, SLC11A1, NOCT, CCL2, SLC1A1, APOD |
| GO:0023057 | negative regulation of signaling | 0.034 | 0.004 | 0.012 | ADRB2, THBS1, SLC25A5, ADM, SIAH2, SPRY1, SOCS3, INHBB, EGR1, ARRDC3, DUSP5, SOCS1, SOX9, GJA1, APOD | |
| GO:0009611 | response to wounding | 0.043 | 0.001 | 0.035 | CCN1, PPL, SERPINE1, THBS1, F3, INHBB, SLC1A1, ITGA5, APOD | |
| GO:0072359 | circulatory system development | 0.043 | <0.001 | <0.001 | CCN1, SERPINE1, JUNB, THBS1, ADM, VEGFA, TIPARP, ITGA5, ANGPTL4, F3, EGR2, SOX9, GJA1, SLC1A1 |
Table 2.
Overlapping significantly enriched KEGG pathways based on KEGG enrichment of DEGs, GSEA and WGCNA.
Table 2.
Overlapping significantly enriched KEGG pathways based on KEGG enrichment of DEGs, GSEA and WGCNA.
| Trait | KEGG ID | Description | KEGG_DEGsq value | KEGG_GSEAq value | KEGG_WGCNAq value | Overlapping DEGs |
| IFC | ssc04931 | Insulin resistance | <0.001 | 0.07 | <0.001 | INSR, PPARGC1A, PTPN1, TRIB3, IRS2, PRKAG2, SOCS3, GFPT2 |
| ssc04010 | MAPK signaling pathway | 0.002 | 0.052 | <0.001 | MAP2K3, FLNC, VEGFA, GADD45A, INSR, HSPB1, MAP3K8, GADD45G, MYC, IL1RAP | |
| ssc04920 | Adipocytokine signaling pathway | 0.002 | 0.071 | <0.001 | PPARGC1A, IRS2, PRKAG2, SOCS3 | |
| ssc04066 | HIF-1 signaling pathway | 0.006 | 0.021 | <0.001 | VEGFA, INSR, IL6R, SERPINE1, HK3, TIMP1 | |
| ssc04068 | FoxO signaling pathway | 0.02 | 0.029 | <0.001 | GADD45A, INSR, GABARAPL1, IRS2, PRKAG2, GADD45G | |
| a* | ssc04068 | FoxO signaling pathway | 0.002 | <0.001 | <0.001 | GADD45A, GABARAPL1, IRS2, PRKAG2, GADD45B, FOXO1, IL6, PLK3, FBXO32 |
| ssc04920 | Adipocytokine signaling pathway | 0.005 | 0.097 | <0.001 | PPARGC1A, IRS2, PRKAG2, CPT1A, SOCS3 | |
| ssc04010 | MAPK signaling pathway | 0.043 | 0.013 | <0.001 | GADD45A, FLNC, GADD45B, VEGFA, FGF6, DUSP1, IL1RAP, DUSP4, MYC, DUSP5, DUSP2 | |
| ssc04066 | HIF-1 signaling pathway | 0.074 | 0.021 | <0.001 | SERPINE1, VEGFA, TIMP1, IL6, HK2 |
Disclaimer/Publisher’s Note: The statements, opinions and data contained in all publications are solely those of the individual author(s) and contributor(s) and not of MDPI and/or the editor(s). MDPI and/or the editor(s) disclaim responsibility for any injury to people or property resulting from any ideas, methods, instructions or products referred to in the content. |
© 2023 by the authors. Licensee MDPI, Basel, Switzerland. This article is an open access article distributed under the terms and conditions of the Creative Commons Attribution (CC BY) license (https://creativecommons.org/licenses/by/4.0/).
Copyright: This open access article is published under a Creative Commons CC BY 4.0 license, which permit the free download, distribution, and reuse, provided that the author and preprint are cited in any reuse.
RNA Profiles of the Korat Chicken Breast Muscle with Increased Carnosine Content Produced through Dietary Supplementation with β-Alanine or L-Histidine
Satoshi Kubota
et al.
Animals,
2021


MDPI Initiatives
Important Links
© 2024 MDPI (Basel, Switzerland) unless otherwise stated