1. Introduction
1.1. Motivation
It is human nature to make mistakes. A study has shown that input tasks that require complex thinking achieve only 95% accuracy. And only 60% of errors are detected after review [
1]. From this study, we can infer that human errors are inevitable. In basketball, statistical errors occur even at the highest level of competition [
2,
3]. This is despite the fact that large amounts of resources are invested to avoid them. At lower levels of competition, where resources are scarce, these errors occur more frequently and often go unnoticed. By implementing a reliable system for recording these statistics, we could prevent these errors at all levels of play and also eliminate the subjectivity that can occur when people record the statistics.
1.2. Related work
The analysis of the video is performed in several steps. In the first step, we recognize the players on the field. In the second step, we classify them into their respective teams. In the next step, we determine their position in the two-dimensional plane of the field. And in the last step, we determine the action they perform. There are a variety of works that deal with one or more of these steps [
4,
5,
6,
7,
8,
9].
Player detection can be done in many different ways. We can use a HOG detector [
5,
6], a deformable part model [
4], a particle filter model for tracking moving targets [
7], the AlphaPose algorithm [
9], or a neural network such as YOLO [
10]. Teams are primarily classified based on the color of their jerseys [
4,
5,
6]. Homographic transformation estimation is done using the algorithm SIFT [
4] and the help of affine transformations [
6,
9]. The detection of statistics can be done with the help of finite automata that detect the movements of the officials [
8]. We can also analyze the identities of the players using analysis of their features [
4], but this is beyond the scope of this algorithm.
2. Player tracking
2.1. Player detection
We use the YOLO algorithm to detect players. To do this, we trained user-defined YOLO weights by transfer learning from a COCO dataset [
11]. We used 1300 images classified by hand. We divided 80% of them into the training subset and 20% into the test subset. Using this method, we achieved an accuracy of 96.82%. Although YOLO achieved high recognition accuracy, the images were frequently misclassified.
2.2. Player tracking
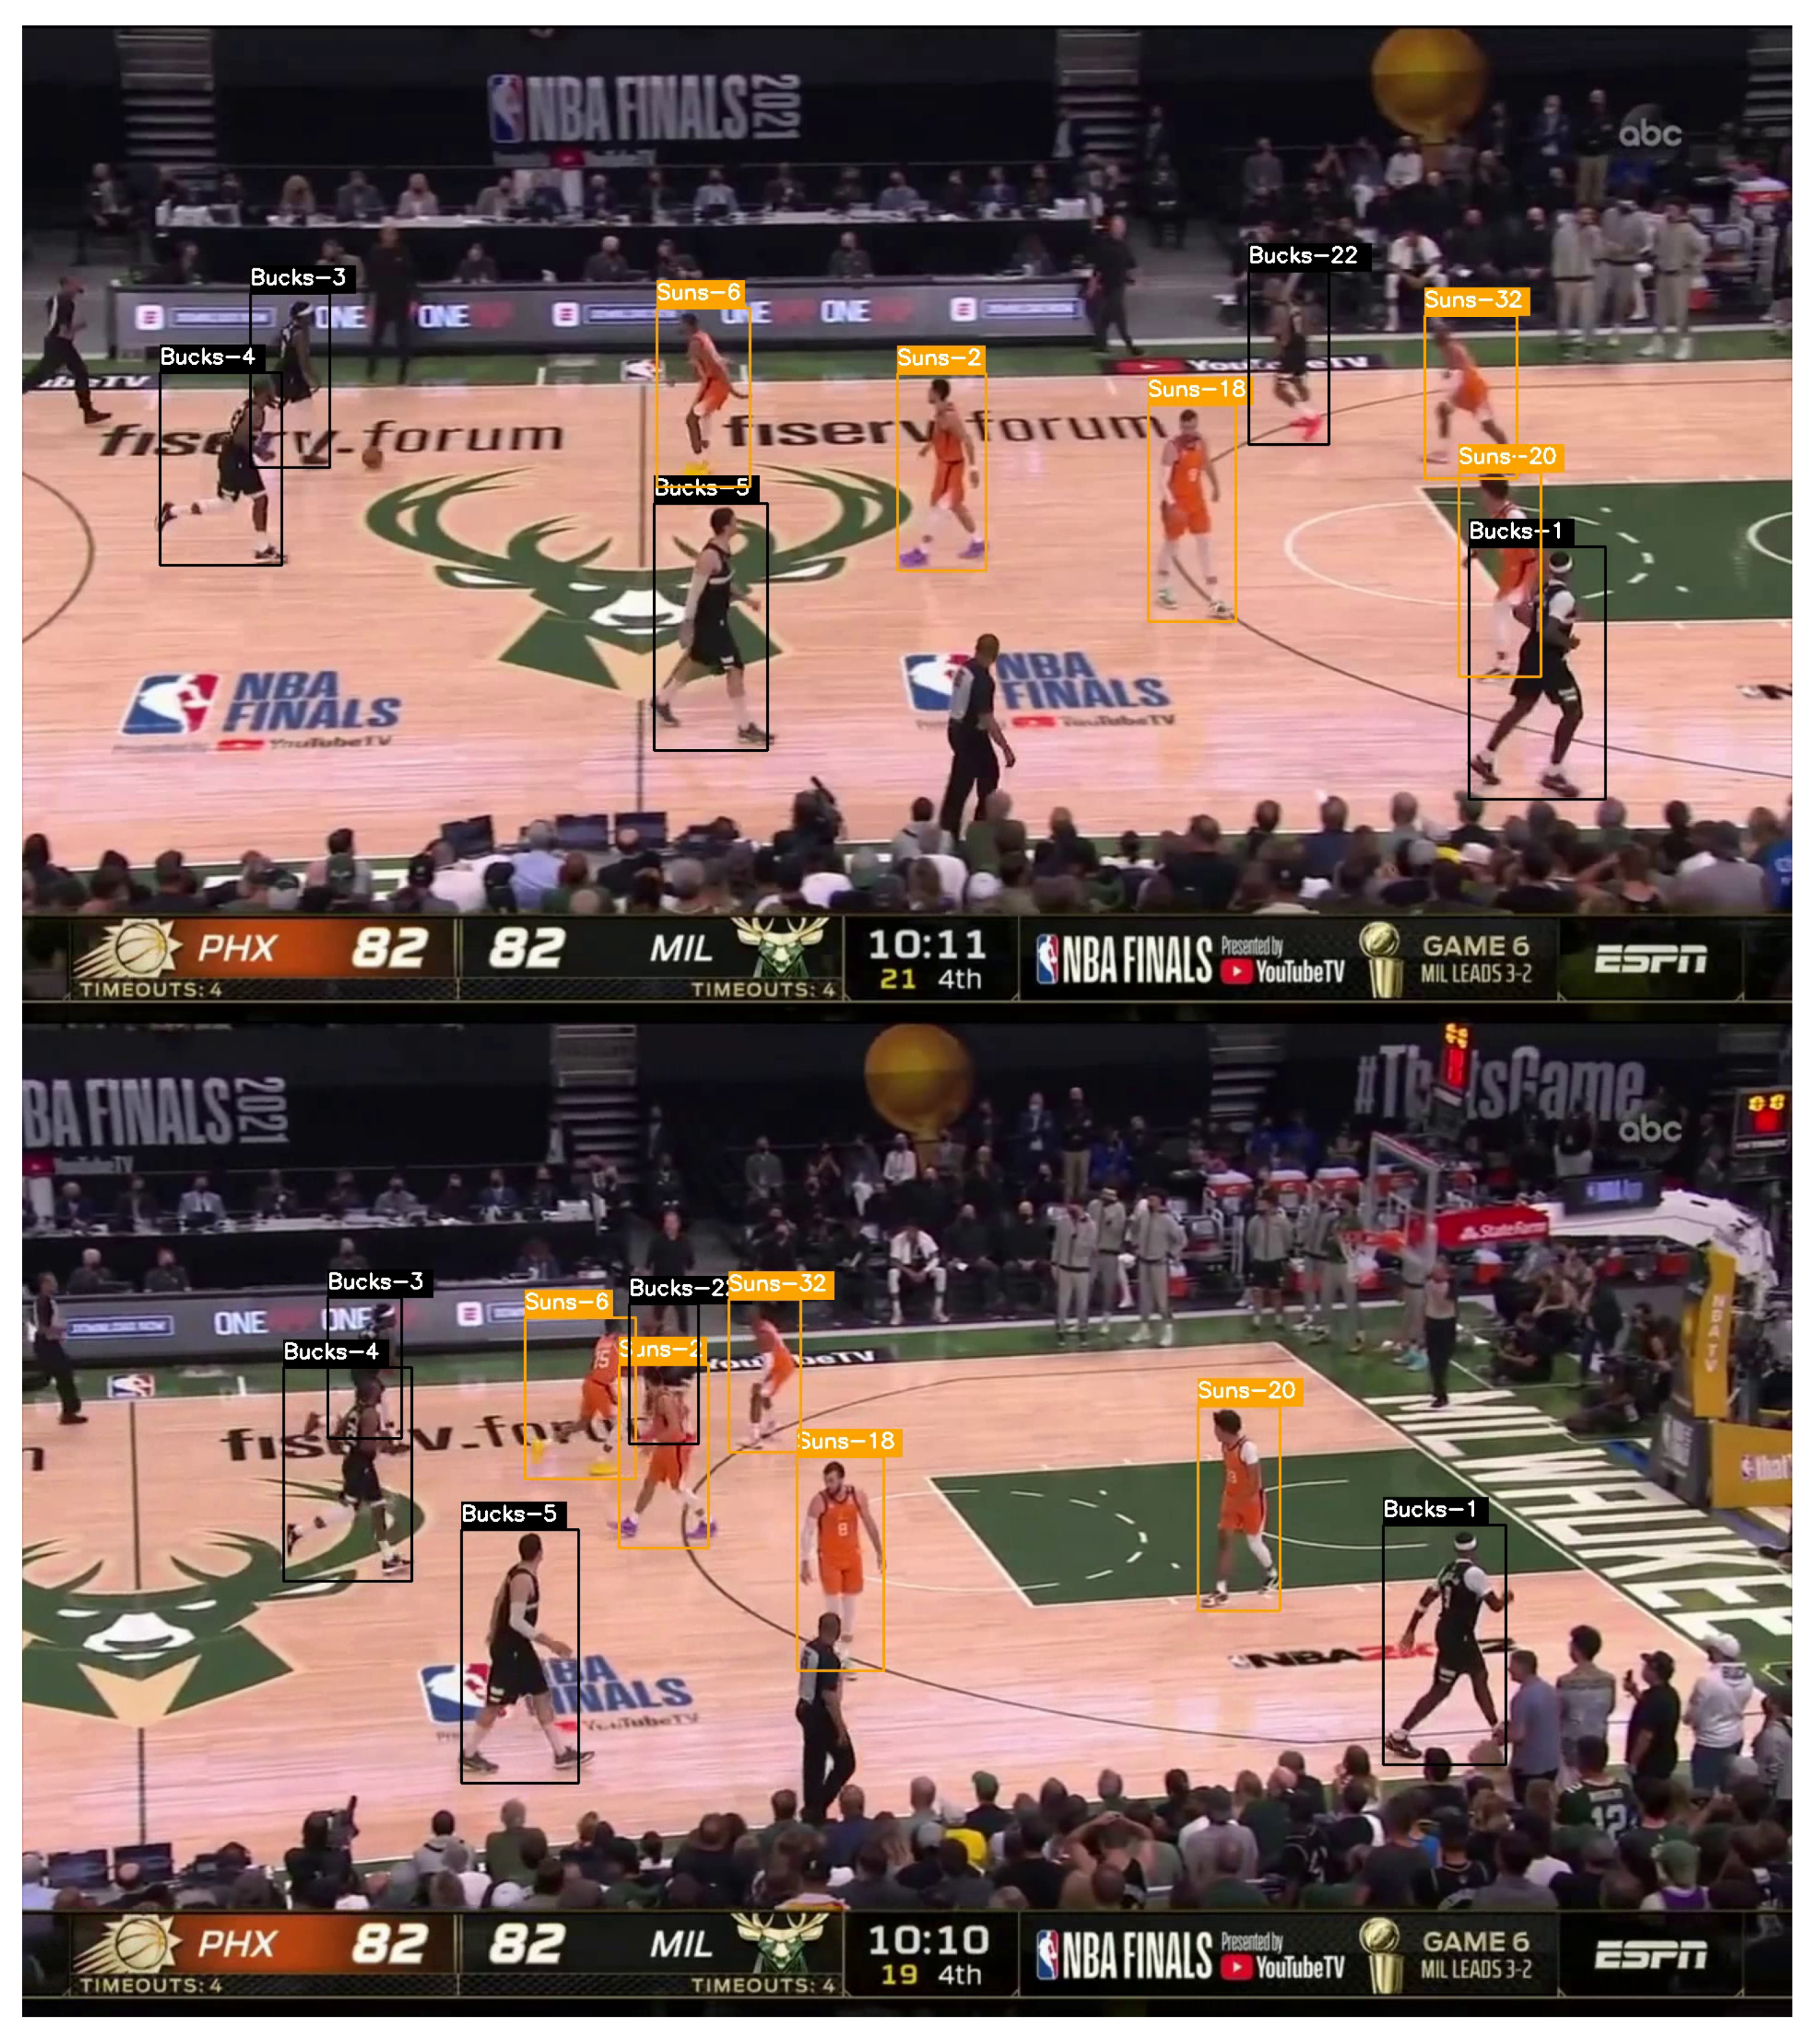
We use a combination of the DeepSort [
12] and YOLO algorithms to track players. The DeepSORT algorithm additionally helps improve classification accuracy by taking multiple YOLO predictions into account when predicting the class of the track. This improves on the misclassifications that occurred with YOLO and introduces a weakness. Once a track is classified, the algorithm will not reclassify the track. Since basketball players often cross paths, tracks can change between them. When players come from opposing teams, they are misclassified until the destruction of the tracks.
Figure 1.
Example of DeepSORT and YOLO working on an NBA broadcast with a 2-second difference.
Figure 1.
Example of DeepSORT and YOLO working on an NBA broadcast with a 2-second difference.
2.3. Improvement of classification
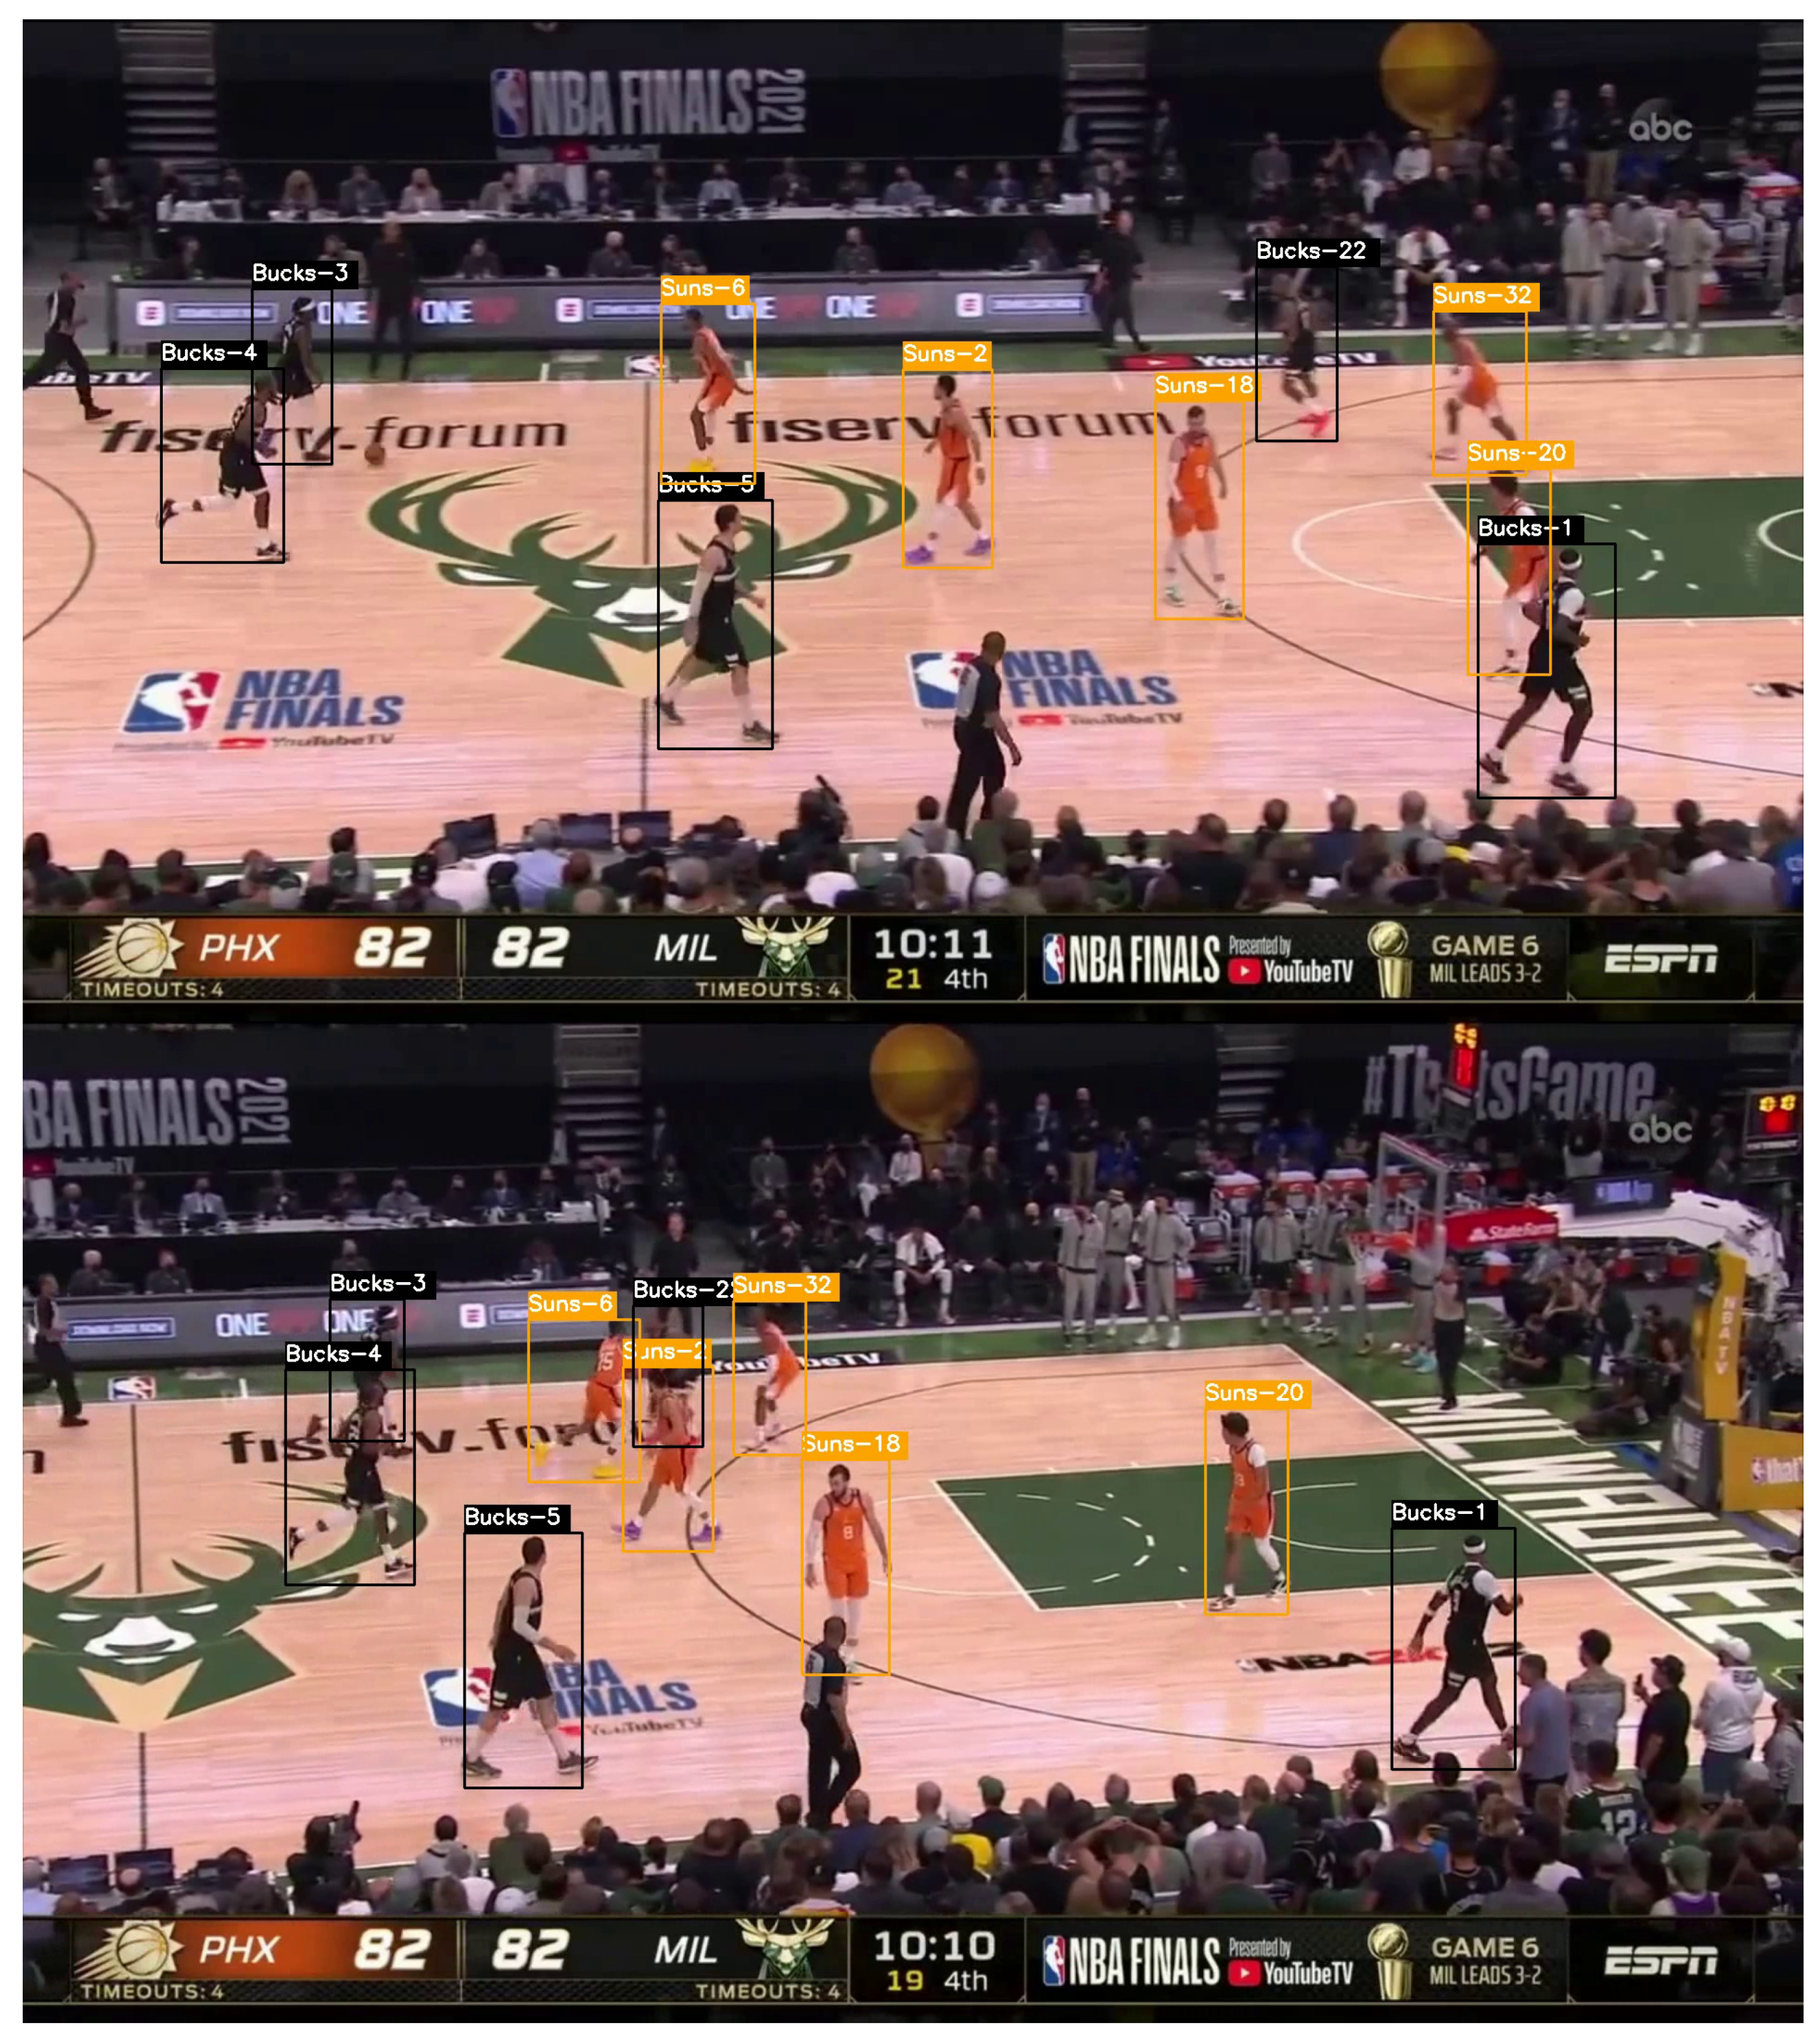
To solve the misclassification problem that occurred with the DeepSORT algorithm, we decided to use another neural network in addition to the other classifiers to assign players to their respective teams. We used the MobileNetV2 [
13] neural network. We trained the network by transfer learning and used a dataset of 8000 images in which both classes were equally represented.
We tested the neural network on another dataset of 1000 images and achieved 99.41% accuracy. This not only improved the predictions but also solved the misclassification problem.
Figure 2.
Example of the classification without the additional MobileNetV2 on the left and with on the right.
Figure 2.
Example of the classification without the additional MobileNetV2 on the left and with on the right.
3. Homography of the player coordinates
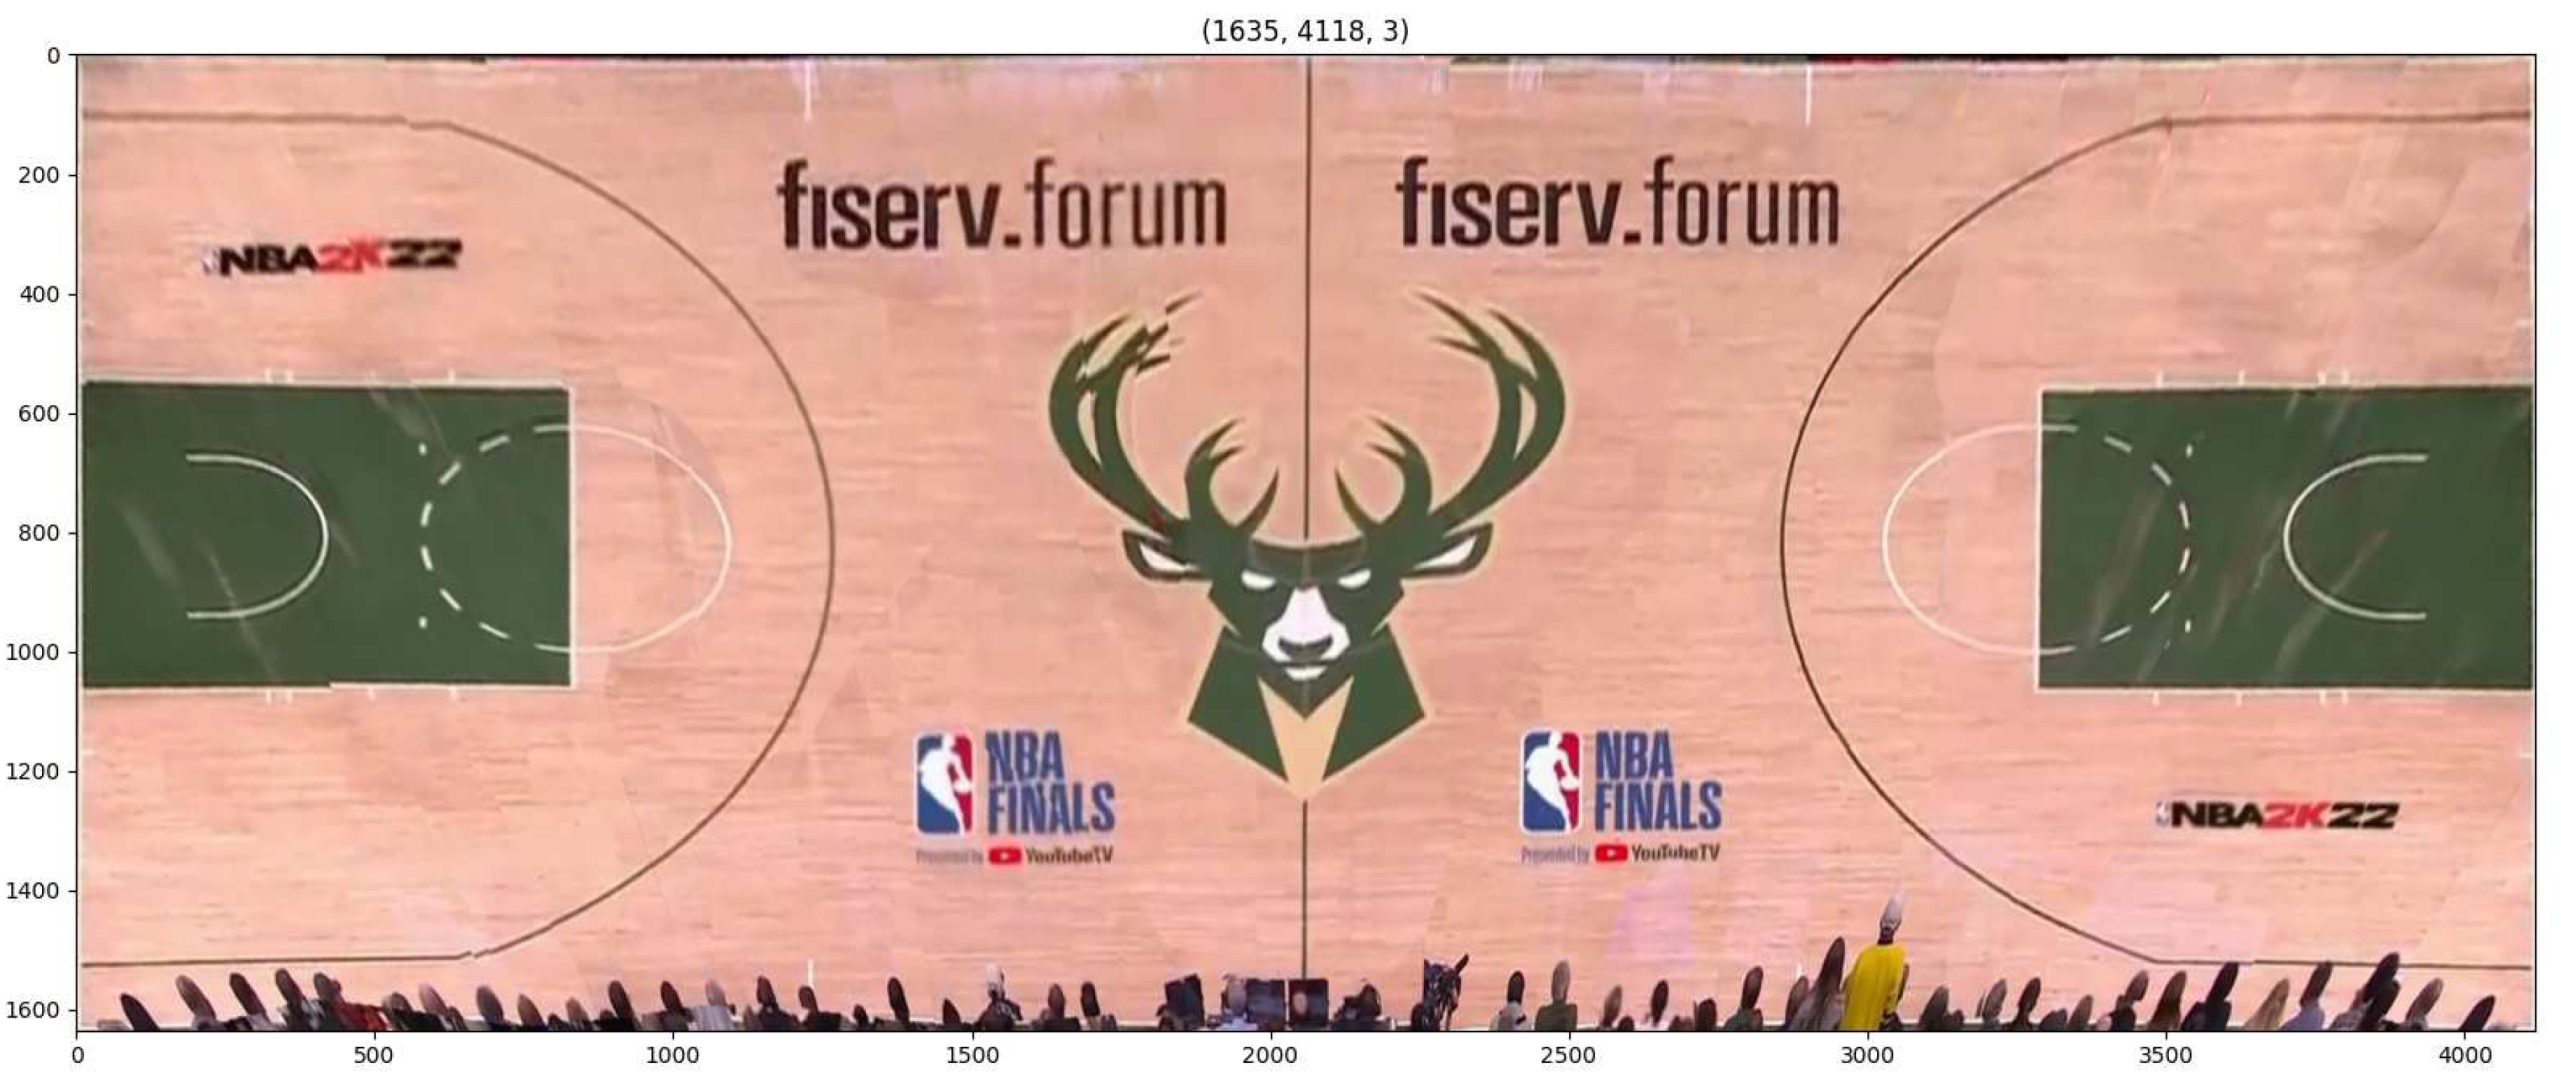
First, we create a side view of the playing field from all perspectives shown during the game. We transform this image using the transformation matrix
where
This results in the following image. Which is then used to plot the x and y coordinates of the players on the field.
Figure 3.
Side view of the court after using the transformation matrix.
Figure 3.
Side view of the court after using the transformation matrix.
A SIFT algorithm is then applied to the side view of the playing field. At each iteration, each image is processed and its transformation matrix is calculated using the SIFT algorithm as well as the RANSAC [
14] and Levenberg-Marquardt [
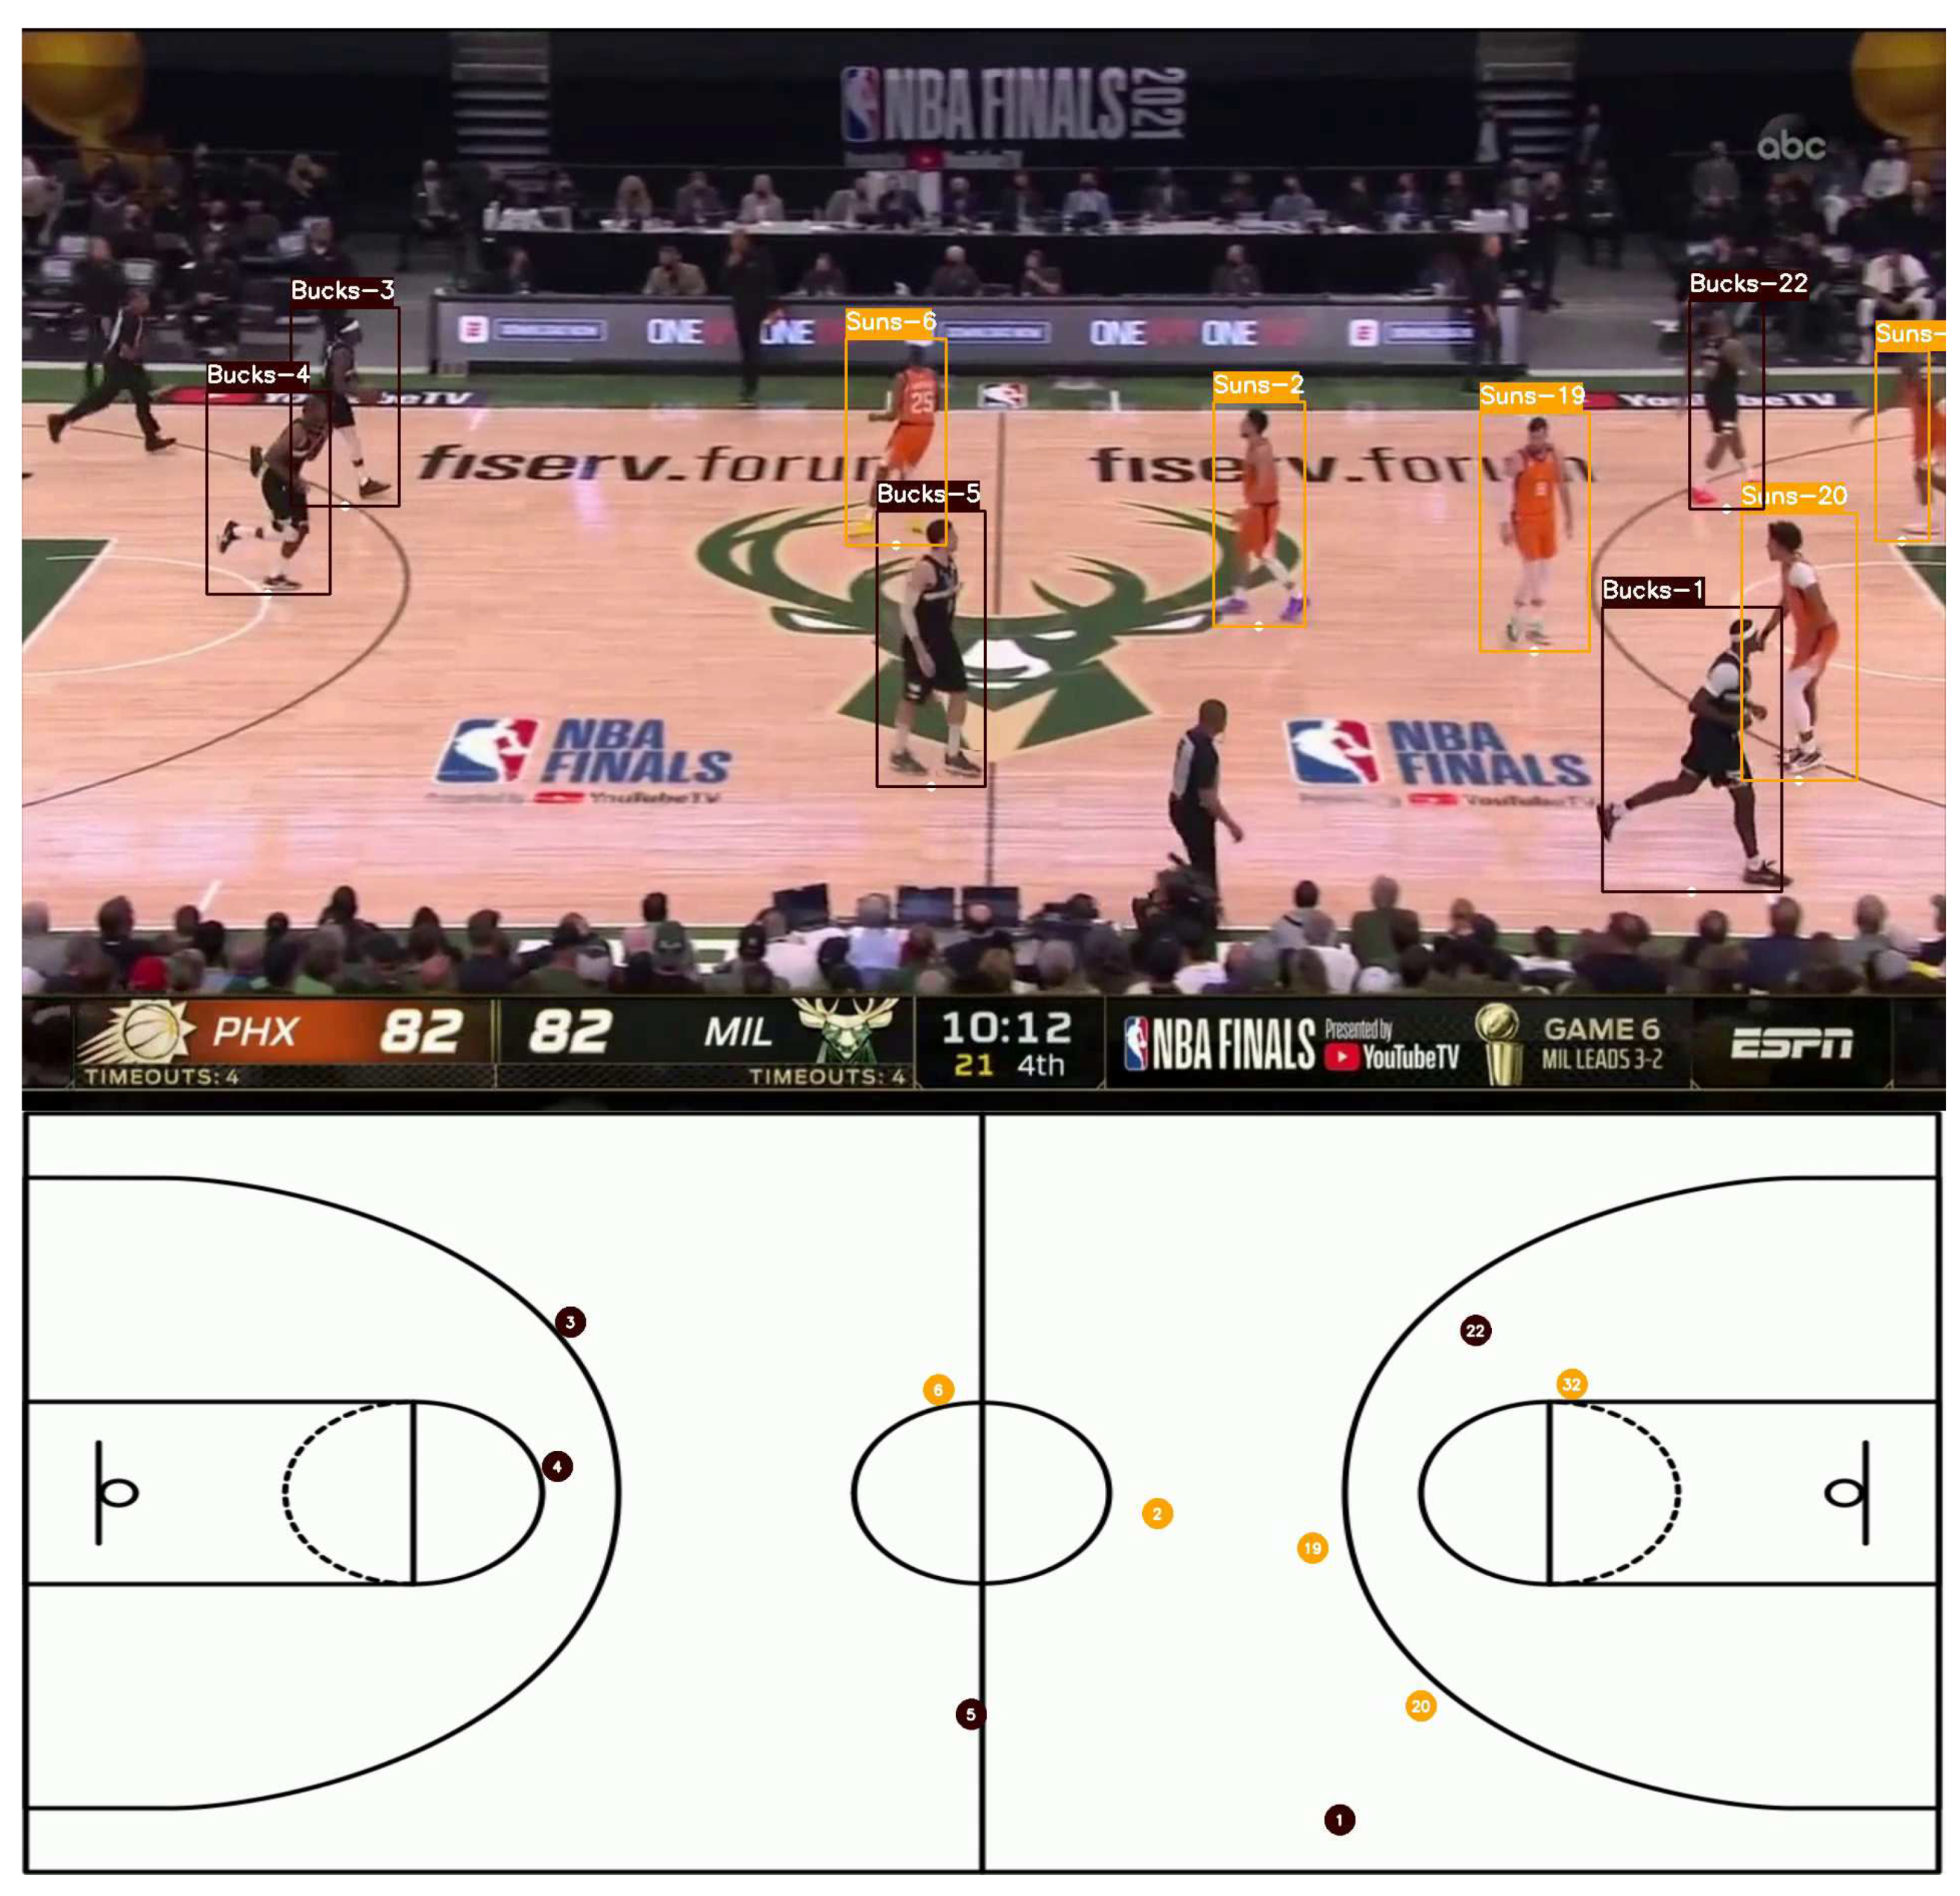
15] algorithms. With the calculated transformation matrix of the current image and the transformation matrix of the side view. We can calculate the x and y coordinates of the player positions with
Figure 4.
Display of the player positions after the use of the homography of their coordinates.
Figure 4.
Display of the player positions after the use of the homography of their coordinates.
4. Detection of player statistics
We propose a new method for collecting player statistics. Our method is to detect the players’ actions indirectly by knowing the flow of the game and having certain information. This is done by tracking the movements of the ball, its possession, and the position of the basketball hoop.
We decided to track made and attempted field goals, assists, rebounds, steals and turnovers.
4.1. Field goals
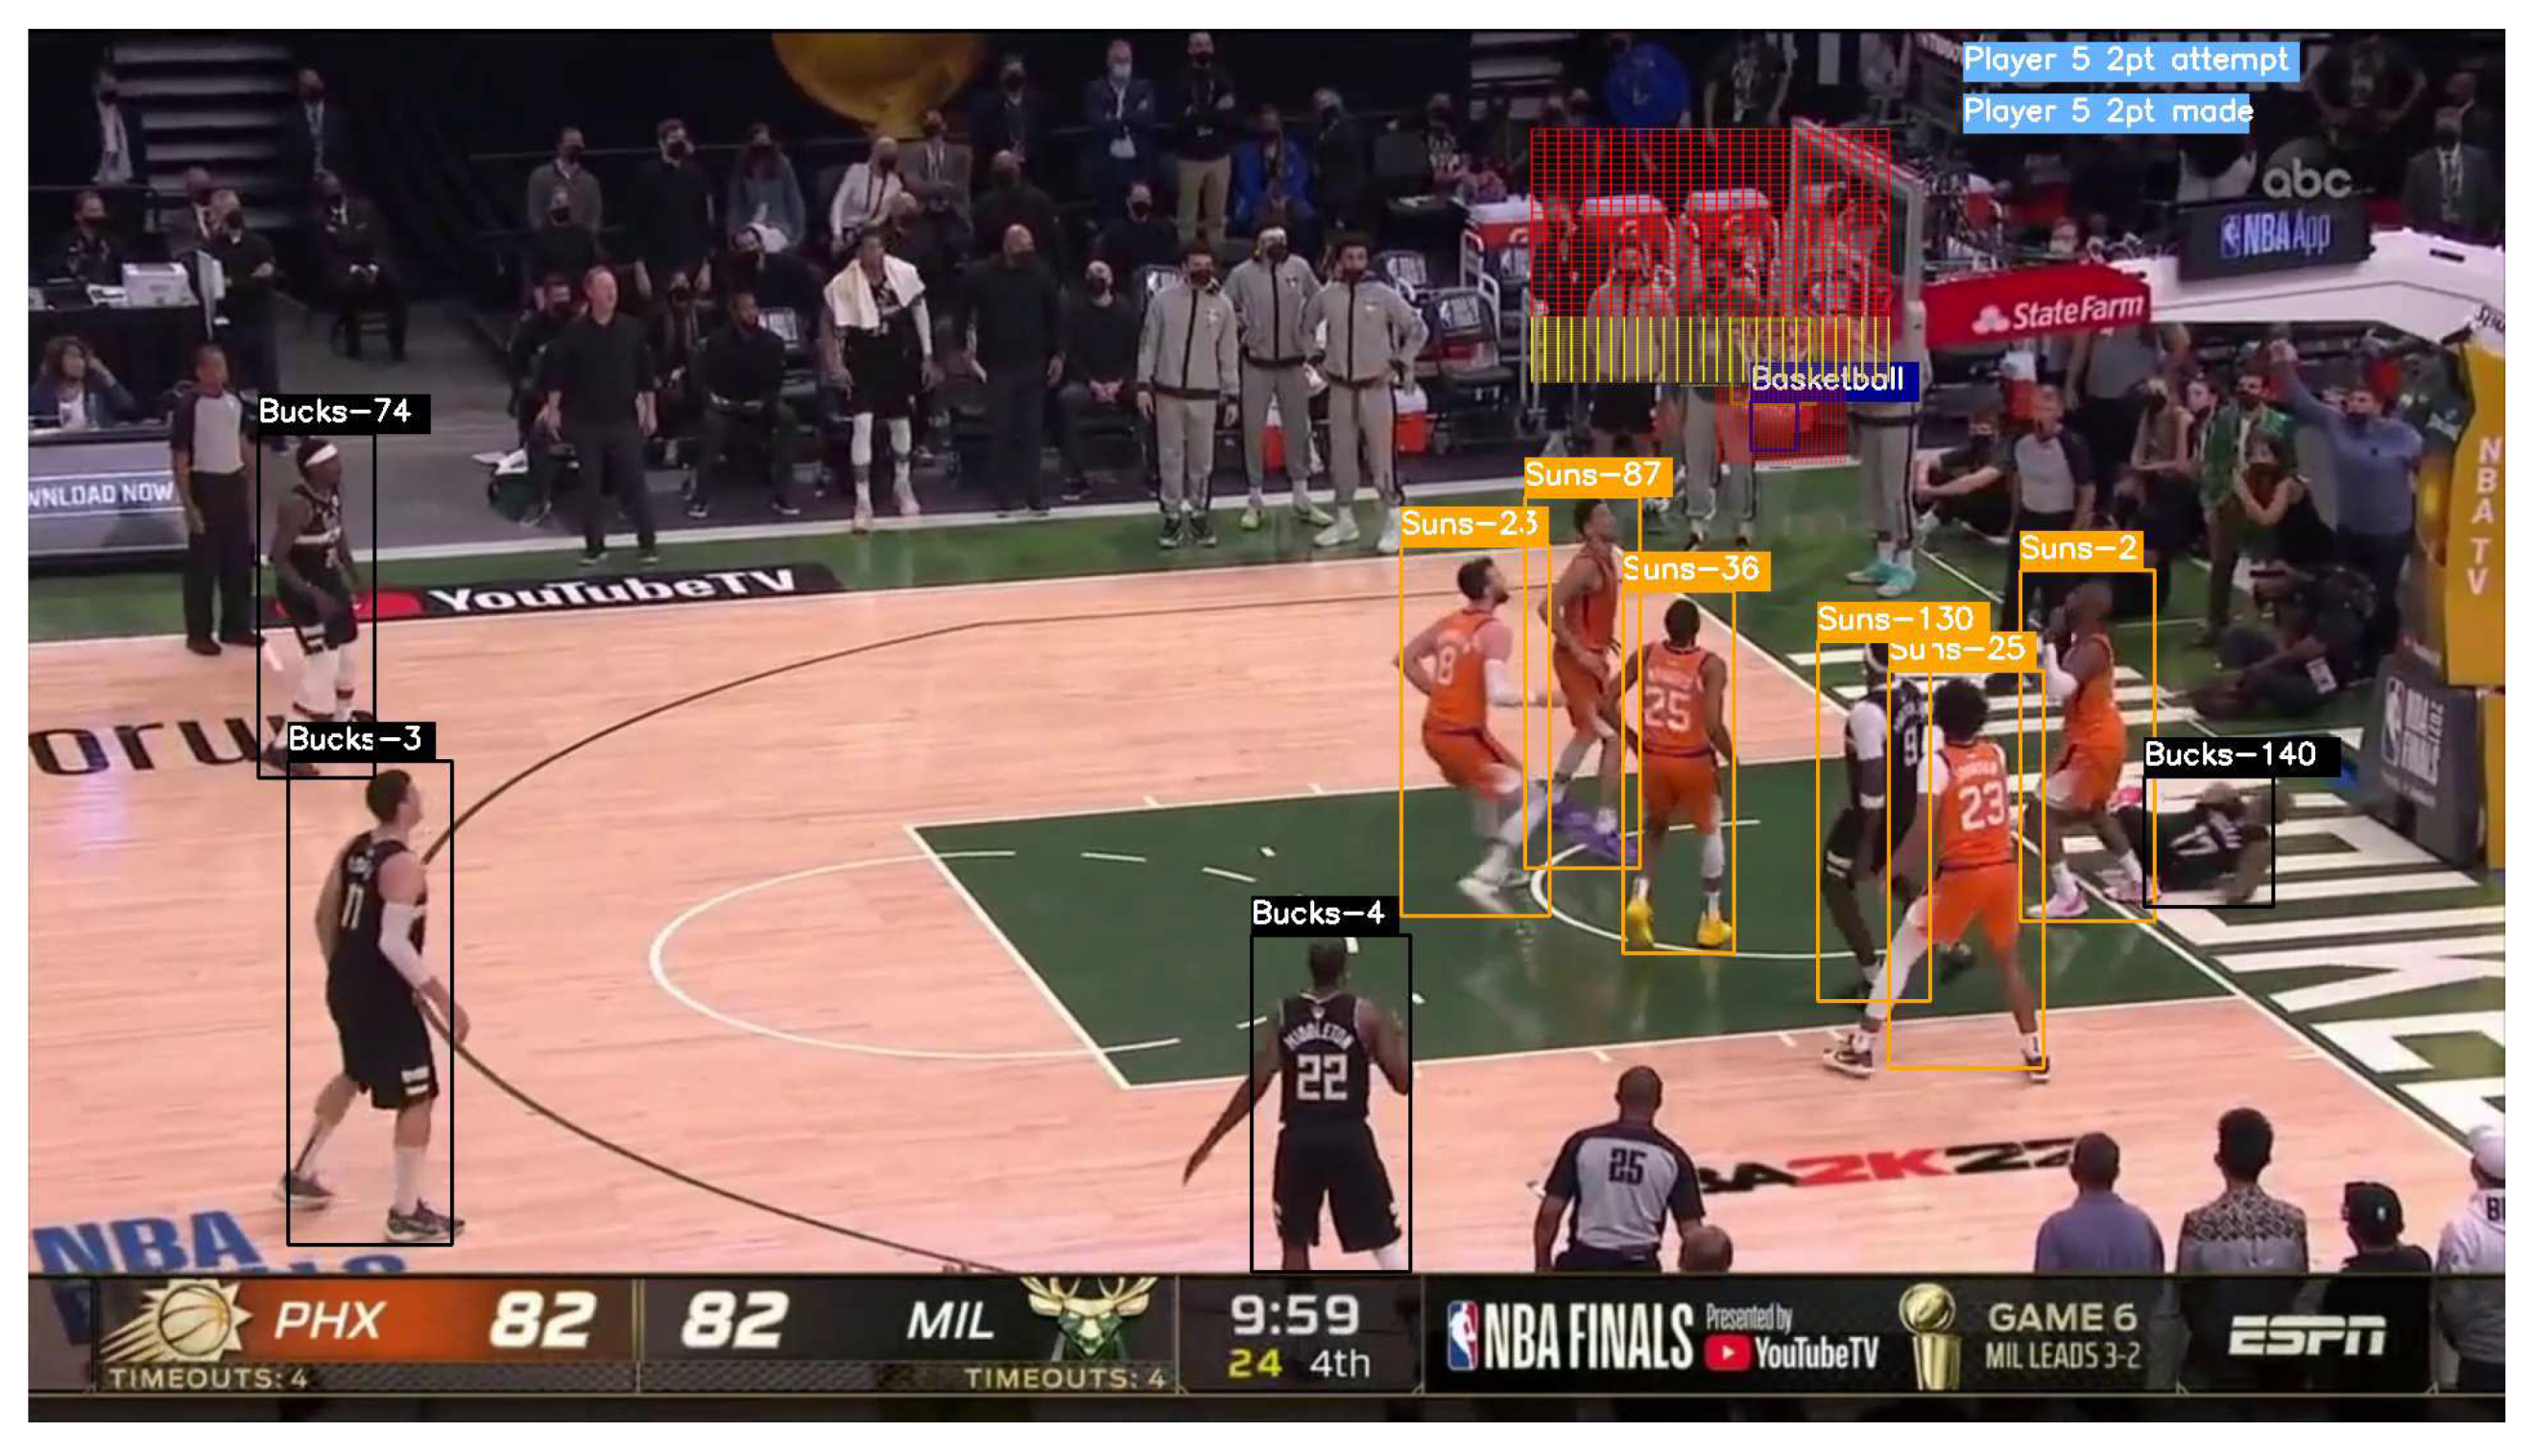
A field goal attempt is recorded when the area of the ball intersects with the area above the basketball hoop, shown in red in the figure below. A successful field goal attempt can only be registered if an attempt has already been registered. The ball must then not intersect with the area next to the basketball hoop, which is shown in yellow and must intersect with the area below it, which is also shown in red. This method avoids false positives and provides a larger margin of error than tracking only the ball and basket since they cannot be detected in each iteration.
Figure 5.
Visual representation of the areas of interest for field goal detection.
Figure 5.
Visual representation of the areas of interest for field goal detection.
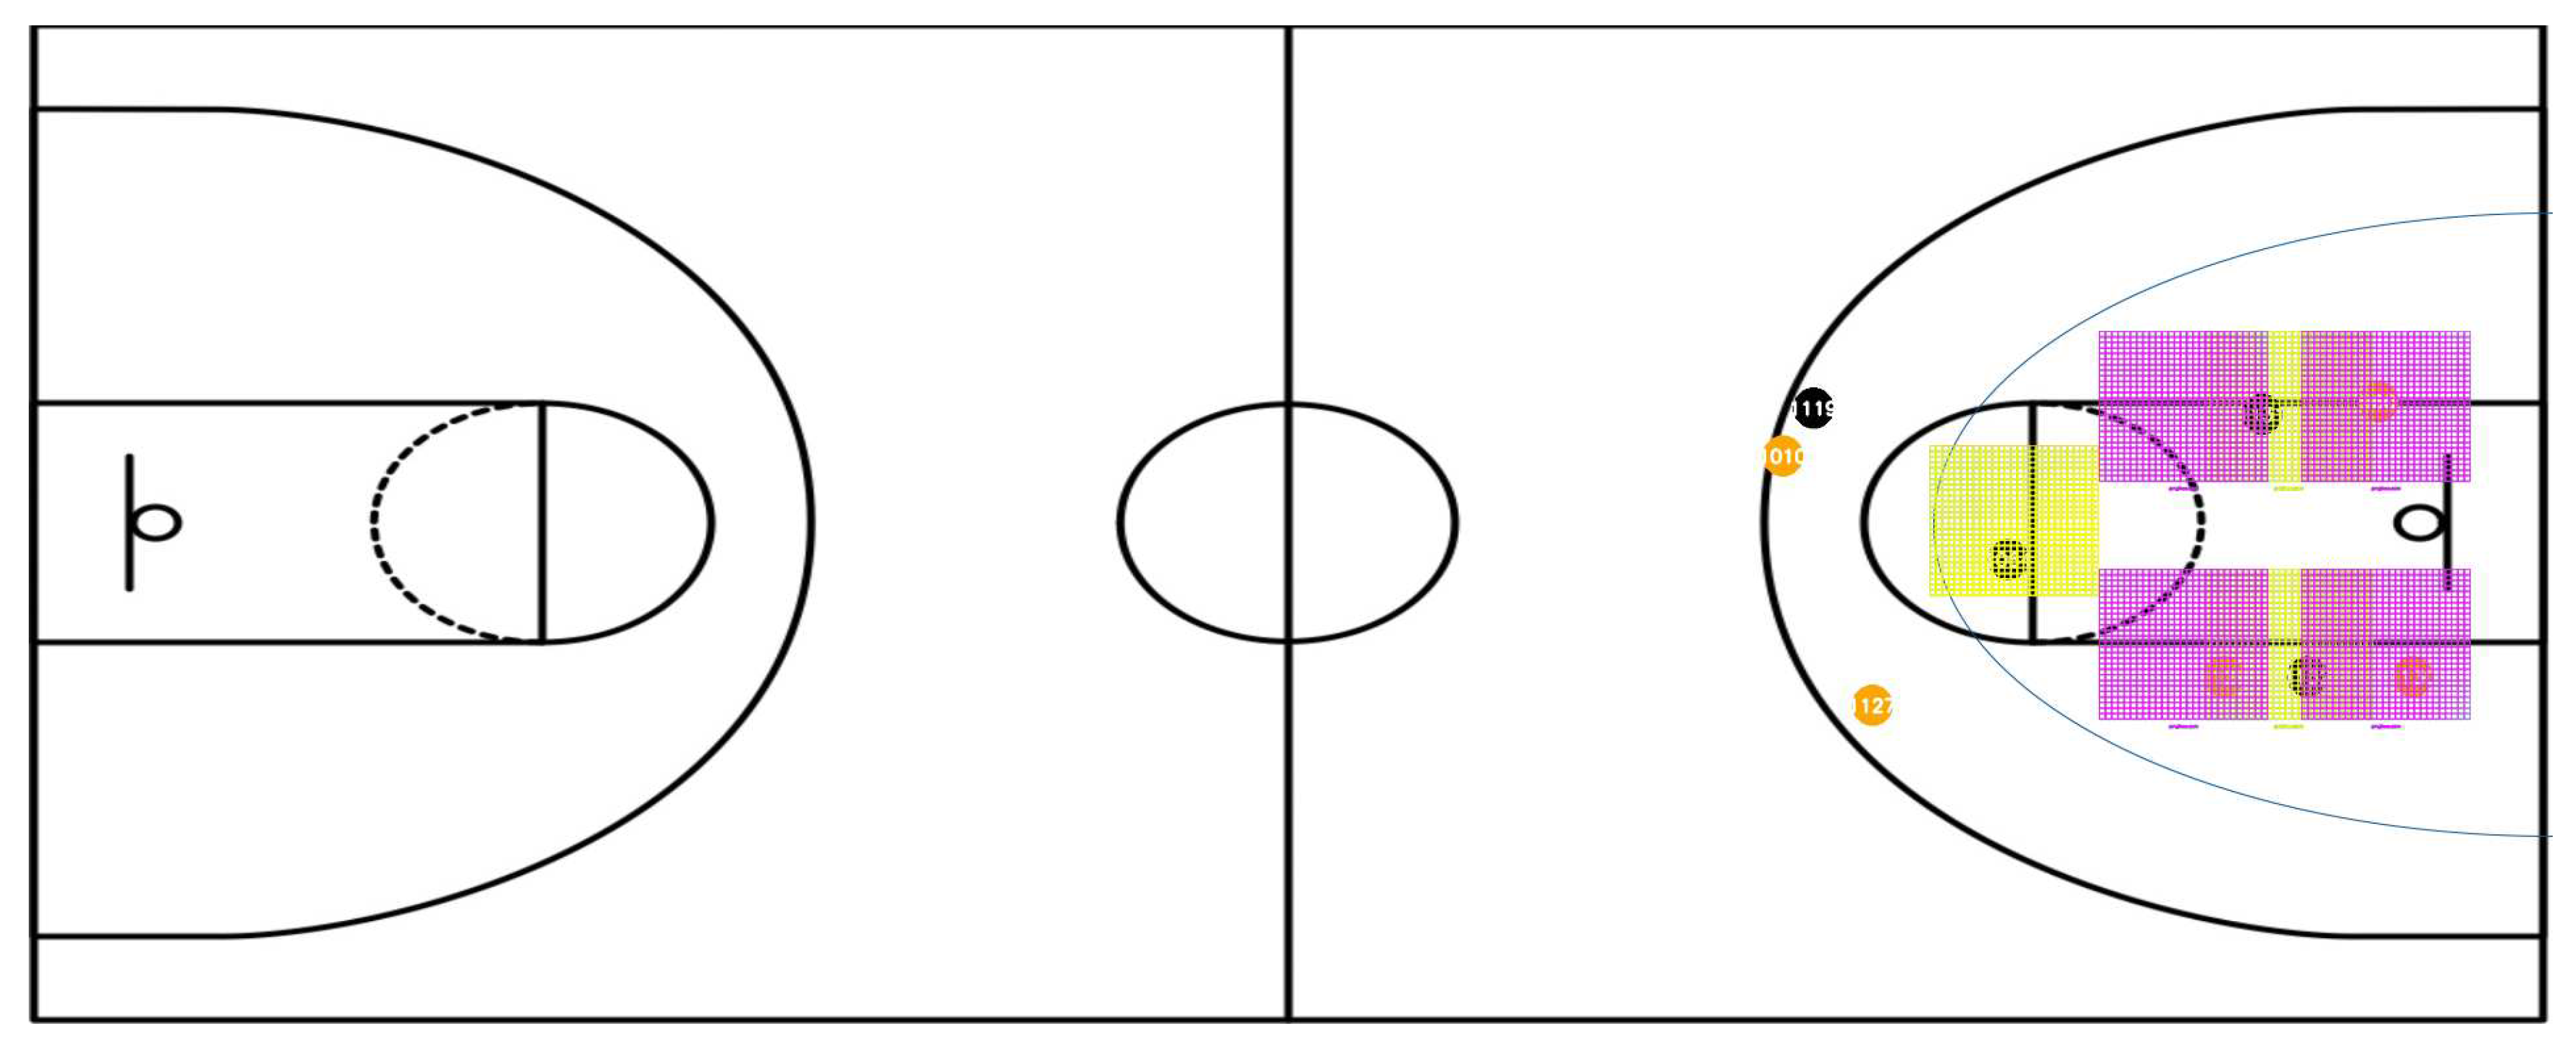
The distinction between a one-, two-, and three-point shot is based on player coordinates in two-dimensional space calculated using the homography transform. A three-point shot is detected when the player is outside the two-point area, and a two-point shot is detected when the player is inside this area. The one-point shot or free throw is detected based on the unique positioning of the players during that shot. Either a player is inside the three-point line and shoots from the free throw line during a technical foul, or a player shoots from the free throw line while the players are waiting to collect the rebound, as shown in the figure below.
Figure 6.
Successful detection of a free throw.
Figure 6.
Successful detection of a free throw.
As we can see, 6 players must be inside the ellipse. The positions of the attacking team must overlap with the areas marked in yellow and those of the defending team with the areas marked in purple.
4.2. Detecting rebound, assist, turnover, steal
A rebound is recorded when a field goal is attempted and not scored. The first player to gain possession of the ball will receive the rebound.
An assist is recorded if the field goal attempt is successful. Due to the subjective nature of this metric, we decided to adjust the time interval in which the pass still counts as an assist to minimize false positives.
A turnover is recorded when the player loses possession and a player from the opposing team recovers it. This method also works for turnovers caused by fouls or the ball going out of bounds. No turnover is registered after a successful field goal attempt where possession is changed. The disadvantage of this method is that sometimes the turnover cannot be registered until long after the incident.
A steal is registered when a turnover has been registered and the ball has not yet left the field of play.
5. Results
We analyzed the results of our algorithm on three NBA games between the Phoenix Suns and the Milwaukee Bucks in the finals, i.e., 144 minutes of play, to test the robustness of our algorithm. We evaluated the results by hand. We recorded positive detections, false detections, and missed detections where a basketball statistic was neither positively nor negatively detected.
Table 1.
Tracking accuracy of the statistics with our algorithm.
Table 1.
Tracking accuracy of the statistics with our algorithm.
| |
3PA |
3PM |
2PA |
2PM |
1PM |
1PM |
ORB |
DRB |
STL |
TO |
AST |
| Positive detections |
141 |
62 |
284 |
115 |
112 |
99 |
51 |
192 |
58 |
88 |
83 |
| False detections |
69 |
50 |
43 |
16 |
44 |
38 |
16 |
16 |
4 |
3 |
17 |
| Missed detections |
9 |
4 |
51 |
28 |
0 |
4 |
11 |
22 |
0 |
10 |
2 |
| Accuracy |
63,3% |
53,4% |
75,1% |
72,3% |
71,7% |
70,2% |
65,4% |
83,5% |
93,5% |
87,1% |
81,4% |
We also analyzed the distribution of detection of field goal attempts.
As can be seen from the
Table 2, many one-point shots were misidentified as three-point shots because the homography transformation was sometimes miscalculated on one side of the court. Improving this would be the biggest improvement for our algorithm, as it would improve not only the detection accuracy of three- and one-point shots, but also that of other metrics. The algorithm in action can be viewed at the following link
https://drive.google.com/file/d/1Ewu3Z7O-QdqK9taDoV_gFckaDYdoDO-9/view?usp=sharing.
6. Conclusion
Automatic statistical recognition can be used to minimize the external human factor in games and improve the quality of games. In this paper, the characteristics of basketball games in-game videos are investigated and an effective method for detecting and predicting video motion in sports videos is proposed. First, neural networks and object-tracking algorithms for tracking, identifying, and classifying players are presented. Then, the algorithm for computing homographic transformation is presented to detect the positions of players in two-dimensional space. Finally, an algorithm for predicting the players’ actions and consequently their statistics based on the knowledge of the game history is proposed. The results of this algorithm can be used to track statistics or create an augmented reality of the playing field. The results show that the proposed method can effectively identify player statistics in-game videos with high accuracy. An example of the working algorithm can be found on [
16].
We also compared the results with a similar algorithm in the same domain [
17]. Although we could not compare all metrics, we obtained similar results, as can be seen in the following
Table 3. We achieved slightly worse accuracy in predicting the type of basketball shot, but higher accuracy in predicting rebounded balls. The main problem in our algorithm was computing the homography transformation on one side of the floor during free throws. This not only decreased the prediction accuracy for free throws but also for two- and three-point shots. By comparison, on the other side of the court, accuracy in detecting free throws was 96.7%. We believe that further improvement of this part of the algorithm would significantly increase the accuracy of these metrics and surpass the previously mentioned algorithm.
References
- Panko, R.R. Thinking is bad: Implications of human error research for spreadsheet research and practice. arXiv preprint arXiv:0801.3114 2008.
- Purdum, D. Stat-keeping error in Illinois State-Chicago State basketball game leads to sportsbook refunds. https://www.espn.com/chalk/story/_/id/32861143/stat-keeping-error-illinois-state-chicago-state-basketball-game-leads-sportsbook-refunds. accessed: 2021-12-21.
- Eddelstein, J. NBA Stat Error Caused Grief For (At Least) One Pennsylvania Bettor, But All’s Well That Ends Well. https://www.pennbets.com/nba-stat-error-causes-grief/. accessed: 2021-12-21.
- Lu, W.L.; Ting, J.A.; Little, J.J.; Murphy, K.P. Learning to track and identify players from broadcast sports videos. IEEE transactions on pattern analysis and machine intelligence 2013, 35, 1704–1716. [CrossRef]
- Xie, S.; Unger, C.; Patel, K. BASKETBALL PLAYER TRACKING. https://cliveunger.github.io/pdfs/Basketball_Player_Tracking.pdf. accessed: 2023-08-28.
- Cheshire, E.; Halasz, C.; Perin, J.K. Player tracking and analysis of basketball plays. European Conference of Computer Vision, 2013.
- Wu, K.H.; Tsai, W.L.; Pan, T.Y.; Hu, M.C. Robust basketball player tracking based on a hybrid detection grouping framework for overlapping cameras. 2019 IEEE International Conference on Big Data (Big Data). IEEE, 2019, pp. 5094–5100. [CrossRef]
- Lee, J.; Lee, J.; Moon, S.; Nam, D.; Yoo, W. Basketball event recognition technique using Deterministic Finite Automata (DFA). 2018 20th International Conference on Advanced Communication Technology (ICACT). IEEE, 2018, pp. 675–678.
- Johnson, N. Extracting player tracking data from video using non-stationary cameras and a combination of computer vision techniques. Proceedings of the 14th MIT sloan sports analytics conference, Boston, MA, USA, 2020, Vol. 218.
- Redmon, J.; Divvala, S.; Girshick, R.; Farhadi, A. You only look once: Unified, real-time object detection. Proceedings of the IEEE conference on computer vision and pattern recognition, 2016, pp. 779–788.
- Lin, T.Y.; Maire, M.; Belongie, S.; Hays, J.; Perona, P.; Ramanan, D.; Dollár, P.; Zitnick, C.L. Microsoft coco: Common objects in context. Computer Vision–ECCV 2014: 13th European Conference, Zurich, Switzerland, September 6-12, 2014, Proceedings, Part V 13. Springer, 2014, pp. 740–755.
- Wojke, N.; Bewley, A.; Paulus, D. Simple online and realtime tracking with a deep association metric. 2017 IEEE international conference on image processing (ICIP). IEEE, 2017, pp. 3645–3649.
- Sandler, M.; Howard, A.; Zhu, M.; Zhmoginov, A.; Chen, L.C. Mobilenetv2: Inverted residuals and linear bottlenecks. Proceedings of the IEEE conference on computer vision and pattern recognition, 2018, pp. 4510–4520.
- Shi, G.; Xu, X.; Dai, Y. SIFT feature point matching based on improved RANSAC algorithm. 2013 5th International Conference on Intelligent Human-Machine Systems and Cybernetics. IEEE, 2013, Vol. 1, pp. 474–477.
- Ranganathan, A. The levenberg-marquardt algorithm. Tutoral on LM algorithm 2004, 11, 101–110.
- Veršnik, A. Video example of the working algorithm implementation. https://drive.google.com/file/d/1Ewu3Z7O-QdqK9taDoV_gFckaDYdoDO-9/view?usp=sharing. accessed: 2021-12-21.
- Li, W.; Wu, Y.; Lian, B.; Zhang, M. Deep Learning Algorithm-Based Target Detection and Fine Localization of Technical Features in Basketball. Computational Intelligence and Neuroscience 2022, 2022. [CrossRef]
|
Disclaimer/Publisher’s Note: The statements, opinions and data contained in all publications are solely those of the individual author(s) and contributor(s) and not of MDPI and/or the editor(s). MDPI and/or the editor(s) disclaim responsibility for any injury to people or property resulting from any ideas, methods, instructions or products referred to in the content. |
© 2023 by the authors. Licensee MDPI, Basel, Switzerland. This article is an open access article distributed under the terms and conditions of the Creative Commons Attribution (CC BY) license (http://creativecommons.org/licenses/by/4.0/).
