Submitted:
07 September 2023
Posted:
11 September 2023
You are already at the latest version
Abstract
Keywords:
1. Introduction
2. Results
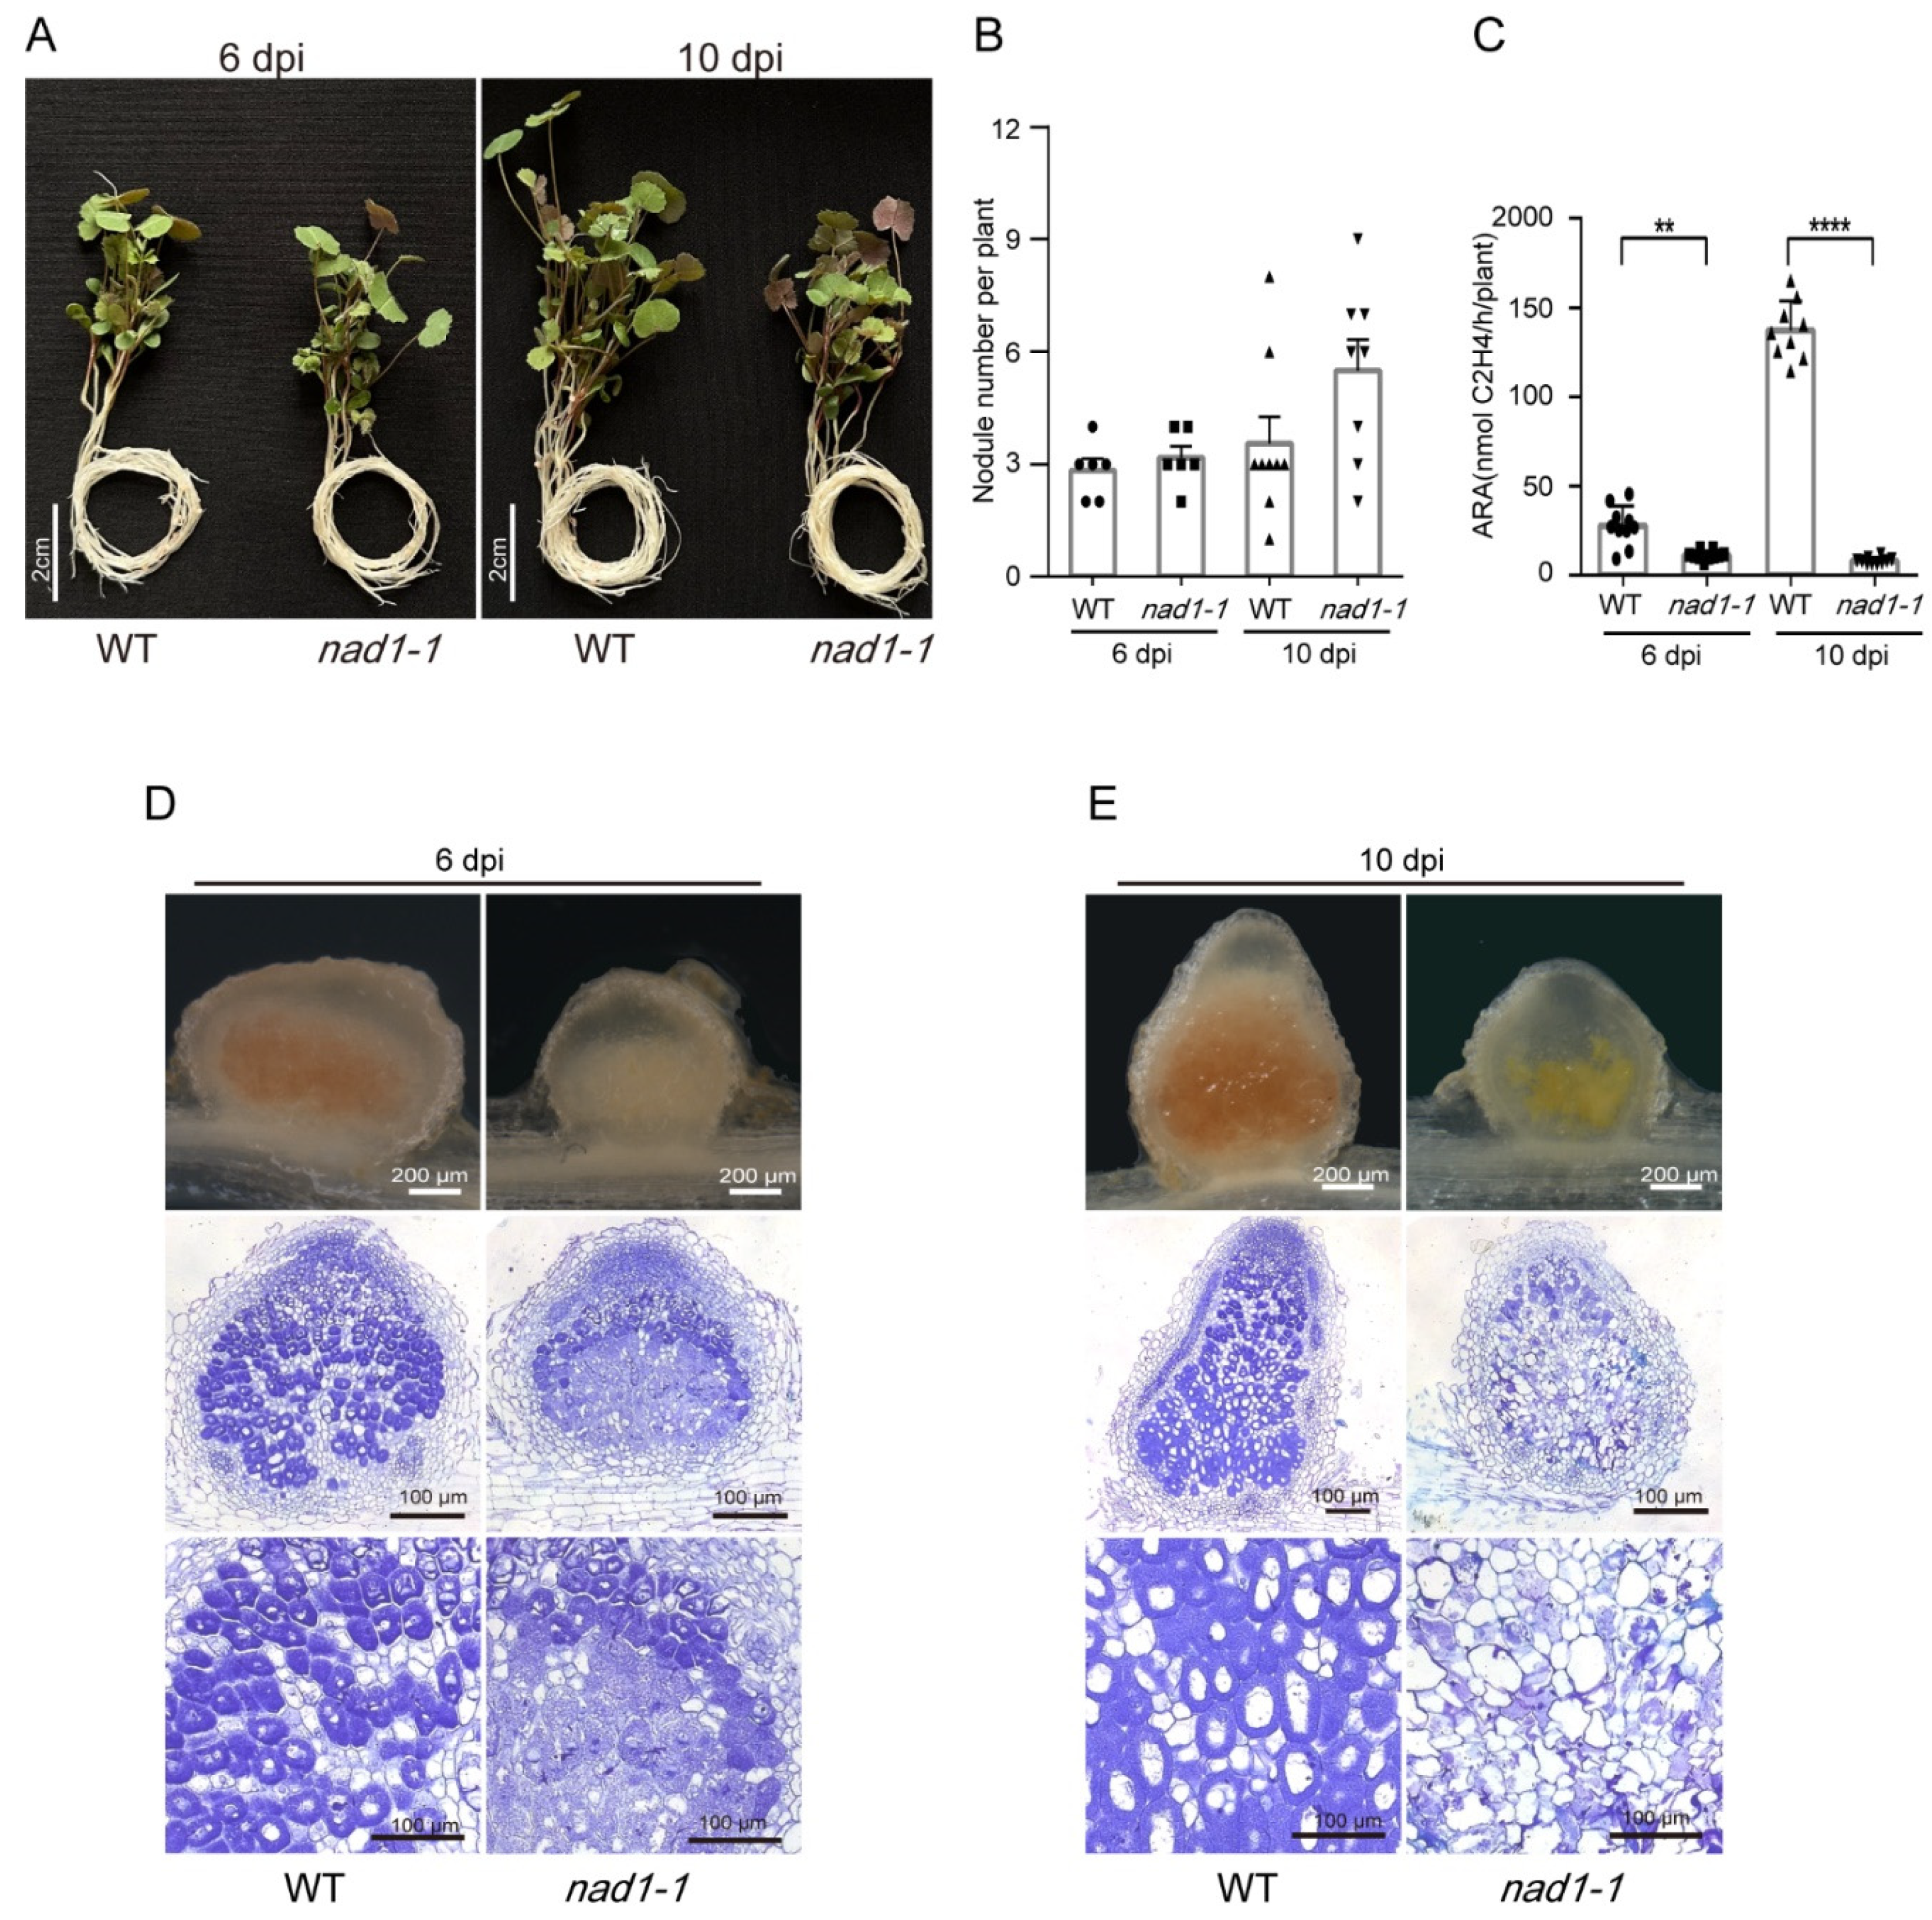
2.1. Requirement of NAD1 for Nodule Development and Symbiotic Nitrogen Fixation
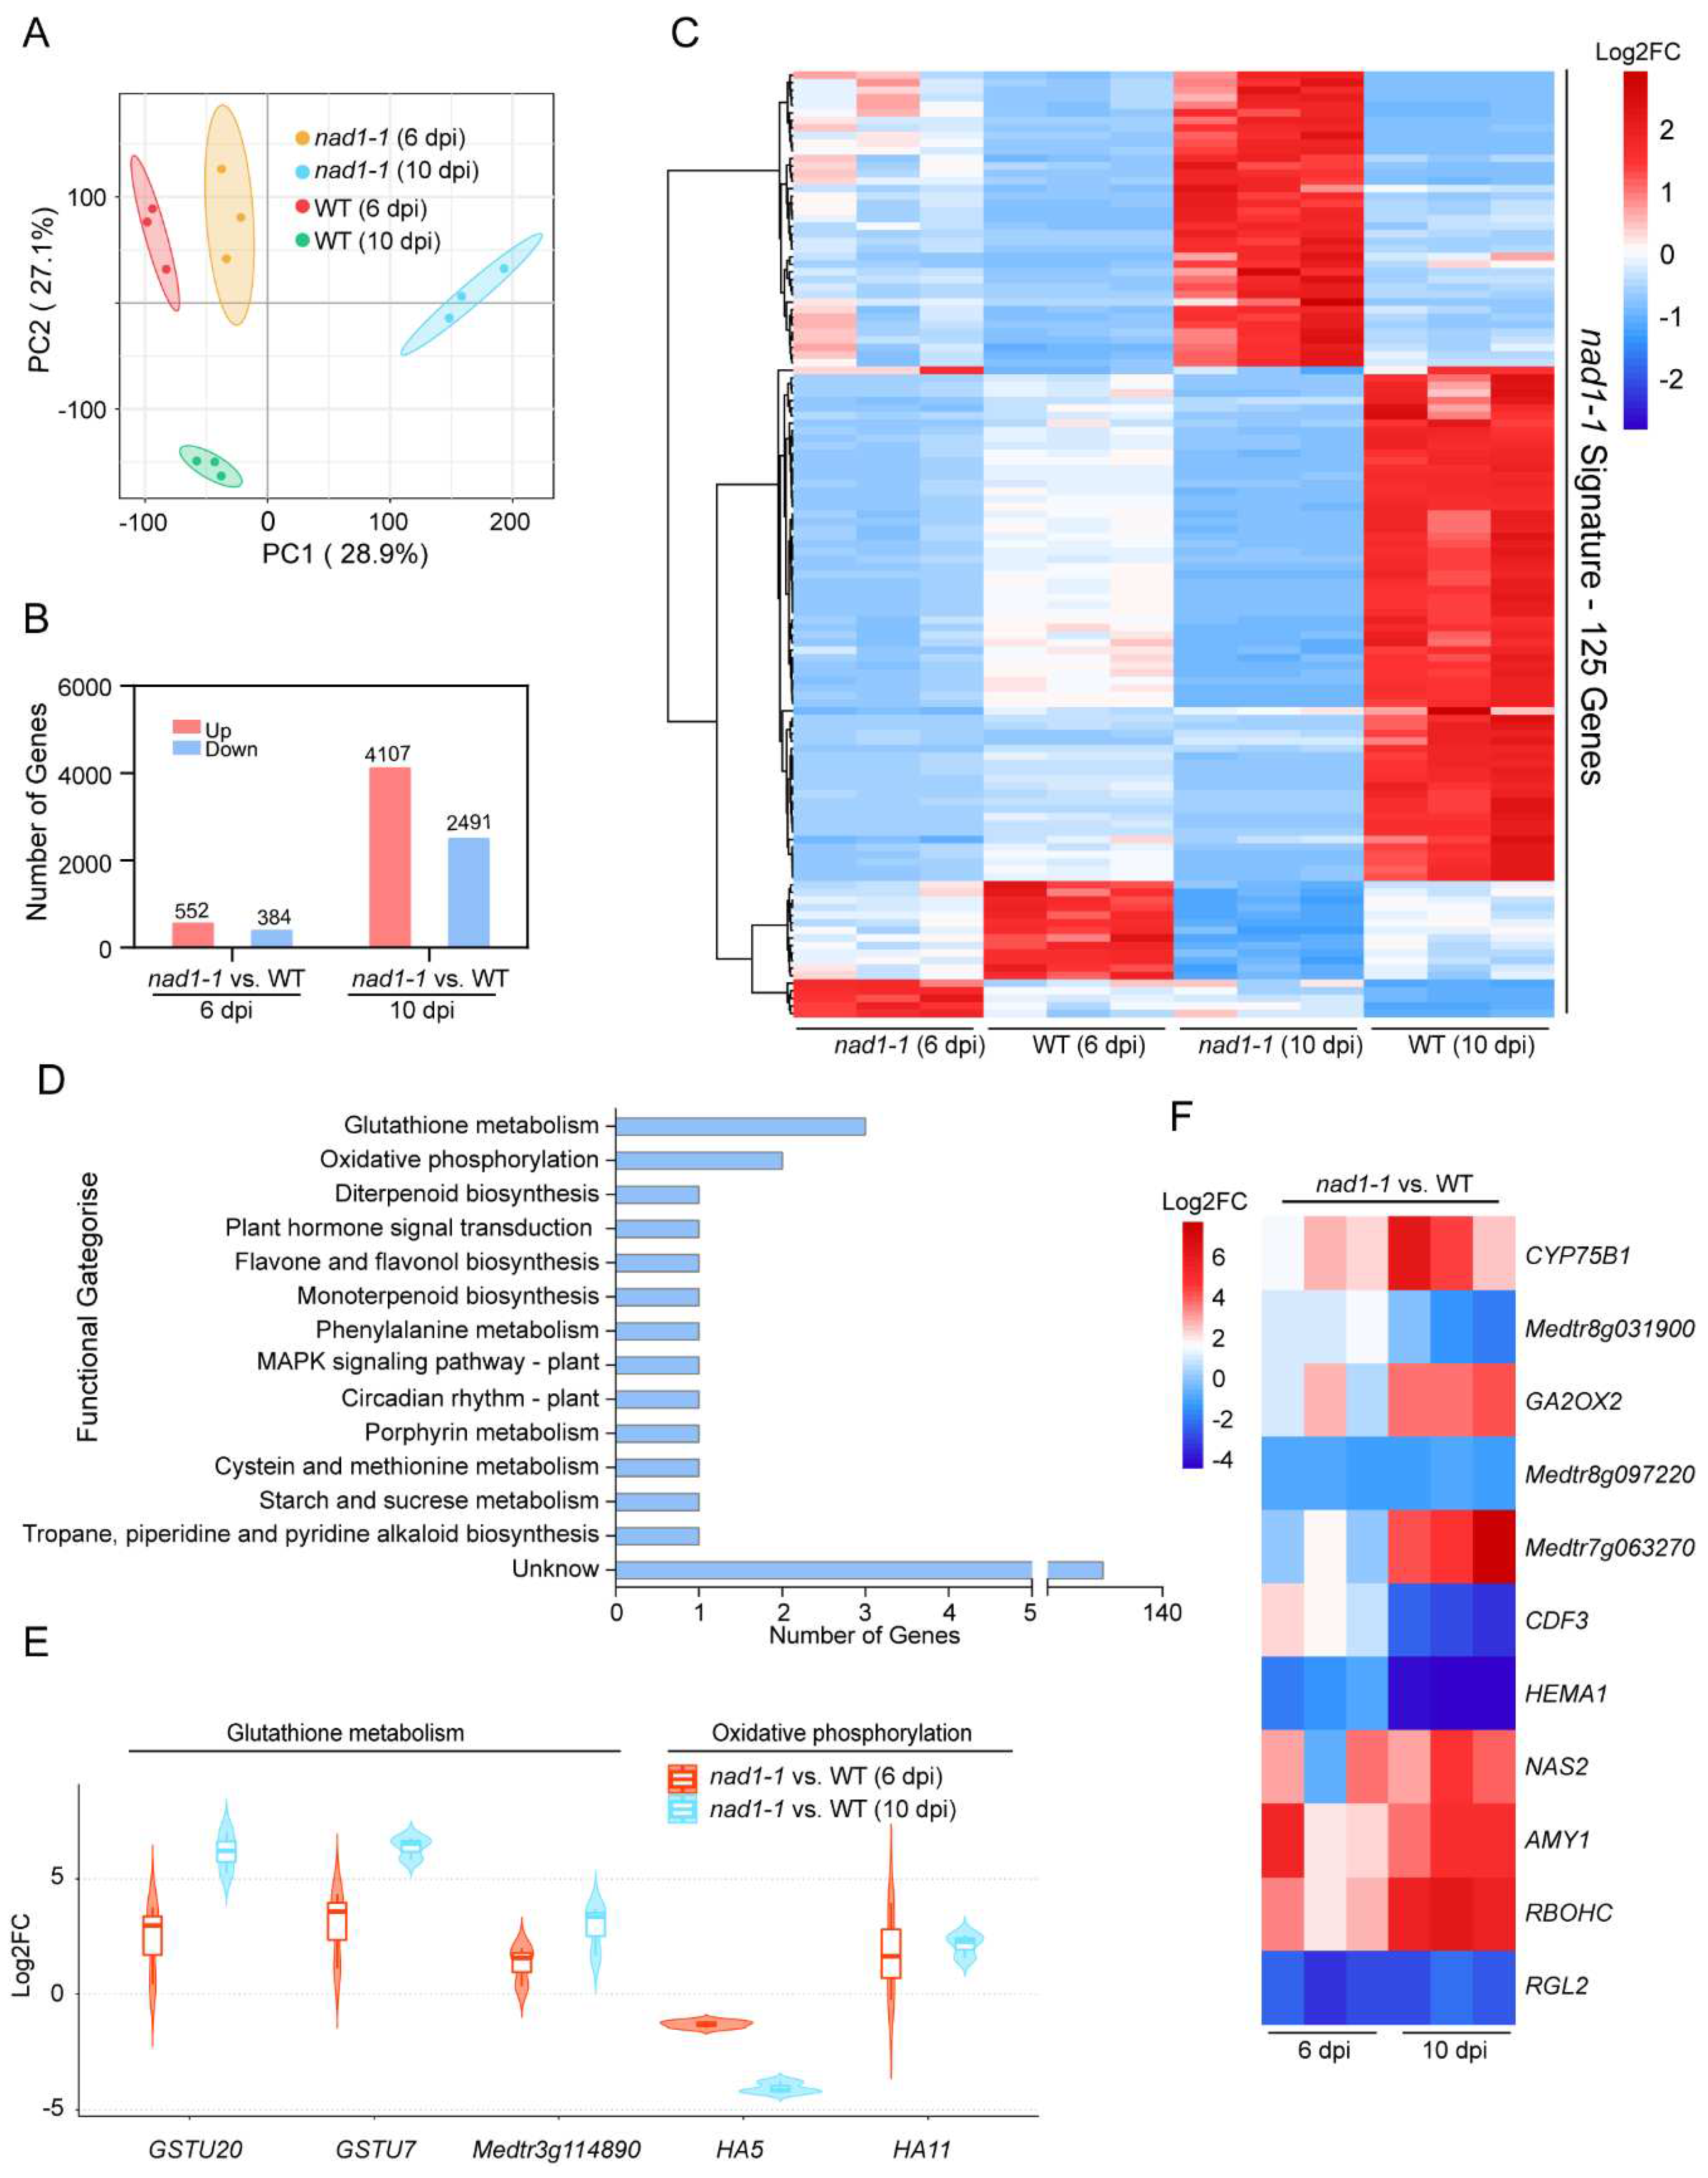
2.2. Identification of DEGs and function analysis in plant
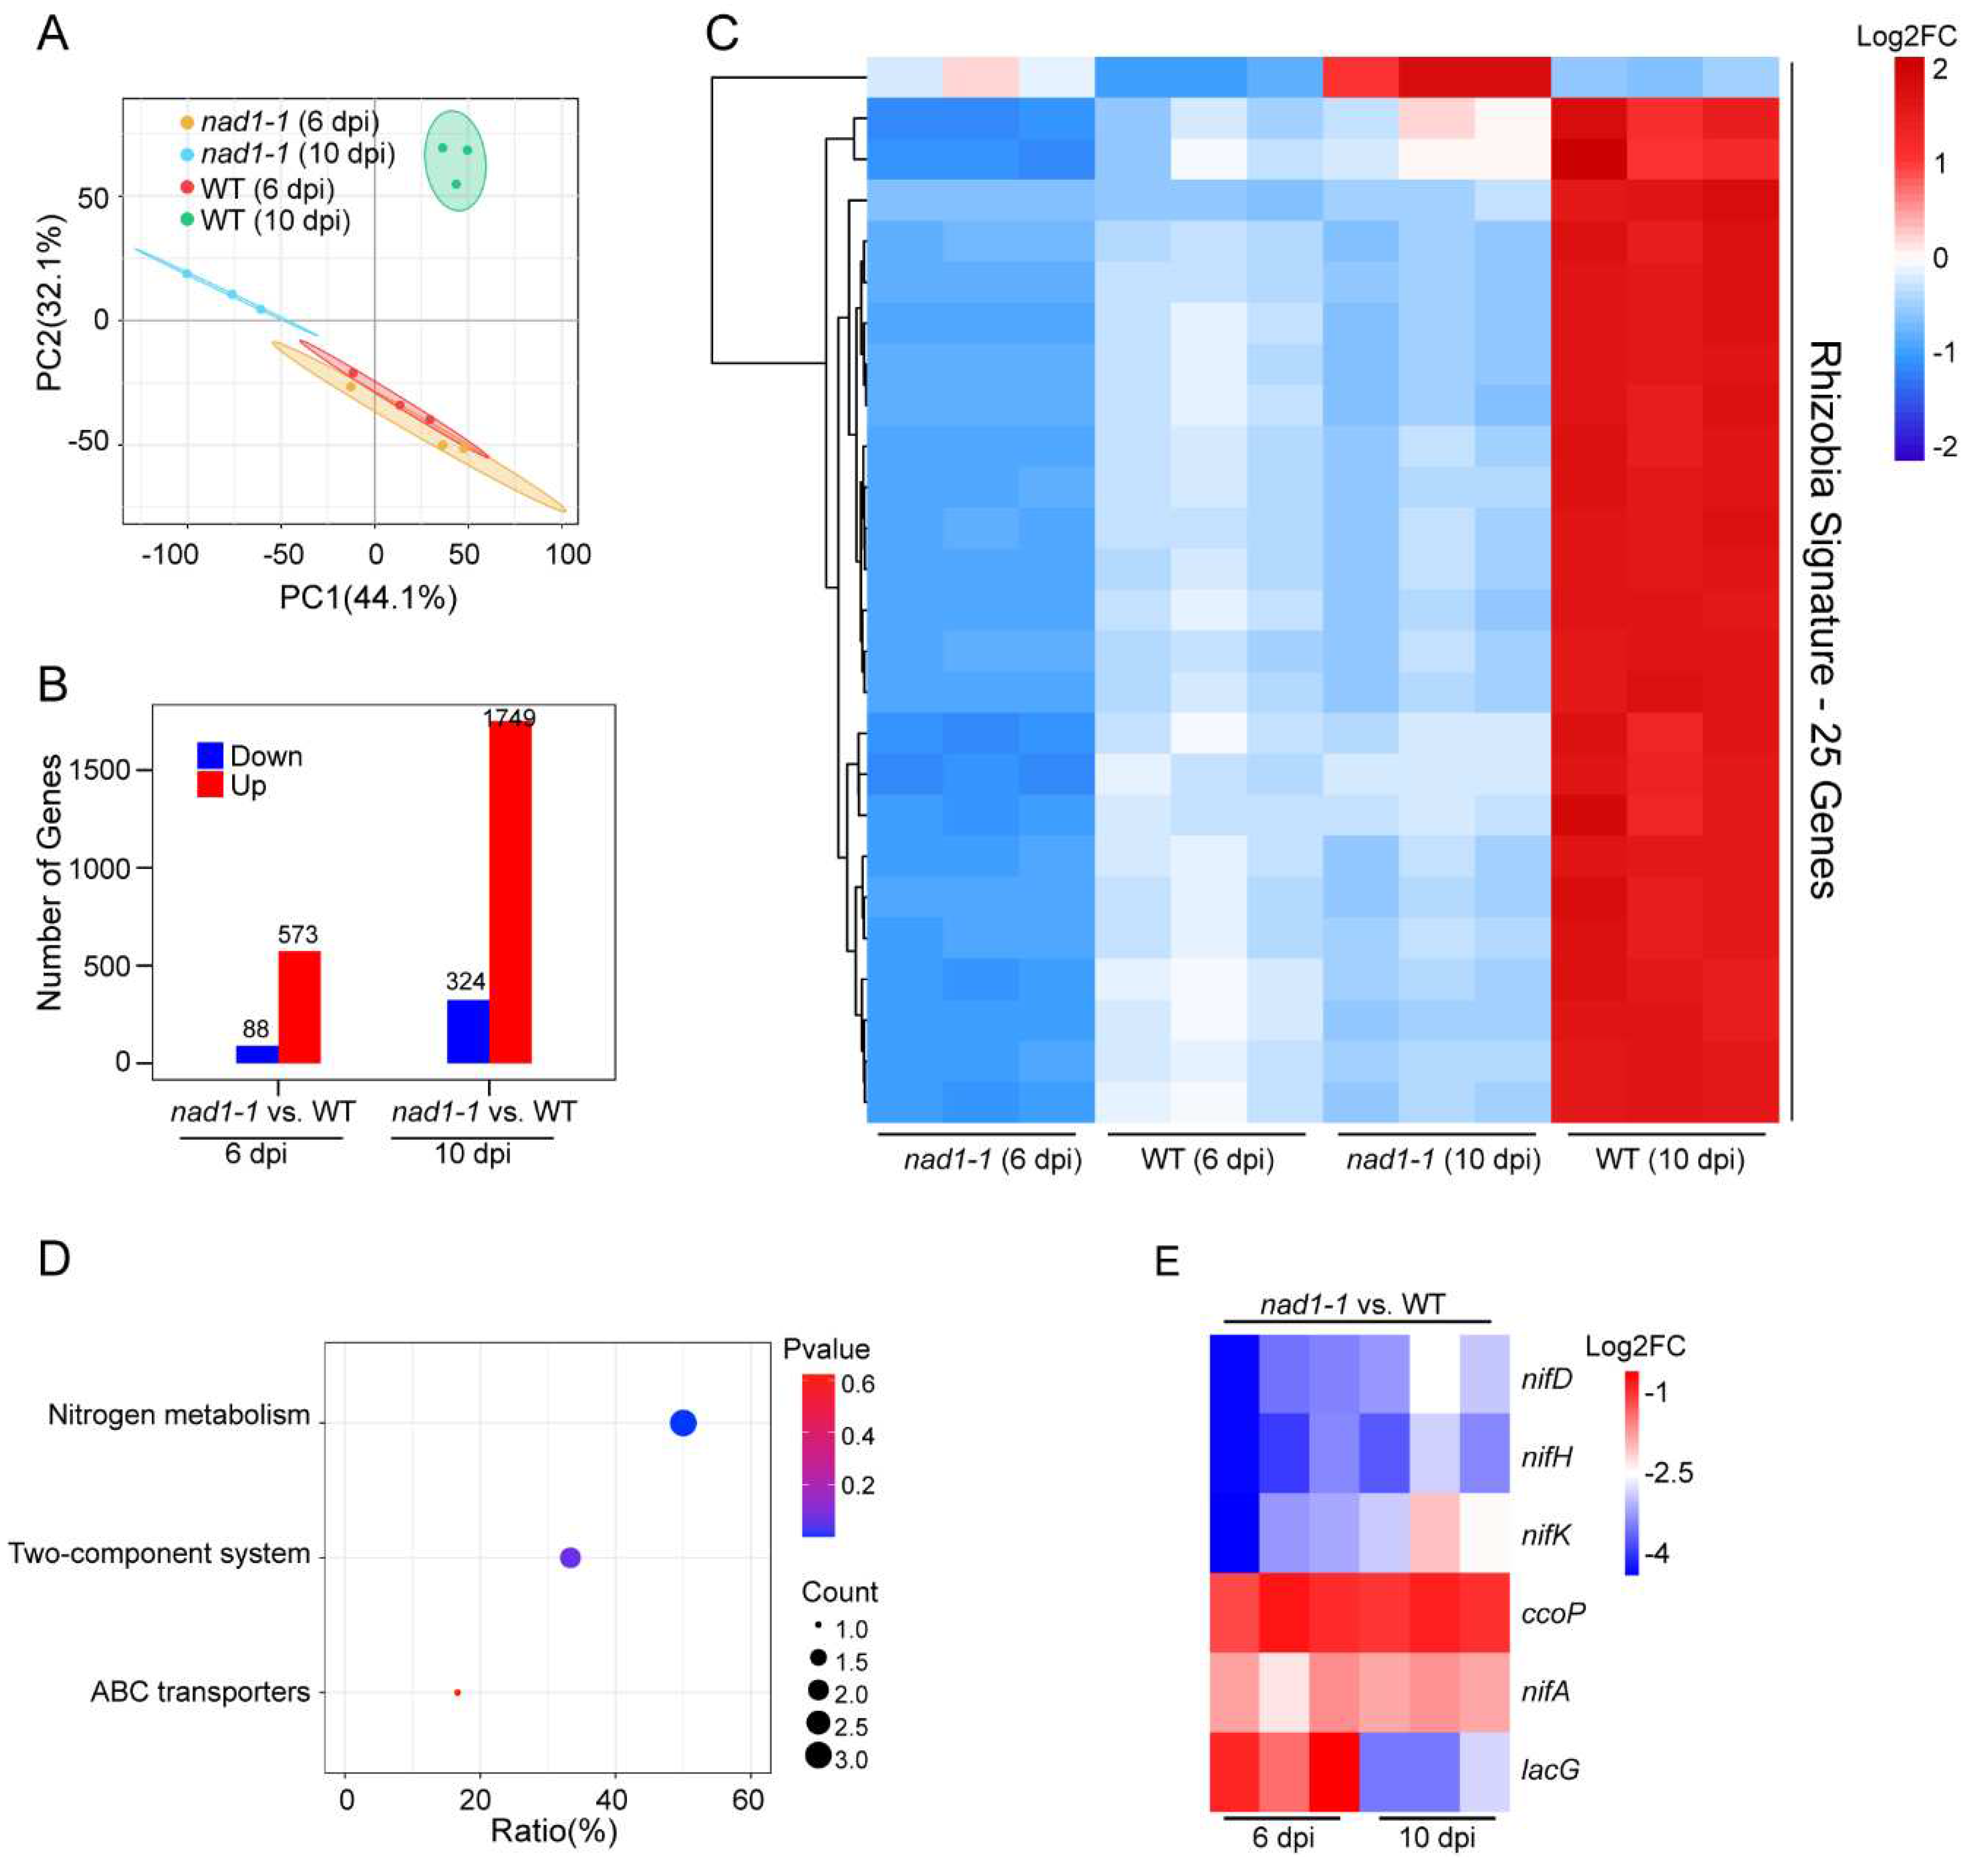
2.3. Identification of DEGs and their function analysis in rhizobia
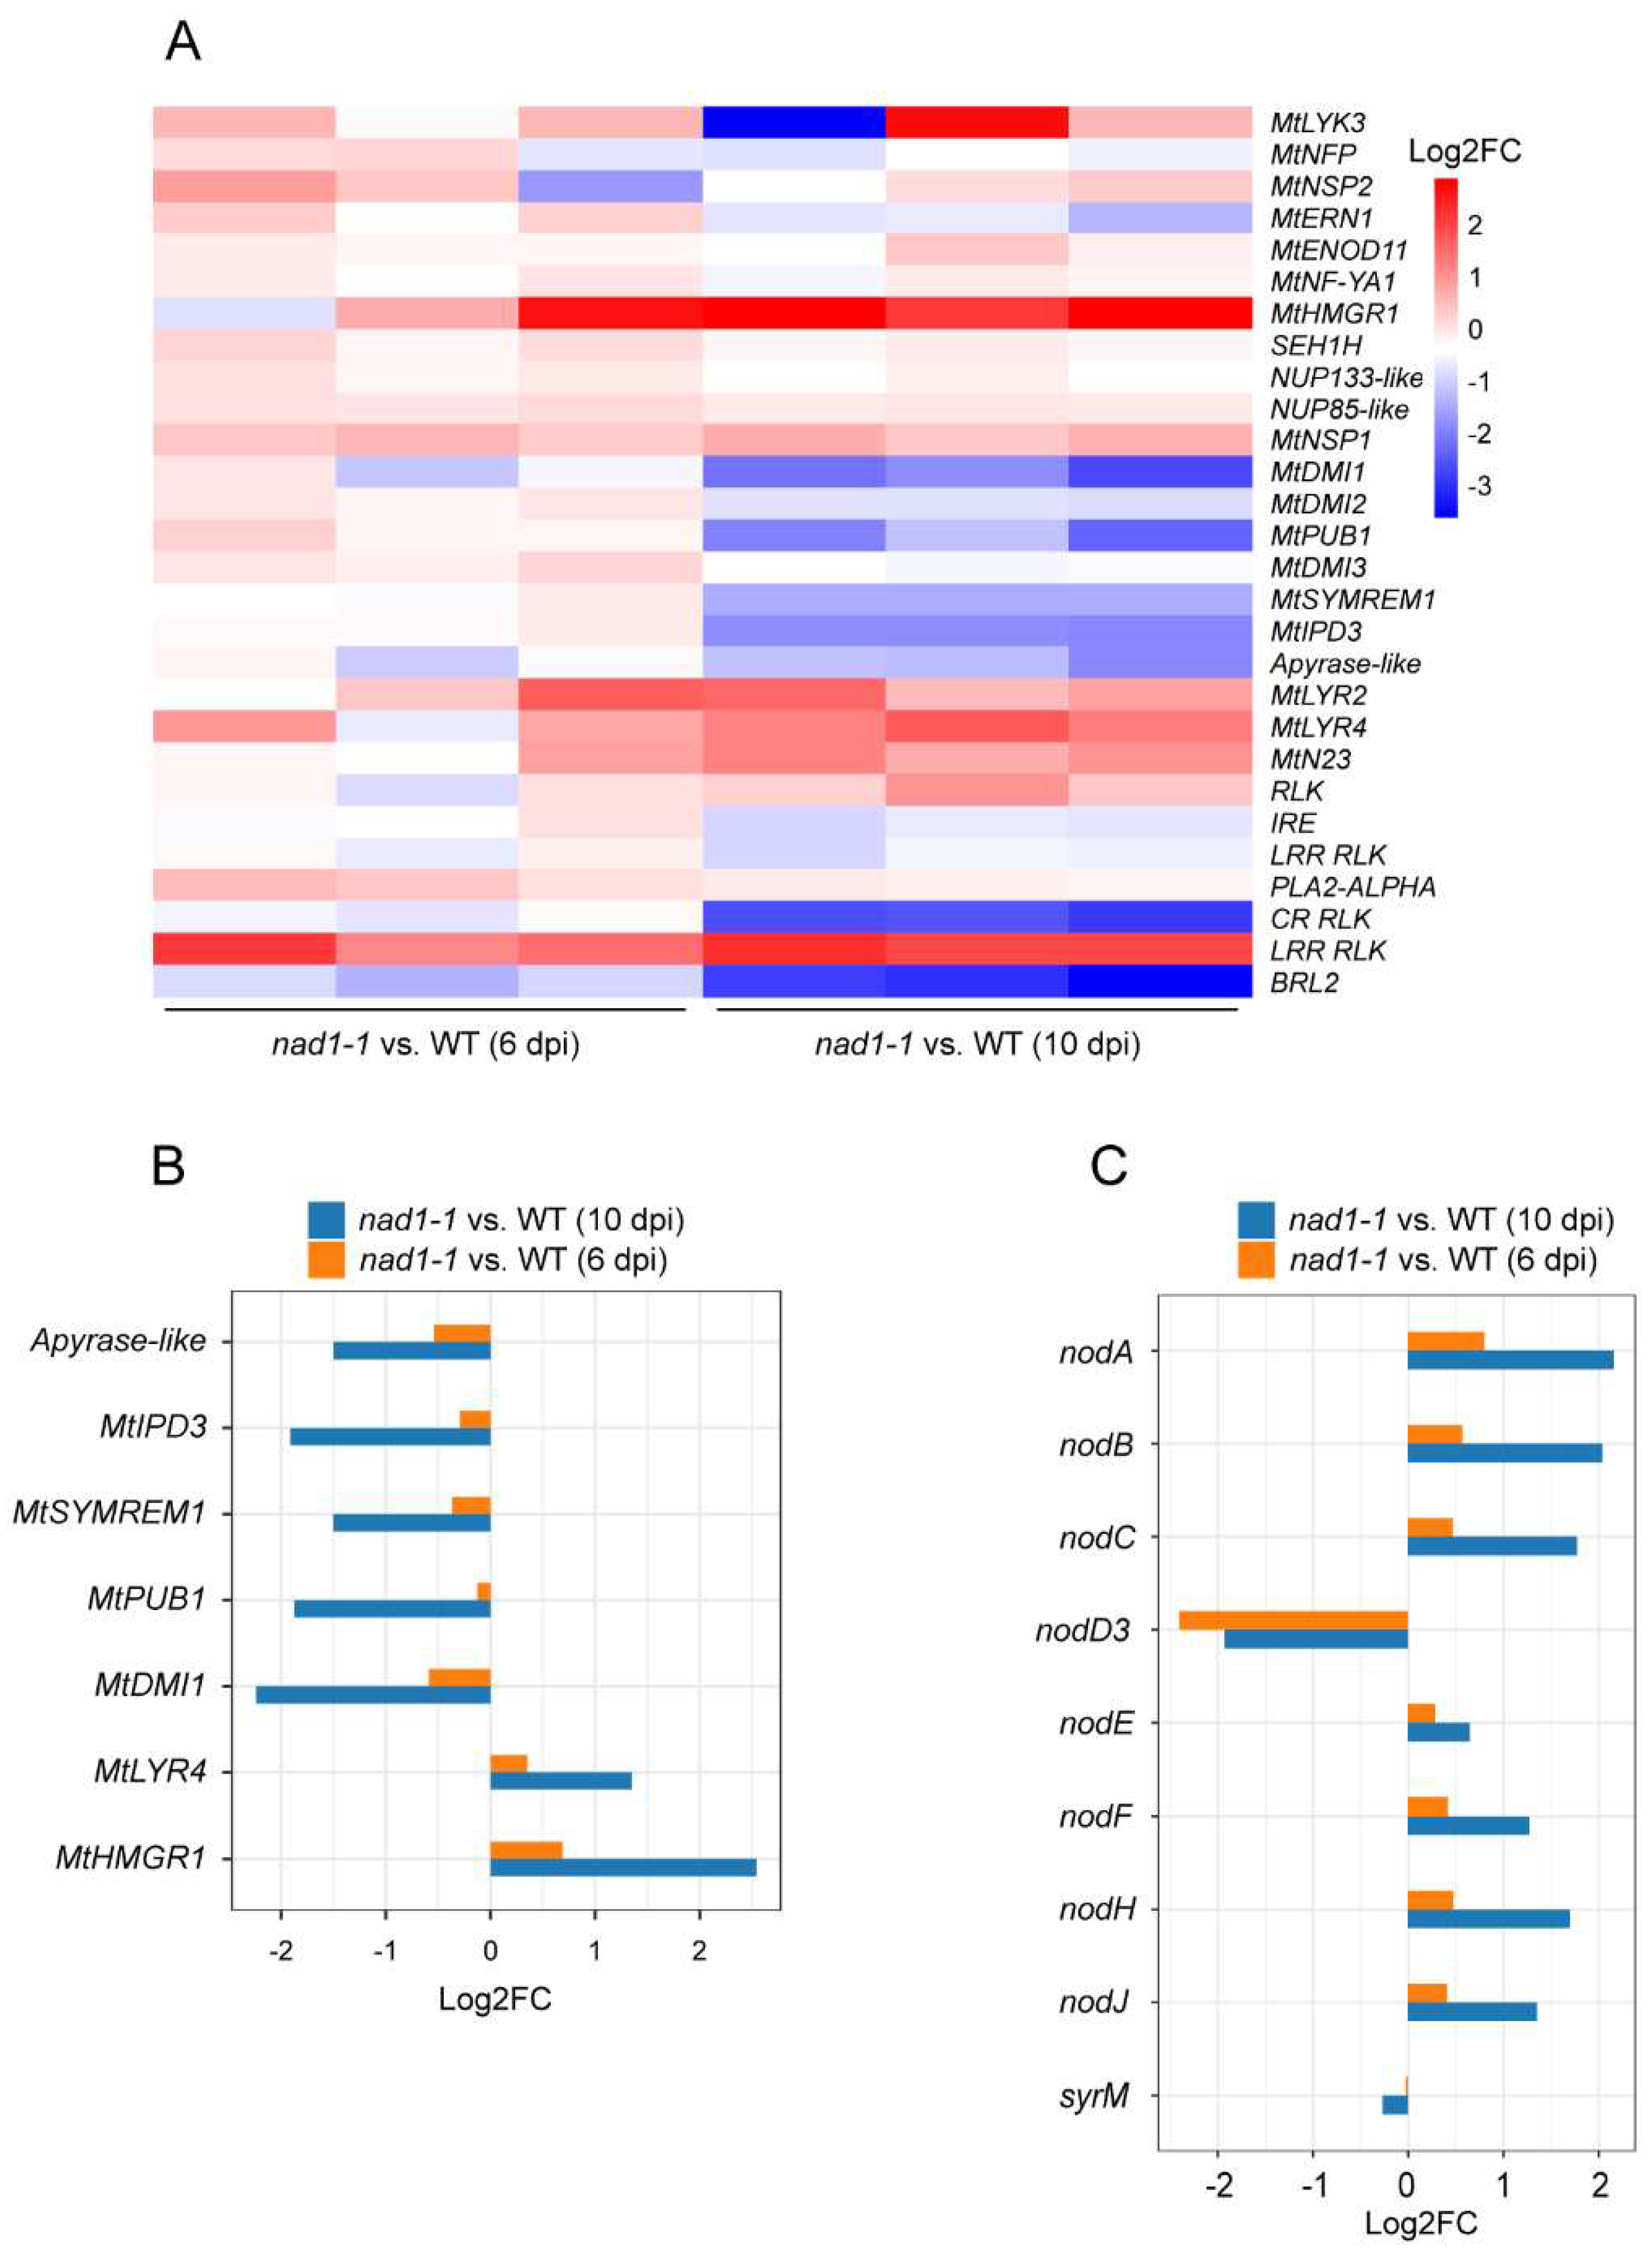
2.4. Expression of genes associated with plant–rhizobia NF signaling process
2.5. Expression of genes involved in nodule meristem and differentiation
2.6. Effects of NAD1 gene on nodule symbiosis
2.7. Interactome Analysis of Medicago and Sinorhizobium During Defense
3. Discussion
4. Materials and Methods
4.1. Growth and Inoculation of Plant cultivation, inoculation, and root-nodule harvest
4.2. Acetylene reduction assay
4.3. Microscopy Analyses
4.4. RNA Isolation/ RNA purification, amplification, and Sequencing
4.5. Dual RNA-seq Data analysis
5. Conclusions
Supplementary Materials
Author Contributions
Funding
Institutional Review Board Statement
Informed Consent Statement
Data Availability Statement
Conflicts of Interest
References
- Oldroyd, G.E.D.; Leyser, O. A plant's diet, surviving in a variable nutrient environment. Science. 2020, 368, eaba0196. [Google Scholar] [CrossRef] [PubMed]
- Guo, K.; Yang, J.; Yu, N.; Luo, L.; Wang, E. Biological nitrogen fixation in cereal crops: Progress, strategies, and perspectives. Plant Commun. 2023, 4, 100499. [Google Scholar] [CrossRef] [PubMed]
- Sprent, J.I.; James, E.K. Legume evolution: where do nodules and mycorrhizas fit in? Plant Physiol. 2007, 144, 575–81. [Google Scholar] [CrossRef] [PubMed]
- Larrainzar, E.; Villar, I.; Rubio, M.C.; Pérez-Rontomé, C.; Huertas, R.; Sato, S.; Mun, J.H.; Becana, M. Hemoglobins in the legume-Rhizobium symbiosis. New Phytol. 2020, 228, 472–484. [Google Scholar] [CrossRef] [PubMed]
- Timmers, A.C.; Soupène, E.; Auriac, M.C.; de Billy, F.; Vasse, J.; Boistard, P.; Truchet, G. Saprophytic intracellular rhizobia in alfalfa nodules. Mol Plant Microbe Interact. 2000, 13, 1204–1213. [Google Scholar] [CrossRef] [PubMed]
- Hirsch, A.M. Developmental biology of legume nodulation. New Phytol. 1992, 122, 211–237. [Google Scholar] [CrossRef]
- Sprent, J.I. Evolving ideas of legume evolution and diversity: a taxonomic perspective on the occurrence of nodulation. New Phytol. 2007, 174, 11–25. [Google Scholar] [CrossRef]
- Glyan'ko, A.K. Signaling Systems of Rhizobia (Rhizobiaceae) and Leguminous Plants (Fabaceae) upon the Formation of a Legume-Rhizobium Symbiosis (Review). Prikl Biokhim Mikrobiol. 2015, 51, 453–464. [Google Scholar] [CrossRef]
- Roy, S.; Liu, W.; Nandety, R.S.; Crook, A.; Mysore, K.S.; Pislariu, C.I.; Frugoli, J.; Dickstein, R.; Udvardi, M.K. Celebrating 20 Years of Genetic Discoveries in Legume Nodulation and Symbiotic Nitrogen Fixation. Plant Cell. 2020, 32, 15–41. [Google Scholar] [CrossRef]
- Mergaert, P.; Uchiumi, T.; Alunni, B.; Evanno, G.; Cheron, A.; Catrice, O.; Mausset, A.E.; Barloy-Hubler, F.; Galibert, F.; Kondorosi, A.; Kondorosi, E. Eukaryotic control on bacterial cell cycle and differentiation in the Rhizobium-legume symbiosis. Proc Natl Acad Sci U S A. 2006, 103, 5230–5235. [Google Scholar] [CrossRef]
- Meng, X.; Zhang, S. MAPK cascades in plant disease resistance signaling. Annu Rev Phytopathol. 2013, 51, 245–266. [Google Scholar] [CrossRef]
- Gómez-Gómez, L.; Boller, T. FLS2: an LRR receptor-like kinase involved in the perception of the bacterial elicitor flagellin in Arabidopsis. Mol Cell. 2000, 5, 1003–1011. [Google Scholar] [CrossRef]
- Miya, A.; Albert, P.; Shinya, T.; Desaki, Y.; Ichimura, K.; Shirasu, K.; Narusaka, Y.; Kawakami, N.; Kaku, H.; Shibuya, N. CERK1, a LysM receptor kinase, is essential for chitin elicitor signaling in Arabidopsis. Proc Natl Acad Sci U S A. 2007, 104, 19613–19618. [Google Scholar] [CrossRef]
- Qi, D.; Innes, R.W. Recent Advances in Plant NLR Structure, Function, Localization, and Signaling. Front Immunol. 2013, 4, 348. [Google Scholar] [CrossRef] [PubMed]
- Boscari, A.; Del Giudice, J.; Ferrarini, A.; Venturini, L.; Zaffini, A.L.; Delledonne, M.; Puppo, A. Expression dynamics of the Medicago truncatula transcriptome during the symbiotic interaction with Sinorhizobium meliloti: which role for nitric oxide? Plant Physiol. 2013, 161, 425–439. [Google Scholar] [CrossRef] [PubMed]
- Saeki, K. Rhizobial measures to evade host defense strategies and endogenous threats to persistent symbiotic nitrogen fixation: a focus on two legume-rhizobium model systems. Cell Mol Life Sci. 2011, 68, 1327–39. [Google Scholar] [CrossRef] [PubMed]
- Zamioudis, C.; Pieterse, C.M. Modulation of host immunity by beneficial microbes. Mol Plant Microbe Interact. 2012, 25, 139–150. [Google Scholar] [CrossRef] [PubMed]
- Feng, Y.; Wu, P.; Liu, C.; Peng, L.; Wang, T.; Wang, C.; Tan, Q.; Li, B.; Ou, Y.; Zhu, H.; Yuan, S.; Huang, R.; Stacey, G.; Zhang, Z.; Cao, Y. Suppression of LjBAK1-mediated immunity by SymRK promotes rhizobial infection in Lotus japonicus. Mol Plant. 2021, 14, 1935–1950. [Google Scholar] [CrossRef] [PubMed]
- Bourcy, M.; Brocard, L.; Pislariu, C.I.; Cosson, V.; Mergaert, P.; Tadege, M.; Mysore, K.S.; Udvardi, M.K.; Gourion, B.; Ratet, P. Medicago truncatula DNF2 is a PI-PLC-XD-containing protein required for bacteroid persistence and prevention of nodule early senescence and defense-like reactions. New Phytol. 2013, 197, 1250–1261. [Google Scholar] [CrossRef]
- Berrabah, F.; Bourcy, M.; Eschstruth, A.; Cayrel, A.; Guefrachi, I.; Mergaert, P.; Wen, J.; Jean, V.; Mysore, K.S.; Gourion, B.; Ratet, P. A nonRD receptor-like kinase prevents nodule early senescence and defense-like reactions during symbiosis. New Phytol. 2014, 203, 1305–1314. [Google Scholar] [CrossRef]
- Sinharoy, S.; Torres-Jerez, I.; Bandyopadhyay, K.; Kereszt, A.; Pislariu, C.I.; Nakashima, J.; Benedito, V.A.; Kondorosi, E.; Udvardi, M.K. The C2H2 transcription factor regulator of symbiosome differentiation represses transcription of the secretory pathway gene VAMP721a and promotes symbiosome development in Medicago truncatula. Plant Cell. 2013, 25, 3584–3601. [Google Scholar] [CrossRef] [PubMed]
- Wang, C.; Yu, H.; Luo, L.; Duan, L.; Cai, L.; He, X.; Wen, J.; Mysore, K.S.; Li, G.; Xiao, A.; Duanmu, D.; Cao, Y.; Hong, Z.; Zhang, Z. NODULES WITH ACTIVATED DEFENSE 1 is required for maintenance of rhizobial endosymbiosis in Medicago truncatula. New Phytol. 2016, 212, 176–191. [Google Scholar] [CrossRef] [PubMed]
- Berrabah, F.; Ratet, P.; Gourion, B. Multiple steps control immunity during the intracellular accommodation of rhizobia. J Exp Bot. 2015, 66, 1977–85. [Google Scholar] [CrossRef]
- Yu, H.; Bao, H.; Zhang, Z.; Cao, Y. Immune Signaling Pathway during Terminal Bacteroid Differentiation in Nodules. Trends Plant Sci. 2019, 24, 299–302. [Google Scholar] [CrossRef] [PubMed]
- Gu, Y.; Zebell, S.G.; Liang, Z.; Wang, S.; Kang, B.H.; Dong, X. Nuclear Pore Permeabilization Is a Convergent Signaling Event in Effector-Triggered Immunity. Cell. 2016, 166, 1526–1538. [Google Scholar] [CrossRef] [PubMed]
- Nobori, T.; Velásquez, A.C.; Wu, J.; Kvitko, B.H.; Kremer, J.M.; Wang, Y.; He, S.Y.; Tsuda, K. Transcriptome landscape of a bacterial pathogen under plant immunity. Proc Natl Acad Sci U S A. 2018, 115, E3055–E3064. [Google Scholar] [CrossRef]
- Mahmood, K.; Torres-Jerez, I.; Krom, N.; Liu, W.; Udvardi, M.K. Transcriptional Programs and Regulators Underlying Age-Dependent and Dark-Induced Senescence in Medicago truncatula. Cells. 2022, 11, 1570. [Google Scholar] [CrossRef]
- Fagorzi, C.; Bacci, G.; Huang, R.; Cangioli, L.; Checcucci, A.; Fini, M.; Perrin, E.; Natali, C.; DiCenzo, G.C.; Mengoni, A. Nonadditive Transcriptomic Signatures of Genotype-by-Genotype Interactions during the Initiation of Plant-Rhizobium Symbiosis. mSystems. 2021, 6, e00974–e00920. [Google Scholar] [CrossRef]
- Zhang, A.; Luo, R.; Li, J.; Miao, R.; An, H.; Yan, X.; Pang, Q. Arabidopsis Glutathione-S-Transferases GSTF11 and GSTU20 Function in Aliphatic Glucosinolate Biosynthesis. Front Plant Sci. 2022, 12, 816233. [Google Scholar] [CrossRef]
- Ugalde, J.M.; Lamig, L.; Herrera-Vásquez, A.; Fuchs, P.; Homagk, M.; Kopriva, S.; Müller-Schüssele, S.J.; Holuigue, L.; Meyer, A.J. A dual role for glutathione transferase U7 in plant growth and protection from methyl viologen-induced oxidative stress. Plant Physiol. 2021, 187, 2451–2468. [Google Scholar] [CrossRef]
- Saliba, E.; Primo, C.; Guarini, N.; André, B. A plant plasma-membrane H+-ATPase promotes yeast TORC1 activation via its carboxy-terminal tail. Sci Rep. 2021, 11, 4788. [Google Scholar] [CrossRef] [PubMed]
- Liu, Y.; Fan, W.; Cheng, Q.; Zhang, L.; Cai, T.; Shi, Q.; Wang, Z.; Chang, C.; Yin, Q.; Jiang, X.; Jin, K. Multi-omics analyses reveal new insights into nutritional quality changes of alfalfa leaves during the flowering period. Front Plant Sci. 2022, 13, 995031. [Google Scholar] [CrossRef] [PubMed]
- Jia, X.M.; Zhu, Y.F.; Hu, Y.; Zhang, R.; Cheng, L.; Zhu, Z.L.; Zhao, T.; Zhang, X.; Wang, Y.X. Integrated physiologic, proteomic, and metabolomic analyses of Malus halliana adaptation to saline-alkali stress. Hortic Res. 2019, 6, 91. [Google Scholar] [CrossRef] [PubMed]
- Yu, H.; Xiao, A.; Dong, R.; Fan, Y.; Zhang, X.; Liu, C.; Wang, C.; Zhu, H.; Duanmu, D.; Cao, Y.; Zhang, Z. Suppression of innate immunity mediated by the CDPK-Rboh complex is required for rhizobial colonization in Medicago truncatula nodules. New Phytol. 2018, 220, 425–434. [Google Scholar] [CrossRef]
- Roux, B.; Rodde, N.; Jardinaud, M.F.; Timmers, T.; Sauviac, L.; Cottret, L.; Carrère, S.; Sallet, E.; Courcelle, E.; Moreau, S.; Debellé, F. .; Capela, D.; de Carvalho-Niebel, F.; Gouzy, J.; Bruand, C.; Gamas, P. An integrated analysis of plant and bacterial gene expression in symbiotic root nodules using laser-capture microdissection coupled to RNA sequencing. Plant J. 2014, 77, 817–837. [Google Scholar] [CrossRef]
- Barnett, M.J.; Long, S.R. The Sinorhizobium meliloti SyrM regulon: effects on global gene expression are mediated by syrA and nodD3. J Bacteriol. 2015, 197, 1792–1806. [Google Scholar] [CrossRef]
- Mathesius, U.; Crespi, M.; Frugier, F. MtCRE1-dependent cytokinin signaling integrates bacterial and plant cues to coordinate symbiotic nodule organogenesis in Medicago truncatula. Plant J. 2011, 65, 622–633. [Google Scholar]
- Jardinaud, M.F.; Fromentin, J.; Auriac, M.C.; Moreau, S.; Pecrix, Y.; Taconnat, L.; Cottret, L.; Aubert, G.; Balzergue, S.; Burstin, J.; Carrere, S.; Gamas, P. MtEFD and MtEFD2: Two transcription factors with distinct neofunctionalization in symbiotic nodule development. Plant Physiol. 2022, 189, 1587–1607. [Google Scholar] [CrossRef]
- Alunni, B.; Gourion, B. Terminal bacteroid differentiation in the legume-rhizobium symbiosis: nodule-specific cysteine-rich peptides and beyond. New Phytol. 2016, 211, 411–417. [Google Scholar] [CrossRef]
- Zhang, J.; Subramanian, S.; Zhang, Y.; Yu, O. Flavone synthases from Medicago truncatula are flavanone-2-hydroxylases and are important for nodulation. Plant Physiol. 2007, 144, 741–751. [Google Scholar] [CrossRef]
- Gargantini, P.R.; Gonzalez-Rizzo, S.; Chinchilla, D.; Raices, M.; Giammaria, V.; Ulloa, R.M.; Frugier, F.; Crespi, M.D. A CDPK isoform participates in the regulation of nodule number in Medicago truncatula. Plant J. 2006, 48, 843–856. [Google Scholar] [CrossRef] [PubMed]
- Lang, C.; Long, S.R. Transcriptomic Analysis of Sinorhizobium meliloti and Medicago truncatula Symbiosis Using Nitrogen Fixation-Deficient Nodules. Mol Plant Microbe Interact. 2015, 28, 856–868. [Google Scholar] [CrossRef] [PubMed]
- Li, Q.; Chen, S. Transfer of Nitrogen Fixation (nif) Genes to Non-diazotrophic Hosts. Chembiochem. 2020, 21, 1717–1722. [Google Scholar] [CrossRef] [PubMed]
- Janczarek, M. Environmental signals and regulatory pathways that influence exopolysaccharide production in rhizobia. Int J Mol Sci. 2011, 12, 7898–7933. [Google Scholar] [CrossRef]
- Ding, H.; Yip, C.B.; Geddes, B.A.; Oresnik, I.J.; Hynes, M.F. Glycerol utilization by Rhizobium leguminosarum requires an ABC transporter and affects competition for nodulation. Microbiology (Reading). 2012, 158, 1369–1378. [Google Scholar] [CrossRef]
- Zhou, D.; Li, Y.; Wang, X.; Xie, F.; Chen, D.; Ma, B.; Li, Y. Mesorhizobium huakuii HtpG Interaction with nsLTP AsE246 Is Required for Symbiotic Nitrogen Fixation. Plant Physiol. 2019, 180, 509–528. [Google Scholar] [CrossRef]
- Sadykov, M.R.; Zhang, B.; Halouska, S.; Nelson, J.L.; Kreimer, L.W.; Zhu, Y.; Powers, R.; Somerville, G.A. Using NMR metabolomics to investigate tricarboxylic acid cycle-dependent signal transduction in Staphylococcus epidermidis. J Biol Chem. 2010, 285, 36616–36624. [Google Scholar] [CrossRef]
- Hu, J.; Akula, N.; Wang, N. Development of a Microemulsion Formulation for Antimicrobial SecA Inhibitors. PLoS One. 2016, 11, e0150433. [Google Scholar] [CrossRef]
- Watson, R.J.; Rastogi, V.K. Cloning and nucleotide sequencing of Rhizobium meliloti aminotransferase genes: an aspartate aminotransferase required for symbiotic nitrogen fixation is atypical. J Bacteriol. 1993, 175, 1919–1928. [Google Scholar] [CrossRef]
- Zheng, H.; Mao, Y.; Teng, J.; Zhu, Q.; Ling, J.; Zhong, Z. Flagellar-dependent motility in Mesorhizobium tianshanense is involved in the early stage of plant host interaction: study of an flgE mutant. Curr Microbiol. 2015, 70, 219–227. [Google Scholar] [CrossRef]
- Syska, C.; Brouquisse, R.; Alloing, G.; Pauly, N.; Frendo, P.; Bosseno, M.; Dupont, L.; Boscari, A. Molecular Weapons Contribute to Intracellular Rhizobia Accommodation Within Legume Host Cell. Front Plant Sci. 2019, 10, 1496. [Google Scholar] [CrossRef] [PubMed]
- Cabrera, J.J.; Sánchez, C.; Gates, A.; Bedmar, E.J.; Mesa, S.; Richardson, D.J.; Delgado, M.J. The nitric oxide response in plant-associated endosymbiotic bacteria. Biochem Soc Trans. 2011, 39, 1880–1885. [Google Scholar] [CrossRef] [PubMed]
- Cao, Y.; Halane, M.K.; Gassmann, W.; Stacey, G. The Role of Plant Innate Immunity in the Legume-Rhizobium Symbiosis. Annu Rev Plant Biol. 2017, 68, 535–561. [Google Scholar] [CrossRef] [PubMed]
- Marino, D.; Andrio, E.; Danchin, E.G.; Oger, E.; Gucciardo, S.; Lambert, A.; Puppo, A.; Pauly, N. A Medicago truncatula NADPH oxidase is involved in symbiotic nodule functioning. New Phytol. 2011, 189, 580–592. [Google Scholar] [CrossRef] [PubMed]
- Montiel, J.; Arthikala, M.K.; Cárdenas, L.; Quinto, C. Legume NADPH Oxidases Have Crucial Roles at Different Stages of Nodulation. Int J Mol Sci. 2016, 17, 680. [Google Scholar] [CrossRef]
- Harrison, J. Jamet, A.; Muglia, C.I.; Van de Sype, G.; Aguilar, O.M.; Puppo, A.; Frendo, P. Glutathione plays a fundamental role in growth and symbiotic capacity of Sinorhizobium meliloti. J Bacteriol. 2005, 187, 168–174. [Google Scholar] [CrossRef]
- Castro-Sowinski, S.; Matan, O.; Bonafede, P.; Okon, Y. A thioredoxin of Sinorhizobium meliloti CE52G is required for melanin production and symbiotic nitrogen fixation. Mol Plant Microbe Interact. 2007, 20, 986–993. [Google Scholar] [CrossRef]
- Benyamina, S.M.; Baldacci-Cresp, F.; Couturier, J.; Chibani, K.; Hopkins, J.; Bekki, A.; de Lajudie, P.; Rouhier, N.; Jacquot, J.P.; Alloing, G.; Puppo, A.; Frendo, P. Two Sinorhizobium meliloti glutaredoxins regulate iron metabolism and symbiotic bacteroid differentiation. Environ Microbiol. 2013, 15, 795–810. [Google Scholar] [CrossRef]
- Santos, R.; Hérouart, D.; Puppo, A.; Touati, D. Critical protective role of bacterial superoxide dismutase in rhizobium-legume symbiosis. Mol Microbiol. 2000, 38, 750–759. [Google Scholar] [CrossRef]
- Jamet, A.; Sigaud, S.; Van de Sype, G.; Puppo, A.; Hérouart, D. Expression of the bacterial catalase genes during Sinorhizobium meliloti-Medicago sativa symbiosis and their crucial role during the infection process. Mol Plant Microbe Interact. 2003, 16, 217–225. [Google Scholar] [CrossRef]
- Sánchez. C.; Gates, A.J.; Meakin, G.E.; Uchiumi, T.; Girard, L.; Richardson, D.J.; Bedmar, E.J.; Delgado, M.J. Production of nitric oxide and nitrosylleghemoglobin complexes in soybean nodules in response to flooding. Mol Plant Microbe Interact. 2010, 23, 702–711. [Google Scholar] [CrossRef] [PubMed]
- Del Giudice, J.; Cam, Y.; Damiani, I.; Fung-Chat, F.; Meilhoc, E.; Bruand, C.; Brouquisse, R.; Puppo, A.; Boscari, A. Nitric oxide is required for an optimal establishment of the Medicago truncatula-Sinorhizobium meliloti symbiosis. New Phytol. 2011, 191, 405–417. [Google Scholar] [CrossRef]
- Blanquet, P.; Silva, L.; Catrice, O.; Bruand, C.; Carvalho, H.; Meilhoc, E. Sinorhizobium meliloti Controls Nitric Oxide-Mediated Post-Translational Modification of a Medicago truncatula Nodule Protein. Mol Plant Microbe Interact. 2015, 28, 1353–1363. [Google Scholar] [CrossRef] [PubMed]
- Cam, Y. Pierre, O.; Boncompagni, E.; Hérouart, D.; Meilhoc, E.; Bruand, C. Nitric oxide (NO): a key player in the senescence of Medicago truncatula root nodules. New Phytol. 2012, 196, 548–560. [Google Scholar] [CrossRef]
- Anders, S.; Huber, W. Differential expression analysis for sequence count data. Genome Biol. 2010, 11, R106. [Google Scholar] [CrossRef] [PubMed]
Disclaimer/Publisher’s Note: The statements, opinions and data contained in all publications are solely those of the individual author(s) and contributor(s) and not of MDPI and/or the editor(s). MDPI and/or the editor(s) disclaim responsibility for any injury to people or property resulting from any ideas, methods, instructions or products referred to in the content. |
© 2023 by the authors. Licensee MDPI, Basel, Switzerland. This article is an open access article distributed under the terms and conditions of the Creative Commons Attribution (CC BY) license (https://creativecommons.org/licenses/by/4.0/).


