Preprint
Article

Immunotechniques for the Group Determination of Macrolide Antibiotics Traces in the Environment Using a Volume-Mediated Sensitivity Enhancement Strategy

Altmetrics

Downloads

82

Views

27

Comments

0

A peer-reviewed article of this preprint also exists.

Submitted:

07 September 2023

Posted:

11 September 2023

You are already at the latest version

Alerts
Abstract
Macrolide antibiotics, effective antimicrobial agents, are intensively used in human and veterinary medicine as well as in agriculture and therefore are found all over the world as environmental pollutants, harming sensitive eco-community organisms and provoking the selection of resistant forms. A novel azithromycin derivative was synthesized and as a rationally designed hapten conjugate ensured group immunorecognition of 6 major macrolide representatives (105-41%), erythromycin, erythromycin ethylsuccinate, clarithromycin, roxithromycin, azithromycin and dirithromycin in competitive immunoassay based on anti-clarithromycin antibodies. The heterologous hapten-based ELISA format simultaneously contributed to a 5-fold increase in sensitivity (ERY IC50 = 0.04 ng/mL). However, for the detection of trace macrolides in environmental samples, an underexploited in immunoassay field strategy was proposed in the present study to significantly improve the detectability of analytes. Unlike most approaches, it does not require special enhancers/amplifiers or additional concentration/extraction procedures, but only involves a larger volume of test samples. Gradual volume increase of samples (from 0.025 to 10 mL) analyzed in direct competitive ELISA, immunobeads, and immunofiltration assay formats based on the same reagents resulted in a significant improvement (more than 50-fold) in assay sensitivity and detection limit up to 5 and 1 pg/mL, respectively. The suitability of the test for detecting macrolide contamination of natural water was confirmed by recovery of macrolides from spiked blank samples (71.7-141.3%). A series of natural water samples from Lake Onega and its influents near Petrozavodsk were analyzed during a 2022-2023 using both the developed immunoassay and HPLC-MS/MS and revealed no macrolide antibiotic contamination.
Keywords: 
Subject: Environmental and Earth Sciences  -   Water Science and Technology

1. Introduction

Macrolide antibiotics are a family of drugs united by a similar structure, consisting of a 14-16 atom macrocyclic lactone ring with carbohydrate substituents [1]. Here we consider 14- and 15-membered erythromycin-based cousins all carrying desosamine and cladinose/oleandrose linked by a glycosidic bond (Figure S1) apart from 16-membered macrolides having distinct sugars (mycinose, mycaminose and mycarose) [2].
Erythromycin (ERY) and oleandomycin (OLE) are the very first natural representatives of macrolide antibiotics, which have been isolated and used since 1952/54. Esters of ERY and semi-synthetic derivatives such as dirithromycin (DIR), clarithromycin (CLA), roxithromycin (ROX) and azithromycin (AZI), which are more stable in an acidic environment than ERY, date back to the 1980s [3]. Currently, OLE is practically not used individually but registered as a drug combination with tetracycline (OletetrinTM). DIR is not produced in Russia and the United States; however, it is still available in many European countries. Tulathromycin (TUL) is a veterinary antibiotic, indicated only for cattle, pigs and sheep [4]. Each of the three macrolides OLE, DIR and TUL appears in less than 1% of publications and therefore was not included in the following charts, where the main representatives of the macrolides in scientific research are ERY, CLA, AZI and ROX (Figure 1).
Interest in AZI increased significantly during the SARS-CoV-2 pandemic (Figure 1A). In addition to its efficiency against sensitive bacterial co-infection, AZI has demonstrated in vitro activity against SARS-CoV-2 virus and can act at various stages of the viral cycle. Its immunomodulatory properties, ability to suppress cytokine production has been associated with reduced mortality and ventilator days [5]. Thus, a bibliographic search allows us to conclude that over the past 30 years, the scientific literature on 14- and 15-membered macrolides has been devoted to the following main areas: ERI (46.3%), AZI (34.2%) and CLA + ROX (29%+4.2%) (Figure 1B).
The results of the subject area queries indicate that the vast majority (75-85%) of research is related to the field of medicine, which is the main sphere of macrolide application. Scientific attention to the veterinary and agrobiological uses of macrolides primarily focuses on ERY, which is approved for farm animals and accounts for 3.3% and 3.5% of all ERY publications, respectively. The share of human antibiotics CLA, ROX and AZI in these areas is more modest, at around 1% each (Figure 1C). It worth noting the high share (10%) of environmental studies among ROX-queried publications. However, the absolute number of these ROX studies is comparable to those for CLA and AZI, while ERY’s impact on environmental research is as strong as that of CLA, ROX, and AZI combined, due to its long-term use in both human and veterinary medicine.
Indeed, all the mentioned macrolides are commonly found as contaminants in various aquatic environments worldwide with concentrations from ng/L to µg/L [6,7,8,9]. The effect of macrolide exposure on the growth, metabolism, antioxidant system, photosynthesis, DNA replication, and repair in the eco-community of algae, viruses, bacteria, crustaceans, invertebrates, and fish has been noted in many studies [10,11,12,13]. Therefore, as awareness of the potential harm of antibiotic residues to aquatic organisms increases, several antibiotics, including ERY, CLA and AZI, have been placed on the European Union (EU) watch list of new water pollutants [14].
Environmental pollution monitoring requires particularly highly sensitive methods capable of detecting trace amounts of pollutants, which diluted multiple times in the environment and present at very low concentrations. In such cases, additional enrichment and preconcentration of the test sample become essential for sample preparation [9,15,16,17].
Accordingly, the current study aims to enhance the group specificity of the immunochemical method for the detection of key macrolide antibiotics as frequent water pollutants using a novel hapten design and develop an approach to detect trace amounts of analytes by involving a larger sample volume without additional concentration/extraction procedures.

2. Methods

2.1. Chemicals and reagents

Erythromycin (ERY), erythromycin ethyl succinate (ESE), clarithromycin (CLA), roxithromycin (ROX), azithromycin (AZI), tulathromycin (TUL), oleandomycin (OLE), ethylenediamine (EDA), 1-ethyl-3-(3-dimethylaminopropyl) carbodiimide (EDC), N,N′-dicyclohexylcarbodiimide (DCC), N-hydroxysuccinimide (NHS), carboxymethoxylamine hemihydrochloride (CMO), sodium periodate (PI), sodium borohydride, dimethyl adipimidate (DMA), bovine serum albumin (BSA), gelatin (GEL), and horseradish peroxidase (HRP) were purchased from Chimmed (Moscow, Russia). Goat anti-rabbit IgG antibodies conjugated to horseradish peroxidase (GAR-HRP) were purchased from Imtek Ltd. (Moscow, Russia). Dimethylformamide (DMF), glutaraldehyde (GA), and ovalbumin (OVA) were obtained from Serva (Heidelberg, Germany). 9-(Carboxymethyloxime)-clarithromycin (cmoCLA), conjugated antigens and antibodies against BSA-cmoCLA(ae) were prepared and described in our previous work [18].

2.2. Hapten synthesis

TLC analysis was performed on the Silica gel 60 F254 plates (aluminum sheets 20×20 cm) Merck (Darmstadt, Germany). Compounds were purified to have purity higher than 90% by normal phase flash or column chromatography on Merck silica gel (0.040-0.063 mm) (Darmstadt, Germany), or crystallization. The purity was assessed by reverse phase HPLC which was carried out on a Shimadzu HPLC instrument of the LC 10 series (Japan) on a Kromasil-100 C18 column (4.6×250 mm, particle size 5 µm, Ekzo Nobel, Sweden) with an injection volume of 20 µL (concentration of substances 0.25–0.5 mg/mL) at a flow rate of 1.0 mL/min and monitored by a diode array ultraviolet detector at 280 nm. The system consisted of buffer—0.2% HCOONH4 at pH 4.2 and organic phase—acetonitrile. The proportion of acetonitrile was varied from 20→80% for 30 min. 1H and 13C-NMR spectra were recorded at 30ºC on a Bruker 400 NMR spectrometer at 400 and 100 MHz, respectively. Chemical shifts are expressed in δ ppm referenced to an internal tetramethylsilane (δ = 0 ppm) standard. Abbreviations used in describing peak signals are br = broad, s = singlet, d = doublet, dd = doublet of doublets, t = triplet, q = quartet, m = multiplet. ESI MS spectra were recorded on a Bruker microTOF-Q II™ instrument (BrukerDaltonics GmbH, Bremen, Germany).
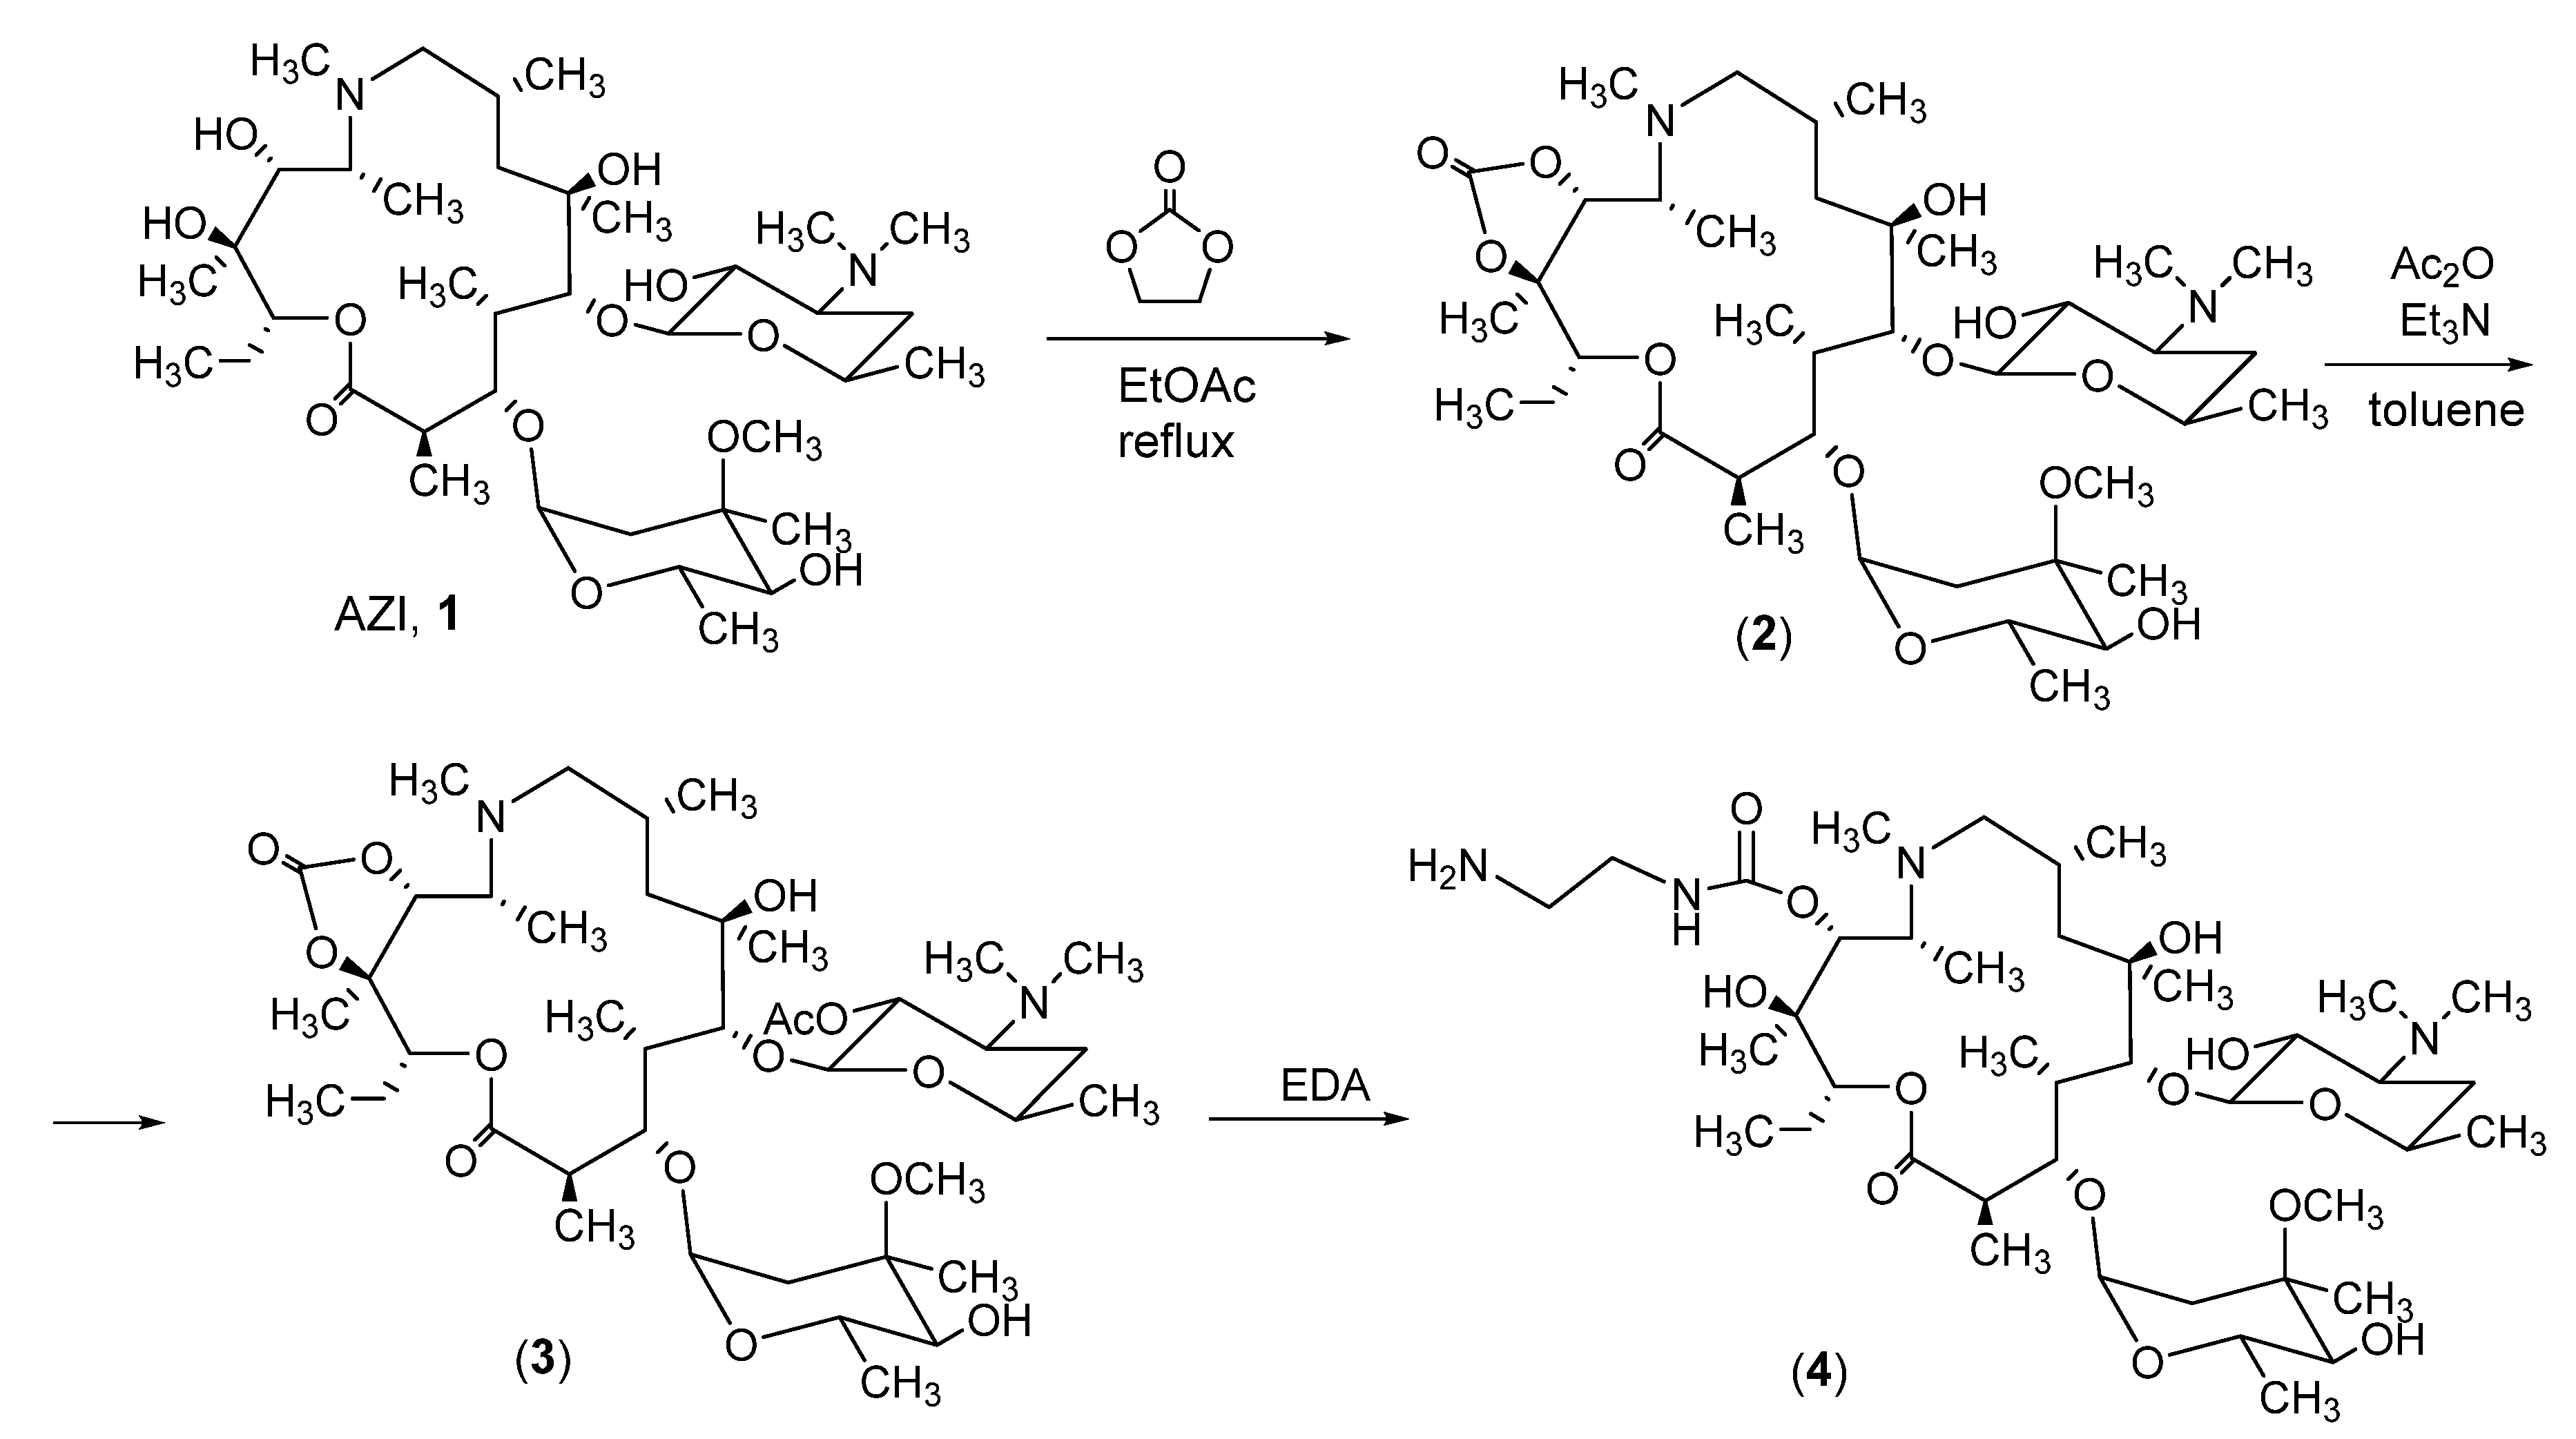
aecAZI. 11,12-cyclic carbonate of azithromycin (2). Ethylene carbonate (4 g, 45.5 mmol) was added poirtionwise to a stirred solution of AZI (6 g, 8.02 mmol) and K2CO3 (1.6 g, 11.58 mmol) in ethyl acetate, the reaction mixture refluxed for 24 h and then concentrated in vacuo. CHCl3 (100 mL) and H2O (100 mL) were added to the residue. The water fraction was extracted with CHCl3 (2×50 mL). The combined organic layers were washed with H2O (2×100 mL), dried over Na2SO4 and evaporated to dryness to give target compound 2 as white solid. Yield: 5.9 g (95%). Rf = 0.25 (CHCl3/CH3OH, 6:1); mp 140–142 °C; MS (ESI) m/z calculated for C39H70N2O13 774.4878; found (M + H)+ 775.4824.
2′-O-Acetyl 11,12-cyclic carbonate of azithromycin (3). Acetic anhydride (0.5 mL, 5.34 mmol) and Et3N (1.48 mL, 10.68 mmol) were added to a solution of 11, 12-cyclic carbonate of azithromycin (2, 2.0 g, 2.67 mmol) in CH2Cl2 (20 mL). The reaction mixture was stirred at room temperature for 24 h, then 5% aqueous solution of NaHCO3 (20 mL) was added, the water layer was extracted CH2Cl2 (2×10 mL). Combined organic layers were washed with H2O (2×10 mL), dried over Na2SO4 and concentered in vacuo. The residue was purified by the flash chromatography method on silica gel (CH2Cl2/CH3OH, 10:1). Fractions containing target compound were combined and evaporated in vacuo to dryness to give target compound 3 as white foam solid. Yield: 1.5 g (75%). Rf = 0.6 (CHCl3/CH3OH, 6:1); mp 134–136 °C; MS (ESI) m/z calculated for C41H72N2O14 816.4984; found (M + H)+ 817.5067.
11-O-(2-aminoethyl)carbamoyl azithromycin (4). 2′-O-Acetyl 11,12-cyclic carbonate of azithromycin (3, 1.0 g, 1.22 mmol) was dissolved in 1,2-diaminoethane (4 mL). The reaction mixture was stirred at room temperature for 48 h, then ethyl acetate (50 mL) and H2O (40 mL) were added. The organic layer was separated extracted ethyl acetate (2×20 mL). Combined organic layers were washed with H2O (2×40 mL), dried over Na2SO4 and concentered in vacuo. The residue was purified by the flash chromatography method on silica gel (CH2Cl2/CH3OH, 10:1). Fractions containing target compound were combined and evaporated in vacuo to dryness to give target compound 4 (aecAZI) as light foam. Yield: 0.817 g (80%); Rf = 0.15 (CHCl3/CH3OH/NH3, 3:1:0.1); MS (ESI) m/z calculated for C41H78N4O13 834.5565 found (M+H)+ 835.7054. Rt 5.05 min. 1H NMR (400 MHz, CDCl3, δ ppm): 5.02 (s, 2H), 4.91 (d, 1H), 4.49 (d, 1H), 4.41(d, 1H), 4.30 (s, 1H), 4.10 (t, 1H), 3.29-3.32 (m, 4H), 3.13 (t, 3H), 3.02 (d, 1H), 2.35 (m, 7H), 2.23 (m, 3H), 1.98 (m, 3H), 1.73–1.76 (m, 1H), 1.66 (t, 1H), 1.55 (m, 2H), 1.36–1.17 (m, 15H), 1.13 (m, 2H), 1.09 (d, 3H), 0.99 (d, 2H), 0.86 (t, 2H). 13C NMR (100 MHz, CDCl3, δ ppm): 177.1, 158.1, 104.2, 96.2, 78.8, 78.1, 75.3, 74.3, 73.1, 70.9, 70.7, 66.1, 65.8, 62.2, 62.1, 49.8, 45.9, 43.1, 42.4, 40.7, 39.7, 37.8, 36.2, 35.2, 31.7, 29.9, 29.8, 29.7, 29.6, 29.5, 29.4, 27.2, 22.9, 22.3, 21.82, 21.5, 18.2, 14.8, 11.6, 10.7, 10.2.
cmoERY. CMO-derivative of ERY was synthesized according to procedure described elsewhere [19]. Briefly, CMO (10 mg, 78 µmol) was dissolved in 2 mL of water and added dropwise to ERY solution (20 mg, 27 µmol) in 2 mL of ethanol. The pH was adjusted to 5.5 by using a 1M NaHCO3. The mixture was incubated for 5 h at 50oC and then cooled to room temperature. To extract cmoERY, CH2Cl2 (5 mL) was added. The organic phase was evaporated in vacuo; a brown oily residue was dried out using Na2SO4 and confirmed by HPLC–MS/MS.

2.3. Preparation of coating antigens

GEL-cmoCLA(ae). Cmo-CLA (5 mg, 6.1 µmol) in 1 mL of DMF was supplemented with NHS and EDC (10 µmol) from 10 mg/mL solution in DMF). After stirring a mixture for 1.5 h, the activated cmo-CLA was dropwise added to GEL (8 mg, 50 nmol) in 1 mL of carbonate-bicarbonate buffer (CBB, 0.05M, pH 9.5) and stirred overnight at room temperature. Molar ratios between protein and hapten were taken as 1/10 and 1/30.
OVA-cmoERY(ae). Cmo-ERY (8 mg, 10 µmol) was dissolved in 1 mL DMF and supplemented with DCC (4 mg, 20 mmol) and NHS (2.3 mg, 20 mmol). The mixture was stirred for 4 h, after that some precipitated DCC-urea was removed by centrifugation. Then, the activated cmo-ERY was dropwise added to OVA (4.5 mg, 100 nmol) in 2 mL of water, stirred using a magnet stirrer and kept at 4oC overnight.
OVA-aecAZI(ga). The mixtures containing 3,6 mg of OVA (80 nmol) and 10- or 30-fold molar excess of aecAZI (0.67 and 2.0 mg, respectively) in 1 mL of CBB were composed. Freshly prepared 2.5% glutaraldehyde solution (40 µL, 10 µmol) were added to each mixture and stirred for 2.5 h using a magnet stirrer. And extra 1h-stirring was conducted after the addition of 100 µL of sodium borohydride (1.9 mg/mL).
OVA-aecAZI(dma). The mixtures containing 3.6 mg of OVA (80 nmol) and 10- or 30-fold molar excess of aecAZI (0.67 and 2.0 mg, respectively) in 1 mL of CBB were supplemented with of DMA (2,45 mg, 10 µmol) in 100 µL of CBB and stirred for 2.5 h.
OVA(pi)-aecAZI. OVA (9.0 mg, 200 nmol) in 1 mL of 10 мM acetic buffer (pH 5.0) was supplemented with sodium periodate (2.14 mg, 10 µmol) from 10 mg/mL solution and stirred for 20 min. After oxidation, excessive reagents were removed by overnight dialysis against 5L 10 мM acetic buffer. The volume of dialysate was measured and portions of oxidized OVA (3.6 mg, 80 nmol) were added to solutions of 0.67 or 2.0 mg aecAZI (10 and 30-fold molar excess over OVA, respectively) in 0.5 mL CBB and stirred 2.5 h at room temperature. To stabilize conjugates, 100 µL of sodium borohydride (1.9 mg/mL) were added to each reaction mixture and stirred for 1h.
To remove the unreacted low-molecular weight ingredients, the resultant conjugates were dialyzed using Visking tubes (Sigma, St. Louis, MO, MWCO 14 kDa) against 2×5L of 0.9% NaCl, pH 7.4 for 48 hours. The dialysates were supplemented with glycerol and stored as 1 mg/mL-solutions at -20 oC until use.

2.4. Indirect competitive enzyme-linked immunosorbent assay (icELISA)

The general ELISA procedure, buffers, washing steps, temperature and duration of incubations, registration and processing of results did not differ from [20]. In present work, we investigated and compared several new designed and previously established coating antigens, which were adsorbed on the 96-well Costar plates from 0.1-3.0 µg/mL solutions in CBB (pH 9.6) overnight at 4 oC. The number of analytes, macrolides to be analyzed as cross-reactive substances was expanded in this work and represented by CLA, ERY, ESE, ROX, AZI, DIR, TUL and OLE. Solutions of these analytes (1 pg/mL–1 μg/mL) were added to wells of the plate along with anti-cmoCLA antibody in PBS-T with 1%BSA and incubated for 1 h at 25 oC in plate-shaker ST-3 L (ELMI Ltd. laboratory equipment, Riga, Latvia). GAR-HRP was used to detect coating antigen–antibody formed complexes for 1 h at 37 oC. Activity of bound enzyme was detected using TMB-substrate mixture and intensity of colored product was read at 450 nm using a LisaScan spectrophotometer (Erba Mannheim, Czech Republic).
Structurally related macrolides CLA, ESE, ROX, AZI, DIR, TUL, and OLE were analyzed for cross-reactions. Their inhibition concentrations (IC) resulting to half-maximal absorbance (B/Bo = 50%) served for determination of cross-reactivity (CR = 100% × IC50 ERY/IC50 ANALOG). Assay sensitivity, limit of detection (LOD) and working range of assay were set as values of IC50, IC10, and IC20-IC80 range, respectively.

2.5. HRP-labelled antigen preparation

Hapten conjugation to HRP was conducted by periodate method as in previous work [21]. Briefly, HRP solution (3.2 mg, 80 nmol) in 0.4 mL H2O was combined with equal volume of sodium periodate (1.7 mg, 8 µmol) and stirred for 15 min at magnet stirrer. Overnight dialysis against 0.01 M acetic buffer (pH 4.5) was followed after to remove excess of periodate. The oxidized HRP was added dropwise to aecAZI dissolved in CBB (pH 9.6) and stirred for 2h at RT. The molar ratio between hapten and enzyme was taken in coupling as 1:3 and 1:10. To reduce the resulting Schiff base, 50 µL of an aqueous solution of sodium borohydride (2 mg/ml) was added and stirred for 1 h. After dialysis, HRP-aecAZI stabilized with 1%BSA-PBS in 50% glycerol was stored at -20 °C until use.

2.6. Immunosorbent preparation

Sepharose 4B or Sepharose-CL-2B (Pharmacia, Uppsala, Sweden) were washed with water on a porous glass filter, and then squeezed out with a soft press from excess moisture. The washed beads (2 g) were placed in a vial with sodium periodate solution (60 mg in 5 ml H2O) and mixed with a rotary mixer (ELMI Ltd. laboratory equipment, Riga, Latvia) for 45 min. An additional 30 min rotation continued after the addition of ethylene glycol (250 µL). The beads were then washed with water and finally with CBB (pH 9.6) squeezed mildly out. Each of the activated sorbents was placed in a vial for mixing with anti-cmoCLA IgG (10 mg) in 2 mL CBB (pH 9.6) for 48 h at 4 °C. The excess of antibody was squeezed out. The beads were then washed with water and placed in a sodium borohydride solution (4 mg/4 mL) for 1 h with occasional shaking. After the final washing with water and PSBT, the resulting immune sorbents were stored at 4 °C in 10 mL of PSBT preserved with Merthiolate (1 mg).

2.7. Direct competitive assay formats

To implement these assay formats, the IgG fraction was first isolated from antiserum by the double precipitation method using caprylic acid and ammonium sulfate, described in detail in [22]. The principle of the assays is based on competition between analyte and enzyme-labelled antigen (HRP-aecAZI) for binding to antibody coated on the plate (dcELISA) or coupled covalently to Sepharose beads. The latter immunosorbent was used in immunobeads assay (IBA) and immunofiltration assay (IFA).
dcELISA plate format. Direct competitive antibody-coated ELISA format was carried out in accordance with the generally accepted procedure. The antibody coated on polystyrene plates could capture the free analyte from the tested sample and enzyme-labelled hapten in competitive manner. The sequence of manipulations corresponded to those described for similar format earlier [21]. The role of the volume ratios between the standard (25-275 µL) and HRP-aecAZI (25-175 µL) on the sensitivity of the assay was studied in this work.
Immunobead assay (IBA). Standard solution of analyte or tested sample in 1-2 mL PBST were accomplished with HRP-aecAZI and immunosorbents Anti-CLA(IgG)-S4B or Anti-CLA(IgG)-SCL2B taken in optimized concentration/volume and incubated for 0.5-3 h periods at a rotary mixer mixing (15 rpm). The beads were then pelleted by centrifugation (5 min, 3400× g) and suspended to the original volume with PBST. After three washing cycles, the bead pellet was suspended with TMB-substrate mixture (200 μL), and 8M sulfuric acid (50 μL) was added 30 min later to terminate enzymatic reaction. Intensity of colored product was measured using plate reader at 450 nm.
Immunofiltration assay (IFA). The IFA principle consisted in passing a mixture of standard/sample (10 mL) and HRP-aecAZI through the beads with immobilized antibodies (Anti-CLA(IgG)-S4B or Anti-CLA(IgG)-SCL2B) placed in homemade column and recording the enzymatic activity of the captured HRP-aecAZI. Briefly, the optimal volume of the prepared immunosorbent was placed on a pre-moistened filter support in a 10-μL filtered micropipette tip, which was then accurately attached to a syringe. This homemade column was filled with 10 mL of the standard analyte or water sample, avoiding the formation of bubbles. The standards/samples were allowed to drip freely through the tips or external pressure was applied using a peristaltic pump. A washing of beads with 3–5 mL of PBST was followed. Then, the ends of the tips were cut off, and the filter pads with a layer of sorbent were pushed/washed out of the tips with reverse flow of 200 µL of the TMB-substrate mixture into the wells of the plate. The enzymatic reaction was terminated and optical signal was registered as above.

2.8. Sample pretreatment and analysis

Samples of tap, natural or waste water were filtered through a paper filter to eliminate foreign inclusions if necessary. Then, to minimize differences in pH, ionic strength, and possible non-specific interactions, the samples were supplemented with 25xPBST-concentrate and analyzed for macrolides trace using the developed immunoassay. Parallelly, the samples were tested by HPLC-MS/MS to verify macrolide type including 16-membered macrolides (Table S1, Figure S2). The procedure employed is described in Supplementary Information.
Blank natural water sample verified using HPLC-MS/MS were spiked with macrolide analytes, pretreated as above and tested in the developed immunoassay to determine recovery.

3. Results and discussion

3.1. Synthesis of haptens

The method described by S. Ma et al. [23] was adopted for the synthesis of the target 11-O-aminoethylcabamoyl derivative of azithromycin (4) (Scheme 1).
The reaction of AZI with ethylene carbonate resulted in formation of 11,12-cyclic carbamate of azithromycin (2), the 2′-hydroxylic group was protected by the acetyl group by the reaction of compound 2 with acetic anhydride in the presence of trimethylamine. Coupling of the resulting compound 3 with EDA in the presence of pyridine hydrochloride at room temperature produced the desired 11-O-aminoethylcabamoyl derivative of azithromycin (4).
The purity of compound was determined by TLC and HPLC, the structure was confirmed by HR-ESI mass-spectrometry and 1H and 13C NMR spectra. The assignment of signals in the 1H and 13C NMR spectra was made using the described assignments of the signals in the 13C NMR of azithromycin [24,25]. 13C NMR spectrum of compound 4 contain all the signals of carbon atoms corresponding to the azithromycin residue; additionally signals corresponding to the introduced carbon atoms were observed: at 158.1 ppm (corresponding to the carbamoyl carbon atom; and two signal at 25-34 ppm (corresponding to the 2 aliphatic carbon atoms of the spacer residue).

3.2. Preparation of conjugated antigens

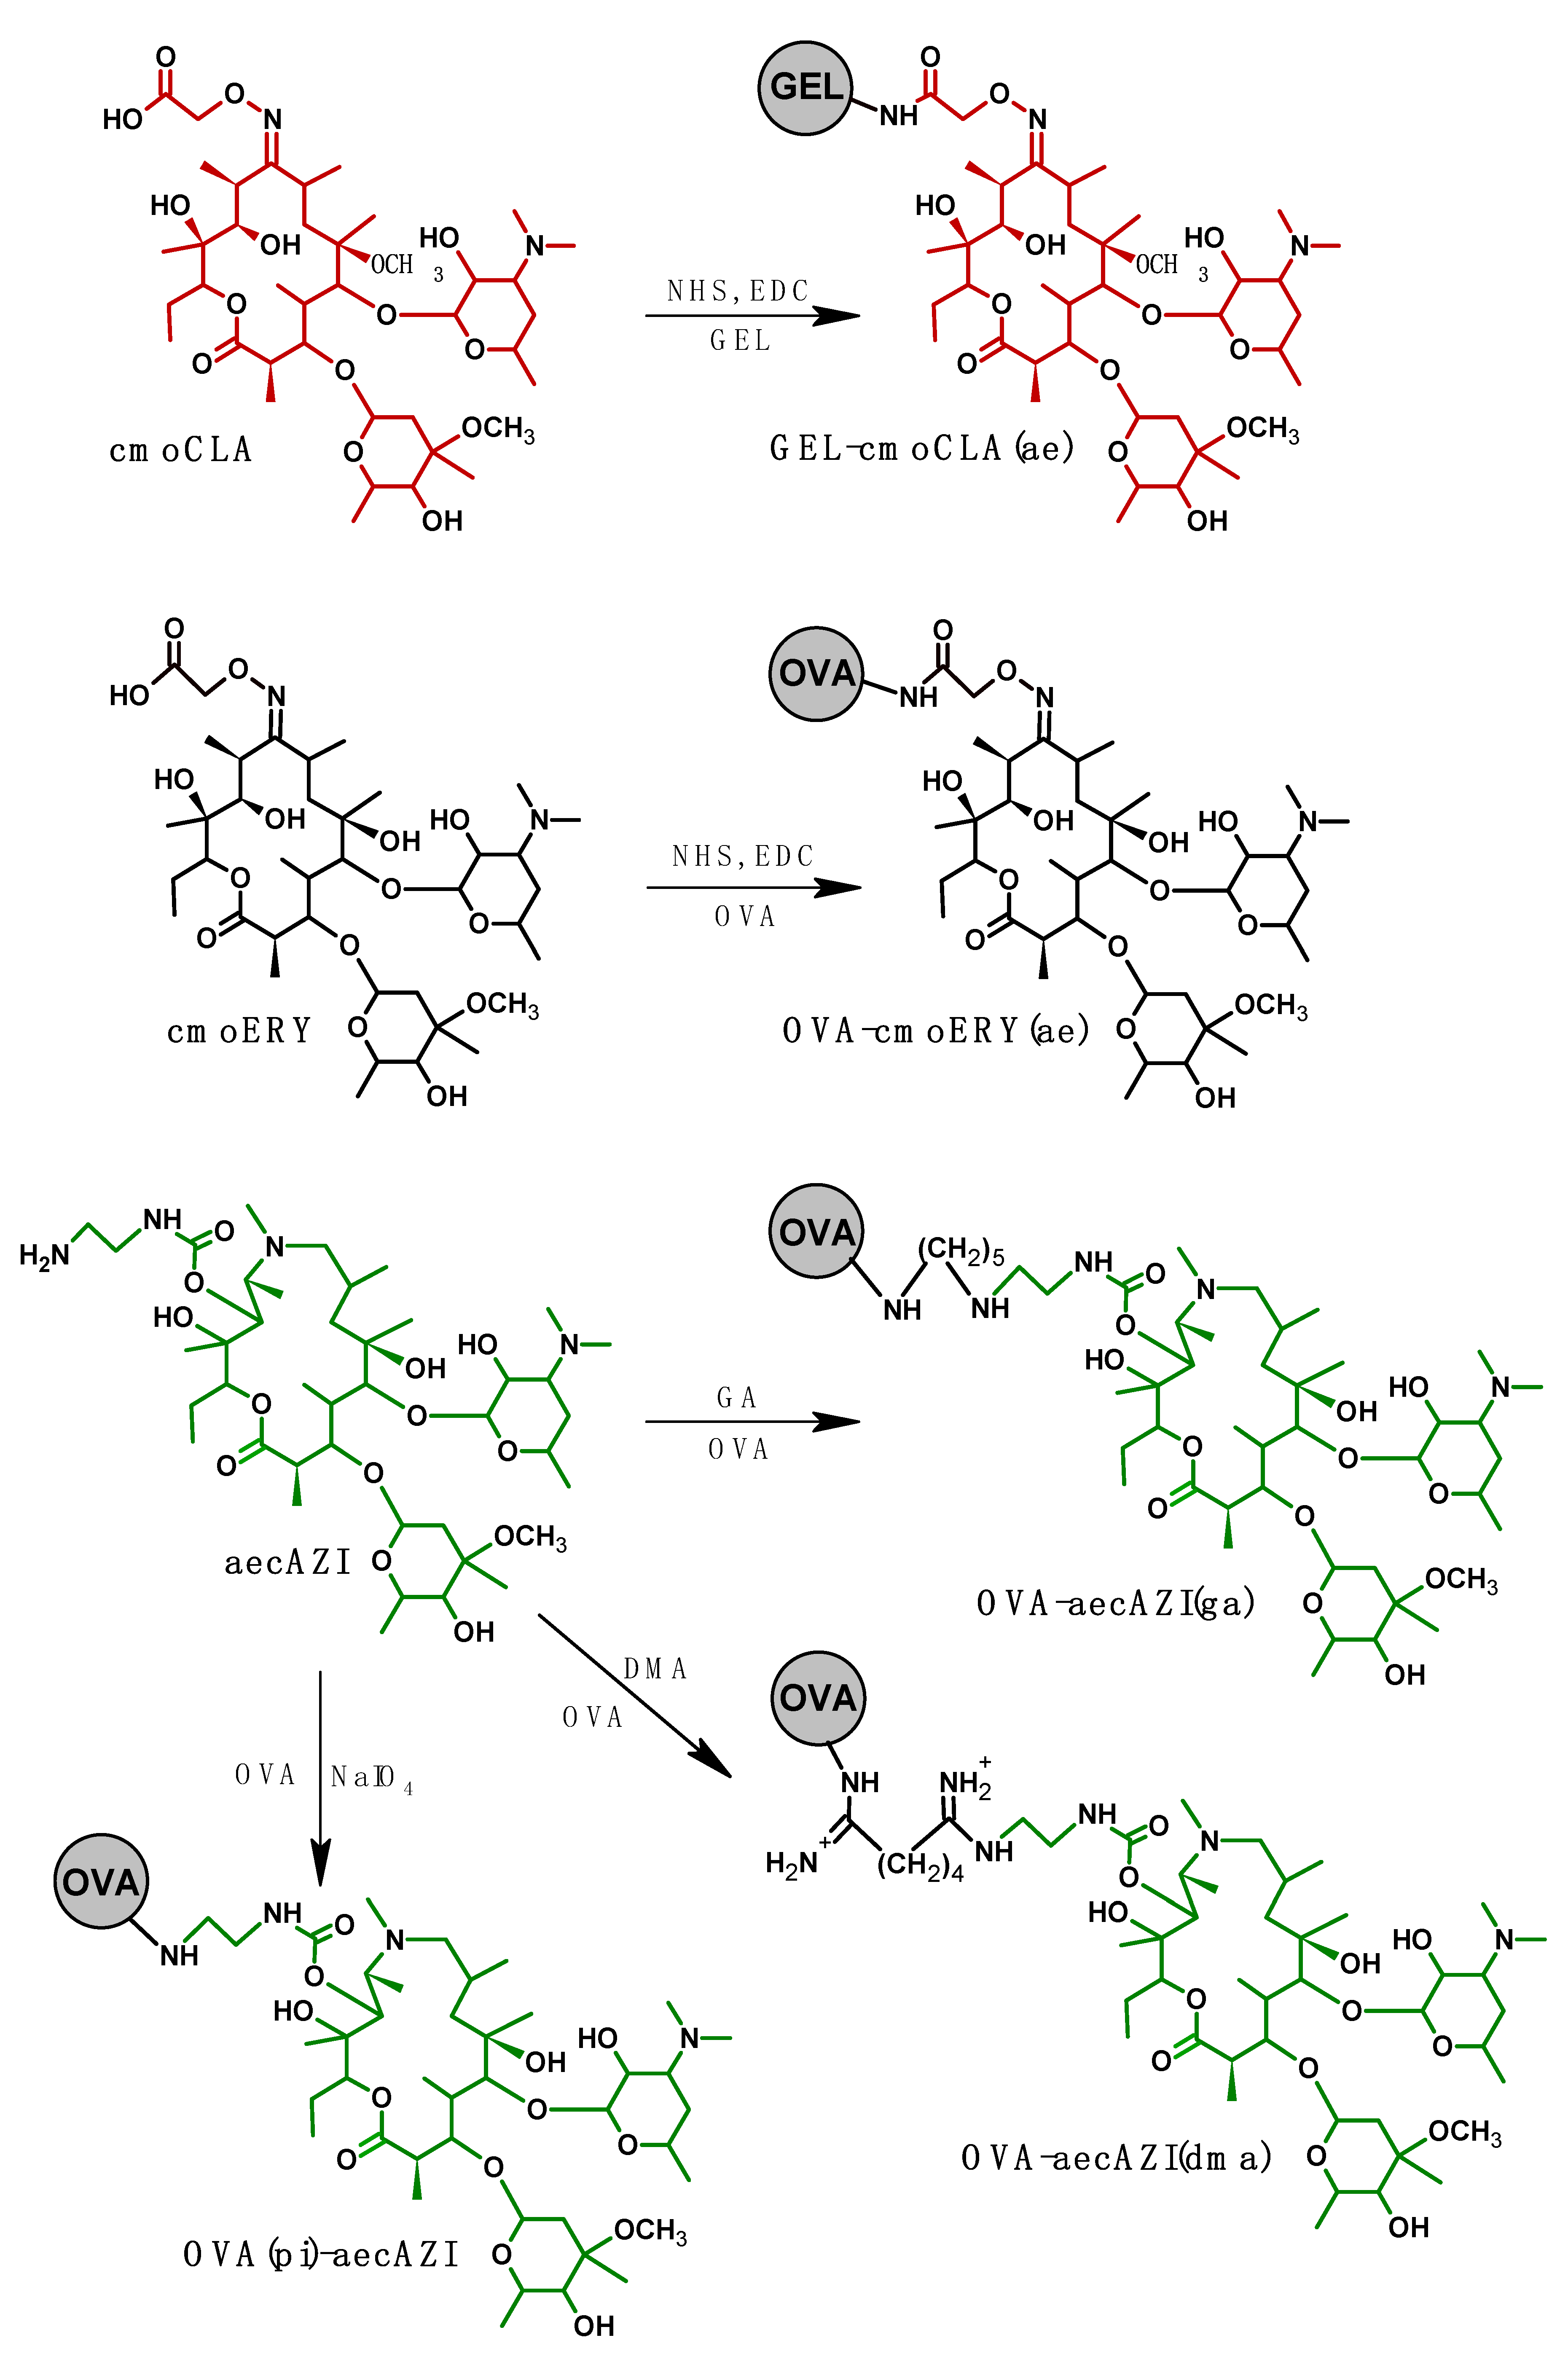
Along with the homologous GEL-cmoCLA(ae), a number of heterologous conjugates were obtained and investigated as coating antigens in this work. As it follows from our previous study, the main target epitopes of antibody response against BSA-cmoCLA(ae) were carbohydrate fragments, L-cladinose, and D-desosamine, which ensured the group recognition of macrolides [18]. Nevertheless, 15-membered macrolide, AZI with the same carbohydrate substituents was recognized weaker (CR = 8.8%) in comparison with analogues ERY, CLA, and ROX (68-125%). However, AZI has become especially popular in recent years due to the SARS-COV-2 epidemic. This has served as an additional incentive to improve AZI recognition to the level of other members of the macrolide group.
The literature search on the competitive immunoassay of small analytes has shown that an effective way to shift the cross-reactivity profile of an assay towards the desired cross-reagent is to use the latter as a coating or a labeled hapten. The phenomenon of immunorecognition enhancement was clearly observed with such analytes as spiramycin, vancomycin [26], and teicoplanin [27]. As can be seen from Figure 2, five coating conjugates were prepared. To ensure the safety of common epitopes, the present conjugates were designed to introduce a novel hapten molecule without affecting the target carbohydrate determinants.
Thus, along with homologous GEL-cmoCLA(ae), heterologous OVA-cmoERY(ae) and several heterologous conjugates based on AZI-derivative were synthetized to study its effect on assay spesificity.

3.3. Specificity and sensitivity of the developed ELISA variants

The present attempt to improve the recognition of AZI, a macrolide with a 15-membered macrocycle, was carried out by modifying the design of the coating hapten and testing the specificity of the respective ELISA variants (Table 1). Besides, the detectability of four additional macrolides (ESE, DIR, TUL, and OLE) has also been additionally examined.
The initial specificity study showed that the target epitopes for antibodies are the carbohydrate fragments of macrolides [18]. Present cross-reactivity analysis suggests that the main target epitope is cladinose, since its modification in OLE and TUL (Figure S1) makes them poor cross-reactants. At the same time, the presence of a large substituent, ethyl succinate, in ESE’s desosamine was not critical for recognition by antibodies.
ERY as a heterologous hapten in the coated OVA-cmoERY(ae) had minimal differences from the immunizing hapten. Therefore, it did not introduce significant changes in the profile of cross interactions. Similar cross-reactivity (CR) and sensitivity (IC50) values were obtained in this assay variant for CLA, ERY, ROX, and AZI compared with homologous Gel-cmoCLA(ae) [18]. ESE (37%) and DIR (31%) added to the list of recognized analytes, while TUL and OLE turned out to be rather weak inhibitors (2.7% and 0.2%, respectively). All ELISAs based on coated AZI conjugates showed better AZI detectability (13-41%) compared to 9% in the first two assays. Presentation of a heterologous 15-membered AZI ring through a long spacer in the form of 5/6-atom chains (ga/dma) for antibody recognition had a similar and moderate effect on cross-reactivity (13.7% and 12.9%). However, zero-length conjugation at OVA(pi)-aecAZI contributed to masking the distinctive features of the 15-membered macrocycle and increased cross-reactivity AZI up to 41%.
Comparative cross-reactivity examinations between assay variants revealed that the OVA(pi)-aecAZI-ELISA was characterized by the best group detection of six macrolides (CLA, ERY, ESE, ROX, AZI, and DIR) differing only 2.6 times (105-41%). Thus, in summary, we can state that the effect of new designed heterologous hapten conjugate made it possible to improve the assay sensitivity by 4 times and detectability of AZI from 9% to 41%.

3.4. Direct competitive assay formats

As a result of interactions between antibody and a number of coating antigens, we have identified a preferred hapten and rational antigen design for the most sensitive and broad-specific detection. Since the aecAZI hapten conjugated to the carrier via a zero-length arm contributed the desired assay performance, the same design enzyme-labelled hapten was prepared for the direct competitive assay format. Consistent with our previous observation [21], binding of an enzyme-labelled hapten with a lower molar ratio between hapten and HRP (3:1) resulted in better analyte competition and assay sensitivity compared to a 10:1 ratio. Thus, a direct competitive assay format was optimized and established based on coated anti-BSA-cmoCLA(ae) antibody and HRP-aecAZI×3 as a tracer.
It is common practice to express and compare the characteristics of the methods in concentration units. This is because the assay protocol typically involves the use of fixed sample volumes. However, the actual factor is the amount of analyte in analysis. In this study, we examined the effect of changing the sample volume on assay sensitivity in order to improve assay performance using the internal resource of available reagents without additional complicating approaches, special enhancers or signal amplifiers.

3.5. Effect of sample volume increase on sensitivity in plate assay format

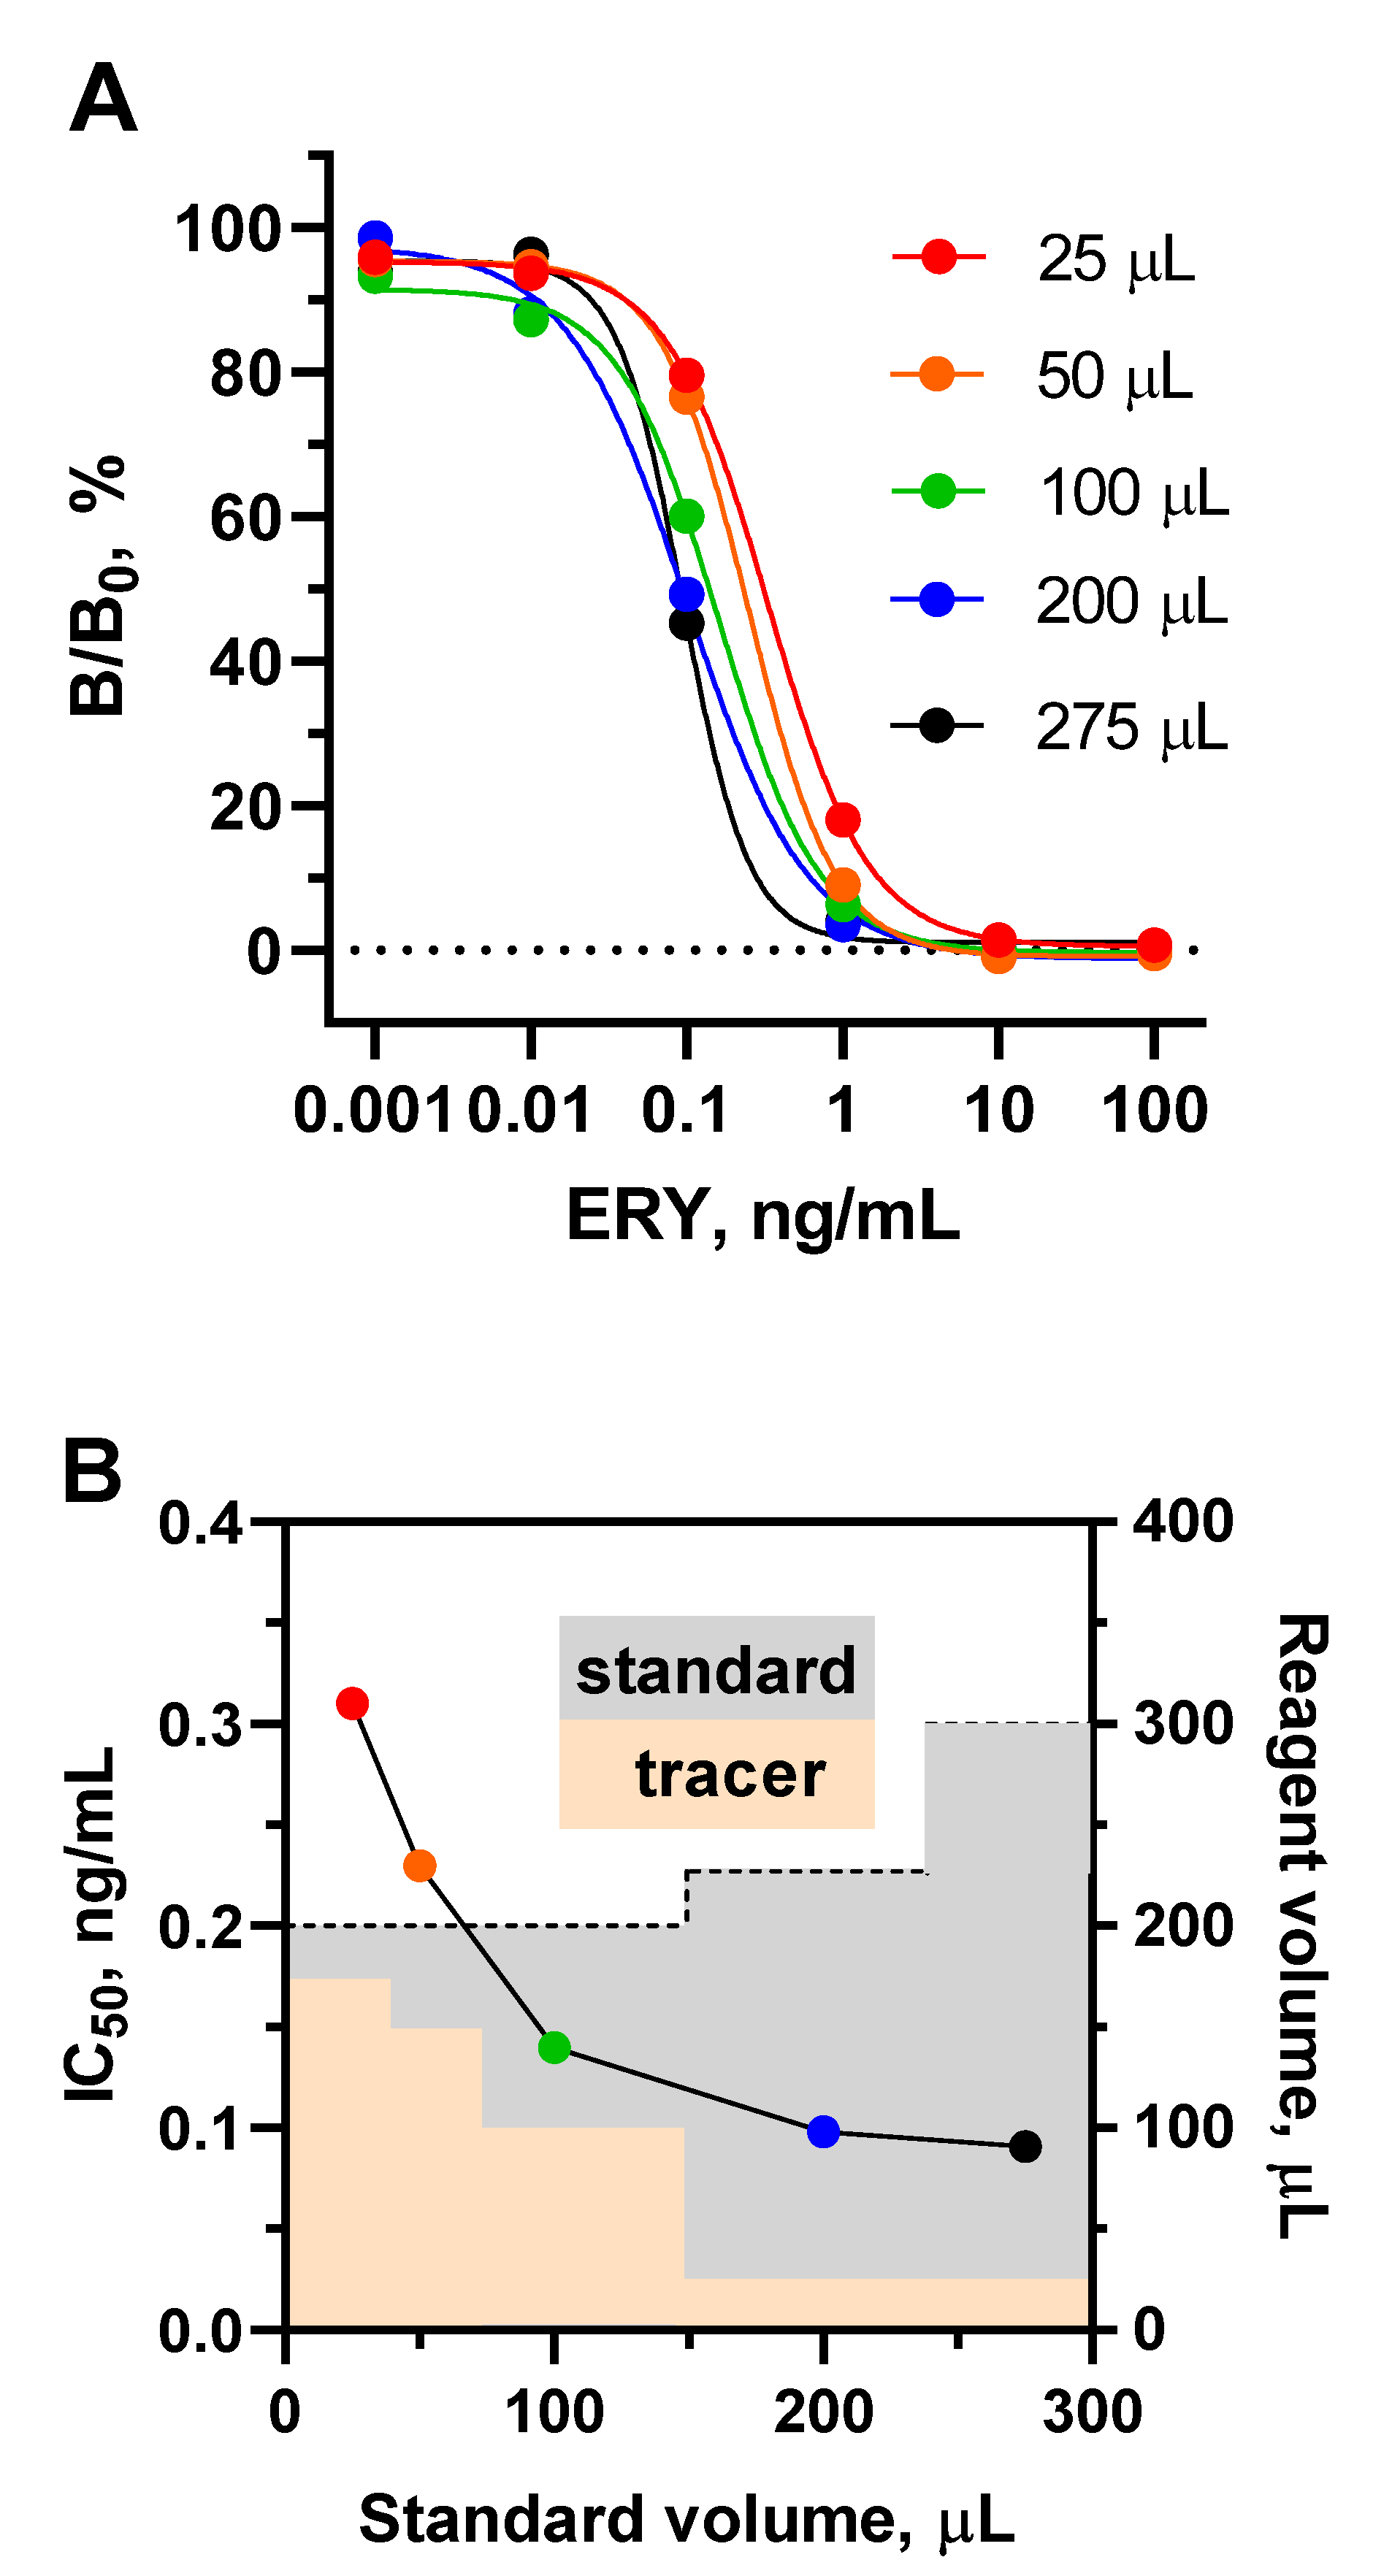
In the plate assay format, reaction volumes are limited to a well volume of 350-400 μL, however, the ratio of reactant volumes can be varied within this range. Thus, the standard curves for ERY as a model analyte clearly shift to the left as the volume of the analyte increases (Figure 4A).
To address this, the volume of the tracer was reduced by proportionally increasing its concentration so that the total volume of the reaction mixture does not exceed 300 μL, as shown in Figure 4B. Increasing the volume of ERY standard in this experiment from 25 to 275 µL resulted in an improvement in assay sensitivity (IC50) from 0.31 to 0.091 ng/mL.
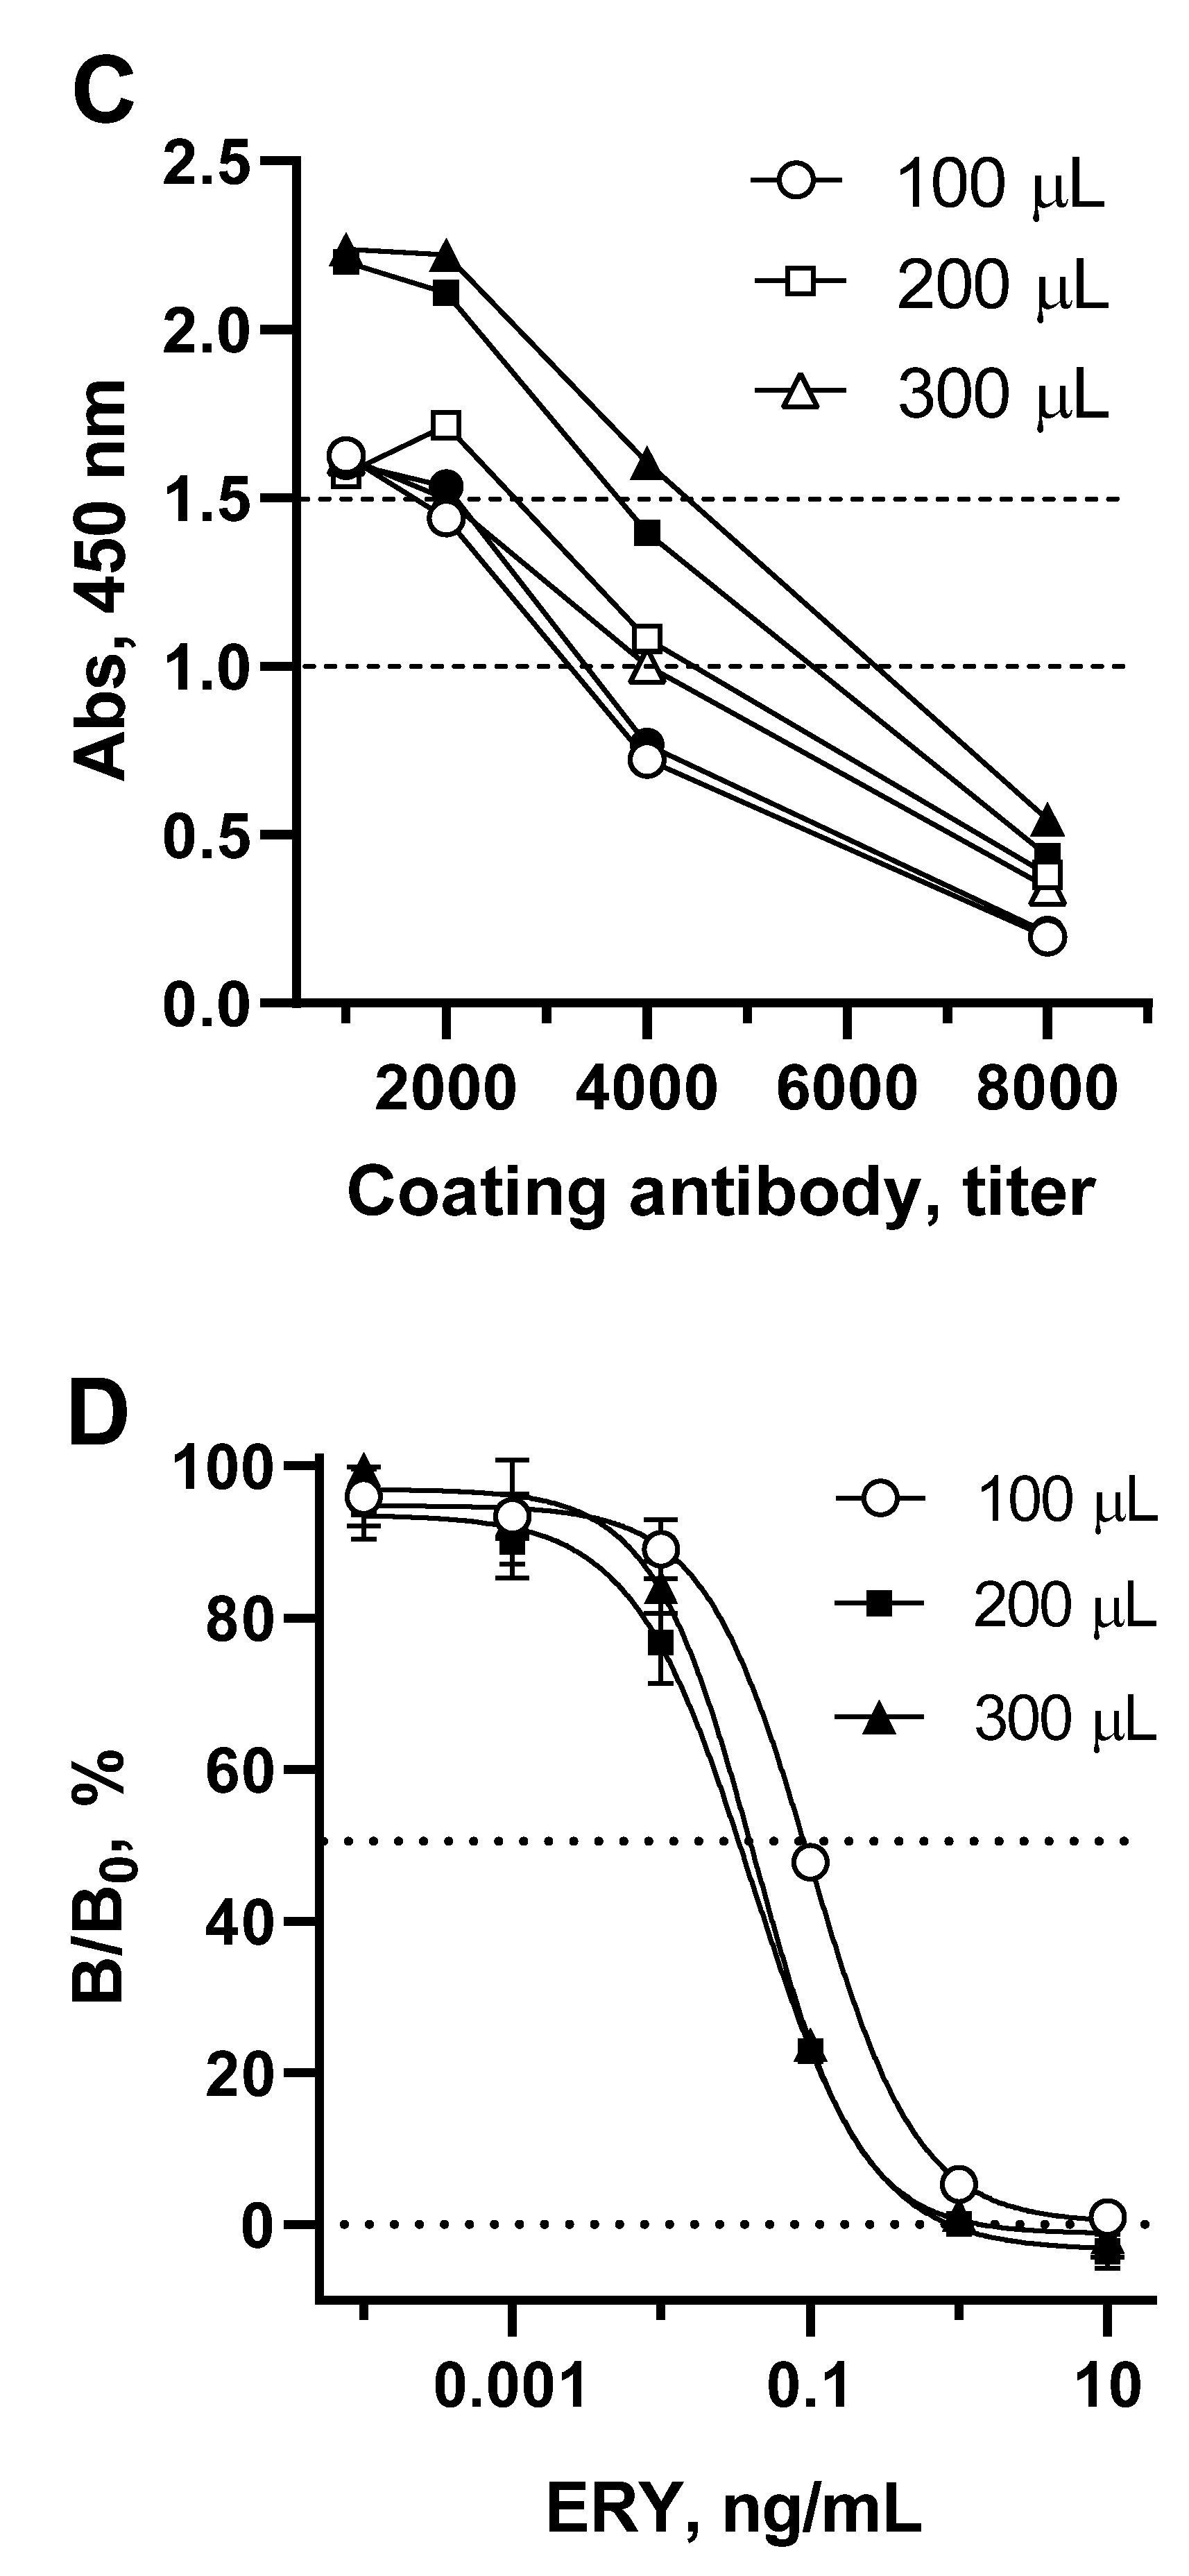
Since the volume of competitive interaction reach 300 µL, it is logically that the well surface coated with antibody should be broaden appropriately. To achieve this, the coating antibody concentration, as well as the volumes of substrate and stop solution volumes were optimized (Figure 4C).
It can be observed that the optical signal increases with an increase in the surface of the well coated with antibody. This growth was particularly pronounced when the volume of the substrate was also increased from 100 to 200 μL. Therefore, for each volume of coating antibodies, optimal concentrations were determined to provide an optical signal of 1.0-1.5, and then they were compared in terms of the sensitivity of ERY determination (Figure 4D). Increasing the surface area of wells coated with antibodies from 100 µL to 200 and 300 µL resulted in a corresponding change in IC50 of 0.091, 0.038, 0.042 ng/mL, respectively. The volume of substrate (200 µL) supplemented with the volume of stop solution (50 µL) was the limiting factor, since further volume increases are not applicable for spectrophotometer reading. Therefore, when coated with 300 μL of antibodies, no tendency to increase sensitivity was observed. Thus, with a 200 µL-volume of coating antibodies and a maximum possible sample volume of 275 µL, the sensitivity of macrolide detection increased to 0.038 ng/mL (ERY).

3.6. Effect of oriented coating of antibody and competitive stage duration on assay sensitivity

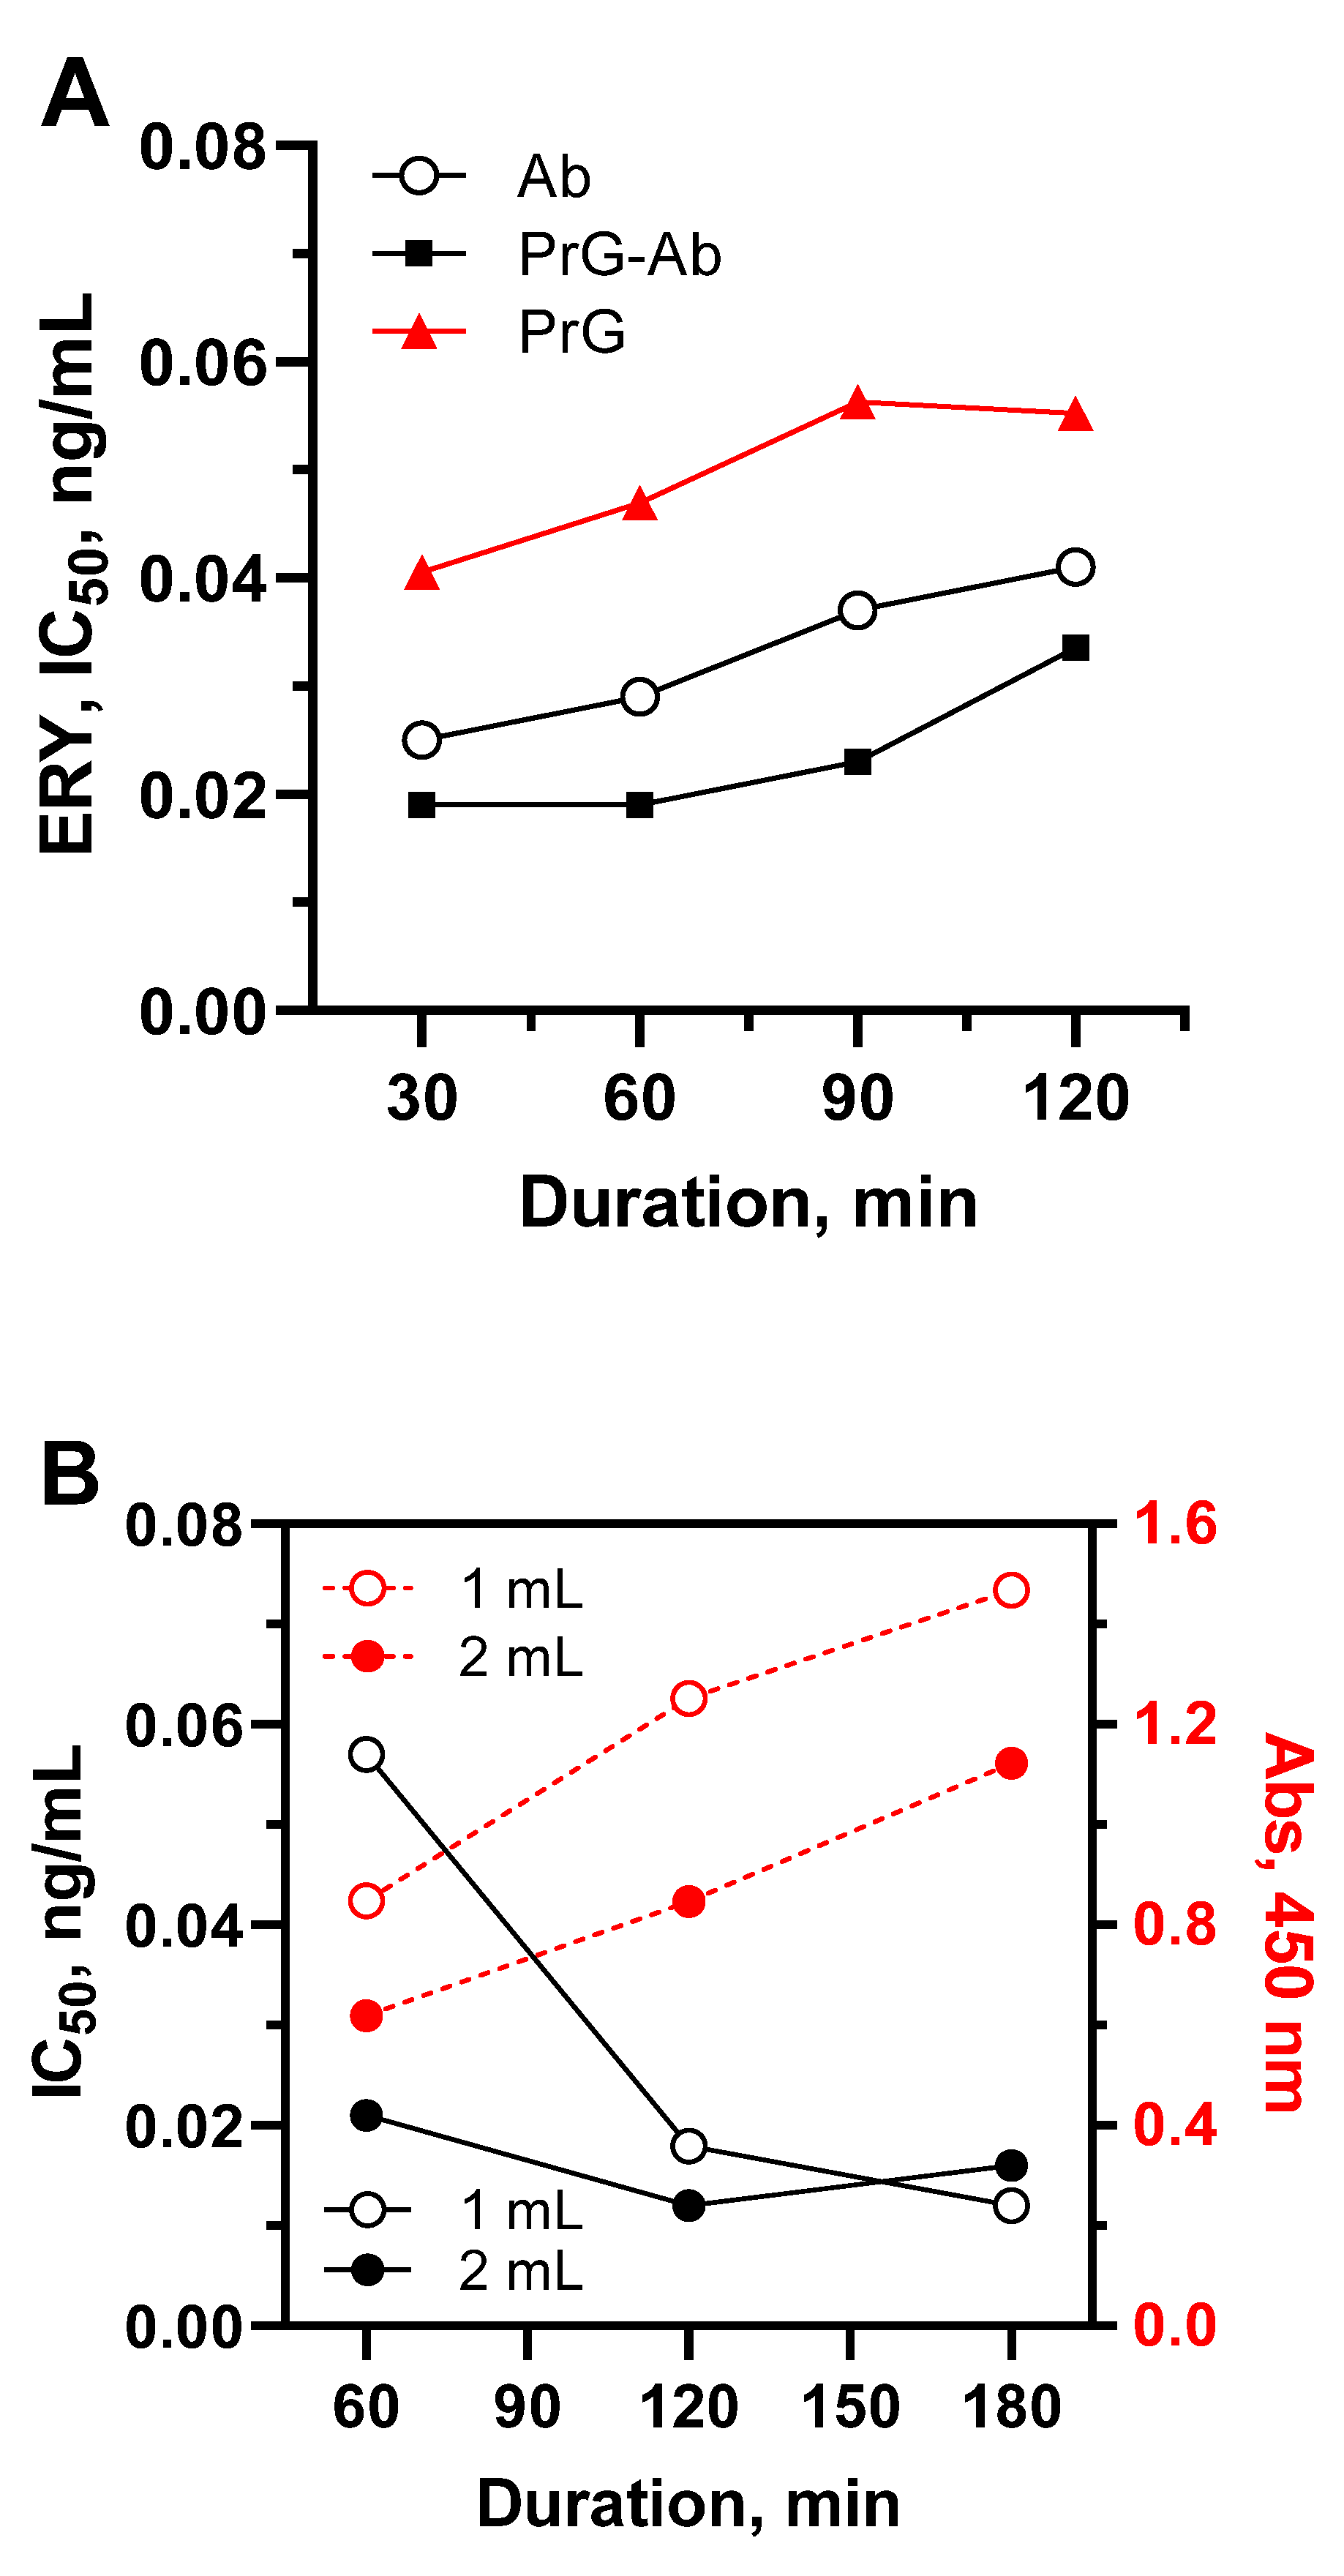
Another issue of consideration was the increase in the functional activity of antibodies due to their oriented immobilization on the surface of polystyrene and its effect on the sensitivity of the method [28]. This was achieved by interacting the adsorbed protein G with the antibody Fc fragments, which allowed the antibody binding fragments to remain spatially accessible. Such interaction could be implemented in step-by-step manner or as a result of self-assembly (Figure 5A).
The step-by-step procedure involved the initial formation of a complex between the coated protein G and the antibody (PrG-Ab) followed by a competitive assay step. An alternative method of self-assembly implied the competitive interaction of antibodies, analyte (sample) and tracer in solution with simultaneous binding to the coated protein G (PrG).
Improving the functional activity of antibodies due to their oriented coating made it possible to increase assay sensitivity (Figure 5A, rectangle vs. circle), and reduce the consumption of antibodies by 2 times. However, the additional PrG-Ab interaction step lengthened the assay by 1 hour. The one-step self-assembly assay format (Figure 5A, triangle) turned out to be comparatively insensitive. Self-assembly assumed the simultaneous completion of two interactions PrG-Ab-HRP-aecAZI, which, as a rule, requires a prolonged incubation (2 h) or higher concentrations of reagents to maintain an adequate output signal [29]. Thus, the oriented antibody using a stepwise coating provides an additional gain in sensitivity compared to randomly coated antibody [30].

3.7. Effect of sample volume increase on sensitivity assessed in IBA and IFA

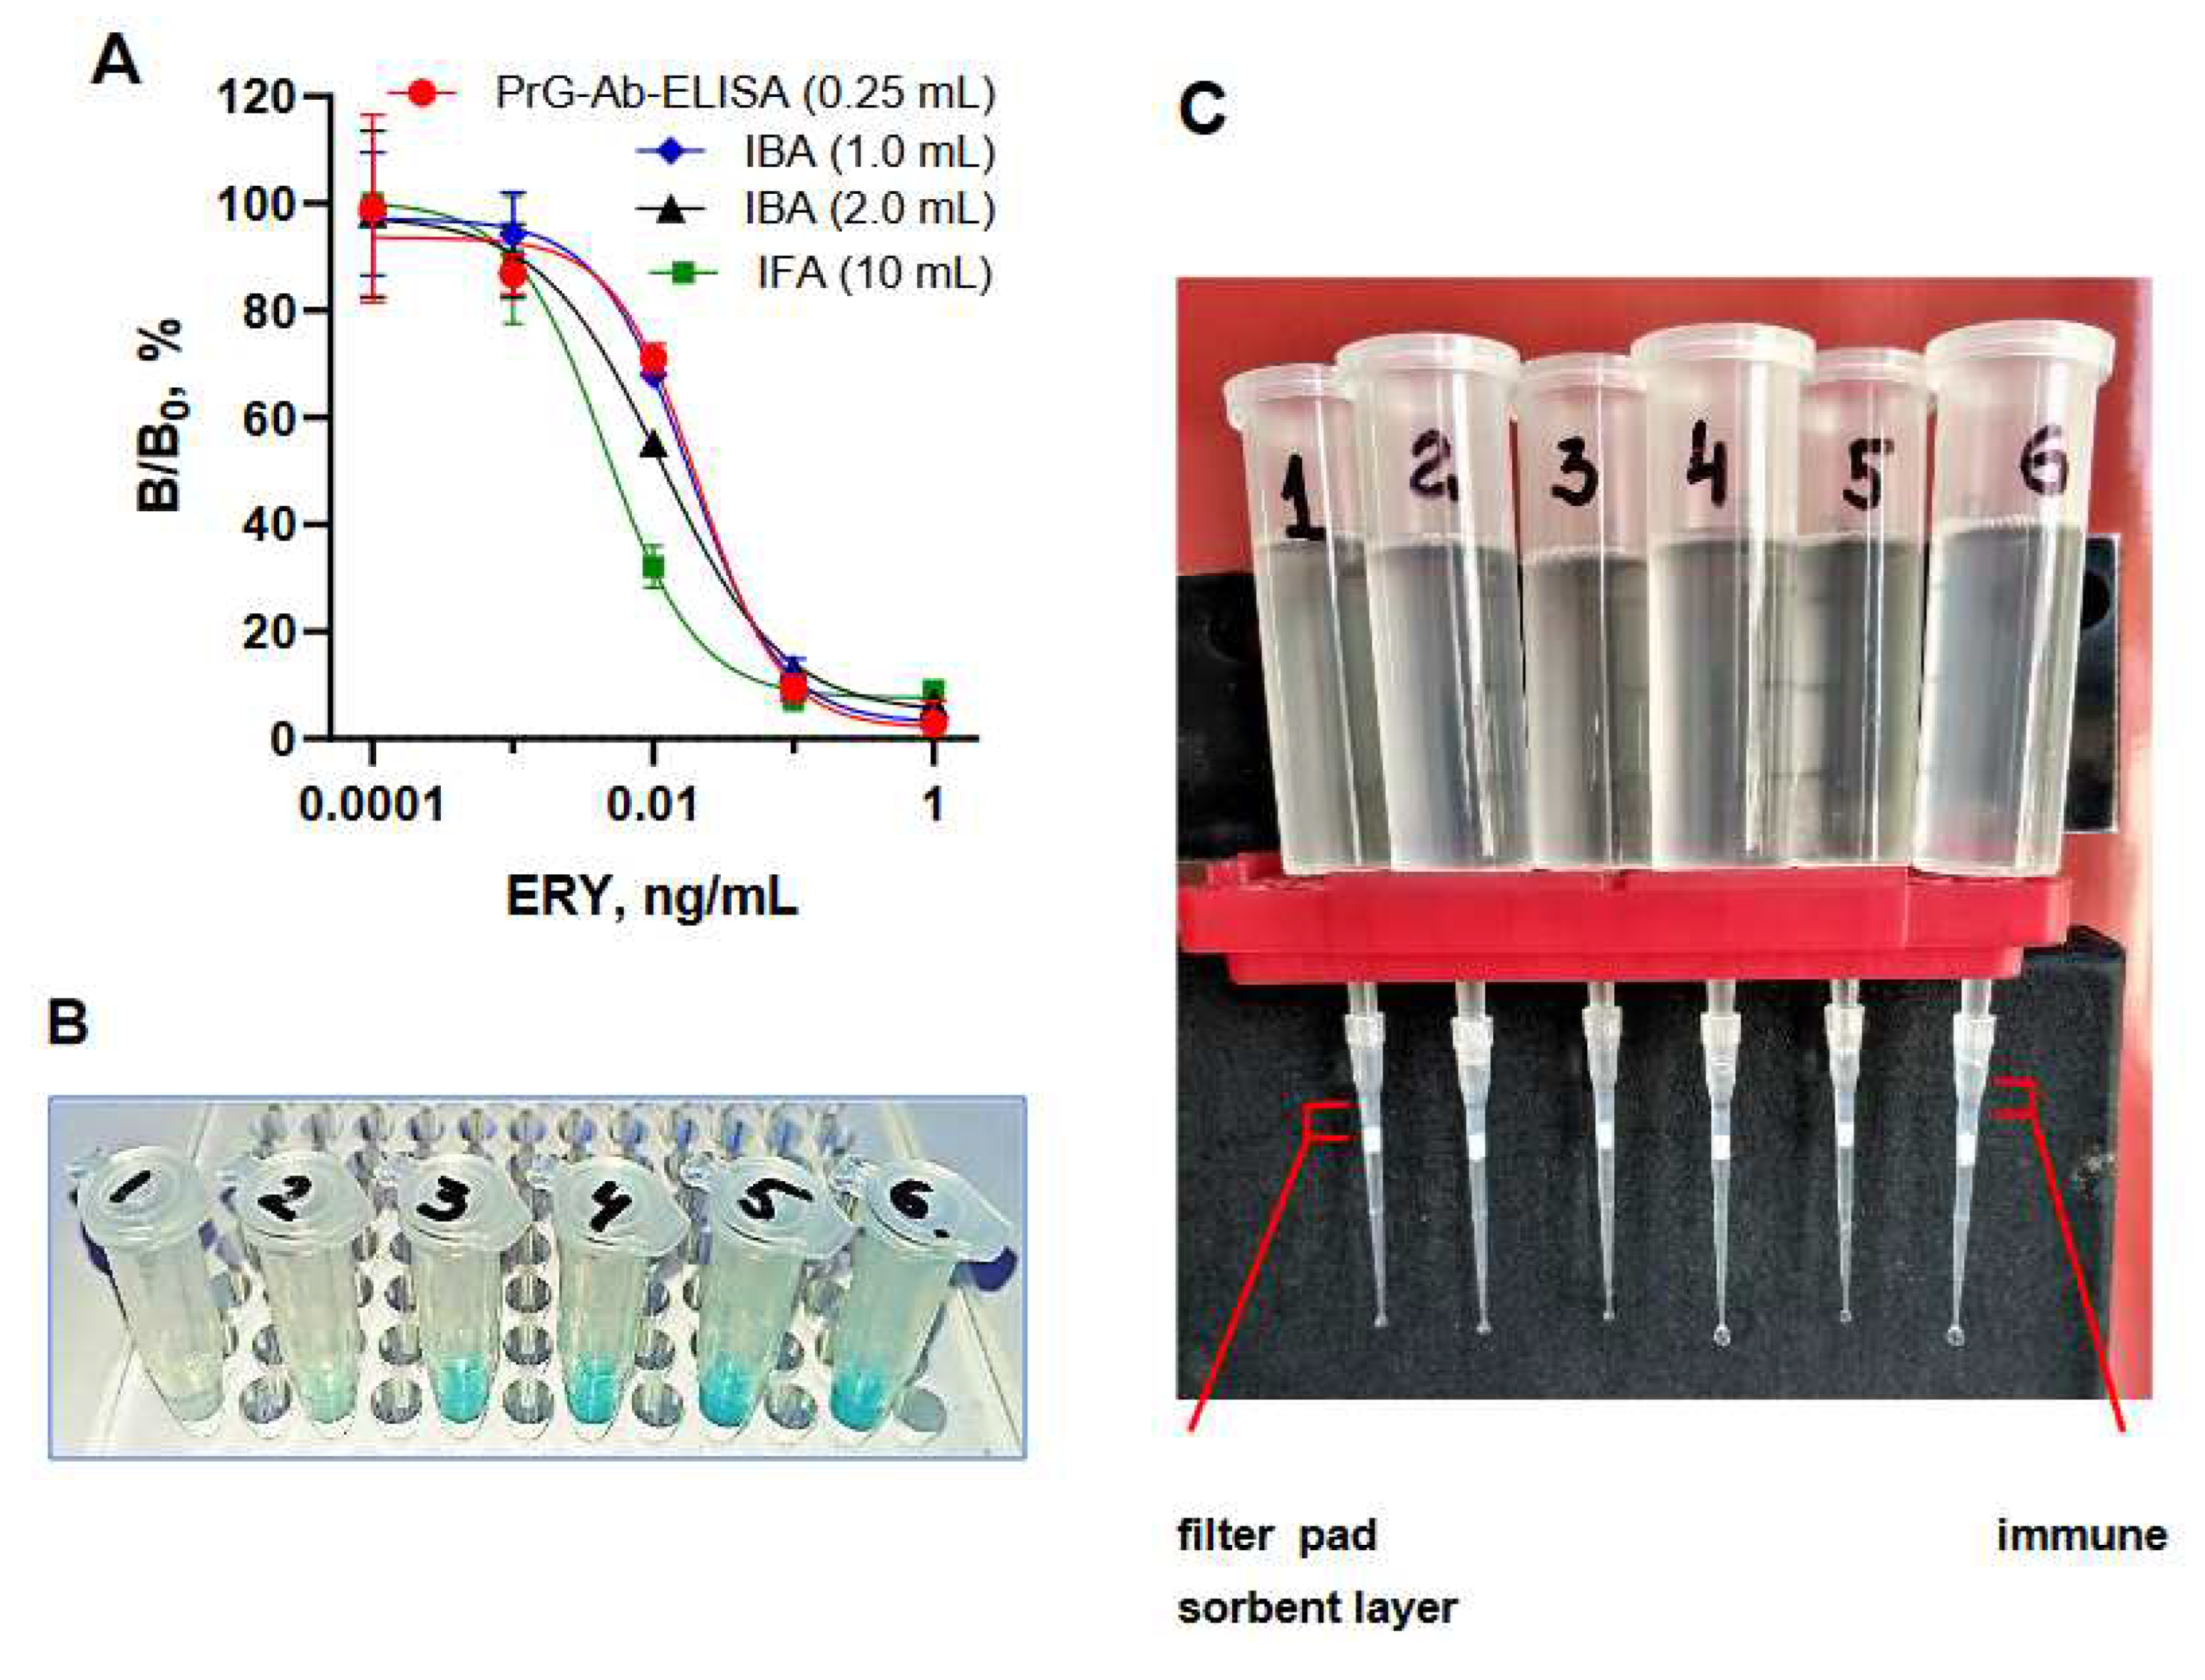
Due to the fact that the plate format does not allow the analysis of samples with a volume of more than 250 μL, the effect of this factor on assay characteristics was further evaluated in IBA and IFA, where the direct competitive immunoassay principle remained the same. Antibody covalently immobilized on agarose was used as a solid phase instead of a polystyrene plate and stored for year at 4 °C without activity loss. The quantity of tracer HRP(pi)-aecAZI was kept constant across the compared assay formats, but volume of immune beads was optimized to provide an output optical signal of 1.0-1.5. IBA was performed by incubating beads and tracer with 1 and 2 mL-samples in Eppendorf tubes for 1-3 h with slow rotation (Figure 6B). Prolonged incubation resulted in a higher output signal, but 2 h were sufficient to reach an adequate absorbance rate when testing both 1 mL- and 2 mL-samples (Figure 5B). As shown in Figure 6A, the sensitivity continued to improve with increasing sample volume.
IFA allowed the analysis of 10 mL samples, which were preliminarily supplemented with a tracer and freely dropped overnight through a layer of immune sorbent placed in the filtered microtip (Figure 5B and Figure 6C).
Thus, the approach using a heterologous hapten aecAZI was one of the steps to improve the sensitivity of the assay [31]. Then, by utilizing only the internal resource of the prepared reagents without additional labels, enhancers or amplifiers, the sensitivity of the assay can be significantly increased by a larger sample volume, surpassing the sensitivity of many reported assays (Table 2).

3.8. Environmental water analysis and recovery examination

The high sensitivity achieved through the use of a heterologous hapten and the sample volume-mediated effects, along with the specificity for a number of macrolides, enabled the detection of antibiotic pollution in environmental water using the immunoassay. 105 water samples were taken at 17 geographical points from different depths of Lake Onega and its influents near Petrozavodsk three times a year (September-22, March-23, and May-23) (Table S2). Screening analysis conducted using PrG-ELISA and HPLC-MS/MS in parallel revealed no macrolide contamination.
Recovery of macrolides in spiked blank environmental water samples was performed in PrG-ELISA using ERY as a standard and, accordingly, the revealed activity of the samples was expressed in ERY equivalents (Table S3). Using the cross-reactivity ratios of the known macrolides with respect to the ERY, their concentrations in the samples could be approximated. Quite adequate level of recovery (71.7-141.3%) was found indicating the suitability of the test for detecting macrolide contamination of natural water.

4. Conclusions

Assay parameters such as sensitivity and LOD, commonly reported as analyte concentrations, actually depend on the amount of analyte in the assay rather than the concentration of the analyte. This obvious fact is often overlooked due to the established protocol of the analysis procedure. In the present study, we used macrolide antibiotics as model analytes to demonstrate that increasing the sample volume is an effective but underexploited approach for improving the sensitivity of the immunoassay. By gradually increasing the sample volume while using the same reagents in direct competitive ELISA, IBA and IFA formats, we observed significant changes in assay parameters, as summarized in the Table 3.
The resulting changes in sensitivity and LOD reached more than 50 times, highlighting the impact of sample volume on assay performance. Oriented antibody coating via protein G-mediated capturing has also been shown to improve assay sensitivity and reduce antibody consumption.
In addition to the aforementioned approaches, a new heterologous hapten, aecAZI, was synthesized, which also contributed to a 5-fold increase in sensitivity and improved group detection of macrolides due to better recognition of AZI. Consequently, due to their picogram-level sensitivity and group recognition of ERY, CLA, ROX, AZI, ESE, and DIR, the developed assays could be suitable for monitoring of macrolide pollution in the environment. A series of natural water samples from Lake Onega and its influents near Petrozavodsk were analyzed during a 2022-2023 using both the developed immunoassay and HPLC-MS/MS and revealed no macrolide antibiotic contamination. The suitability of the test for detecting macrolide contamination of natural water was confirmed by recovery of macrolides from spiked blank samples (71.7-141.3%).

Supplementary Materials

The following supporting information can be downloaded at the website of this paper posted on Preprints.org.

Author Contributions

M.A.B.: Conceptualization, Methodology, Investigation, Visualization, Writing—original draft, Writing—review & editing; E.N.B.: Investigation, Writing—original draft; A.N.T.: Methodology, Writing—review & editing; A.O.M: Formal analysis, Writing—original draft; I.A.G.: Methodology, Investigation, Writing—original draft.

Acknowledgments

The authors are grateful to Dr. M.B. Zobov for providing of water samples within the framework of the state assignment to the Northern Water Problems Institute of Karelian Research Centre of the Russian Academy of Sciences.
Conflicts of interest: The authors declare no competing financial interest.

References

  1. S. Pal, A journey across the sequential development of macrolides and ketolides related to erythromycin, Tetrahedron, 2006, 14, 3171-3200. [CrossRef]
  2. B. Arsic, J. Barber, A. Čikoš, M. Mladenovic, N. Stankovic and P. Novak, 16-membered macrolide antibiotics: a review, International journal of antimicrobial agents, 2018, 51, 283-298. [CrossRef]
  3. H. A. Kirst, 2 Semi-synthetic Derivatives of Erythromycin, Progress in medicinal chemistry, 1993, 30, 57-88. [CrossRef]
  4. N. A. Evans, Tulathromycin: an overview of a new triamilide antibiotic for livestock respiratory disease, Veterinary Therapeutics: research in applied veterinary medicine, 2005, 6, 83-95.
  5. D. Echeverría-Esnal, C. Martin-Ontiyuelo, M. E. Navarrete-Rouco, M. De-Antonio Cuscó, O. Ferrández, J. P. Horcajada and S. Grau, Azithromycin in the treatment of COVID-19: a review, Expert review of anti-infective therapy, 2021, 19, 147-163. [CrossRef]
  6. E. Felis, J. Kalka, A. Sochacki, K. Kowalska, S. Bajkacz, M. Harnisz and E. Korzeniewska, Antimicrobial pharmaceuticals in the aquatic environment-occurrence and environmental implications, European Journal of Pharmacology, 2020, 866, 172813. [CrossRef]
  7. J. Liu, W.-J. Deng, G.-G. Ying, E. P. Tsang and H.-C. Hong, Occurrence and distribution of antibiotics in surface water, Ecotoxicology, 2022, 31, 1111-1119. [CrossRef]
  8. C. Zheng, J. Liu, Y. Cai, C. Jing, R. Jiang, X. Zheng and G. Lu, Pharmaceutically active compounds in biotic and abiotic media of rivers receiving urban sewage: Concentrations, bioaccumulation and ecological risk, Process Safety and Environmental Protection, 2022, 166, 491-499. [CrossRef]
  9. S. D. Richardson and S. Y. Kimura, Water analysis: emerging contaminants and current issues, Analytical Chemistry, 2019, 92, 473-505. [CrossRef]
  10. J. Wan, P. Guo, X. Peng and K. Wen, Effect of erythromycin exposure on the growth, antioxidant system and photosynthesis of Microcystis flos-aquae, Journal of hazardous materials, 2015, 283, 778-786. [CrossRef]
  11. S. Yan, N. Ding, X. Yao, J. Song, W. He, F. Rehman and J. Guo, Effects of erythromycin and roxithromycin on river periphyton: Structure, functions and metabolic pathways, Chemosphere, 2023, 137793. [CrossRef]
  12. J. Li, W. Li, K. Liu, Y. Guo, C. Ding, J. Han and P. Li, Global review of macrolide antibiotics in the aquatic environment: Sources, occurrence, fate, ecotoxicity, and risk assessment, Journal of Hazardous Materials, 2022, 129628. [CrossRef]
  13. L. H. Yang, G. G. Ying, H. C. Su, J. L. Stauber, M. S. Adams and M. T. Binet, Growth-inhibiting effects of 12 antibacterial agents and their mixtures on the freshwater microalga pseudokirchneriella subcapitata, Environmental Toxicology and Chemistry: An International Journal, 2008, 27, 1201-1208. [CrossRef]
  14. Commission Implementing Decision (EU) 2015/495 of 20 March 2015 590 establishing a watch list of substances for Union-wide monitoring in the field of water policy pursuant to 591 Directive 2008/105/EC of the European Parliament and of the Council, Off. J. Eur. Union L, 2015, 78, 40-42.
  15. V. Camel and M. Caude, Trace enrichment methods for the determination of organic pollutants in ambient air, Journal of Chromatography A, 1995, 710, 3-19. [CrossRef]
  16. Y. Wen, J. Li, J. Ma and L. Chen, Recent advances in enrichment techniques for trace analysis in capillary electrophoresis, Electrophoresis, 2012, 33, 2933-2952. [CrossRef]
  17. L. Guo, X. Ma, X. Xie, R. Huang, M. Zhang, J. Li, G. Zeng and Y. Fan, Preparation of dual-dummy-template molecularly imprinted polymers coated magnetic graphene oxide for separation and enrichment of phthalate esters in water, Chemical Engineering Journal, 2019, 361, 245-255. [CrossRef]
  18. I. Galvidis, G. Lapa and M. Burkin, Group determination of 14-membered macrolide antibiotics and azithromycin using antibodies against common epitopes, Analytical biochemistry, 2015, 468, 75-82. [CrossRef]
  19. Z. Wang, T. Mi, R. C. Beier, H. Zhang, Y. Sheng, W. Shi, S. Zhang and J. Shen, Hapten synthesis, monoclonal antibody production and development of a competitive indirect enzyme-linked immunosorbent assay for erythromycin in milk, Food chemistry, 2015, 171, 98-107. [CrossRef]
  20. A. Raysyan, I. A. Galvidis, R. J. Schneider, S. A. Eremin and M. A. Burkin, Development of a latex particles-based lateral flow immunoassay for group determination of macrolide antibiotics in breast milk, Journal of pharmaceutical and biomedical analysis, 2020, 189, 113450. [CrossRef]
  21. M. A. Burkin, I. A. Galvidis, Y. A. Surovoy, I. V. Plyushchenko, I. A. Rodin and S. V. Tsarenko, Development of ELISA formats for polymyxin B monitoring in serum of critically ill patients, Journal of Pharmaceutical and Biomedical Analysis, 2021, 204, 114275. [CrossRef]
  22. F. Perosa, R. Carbone, S. Ferrone and F. Dammacco, Purification of human immunoglobulins by sequential precipitation with caprylic acid and ammonium sulphate, Journal of immunological methods, 1990, 128, 9-16. [CrossRef]
  23. X. Li, S. Ma, M. Yan, Y. Wang and S. Ma, Synthesis and antibacterial evaluation of novel 11, 4 ″- disubstituted azithromycin analogs with greatly improved activity against erythromycin-resistant bacteria, European Journal of Medicinal Chemistry, 2013, 59, 209-217. [CrossRef]
  24. J. Barber, Assignments of the 13C and 1H NMR spectra of azithromycin in CDCl3, Magnetic resonance in chemistry, 1991, 29, 740-743. [CrossRef]
  25. R. J. Brennan and J. Barber, Full assignments of the 13C and 1H NMR spectra of azithromycin in buffered D2O and DMSO-d6, Magnetic resonance in chemistry, 1992, 30, 327-333.
  26. M. A. Burkin and I. A. Galvidis, Hapten modification approach for switching immunoassay specificity from selective to generic, Journal of immunological methods, 2013, 388, 60-67. [CrossRef]
  27. M. A. Burkin, I. A. Galvidis and S. A. Eremin, Specific and generic immunorecognition of glycopeptide antibiotics promoted by unique and multiple orientations of hapten, Biosensors, 2019, 9, 52. [CrossRef]
  28. S. Gao, J. M. Guisán and J. Rocha-Martin, Oriented immobilization of antibodies onto sensing platforms-A critical review, Analytica chimica acta, 2022, 1189, 338907. [CrossRef]
  29. I.A. Galvidis, Z. Wang, R. I. Nuriev and M. A. Burkin, Broadening the detection spectrum of small analytes using a two-antibody-designed hybrid immunoassay, Analytical chemistry, 2018, 90, 4901-4908. [CrossRef]
  30. N. Tajima, M. Takai and K. Ishihara, Significance of antibody orientation unraveled: well-oriented antibodies recorded high binding affinity, Analytical chemistry, 2011, 83, 1969-1976. [CrossRef]
  31. M. A. Burkin, G. B. Lapa, I. A. Galvidis, K. M. Burkin, A. V. Zubkov and S. A. Eremin, Three steps improving the sensitivity of sulfonamide immunodetection in milk, Analytical Methods, 2018, 10, 5773-5782. [CrossRef]
  32. X. Li, K. Wen, Y. Chen, X. Wu, X. Pei, Q. Wang, A. Liu and J. Shen, Multiplex immunogold chromatographic assay for simultaneous determination of macrolide antibiotics in raw milk, Food analytical methods, 2015, 8, 2368-2375. [CrossRef]
  33. X. Li, J. Shen, Q. Wang, S. Gao, X. Pei, H. Jiang and K. Wen, Multi-residue fluorescent microspheres immunochromatographic assay for simultaneous determination of macrolides in raw milk, Analytical and bioanalytical chemistry, 2015, 407, 9125-9133. [CrossRef]
  34. L. Zeng, L. Liu, H. Kuang, G. Cui and C. Xu, A paper-based colorimetric assay for rapid detection of four macrolides in milk, Materials Chemistry Frontiers, 2019, 3, 2175-2183. [CrossRef]
  35. C. Duan, H. Zhang, Y. Zhang, Q. Li, P. Li, G. M. Mari, S. A. Eremin, J. Shen and Z. Wang, Robust Homogeneous Fluorescence Polarization Immunoassay for Rapid Determination of Erythromycin in Milk, Foods, 2023, 12, 1581. [CrossRef]
Figure 1. Scopus database publications (1992-2022) by macrolide antibiotics (‘erythromycin’ OR ‘clarithromycin’ OR ‘roxithromycin’ OR ‘azithromycin’ mentioned in title, abstract or keywords) (A). The share of publications of each representative of macrolides (B). Distribution of publications by subject MEDI (medicine), AGBI (agricultural and biological sciences), VETE (veterinary), ENVI (environmental science) and OTHER areas (C).
Preprints 84529 g001
Scheme 1. 11-O-(2-aminoethyl)cabamoyl derivative of azithromycin (aecAZI) synthesis.
Preprints 84529 sch001
Figure 2. Preparation of coating conjugates.
Preprints 84529 g002
Figure 4. (A). Effect of standard and reagents volume in the well on direct competitive ELISA calibration curve. (B). Dependence of ELISA sensitivity on immunoreagent volumes. The ratios of standard/tracer HRP(pi)-aecAZI volumes were following 25/175 µL, 50/150 µL, 100/100 µL, 200/25 µL, and 275/25 µL. Tracer concentrations were 0.57-, 0.67-, 1-, 4-, and 4-fold of working concentration, respectively. (C). Optimization of coating antibody volume (100-300 µL) and concentration (1/1000-1/8000). Substrate/stop solution volumes were 100/100 µL (empty symbols) and 200/50 µL (filled symbols). Optimal absorbance range 1.0-1.5 is indicated with dash lines. (D). Effect of coating antibody and substrate volumes on ELISA signal and sensitivity. Antibody were coated at 100 µL, 200 µL and 300 µL per well from 1/2000, 1/4000, and 1/5000 solutions, respectively. The ratio of standard/tracer HRP(pi)-aecAZI volumes was 275/25 µL. Substrate/stop solution volumes were 100/100 µL (empty symbols) and 200/50 µL (fill symbols).
Preprints 84529 g004aPreprints 84529 g004b
Figure 5. (A). Effect of oriented antibody coating and competitive stage duration on assay sensitivity. Each point represents the IC50 value calculated from standard curves generated in corresponding assay variants. Ab, coated antibody; PrG, coated protein G in self-assembly assay; PrG-Ab, antibody captured by protein G in step-by-step assay; (B). Dependence of IBA parameters on the duration of incubation.
Preprints 84529 g005
Figure 6. (A). Standard curves of ERY determination from different volume samples conducted in PrG-Ab ELISA (250 µL), IBA (1 mL and 2mL), and IFA (10 mL). (B). Visual results of IBA of 1mL-solutions ERY 1000 pg/mL–0.1 pg/mL, 0 pg/mL (1-6). (C). Instillation of 10 mL-sample through a microtip with a layer of sorbent on the filter in IFA.
Preprints 84529 g006
Table 1. The cross-reactivity (CR) of anti-BSA-cmoCLA(ae) antibodies with macrolides (MLs).
MLs GEL-cmoCLA(ae)* OVA-cmoERY(ae) OVA-aecAZI(ga) OVA-aecAZI(dma) OVA(pi)-aecAZI
IC50, ng/mL CR, % IC50, ng/mL CR, % IC50, ng/mL CR, % IC50, ng/mL CR, % IC50, ng/mL CR, %
CLA 0.16 100 0.172 100 0.043 100 0.157 100 0.044 100
ERY 0.20 68.2 0.240 71.7 0.049 87.8 0.223 70.4 0.042 105
ESE - - 0.466 36.9 0.094 45.7 0.352 44.6 0.074 59.5
ROX 0.14 125 0.125 137.6 0.040 107.5 0.157 100 0.051 86.3
AZI 1.63 8.8 1.990 8.6 0.315 13.7 1.220 12.9 0.107 41.1
DIR - - 0.554 31.0 0.136 31.6 0.544 28.9 0.096 45.8
TUL - - 629.9 2.7 134.8 0.03 379.5 0.04 5.403 0.81
OLE - - 75.75 0.2 40.10 0.11 287.2 0.05 45.64 0.1
* The CR data were recalculated from those presented in [18]. Dash means that the compound has not been examined.
Table 2. Comparable characteristics of reported immunoassays for macrolide determination.
Assay (Matrix) Immunogen Antigen IC50//LOD, ng/mL CR, % Reference
ICA (Milk) Commercial Commercial ni//5 ERY 100 [32]
FM-ICA (Milk) Commercial Commercial ni//0.13 ERY 100 [33]
IC-ELISA (Milk) BSA-cmoERY(ma) OVA-cmoERY(ae) 0.94//0.3 CLA
ERY
ESE
ROX
AZI
DIR
26.7
100
-
14.8
0.9
157
[19]
ICA (Milk) BSA-cmoCLA(ae) OVA-cmoCLA(ae) 0.16//0.095 CLA
ERY
ESE
ROX
AZI
DIR
100
30.1
-
21.1
16.2
-
[34]
LFIA (Breast milk) BSA-cmoCLA(ae) GEL-cmoCLA(ae) 0.45//0.12 CLA
ERY
ROX
DIR
AZI
100
7.5
97.8
5.4
5.7
[20]
FPIA (Milk) BSA-cmoERY(ma) OVA-cmoERY(ae) 7.4//14.1 CLA
ERY
ESE
ROX
AZI
DIR
26.7
100
43.7
92
-
157
[35]
IC-ELISA (Water)IFA (Water) BSA-cmoCLA(ae) OVA(pi)-aecAZIHRP(pi)-aecAZI 0.04//0.010.005//0.001 CLA
ERY
ESE
ROX
AZI
DIR
100
105
59.5
86.3
41.1
45.8
Present study
IC-ELISA—indirect competitive ELISA; ICA—immunogold chromatographic assay; FM-ICA—fluorescent microsphere-based immunochromatographic assay; LFIA—latex lateral flow immunoassay; FPIA—fluorescence polarization immunoassay; IFA—immunofiltration assay; ni—not indicated; ma—mixed anhydride method
Table 3. ERY immunodetection parameters depending on the volume of the test sample.
Assay format, competitive step duration Coating Ab volume, µL Standard/Sample, µL IC50, ng/mL IC20-IC80, ng/mL IC10, ng/mL
ELISA, 1h 100 25 0.31 0.097-0.907 0.04
100 50 0.23 0.085-0.565 0.04
100 100 0.14 0.037-0.400 0.008
100 200 0.098 0.029-0.253 0.011
100 275 0.091 0.043-0.184 0.024
200 275 0.034 0.008-0.119 0.002
300 275 0.040 0.012-0.119 0.006
PrG-ELISA, 1.5 h 200 250 0.055 0.015-0.199 0.007
PrG-Ab-ELISA, 0.5h 200 250 0.020 0.006-0.054 0.002
IBA, 2 h 10 1000 0.018 0,006-0.056 0.003
IBA, 2 h 20 2000 0.012 0.003-0.057 0.001
IFA, overnight 50 10000 0.005 0.002-0.019 0.001
Disclaimer/Publisher’s Note: The statements, opinions and data contained in all publications are solely those of the individual author(s) and contributor(s) and not of MDPI and/or the editor(s). MDPI and/or the editor(s) disclaim responsibility for any injury to people or property resulting from any ideas, methods, instructions or products referred to in the content.
Copyright: This open access article is published under a Creative Commons CC BY 4.0 license, which permit the free download, distribution, and reuse, provided that the author and preprint are cited in any reuse.
Prerpints.org logo

Preprints.org is a free preprint server supported by MDPI in Basel, Switzerland.

Subscribe

© 2024 MDPI (Basel, Switzerland) unless otherwise stated