Preprint
Article

Effect of Terminal Substituents of 2-Aminobenzimidazoles on Non-Covalent Molecular Interactions in Their Transition Metal Coordination Compounds. Evaluation of Their Biological Activity

Altmetrics

Downloads

93

Views

28

Comments

0

A peer-reviewed article of this preprint also exists.

Submitted:

07 September 2023

Posted:

12 September 2023

You are already at the latest version

Alerts
Abstract
There were designed and synthesized two new sulfone 2-aminobenzimidazole derivatives. Coordination compounds were obtained with nickel(II), copper(II), zinc(II), cadmium(II) and mercury(II) and these novel ligands. There were fully characterized by spectroscopic and analytical techniques. Single crystal X-ray structural analysis was performed on order to study the relevant intra and inter non-covalent interactions, mainly H...π, lone pair·...π, π...π, highlighting the difference between the ethyl and phenyl groups in such interactions. Dimeric and trimeric supramolecular syntons were found for some of these compounds. Their biological activity was investigated, being the copper(II) compounds with the sulfone phenyl derivative the most active.
Keywords: 
Subject: Chemistry and Materials Science  -   Medicinal Chemistry

1. Introduction

Since the pioneering work of cis-platinum and other related platinum compounds [1], biologically active coordination compounds became a new field for bioinorganic chemistry. Platinum is still part of many newly synthetic compounds that attempt to use the covalent mechanism of cis-platinum but using different ligands. [2,3] Although cis-platinum and other metallic compounds are quite useful and effective, their well-known toxicity [4,5] is still a problem to overcome by the design of new compounds with less side effects [6]. There is an interest on focusing in coordination compounds of essential trace elements, as Fe, Co, Ni, Cu and Zn [7-9], commonly found in biological systems as part of metalloproteins or cofactors for many enzymes [10]. The use of trace elements aims to take advantage of the pre-existent metabolic routes for them, so they could be less toxic than heavier metals.
Considerable research has been done to elucidate the biological activity of coordination compounds and how they work inside human cells to achieve its goal. Different mechanisms have been proposed, mainly related to the molecular structure of the compounds, such as redox activity of the compound or its metal center, covalent bonding to DNA and other biomolecules, non-covalent interactions with biomolecules or a combination of the ones mentioned [11]. While redox activity and covalent bonding are more direct and unspecific, a mechanism based on non-covalent interactions may be more difficult to elucidate, but it will be more sensitive to changes in the structure of the coordination compound and the conformation adopted by the biomolecules [12-14].
DNA is an example of the different ways in which a single biomolecule may interact with transition metal coordination compounds. With B-DNA, the complexes may interact through the phosphate backbone of the strands, stablish interactions with the nitrogenated bases at the mayor or the minor grooves, intercalate aromatic moieties between two nucleotides or a combination of these possibilities. All these interactions led to conformational changes of this biomolecule, affecting its stability and those processes in which it is involved [15]. An example of the relevance of the specificity of non-covalent interactions is found with the interaction of coordination compounds and the quadruplex conformation of DNA, observed at the telomeres of chromosomes in guanine rich sections, and that has been related to cell aging and apoptosis [16-20]
The continuous study of non-covalent interactions has been relevant to the design of biologically active compounds [21]. We have been interested on the design of biologically active ligands and their corresponding transition metal coordination compounds, specifically focus on the influence of non-covalent interactions into the biological properties [22].
In a previous work with tinidazole (tnz) and its copper(II) and zinc(II) compounds, it was found that tetrahedral coordination compounds showed excellent antiparasitic activity [23,24]. An important factor for the activity of these compounds was the presence of a bifurcated intramolecular lone pair⋅⋅⋅π interaction (lp), between an O atom of the sulfone group with both imidazolic rings from the coordinated tnz ligands. This interaction stabilized the molecular tetrahedral structure, which was stable enough to be conserved in solution. The biological activity of the tinidazole copper(II) compounds was further investigated. Different counterions were used to generate tnz-based complexes of various geometries to study the influence of the geometry in the biological activity. Cyclic voltammetry and gel electrophoresis experiments were performed to evaluate their oxidative-damaging properties, their redox properties were attributable to both the ligand and the metal ion. Additionally, DNA-interacting ability and cytotoxicity of tnz copper(II) complexes were evaluated. These complexes interact with DNA by means of electrostatic interactions or/and groove binding, and the generation of ROS, in the presence of a reducing agent, induces DNA damage. Cytotoxicity studies with different cancer cell lines revealed that complexes [Cu(tnz)2(µ-Cl)Cl]2 and [Cu(tnz)2Br2] showed the highest cytotoxicity, while they were moderately toxic to normal cells [25, 26]
Most of the studied cytotoxic coordination compounds have been with chelating ligands, the results with non-chelating ligands, tinidazole [23-26] and clotrimazole [27,28], have shown that weak interactions, such as hydrogen bonding, electrostatic interactions, π stacking, lp⋅⋅⋅π or hydrophobic contacts, as well as geometry and redox properties, have an important role on the biological activity of coordination compounds with monocoordinated ligands.
Based on these results, we were interested to investigate 2-aminobenzimidazole sulfonated derivatives, the presence of the amino group has been found to be of great importance for interactions with or between biomolecules, thanks to the high hydrogen donor character of the group [12]. These interactions have been observed in previous studies of coordination compounds with the unsubstituted 2-aminobenzimidazole ligand, where the -NH2 gives place to intramolecular hydrogen bonding with the coordinated halides or acetates stabilized the molecular structure [29,30]. In addition, the sulfone group have shown to give place to weak interactions, lp⋅⋅⋅π contacts, or the presence of a phenyl group to π⋅⋅⋅π stacking [31].
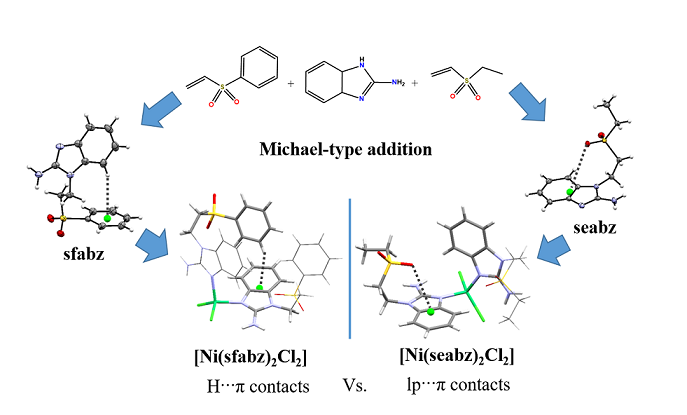
Herein we present the structural and spectroscopic characterization, as a non-covalent interactions analysis of the ethyl and phenyl sulfonated ligands, 2-amino-1-(2-phenylsulphonyl)ethylbenzimidazole (sfabz); 2-amino-1-(2-ethylsulfonyl) ethylbenzimidazole (seabz) and their coordination compounds. The antiproliferative activity of the obtained compounds was investigated.

2. Experimental

2.1. Materials and methods

2-aminobenzimidazole, phenylvinyl sulfone and ethylvinyl sulfone were purchased from Sigma-Aldrich and used without further purification. The metal salts K2CO3 (99%), CuCl2·2H2O (97%), CuBr2 (98%), NiCl2·6H2O (99%), ZnBr2 (>97%), HgCl2 (98%) and CdCl2·2.5H2O (99%) were purchased from J.T. Baker, the salt ZnCl2 (>97%), was obtained from Sigma Aldrich and the salt NiBr2·3H2O (99%) was purchased from Merck. All solvents were obtained from J.T. Baker. Both salts and solvents were used without further purification.

2.2. Synthesis of the ligands.

2.2.1. Synthesis of 2-amino-1-(2-phenylsulfonyl)ethylbenzimidazole (sfabz)

The ligand was synthesized by mixing phenylvinyl sulfone (3.3182 mmol, 0.5582 g), 2-aminobenzimidazole (3.3182 mmol, 0.4418 g), and K2CO3 (1.6591 mmol, 0.2293 g) in 10 mL of acetonitrile. The mixture was stirred under reflux for ten minutes, left to stand at room temperature and then filtered. The precipitate was washed with a concentrated solution of NH4Cl and then with distilled water. Crystals suitable for single crystal X-ray diffraction were obtained by slow evaporation of a solution of the ligand in methanol. Yield: 92%. Anal. Calculated for C15H15N3O2S: C, 59.78%; H, 5.02%; N, 13.95%; S, 10.62%. Experimental: C, 59.58%; H, 4.82%; N, 14.19%; S, 10.76%. IR (ν cm-1 ): 3434 νas(NH2), 3341 νs(NH2), 1664 ν(C=C)+ρ(NH2)+ν(C2-N3), 1552 ν(C=N)+ρ(NH2)+ν(C2-N10), 1286 νas(SO2), 1140 νs(SO2). RMN: δ 7.86 (H17, d, J= 7.4 Hz, 2H), 7.71 (H19, t, J= 7.4 Hz, 1H), 7.58 (H18, t, J= 7.4 Hz, 2H), 7.05 (H4, d, J= 7.5 Hz, 1H), 6.89 (H5, t, J= 7.5, 1H), 6.79 (H6, t, J= 7.5 Hz, 1H), 6.74 (H7, d, J= 7.5 Hz, 1H), 6.43 (H10, s, 2H), 4.28 (H11, t, J= 7.0 Hz, 2H), 3.72 (H12, t, J= 7.0 Hz, 2H).

2.2.2. Synthesis of 2-amino-1-(2-ethylsulfonyl)ethylbenzimidazole (seabz)

The ligand was prepared by mixing ethylvinyl sulfone (4.768 mmol, 0.5755 g) and 2-aminobenzimidazole (4.768 mmol, 0.6376 g) in 10 mL of acetonitrile. This mixture was stirred under reflux for 30 minutes, then was left to stand at room temperature. The precipitate was filtered and washed with 5 mL of ethylacetate. Crystals suitable for single crystal X-ray diffraction were obtained by slow evaporation of a solution of the ligand in methanol. Yield: 66%. Anal. Calculated for C11H15N3O2S: C, 51.24%; H, 6.06%; N, 16.30%; S, 12.44%. Experimental: C, 51.27%; H, 5.93%; N, 16.35%; S, 12.50%. IR (ν cm-1 ): 3460 νas(NH2), 3373 νs(NH2), 1639 ν(C=C)+ρ(NH2)+ν(C2-N3), 1549 ν(C=N)+ρ(NH2)+ν(C2-N10), 1281 νas(SO2), 1132 νs(SO2). RMN: δ 7.13 y 7.15 (H4 y H7, dd, J= 7.4, 1.2 Hz, 2H), 6.94 (H6, td, J= 7.4, 1.2 Hz, 1H), 6.88 (H5, td, J= 7.4, 1.2 Hz, 2H), 6.48 (H10, s, 2H), 4.39 (H11, d, J= 7.2 Hz, 2H), 3.46 (H12, t, J= 7.2 Hz, 2H), 3.08 (H16, q, J= 7.4 Hz, 2H), 1.15 (H17, t, J= 7.4 Hz, 2H).

2.3. Synthesis of the coordination compounds

Coordination compounds of sfabz and seabz were synthesized by similar procedures. A mixture of the ligand and the metal salt in a methanol solution (10 mL) was stirred under reflux for 30 minutes. The reaction mixture was left to stand at room temperature, the obtained products were filtered and washed with cold ethanol. Details of the reaction conditions are discussed below.

2.3.1. [Ni(sfabz)2Cl2] (1)

A solution of the ligand (0.1507 g, 0.5 mmol) and NiCl2·6H2O (0.0594 g, 0.25 mmol) in 15 mL of ethanol was stirred under reflux for 30 minutes. The reaction mixture was left to stand at room temperature. The obtained product was filtered and washed with 10 mL of cold ethanol. Crystals suitable for single crystal X-ray diffraction were obtained preparing a solution in acetone of the solid obtained and leaving it to slow evaporation. Yield: 80%. Anal. Calculated for NiC30H32N6O5S2Cl2: C, 48.02%; H, 4.30%; N, 11.20%; S, 8.55%. Experimental: C, 47.62%; H, 3.56%; N, 10.80%; S, 8.01%. IR (ν cm-1 ): 3387 νas(NH2), 3305 νs(NH2), 1645 ν(C=C)+ρ(NH2)+ν(C2-N3), 1552 ν(C=N)+ρ(NH2)+ν(C2-N10), 1292 νas(SO2), 1141 νs(SO2).

2.3.2. [Ni(sfabz)2Br2] (2)

A solution of the ligand (0.1507 g, 0.5 mmol) and NiBr2·3H2O (0.0681 g, 0.25 mmol) in 15 mL of ethanol was stirred under reflux for 30 minutes. The reaction mixture was left to stand at room temperature. The obtained product was filtered and washed with 10 mL of cold ethanol. The compound was dissolved in acetone and crystals suitable for single crystal X-ray diffraction were obtained by slow evaporation of the solvent. Yield: 71%. Anal. Calculated for NiC30H30N6O4S2Br2: C, 43.88%; H, 3.68%; N, 10.23%; S, 7.81%. Experimental: C, 43.56%; H, 3.20%; N, 10.10%; S, 7.66%. IR (ν cm-1 ): 3418 νas(NH2), 3307 νs(NH2), 1643 ν(C=C)+ρ(NH2)+ν(C2-N3), 1549 ν(C=N)+ρ(NH2)+ν(C2-N10), 1290 νas(SO2), 1146 νs(SO2).

2.3.3. [Ni(seabz)2Cl2] (3)

A solution of the ligand (0.1267 g, 0.5 mmol) and NiCl2·6H2O (0.0594 g, 0.25 mmol) in 15 mL of ethanol was stirred under reflux for 30 minutes. The reaction mixture was left to stand at room temperature. The obtained product was filtered and washed with 10 mL of cold ethanol. The compound was dissolved in acetone and crystals suitable for single crystal X-ray diffraction were obtained by slow evaporation of the solvent. Yield: 89%. Anal. Calculated for NiC22H34N6O6S2Cl2: C, 39.31%; H, 5.10%; N, 12.50%; S, 9.54%. Experimental: C, 39.69%; H, 4.82%; N, 12.56%; S, 8.80%. IR (ν cm-1 ): 3407 νas(NH2), 3321 νs(NH2), 1646 ν(C=C)+ρ(NH2)+ν(C2-N3), 1559 ν(C=N)+ρ(NH2)+ν(C2-N10), 1295 νas(SO2), 1128 νs(SO2).

2.3.4. [Ni(seabz)2Br2] (4)

A solution of the ligand (0.1267 g, 0.5 mmol) and NiBr2·3H2O (0.0681 g, 0.25 mmol) in 15 mL of ethanol was stirred under reflux for 30 minutes. The reaction mixture was left to stand at room temperature. The obtained product was filtered and washed with 10 mL of cold ethanol. Yield: 69%. Anal. Calculated for NiC22H35N6O6.5S2Br2: C, 34.31%; H, 4.58%; N, 10.91%; S, 8.37%. Experimental: C, 33.97%; H, 4.11%; N, 11.25%; S, 7.84%. IR (ν cm-1 ): 3387 νas(NH2), 3311 νs(NH2), 1645 ν(C=C)+ρ(NH2)+ν(C2-N3), 1550 ν(C=N)+ρ(NH2)+ν(C2-N10), 1294 νas(SO2), 1126 νs(SO2).

2.3.5. [Cu(sfabz)2Cl2] (5)

A solution of 0.0426 g (2.5 mmol) of CuCl2·2H2O and 0.2260 g (7.5 mmol) of the ligand sfabz in 15 mL of ethanol was stirred under reflux for one hour. The reaction mixture was left to stand at room temperature. The obtained product was filtered and washed with 10 mL of cold ethanol. Crystals suitable for single crystal X-ray diffraction were obtained by slow evaporation of the remanent ethanolic reaction mixture. Yield: 65%. Anal. Calculated for CuC30H31N6O4.5S2Cl2: C, 48.29%; H, 4.19%; N, 11.26%; S, 8.60%. Experimental: C, 48.10%; H, 3.94%; N, 11.36%; S, 8.95%. IR (ν cm-1 ): 3440 νas(NH2), 3372 νs(NH2), 1638 ν(C=C)+ρ(NH2)+ν(C2-N3), 1546 ν(C=N)+ρ(NH2)+ν(C2-N10), 1289 νas(SO2), 1138 νs(SO2).

2.3.6. [Cu(sfabz)2Br2] (6)

A solution of the ligand (0.1507 g, 0.5 mmol) and CuBr2 (0.0558 g, 0.25 mmol) in 15 mL of ethanol was stirred under reflux for 30 minutes. The reaction mixture was left to stand at room temperature. The obtained product was filtered and washed with 10 mL of cold ethanol. Yield: 97%. Anal. Calculated for CuC30H32N6O5S2Br2: C, 42.69%; H, 3.82%; N, 9.96%; S, 7.60%. Experimental: C, 42.41%; H, 3.49%; N, 9.87%; S, 7.31%. IR (ν cm-1 ): 3525 νas(NH2), 3318 νs(NH2), 1643 ν(C=C)+ρ(NH2)+ν(C2-N3), 1557 ν(C=N)+ρ(NH2)+ν(C2-N10), 1294 νas(SO2), 1141 νs(SO2).

2.3.7. [Cu(seabz)2Cl2] (7)

A solution of 0.0426 g (2.5x10⁻⁴ mol) of CuCl2·2H2O and 0.1267 g (5x10⁻⁴ mol) of the ligand seabz in 15 mL of ethanol was stirred under reflux for 30 minutes. The solvent was evaporated under heating and the precipitate was filtered and washed with 10 mL of cold ethanol. Yield: 80%. Anal. Calculated for CuC22H34N6O6S2Cl2: C, 39.11%; H, 5.08%; N, 12.45%; S, 9.47%. Experimental: C, 39.17%; H, 5.44%; N, 12.68%; S, 7.97%. IR (ν cm-1 ): 3397 νas(NH2), 3308 νs(NH2), 1645 ν(C=C)+ρ(NH2)+ν(C2-N3), 1558 ν(C=N)+ρ(NH2)+ν(C2-N10), 1294 νas(SO2), 1125 νs(SO2).

2.3.8. [Cu(seabz)2Br2] (8)

A solution of 0.0558 g (2.5x10⁻⁴ mol) of CuBr2 and 0.1267 g (5x10⁻⁴ mol) of the ligand in 15 mL of ethanol was stirred under reflux for 30 minutes. The solution of the reaction mixture was evaporated under heating. The precipitate was filtered and washed with 10 mL of cold ethanol. Yield: 81%. Anal. Calculated for CuC22H30N6O4S2Br2: C, 36.20%; H, 4.14%; N, 11.51%; S, 8.79%. Experimental: C, 36.40%; H, 4.46%; N, 11.66%; S, 8.18%. IR (ν cm-1 ): 3388 νas(NH2), 3321 νs(NH2), 1639 ν(C=C)+ρ(NH2)+ν(C2-N3), 1549 ν(C=N)+ρ(NH2)+ν(C2-N10), 1289 νas(SO2), 1123 νs(SO2).

2.3.9. [Zn(sfabz)2Cl2] (9)

A solution of the ligand (0.1507 g, 0.5 mmol) and ZnCl2 (0.0341 g, 0.25 mmol) in 15 mL of ethanol was stirred under reflux for 30 minutes. The reaction mixture was left to stand at room temperature. The obtained product was filtered and washed with 10 mL of cold ethanol. The compound was dissolved in acetone. Crystals suitable for X-ray diffraction were obtained by slow evaporation of the solvent. Yield: 84%. Anal. Calculated for ZnC30H31N6O4.5S2Cl2: C, 48.17%; H, 4.18%; N, 11.23%; S, 8.57%. Experimental: C, 48.17%; H, 3.35%; N, 11.28%; S, 8.39%. IR (ν cm-1 ): 3390 νas(NH2), 3315 νs(NH2), 1646 ν(C=C)+ρ(NH2)+ν(C2-N3), 1556 ν(C=N)+ρ(NH2)+ν(C2-N10), 1293 νas(SO2), 1142 νs(SO2).

2.3.10. [Zn(sfabz)2Br2] (10)

A mixture of the ligand (0.1507 g, 0.5 mmol) and ZnBr2 (0.0563 g, 0.25 mmol) in 15 mL of ethanol was stirred under reflux for 30 minutes. The reaction mixture was left to stand at room temperature. The reaction mixture was left to stand at room temperature. The obtained product was filtered and washed with 10 mL of cold ethanol. The compound was dissolved in acetone. Crystals suitable for X-ray diffraction were obtained by slow evaporation of the solvent. Yield: 78%. Anal. Calculated for ZnC30H30N6O4S2Br2: C, 43.52%; H, 3.65%; N, 10.15%; S, 7.28%. Experimental: C, 43.28%; H, 3.30%; N, 10.11%; S, 7.28%. IR (ν cm-1 ): 3415 νas(NH2), 3312 νs(NH2), 1627 ν(C=C)+ρ(NH2)+ν(C2-N3), 1552 ν(C=N)+ρ(NH2)+ν(C2-N10), 1290 νas(SO2), 1136 νs(SO2).

2.3.11. [Zn(seabz)2Cl2] (11)

A solution of the ligand (0.1267 g, 0.5 mmol) and ZnCl2 (0.0341 g, 0.25 mmol) in 15 mL of ethanol was stirred under reflux for 30 minutes. The reaction mixture was left to stand at room temperature. The obtained product was filtered and washed with 10 mL of cold ethanol. The reaction mixture was left to stand at room temperature. The obtained product was filtered and washed with 10 mL of cold ethanol. The compound was dissolved in acetonitrile. Crystals suitable for X-ray diffraction were obtained by slow evaporation of the solvent. Yield: 79%. Anal. Calculated for ZnC22H32N6O5S2Cl2: C, 39.98%; H, 4.88%; N, 12.72%; S, 9.70%. Experimental: C, 40.02%; H, 5.46%; N, 13.12%; S, 9.08%. IR (ν cm-1 ): 3411 νas(NH2), 3328 νs(NH2), 1650 ν(C=C)+ρ(NH2)+ν(C2-N3), 1562 ν(C=N)+ρ(NH2)+ν(C2-N10), 1295 νas(SO2), 1128 νs(SO2).

2.3.12. [Zn(seabz)2Br2] (12)

A solution of the ligand (0.1267 g, 0.5 mmol) and ZnBr2 (0.0563 g, 0.25 mmol) in 15 mL of ethanol was stirred under reflux for 30 minutes. The reaction mixture was left to stand at room temperature. The obtained product was filtered and washed with 10 mL of cold ethanol. Yield: 92%. Anal. Calculated for ZnC22H30N6O4S2Br2: C, 36.11%; H, 4.13%; N, 11.48%; S, 8.76%. Experimental: C, 35.87%; H, 3.86%; N, 11.90%; S, 7.62%. IR (ν cm-1 ): 3400 and 3365 νas(NH2), 3330 and 3306 νs(NH2), 1640 ν(C=C)+ρ(NH2)+ν(C2-N3), 1550 ν(C=N)+ρ(NH2)+ν(C2-N10), 1290 νas(SO2), 1124 νs(SO2).

2.3.13. [Cd(sfabz)2Cl2] (13)

A solution of the ligand (0.1507 g, 0.5 mmol) and CdCl2·2.5H2O (0.0572 g, 0.25 mmol) in 15 mL of ethanol was stirred under reflux for 30 minutes. The reaction mixture was left to stand at room temperature. The obtained product was filtered and washed with 10 mL of cold ethanol. Yield: 90%. Anal. Calculated for CdC30H30N6O4S2Cl2: C, 45.84%; H, 3.85%; N, 10.69%; S, 8.16%. Experimental: C, 46.10%; H, 3.88%; N, 10.82%; S, 7.21%. IR (ν cm-1 ): 3419 νas(NH2), 3356 νs(NH2), 1655 ν(C=C)+ρ(NH2)+ν(C2-N3), 1568 ν(C=N)+ρ(NH2)+ν(C2-N10), 1289 νas(SO2), 1144 νs(SO2).

2.3.14. [Cd(seabz)2Cl2] (14)

A solution of the ligand (0.1267 g, 0.5 mmol) and CdCl2·2.5H2O (0.0572 g, 0.25 mmol) in 15 mL of ethanol was stirred under reflux for 30 minutes. The reaction mixture was left to stand at room temperature. The obtained product was filtered and washed with 10 mL of cold ethanol. The compound was dissolved in acetonitrile. Crystals suitable for X-ray diffraction were obtained by slow evaporation of the solvent. Yield: 89%. Anal. Calculated for CdC22H31N6O4.5S2Cl2: C, 37.80%; H, 4.47%; N, 12.02%; S, 9.18%. Experimental: C, 37.96%; H, 4.77%; N, 11.73%; S, 8.13%. IR (ν cm-1 ): 3400 νas(NH2), 3332 νs(NH2), 1648 ν(C=C)+ρ(NH2)+ν(C2-N3), 1558 ν(C=N)+ρ(NH2)+ν(C2-N10), 1295 νas(SO2), 1127 νs(SO2).

2.3.15. [Hg(sfabz)2Cl2] (15)

A solution of the ligand (0.1507 g, 0.5 mmol) and HgCl2 (0.0679 g, 0.25 mmol) in 15 mL of ethanol was stirred under reflux for 30 minutes. The reaction mixture was left to stand at room temperature. The obtained product was filtered and washed with 10 mL of cold ethanol. Yield: 93%. Anal. Calculated for HgC30H30N6O4S2Cl2: C, 41.22%; H, 3.46%; N, 9.61%; S, 7.34%. Experimental: C, 41.10%; H, 3.35%; N, 9.91%; S, 6.40%. IR (ν cm-1 ): 3387 νas(NH2), 3311 νs(NH2), 1645 ν(C=C)+ρ(NH2)+ν(C2-N3), 1552 ν(C=N)+ρ(NH2)+ν(C2-N10), 1292 νas(SO2), 1141 νs(SO2).

2.3.16. [Hg(seabz)2Cl2] (16)

A solution of the ligand (0.1267 g, 0.5 mmol) and HgCl2 (0.0678 g, 0.25 mmol) in 15 mL of ethanol was stirred under reflux for 30 minutes. The reaction mixture was left to stand at room temperature. The obtained product was filtered and washed with 10 mL of cold ethanol. The compound was dissolved in acetonitrile. Crystals suitable for X-ray diffraction were obtained by slow evaporation of the solvent. Yield: 68%. Anal. Calculated for HgC22H30N6O4S2Cl2: C, 33.96%; H, 3.89%; N, 10.80%; S, 8.24%. Experimental: C, 33.95%; H, 4.28%; N, 10.73%; S, 7.08%. IR (ν cm-1 ): 3403 νas(NH2), 3331 νs(NH2), 1647 ν(C=C)+ρ(NH2)+ν(C2-N3), 1559 ν(C=N)+ρ(NH2)+ν(C2-N10), 1295 νas(SO2), 1125 νs(SO2).

2.4. Physical Measurements

FT IR spectra were recorded with an FT-IR/FT-FIR Spectrum 400 spectrophotometer using a universal ATR accessory Perkin-Elmer (4000-400 cm-1). The UV-Vis-NIR spectra (diffuse reflectance, 40000-5000 cm-1) were recorded on a Cary-5000 (Varian) spectrophotometer, spectra recorded in solution for the copper(II) compounds was obtained from a 1x10⁻³ M solution of the compounds in DMSO. Elemental analyses were carried in a Fisons EA 1180 analyzer. The 1H and 13C NMR spectra were recorded with a Varian Unity Inova spectrometer with a frequency of 400 MHz for 1H and 100 MHz for 13C, using DMSO-d6 as solvent, chemical shifts (δ) are reported in ppm referred to tetramethylsilane (TMS).

2.5. Solution studies

In order to study the stability of the copper(II) compounds in solution their spectra were recorded in DMSO (1x10⁻³M) on a Cary-5000 (Varian) spectrophotometer for 24 h. For the zinc(II) compounds their 1H-NMR spectra was obtained using a Varian Unity Inova spectrometer with a frequency of 400 MHz, using DMSO-d6 as solvent, chemical shifts (δ) are reported in ppm referred to tetramethylsilane (TMS).

2.6. X-ray Crystallography

X-ray diffraction data for the ligands and the compounds 1, 2, 3 and 10 were obtained using standard procedures on an Oxford Diffraction Gemini “A” instrument with a CCD area detector using graphite-monochromated Mo(Kα) radiation for both ligands and the compounds 1, 2 and 3, and Cu(Kα) for compound 10. Data for both ligands and the compounds 1, 2, 3 and 10 were obtained at 130 K. Intensities were measured using φ + ω scans.
Diffraction data for compounds 5 and 9 were obtained on a Bruker D8 Venture\k-geometry diffractometer equipped with a CCD detector using graphite-monochromated Mo(Kα) radiation at 293.15 K for compound 5, and 150 K for compound 9. All structures were solved using direct methods, using the package SHELXS-2012 and refined with an anisotropic approach for non-hydrogen atoms using the SHELXL-2014/7 program. All hydrogen atoms that couldn’t be detected were positioned geometrically as riding on their parent atoms, with C–H = 0.93–0.99 A and Uiso(H) = −1.2Ueq(C) for aromatic and methylene groups [32-34]. All crystallographic data can be found in Tables S1-S3.

2.7. Cell growth inhibition

2.7.1. Cell culture

HeLa (cervix-uterine) MCF-7 (breast), HCT-15 (colorectal) and A549 (lung) human carcinoma cell lines and L929 mouse fibroblast, were acquired from ATCC (American Tissue Culture Collection) and maintained in incubation at 310 K and 5% CO2 with RPMI (GIBCO®, Invitrogen corporation) supplemented with 10% BFS (GIBCO®, Invitrogen corporation), 1% L-glutamine and 1% penicillin/streptomycin. Experiments were performed with cells within at least 5 passages from each other. All cells were split when around 80–95% confluence was reached using 0.25% trypsin/EDTA.

2.7.2. In vitro growth inhibition assay

After plating 2 × 10⁴ cells/well in 96-well microplate (Costar®) with 300 μL capacity and allowed to attach incubating at 310 K for 48 h, HeLa (cervix-uterine) MCF-7 (breast), HCT-15 (colorectal) and A549 (lung) human carcinoma cell lines and L929 mouse fibroblast were treated with sfabz, seabz and their Cu(II), and Zn(II) coordination compounds. The test metal compounds were made up in 5% DMSO and saline to give a 1 mM stock solution by initial dissolution in DMSO followed by dilution with saline. Sonication was sometimes used to facilitate complete dissolution. Serial dilutions were carried out to give final screening concentrations of ligands and the coordination compounds of 400, 200, and 20 μM (final concentration of DMSO of 0.5% (v/v)). Aliquots of 50 μL of these solutions were added to the wells (in triplicate) already containing 150 μL of media, so that the final concentrations were 100, 50 and 5 μM (final concentration of DMSO of 0.125% (v/v)). The cells were exposed to the complex for 24 h, which then was removed and the cells washed with washing media followed by the addition of 200 μL of fresh RPMI media. Then the cells were incubated for 72 h of recovery time. The remaining biomass was then estimated by the sulforhodamine B assay [35] (SRBassay). The three screening concentrations were used in an initial test of activity. The selected complexes were then tested for half maximal inhibitory concentration (IC50) value determination. The previously described assay was then repeated but using six different concentrations of complex instead, ranging from 0.1 to 100 μM. Each assay was done in triplicate. IC50 values were obtained from plots of % cell survival against log of the drug concentration.

3. Results and Discussion

3.1. Spectroscopic Characterization and magnetic susceptibility

Chlorido and bromido, NiII, CuII, ZnII, CdII and HgII coordination compounds of 2-amino-1-(2-phenylsulfonyl)ethylbenzimidazole (sfabz) and 2-amino-1-(2-ethylsulfonyl)ethylbenzimidazole (seabz), were obtained. Their general structures were proposed based on spectroscopical data as well as elemental analyses. When single crystals were obtained the proposed structure was confirmed by the X-ray diffraction structure. The magnetic moments were also determined.

3.1.1. IR spectra.

The phenylsulfonated ligand (sfabz) presented the νas(NH2) and the νs(NH2) vibrations in 3434 and 3341 cm-1 respectively, it also presented a band at 1664 cm-1 that was assigned as the contributions from the ν(C=C), the ρ(NH2) and the ν(C2-N3) vibrations; in a similar way, the band at 1552 cm-1 was assigned as the sum of the contributions from the ν(C=N), the ρ(NH2) and the ν(C2-N10) vibrations. Finally, the spectra presented bands at 1286 and 1140 cm-1, which were assigned to the νas(SO2) and νs(SO2) vibrations respectively. Benzimidazolic bands were assigned as proposed by Sudha and coworkers [36]. Upon coordination of sfabz through the N3, the band centered in 1664 cm-1 was shifted to lower energy (1656-1627 cm-1) and the band at 1552 cm-1 showed shifts to higher or lower energy depending on the metal (1571-1546 cm-1). Sulfone bands νas(SO2) and νs(SO2) were shifted to higher energy (1294-1289 cm-1 and 1144-1141 cm-1 respectively). Only in compounds 5 and 10 the νs(SO2) band was shifted to lower energy (1138-1136 cm-1).
On the other hand, the ethylsulfonated ligand (seabz) presented bands at 3460 and 3373 cm-1, assigned to the νas(NH2) and νs(NH2) vibrations respectively. Also, the bands at 1639 and 1549 cm-1 were assigned in the same composed way as in the sfabz ligand. Finally, bands at 1281 and 1132 cm-1, attributed to the νas(SO2) and νs(SO2) and both vibrations of the amino group (3414-3365 cm-1 and 3332-3306 cm-1, respectively). were shifted upon coordination.

3.1.2. Electronic spectroscopy and magnetic susceptibility.

For all nickel(II) and copper(II) compounds, the effective magnetic moment was determined and the UV-Vis-NIR was recorded. All the nickel(II) compounds were assigned to a tetrahedral geometry and because of that it was possible to calculate the ν1 transition according to the graphical method described by Lever [37], the assigned transitions, as well as the effective magnetic moment are shown in Table 1.
The electronic transitions agree with the expected values for a nickel(II) (d8) tetrahedral compounds. The effective magnetic moment for these complexes is well within the range of 3.2-4.1 B.M. for nickel(II) showing this geometry [38]. Furthermore, the experimental results presented here are supported by their X-ray structure (vide infra).
Similarly, the diffuse reflectance electronic spectra for copper(II) compounds 5-8, show the d-d transition ca. 10000 cm-1. Previously reported distorted tetrahedral copper(II) compounds have shown d-d transitions around these values [39, 40]. To further assess the stability of these compounds in solution, the spectra in a DMSO solution was obtained. Table 1 shows the values of the d-d electronic transitions at similar values to those in solid state, suggesting the conservation of the ligands in solution (Figure S1, S2.). Compounds 5-8 depict a µeff within the expected range of 1.8-2.2 B.M. [38].

3.1.3. NMR studies.

1H, 13C and HSQC spectra were obtained for both ligands and compounds 9, 11, 13, 14, 15 and 16. The 1H-NMR and 13C-NMR signals were assigned, according to Figure 1a, and are in agreement with the HSQC spectra (Tables S4 and S5). Similarly, Figure 1.b, depicts the assignation for the ligand seafz, corroborated through HSQC (Tables S6 and S7).
For both series of coordination compounds, signals of the ligands, in both 1H and 13C spectra, were shifted upon coordination (Δδ=ligand-complex, Δδ > 0.05 ppm for 1H and Δδ>0.1 ppm for 13C). Table 2 and Table 3 resume the effect of coordination in the 1H and 13C signals of the ligands except for their ethyl and phenyl substituents.
According to the 1H spectra, it is possible to differentiate the behavior of the three groups of protons: the benzimidazolic protons, the amino group, and the aliphatic chain protons. For the benzimidazolic protons of both series of compounds, the deshielding effect is more pronounced in H6 and H7 and smaller in H5. Comparing the effect of different metals, the deshielding at H5-H7 follows the trend Hg=Zn<Cd, while at H4 all metals cause almost similar displacements in the sfabz series and Cd causes the bigger effect in the seabz series.
In both ligands’ series the amino protons get deshielded upon coordination to the metal ion. This effect is more predominant with Zn, and lower with Cd. Similarly, the aliphatic chain shows a significant displacement with same tendency seen in the amino group, namely, Zn>Hg>Cd.
Comparing the effect of the metal in the 13C spectra, the shielding and deshielding are more pronounced in the Zn compounds and less prominent in the Hg and Cd compounds. The 13C chemical shifts of the aliphatic chain showed a slight deshielding at C11, and a shielding effect on the C12, an effect that can be attributed to the sulfone group in the chain. The terminal chain is also affected by the sulfone, were the aliphatic ethyl chain shows no significant changes in its chemical shifts for both 1H and 13C data, while the phenyl group shows significant changes at the C16 and C17 positions (Δδ C16máx= 0.5 ppm, Δδ C17máx= 0.3 ppm).

3.2. X-ray structures of the ligands and their coordination compounds

3.2.1. Crystal structure of the 2-aminobenzimidazolic ligands.

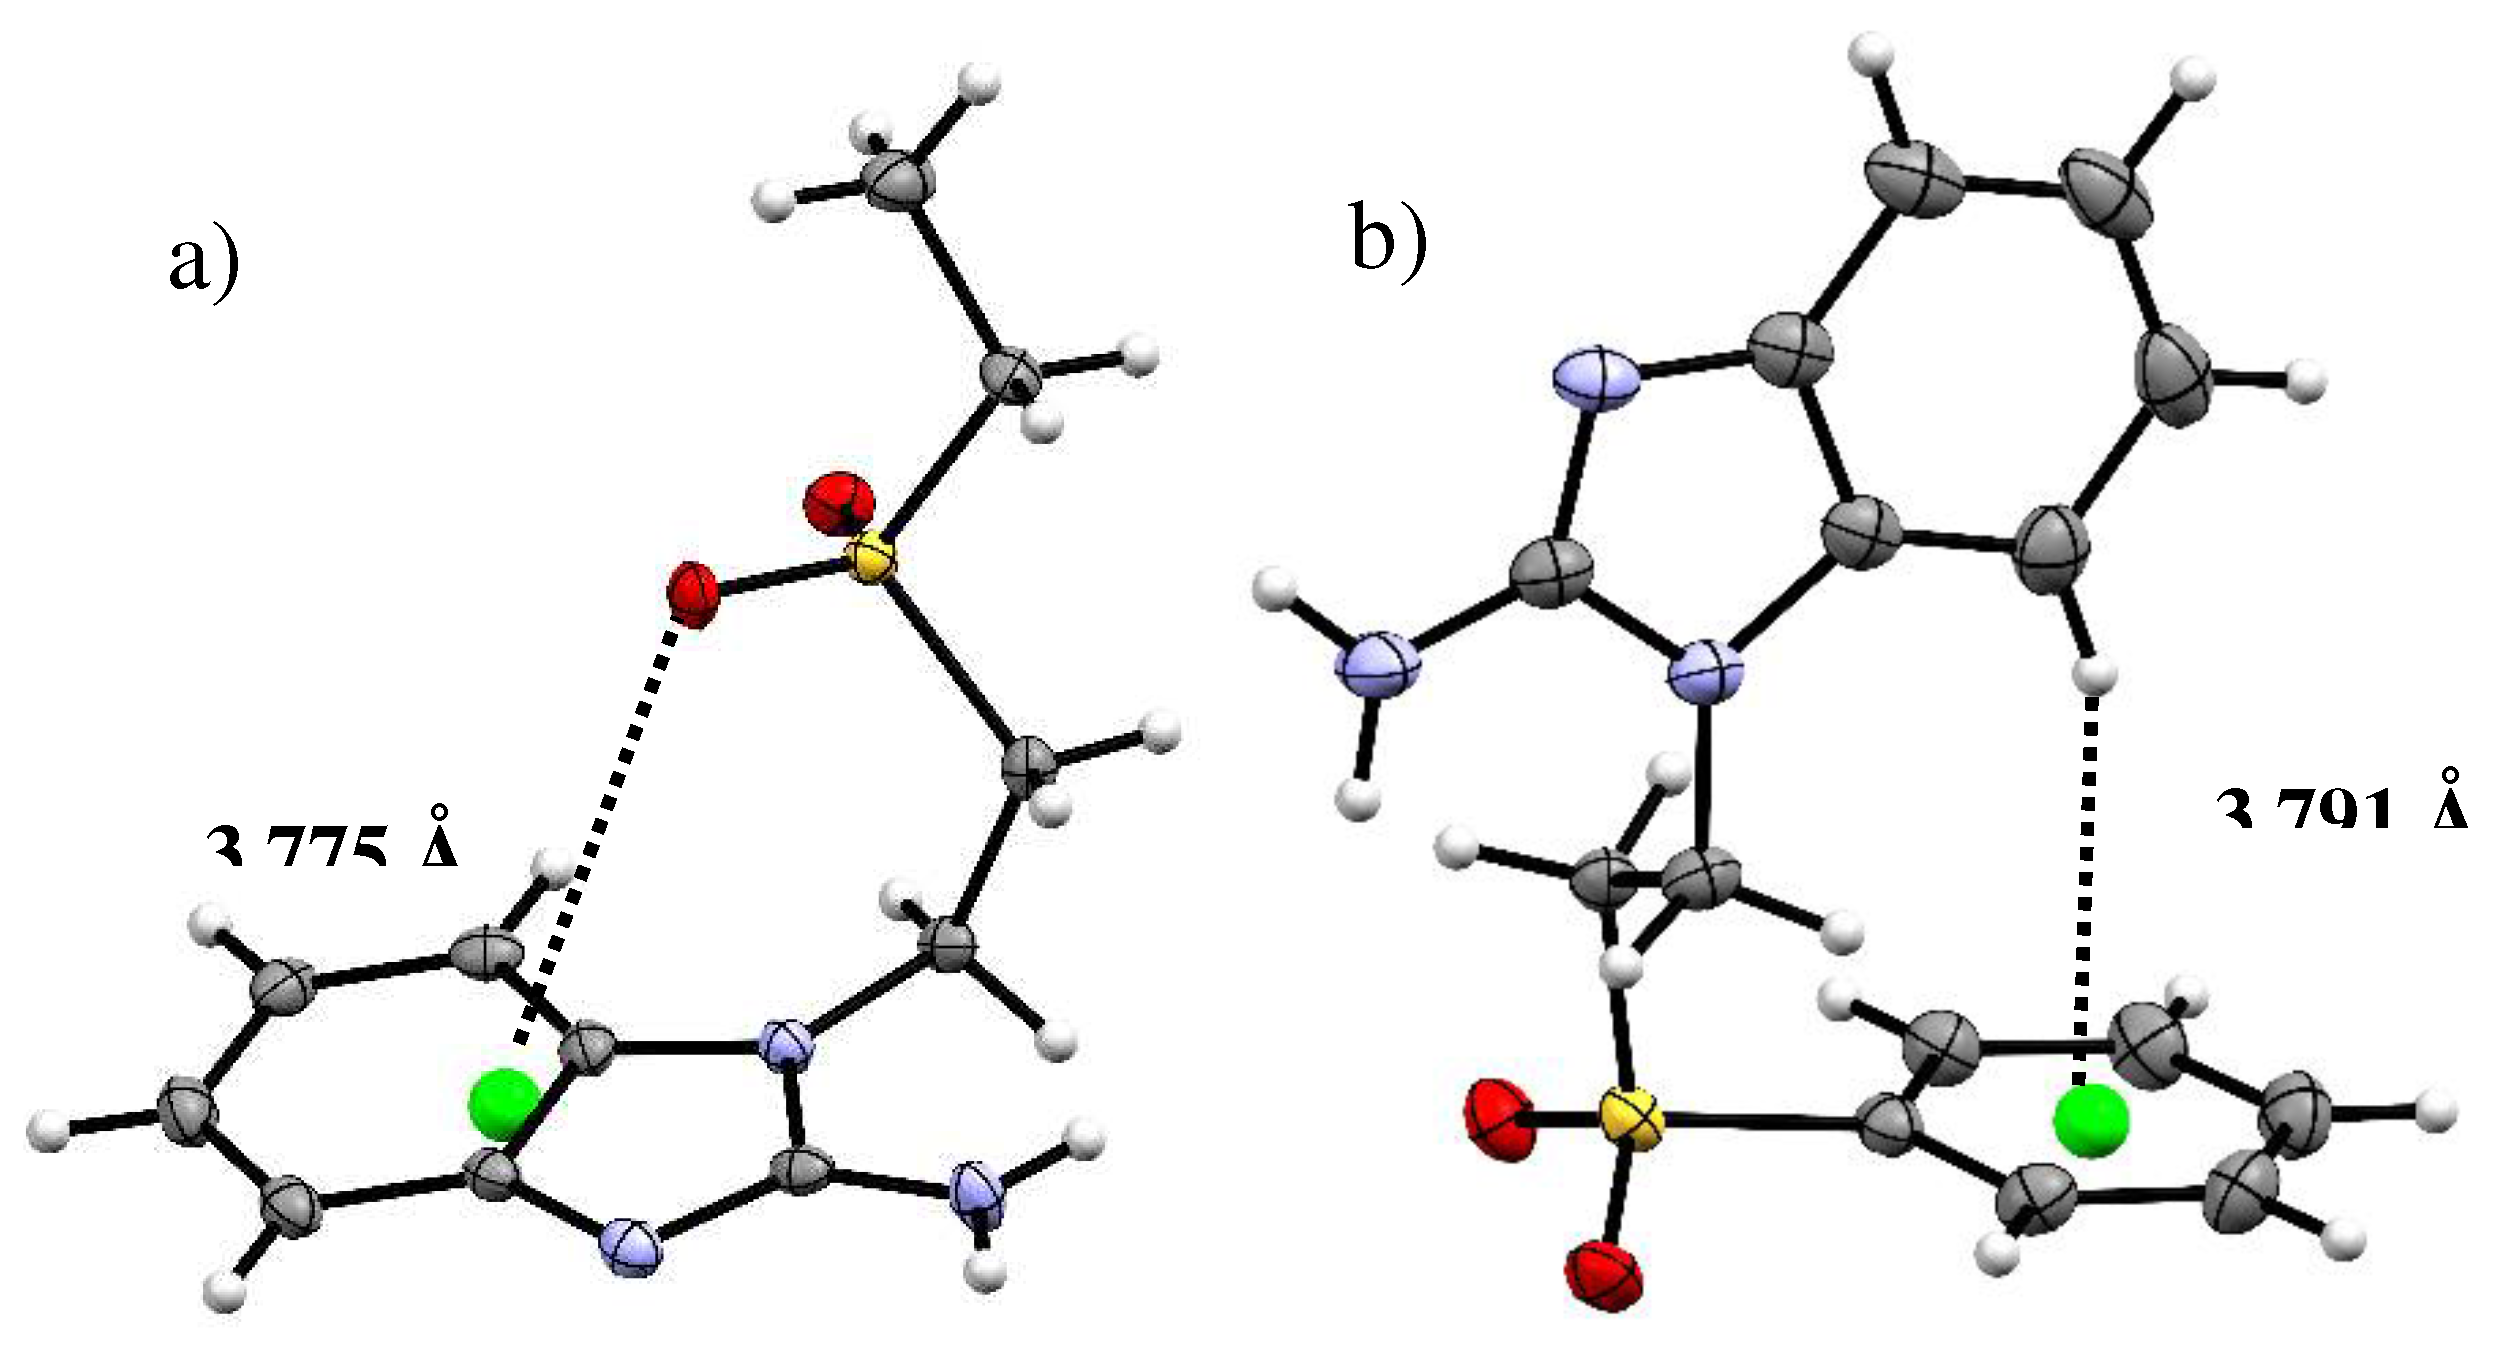
Despite the difference in the terminal substituent, both the seabz and sfabz ligands crystallize in a P 21/n space group, within a monoclinic crystal system. However, these two ligands show different intramolecular interactions. For the seabz ligand, one of the oxygen atoms in the sulfone group is orientated towards the benzimidazolic ring, due to a lone pair···πbz interaction at 3.775 Å (Figure 2a) Instead, the sfabz ligand depicts the sulfone group away from the benzimidazolic ring, thus generating a weak H···πphe at 3.791 Å, between a benzimidazolic proton and the terminal phenyl ring (Figure 2b).
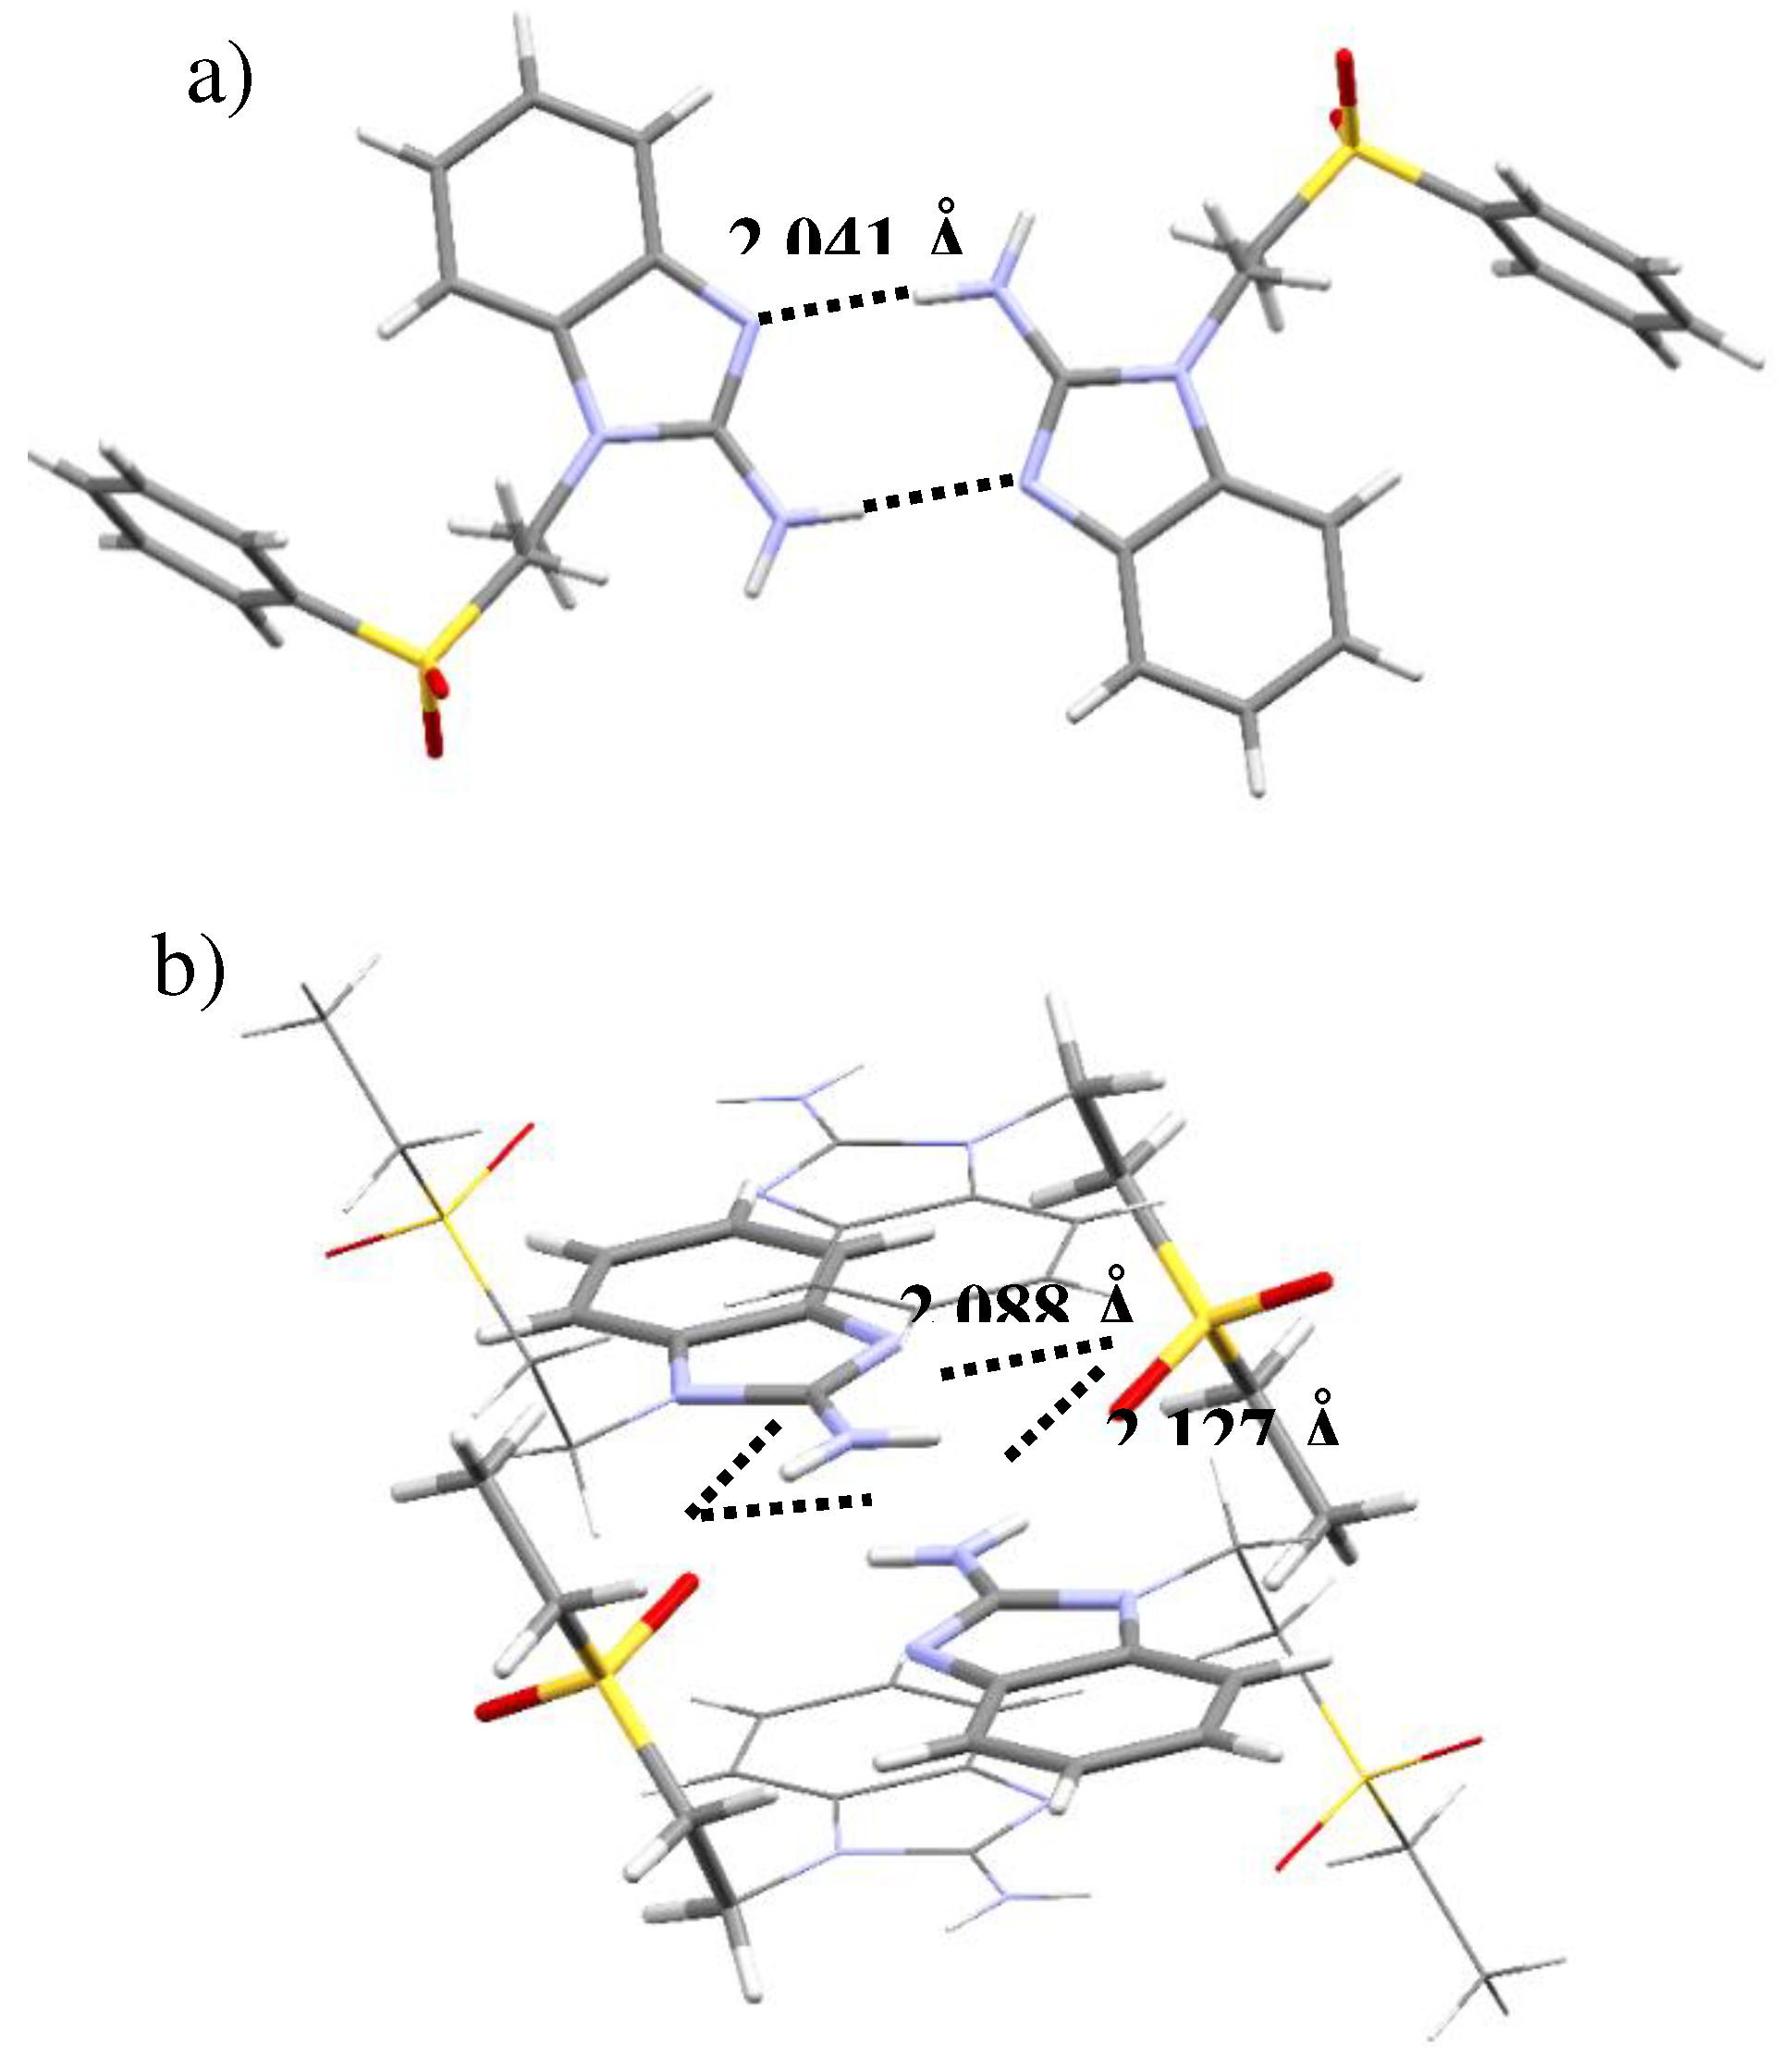
Another difference found in the crystal structures of both ligands are the type of intermolecular interactions, mainly the hydrogen bonding involving the N3 of the benzimidazolic ring. The sfabz ligand depicts two strong hydrogen bonds with the amino group acting as the donor and the N3, the acceptor. This interaction is at 2.041 Å with an angle of 174.58º. Two neighboring molecules show one of these hydrogen bonds each, forming a dimer as depicted in Figure 3a. On the other hand, the seabz ligand also shows a hydrogen bond with the N3 as the acceptor. However, this is a weak hydrogen bond given the donor is a –CH2– group at 2.603 Å and 157.15 º. Alternatively, what seems to be a major stabilizing interaction, between four seabz molecules, is a series of hydrogen bonds with the amino group acting as the donor, with the S=O accepting two protons form different molecules. Their angles and distances (2.088 Å, 2.127 Å and 171.03º, 164.33º) indicate that these interactions are moderate, Figure 3b depicts these hydrogen bonds.

3.2.2. Crystal structure of the coordination compounds of seabz and sfabz.

Herein there were synthesized coordination compounds with both alkylsulfonated benzimidazole ligands to be able to compare the effect of the substituents in the interactions found in the crystal structures of their coordination compounds. As mentioned above, all compounds show the formula [ML2X2] (M2+ = Ni, Cu, Zn, Cd, Hg; L= seabz, sfabz; X= Cl-, Br-). For some of the seabz complexes, adequate crystals for X-ray diffraction were not obtain. This could be due to the fact that the ethyl group will present far less non-covalent interactions than the phenyl ring does (vide infra). Because of this, for compounds 11, 14, and 16, only basic structural features and connectivity are discussed.
Compounds 1, 2 (L = sfabz) and 3 (L = seabz) depict a Ni center with either a Cl- or Br- anion. Compounds 1 and 2 both are obtained in a P-1 space group, within a triclinic crystal system, regardless of the acetone molecule from the solvent in compound 2. Alternatively, compound 3 is obtained in a P 21/c space group and a monoclinic system. The bond lengths and angles around the metal ion for these three compounds are shown in Table 4. From the result shown in this table, it is noticeable that the terminal substituent in the alkylsulfonated chain does not have a major effect in the bonds around the metal ion.
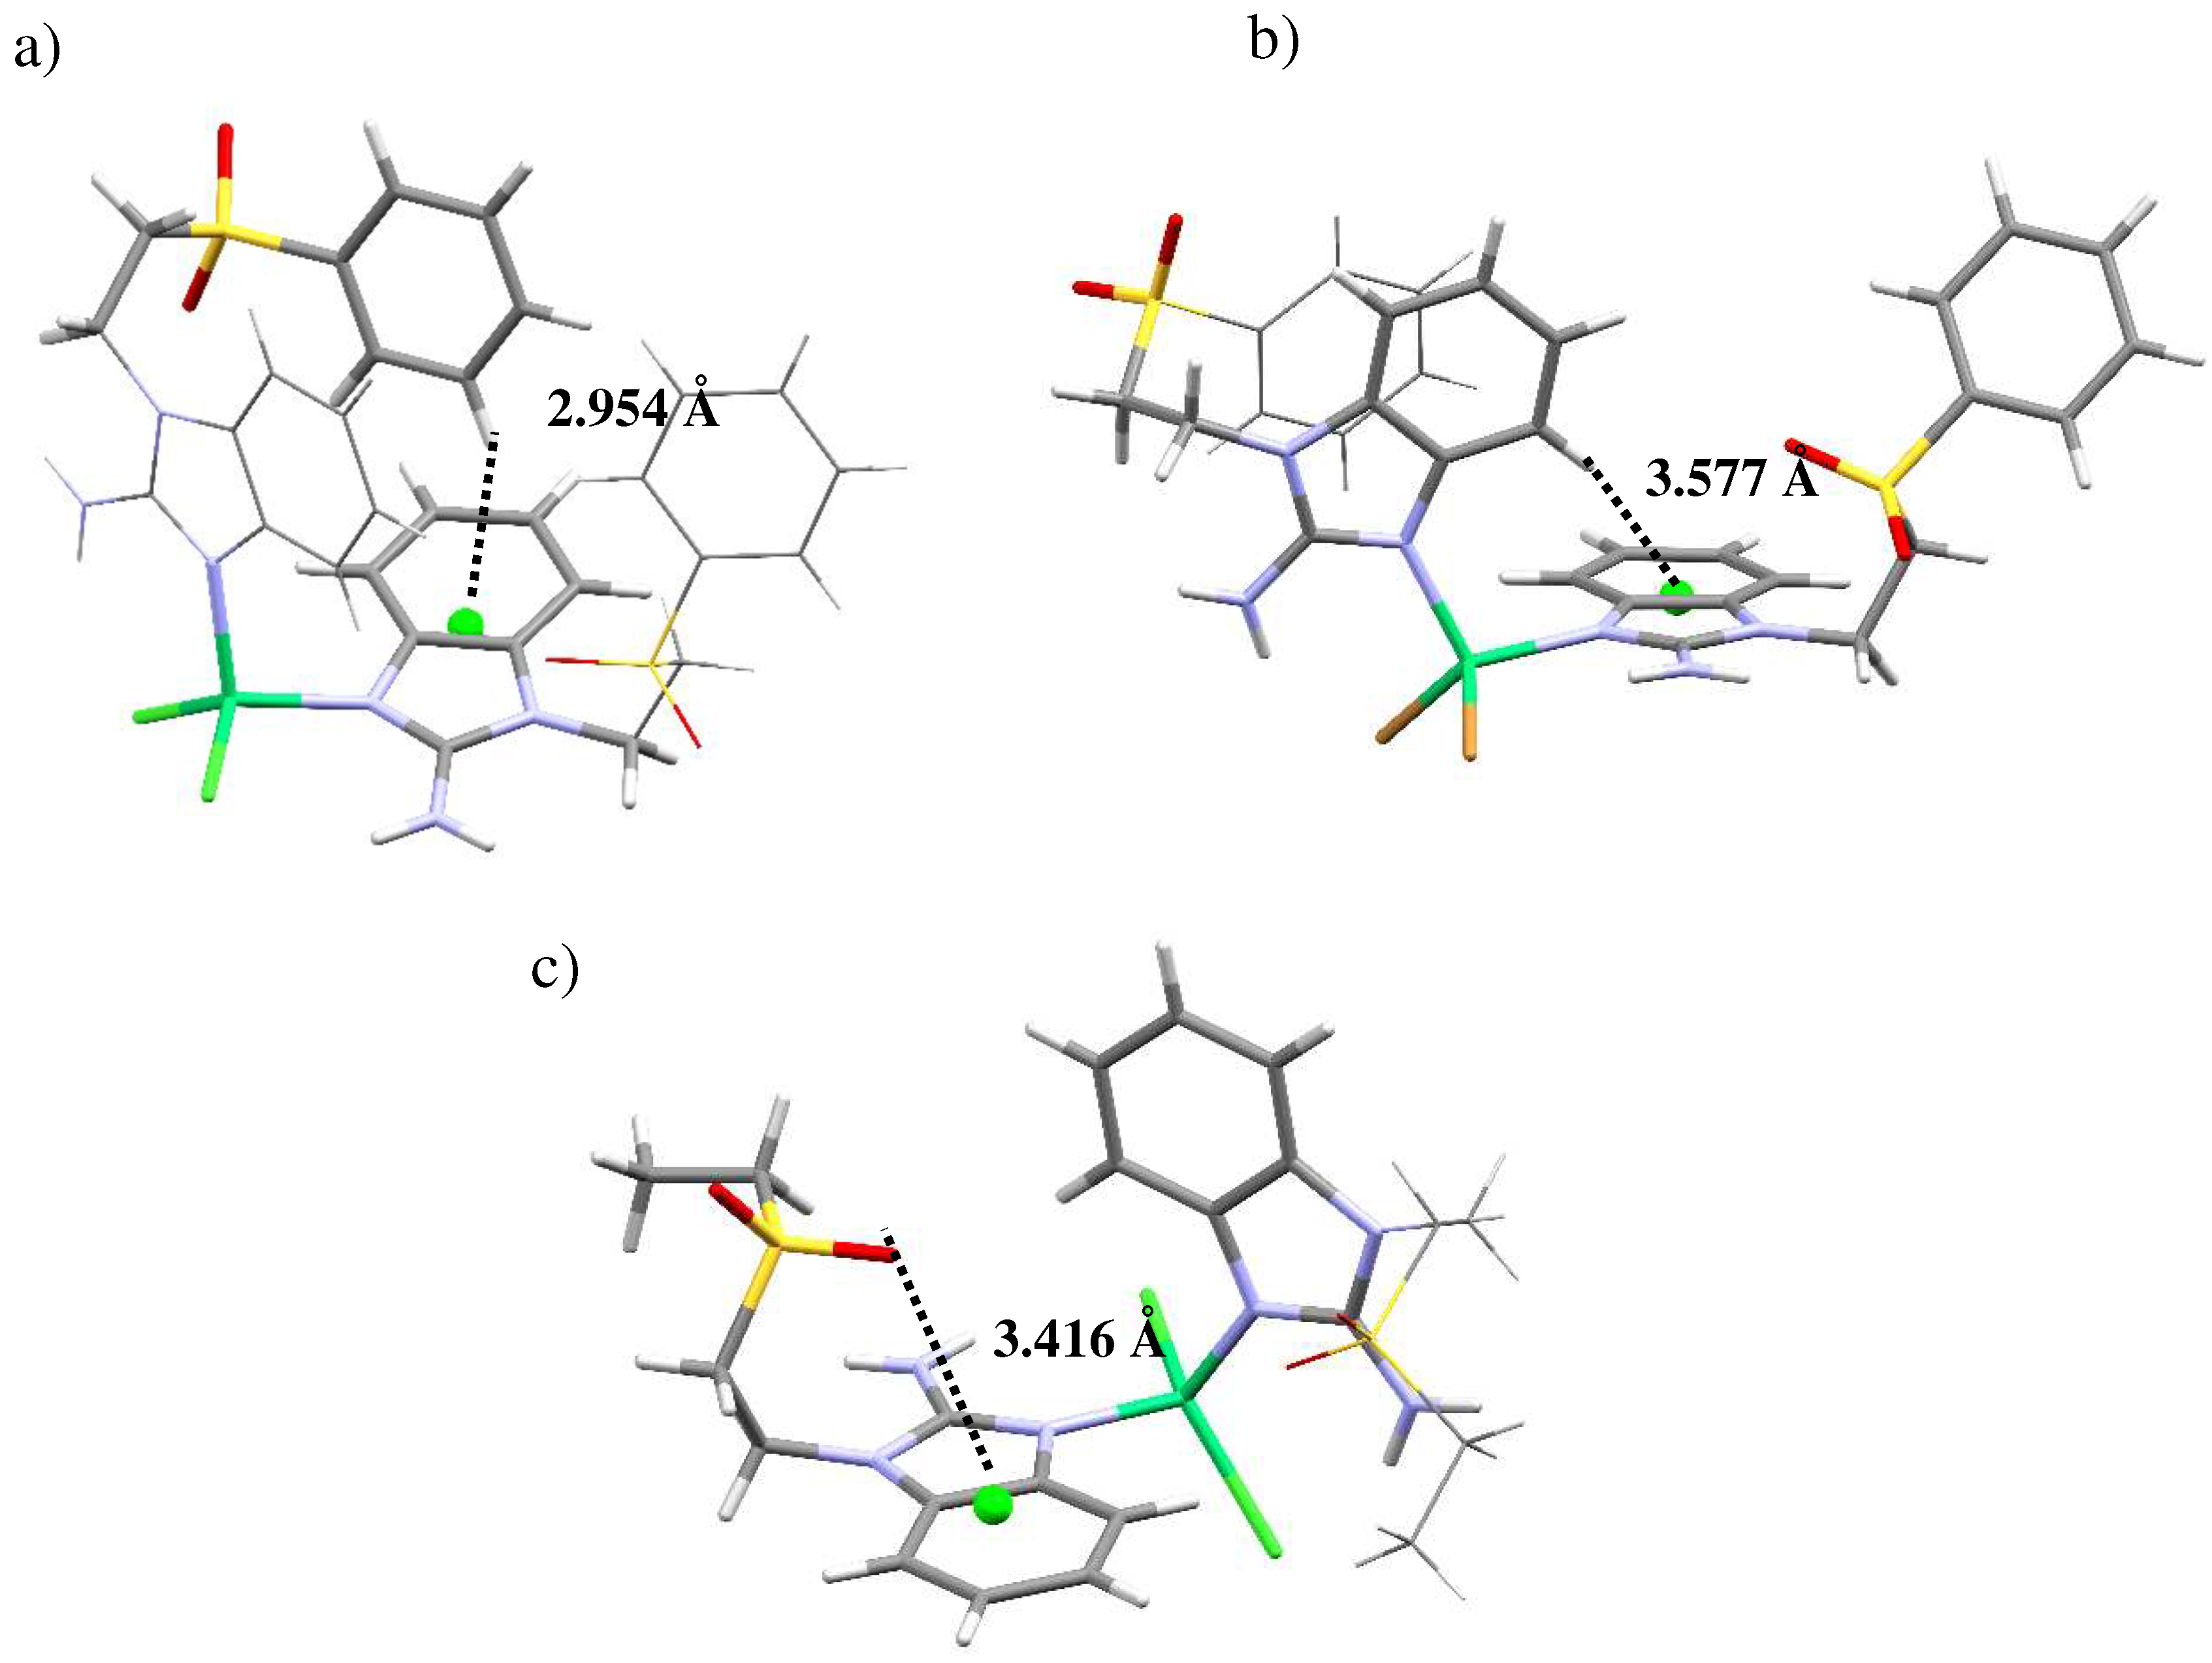
However, the ligands’ terminal group does affect the interactions that each of this compounds present. Even between the two sfabz Ni coordination compounds, different intramolecular contacts are found. The crystal structure for compound 1 (Fig 4a) depicts both ligands in different conformations, one being extended and the other one with both aromatic rings facing each other. In doing so, a H···πbz contact can be found at 2.954 Å. In contrast to the H···πphe interaction observed in the free ligand (vide supra), in the nickel compound this interaction is between two different ligands, where the aromatic rings, acting as donor and acceptor, are reversed giving a H···πbz contact. Compound 2, also a sfabz derivative, shows a similar interaction, between benzimidazolic moieties. The H··· πbz contact (3.577 Å) is shown in Figure 4b. Finally, compound 3, rather than depicting a H···π contact, it depicts a lone pair···π intramolecular interaction between the sulfone group and the benzimidazolic ring (Fig 4c). This interaction is at 3.416 Å and with an angle centroid-N-O of 85.51º, indicative of a strong non-covalent interaction that stabilizes the crystal structure. This emphasizes the importance of the terminal substituent in this type of ligands, when the substituent is a phenyl ring, primarily depicts H···π contacts. Whereas, when it is an ethyl group, this interaction is no longer present giving place to a different interaction, namely, lp···π.
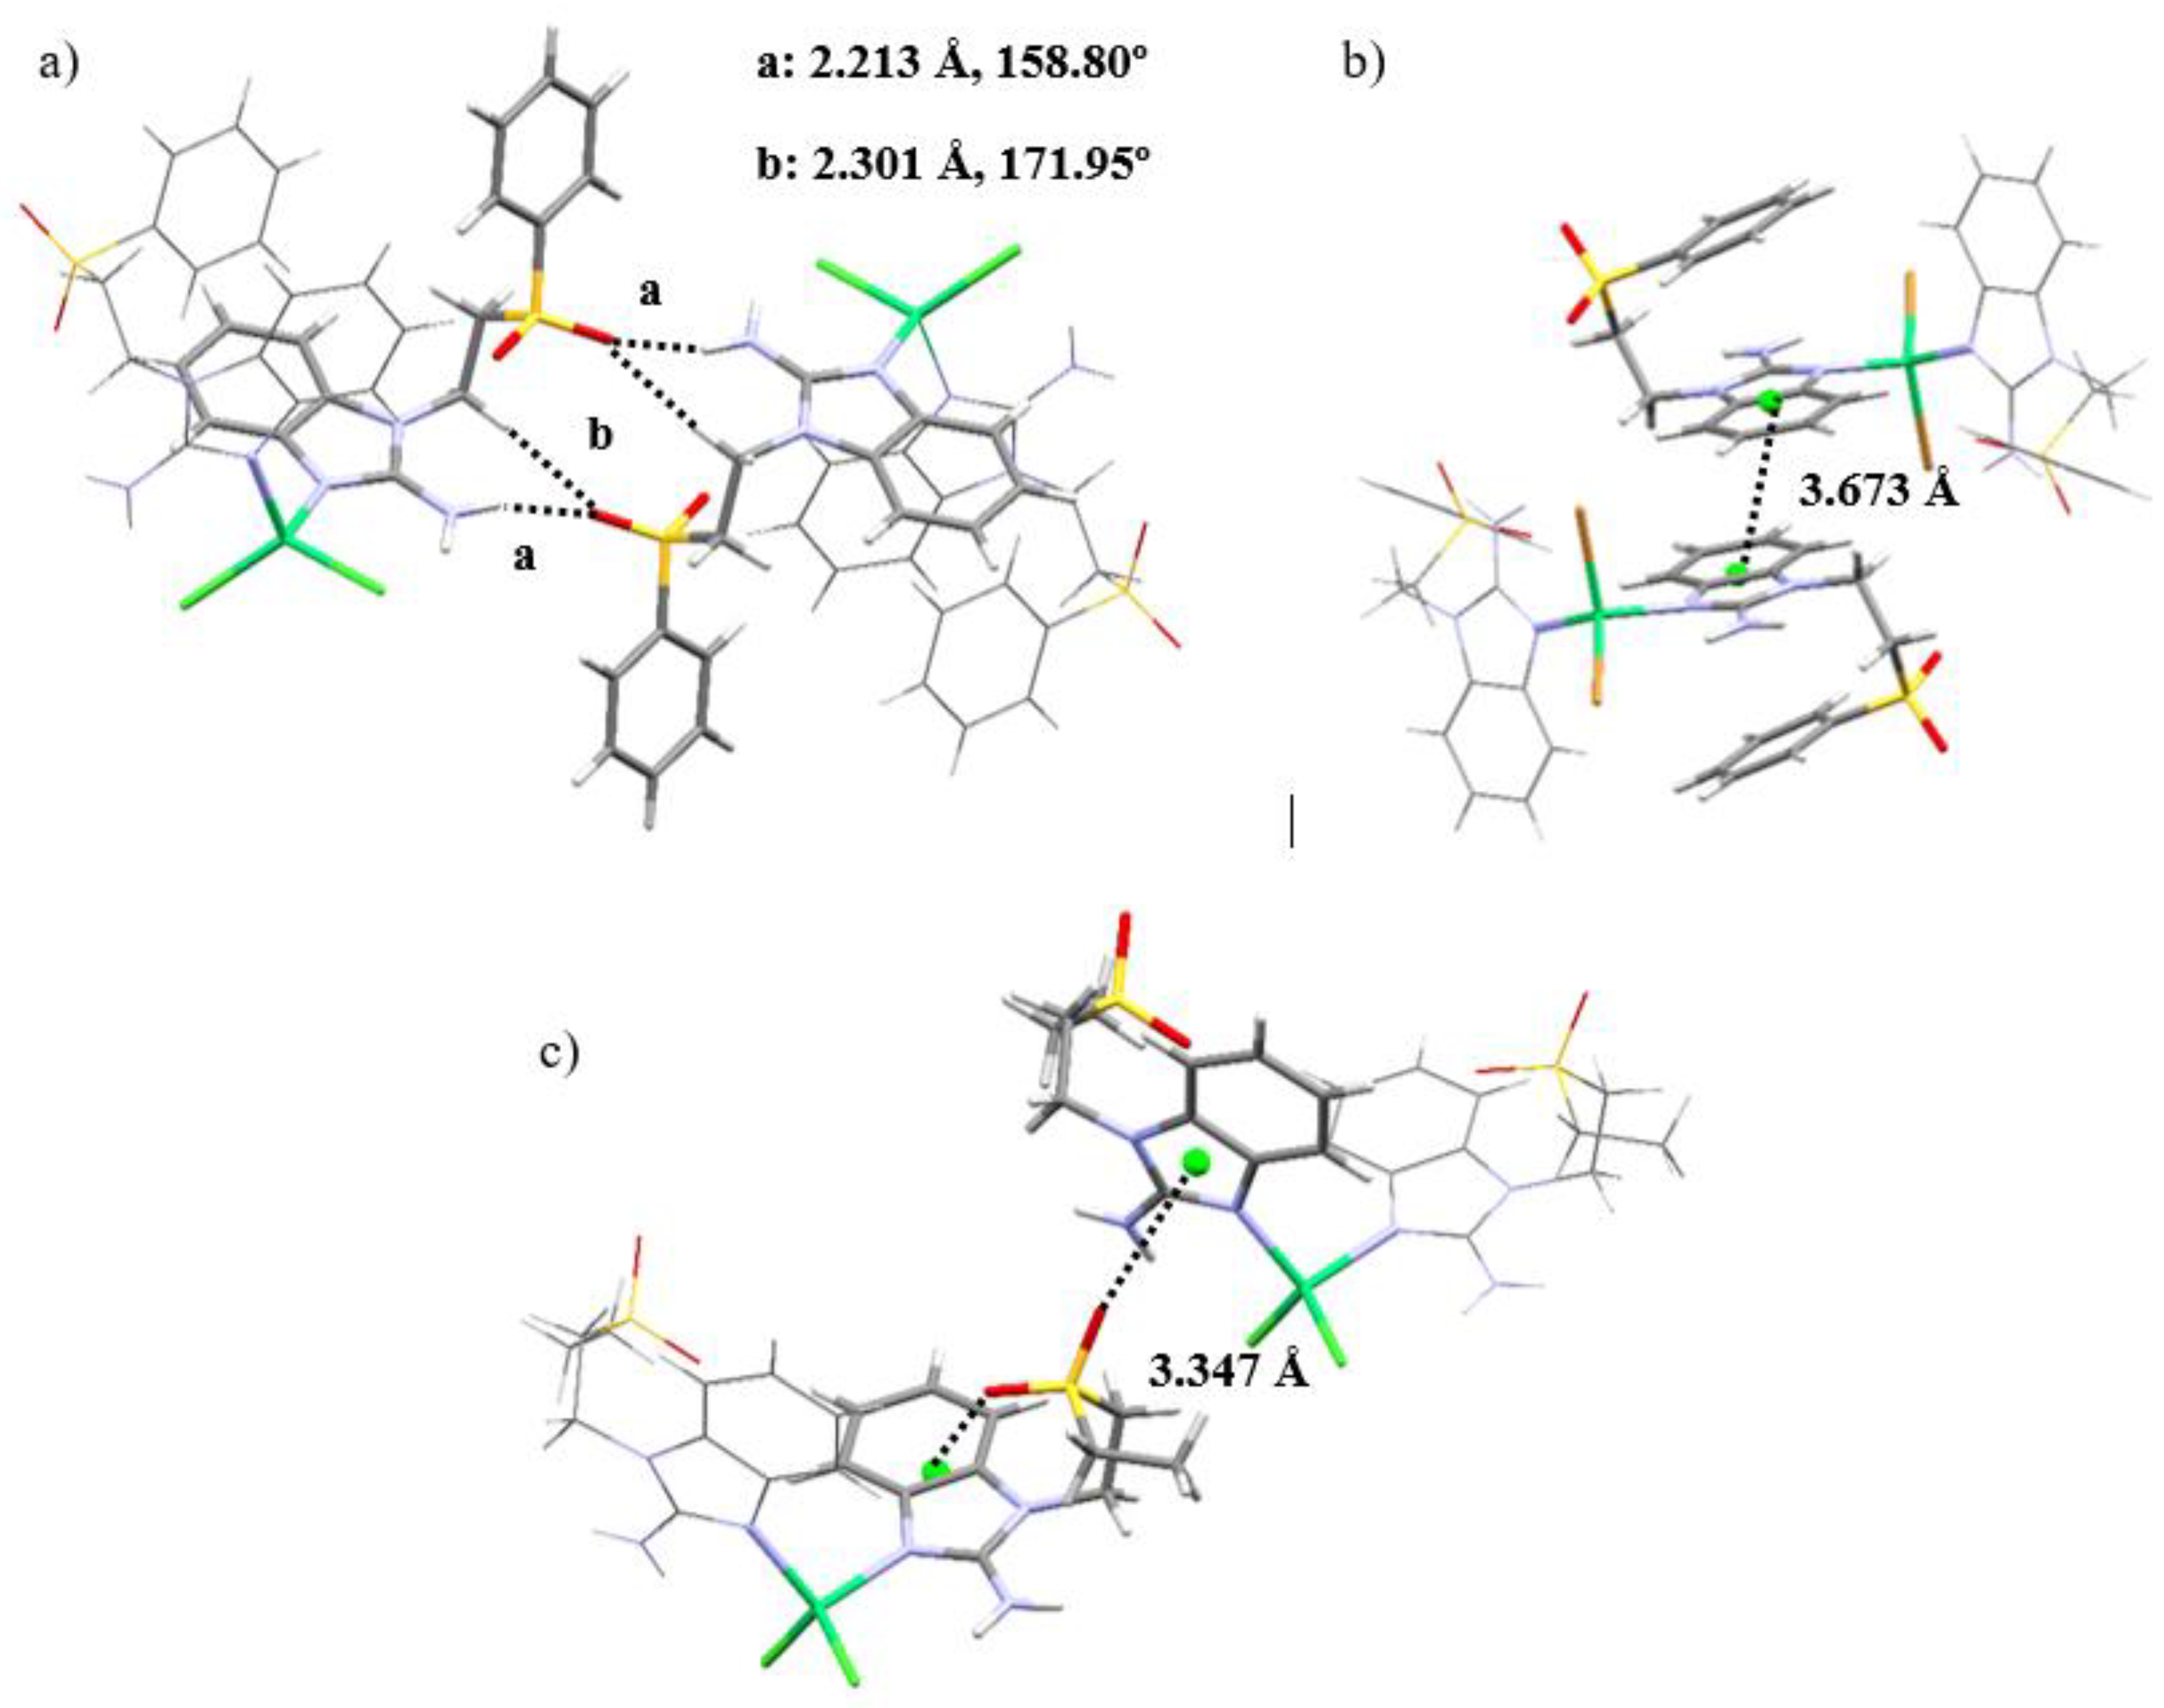
Regarding the intermolecular interactions of these nickel(II) complexes, both sfabz compounds show very different contacts in their crystal structure. Compound 2 depicts a displaced π···π stacking interaction between two benzimidazolic rings at 3.673 Å (centroid-centroid) (Figure 5b). Alternatively, compound 1 shows hydrogen bonds with the amino and a –CH2– group acting as the donor, and an oxygen of the sulfone group as the acceptor (Figure 5a). These differences in intermolecular interactions between these two compounds can be attributed, mainly, to the fact that compound 2 crystalizes with an acetone molecule. Doing a similar analysis with compound 3 with seabz, what seems to be the most important contact is a lone pair···π interaction between S=O and the benzimidazolic ring at 3.347Å and 89.59º, directed towards the center of the imidazolic ring of this molecule (Figure 5c). Interestingly, the other oxygen of the same sulfone group is the one showing the intramolecular lone pair···π interaction (vide supra). This is relevant because in our previous work with alkylsulfonated ligands [24-26], when one oxygen of the sulfone group is depicting such interactions, the other oxygen does not show any other contact, not even weak hydrogen bonds.
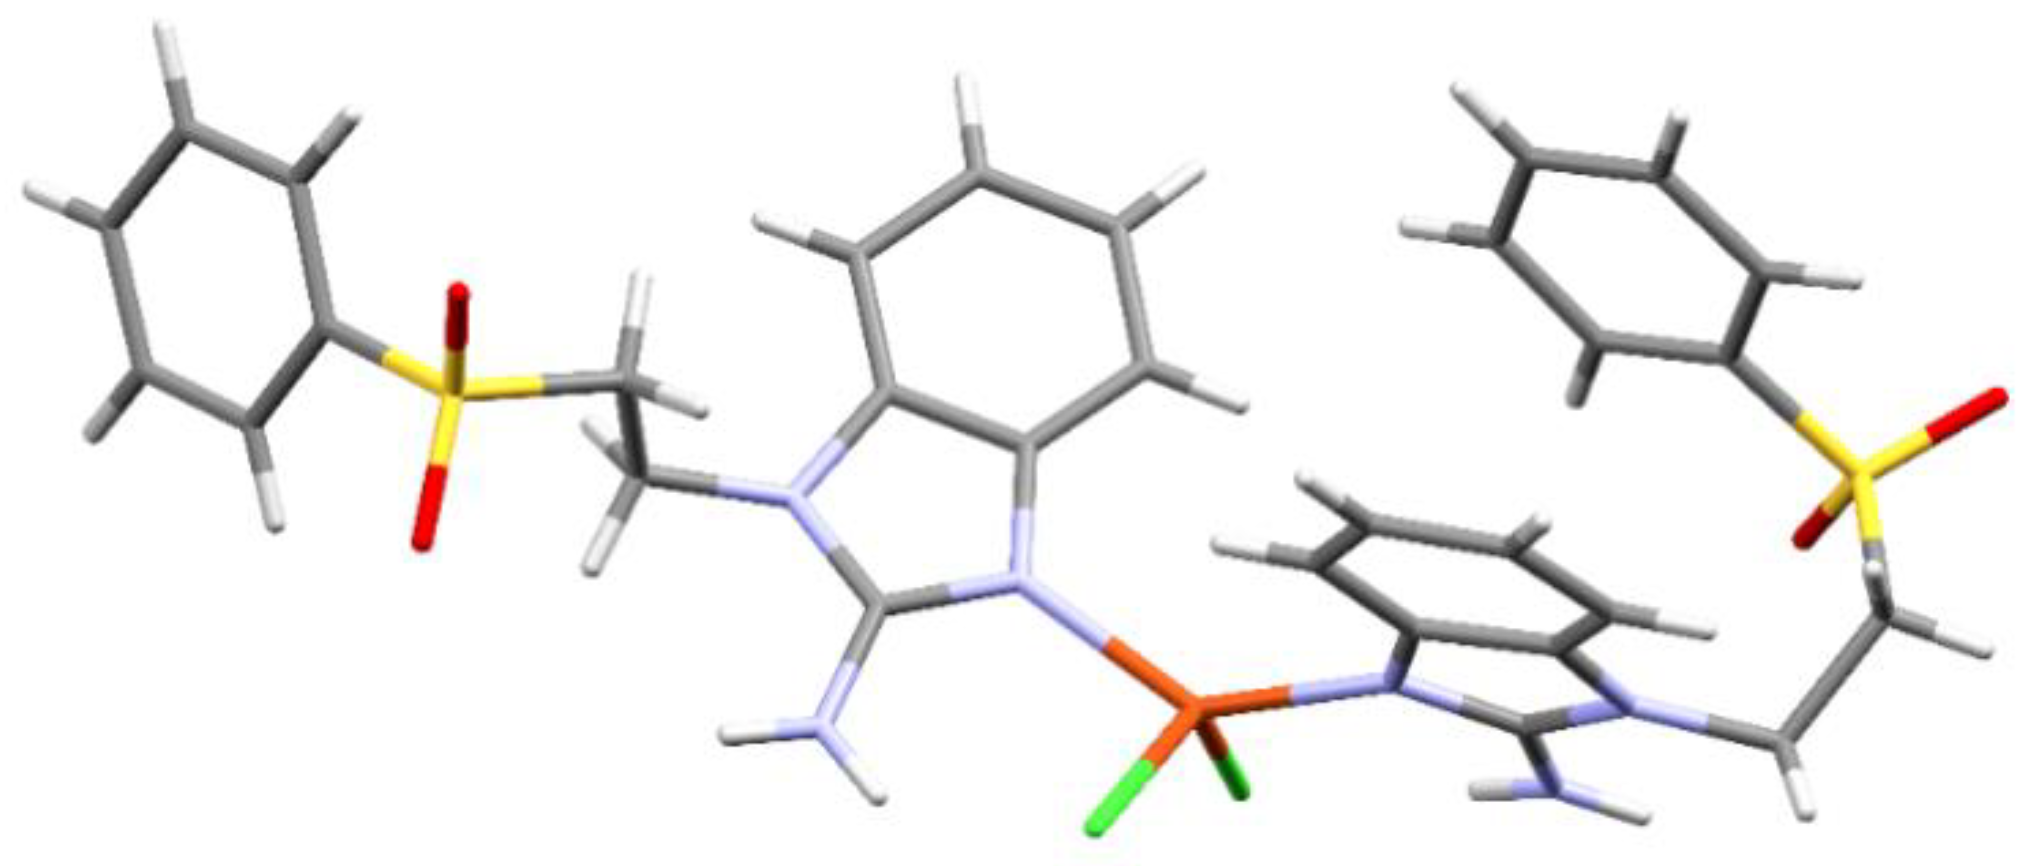
As mentioned above, adequate crystals for X-ray diffraction were easier to obtain with the sfabz ligand. However, the copper(II) complex (compound 5) shows great disorder in one of the sfabz ligands. Regardless, it is still possible to see its connectivity and geometrical features. Compound 5 crystalizes in a P-1 space group, within a triclinic system. Although this compound still stabilizes a tetrahedral geometry, it is more distorted that the nickel and zinc coordination compounds, as its noticeable for its larger N-Cu-N’ angle of 135.54º (Figure 6). No relevant intramolecular contacts could be assigned in this structure, due to the structural disorder.
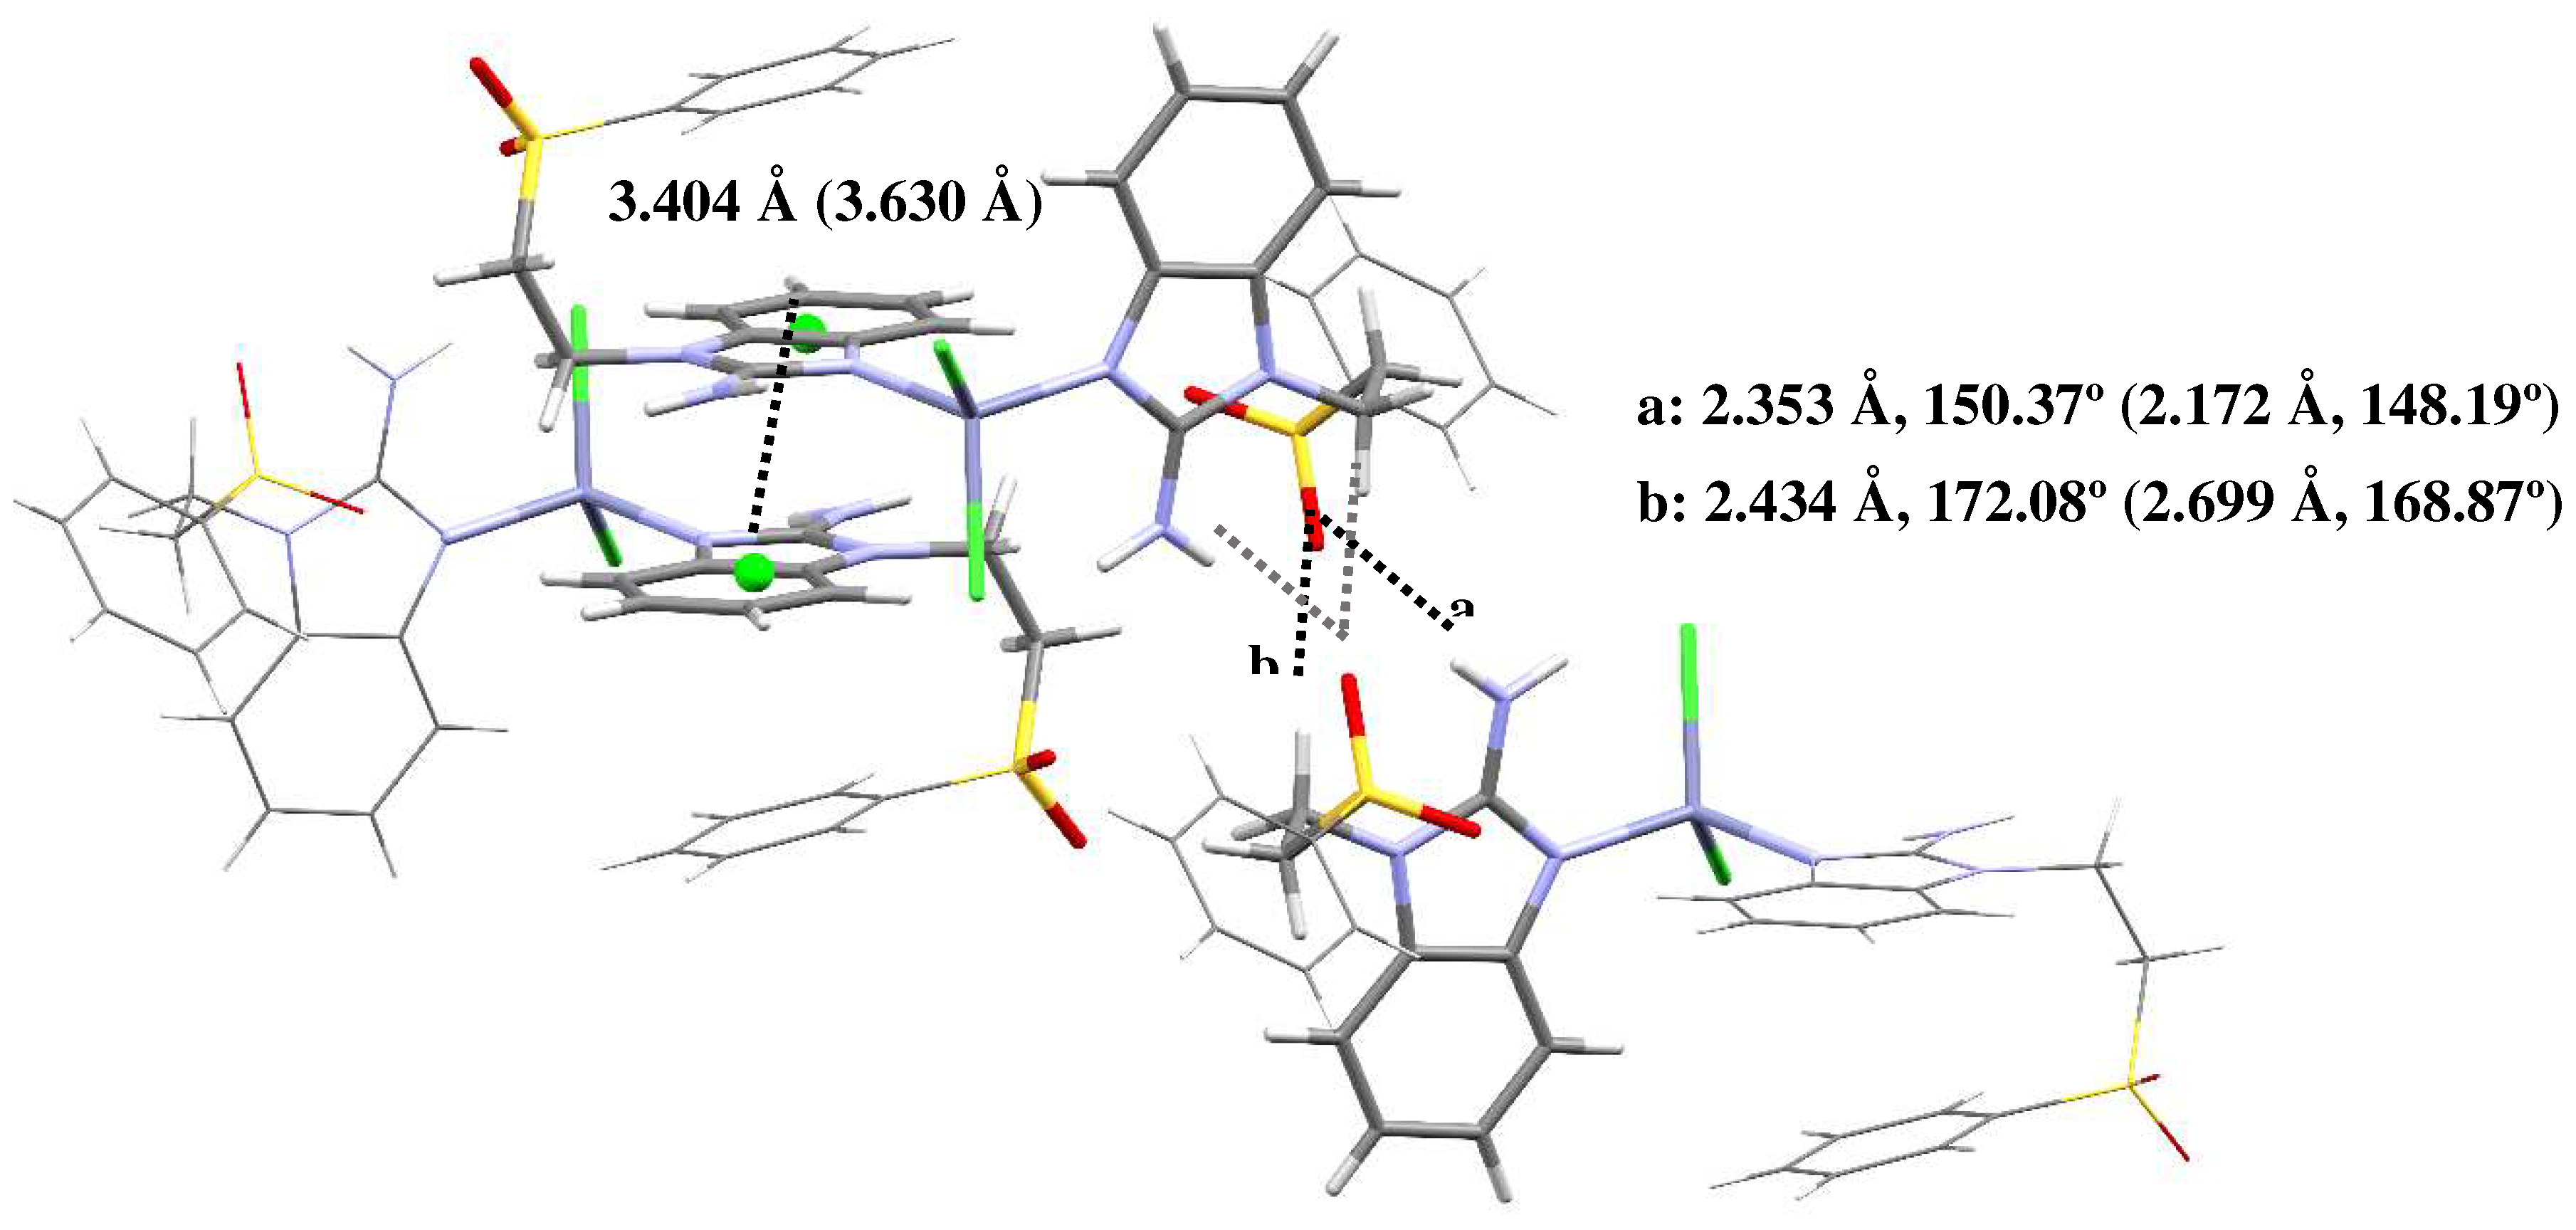
There were obtained two compounds with Zn(II) and sfabz that crystallized in a triclinic system and a P-1 space group. Angles and bond distance around the metal ion are summarize in Table 5. Although compound 10 depicts an acetone molecule in the crystal structure, this doesn´t seem to affect the intramolecular interactions, as both Zn(II) sfabz complexes depict a H···π contact with one benzimidazolic ring acting as the donor, and the other one as de acceptor, with a distance of 3.404 Å for compound 9 and 3.630 Å for compound 10. In contrast to the NiX2 derivatives discussed above, where the crystal structure was either stabilized through either hydrogen bonds with the sulfone or through π stacking between the benzimidazolic rings, compounds 9 and 10, depict both of these interactions at the same time with one neighboring molecule. Figure 7 shows the intermolecular interactions for compound 9, as an example with the relevant angle and distances. The corresponding values for compound 10 can be found in parenthesis in the same Figure.
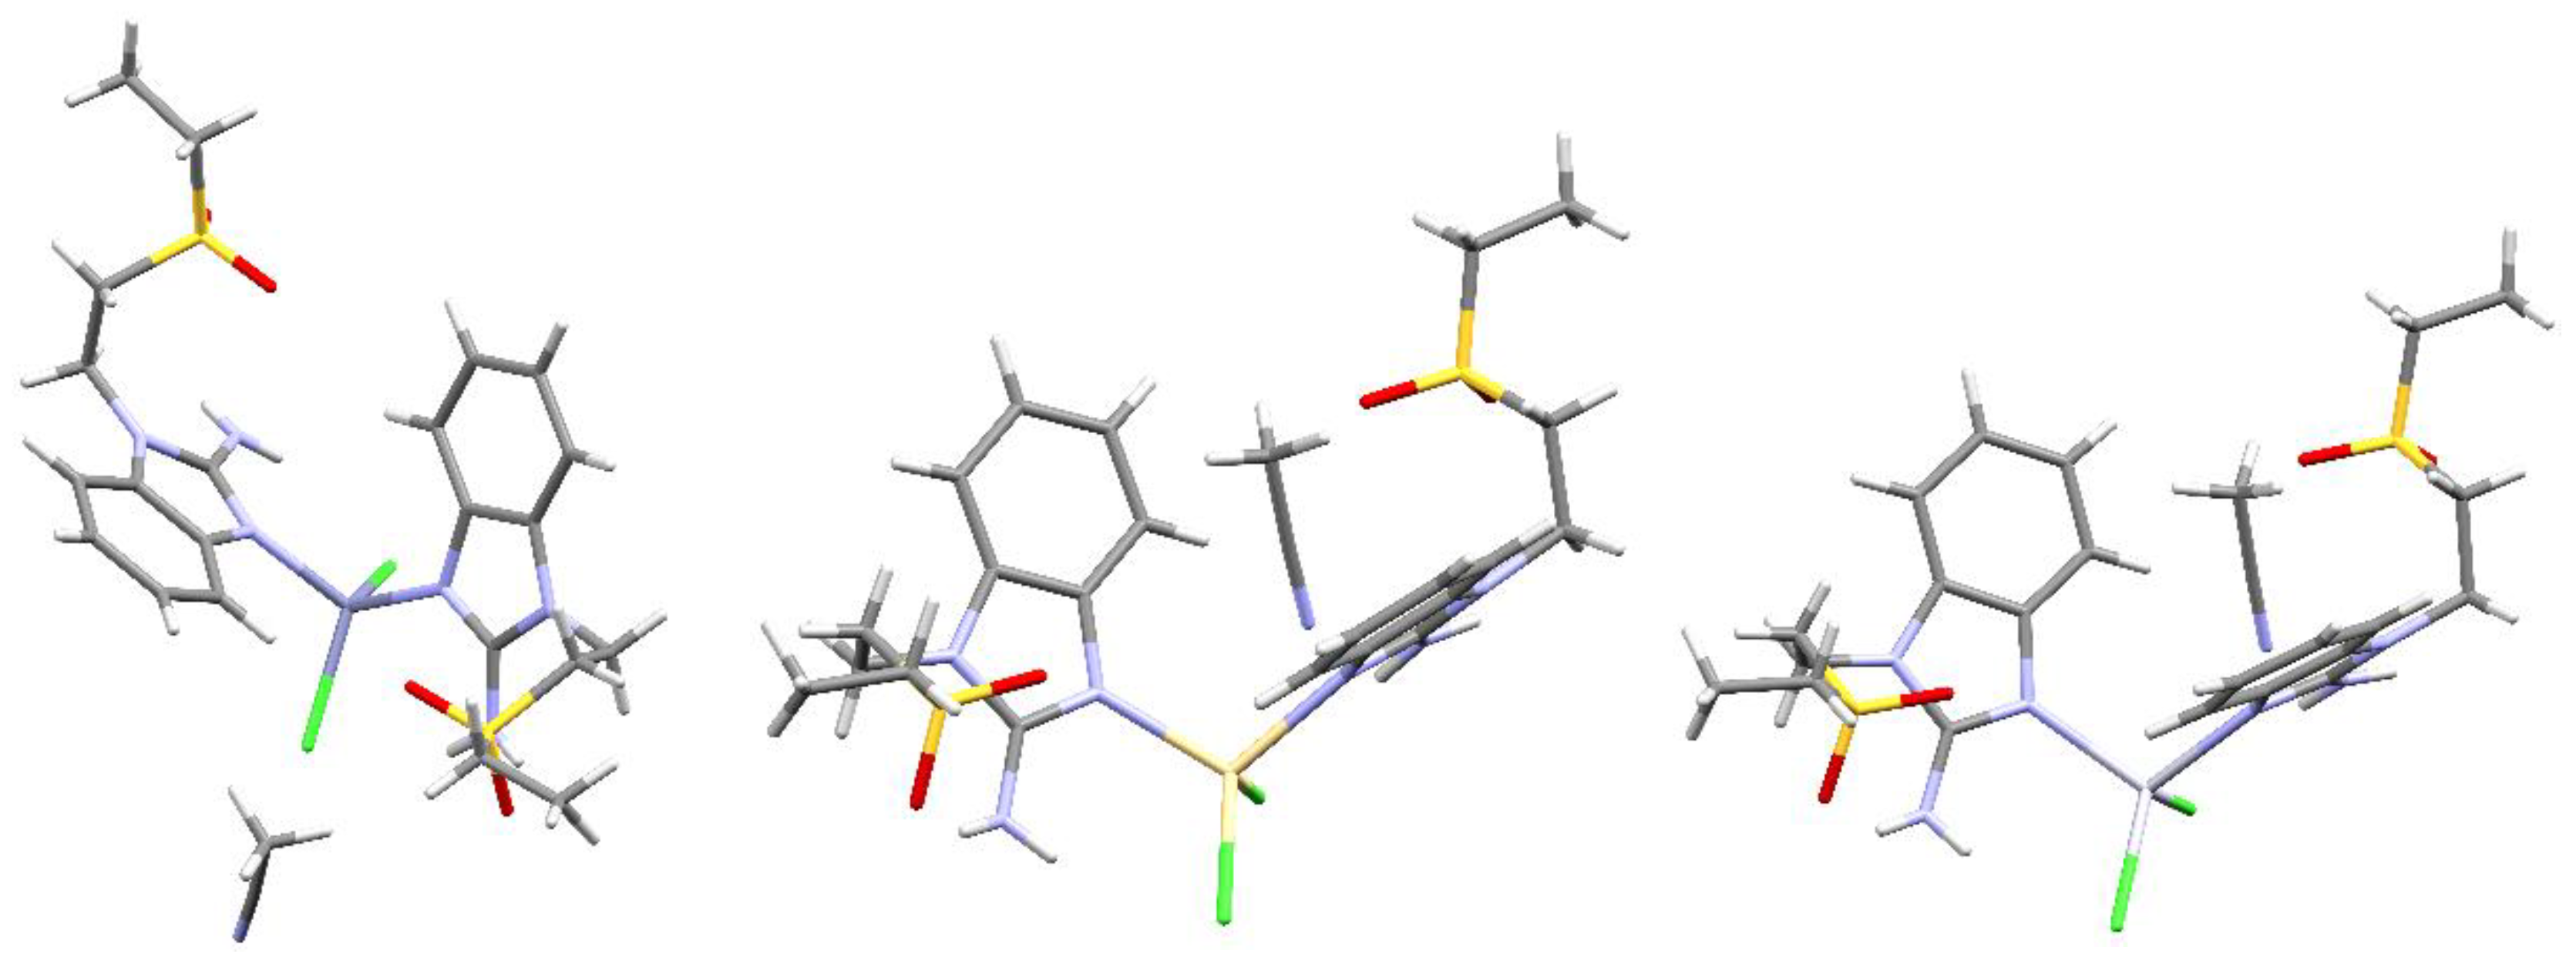
The connectivity and general structure features for compounds 11, 14 and 16 (Zn, Cd and Hg, respectively) are depicted in Figure 8. As the obtained crystals were not adequate to properly obtain their X-ray structure, only general aspects of the compounds can be assessed. Namely, all three compounds depict two alkylsulfone ligands and two halogens, yielding tetracoordinated compounds, a distorted tetrahedral geometry, as seen for all the crystal structures depicted herein. It is noteworthy that, for these three compounds, an acetonitrile molecule is present in the crystal structure. This highlights the importance of the solvent being used for crystallization as, even though some crystal structures depict acetone molecules, this does not affect the quality of the X-ray diffractions obtained. Whereas, using acetontitrile as a solvent introduces disorder and lower-quality crystals are obtained.

3.3. Stability in solution and antiproliferative activity.

The stability in solution of the copper(II) compounds was assessed as described in the methods section of this article. In all cases, the same electronic transitions described above were observed without significant change after a day in solution, indicating that no changes in the geometry or coordination were observed. As the Cu(II) compounds, zinc(II) compounds showed no significant variation in their NMR spectra after the same time period. Both series of compounds were suitable for the biological activity studies.
To determine their antiproliferative activity, a cell-viability assay was carried out with the aforementioned copper(II) and zinc(II) compounds against HeLa (cervix carcinoma), HCT-15 (colorectal adenocarcinoma), MCF-7 (breast adenocarcinoma), A549 (lung adenocarcinoma) and L929 (healthy connective mice tissue).
The IC50 of the compounds were determined and it is presented below (Table 6). As observed in the table, IC50 for both ligands were the highest of all compounds for every cancer cell line, indicating that the ligands alone were not active. In fact, most of the coordination compounds were significantly less active than cis-platinum in most cancer cell lines. Only copper(II) sfabz coordination compounds were active enough to be compared with cis-platinum when tested in the HeLa cell line, being [Cu(sfabz)2Br2] (6) slightly better than the Pt reference compound.
Although only few compounds showed IC50 comparable to cisplatin, there is a visible pattern for the antiproliferative activity of the compounds. Despite the substituent of the benzimidazolic ligand, copper(II) compounds showed higher activity than their zinc(II) homologues. Aditionally, bromo containing compounds were typically more active than their chloro counterparts. Comparing both series of complexes, seabz compounds were substantially less active than the sfabz compounds.
Finally, all compounds were generally less active than cis-platinum towards healthy mice tissue. Giving the selectivity of copper(II) sfabz compounds on cancer cell lines, they are worth further investigation.

Conclusions

Novel sulfone ethyl and phenyl 2-aminobenzimidazole derivatives were designed and synthesized, based on our previous work investigating the relevance of the substituents in heterocyclic ligands into their structural and biological properties. The amino group participates into intramolecular hydrogen bonding giving place to dimeric and tetrameric arrangements of the ligands. Interestingly, the ethyl and phenyl substitution in the alkyl sulfonated chain modify nature of the non-covalent interactions, seabz depicts a lp···πbz while sfabz shows a H···πphe. In their coordination compounds, a tetrahedral geometry was stabilized for all metal ions.
For seafz, most of the coordination compounds presented great disorder in the substituted terminal chain, as a consequence, not suitable crystals for X-ray diffraction were obtained and their molecular connectivity was analyzed. On the other hand, the phenyl substituent of sfabz give place to different interactions allowing the crystallization of compounds with different transition metal ions. In the coordination compounds with sfabz, the presence of the terminal phenyl group induced intramolecular H⋅⋅⋅π interactions, as well as intermolecular π⋅⋅⋅π stacking and hydrogen bonding between the NH2 and the sulfone group. Alternatively, for the nickel(II) compound 3 with seafz, the interactions observed were mainly lp⋅⋅⋅π, both intra and intermolecular.
The antiproliferative activity of all compounds was investigated resulting that two copper(II) sfabz derivatives showed good selectivity towards HeLa cell line, worthy further investigation.

Supplementary Materials

The following supporting information can be downloaded at the website of this paper posted on Preprints.org.

Author Contributions

D. C.-S.: Writing-Original Draft, Investigation, Synthesis, Formal Analysis, Validation; R.C.-R: Writing-Original Draft, Formal Analysis, Validation; F. S.-B. Biological Studies; I. G.-M. Biological Studies, Formal Analysis; N. B.-B.: Conceptualization, Writing and review, Formal Analysis, Resources, Supervision, Funding Acquisition. All authors have read and agreed to the published version of the manuscript.

Data Availability Statement

Crystallographic data were deposited with the Cambridge Crystallo-graphic Data Centre, CCDC, 12 Union Road, Cambridge CB21EZ, UK. These data can be obtained free of charge on quoting the depository numbers CCDC (2292162-2292169) by fax (+44-1223-336-033), email (deposit@ccdc.cam.ac.uk) or their web interface (at http://www.ccdc.cam.ac.uk)

Acknowledgements

Financial support from UNAM, DGAPA (IN206922) and PAIP 5000-9035, is acknowledged. D.C.-S. thanks scholarship from CONACyT (CVU 941567). We thank Patricia Fierro for technical support.

Conflict of interest

The authors declare no conflict of interest.

Supplementary data

Supplementary data to this article can be found online

References

  1. R. A. Alderden, M. D. Hall, T. W. Hambley, J. Chem. Educ., 83 (2006), 728 –734.
  2. Y. Wang, X. Wang, J. Wang, Y. Zhao, W. He, Z. Guo, Inorg. Chem., 50 (2011), 12661-12668.
  3. Y. Qu, R. G. Kipping, N. P. Farrell, Dalton Trans., 44 (2015), 3563-3572.
  4. R. P. Miller, R. K. Tadagavadi, G. Ramesh, W. B. Reeves, Toxins, 2 (2010), 2490–2518.
  5. G. Laurell, U. Jungnelius, Laryngoscope, 100 (1990), 724–734.
  6. P.C.A. Bruijnincx, P.J. Sadler, Curr. Opin. Chem. Biol., 12 (2008), 197–206.
  7. D. Hernández-Romero, S. Rosete-Luna, A. López-Monteon, A. Chávez-Piña, N. Pérez-Hernández, J. Marroquín-Flores, A. Cruz-Navarro, G. Pesado-Gómez, D. Morales-Morales, R. Colorado-Peralta, Coord. Chem. Rev., 439 (2021), 213930-213981.
  8. A. Erxleben, Coord. Chem. Rev. 360 (2018), 92-121.
  9. Erxleben, Chimia, 71 (2017) 102-111.
  10. M.A. Zoroddu, J. Aaseth, G. Crisponi, S. Medici, M. Peana, V.M. Nurchi, J. Inorg. Biochem., 195 (2019), 120-129.
  11. B.J. Pages, D.L. Ang, E.P. Wright, J.R. Aldrich-Wright, Dalton Trans. 44 (2015), 3505-3526.
  12. P. Zhou, J. Huang, F. Tian, Curr. Med. Chem., 19 (2012), 226-238.
  13. J.P. Lu, X.H. Yuan, H. Yuan, W.L. Wang, B. Wan, S.G. Franzblau, Q.Z. Ye, Chem. Med. Chem., 6 (2011), 1041-1048.
  14. J.P. Lu, X.H. Yuan, Q.Z. Ye, Eur. Jour. Med. Chem., 47 (2012), 479-484.
  15. S.U. Rehman, T. Sarwar, M.A. Husain, H.M. Ishqi, M. Tabish, Arch. Biochem. Biophys., 576 (2015), 49-60.
  16. S. Burge, G.N. Parkinson, P. Hazel, A.K. Todd, S. Neidle, Nucleic Acids Res., 34(19) (2006), 5402-5415.
  17. J.E. Reed, A.A. Arnal, S. Neidle, R. Vilar, J. Am. Chem. Soc., 128(18) (2016), 5992-5993.
  18. L. Sabater, P.J. Fang, C.F. Chang, A. De Rache, E. Prado, J. Dejeu, A. Garofalo, J.H. Lin, J.L. Mergny, E. Defrancq, G. Pratviel, Dalton Trans., 44 (2015), 3701-3707.
  19. V.S. Stafford, K. Suntharalingam, A. Shivalingam, A.J.P. White, D.J. Mann, R. Vilar, Dalton Trans., 44 (2015), 3686-3700.
  20. P. Gratteri, L. Massari, E. Michelucci, R. Rigo, L. Messori, M.A. Cinellu, C. Musetti, C. Sissi, C. Bazzicalupi, Dalton Trans., 44 (2015), 3633-3639.
  21. J. Malina, N.P. Farrell, V. Brabec, Inorg. Chem., 53(3) (2014), 1662-1671.
  22. R. Navarro-Peñaloza, B. Landeros-Rivera, H. López-Sandoval, R. Castro-Ramírez, N. Barba-Behrens, Coord. Chem. Rev., 494 (2023), 215360.
  23. I. Alfaro-Fuentes, H. López-Sandoval, E. Mijangos, A.M. Duarte-Hernández, G. Rodríguez-López, M.I. Bernal-Uruchurtu, R. Contreras, A. Flores-Parra, N. Barba-Behrens, Polyhedron, 67 (2014), 373-380.
  24. I. Alfaro-Fuentes, R. Castro-Ramírez, N. Ortiz-Pastrana, R.M. Medina-Guerrero, L.C. Soler-Jiménez, I. Martínez-Rodríguez, M. Bethancourt-Lozano, L. Ibarra-Castro, N. Barba-Behrens, E.J. Fajer-Ávila, J. Inorg. Biochem., 176 (2017), 159-167.
  25. R. Castro-Ramírez, N. Ortiz-Pastrana, A.B. Caballero, M.T. Zimmermann, B.S. Stadelman, A.A.E. Gaertner, J.L. Brumaghim, L. Korrodi-Gregório, R. Pérez-Tomás, P. Gamez, N. Barba-Behrens, Dalton Trans., 47 (2018), 7551-7560.
  26. L.G. Ramírez-Palma, R. Castro-Ramírez, L. Lozano-Ramos, R. Galindo-Murillo, N. Barba-Behrens, F. Cortés-Guzmán, Dalton Trans., 52 (2023), 2087–2095.
  27. S. Betanzos-Lara, C. Gómez-Ruiz, L.R. Barrón-Sosa, I. Gracia-Mora, M. Flores-Álamo, N. Barba-Behrens, J. Inorg. Biochem., 114 (2012), 82-93.
  28. S. Betanzos-Lara, N. P. Chmel, M. T. Zimmerman, L. R. Barron-Sosa, L. Salassa, A. Rodger, J. Brumaghim, I. Gracia-Mora and N. Barba-Behrens, Dalton Trans., 44(2015), 3673-3685.
  29. X.J. Zhao, J. Li, B. Ding, X.G. Wang, E.C. Yang, Inorg. Chem. Comm., 30 (2007), 605-609.
  30. A. Esparza-Ruiz, A. Peña-Hueso, E. Mijangos, G. Osorio-Monreal, H. Nöth, A. Flores-Parra, R. Contreras, N. Barba-Behrens, Polyhedron, 30 (2011), 2090-2098.
  31. G. Durán-Solares, W. Fugarolas-Gómez, N. Ortíz-Pastrana, H. López-Sandoval, T. O. Villaseñor-Granados, A. Flores-Parra, P. J. Altmann, N. Barba-Behrens, J. Coord. Chem., 71 (2018), 1953-1958.
  32. G.M. Sheldrick, Acta Crystallogr., Sect. A: Found. Crystallogr., 64 (2008), 112.
  33. R.C. Clark and J. S. Reid, Acta Crystallogr., Sect. A: Found. Crystallogr., 51 (1995), 887.
  34. C.B. Hübschle, G.M. Sheldrick, B. Dittrich, J. Appl. Crystallogr., 44 (2011), 1281–1284.
  35. E.A. Orellana, A. L. Kasinski, Bio-protocol, 6.21 (2016), e1984-e1984.
  36. S. Sudha, M. Karabacak, M. Kurt, M. Cinar, N. Sundaraganesan, Spectrochim. Acta - Part A Mol. Biomol. Spectrosc., 84 (2011), 184–195.
  37. A.B.P., Lever, J. Chem. Ed., 45(11) (1968), 711-712.
  38. G. Gliemann, Y. Wang, The Ligand Field Concept, 3rd. ed., Encyclopedia of Physical Science and Technology, 2003, pp. 523–538.
  39. A.B.P. Lever, Inorganic Electronic Spectroscopy, Elsevier, Amsterdam, 1984.
  40. R. Navarro-Peñaloza, A.B. Vázquez-Palma, H. López-Sandoval, F. Sánchez-Bartéz, I. Gracia-Mora, N. Barba-Behrens, J. Inorg. Biochem., 219 (2021), 111432.
Figure 1. NMR number assignation for a) sfabz and b) seabz.
Preprints 84576 g001
Figure 2. Crystal structure and intramolecular interactions of a) seabz with a lp···πbz and b) sfabz with a H···πphe. ORTEP ellipsoids at 50% probability.
Preprints 84576 g002
Figure 3. Intermolecular hydrogen bonds forming a) a sfabz dimer and b) seabz tetramer.
Preprints 84576 g003
Figure 4. Intramolecular interactions for a) [Ni(sfabz)2Cl2], depicting a H···πbz, b) [Ni(sfabz)2Br2], depicting a H···πbz and c) [Ni(seabz)2Cl2], depicting a lp···πbz.
Preprints 84576 g004
Figure 5. Intermolecular interactions for [Ni(sfabz)2Cl2], depicting a hydrogen bonding, b) [Ni(sfabz)2Br2], depicting π stacking and c) [Ni(seabz)2Cl2], depicting both intra and inter lp···πbz. .
Preprints 84576 g005
Figure 6. Crystal structure for compound [Cu(sfabz)2Cl2].
Preprints 84576 g006
Figure 7. Intermolecular interactions between three neighboring molecules of [Zn(sfabz)2Cl2].
Preprints 84576 g007
Figure 8. Structural connectivity for compounds left to right: [Zn(seabz)2Cl2], [Cd(seabz)2Cl2] and [Hg(seabz)2Cl2].
Preprints 84576 g008
Table 1. Electronic transitions and assignations for the nickel(II) and copper(II) compounds.
Compound ν1: 4T2(F)4A2 ν2: 4T1(F)4A2 ν3: 4T1(P)4A2 μeff (B.M.)
[Ni(sfabz)2Cl2] (1) 5241 cm-1 9257 cm-1 16993 cm-1 3.85
[Ni(sfabz)2Br2] (2) 5143 cm-1 9778 cm-1 16135 cm-1 3.91
[Ni(seabz)2Cl2] (3) 5423 cm-1 10250 cm-1 16690 cm-1 3.60
[Ni(seabz)2Br2] (4) 5312 cm-1 10096 cm-1 16454 cm-1 3.64
Compound ν1: T2←Esolid state ν1: T2←EDMSO solution --- μeff (B.M.)
[Cu(sfabz)2Cl2] (5) 11000 cm-1 11049 cm-1 (905 nm) --- 1.88
[Cu(sfabz)2Br2] (6) 8670 cm-1 11481 cm-1 (871 nm) --- 1.91
[Cu(seabz)2Cl2] (7) 9506 cm-1 10989 cm-1 (910 nm) --- 2.15
[Cu(seabz)2Br2] (8) 8526 cm-1 11521 cm-1(868 nm) --- 2.16
Table 2. Values of Δδ for the 1H-NMR data. (N.S.=Not significant).
Position sfabz series (Zn/Cd/Hg) seabz series (Zn/Cd/Hg)
Δδ (ppm) Effect Δδ (ppm) Effect
H4 0.16/0.17/0.17 deshielding 0.13/0.21/0.17 deshielding
H5 0.05/N.S./0.09 deshielding 0.11/0.10/0.14 deshielding
H6 0.13/0.06/0.15 deshielding 0.08/N.S./0.09 deshielding
H7 0.18/0.08/0.20 deshielding 0.13/0.08/0.14 deshielding
H10 0.78/0.32/0.69 deshielding 0.84/0.38/0.65 deshielding
H11 0.12/N.S./0.11 deshielding 0.11/N.S./0.08 deshielding
H12 0.09/N.S./0.09 deshielding 0.09/N.S./0.06 deshielding
Table 3. Values of Δδ for the 13C-NMR data.
Position sfabz series (Zn/Cd/Hg) seabz series (Zn/Cd/Hg)
Δδ (ppm) Effect Δδ (ppm) Effect
C2 0.1/0.2/0.2 deshielding 0.1/0.1/0.2 deshielding
C4 0.7/0.2/0.9 Zn, Hg deshieldingCd shielding 0.8/0.2/0.8 Zn, Hg deshieldingCd shielding
C5 1.1/0.4/1.1 deshielding 1.2/0.5/1.0 deshielding
C6 2.0/1.0/1.9 deshielding 2.0/1.1/1.8 deshielding
C7 1.3/0.5/1.4 deshielding 1.2/0.6/1.1 deshielding
C8 1.6/0.8/1.4 shielding 1.6/0.9/1.3 shielding
C9 3.9/2.0/3.7 shielding 4.4/2.5/3.4 shielding
C11 0.3/0.1/0.5 deshielding 0.2/0.1/0.3 deshielding
C12 0.6/0.3/0.7 shielding 0.6/0.3/0.5 shielding
Table 4. Angles and distances around the metal ion for compounds 1, 2 and 3.
Compound Angle Degrees (º) Bond Distance (Å)
[Ni(sfabz)2Cl2] (1) N-Ni-N’ 102.0(1) Ni-Cl 2.233(9)
N-Ni-Cl 107.91(9) Ni-Cl’ 2.258(1)
N-Ni-Cl’ 106.21(9) Ni-N 1.987(3)
N’-Ni-Cl 111.73(9) Ni-N’ 1.979(3)
N’-Ni-Cl’ 106.22(9)
Cl-Ni-Cl’ 121.06(3)
[Ni(sfabz)2Br2] (2) N-Ni-N’ 107.94(8) Ni-Br 2.392(4)
N-Ni-Br 109.49(6) Ni-Br’ 2.414(4)
N-Ni-Br’ 103.65(6) Ni-N 1.975(2)
N’-Ni-Br 112.06(6) Ni-N’ 1.969(2)
N’-Ni-Br’ 109.12(6)
Br-Ni-Br’ 114.09(2)
[Ni(seabz)2Cl2] (3) N-Ni-N’ 102.00(1) Ni-Cl 2.256(10)
N-Ni-Cl 109.09(8) Ni-Cl’ 2.282(9)
N-Ni-Cl’ 108.79(8) Ni-N 1.967(2)
N’-Ni-Cl 107.95(8) Ni-N’ 1.974(3)
N’-Ni-Cl’ 107.22(8)
Cl-Ni-Cl’ 120.25(3)
Table 5. Angles and distances around the metal ion for compounds 9 and 10.
Compound Angle Degrees (º) Bond Distance (Å)
[Zn(sfabz)2Cl2] (9) N-Zn-N’ 108.78(1) Zn-Cl 2.244(2)
N-Zn-Cl 106.71(1) Zn-Cl’ 2.285(2)
N-Zn-Cl’ 111.63(1) Zn-N 1.996(3)
N’-Zn-Cl 115.17(1) Zn-N’ 1.989(4)
N’-Zn-Cl’ 106.72(1)
Cl-Zn-Cl’ 107.91(5)
[Zn(sfabz)2Br2] (10) N-Zn-N’ 111.07(1) Zn-Br 2.399(6)
N-Zn-Br 110.34(9) Zn-Br’ 2.430(6)
N-Zn-Br’ 106.04(9) Zn-N 1.999(3)
N’-Zn-Br 110.89(9) Zn-N’ 1.992(3)
N’-Zn-Br’ 109.85(9)
Br-Zn-Br’ 108.52(2)
Table 6. IC50 values of the copper(II) and zinc(II) compounds for all the cell lines.
HCT-15 IC50 (μM) MCF-7 IC50 (μM) HeLaIC50 (μM) A549IC50 (μM) L929IC50 (μM)
Sfabz 395.4 406.4 386.3 360.4 352.5
[Cu(sfabz)2Cl2] (5) 161.3 136.6 29.8 153.6 148.3
[Cu(sfabz)2Br2] (6) 133.9 118.6 15.0 135.5 122.5
[Zn(sfabz)2Cl2] (9) 140.1 148.5 144.7 170.8 140.9
[Zn(sfabz)2Br2] (10) 144.8 130.2 189.8 140.6 137.4
Seabz 898.6 496.7 748.0 1311.8 2364.9
[Cu(seabz)2Cl2] (7) 168.8 147.3 109.7 166.9 176.7
[Cu(seabz)2Br2] (8) 159.9 139.1 142.0 163.0 147.2
[Zn(seabz)2Cl2] (11) 184.2 163.6 194.0 176.9 166.3
[Zn(seabz)2Br2] (12) 167.8 160.8 167.3 266.3 150.8
cisplatin 32.7 32.3 19.0 34.9 43.2
Disclaimer/Publisher’s Note: The statements, opinions and data contained in all publications are solely those of the individual author(s) and contributor(s) and not of MDPI and/or the editor(s). MDPI and/or the editor(s) disclaim responsibility for any injury to people or property resulting from any ideas, methods, instructions or products referred to in the content.
Copyright: This open access article is published under a Creative Commons CC BY 4.0 license, which permit the free download, distribution, and reuse, provided that the author and preprint are cited in any reuse.
Prerpints.org logo

Preprints.org is a free preprint server supported by MDPI in Basel, Switzerland.

Subscribe

© 2024 MDPI (Basel, Switzerland) unless otherwise stated