
Submitted:
09 September 2023
Posted:
12 September 2023
You are already at the latest version
Abstract
In Saudi Arabia’s mountainous regions, debris flow is a natural hazard that poses a threat to infrastructure and human lives. To assess the potential zones of debris flow in the Al-Hada Road area, a study was conducted using Geographic Information System (GIS) analysis and remote sensing (RS) data. The study took into account various factors that could affect debris flow, such as drainage density, elevation, slope, precipitation, land use, geology, soil, and aspect. The study also included a field trip to identify 11 previous debris flow events that were influenced by high-density drainage and slope. The study utilized weighted overlay analysis in a GIS environment to create a map indicating the potential debris flow zones in the area. According to the analysis, low-risk areas cover 35,354,062.5 square meters, medium-risk areas cover 60,646,250 square meters, and high-risk zones cover an area of 8,633,281 square meters. This result was verified using the locations of previous debris flow events. The study’s findings can help planners and decision-makers identify and prioritize areas for mitigation and prevention measures. Additionally, the study contributes to understanding debris flow hazards in arid and semi-arid regions.
Keywords:
debris flow
; remote sensing
; Geographic Information System
; weighted overlay analysis
; Saudi Arabia
1. Introduction
In areas with mountainous terrain, landslides are a natural disaster that can cause significant damage and loss of life [1]. They happen when rock, mud, or debris moves down a slope pulled by gravity [2]. Landslides can be caused by earthquakes; heavy rainfall; fast-melting snow and ice; or even human activities, such as construction, deforestation, or mining [3]. They can take different forms, including flows, slides, or rock falls and topples. The most common type is debris flow, which happens when there is a high amount of loose material in mountainous regions. Debris flows can be highly destructive and unpredictable, as they often occur suddenly and without warning [4].
Every year, the Red Sea Mountains in Saudi Arabia experience significant challenges from debris flow [5]. These natural disasters pose a threat to the safety of those living nearby or using facilities in the area and can result in financial losses. Debris flow incidents have been reported in various regions, including Al-Baha, Jazan, Al-Madinah, Makkah, and (most recently) on Al-Hada Road in Makkah province.
Al-Hada Road is a significant mountainous route that connects Al-Hada and Tiaf to Makkah al-Mukarramah. However, the road has faced frequent debris flows since its construction because of its high elevation, steep slope, and corresponding rainfall levels. The debris flows have resulted in significant damage to the road, leading to expensive repairs and maintenance that takes weeks to complete [6].
Studies conducted on debris flows on Al-Hada Road have mainly concentrated on examining their geotechnical factors and their impact on neighboring infrastructure. These studies have pinpointed heavy rainfall and construction activities as the primary causes of debris flow. Moreover, they have assessed the efficiency of several prevention and mitigation measures, such as enhanced drainage systems, slope stabilization measures, and early warning systems [6,7].
Geographic Information Systems (GISs) and remote sensing data have been utilized to detect areas susceptible to debris flow [8]. The weighted overlay analysis method, which combines several layers of remote sensing data into a single map, has been used in studies to identify debris-flow-prone areas. This method has proven reliable and precise in identifying such areas [9]. This study adapted high-resolution datasets from RS and GISs to identify debris-flow-prone areas by analyzing various data sources spatially. The analysis will utilize several geospatial techniques, including hydrological modeling, image processing, and weighted overlay analysis. The present study aimed to predict the debris-flow-prone areas in Al-Hada Road using weighted overlay analysis and remote sensing data. Moreover, the outcomes of this study will help decision-makers in this area and similar arid and semi-arid regions identify and prioritize areas for mitigation and prevention measures.
2. Methodology
2.1. Study Area
The Al-Hada Road research site is situated in the western region of Saudi Arabia and can be located using the following coordinates: 40°13′ E, 21°18′ N and 40°18′ E, 21°24′ N (Figure 1). The study area has a diverse elevation range, 656 m at the bottom and 2336 m at the mountaintops. This variation in height poses a unique challenge to researchers investigating the area since different elevations can impact various aspects of the environment, such as temperature and precipitation [10]. Understanding how these elevation changes affect the environment is crucial to predicting future debris flow [11].
Al-Hada Mountain is a part of the Red Sea Mountains, formed by uplifted Precambrian rock via Red Sea rifting. Over the years, erosion has occurred in this area, making Al-Hada Mountain incredibly rugged with steep slopes. The region is notable for its abundance of igneous rocks, such as diorite and granodiorite, as well as granite and granite gneiss. Additionally, various metamorphic rocks, mainly amphibolite schist, can be found in the area. These rocks form through different processes, including tectonic activity involving heat and pressure [12].
The climate in this area is comparable to other parts of Saudi Arabia, experiencing noticeable temperature changes throughout the day and year. Rainfall is common during the winter season, averaging about 95 mm of precipitation [13]. The mountains in this region contribute to the rainfall, which then spreads throughout the valleys. The main valleys in this area are situated to the west, where a road construction project is currently taking place [14].
2.2. Datasets
Mapping the susceptibility of debris flow with remote sensing and Geographic Information System techniques is highly valuable and effective for assessing and evaluating the potential risks and hazards of debris flow in a given area or region [15]. This method involves collecting, integrating, and analyzing various data types and information from different sources, such as geological, geomorphological, hydrological, and meteorological domains. To better comprehend and delineate the susceptibility of debris flow in a spatial manner, datasets such as Sentinel-1 satellite imagery and digital elevation model (DEM) 12.5 are employed to generate and derive essential variables such as drainage density, slope angle, and aspect direction [16].
Moreover, raster data such as geology, soil type, precipitation rate, and land use/cover datasets are also incorporated and included to enhance the accuracy and reliability of the debris-flow-susceptibility mapping [17]. The parameters used in this mapping procedure are assigned appropriate weights, and classes are ranked based on their relative significance and contribution to create a comprehensive and detailed debris flow risk map. Weighted overlay analysis is a method of spatial analysis used to identify areas of interest based on the combination of multiple factors. It allows users to analyze and compare different layers of spatial data, assign relative weights to each layer, and generate a composite map showing each area’s relative importance or priority. This method can be used for various purposes, such as land use planning, environmental impact assessment, risk assessment, and other decision-making processes [18,19].
If the mapping result is not validated or verified with field data or ground truth, then the parameters must be reassigned with different weights, and the process must be repeated iteratively until a satisfactory and acceptable map is produced. Once this has been accomplished successfully, the risk map can be utilized to identify and locate areas or zones of low, medium, and high debris flow susceptibility. The flow chart in Figure 2 illustrates the methodology procedure for mapping debris flow susceptibility zones.
3. Results
Spatial analyses can significantly benefit from remote sensing data [20]. To accurately evaluate the risk of debris flow, it is essential to use various datasets. This section will cover the datasets used for this purpose, as well as their potential for informing our understanding of debris flow risk. Then, we will explore how these datasets can be combined with other raster data sources to create comprehensive models for predicting debris flow risks. The datasets that will be examined include drainage density, elevation, slope, precipitation, land use, geology, soil, and aspect.
3.1. Drainage Density
Drainage density is a measure of the total length of a river or stream network relative to its area. It is used to assess the hydrological characteristics of an area and can help inform decisions about land use, water management, and environmental protection [21]. Drainage density is calculated by dividing the total length of all streams and rivers in an area by its total surface area. The resulting number is typically expressed as kilometers per square kilometer (km/km2). Drainage density is determined by studying the area’s terrain and using a GIS to better understand where drainage concentrates in a given area. Understanding the impact of terrain on drainage density can help identify areas that are prone to debris flow [22]. If drainage or ephemeral streams come in contact with Al-Hada roads, they may suffer from debris flow during heavy rainfall (Figure 3). The land in the area was divided into five categories based on the drainage density values. The five distinct categories are 0–1.07, 1.08–1.97, 1.98–2.9, 2.91–3.87, and 3.88–6.21 (km/km2) (Figure 4).
3.2. Topography
Elevation plays a vital role in the formation and development of debris flows, as it affects the rate at which the material falls and accumulates. Higher elevations create greater potential energy, which can cause faster and more destructive debris flows [23]. A digital elevation model (DEM) is a 3D representation of a terrain’s surface used to map and analyze the topography of an area [24]. The topography was generated from Sentinel-1 satellite data. DEMs are commonly used in various fields, such as geology, hydrology, and debris flow studies. Additionally, higher elevations are more likely to have steep slopes where debris can accumulate and start moving quickly. The research area was found to have a wide range of elevations, from a maximum of 2336 m above mean sea level (AMSL) to a minimum of 656 m AMSL. The elevation of the study area was classified into five distinct categories based on its altitude AMSL. These five categories are 656–922, 923–1181, 1182–1460, 1461–1799, and 1800–2336 m AMSL (Figure 5).
3.3. Slope
The term “slope” is used to describe landforms with a distinct inclination from the horizontal [25]. It can refer to natural and artificial landforms, such as hills, mountains, and man-made structures such as roads. Slope terrain is important for studying the forces of erosion and sedimentation, as well as for understanding the impacts of human activities on landforms [26]. The slope is an essential factor in the study of debris flow. The land’s slope can significantly impact the speed, direction, and destruction caused by debris flows [27]. The slope of the study site varied significantly depending on its location. The highest slopes observed were in the mountainous area and near Al-Hada Road, with a maximum of 78° and lower slopes of 0°, indicating that the terrain in this region is quite diverse. Additionally, we observed that steep slopes were more common in areas with low vegetation cover. This could be attributed to these areas being more susceptible to erosion and debris flow given their steeper inclines. The study area was divided into five classes based on the slope values, ranging from 0 to 10° to 41 to 78° (Figure 6).
3.4. Annual Precipitation
Al-Hada Road and its surrounding areas have an arid climate, with most of its annual precipitation occurring during the spring and winter. The highest rainfall occurs between October and April, with some additional rain falling in the summer [13]. The data were divided into five categories based on the amount of precipitation received in a year to better understand the precipitation patterns of the area. The categories were 90.3–92.1, 92.2–93.5, 93.6–95, and 95.1–96 mm per year. After examining the spatial distribution of the precipitation (Figure 7), we found that the study area has low variations in the annual precipitation rate.
3.5. Lithology
Geological maps are essential for understanding land and predicting potential geological hazards such as debris flows. Granite, granite gneiss, amphibolite schist, diorite, and granodiorite are the most common rock types found on Al-Hada Road [28] (Figure 8). Granite is composed primarily of quartz, feldspar, and mica. Granite gneiss is a metamorphic rock composed of four minerals: quartz, feldspar, muscovite, and biotite. Amphibolite schist is a metamorphic rock composed of amphibole minerals. Diorite is an igneous rock composed of various minerals, including quartz, feldspar, and biotite. Granodiorite is an igneous rock composed of a mixture of quartz, plagioclase feldspar, and hornblende. Studying the characteristics of these rocks helps identify areas prone to debris flow hazards by revealing their composition, structure, and other factors, as well as how they interact with each other.
3.6. Soil
Soil is an important component of the environment and plays a vital role in sustaining life. However, it also plays an important role in causing natural disasters, such as floods and debris flow [29]. Soil is composed of minerals, organic matter, water, and air. There are many types of soil in Saudi Arabia, but loamy-skeletal and loamy-sandy soils are the most common in the study area (Figure 9). Loamy-skeletal soil consists of a combination of clay, silt, and sand particles that provide good drainage and aeration for plants. It also has high nutrient content, which makes it ideal for agricultural production. Loamy-sandy soil is composed of a mixture of sand and silt particles. It is known for its good drainage and aeration, as well as its ability to retain nutrients. Soil plays an important role in the formation of debris flows. Different types of soils can trigger different types of debris flows depending on their composition and characteristics. For example, clay soils are more prone to triggering debris flows than sandy soils. Furthermore, the amount of water present in the soil can also affect the type and intensity of a debris flow.
3.7. Aspect
An aspect map of a study area is important for understanding the dip direction of the slopes in that region. It helps identify the orientation of the slope and can be used to determine if it is suitable for various activities such as agriculture, construction, or mining [30]. Aspect maps can also be used to identify areas that are prone to erosion or debris flow, especially in mountainous road cuts. If the structure plane is directed at the road cuts, this will increase the possibility of debris flow. By understanding the dip direction of the slopes, we can better plan our activities in that region and make sure they are performed safely and efficiently. The aspect data are divided into five classes: 0–68 (northeast), 69–150 (northeast–southeast), 151–221 (southeast–southwest), 222–285 (southwest–northwest), and 286–360 (northwest) (Figure 10).
3.8. Land Use and Land Cover
Land use and land cover maps are essential data for visualizing the spatial distribution of land features, such as forests, agricultural fields, urban areas, and water bodies. These maps provide valuable information about the environment and can be used to identify areas of land change over time [31]. They can also be used to assess the impact of human activities on natural ecosystems and create strategies for sustainable development [32]. Land use categories in the study area include residential, vegetation, and bare land. Al-Hada Road is an example of a road located in the bare land category. The map below provides insight into how humans utilize the space around them for development purposes. It also allows us to identify areas vulnerable to environmental hazards such as debris flow (Figure 11).
4. Discussion
Field observations identifying mass-wasting hazard types in the study area revealed that most of the previous hazards were a combination of water and rock debris flowing downslope at high speeds and hitting the road. These events happened after intense rainstorms. When heavy rain falls on Al-Hada Mountain’s steep slopes, it can quickly produce large amounts of surface runoff that erodes the soil and carries loose rocks and other debris downslope.
In addition, road cuts are another factor that contributes to triggering debris flows. These road constructions can cause significant disturbances on the slopes of Al-Hada Mountain, causing instability and weakening the slopes. These operations remove the material or alter the landscape, making slopes more susceptible to mass-wasting events such as debris flows.
Our field trip concluded that water ran over the mountain surfaces during extreme rainfall, reaching dense drainage areas. This process saturates soil particles with water. Furthermore, some of these intense areas are on steep slopes in the high-elevation area. In this case, they became unstable, leading debris flows to impact Al-Hada Road, especially when the structure was directed toward the road.
Based on our field observations, assigning high weights to both the drainage density and slope layers within the weighted overlay analysis allows for more accurate predictions of where debris flow may occur, as these two layers are both factors that influence how water moves across the landscape, making them critical components in understanding where debris flows might occur. Furthermore, because previous debris flows were concentrated in the high-elevation area, higher-elevation areas were given the second-highest weights. The other parameters were used in the weighted overlay analysis, but they were given low weights because of their low contribution to predicting potential debris flow areas.
The weight percentage for each parameter and the rank of each class are displayed in Table 1. The table displays the weight percentages assigned to various factors that affect the risk of debris flow in the area under study. The drainage density parameter has the highest weight percentage at 35, which implies that it is the most significant factor in determining the risk of debris flow. The slope parameter has the second-highest weight percentage at 35, and the elevation parameter comes in third with a weight percentage of 10. The precipitation, lithology, soil, aspect, and land use/land cover parameters each have a weight percentage of five, indicating that they have a smaller impact on the susceptibility of debris flow.
Figure 12 displays the outcome of the weighted overlay analysis, highlighting the regions with varying levels of debris flow risk. The low-risk locations are indicated in green, covering an area of 35,354,063 square meters. The medium-risk areas are marked in yellow and cover 60,646,250 square meters. The high-risk zones are depicted in red, covering an area of 8,633,281 square meters.
The 11 debris flow locations discovered during the field trip were used to validate risk areas created for the present study (Figure 13). This preventive measure is essential to eliminate any false outcomes. All 11 debris flows were located in high-risk zones, validating the results of the weighted overlay analysis.
5. Conclusions
In this study, we developed a debris flow susceptibility map for the Al-Hada Mountain region in Saudi Arabia using GIS-based weighted overlay analysis and remote sensing data. The study used various parameters such as drainage density, elevation, slope, precipitation, land use, geology, soil, and aspect to map the region’s debris flow zones. The assessment showed low-risk areas covering an area of 35,354,062.5 square meters, medium-risk areas covering 60,646,250 square meters, and high-risk zones covering an area of 8,633,281 square meters. The field trip to Al-Hada Road identified 11 previous debris flows in areas characterized by dense drainage and a high slope. These previous incidents validated our mapped results. This study provides a baseline for future debris flow and risk assessment studies in Saudi Arabia and similar regions. Further research is needed to understand how climate change may influence debris flow in Saudi Arabia’s mountainous areas.
Author Contributions
Conceptualization, T.A. and A.S.E.-S.; methodology, T.A. and A.S.E.-S.; software, T.A. and A.S.E.-S.; writing—original draft preparation, T.A. and A.S.E.-S.; writing—review and editing, T.A. and A.S.E.-S. All authors have read and agreed to the published version of the manuscript.
Funding
Researchers’ supporting project number (IFKSUOR3-157-3), King Saud University, Riyadh, Saudi Arabia.
Data Availability Statement
All data generated or analyzed during this study are included in the published article.
Acknowledgments
The authors extend their appreciation to the Deputyship for Research and Innovation, Ministry of Education, Saudi Arabia, for funding this research work through project no. (IFKSUOR3-157-3). Moreover, the authors thank the anonymous reviewers for their valuable suggestions and constructive comments.
Conflicts of Interest
The authors declare no conflict of interest.
References
- Luo, H.Y.; Zhang, L.M.; Zhang, L.L.; He, J.; Yin, K.S. Vulnerability of buildings to landslides: The state of the art and future needs. Earth-Sci. Rev. 2023, 238, 104329. [Google Scholar] [CrossRef]
- Reichenbach, P.; Rossi, M.; Malamud, B.D.; Mihir, M.; Guzzetti, F. A review of statistically-based landslide susceptibility models. Earth-Sci. Rev. 2018, 180, 60–911. [Google Scholar] [CrossRef]
- Lacroix, P.; Handwerger, A.L.; Bièvre, G. Life and death of slow-moving landslides. Nat. Rev. Earth Environ. 2020, 1, 404–419. [Google Scholar] [CrossRef]
- Alharbi, T.; Sultan, M.; Sefry, S.; ElKadiri, R.; Ahmed, M. ; Chase, R An assessment of landslide susceptibility in the Faifa area, Saudi Arabia, using remote sensing and GIS techniques. Nat. Hazards Earth Syst. Sci. 2014, 14, 1553–1564. [Google Scholar] [CrossRef]
- Youssef, A.M.; Mahdi, A.M.; Al-Katheri, M.M.; Pouyan, S.; Pourghasemi, H.R. Multi-hazards (landslides, floods, and gully erosion) modeling and mapping using machine learning algorithms. J. Afr. Earth Sci. 2023, 197, 104788. [Google Scholar] [CrossRef]
- Sadagah, B. A vigorous debris-flow incident at Al-Hada descent and remedial measures. In Landslide Science for a Safer Geoenvironment; Sassa, K., Canuti, P., Yin, Y., Eds.; Springer: Berlin/Heidelberg, Germany, 2014; pp. 715–718. [Google Scholar]
- Youssef, A.M.; Pradhan, B.; Maerz, N.H. Debris flow impact assessment caused by 14 April 2012 rainfall along the Al-Hada Highway, Kingdom of Saudi Arabia using high-resolution satellite imagery. Arab. J. Geosci. 2014, 7, 2591–2601. [Google Scholar] [CrossRef]
- Casagli, N.; Intrieri, E.; Tofani, V.; Gigli, G.; Raspini, F. Landslide detection, monitoring and prediction with remote-sensing techniques. Nat. Rev. Earth Environ. 2023, 4, 51–64. [Google Scholar] [CrossRef]
- Shit, P.K.; Bhunia, G.S.; Maiti, R. Potential landslide susceptibility mapping using weighted overlay model (WOM). Model. Earth Syst. Environ. 2016, 2, 21. [Google Scholar] [CrossRef]
- Stüwe, K.; Robl, J.; Turab, S.A.; Sternai, P.; Stuart, F.M. Feedbacks between sea-floor spreading, trade winds and precipitation in the Southern Red Sea. Nat. Commun. 2022, 13, 5405. [Google Scholar] [CrossRef]
- Hürlimann, M.; Coviello, V.; Bel, C.; Guo, X.; Berti, M.; Graf, C.; Hübl, J.; Miyata, S.; Smith, J.B.; Yin, H.Y. Debris-flow monitoring and warning: Review and examples. Earth-Sci. Rev. 2019, 199, 102981. [Google Scholar] [CrossRef]
- Alghamdi, A.G.; Aly, A.A.; Majrashi, M.A.; Ibrahim, H.M. Analysis of rockfall hazards along NH-15: A case study of Al-Hada road, Saudi Arabia. Geoenvironmental Disasters 2020, 7, 1. [Google Scholar]
- Almazroui, M.; Islam, M.N.; Alkhalaf, A.K.; Saeed, F. Spatiotemporal analysis of the annual rainfall in the Kingdom of Saudi Arabia. Theor. Appl. Climatol. 2021, 144, 1039–1054. [Google Scholar]
- Almazroui, M.; Islam, M.N.; Jones, P.D.; Athar, H.; Rahman, M.A. Recent climate change in the Arabian Peninsula: Seasonal rainfall and temperature climatology of Saudi Arabia for 1979–2009. Atmos. Res. 2012, 111, 29–45. [Google Scholar] [CrossRef]
- Shahabi, H.; Hashim, M. Landslide susceptibility mapping using GIS-based statistical models and Remote sensing data in tropical environment. Sci. Rep. 2015, 5, 9899. [Google Scholar] [CrossRef] [PubMed]
- Zhang, Q.; Ye, S.; Yan, F. and Ren, B. Application of RS & GIS in Regional Landslides Susceptibility Mapping and Spatiotemporal Characteristics Analysis. IOP Conf. Ser. Earth Environ. Sci. 2020, 428, 012093. [Google Scholar]
- Alkhasawneh, M.; Ngah, U.K.; Isa, N.A.M.; Pradhan, B.; Al-Batah, M.S.; Al-Amoush, H. GIS-based landslide susceptibility mapping and assessment using bivariate statistical models: A case study of Al-Hashimiya Qasabah, Zarqa Governorate, Jordan. Geoenvironmental Disasters 2020, 7, 8. [Google Scholar]
- Chen, Y.; Yu, J.; Khan, S. Spatial sensitivity analysis of multi-criteria weights in GIS-based land suitability evaluation. Environ. Model. Softw. 2010, 25, 1582–1591. [Google Scholar] [CrossRef]
- Malczewski, J.; Rinner, C. (Eds.) . Multicriteria Decision Analysis in Geographic Information Science; Springer: Berlin/Heidelberg, Germany, 2015; Chapter 4: Weighted linear combination. [Google Scholar]
- Alharbi, T. Mapping of groundwater, flood, and drought potential zones in Neom, Saudi Arabia, using GIS and remote sensing techniques. Water 2023, 15, 966. [Google Scholar] [CrossRef]
- Lin, P.; Pan, M.; Wood, E.F.; Yamazaki, D.; Allen, G.H. A new vector-based global river network dataset accounting for variable drainage density. Sci. Data 2021, 8, 28. [Google Scholar] [CrossRef] [PubMed]
- Yang, S.-Y.; Chang, C.-H.; Hsu, C.-T.; Wu, S.-J. Variation of uncertainty of drainage density in flood hazard mapping assessment with coupled 1D–2D hydrodynamics model. Nat. Hazards 2022, 111, 2297–2315. [Google Scholar] [CrossRef]
- Liu, C.; Wang, J.; Li, Z. A new method for estimating the potential energy of debris flows based on a two-phase flow model. Landslides 2019, 16, 1–14. [Google Scholar] [CrossRef]
- Hengl, T.; Reuter, H.I. (Eds.) . Geomorphometry: Concepts, Software, Applications; Elsevier: Amsterdam, The Netherlands, 2009; Chapter 2: Digital elevation model terminology. [Google Scholar]
- Zhou, Q.; Liu, X. Analysis of errors of derived slope and aspect related to DEM data properties. Comput. Geosci. 2004, 30, 369–378. [Google Scholar] [CrossRef]
- Gabet, E.J.; Mudd, S.M. Bedrock erosion by root fracture and tree throw: A coupled biogeomorphic model to explore the humped soil production function and the persistence of hillslope soils. J. Geophys. Res. Earth Surf. 2010, 115. [Google Scholar] [CrossRef]
- Larsen, I.J.; Montgomery, D.R. Landslide erosion coupled to tectonics and river incision. Nat. Geosci. 2012, 5, 468–473. [Google Scholar] [CrossRef]
- Sadagah, B. Rockfall Analysis, Modeling and Mitigation Along Al-Hada Descent Road, Saudi Arabia. In Engineering Geology for Society and Territory–Volume 2; Springer: Berlin/Heidelberg, Germany, 2015; pp. 1931–1935. [Google Scholar] [CrossRef]
- Borrelli, P.; Robinson, D.A.; Panagos, P.; Lugato, E.; Yang, J.E.; Alewell, C.; Wuepper, D.; Montanarella, L.; Ballabio, C. Land use and climate change impacts on global soil erosion by water (2015–2070). Proc. Natl. Acad. Sci. USA 2020, 117, 21994–22001. [Google Scholar] [CrossRef] [PubMed]
- Saravanan, S.; Thirumalaivasan, D. Assessment of Morphometric Parameters as the Basis for Hydrological Analysis of a River Basin Using GIS and Remote Sensing Techniques. ISPRS Int. J. Geo-Inf. 2020, 11, 459. [Google Scholar] [CrossRef]
- Song, X.-P.; Hansen, M.C.; Tyukavina, A.; Potapov, P.V.; Stehman, S.V.; Vermote, E.F.; Townshend, J.R.; Krylov, A.; Kommareddy, I.; Egorov, A. Global land change from 1982 to 2016. Nature 2018, 560, 639–643. [Google Scholar] [CrossRef]
- Fritz, S.; See, L.; McCallum, I.; You, L.; Bun, A.; Moltchanova, E.; Duerauer, M.; Albrecht, F.; Schill, C.; Perger, C.; et al. Mapping global cropland and field size. Glob. Change Biol. 2015, 21, 1980–1992. [Google Scholar] [CrossRef] [PubMed]
Figure 1.
A map displaying Al-Hada Road, which runs through a hilly region with elevation varying from 656 m at the bottom to 2336 m at the mountaintops. The map located in the top left corner provides the study area’s location in Saudi Arabia.
Figure 1.
A map displaying Al-Hada Road, which runs through a hilly region with elevation varying from 656 m at the bottom to 2336 m at the mountaintops. The map located in the top left corner provides the study area’s location in Saudi Arabia.
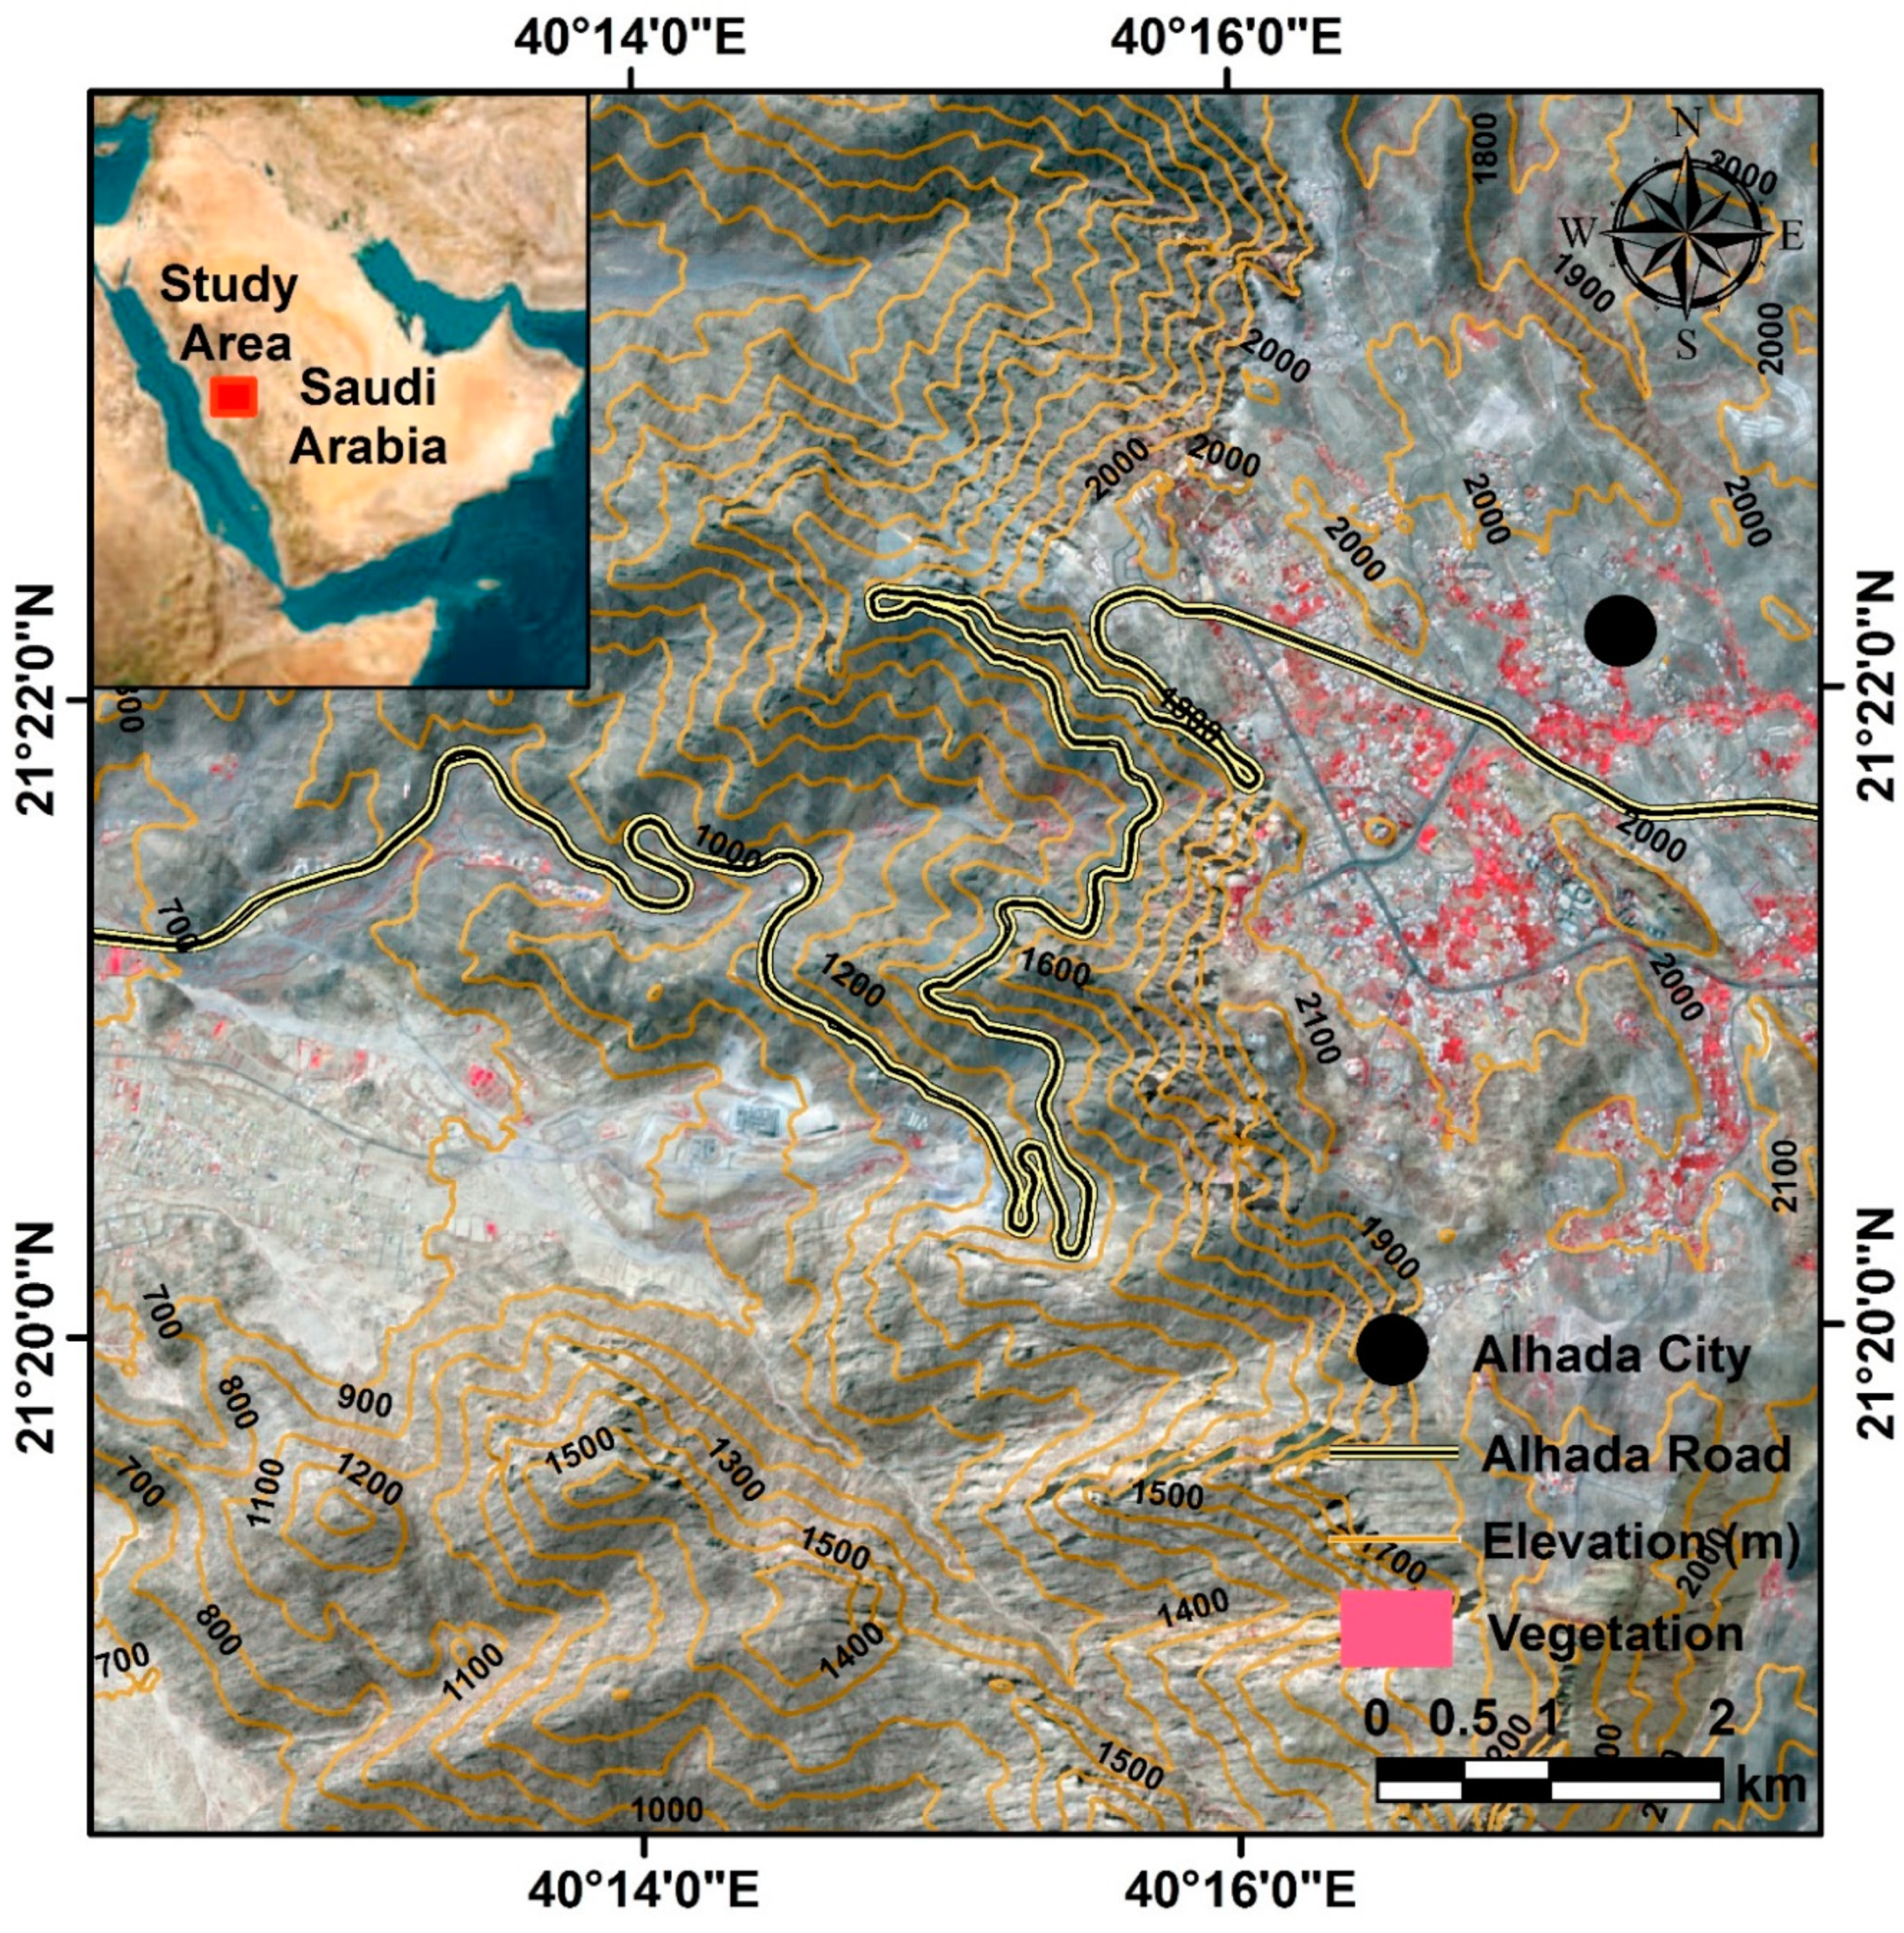
Figure 2.
A flow chart outlining how the datasets were utilized to map the potential debris flow areas at risk on Al-Hada Road.
Figure 2.
A flow chart outlining how the datasets were utilized to map the potential debris flow areas at risk on Al-Hada Road.
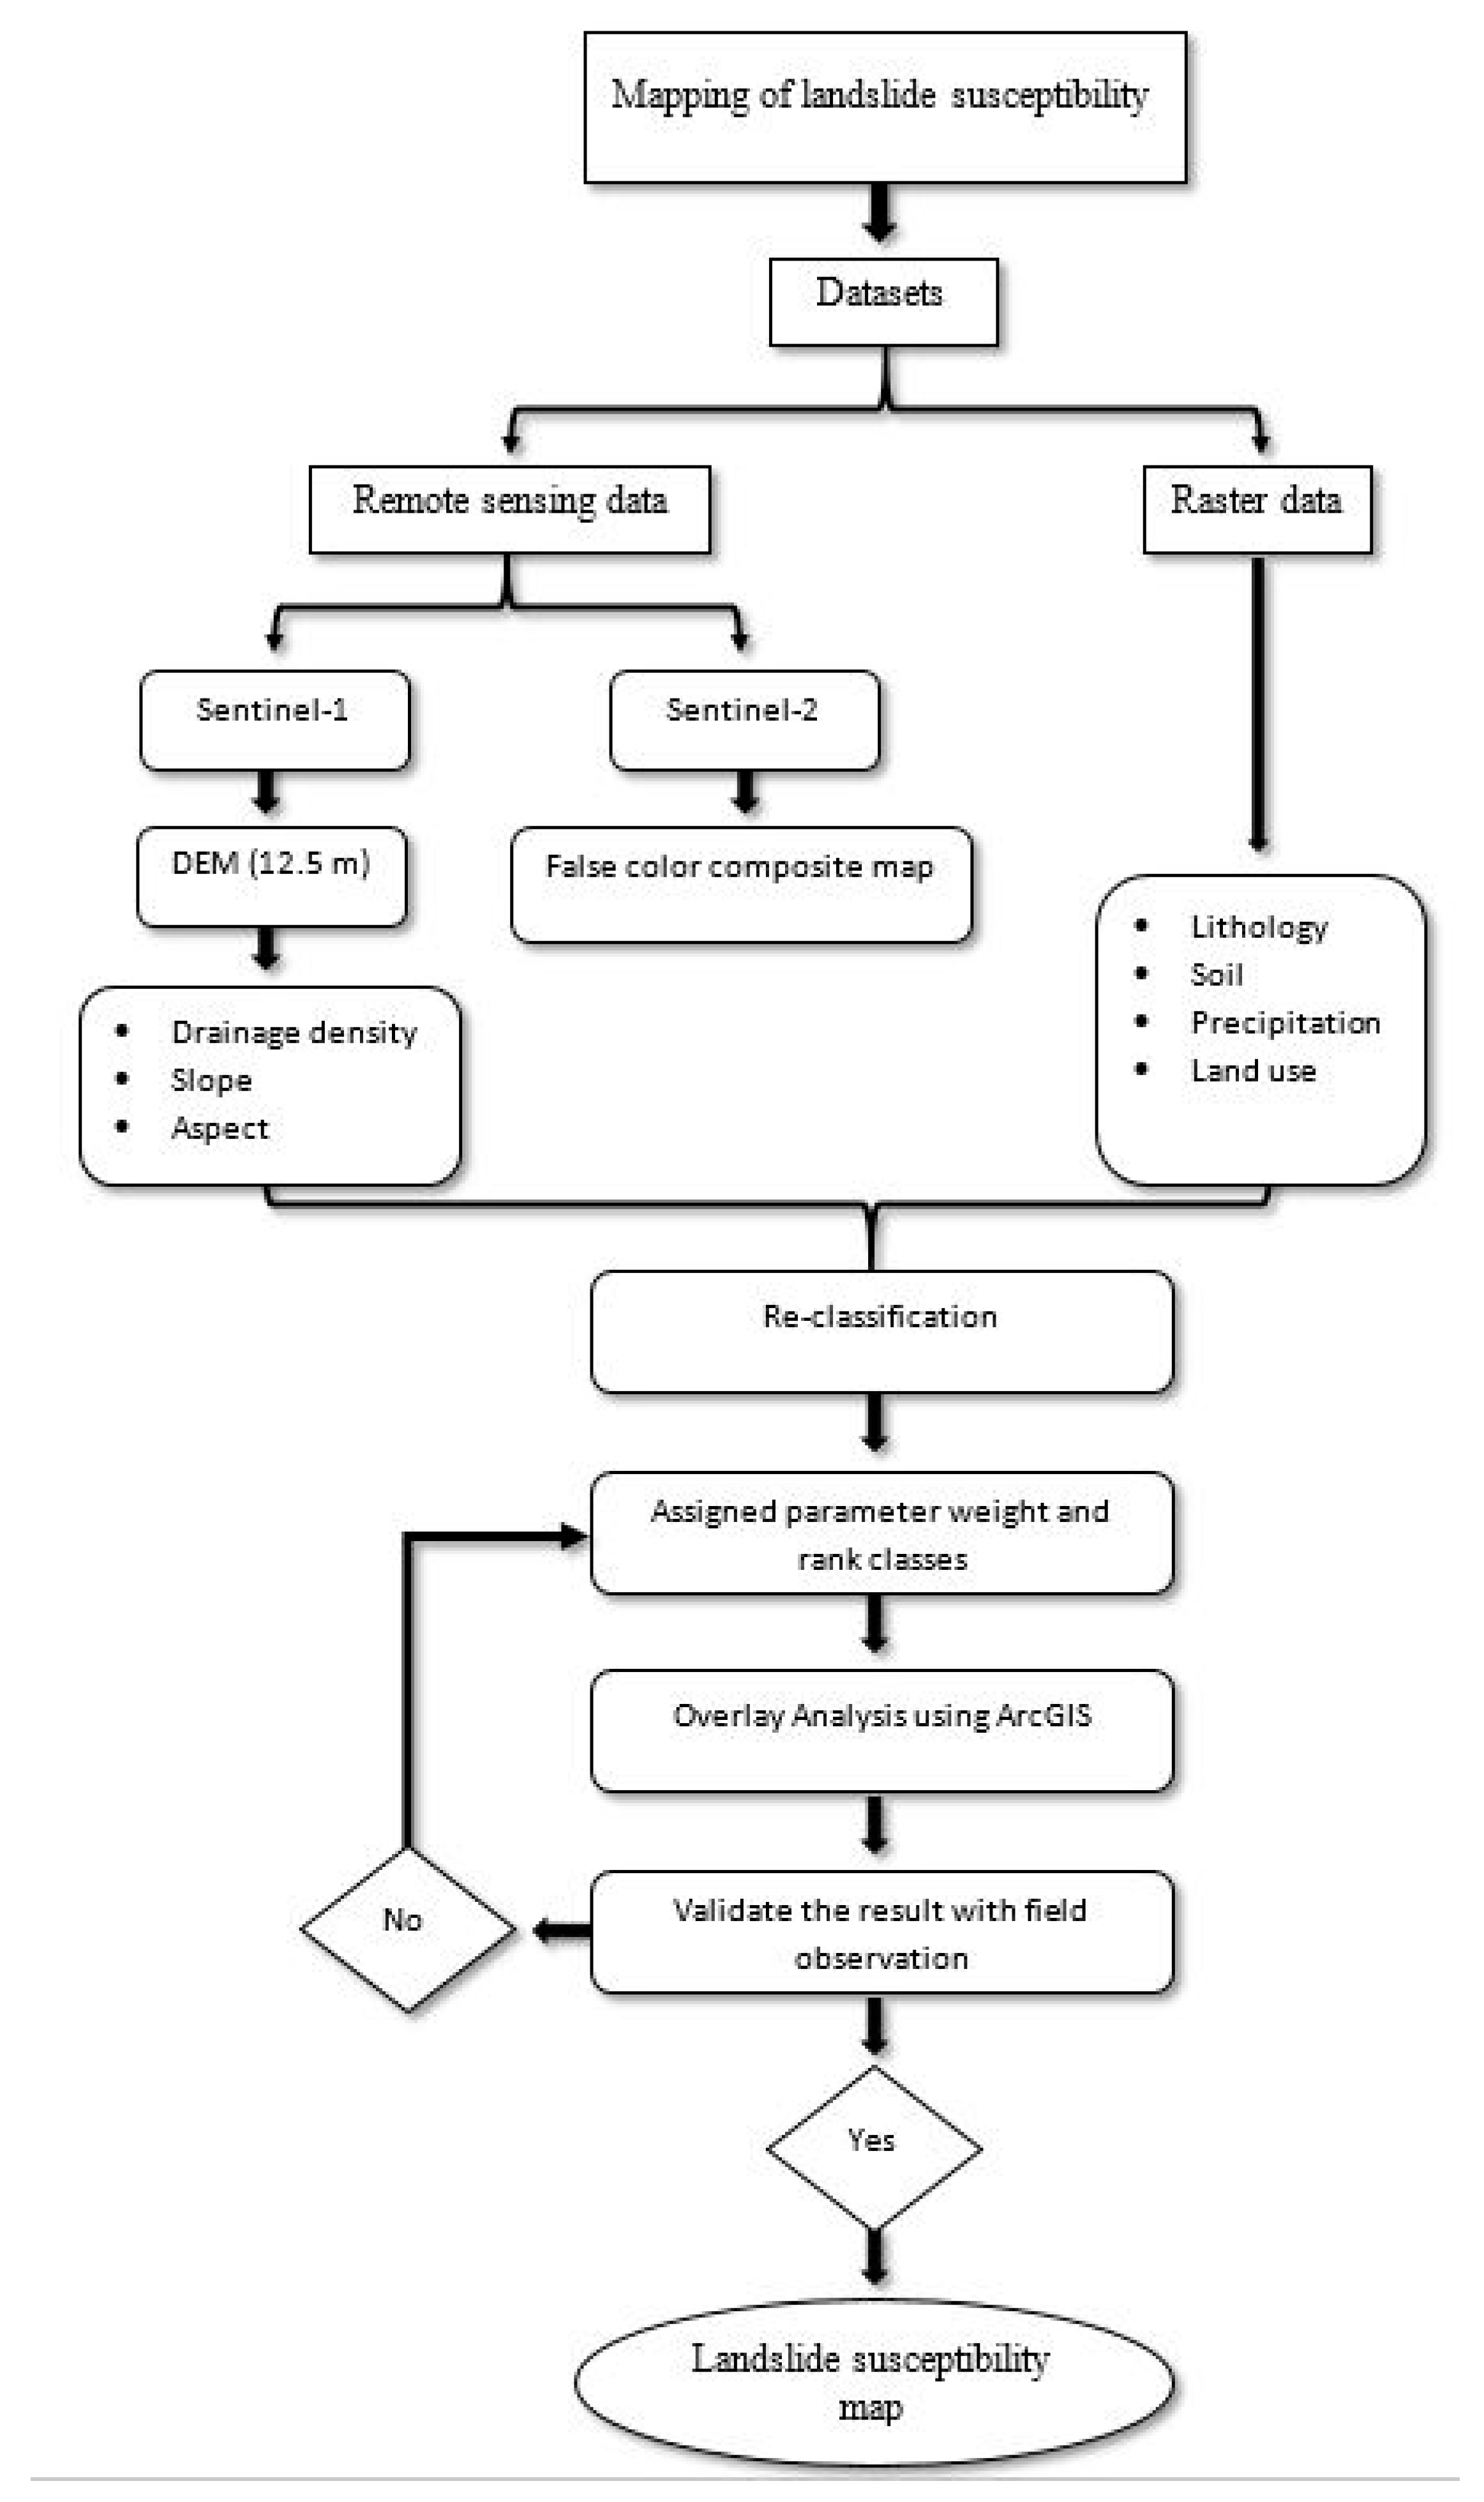
Figure 3.
A 3D view of Al-Hada Mountain and Al-Hada Road. Al-Hada Road is a winding road connecting the city of Al-Hada and Taif with the lowlands. The arrows indicate where ephemeral streams intersect with Al-Hada Road, creating potential debris flow risks for road users and infrastructure.
Figure 3.
A 3D view of Al-Hada Mountain and Al-Hada Road. Al-Hada Road is a winding road connecting the city of Al-Hada and Taif with the lowlands. The arrows indicate where ephemeral streams intersect with Al-Hada Road, creating potential debris flow risks for road users and infrastructure.
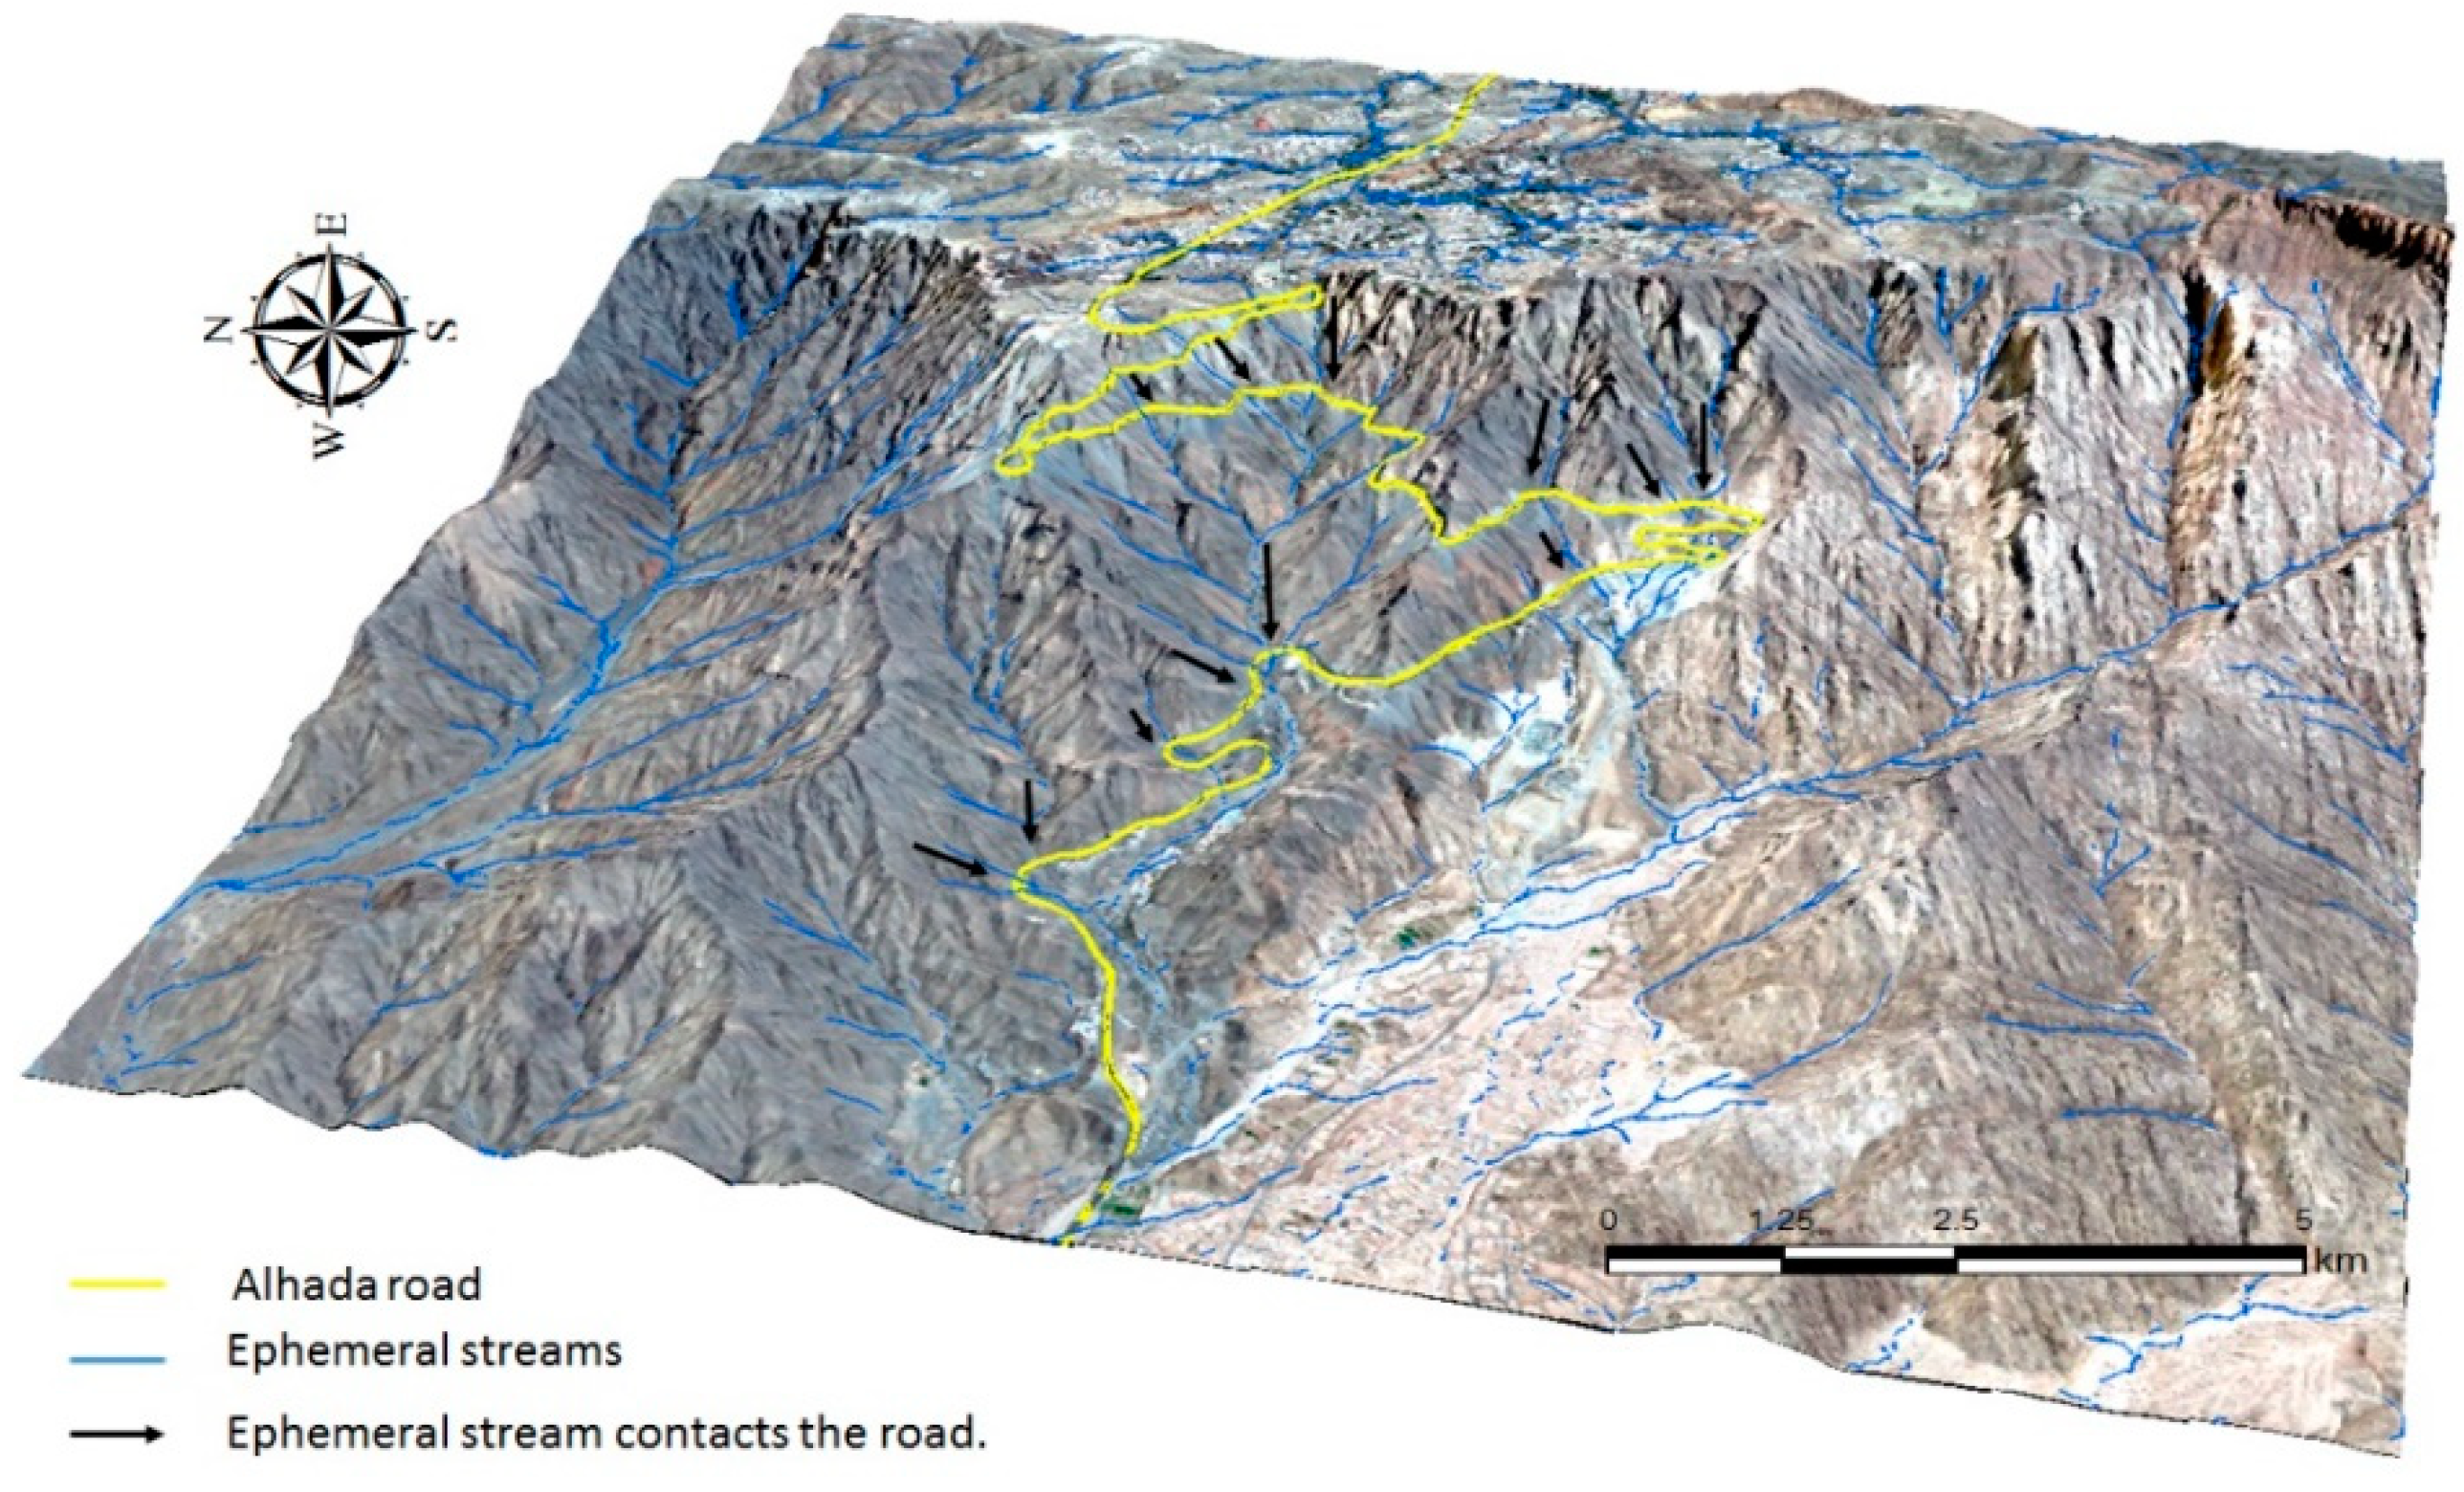
Figure 4.
A map displaying the five classes of drainage density in the study area, ranging from 0 to 1.07 (km/km2) for the smallest class and from 3.88 to 6.21 (km/km2) for the largest class.
Figure 4.
A map displaying the five classes of drainage density in the study area, ranging from 0 to 1.07 (km/km2) for the smallest class and from 3.88 to 6.21 (km/km2) for the largest class.
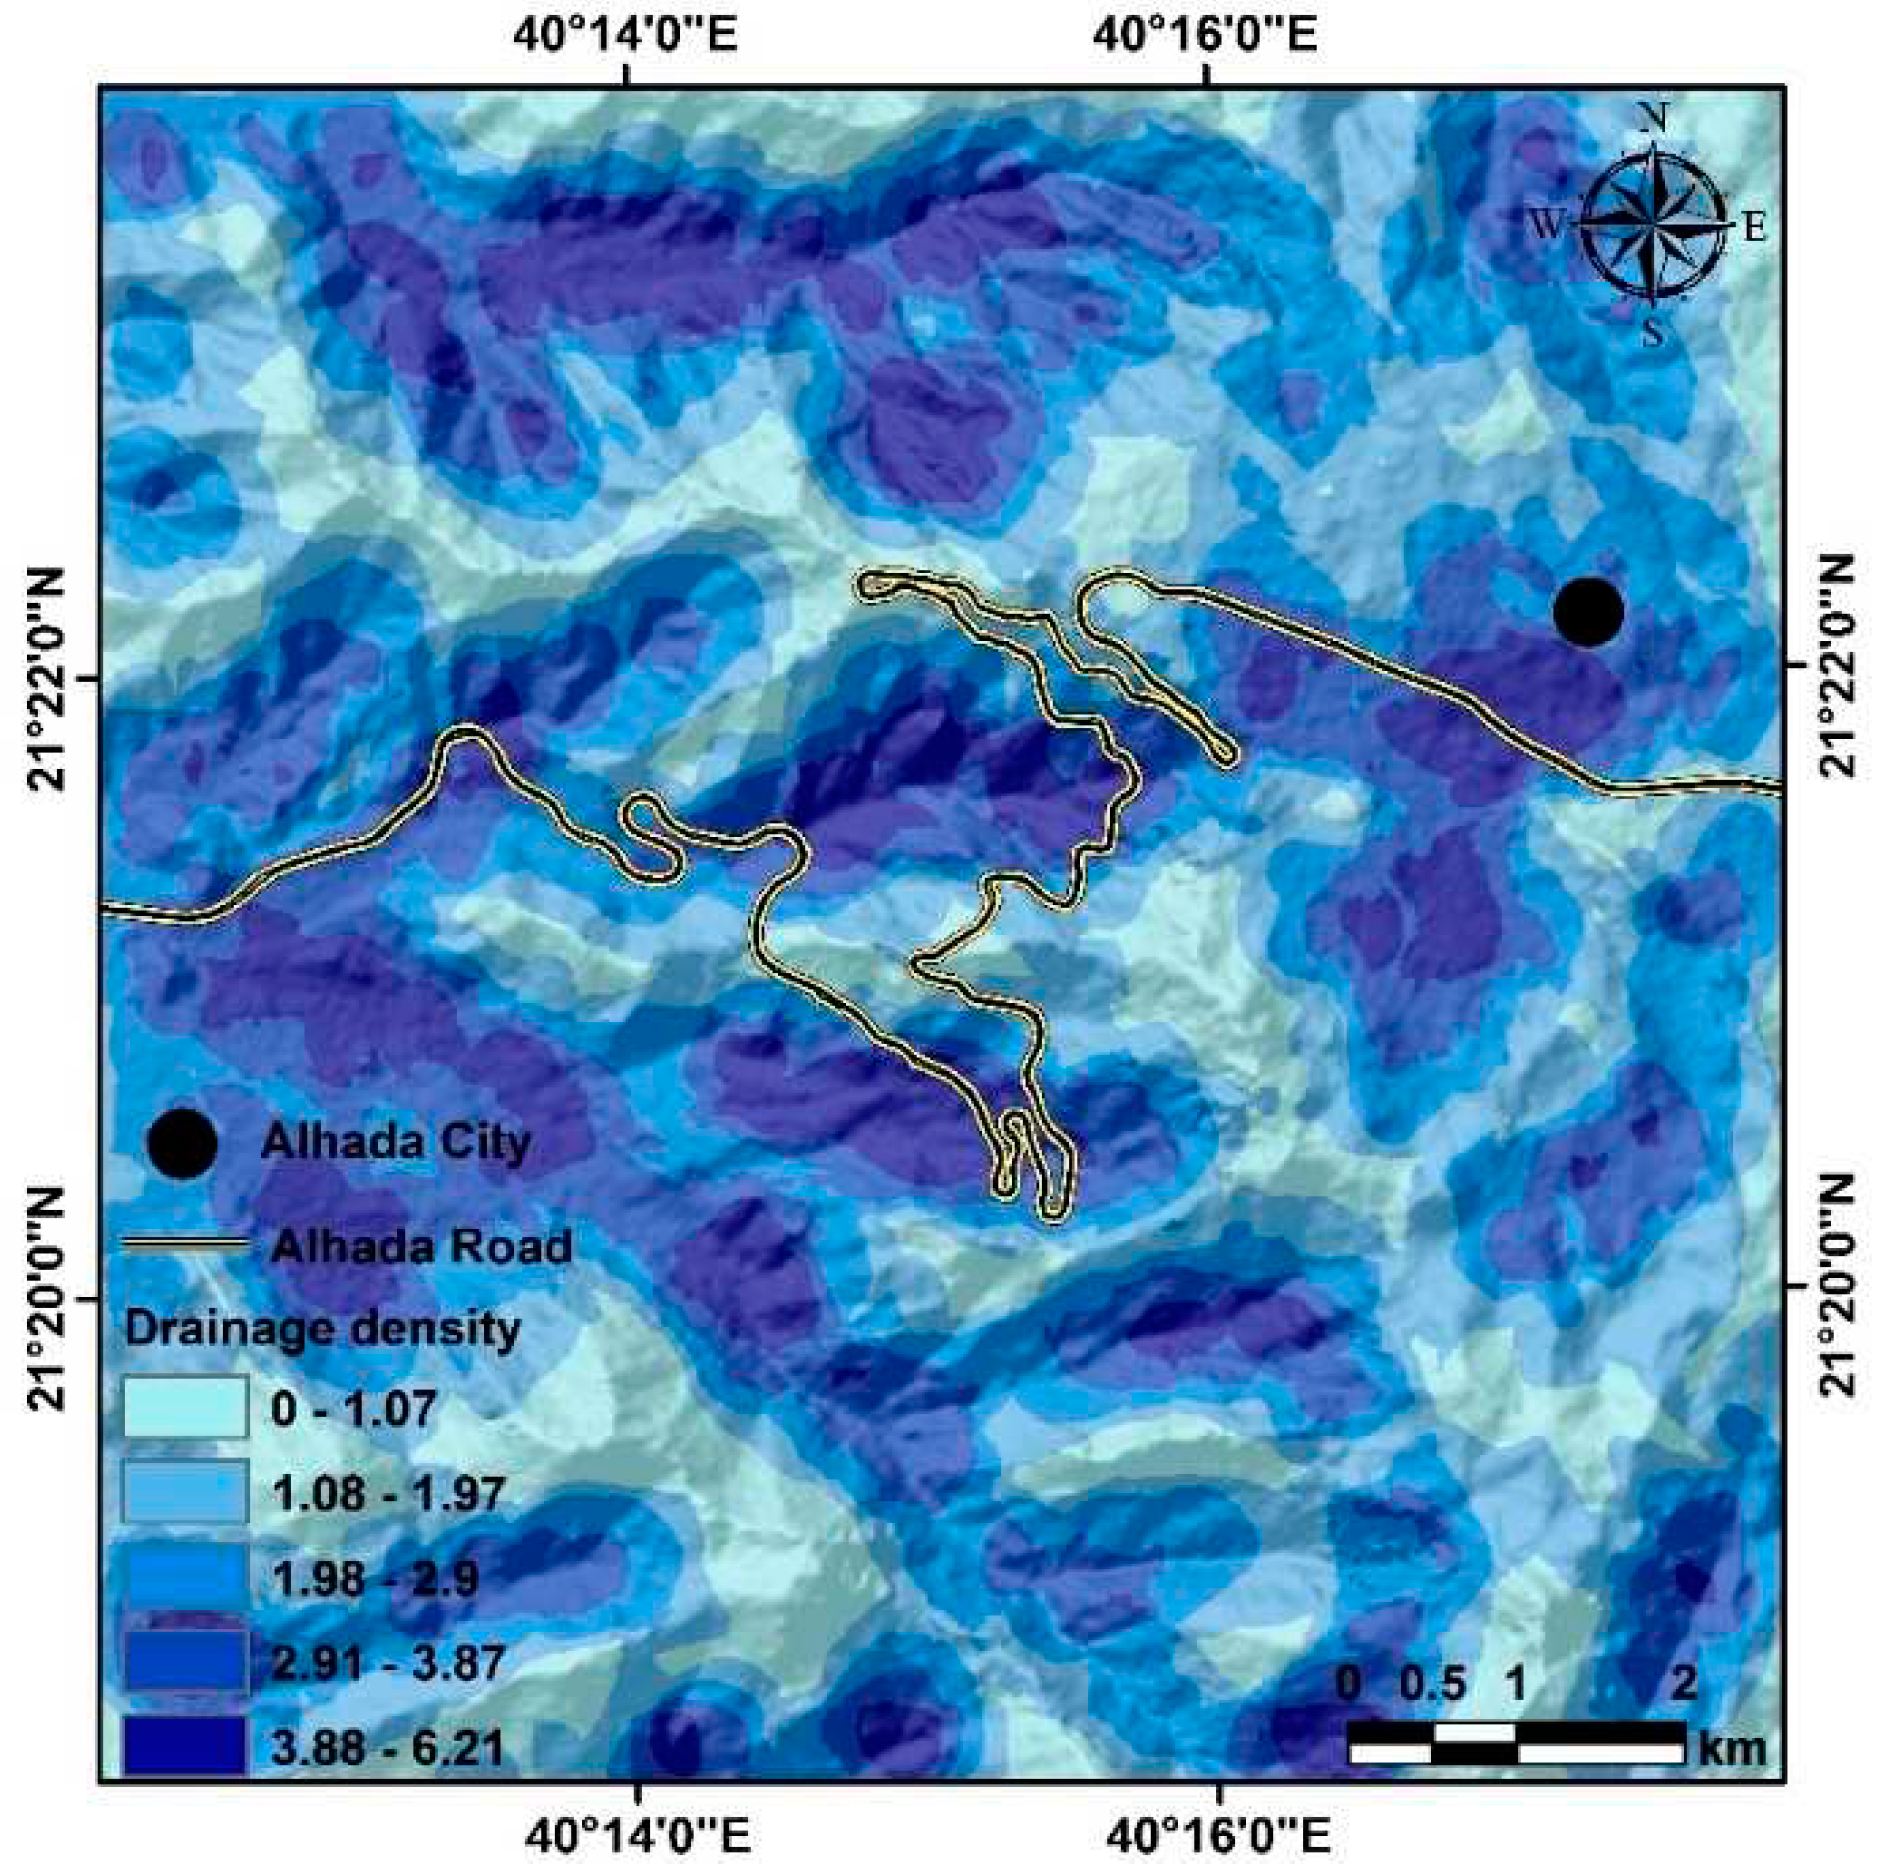
Figure 5.
A map showing the digital elevation model of the study area’s surface elevation, displaying a range of 656 to 922 m AMSL in the west and a sharp rise to 2336 m AMSL in the east.
Figure 5.
A map showing the digital elevation model of the study area’s surface elevation, displaying a range of 656 to 922 m AMSL in the west and a sharp rise to 2336 m AMSL in the east.
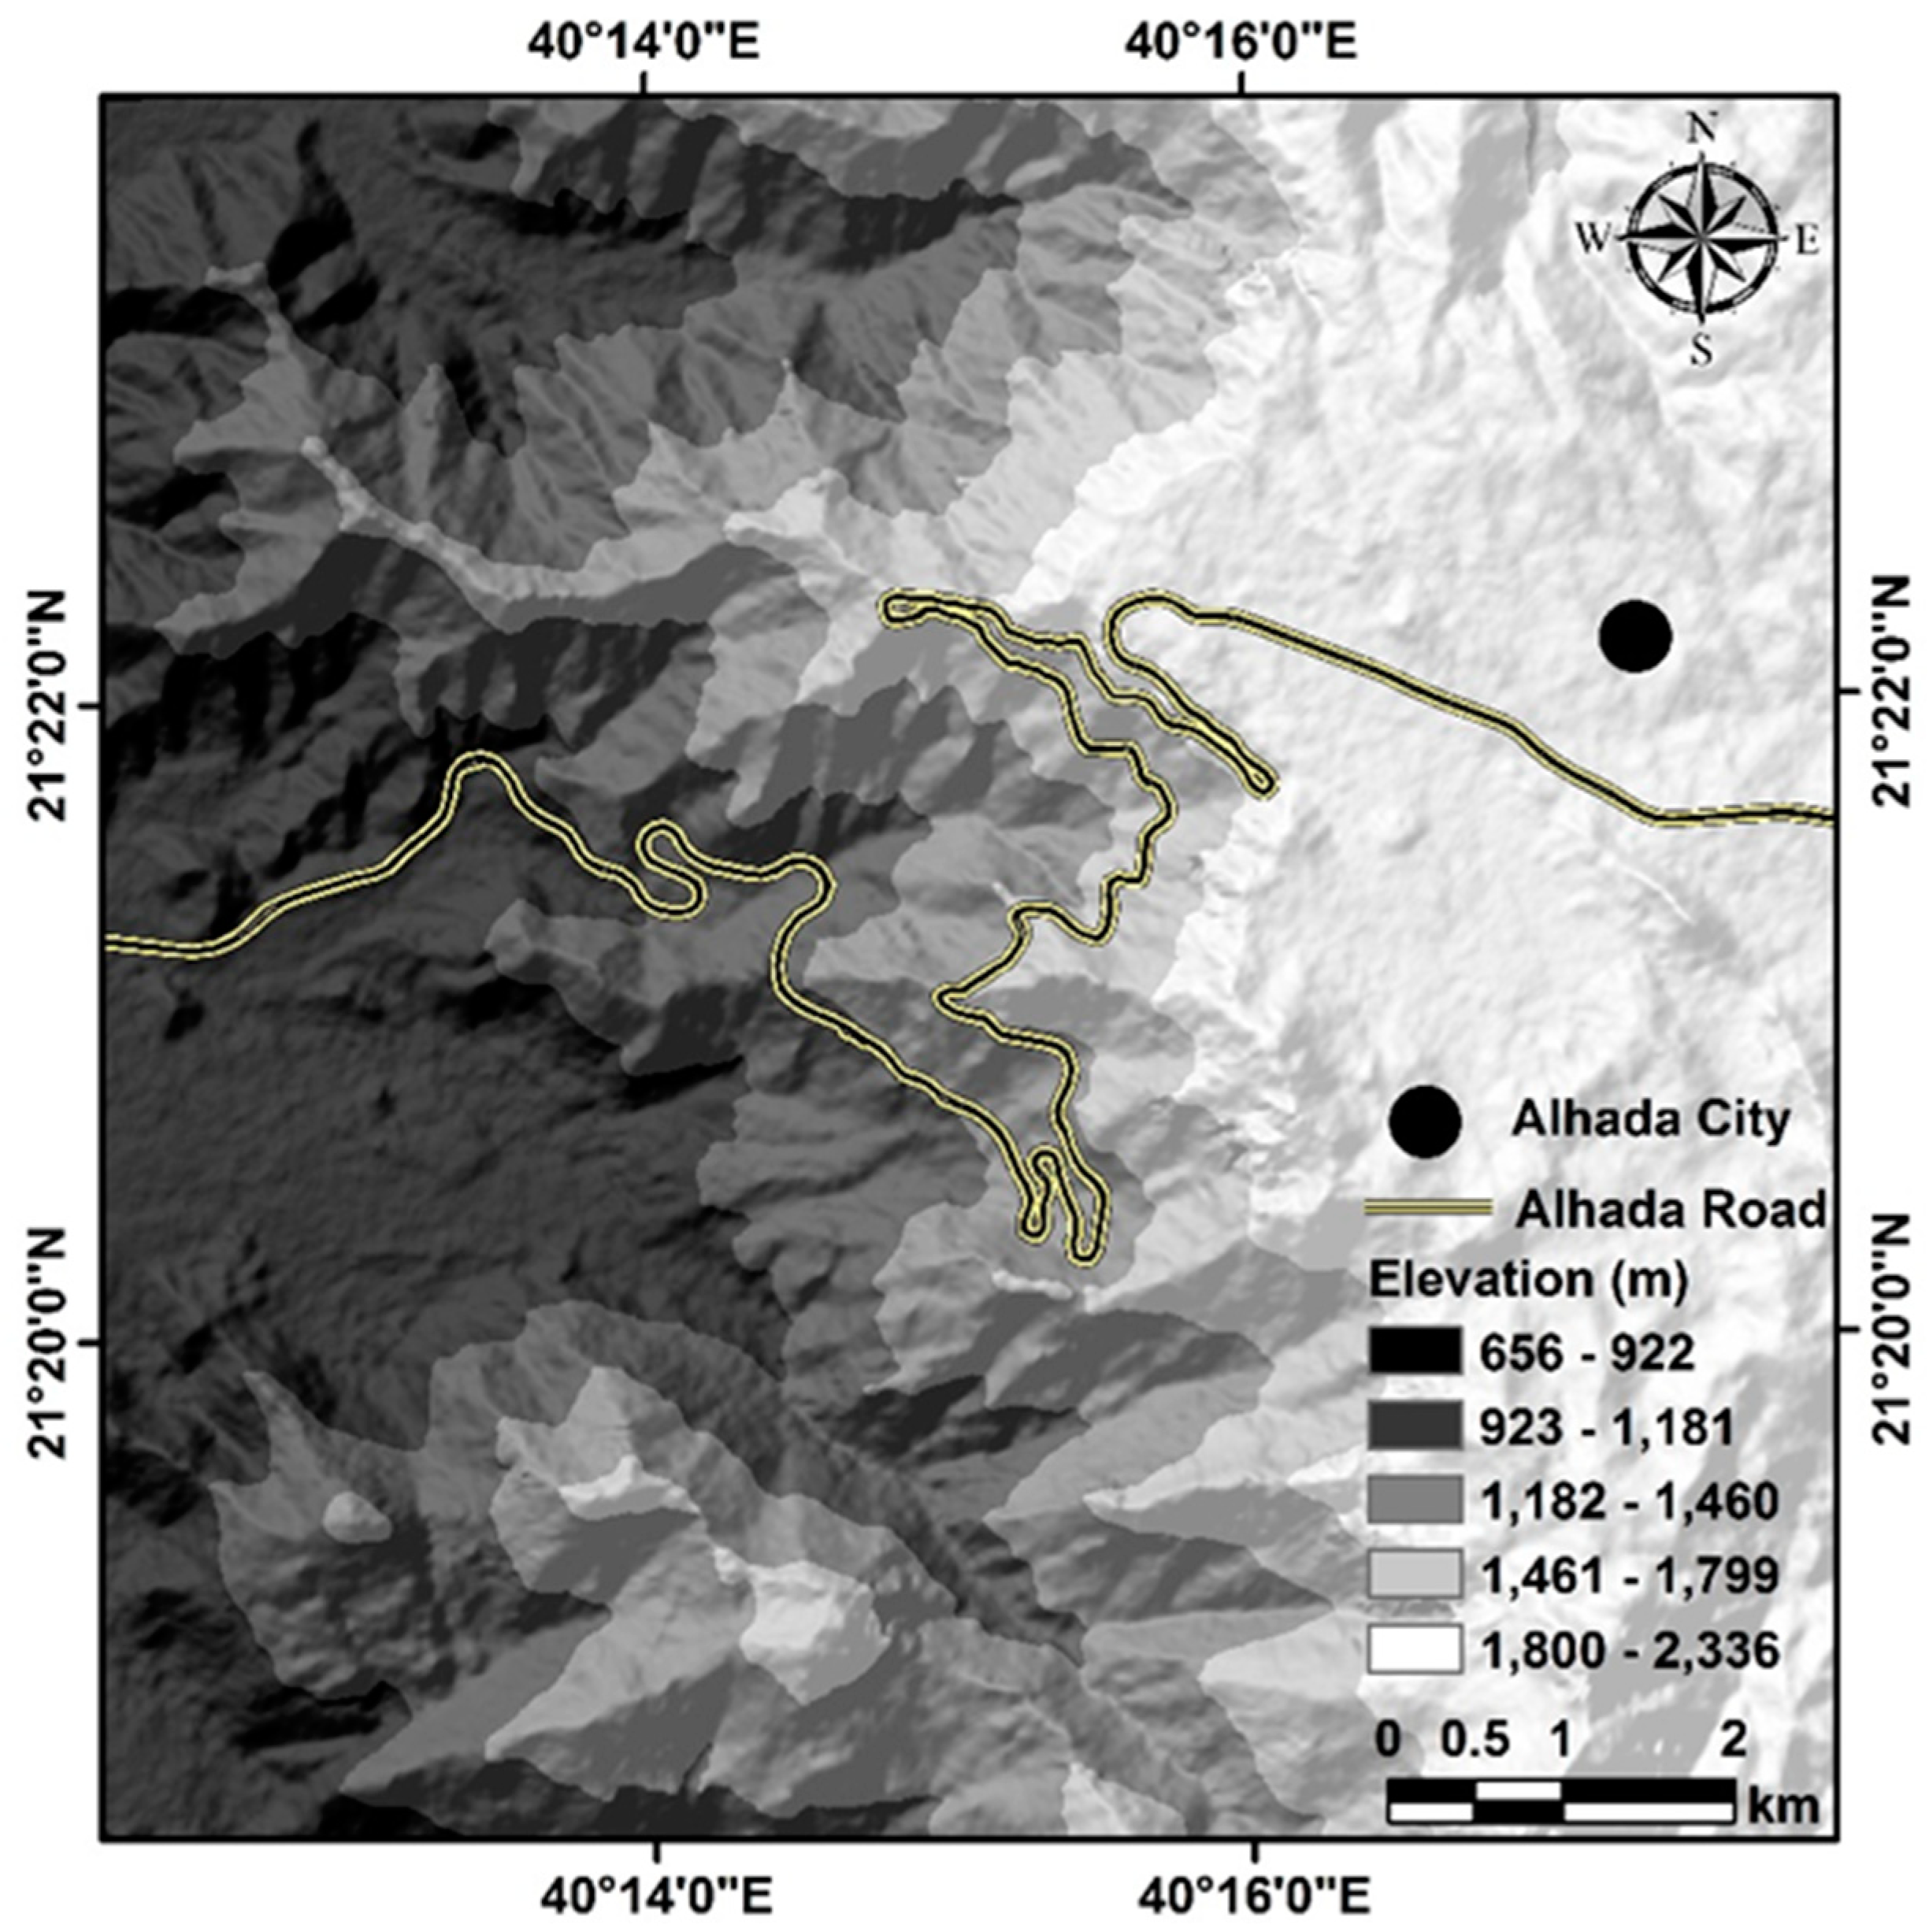
Figure 6.
A map illustrating the varying degrees of slope in the study areas. The slope ranges from 0 to 10 in the lower class and from 41 to 78 in the upper class.
Figure 6.
A map illustrating the varying degrees of slope in the study areas. The slope ranges from 0 to 10 in the lower class and from 41 to 78 in the upper class.
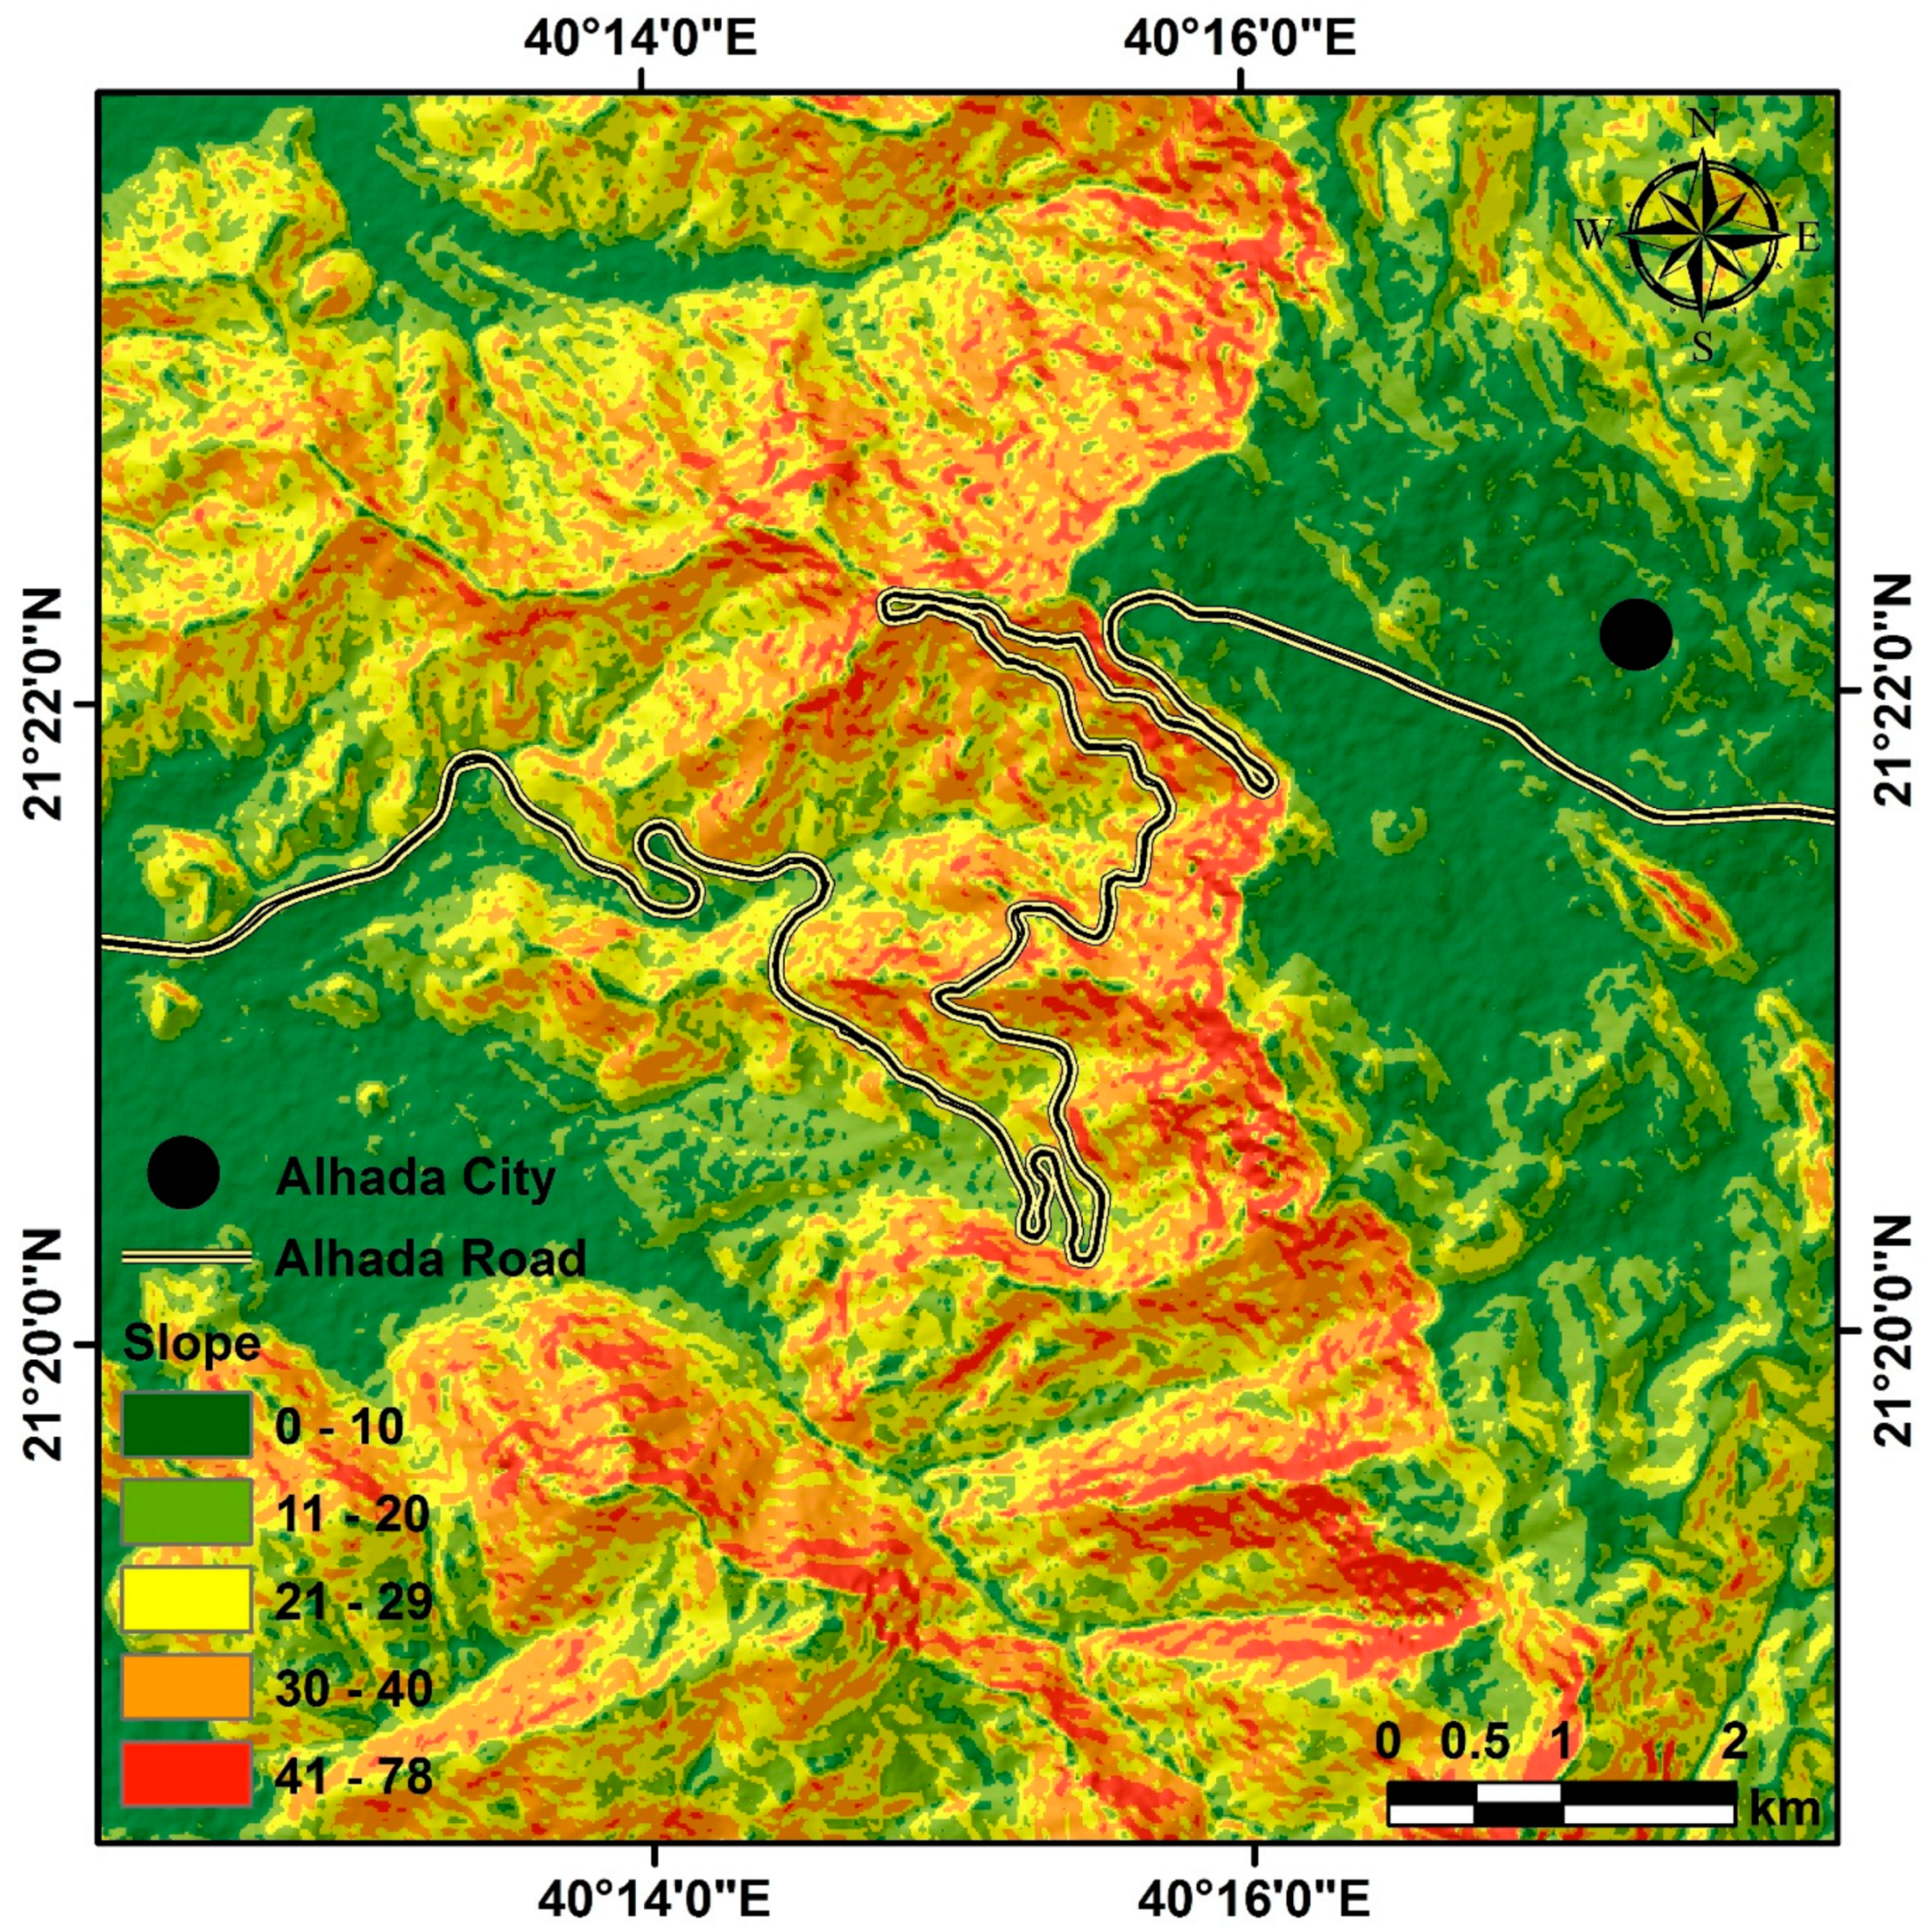
Figure 7.
A map showing the precipitation levels in the small range studied. The highest value recorded was 98 mm while the lowest value was 90 mm.
Figure 7.
A map showing the precipitation levels in the small range studied. The highest value recorded was 98 mm while the lowest value was 90 mm.
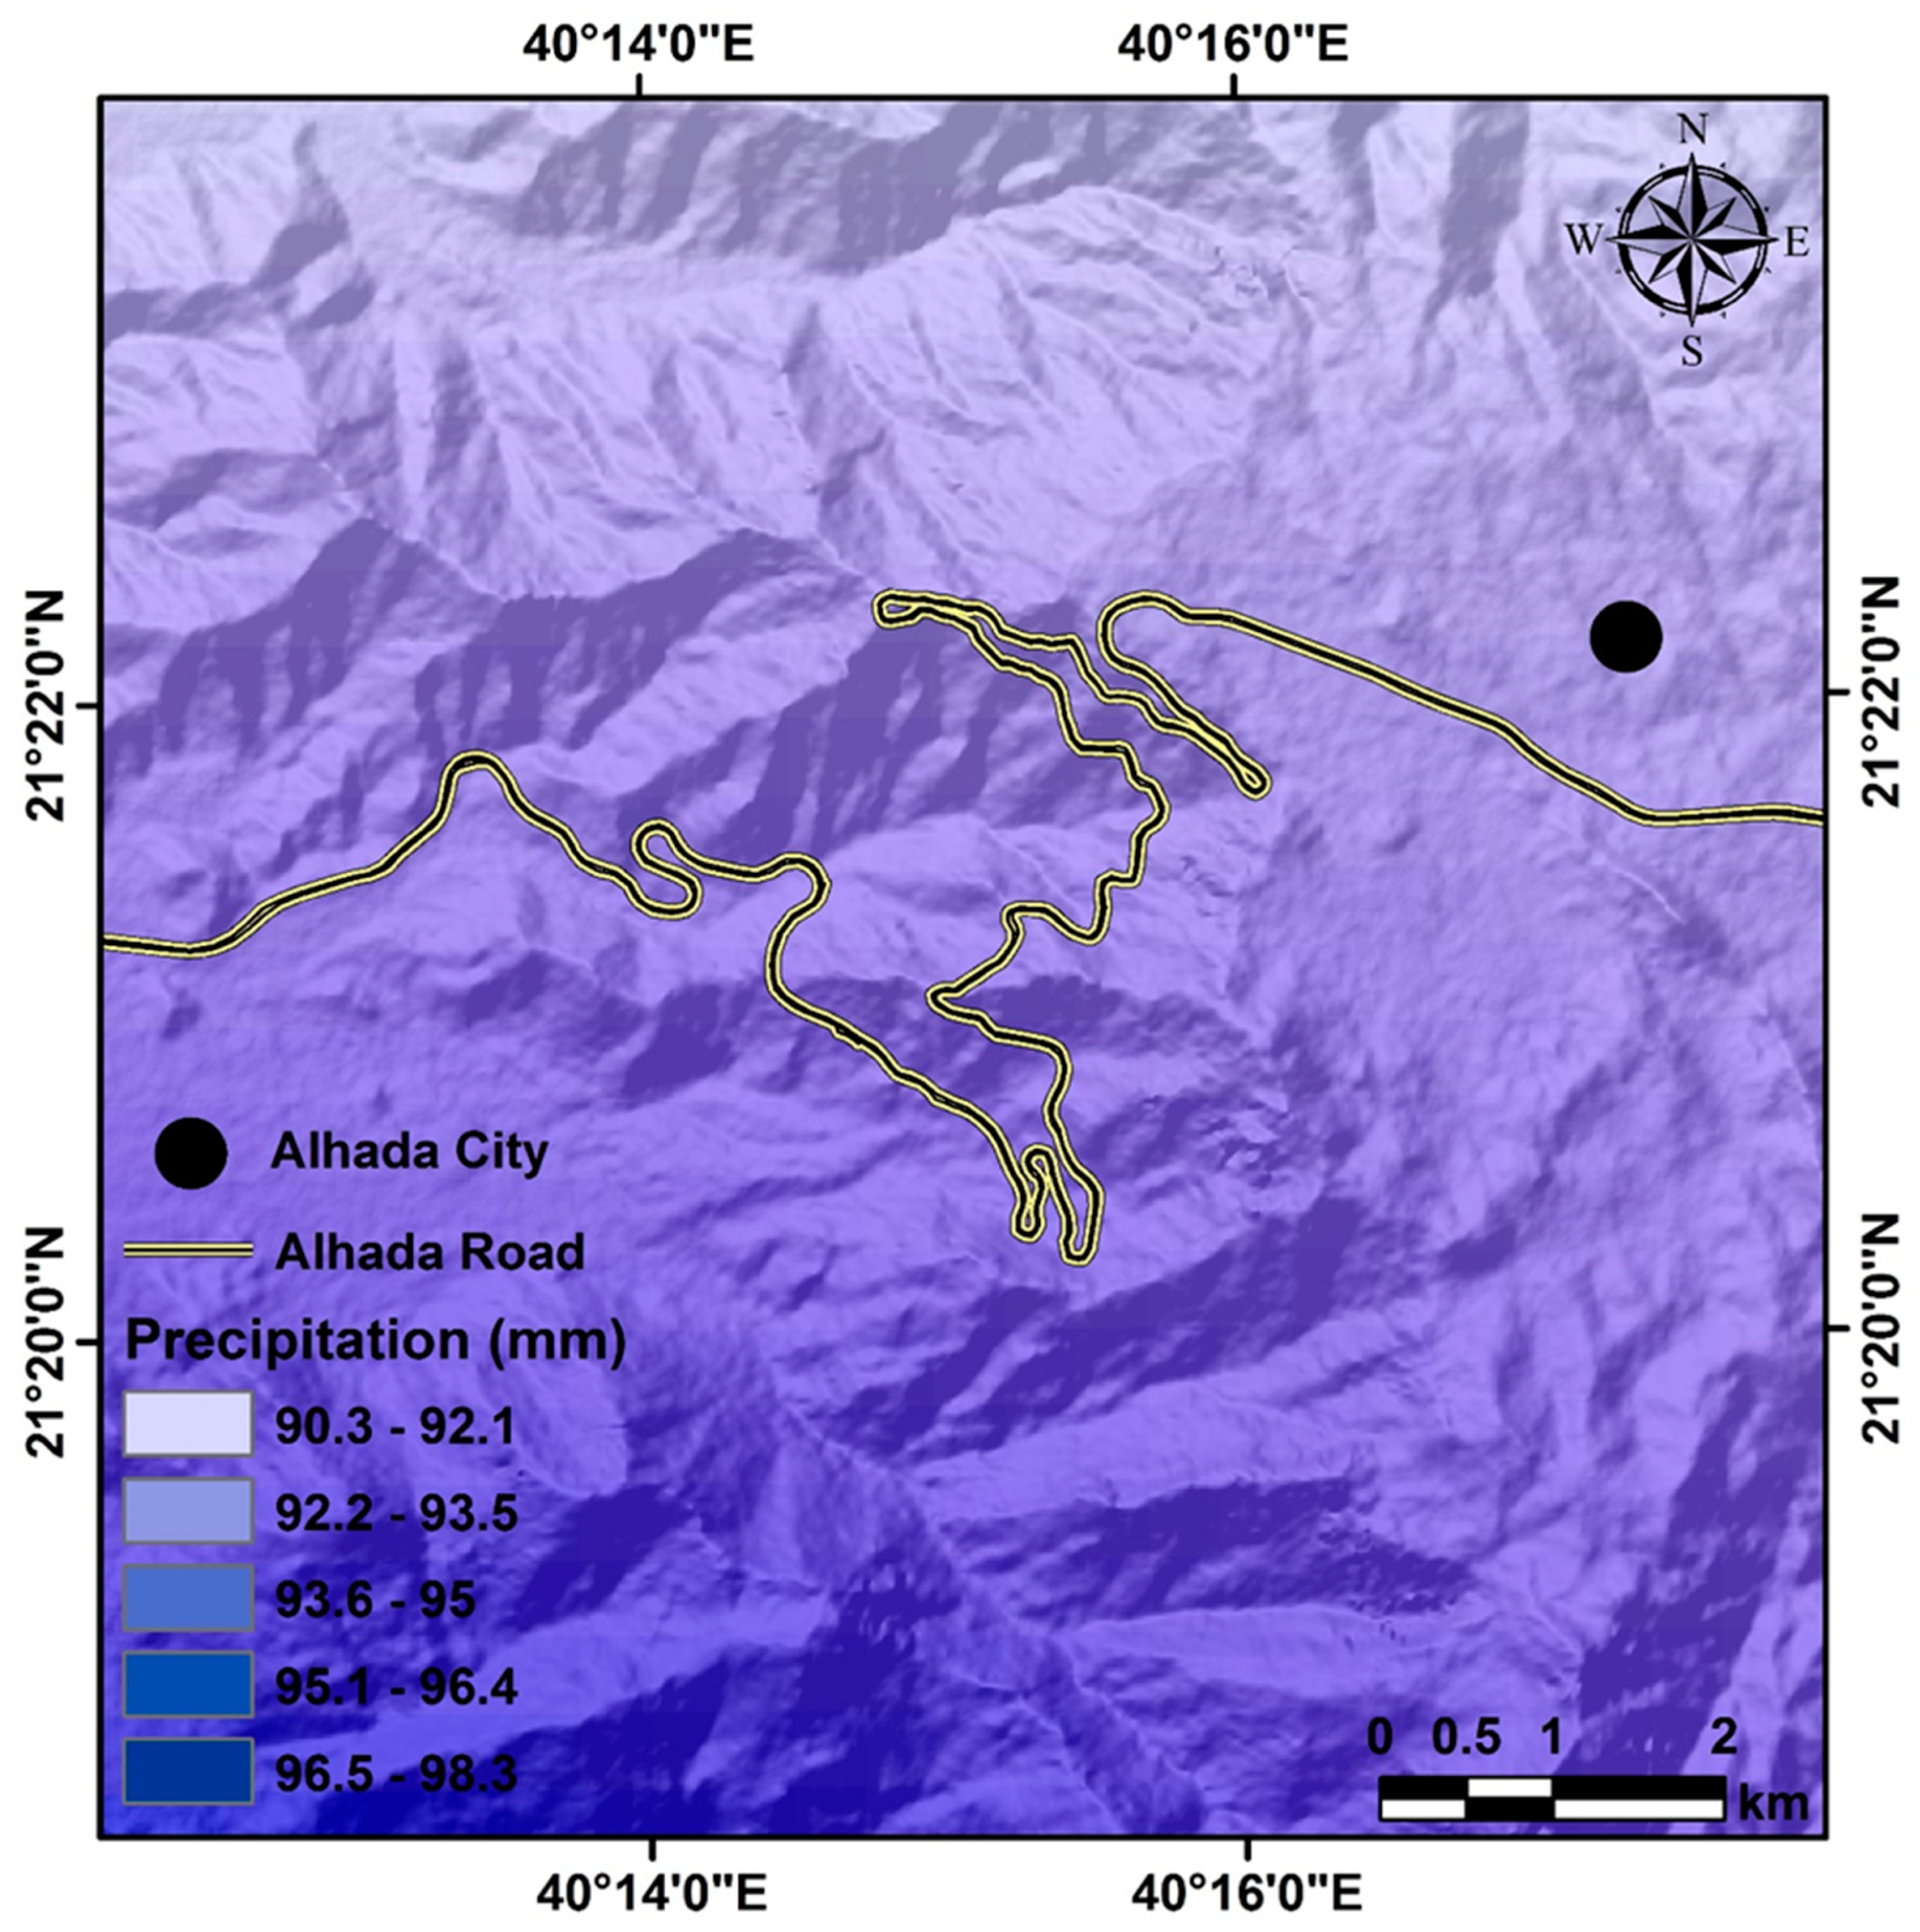
Figure 8.
A geological map of the study area’s rock types. Diorite, granodiorite, granite, and granite gneiss rocks are the most common types in the study area.
Figure 8.
A geological map of the study area’s rock types. Diorite, granodiorite, granite, and granite gneiss rocks are the most common types in the study area.
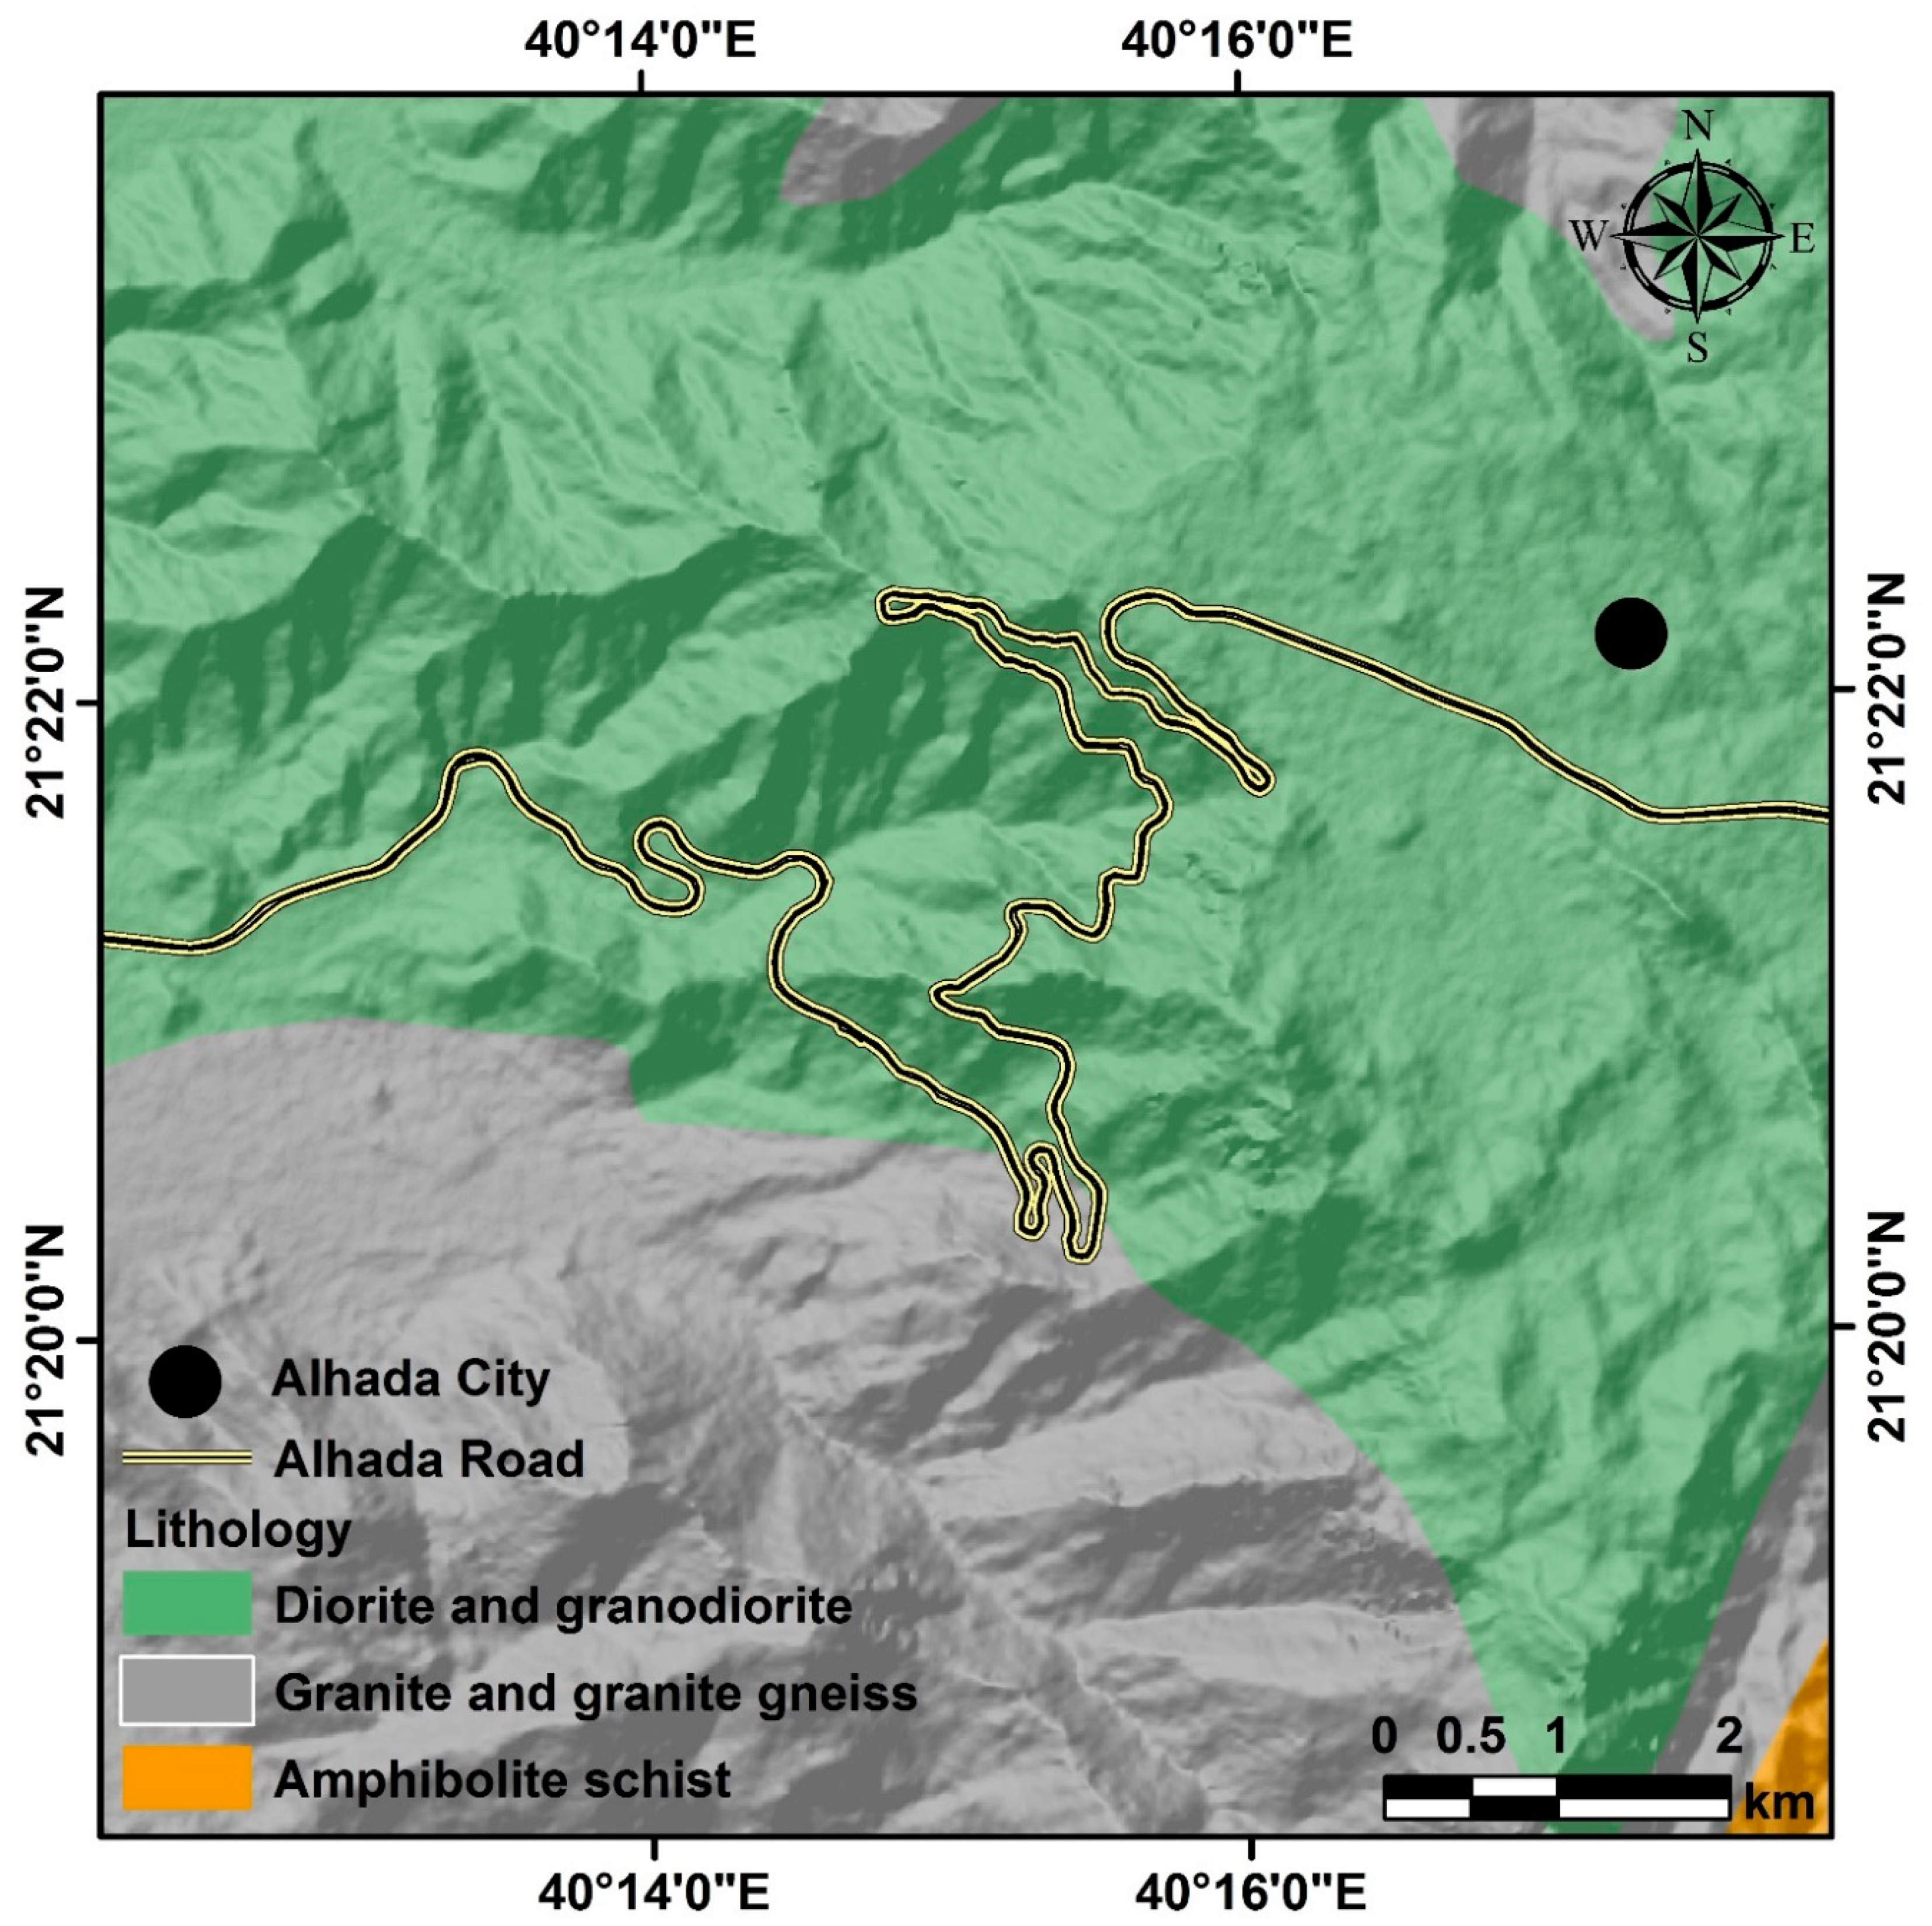
Figure 9.
A map displays the distribution of soil types within the study area.
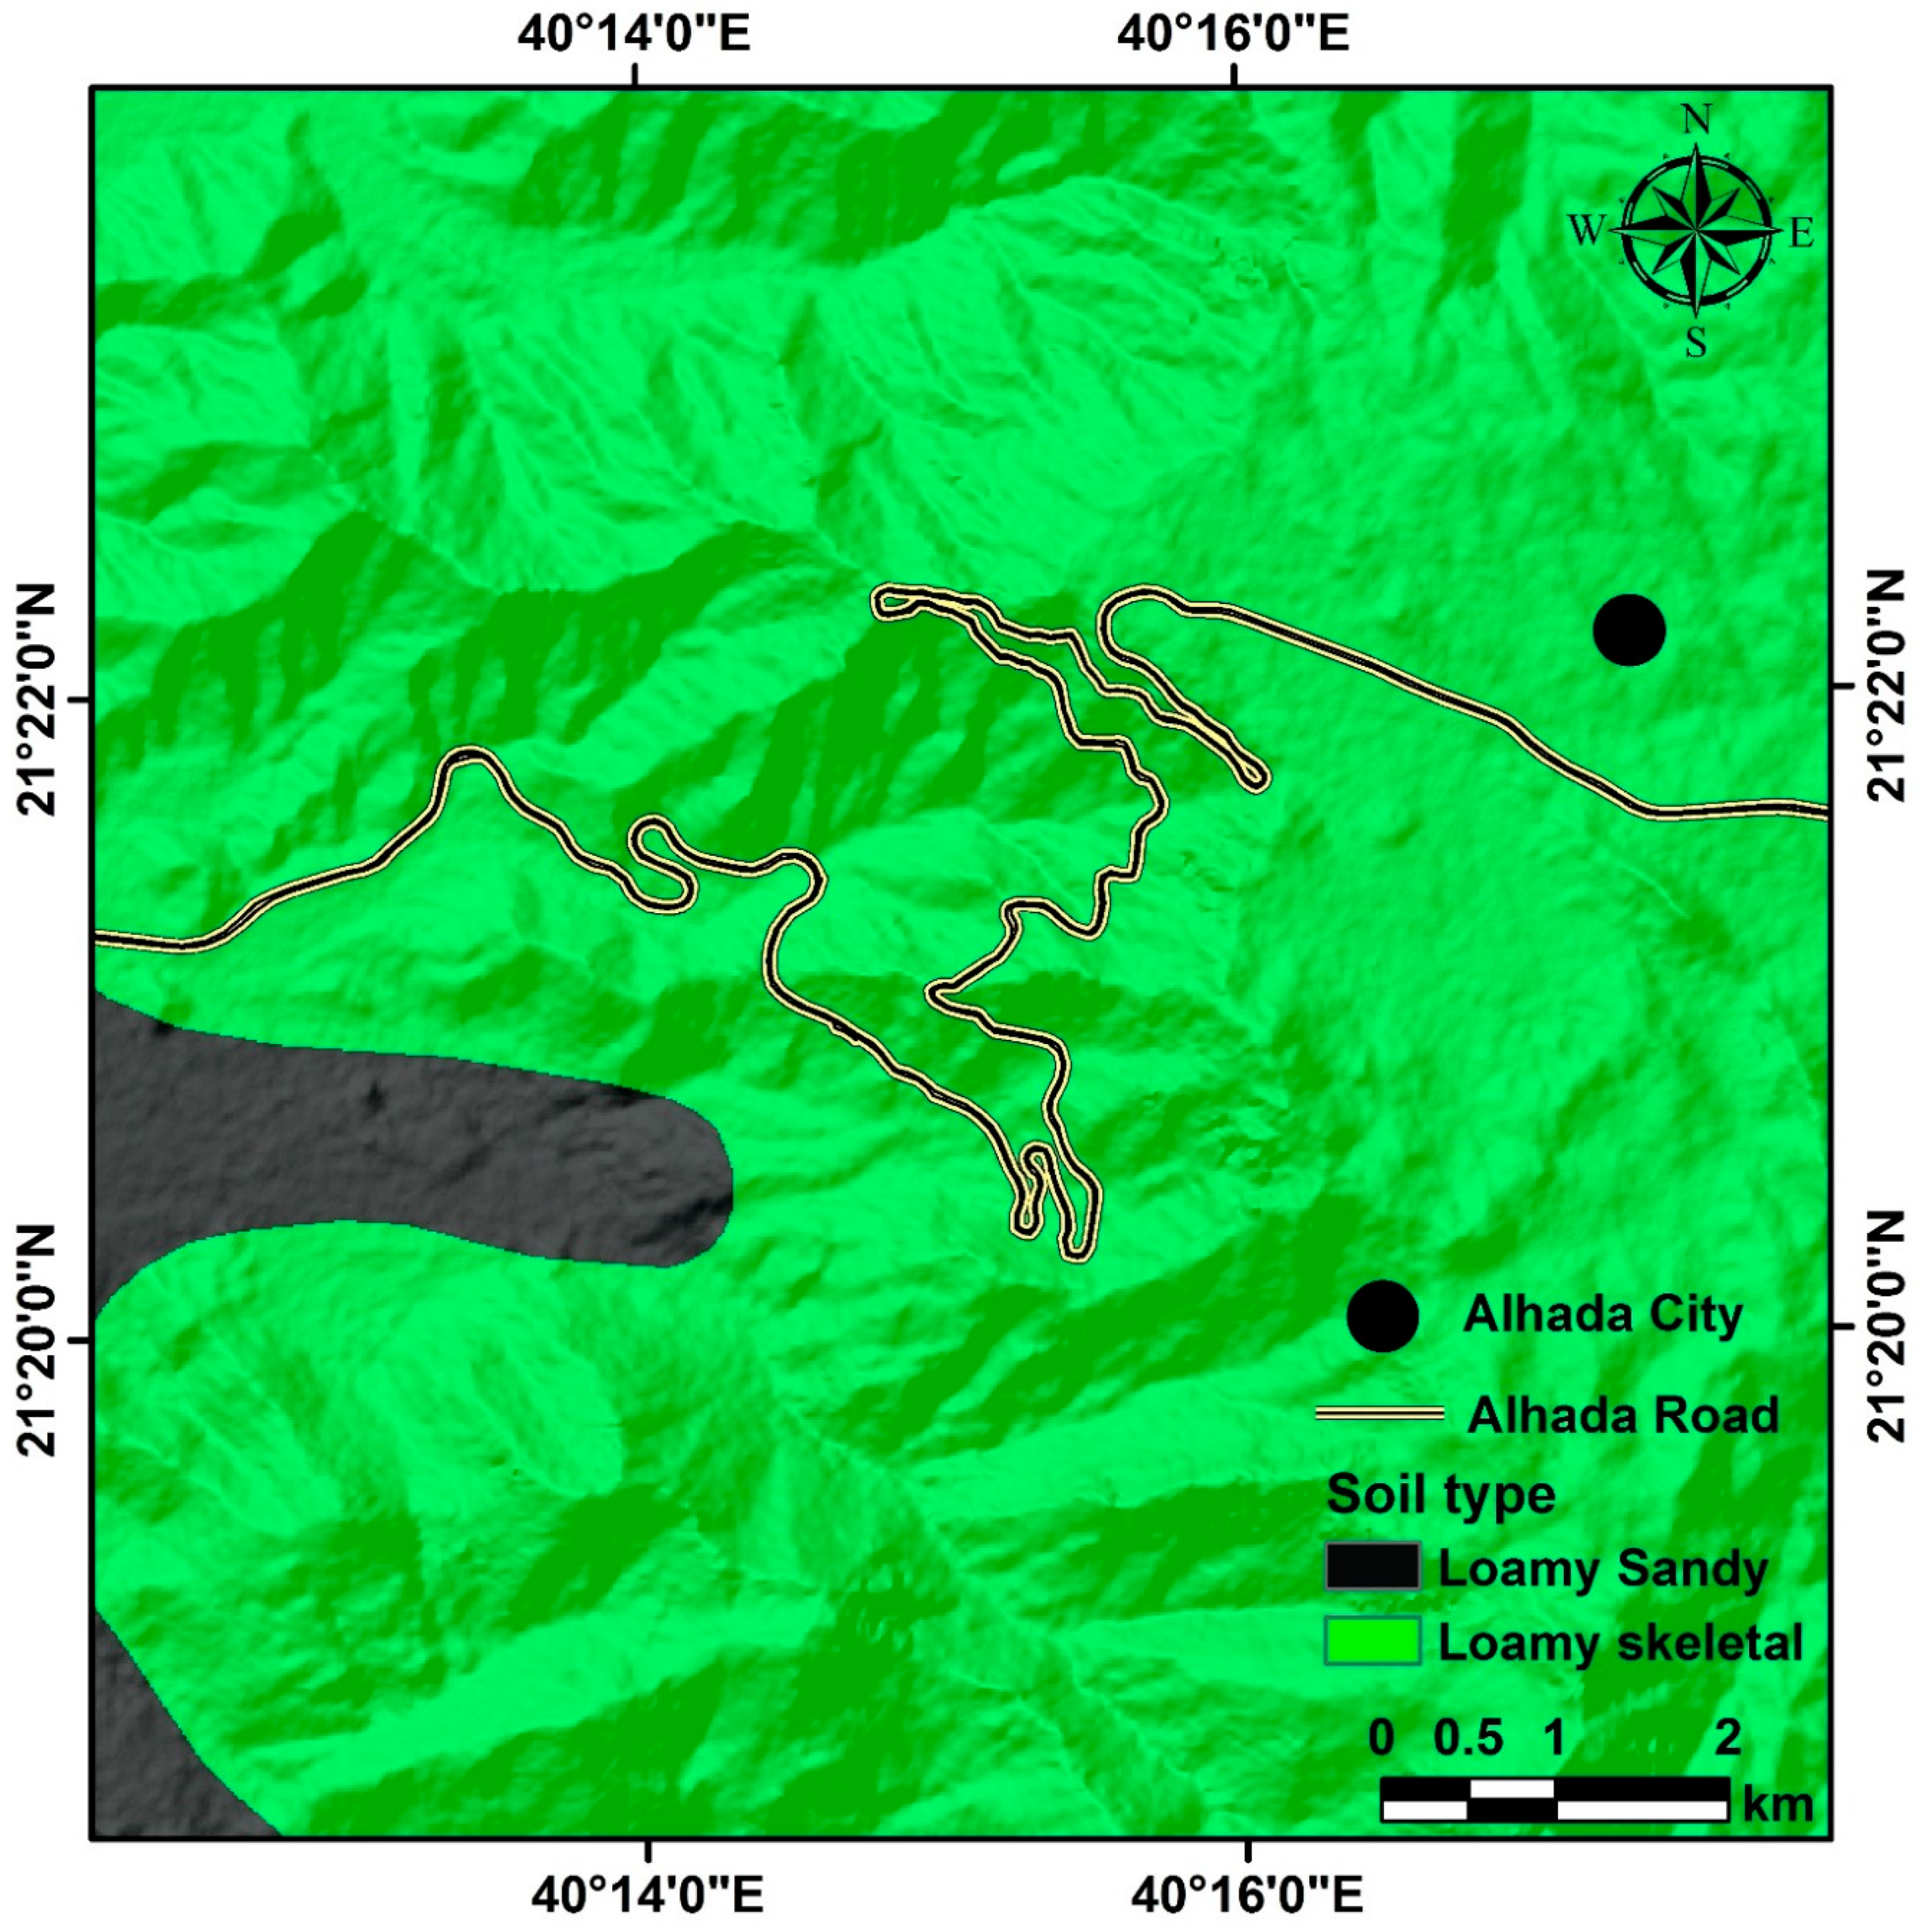
Figure 10.
A map showing the five different aspect direction classes in the study area.
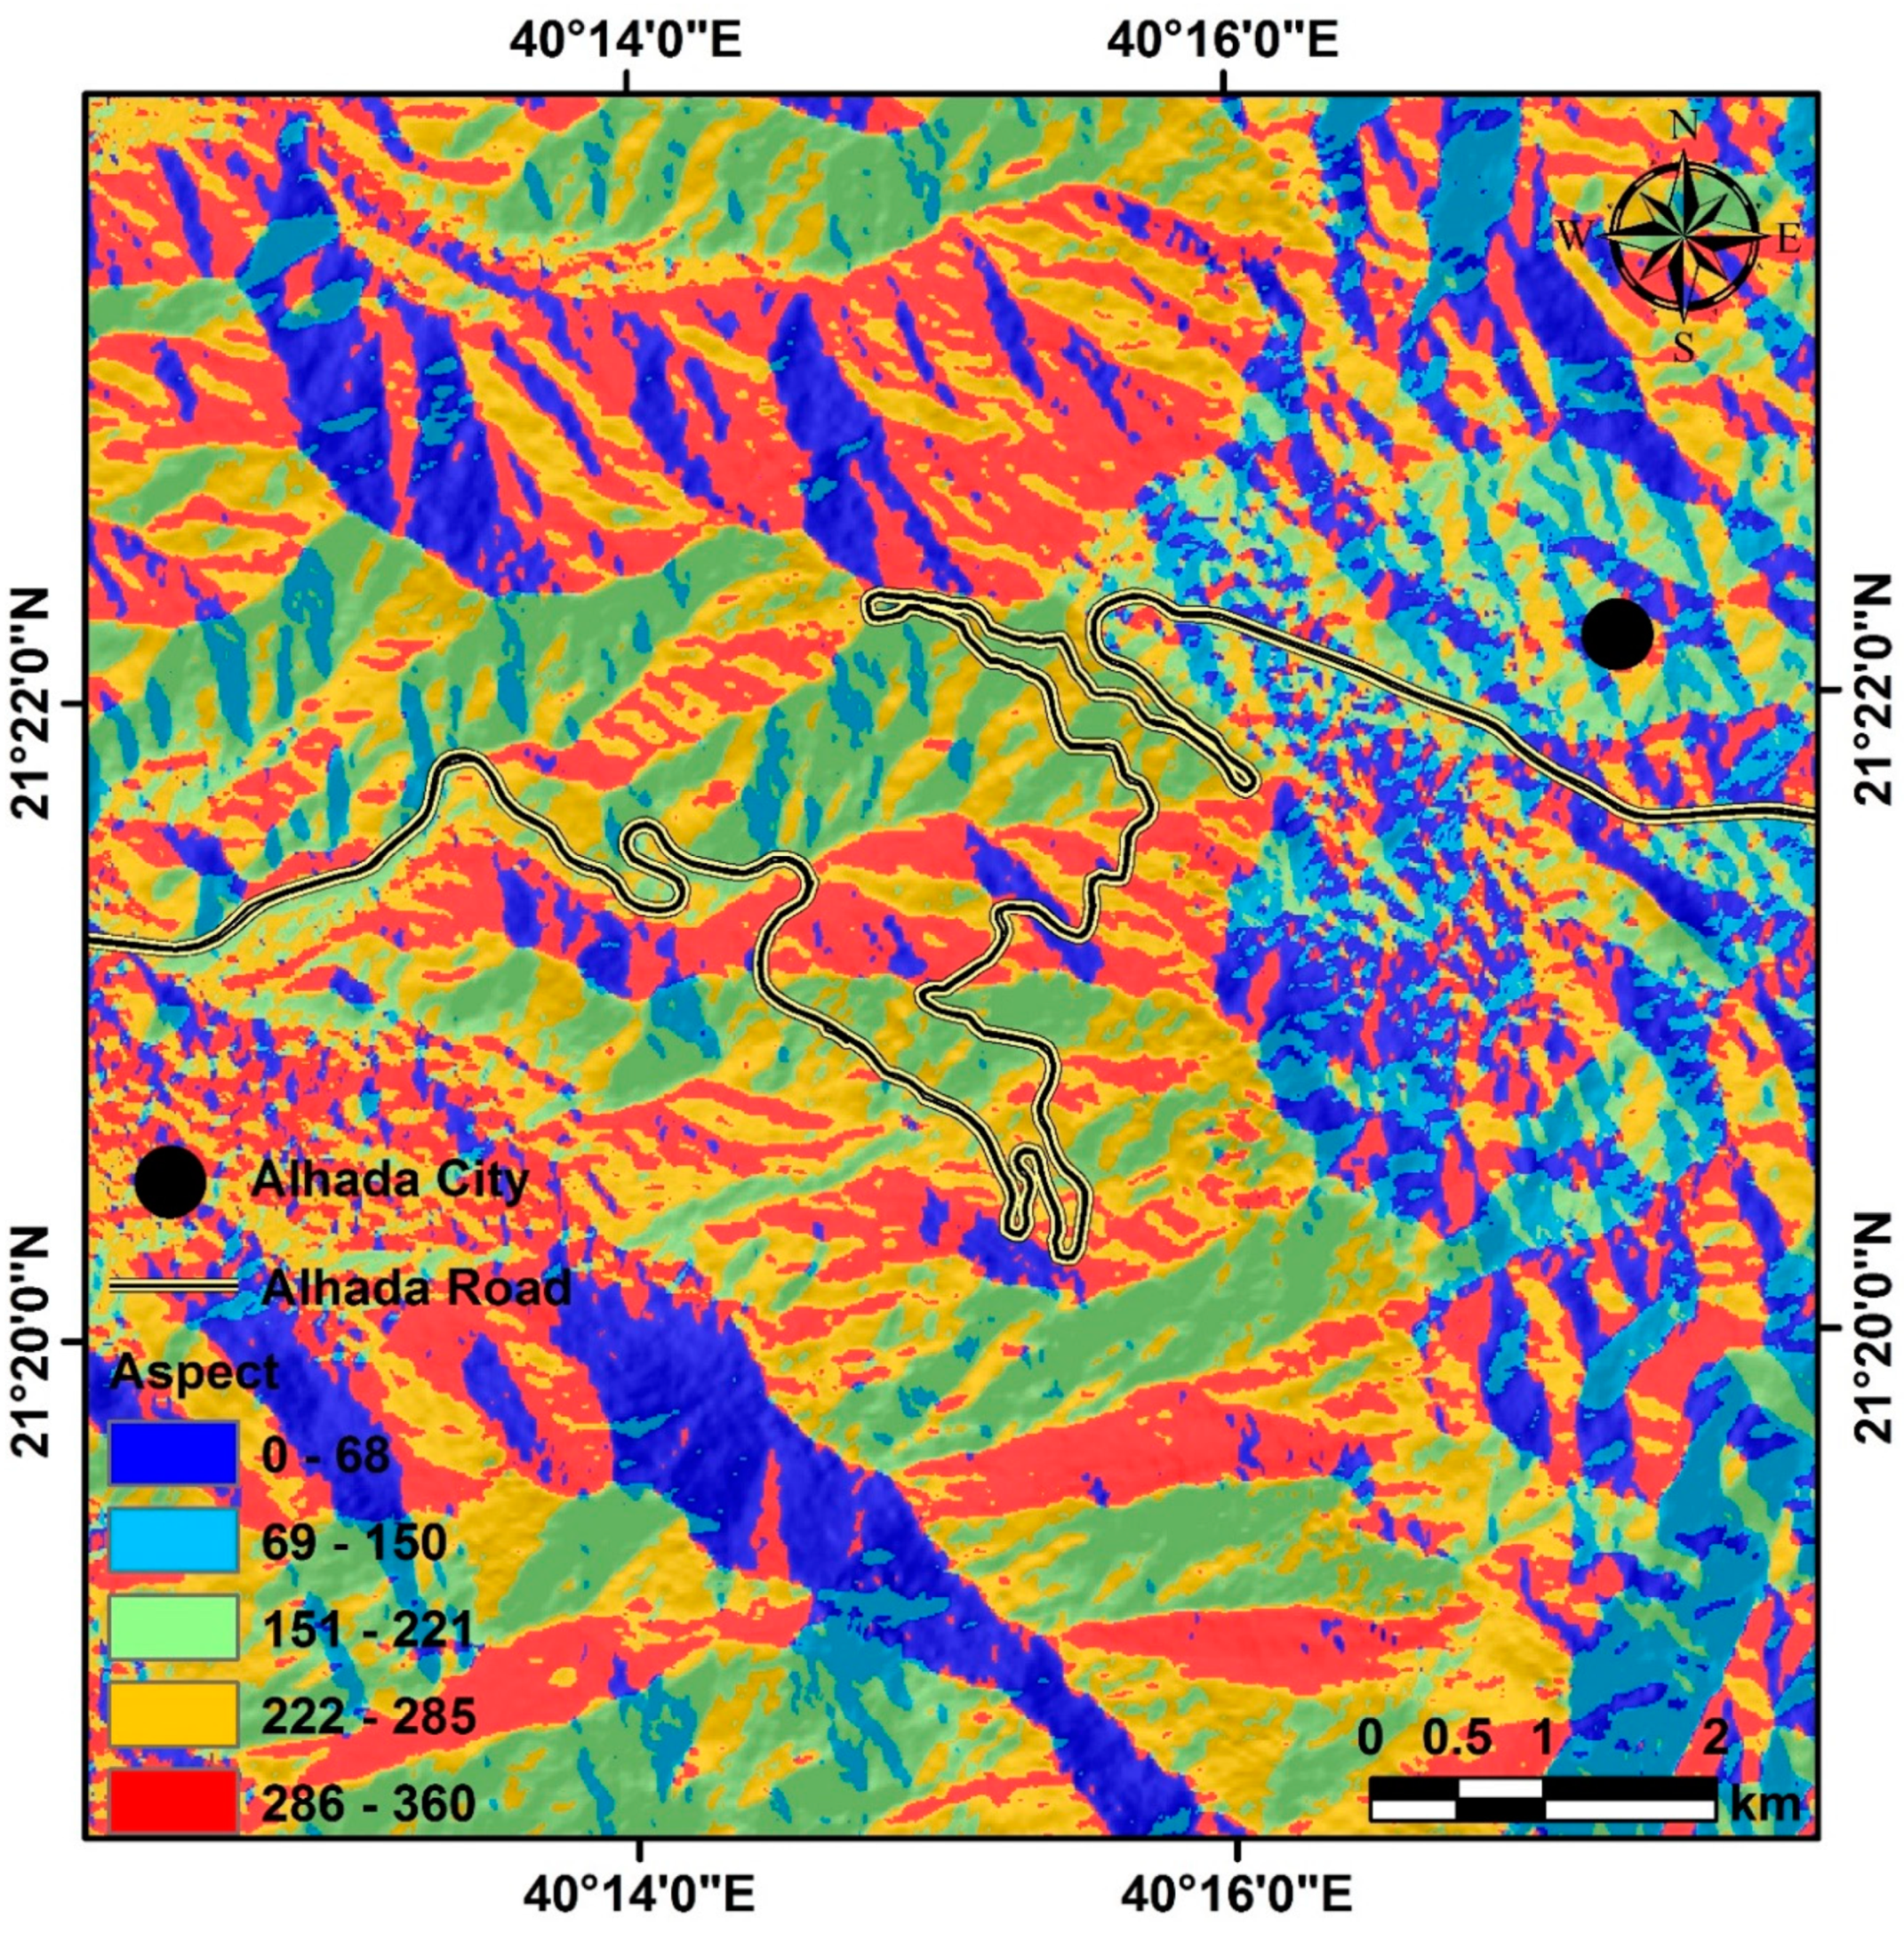
Figure 11.
A map exhibiting the land use/land cover of the study area. It indicates that the majority of the area is bare land, with residential areas coming in second as the main cover type. Agricultural areas, on the other hand, only represent a small portion of the area.
Figure 11.
A map exhibiting the land use/land cover of the study area. It indicates that the majority of the area is bare land, with residential areas coming in second as the main cover type. Agricultural areas, on the other hand, only represent a small portion of the area.
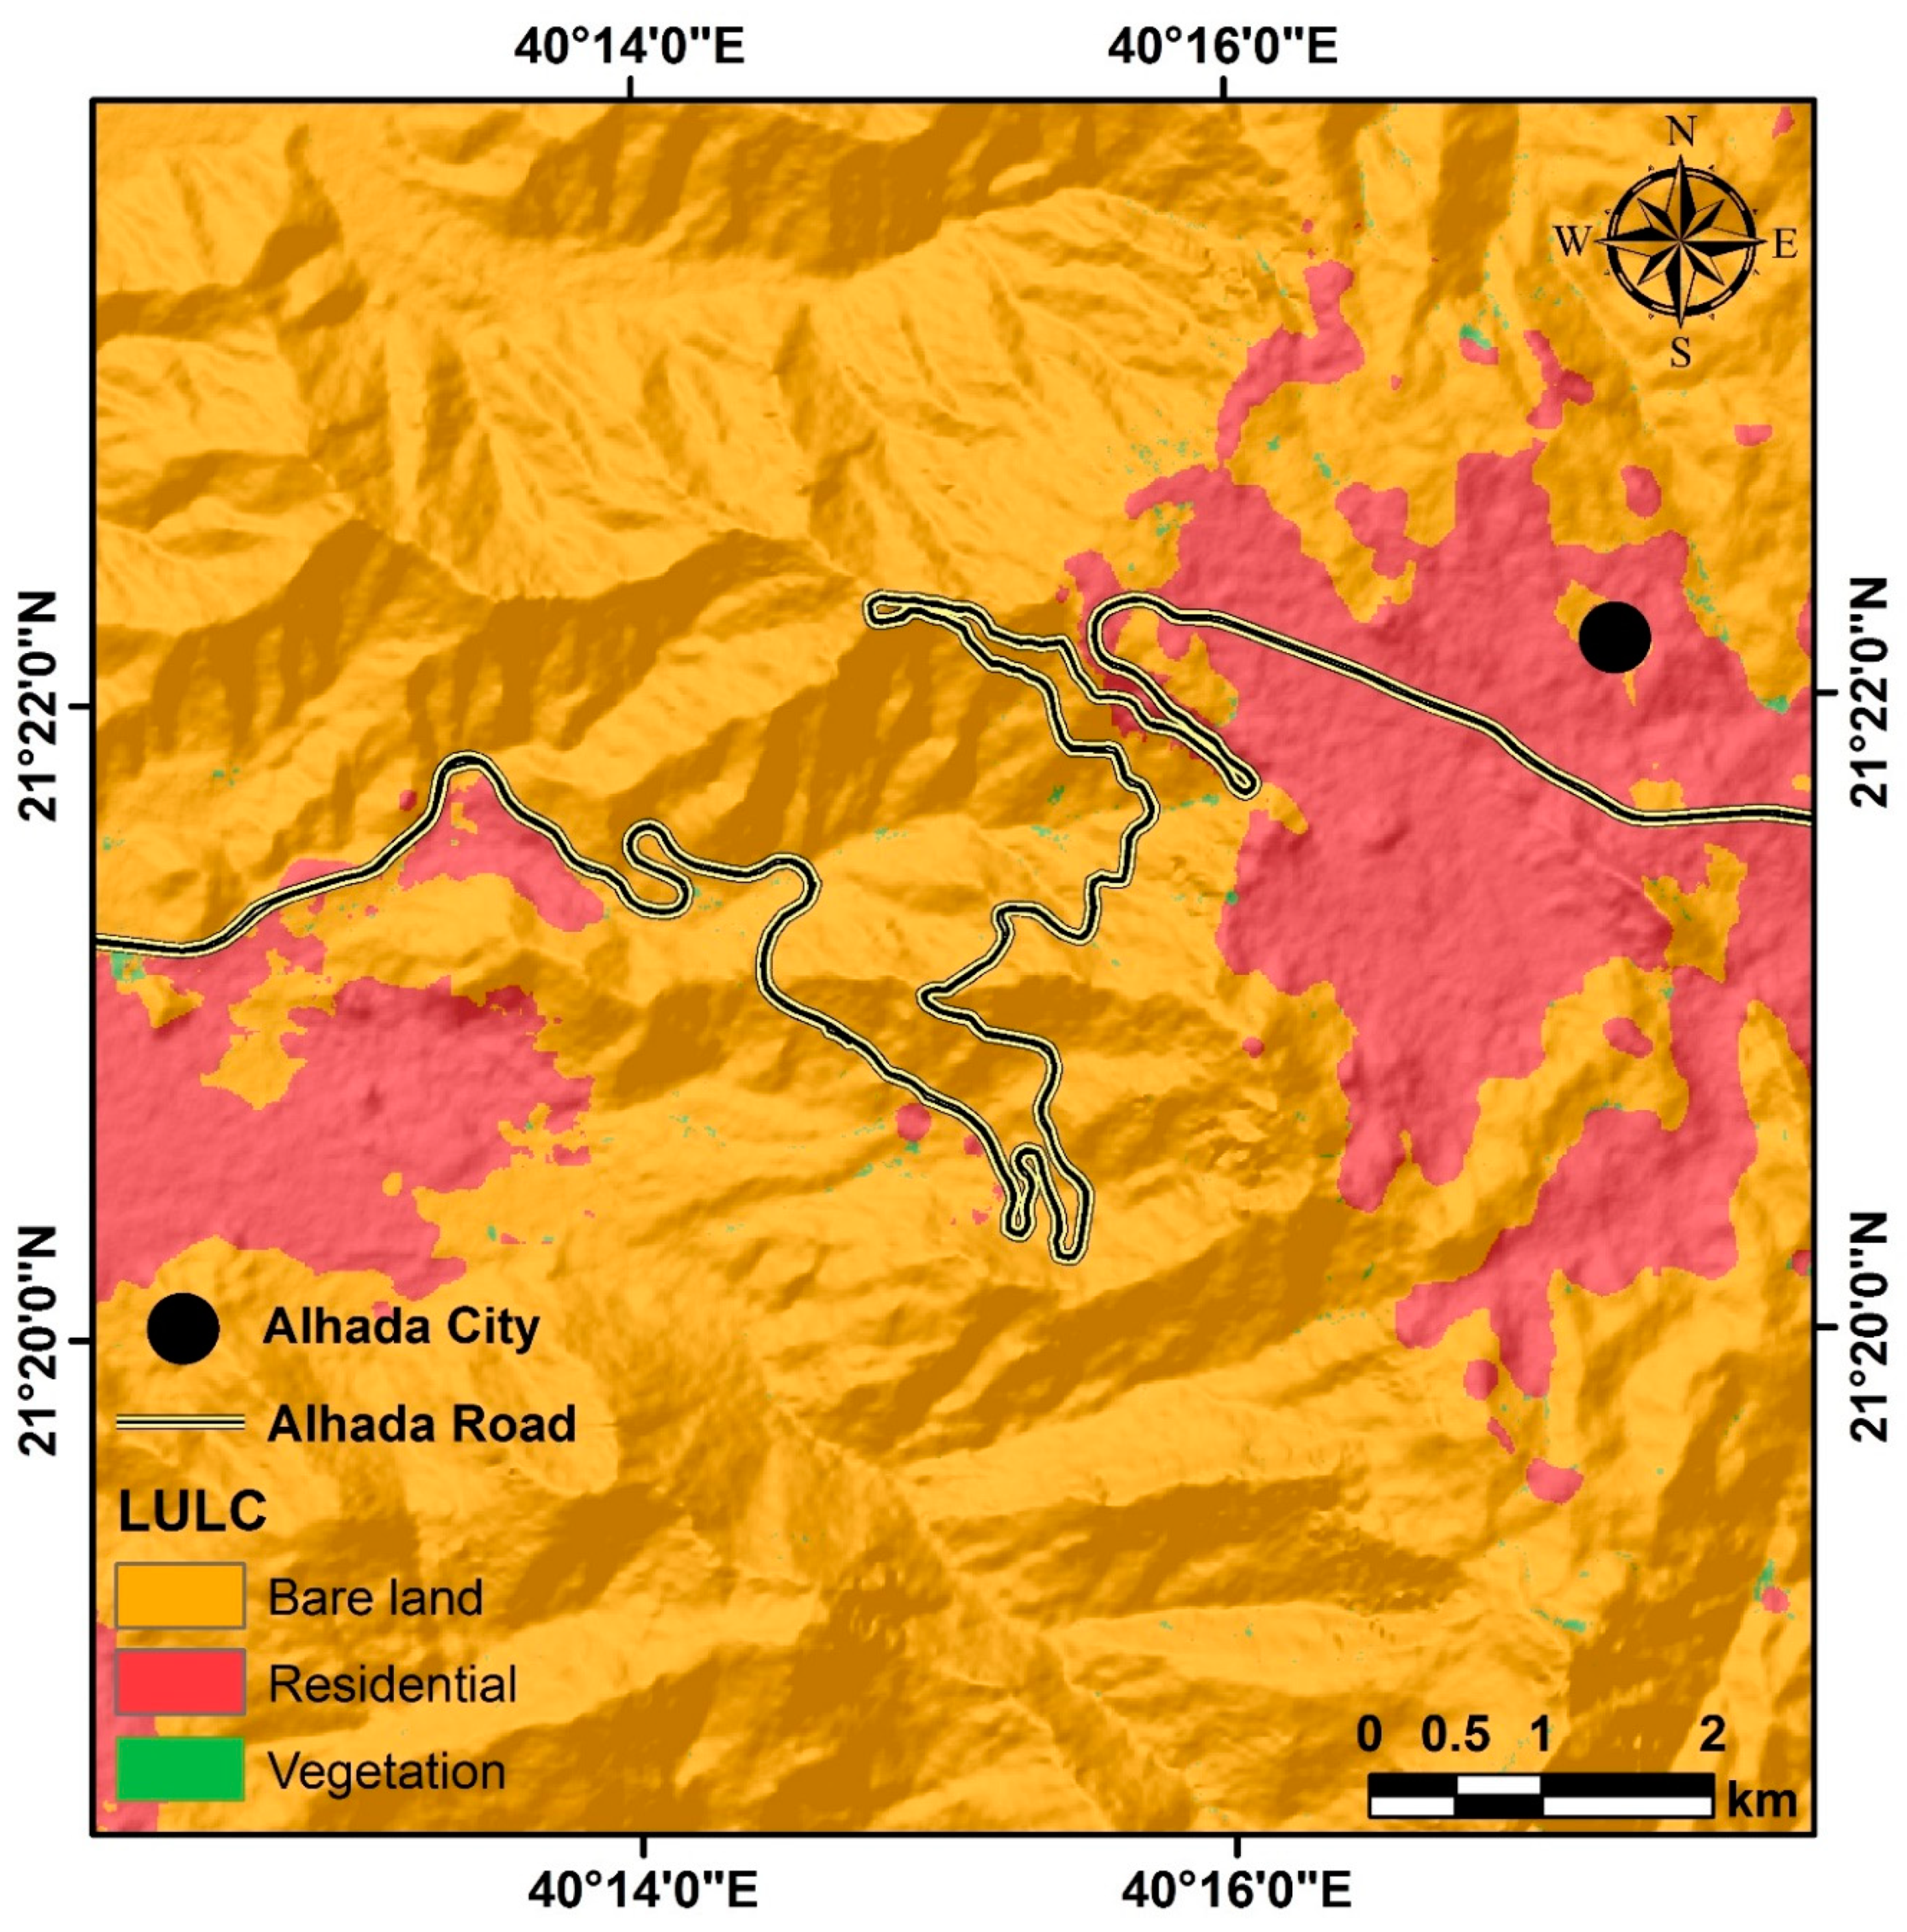
Figure 12.
Map displaying the potential debris flow zones in the Al-Hada Road area.
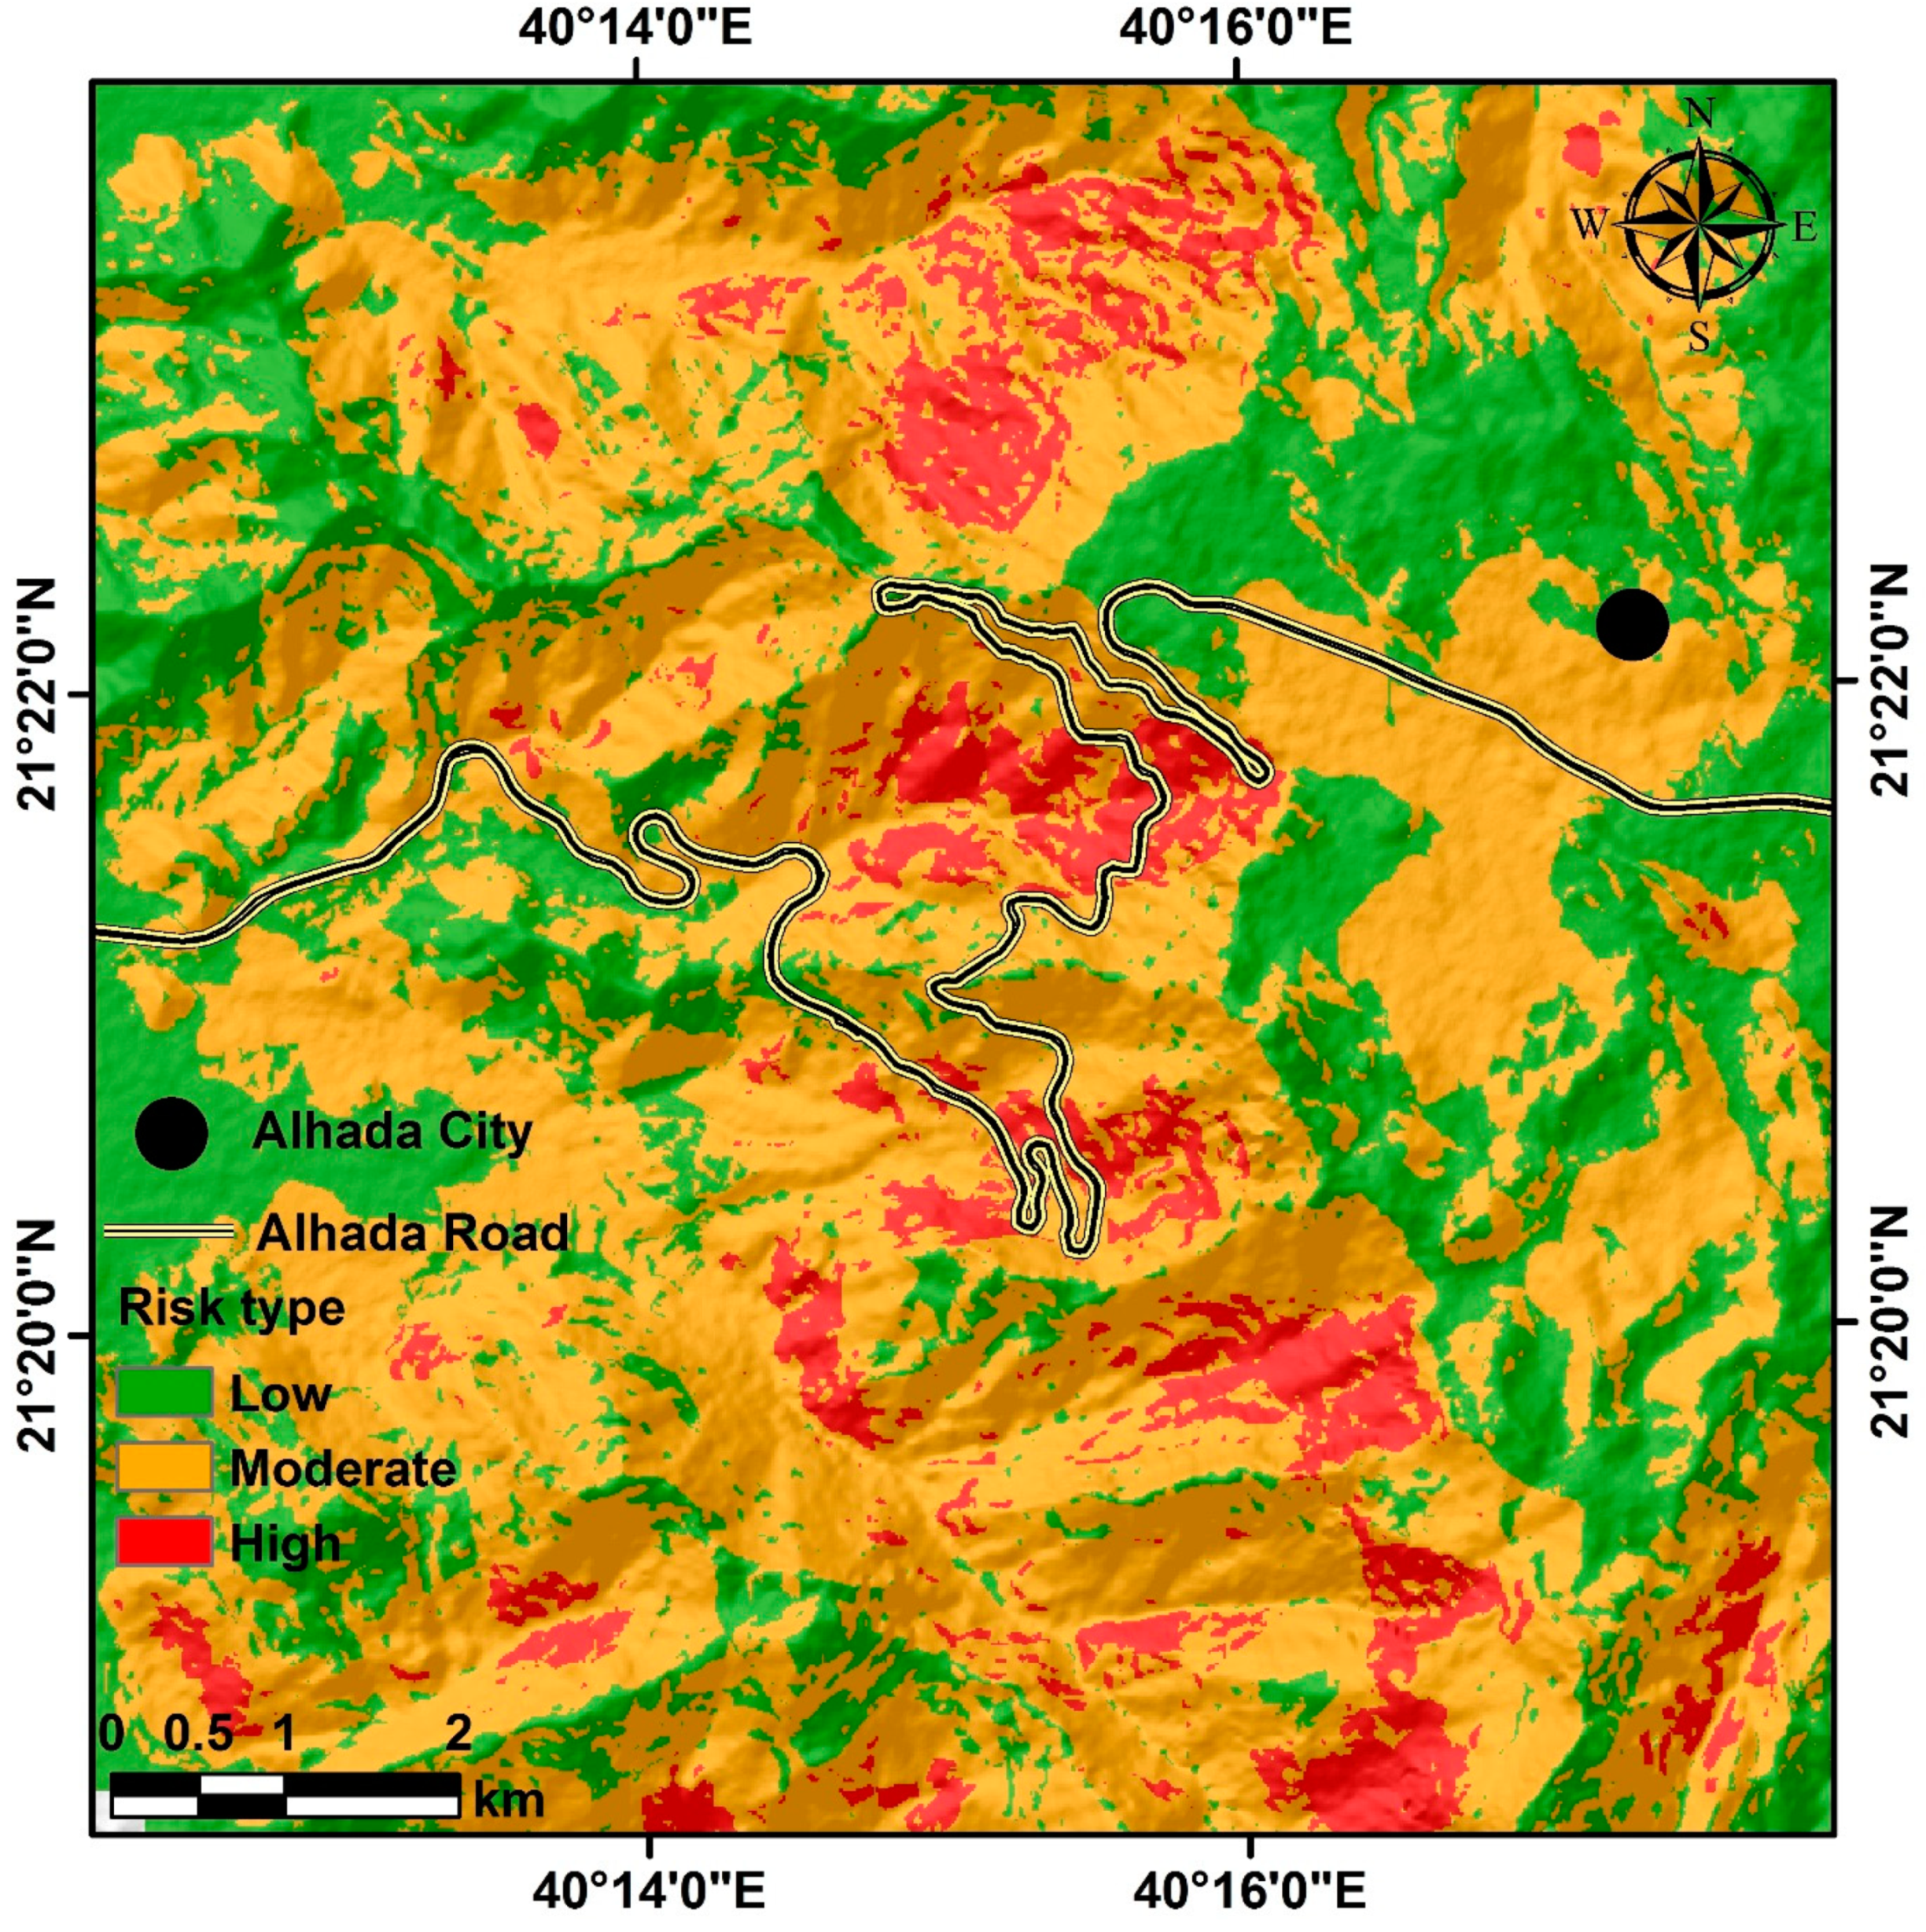
Figure 13.
Potential debris flow zones resulting from weighted overlay analysis and the 11 observed debris flows from the field trip to Al-Hada Mountain. The figure demonstrates the validity of the proposed method for assessing debris flow hazards in the study area.
Figure 13.
Potential debris flow zones resulting from weighted overlay analysis and the 11 observed debris flows from the field trip to Al-Hada Mountain. The figure demonstrates the validity of the proposed method for assessing debris flow hazards in the study area.
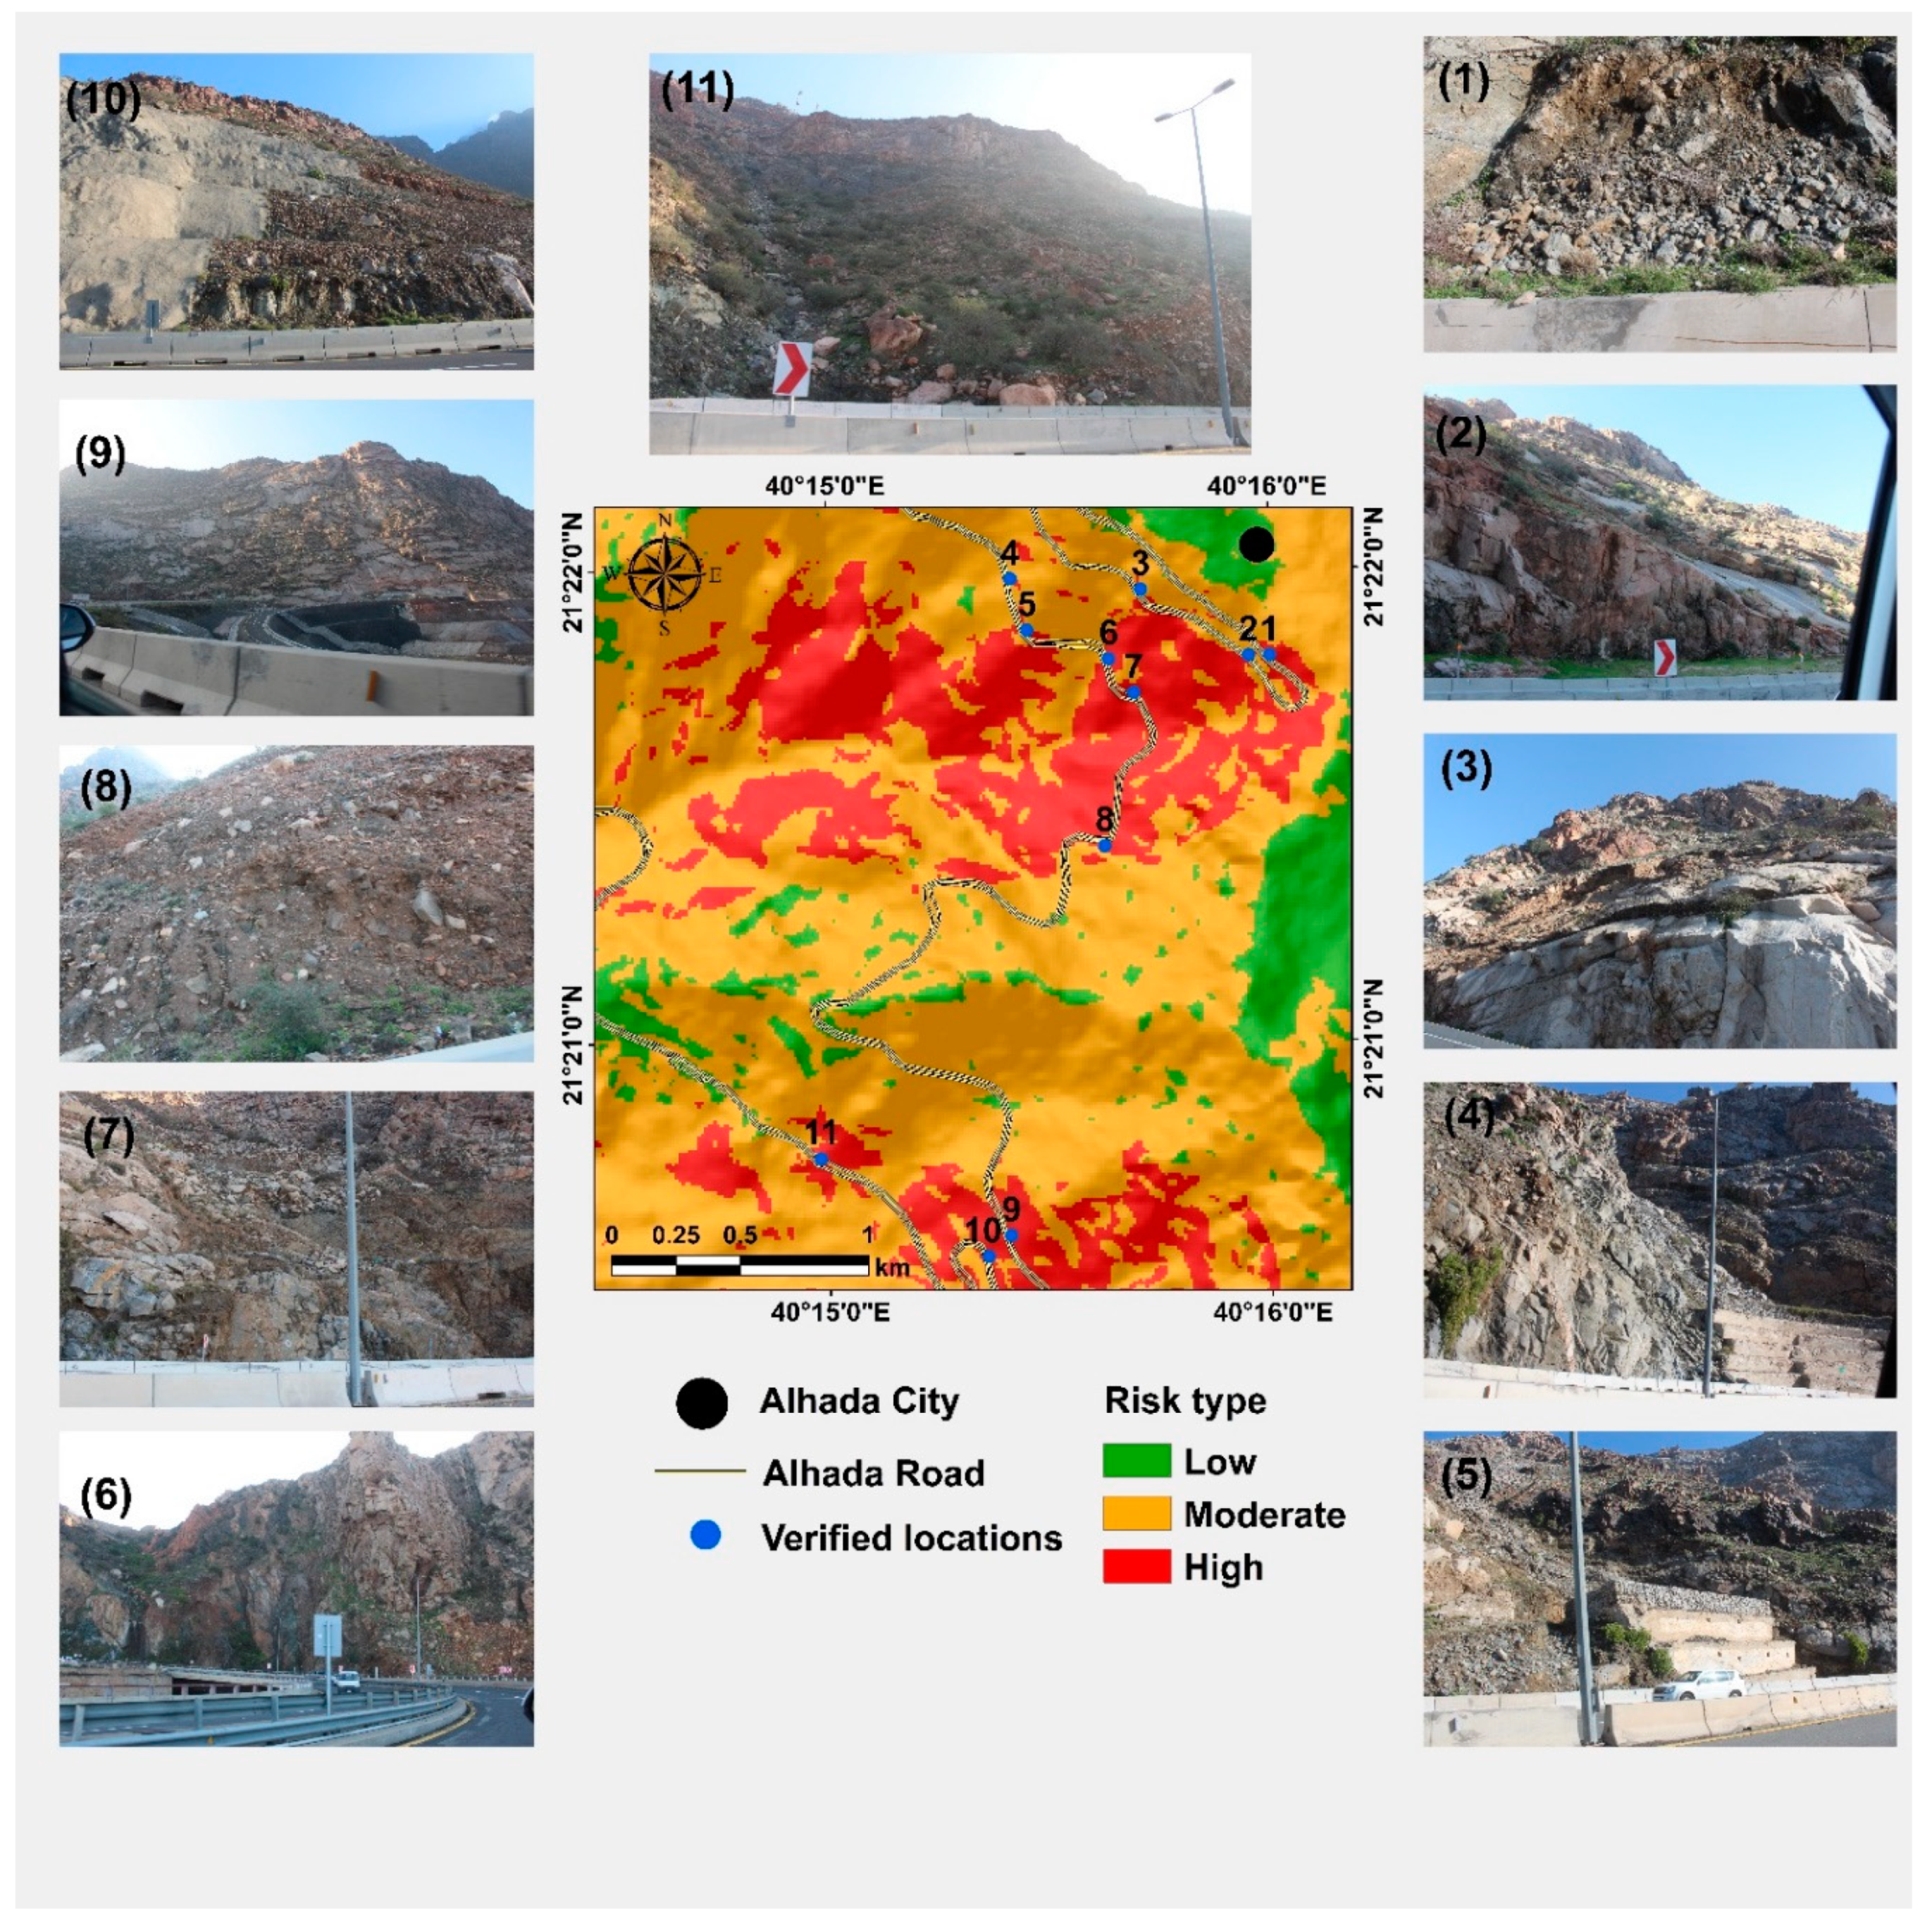

Table 1.
The layers utilized in the overlay analysis to identify potential debris flow zones and their influences, classes, and scales.
Table 1.
The layers utilized in the overlay analysis to identify potential debris flow zones and their influences, classes, and scales.
| Parameter | Weight (%) | Classes | Rank |
|---|---|---|---|
| Slope (Degree) |
30 | 0–10 | 1 |
| 11–20 | 2 | ||
| 21–29 | 3 | ||
| 30–40 | 4 | ||
| 41–78 | 5 | ||
| Precipitation (mm) |
5 | 90.3–92.1 | 1 |
| 92.2–93.5 | 2 | ||
| 93.6–95 | 3 | ||
| 95.1–96.4 | 4 | ||
| 96.5–98.3 | 5 | ||
| Elevation (m) |
10 | 656–922 | 1 |
| 923–1181 | 2 | ||
| 1182–1460 | 3 | ||
| 1461–1799 | 4 | ||
| 1800–2336 | 5 | ||
| Lithology | 5 | Granite and granite gneiss | 3 |
| Amphibolite schist | 1 | ||
| Diorite and granodiorite | 2 | ||
| Drainage density (km2) | 35 | 0–1.07 | 1 |
| 1.08–1.97 | 2 | ||
| 1.98–2.9 | 3 | ||
| 2.91–3.87 | 4 | ||
| 3.88–6.21 | 5 | ||
| Soil | 5 | Loamy Sandy | 1 |
| Loamy-skeletal | 2 | ||
| Aspect | 5 | 0–68 (NE) | 1 |
| 69–150 (NE-SE) | 2 | ||
| 151–221 (SE-SW) | 3 | ||
| 222–285 (SW-NW) | 4 | ||
| 286–360 (NW) | 5 | ||
| Land use/land cover | 5 | Residential | 1 |
| Vegetation | 2 | ||
| Bare land | 3 |
Disclaimer/Publisher’s Note: The statements, opinions and data contained in all publications are solely those of the individual author(s) and contributor(s) and not of MDPI and/or the editor(s). MDPI and/or the editor(s) disclaim responsibility for any injury to people or property resulting from any ideas, methods, instructions or products referred to in the content. |
© 2023 by the authors. Licensee MDPI, Basel, Switzerland. This article is an open access article distributed under the terms and conditions of the Creative Commons Attribution (CC BY) license (https://creativecommons.org/licenses/by/4.0/).
Copyright: This open access article is published under a Creative Commons CC BY 4.0 license, which permit the free download, distribution, and reuse, provided that the author and preprint are cited in any reuse.


