1. Introduction
Buildings are essential attributes of an urban environment. The extraction of building outlines is widely performed for topographic mapping, cadastral purposes, urban planning, disaster management and population density analysis [
2]. Other applications, such as solar radiation potential assessment to plan solar panel installation, wind flow simulations for pollutant diffusion analysis in the built environment and mobile telecommunication installations necessitate more detailed building geometry information including roof shape knowledge [
3]. And thus, to generate 3D building models, reconstruction of the building roof structure is needed.
As buildings are likely to change over time, there is a need for accurate and efficient geometric models [
4]. Given the availability of decimetre-resolution aerial images and elevation data, it is possible to extract detailed information about building outlines and their roof geometry [
5]. In this regard, machine learning methods gives a great opportunity to develop building extraction workflows that consume less time and human labour resources [
6]. Furthermore, recent approaches based on deep learning (DL) algorithms, e.g., Convolutional Neural Networks (CNN), Fully Convolutional Networks (FCN), and Recurrent Neural Networks (RNN), showed high potential to recognize and extract detailed building features [
4,
7,
8,
9].
Given the importance of 3D building models in addressing urban issues and the complex and changing nature of buildings, developing an automatic method that reduces costs, time, and human effort is critical. Until now, there have been limited studies on the automatic extraction of building roof geometry in vector format. Such studies face problems such as false detection, misclassifications and low computational efficiency [
7,
10]. They are limited to image patches with single buildings and the fact is that the majority of the methods produce output in the raster format, which leaves the scope for further improvement [
7,
10,
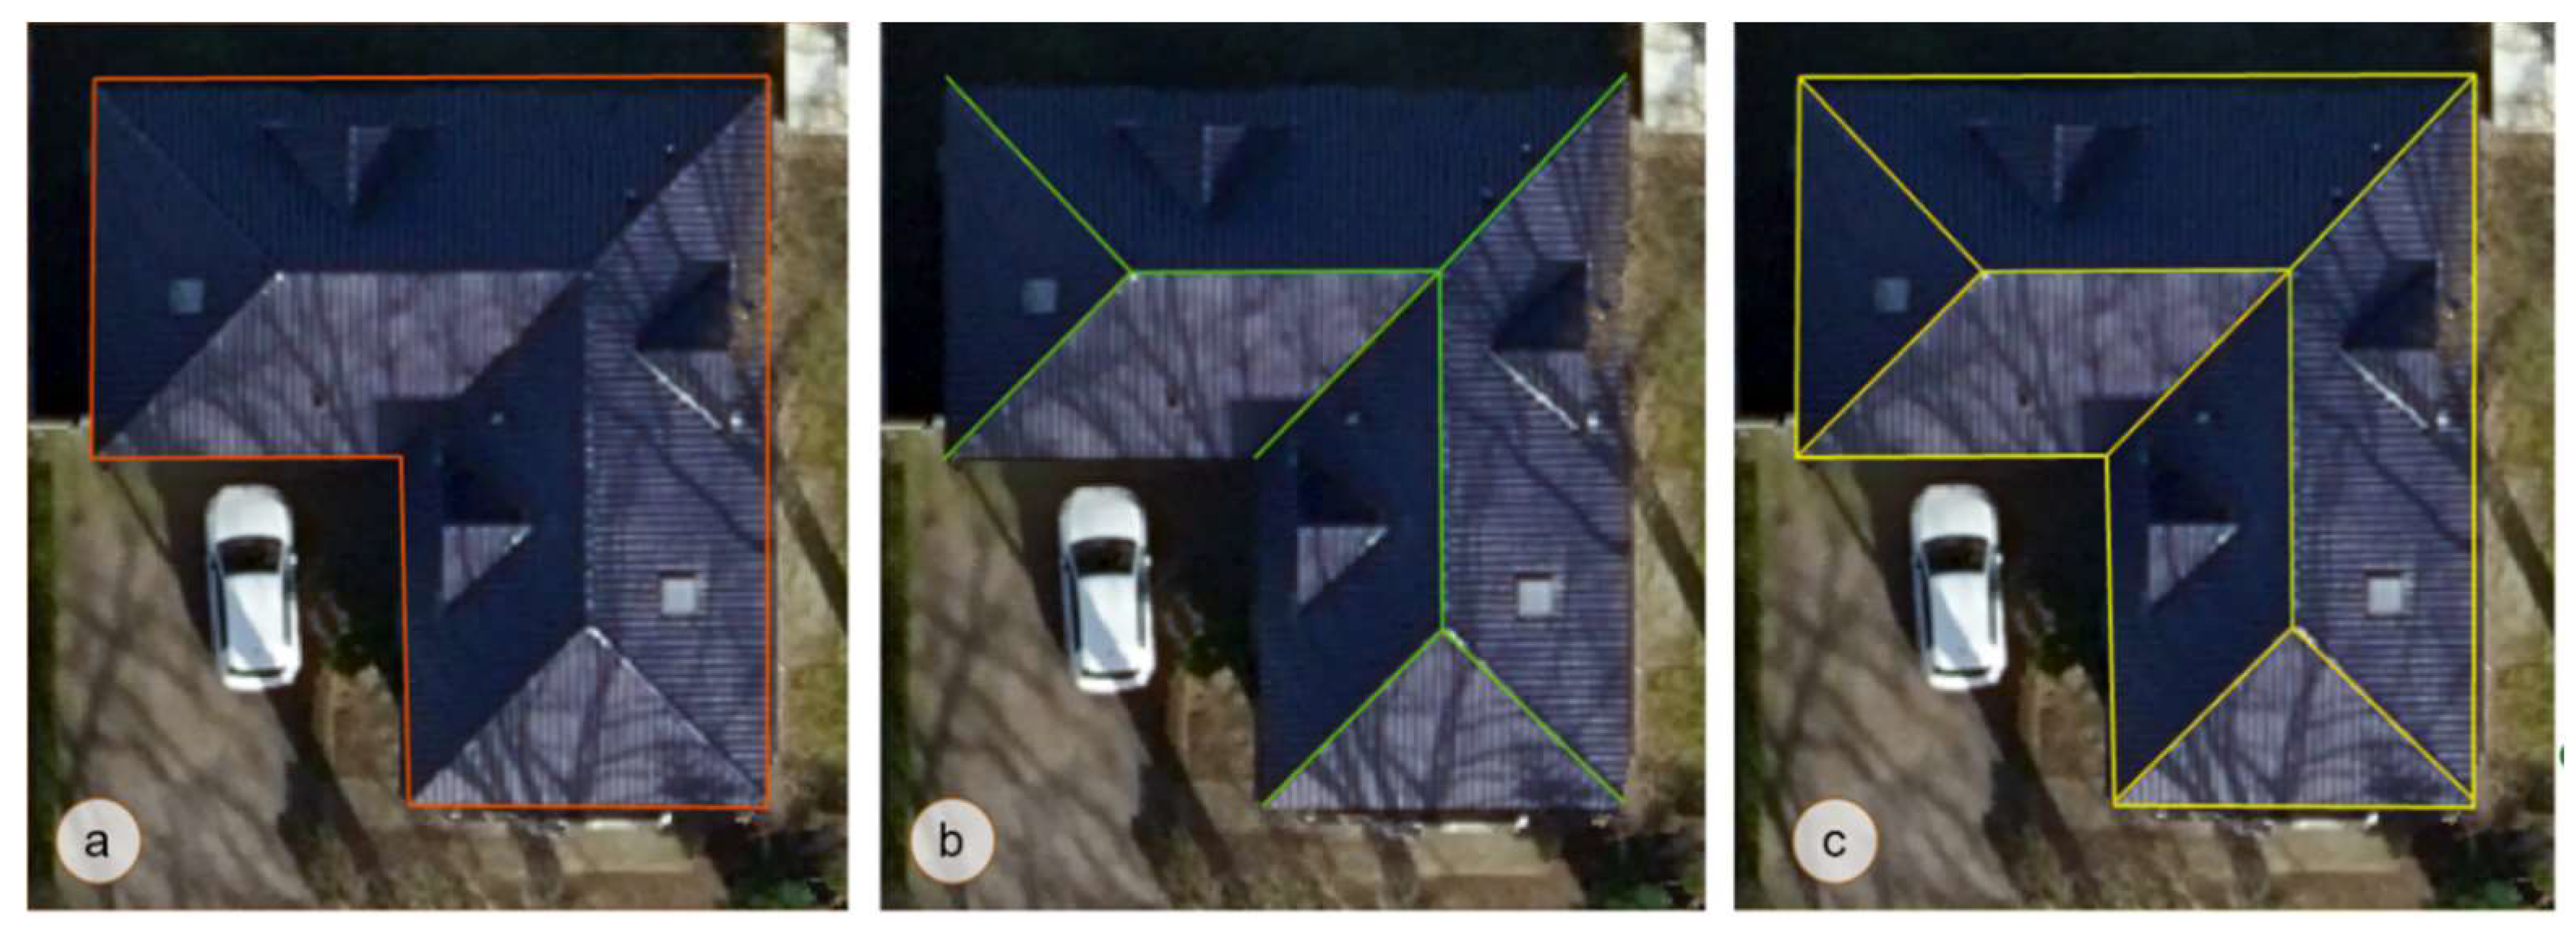
11]. To contribute to the progress of roof structure extraction research, we design Vectorized Roof Extractor – a deep learning-based method to extract building roof structures directly in a vector format (
Figure 1-c). [
1]The basis of our approach was inspired by [
1] that extracts building polygons in vector format. Our method retrieves not only building footprints but also building outlines (
Figure 1-a), which are external edges of the building roof, and inner rooflines (
Figure 1-b), internal intersections of the main roof planes. Besides, it contains simple and efficient vectorization and post-processing approach. We adapted the frame field learning method [
1] in the context of this research to compare it to our approach. We also take advantage of [
2], which proved that height information could improve building segmentation results. Thus, we aim to generate not only the polygons of the building outlines but also the inner rooflines in a vector format.
The proposed Vectorized Roof Extractor has several contributions to building roof structure extraction:
- 1)
The proposed method extracts multiple buildings in one image. This benefit makes training and prediction easier because we can output many roof structures of multiple buildings simultaneously during prediction.
- 2)
The method can detect the shared walls of the buildings.
- 3)
The method outputs are closed building outlines and inner rooflines in vector format.
The remainder of the paper is structured as follows. Related work sub-section provides a review of the related literature for building roof structure extraction. The materials and the method section present the dataset and its preparation and the overview of the research methodology. The details of evaluation metrics are also given in the section. The results section is divided into two subsections corresponding to quantitative and qualitative analyses. A broad discussion section includes strengths and weaknesses of the method, general applicability and suggestions for further studies. The concluding section provides the final remarks.
1.1. Related work
Roof structure extraction has been performed using different Earth observation data. The two main data sources for roof structure reconstruction are Light Detection and Ranging (LiDAR) point clouds and remote sensing (RS) imagery. LiDAR point clouds have been proven as a suitable data source to reconstruct roof structures [
12] due to their high accuracy [
13]. An example of a robust and effective state-of-the-art method is [
14], which uses LiDAR data to extract 3D roof structures in an end-to-end approach. However, it also has drawbacks in data availability and affordability, outdatedness and the inability to differentiate boundaries from nearby objects [
11]. On the other hand, RS imagery, particularly very high resolution (VHR) satellite and aerial images, contains a huge amount of textural and spatial information and can be obtained for different areas and scales [
11], [
15]. Another option is to fuse different datasets, which was proposed in [
8,
16]. However, fusion also has challenges as different characteristics of data sources for the registration process, different spatial resolutions and simultaneous availability [
17]. The fusion of aerial imagery and nDSM was earlier performed by [
2] for building outline delineation with a frame field learning framework, which showed higher performance than using solely aerial images.
In recent years, there has already been a growing interest in methodologies for the recognition and extraction of roof structures in a raster format using DL algorithms, including the works of [
5,
18,
19]. However, for urban applications, the main interest lies in vectorized output. Simple vectorization of the raster output is not sufficient to obtain a vectorized output of sufficient quality for real-world applications. Therefore, regularization and simplification must be introduced to obtain straight edges and corners. Since automatically extracting building roof geometry in the regularised vector format is a challenging task, there are only limited studies that address this problem[
7,
8,
10,
20,
21].
The authors in [
9], proposed an algorithm that uses CNN to detect geometric primitives (lines, corners and regions) and integer programming which collects the information as a planar graph. Similarly, [
7] proposed a method that extracts building features as geometric primitives which form planar graphs from RGB images utilizing their new architecture Convolutional Message Passing Network. The method is highly dependent on pre-processing, computationally inefficient and does not show high accuracy.
In [
21], the authors proposed a model-driven approach for reconstructing LoD2 building models using the “decomposition-optimization-fitting” paradigm. Building detection results are first vectorized into polygons using a “three-step” polygon extraction method, then decomposed into densely connected basic building rectangles prepared to fit primitive building models. To further enhance the orientation of the 2D construction rectangle, they added OpenStreetMap (OSM) and Graph-Cut (GC) labelling as options. Eventually, building roof types are updated, and nearby building models in one building segment are integrated into a complex polygonal model. Since the proposed strategy has limited model types in their library, it may not be applicable for some types of structures, such as those with dome roofs, as may over-partition building segments with complex shapes.
In [
10], an end-to-end roofline extraction approach was introduced using an integrally attracted wireframe parsing (IAWP) framework to generate a planar graph from VHR imagery. The authors also incorporated geometric line priors using Hough Transform into deep networks. The results showed that the method outperforms the Conv-MPN architecture in F-score metrics by 0.7% for corner points and 8.8% for edges. Besides, the method has higher computational efficiency taking half the time and only ¼ GPU memory. Nevertheless, this method only works with image patches containing a single building. It thus cannot map entire urban areas from images with the city coverage. Moreover, the approach still results in several missing detections and incorrect roof structure models.
In their most recent work, the authors in [
22] proposed the Roof Structure Graph Neural Network (RSGNN) method that has 2 components: 1) a Multi-task Learning Module (MLM) to extract and match geometric primitives, 2) a Graph Neural Network (GNN) based Relation Reasoning Module (RRM) for roof structure reconstruction. It outperforms state-of-the-art models but still faces similar issues to IAWP, which are missing line detections and single building extraction per patch.
2. Materials and Methods
2.1. Study area
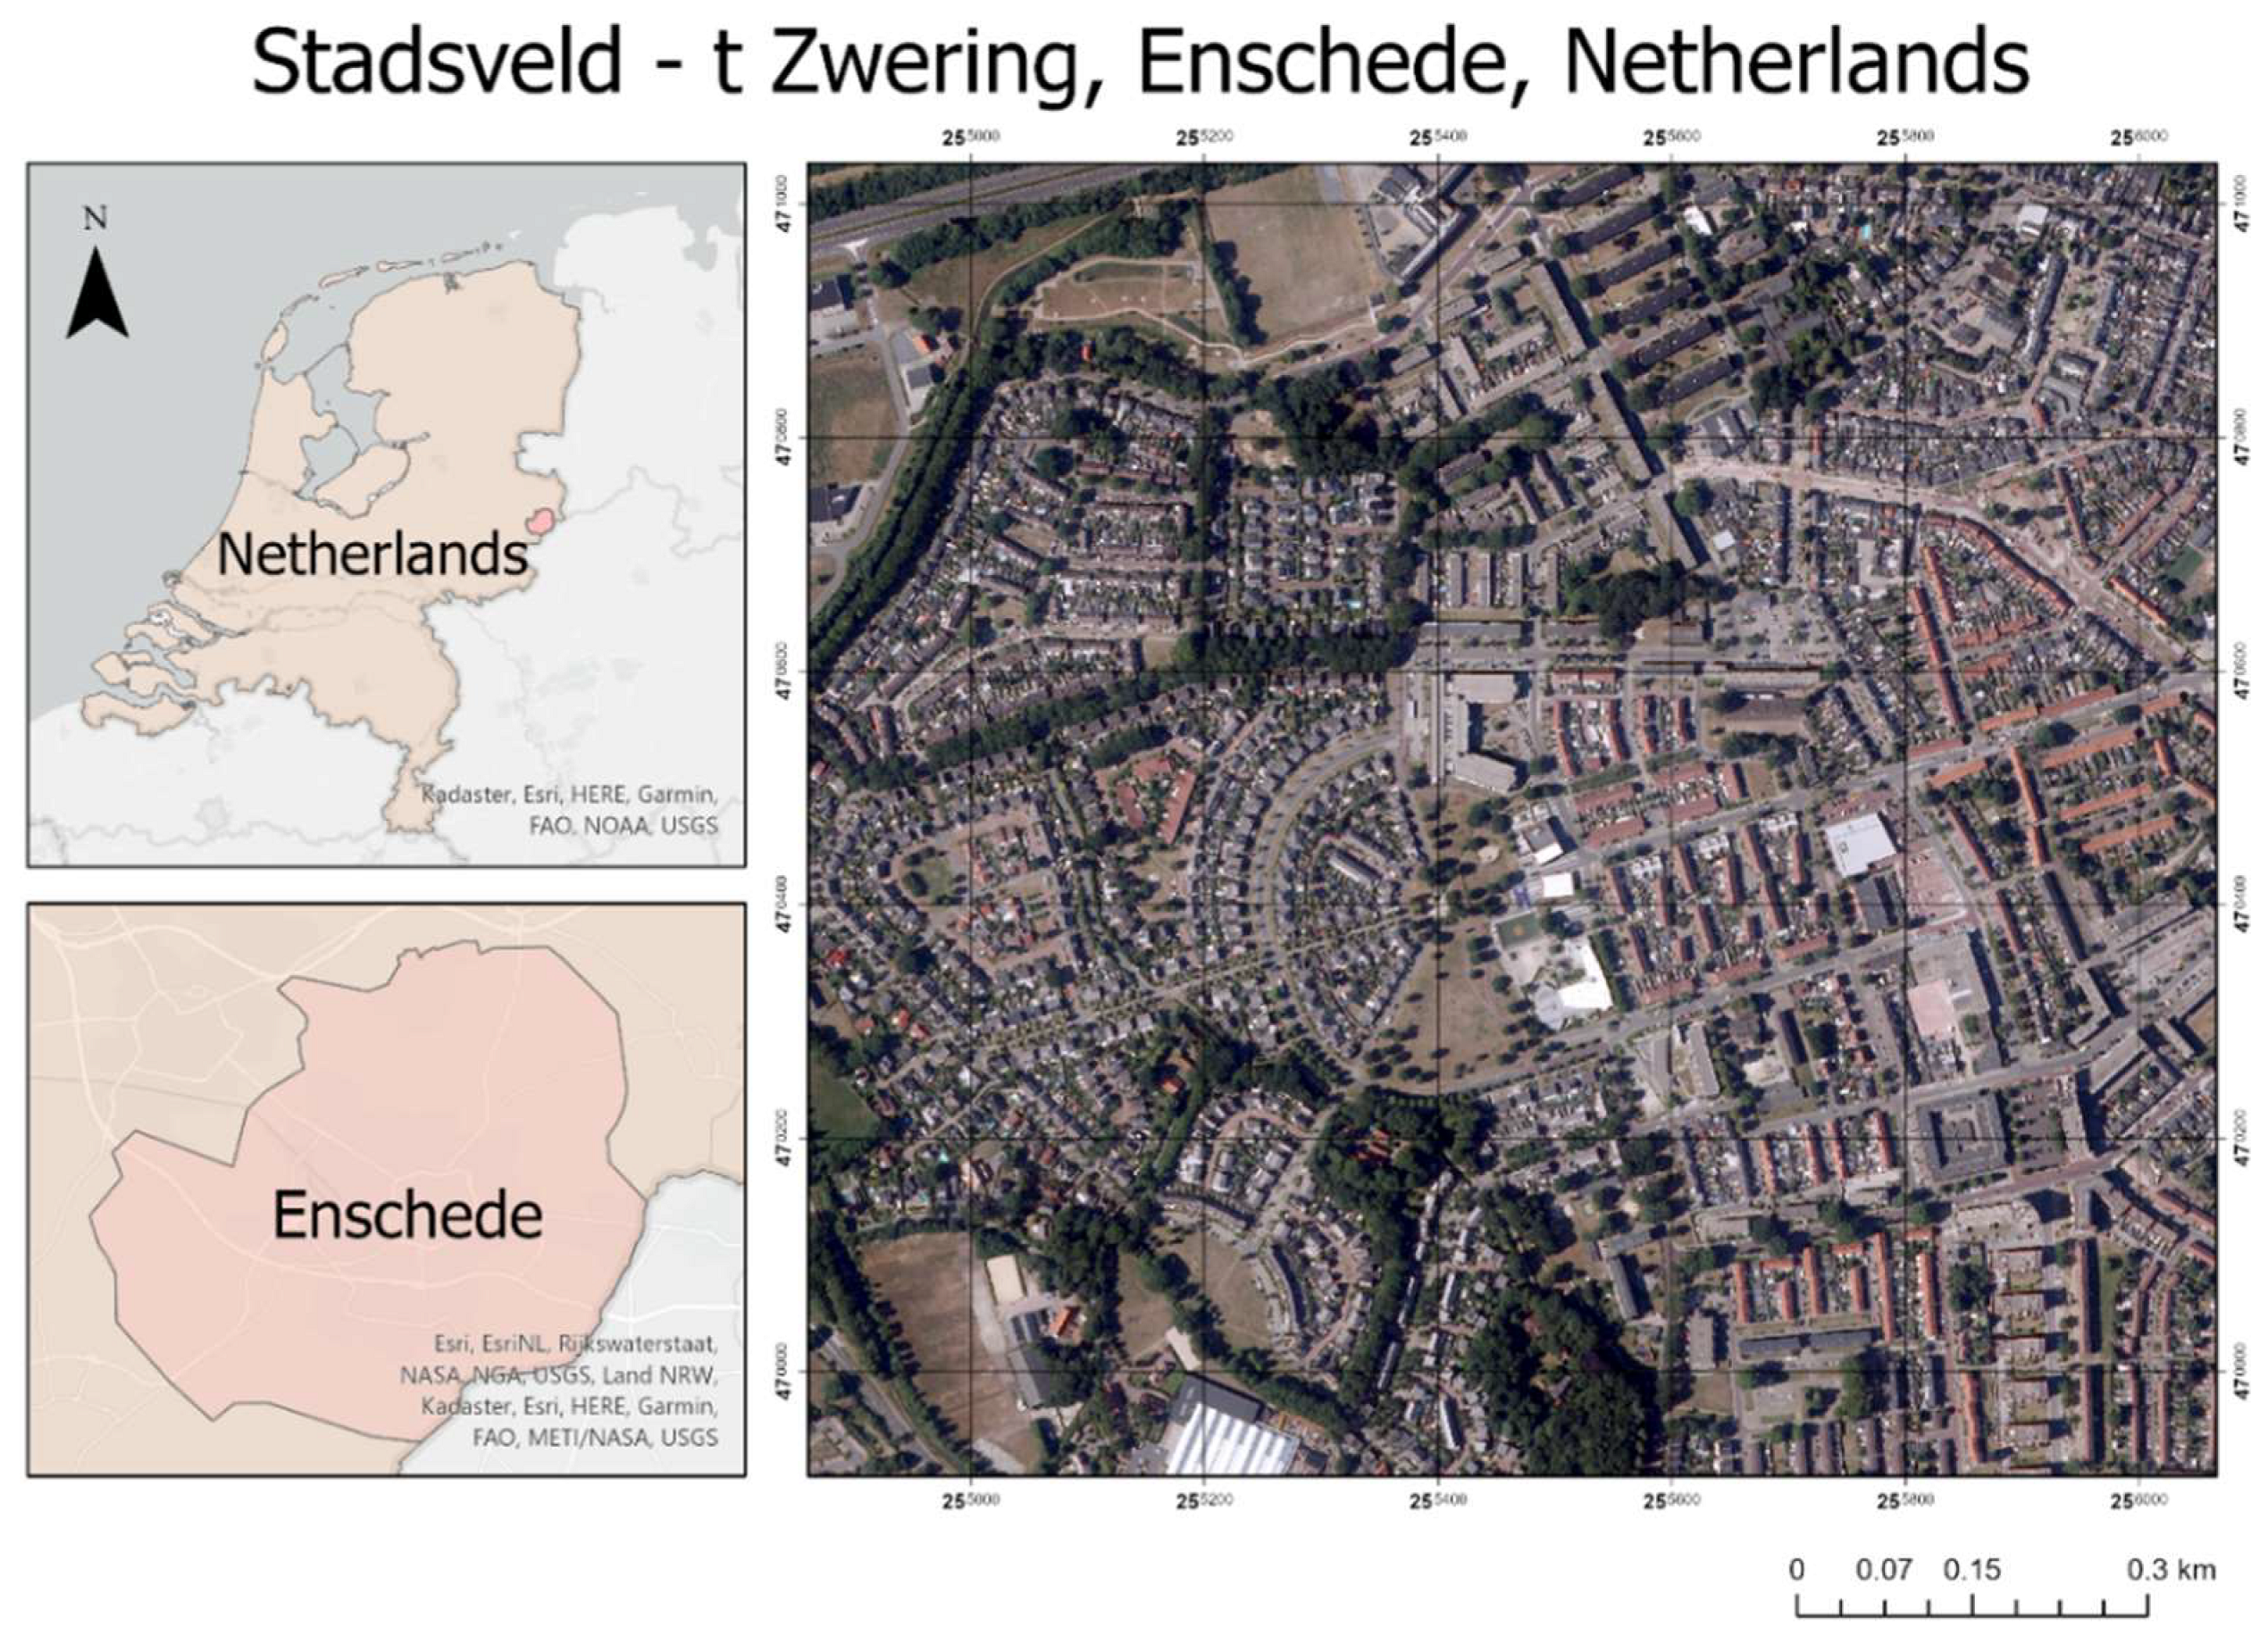
The study area selected for this research is the neighbourhood Stadsveld – t Zwering, a residential area, in Enschede city, Netherlands (
Figure 2). The choice of the study area was made due to the availability of the labelled dataset. The dataset contains files mentioned in
Table 1 below.
2.2. Data pre-processing
The input for our method is an RGB aerial orthophoto of 8 cm spatial resolution and an nDSM of 0.5 m resolution, building footprint and inner lines reference data. nDSM was resampled to 8 cm resolution using bilinear interpolation. RGB bands and nDSM were stacked as a 4-band input raster.
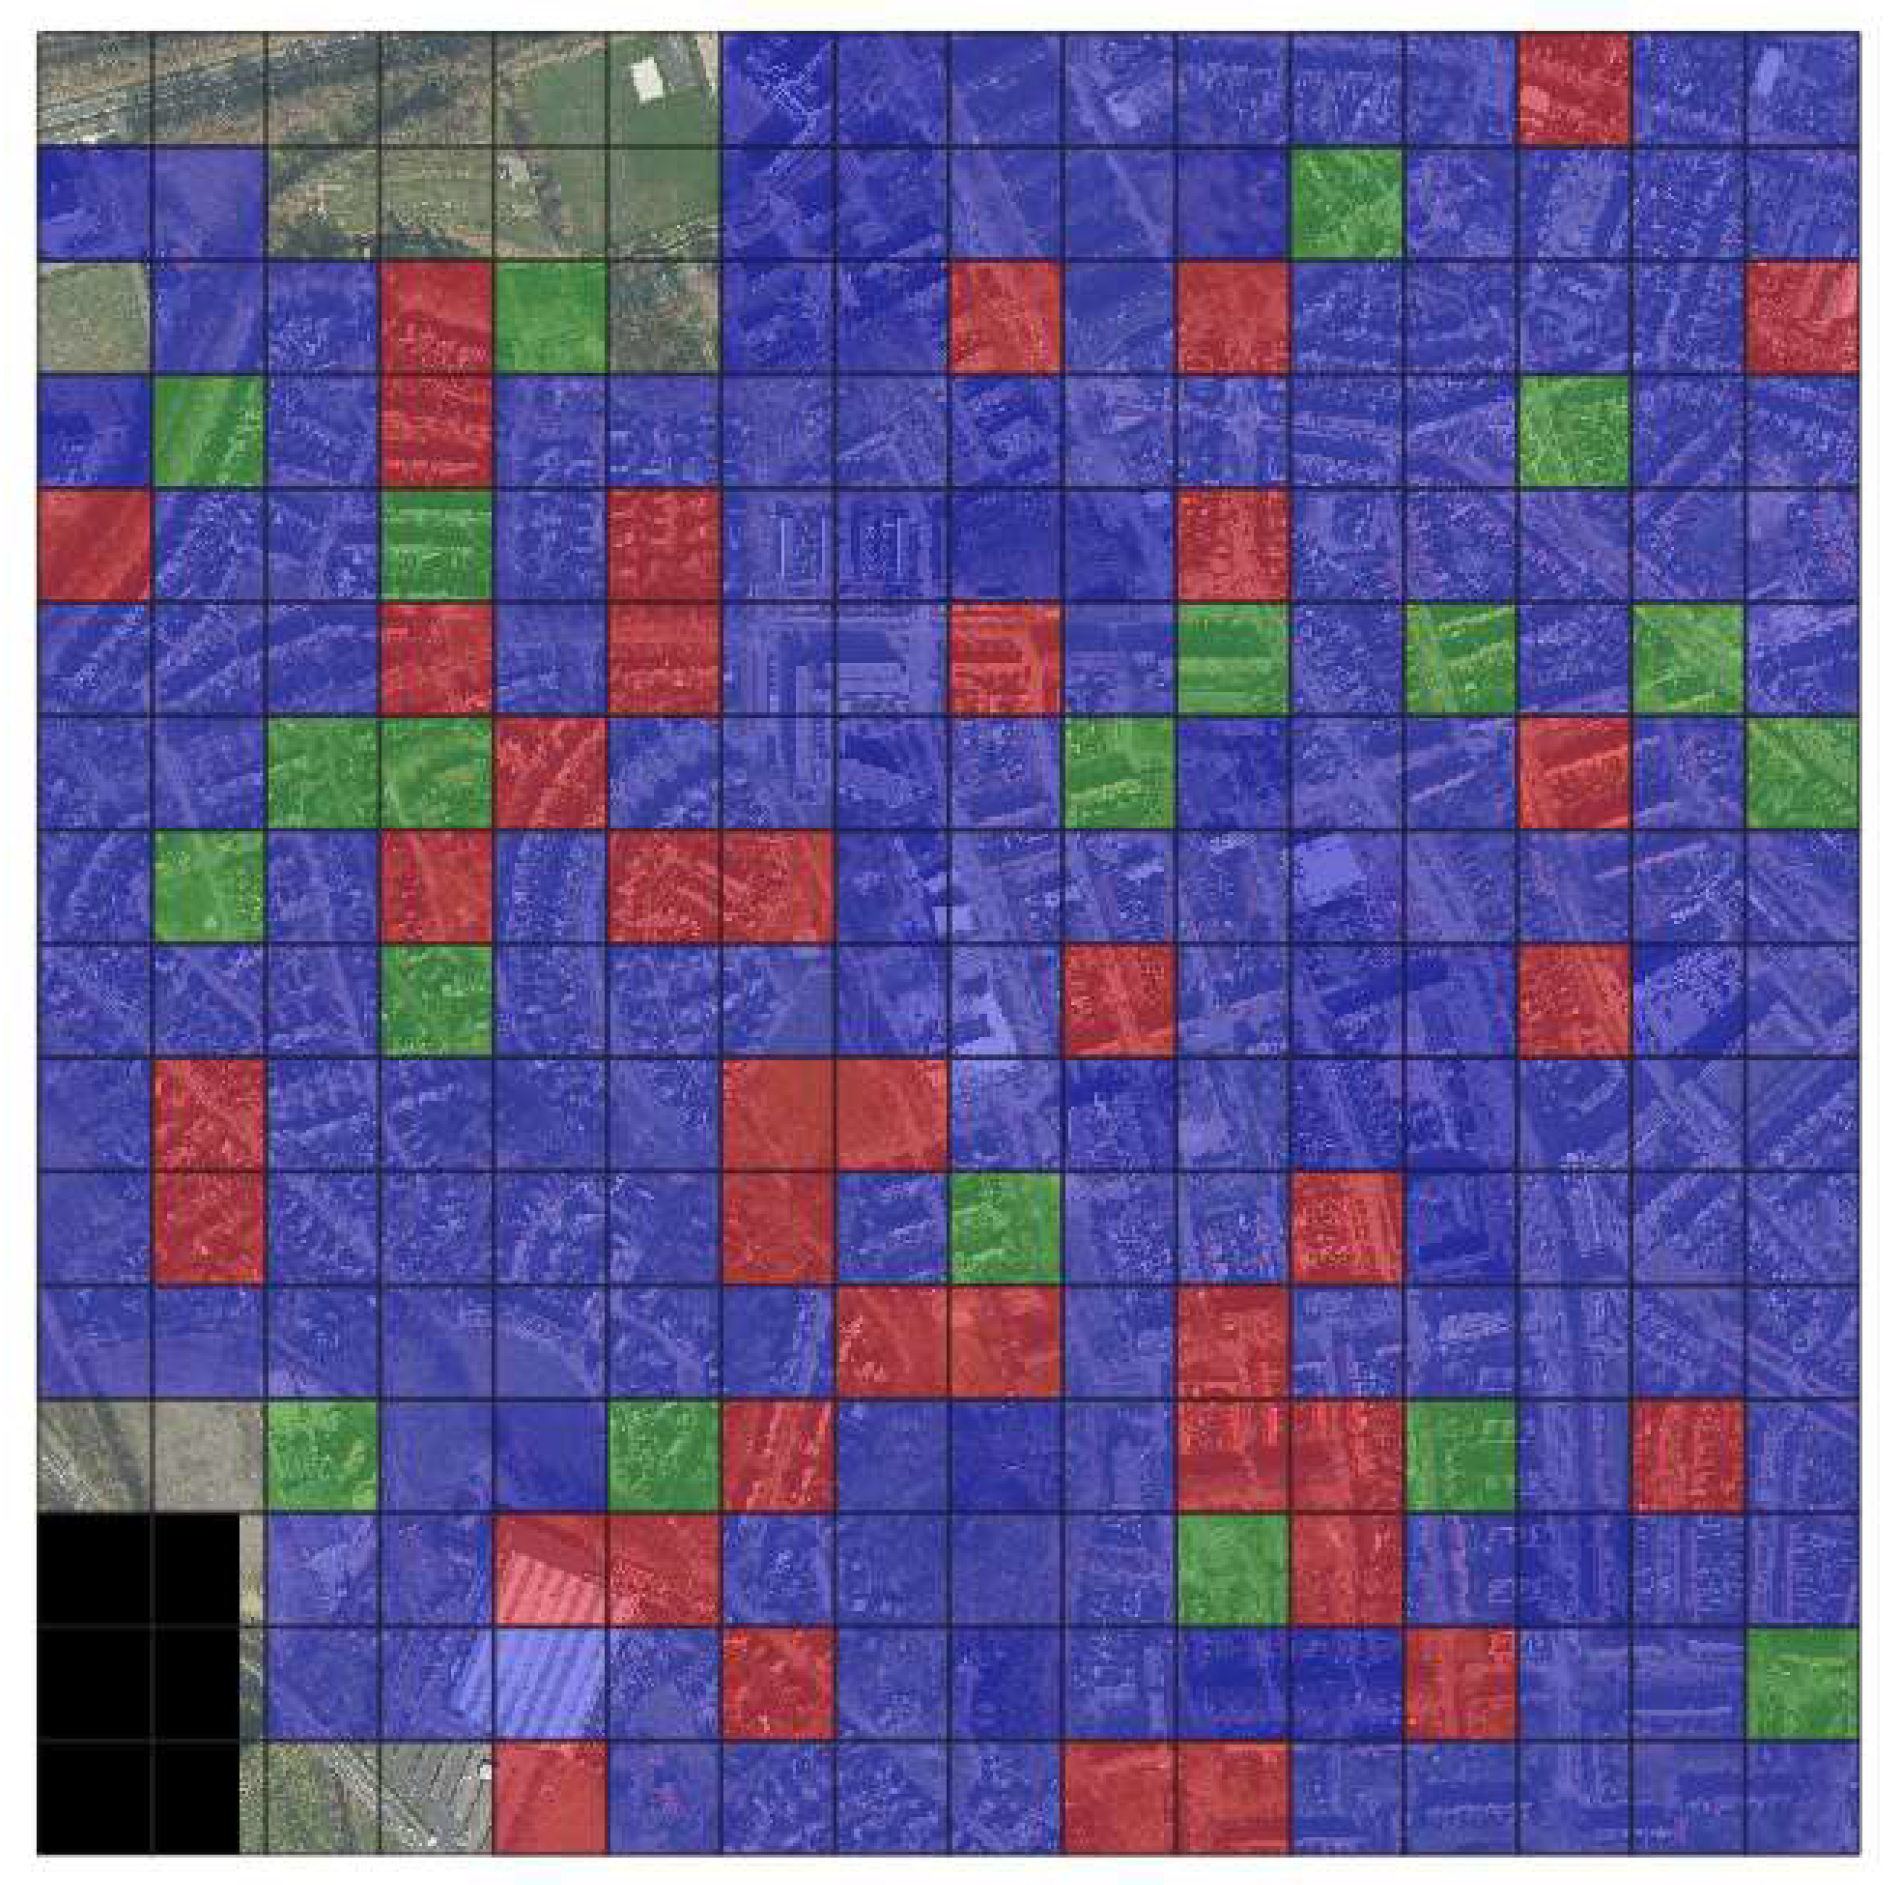
Tiles distribution. The dataset was divided into training, validation and testing tiles in the proportion 7: 1: 2 respectively (
Figure 3,
Table 2). The distribution of the tiles was random to have most of the roof types represented in training. Training and validation tiles were split again into patches of 500x500 pixels size to fit GPU memory and still cover more than one building in one patch.
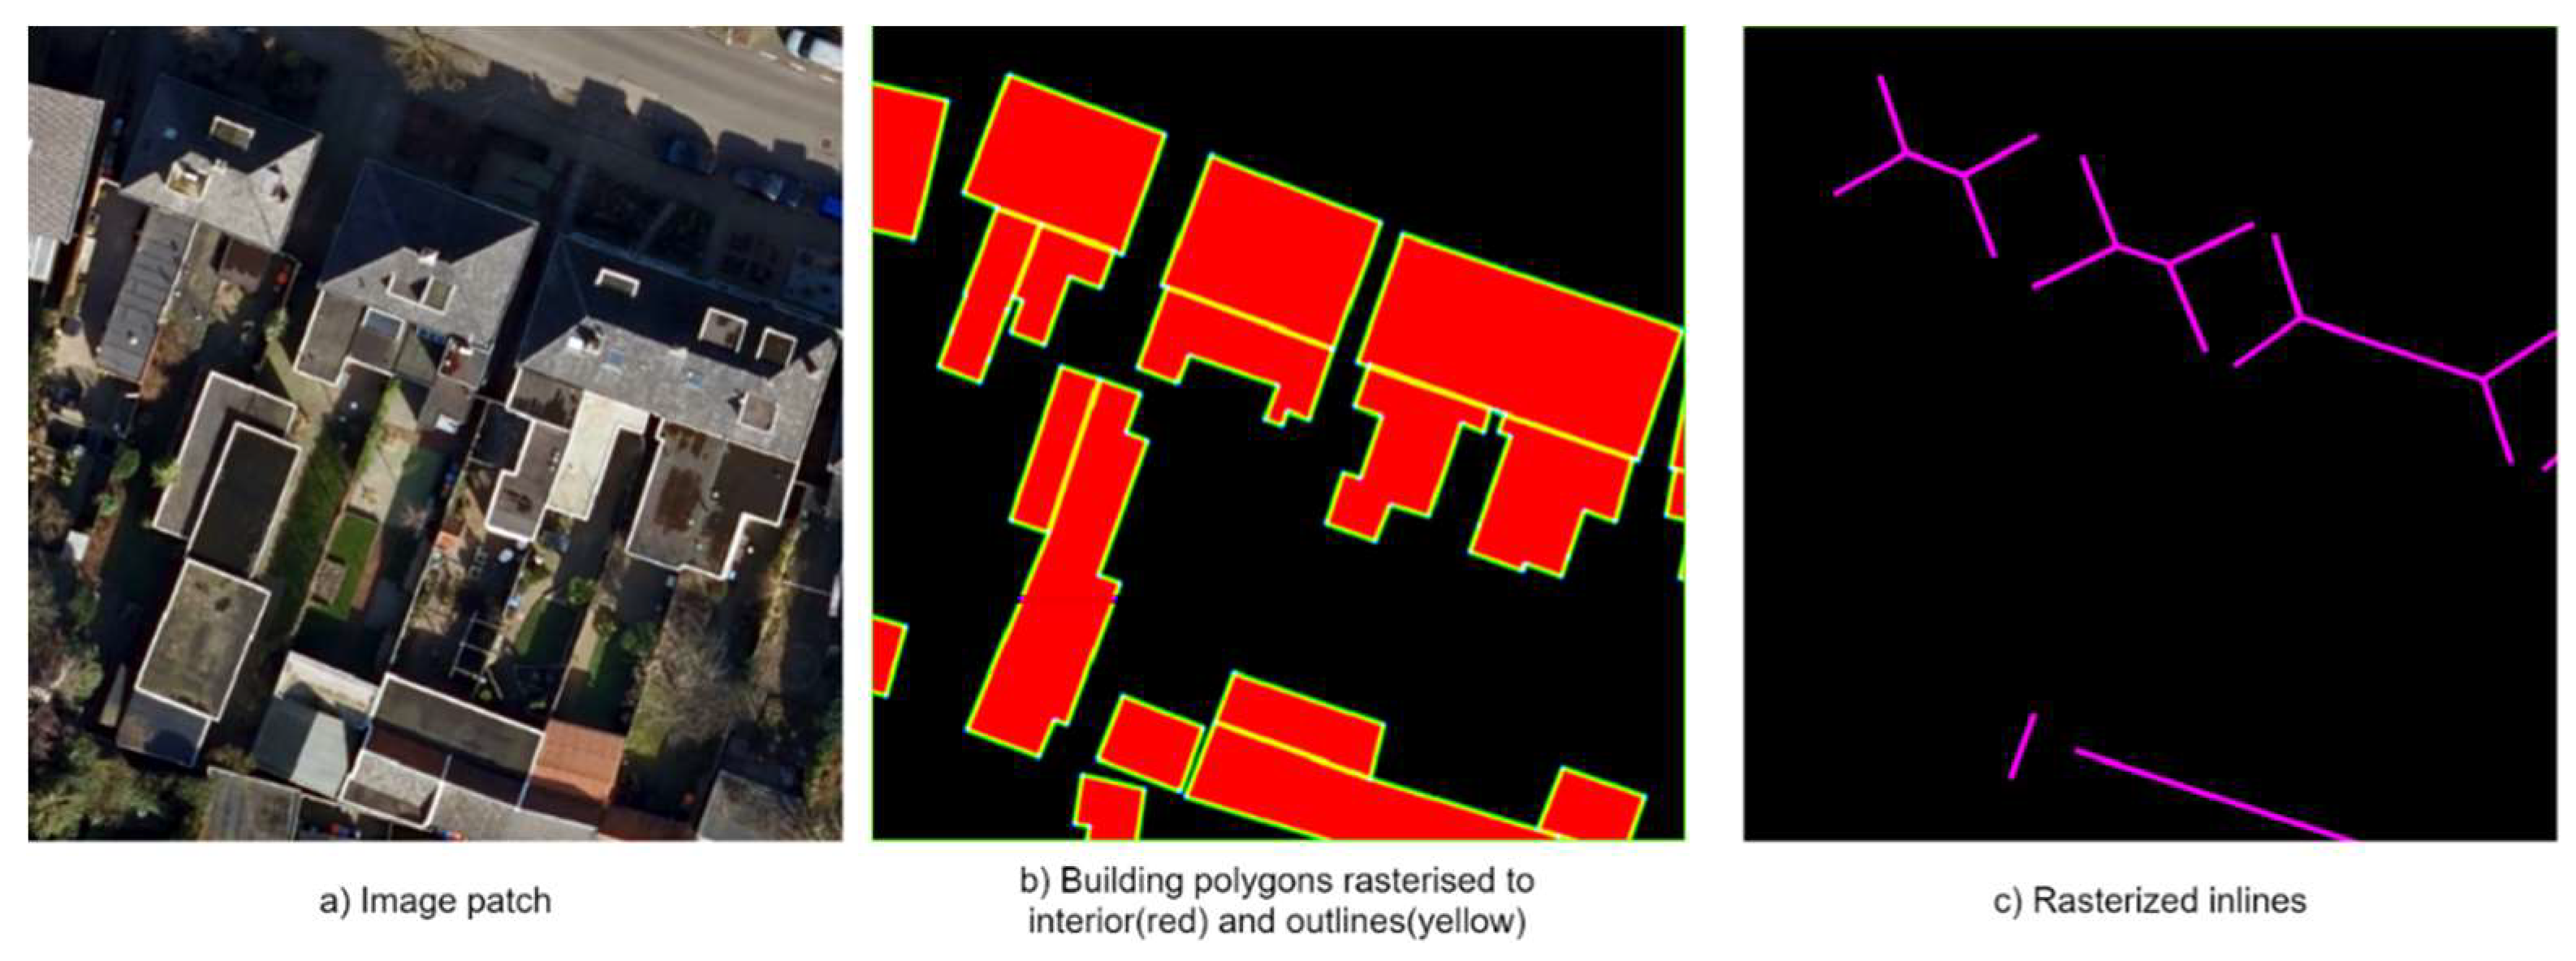
In the preprocessing step implemented in the method, the building polygons and inner rooflines are rasterized for supervised learning in building interior and outline and building inner roofline segmentation branches. Polygons are rasterized into two bands – building interior and outlines (
Figure 4-b), while inner rooflines are rasterized into one band (
Figure 4-c). For the frame field learning, building contours and inner rooflines angles of the unsigned (without a sign) tangent vectors were computed.
2.3. Methodology
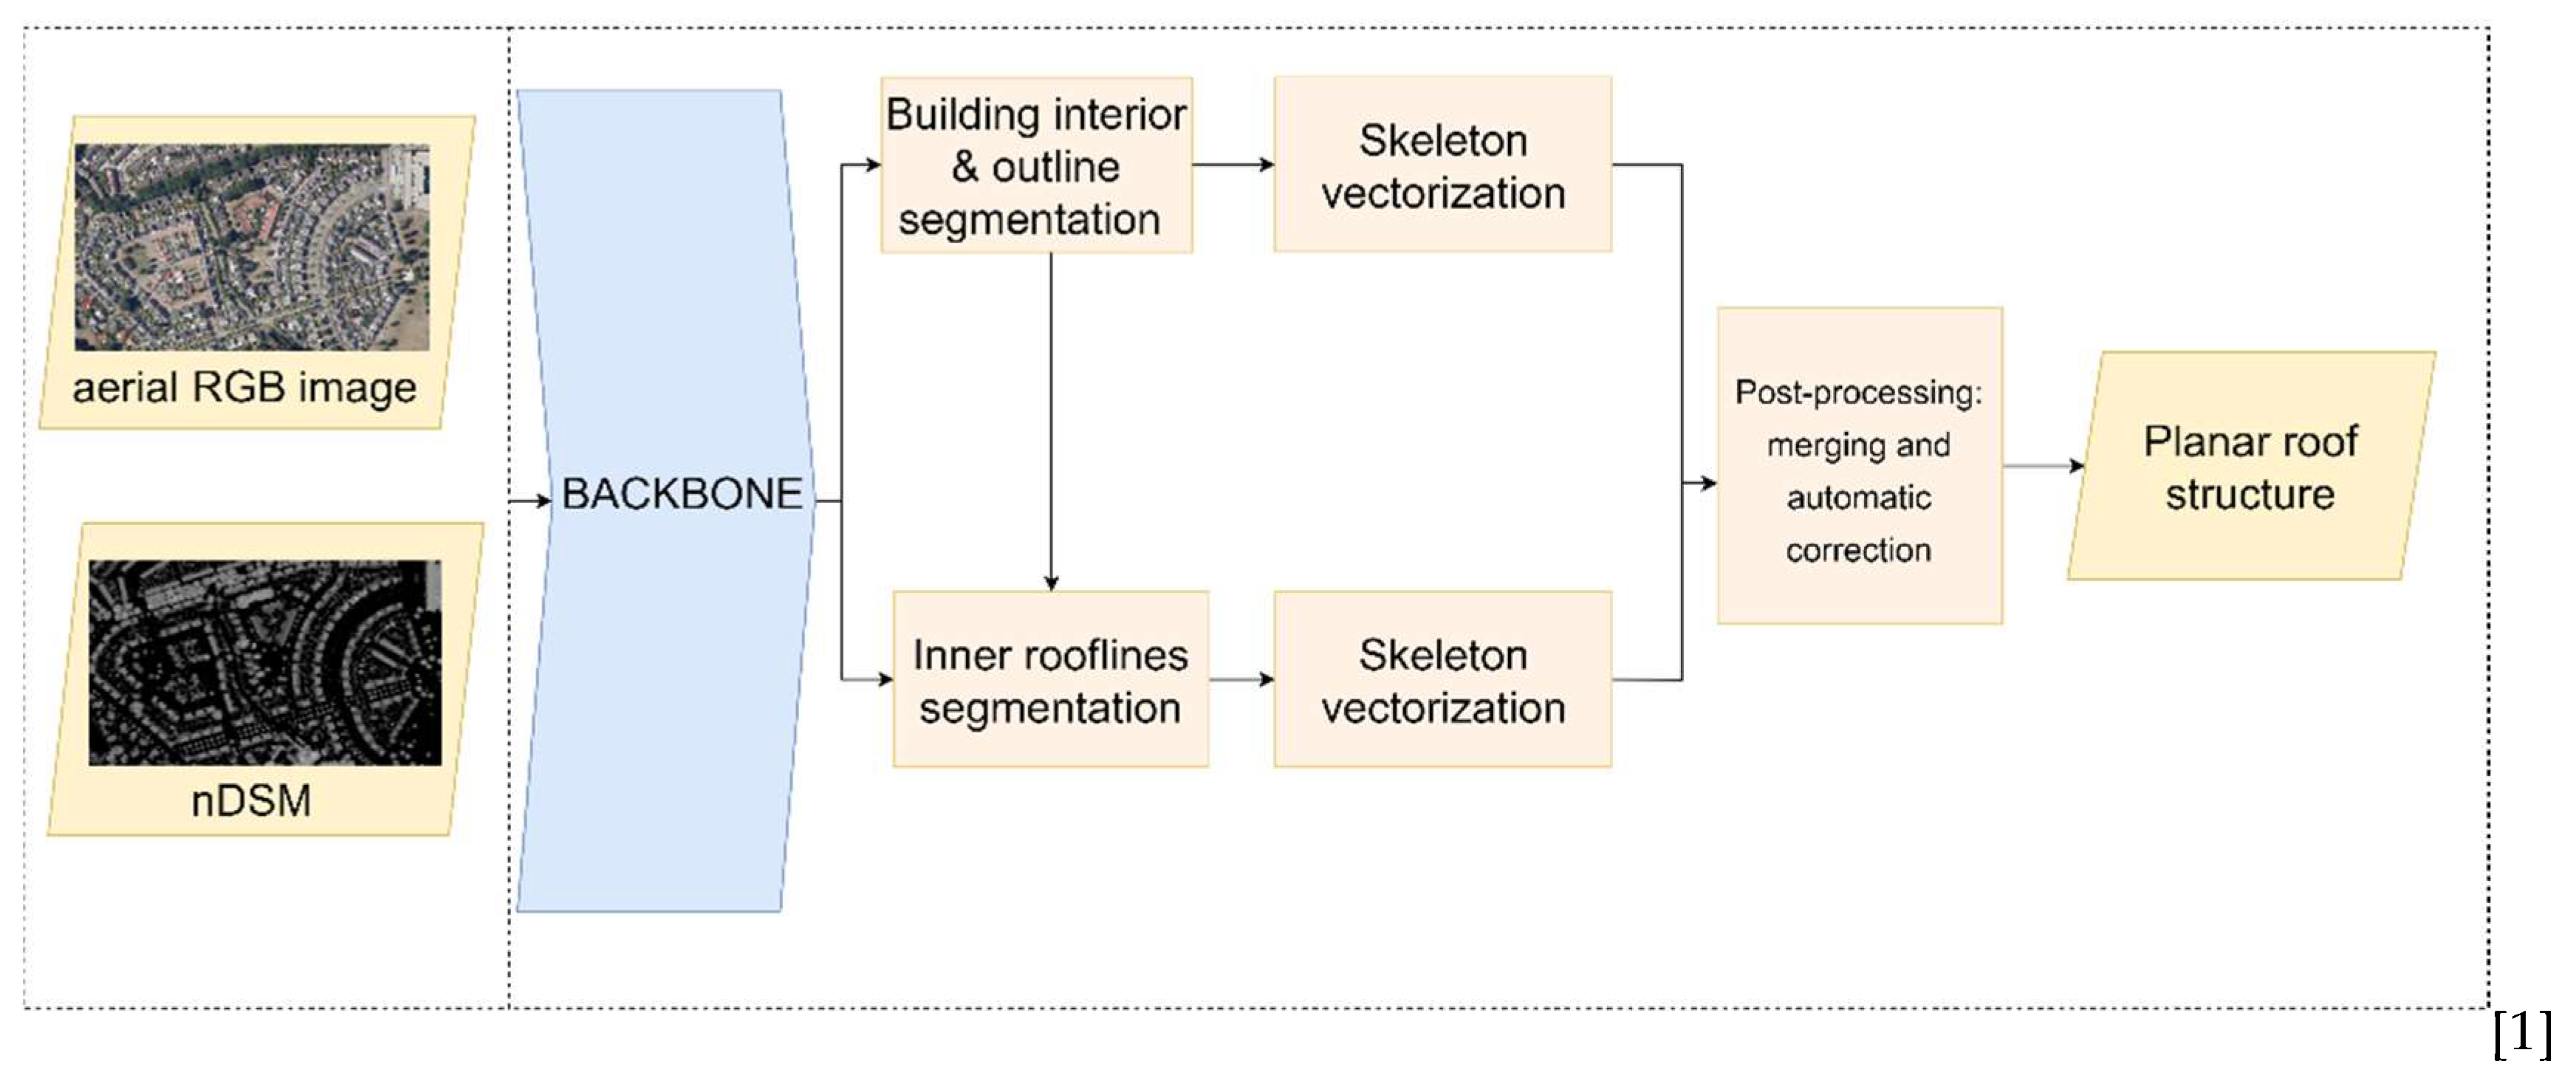
In our study, we develop a method for roof structure extraction. As illustrated in
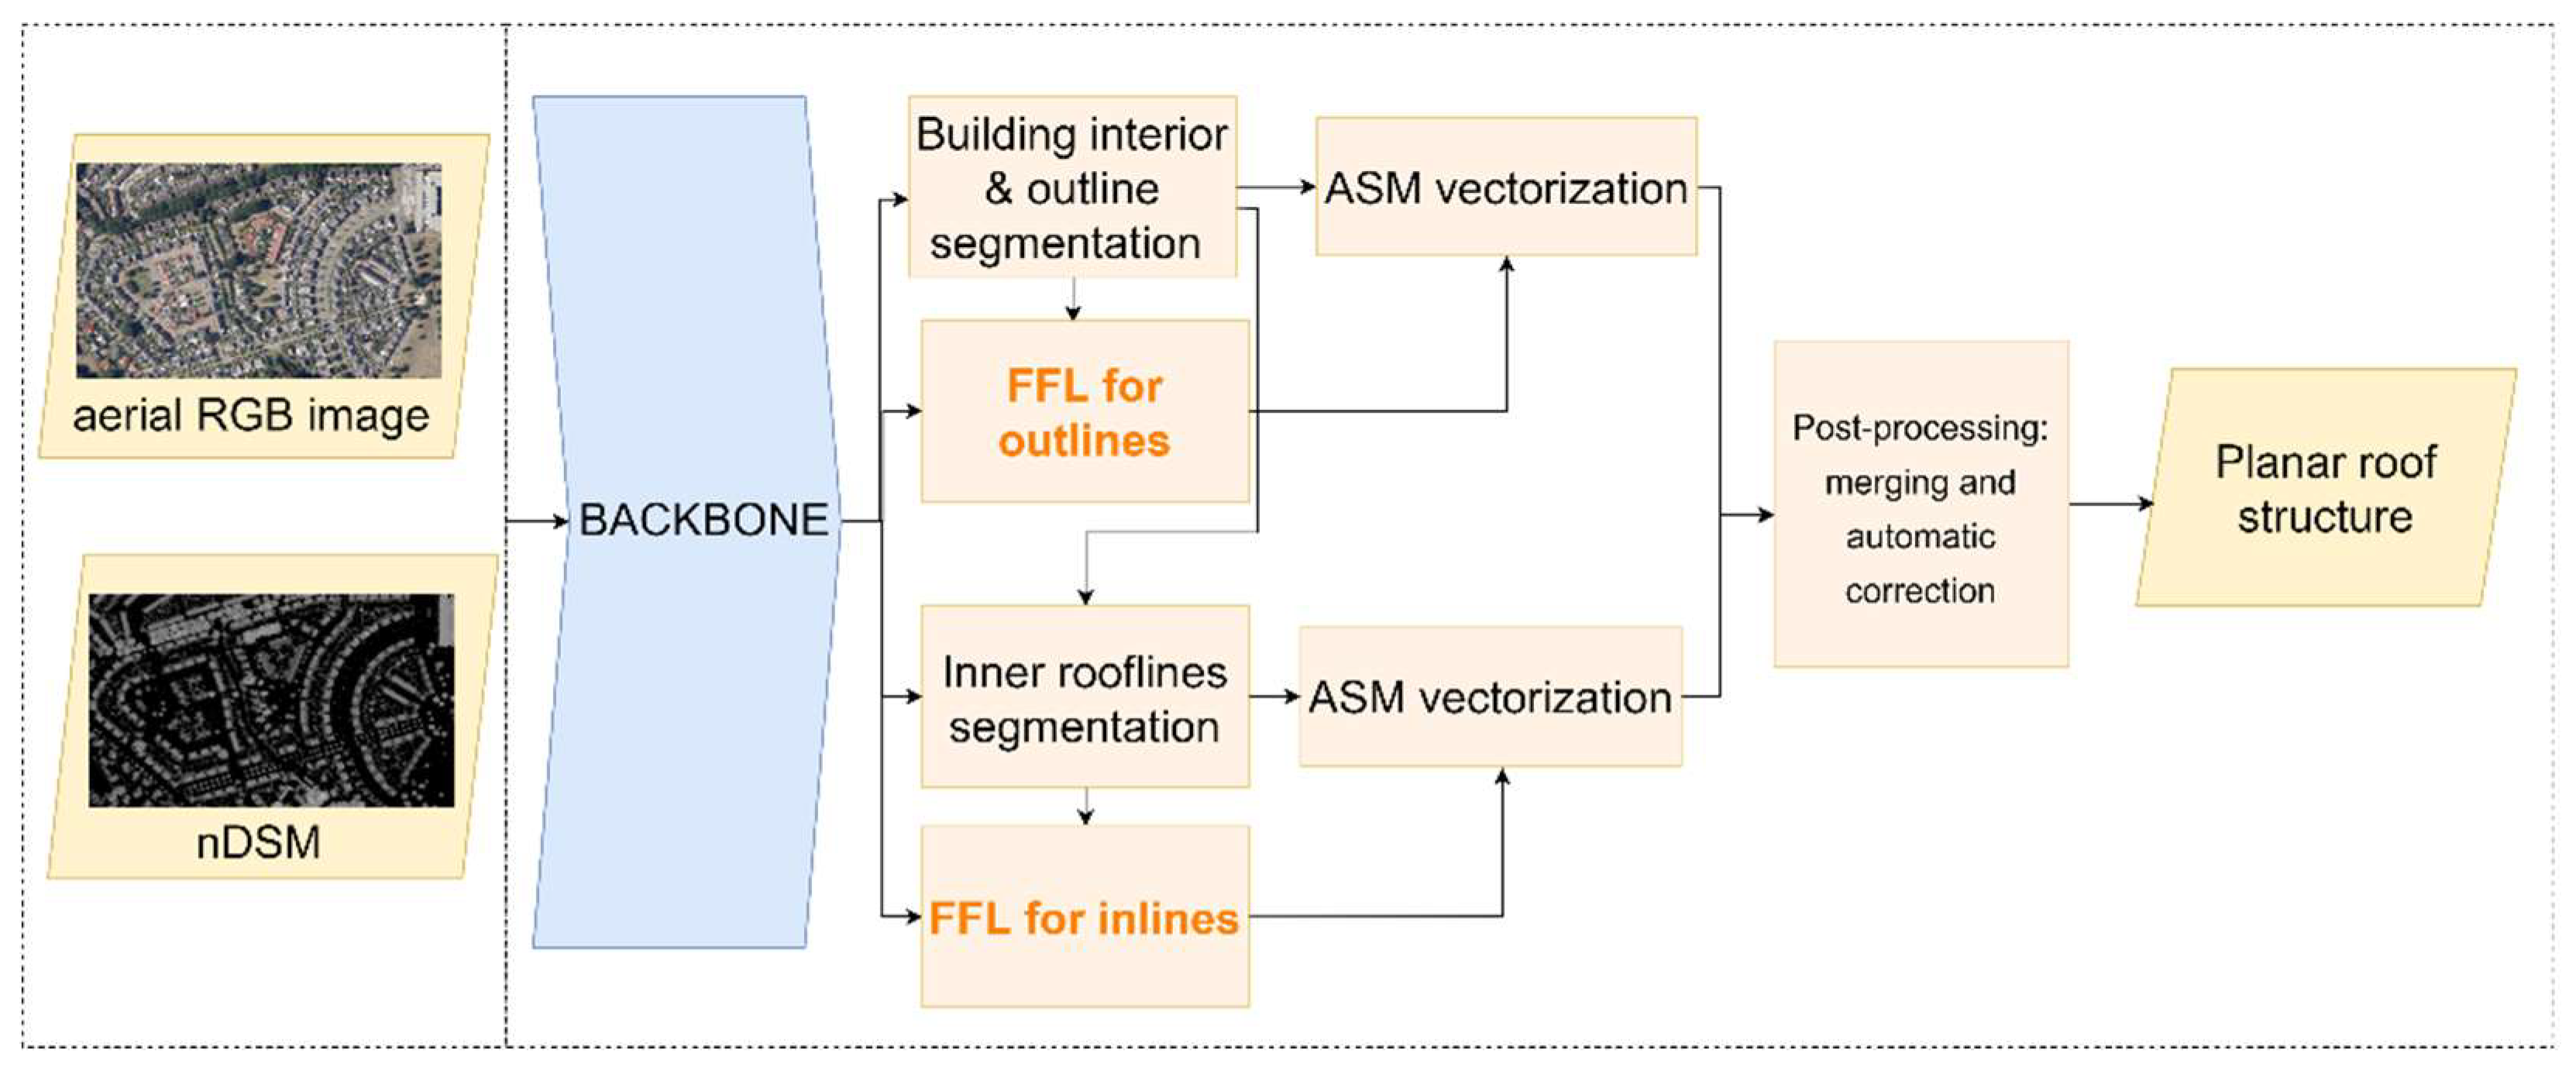
Figure 5, we proposed Vectorized Roof Extractor that consists of the following steps:
Feature map extraction with UResNet101 backbone.
Building outlines and inner rooflines segmentation. These tasks are performed in separate blocks and simultaneously.
Vectorization. The main steps include skeletonization, regularization and simplification of the segmentation output.
Post-processing. This includes automated merging and correction of the building outlines and inner rooflines.
2.3.1. The backbone of the model
In this study, we use pre-trained UResNet-101, the backbone that provided the highest performance in [
1]. The U-Net architecture [
24] utilizes an encoder-decoder structure. The primary objective of the encoder is to capture the overall context of the image, providing an understanding of its contents. This is achieved by gradually reducing the image size while increasing its depth through convolutional and max-pooling layers. Conversely, the decoder aims to reconstruct the image at its original pixel location by employing transposed convolution layers for upsampling. These layers increase the image size while reducing its depth. To enhance the upsampling process, skip connections are employed in each step of the decoder. These connections concatenate the feature maps from the encoder with the output of the transposed convolution layers. The feature maps retain the original spatial information that was lost during compression by the encoder. This inclusion helps the decoder in generating a more precise segmentation outcome.
For performance improvement, the feature extractor has the replaced downsampling section of U-Net with ResNet. ResNet-101 is a deep residual network that addresses the problem of vanishing gradients in very deep neural networks. It introduces residual connections, which enable the network to learn residual mappings instead of directly learning the underlying mappings. These residual connections allow for the training of deeper networks while maintaining or even improving performance. The architecture has been pre-trained on ImageNet [
26]. Our experiments showed that using this encoder results in higher accuracy for roof structure extraction than the standard U-Net encoder. UResNet-101 combines the strengths of U-Net and ResNet-101. The U-Net component allows for precise image segmentation and the capture of fine details, while the ResNet-101 component enables the network to learn more powerful representations by addressing the challenges of deep network training. . The backbone takes an image tile with 4 channels (RGB+nDSM) as an input and produces an F-dimensional feature output (F is the number of extracted feature maps) with the height and width of input size, which is used in further steps.
2.3.2. Building outlines and inner rooflines extraction
Building interior and outlines segmentation map. An F-dimensional feature map undergoes a fully convolutional block that outputs a building segmentation map. The block has the structure represented in
Figure 6. This block consists of a 3x3 convolutional layer, a batch normalization layer, an Exponential Linear Unit (ELU) activation function, another 3x3 convolution, and a sigmoid nonlinearity. The output consists of 2 maps: interior mask and edges (building outlines). The interior mask is used to enforce the edges of the buildings to align with their contour and later used in the vectorization process to correct the building outlines mask.
Inner rooflines segmentation map. The block has the same structure as for building outline segmentation. The previously generated building segmentation map is used as additional input to guarantee building inner rooflines be inside the building interior. The output consists of one channel – an inner roofline segmentation probability map.
The associated network branch is trained using the Tversky [
27] loss function for learning. The total loss function is comprised of multiple loss functions used for different learning branches: 1) outline edge and interior segmentation; 2) inner roofline segmentation; 3) frame field for outlines; 4) frame field for inner rooflines; 5) coupling losses. Since the losses have different units, we calculate a normalization coefficient for each loss by averaging its value over a random portion of the training dataset using a randomly initialized network. The losses are linearly combined after being normalized by this coefficient. The goal of this normalization is to rescale losses to make them easier to balance.
2.3.3. Skeleton vectorization
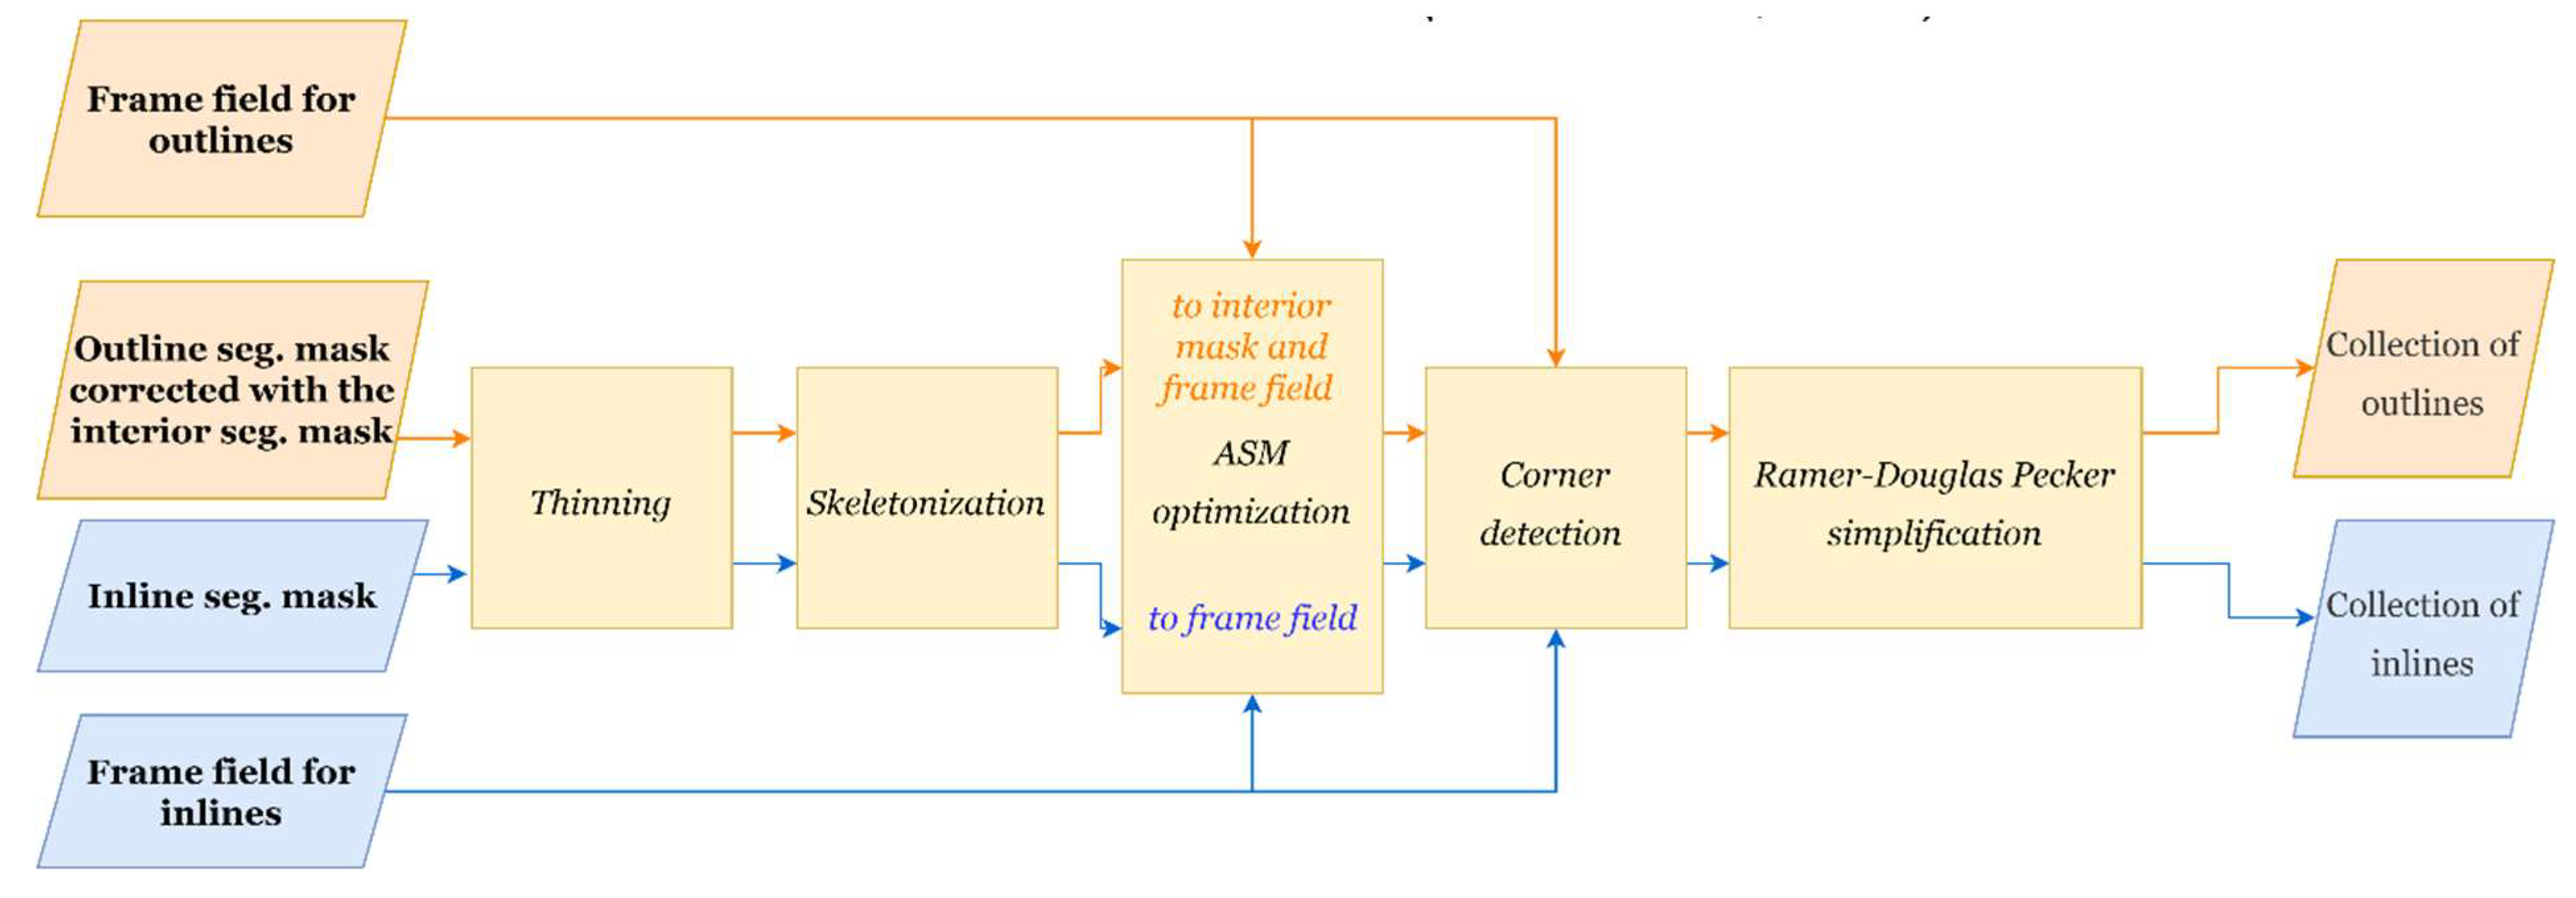
The simple skeleton vectorization (
Figure 7) is comprised of the thinning method, computation of the skeleton graph, conversion to polylines and Ramer-Douglas-Peucker (RDP) simplification which results in the collections of outlines and inner rooflines in vector format.
First, an inner/outer rooflines segmentation mask is computed from the predicted probability map with a segmentation threshold≥0.5. Second, the mask is converted to a one-pixel wide representation using thinning method [
28]. Third, the skeleton graph, which connects those pixels, is generated with Skan Python library. A skeleton graph is a collection of paths, polylines, connected with junction nodes, vertices. Finally, the vertices are simplified with the RDP algorithm [
29] which allows tuning the complexity-to-fidelity ratio with the tolerance value of 5 m and filtered with the Intersection over Union (IOU) >=0.5 per feature. The tolerance value is set with the consideration of results’ applicability.
2.3.4. Post-processing: joining inner rooflines and outlines
Finally, the predicted inner rooflines are matched with predicted building footprint polygons to compose the whole planar roof in the form of intersecting line segments. First, building outlines and inner rooflines are merged into one feature class polylines (
Figure 8-a). Then ArcGIS Extend Lines tool is used to automatically correct inner lines that do not reach the building contours (
Figure 8-b) and Trim Lines tool for those that go beyond them (
Figure 8-c).
2.4. Implementation details
For our experiment we set the maximum number of epochs to 350, training batch size 4, Adam optimizer with starting learning rate 10-3. GPU used is NVIDIA Titan X (Pascal).
The maximum number of epochs was chosen based on our previous experiments and the best epoch used for the test is set using the validation loss trend. The effective batch size that GPU memory can perform with is four. The optimizer and initial learning rate are selected based on studies by [
1], [
2].
2.5. Adapted Frame field learning method to compare with the proposed approach
To provide valuable evaluation and comparison of our approach we adapt the Frame Field Learning (FFL) method [
1]. The central idea of the method is to use frame field learning for polygonization to have regularized building outlines with correct corners. We add inner rooflines extraction branches that consist of segmentation, frame field learning, Active Skeleton Model vectorization and post-processing to the original method (
Figure 9).
2.6. Accuracy assessment methods
2.6.1. Pixel-level metric
Intersection over Union (equation 1) is used for pixel-wise evaluation of the results. This metric is used to evaluate the accuracy of predicted interior, outline and inner roofline segmentation masks.
2.6.2. Line-level metric
To evaluate the similarity of predicted lines to ground truth, polygons and line segments measurement (PoLiS) was computed on predicted outlines and inner rooflines. The metric originally calculates the distance between the predicted polygon and ground truth. It takes into account both positional and shape changes by treating polygons as a series of connected edges rather than just point sets. For our output, we made minor changes to perform the procedure on the line segments. So, a PoLiS distance between predicted line segments A and ground truth B is calculated with equation 2, by taking the average of the distances between each vertex a
j ∈ A, j = 1,..., q of line A and the nearest point b ∈ ∂B (not necessarily a vertex) on line B plus the average of the distances between each vertex b
k ∈ A, k = 1,..., r of line B and the nearest point a ∈ ∂A on line A. Normalization factors (1/2q) and (1/2r) are used to calculate the total average dissimilarity per pair of predicted and reference polygons. The PoLiS distance units are the same as the line segment vertices unit.
To further evaluate the accuracy of our model, we introduce Precision, Recall and F-score with the specific PoLiS tolerance value. Precision indicates the fraction of the predicted outer/inner rooflines being real outer/inner rooflines of the building on the ground. Recall indicates the fraction of the reference outer/inner rooflines being predicted by the model. F-score combines precision and recall in a form of harmonic mean. We set the tolerance value for the geometric precision PoLiS≤0.5 m and consider the line segments with PoLiS distance below this value as correctly predicted. We compute Precision, Recall and F-score using equations 3-5, where True Positive is the number of predicted line segments with the PoLiS≤0.5 m, False Positive is the rest of the predicted line segments and False Negative is the correct line segments that were not predicted by the model.
3. Results
This section presents the performance of two roof structure extraction models – the adapted frame field learning model and our proposed model. Both models were analyzed quantitatively and qualitatively. At last, the drawbacks and benefits of the proposed method are discussed.
3.1. Quantitative analysis
Table 3 shows the IoU achieved on the predicted building interior, outer and inner rooflines segmentation map. The adapted FFL model has a higher IoU inner rooflines with values of 0.35, while Vectorized Roof Extractor performs slightly better on outlines. Both models perform much better when it comes to predicting the interior of the building since the building interior is made up of all the pixels that correspond to the footprint. Predicting outlines and inner rooflines, however, is a more difficult task as it requires predicting line elements with far fewer pixels than the building footprint.
Line-level evaluation (
Table 4). Vectorized Roof Extractor outperforms the FFL model with an average PoLiS distance of 3.5 m for outlines and 1.2 m for inner rooflines, while FFL model is slightly worse on outlines and much worse on inner rooflines.
Using the PoLiS threshold for defining our true positive predictions, we calculated the Precision, Recall and F-score for both building outlines and inner rooflines. According to
Table 5, the Vectorized Roof Extractor outperforms in almost all the metrics, constituting 0.28, 0.34, 0.31 for Precision
PoLiS≤0.5, Recall
PoLiS≤0.5 and F-score
PoLiS≤0.5 for building outlines respectively. For the inner rooflines, the Precision
PoLiS≤0.5, Recall
PoLiS≤0.5 and F-score
PoLiS≤0. are 0.72, 0.47 and 0.57 respectively.
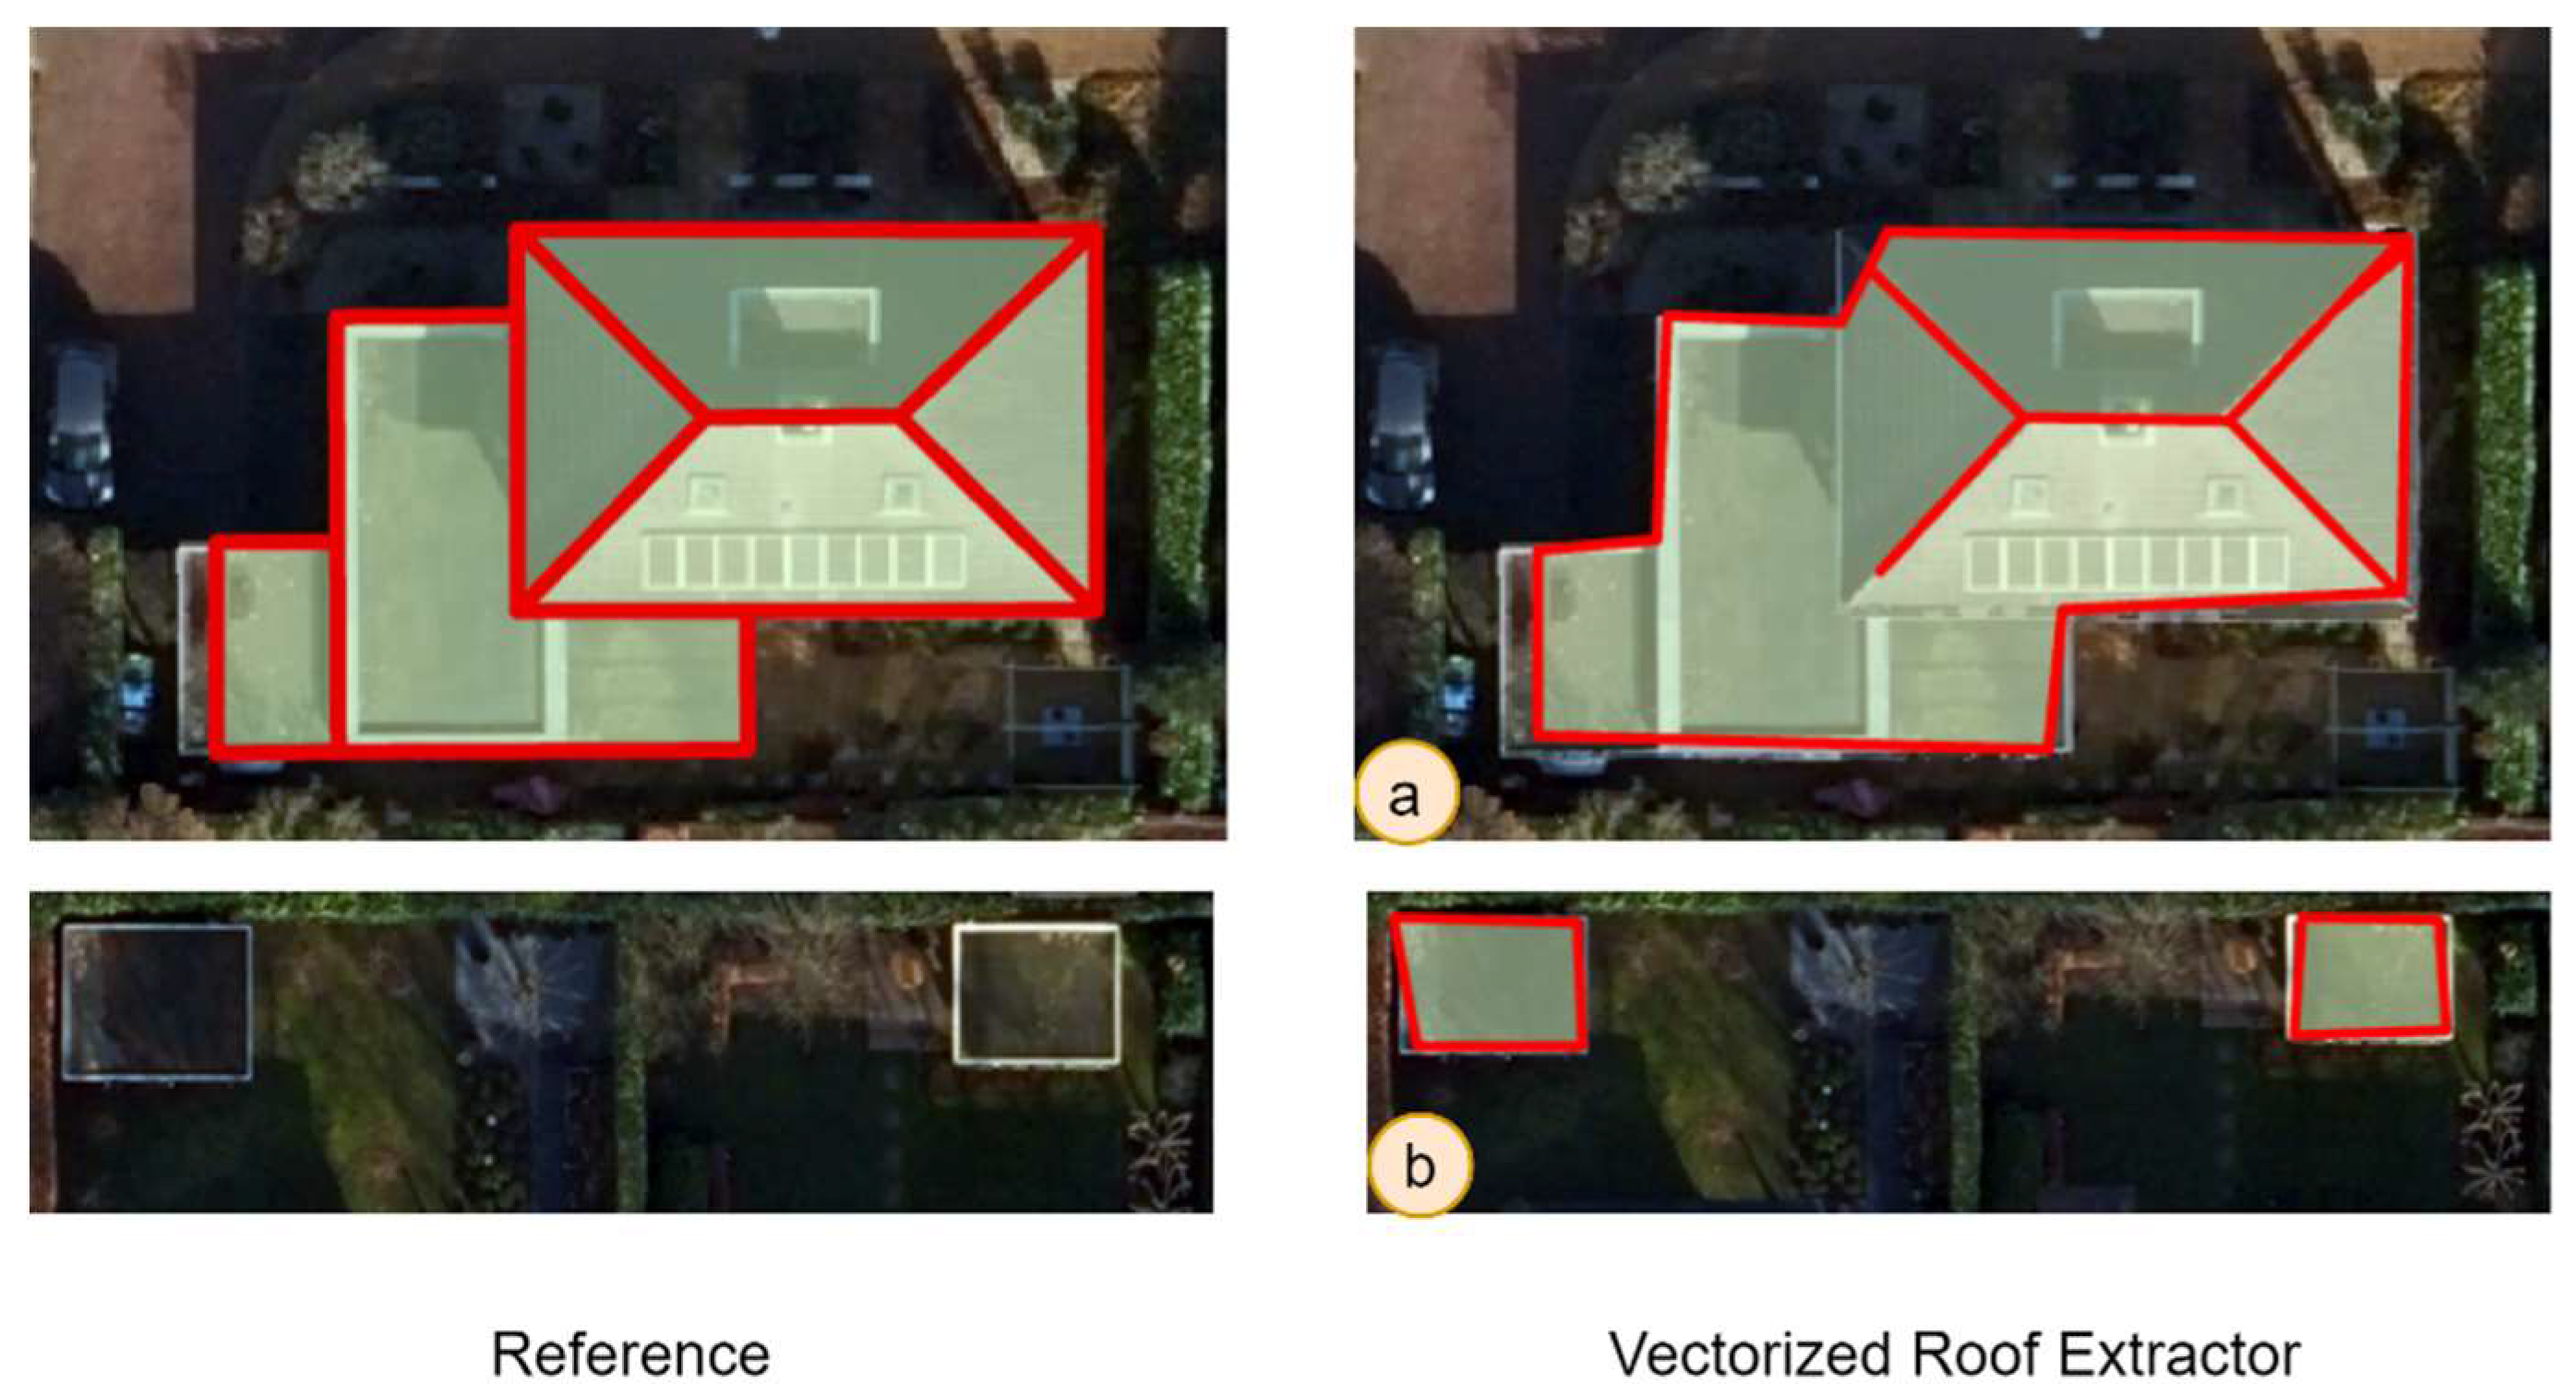
Table 5 also demonstrates that the models’ performances are not yet sufficient for outlines, but that they perform better for inner rooflines. This mostly happens due to two reasons. First, the model occasionally misses the shared wall between adjacent buildings (Figure 14-a) in which case the computed PoLiS distance will have a high value. Second, the model predicts very small buildings (Figure 14-b), e.g., storage sheds, which are not included in the reference data. In this case, the PoLiS will be calculated to the closest line segment that does not actually correspond to the predicted building and this also results in a high value.
3.2. Qualitative analysis
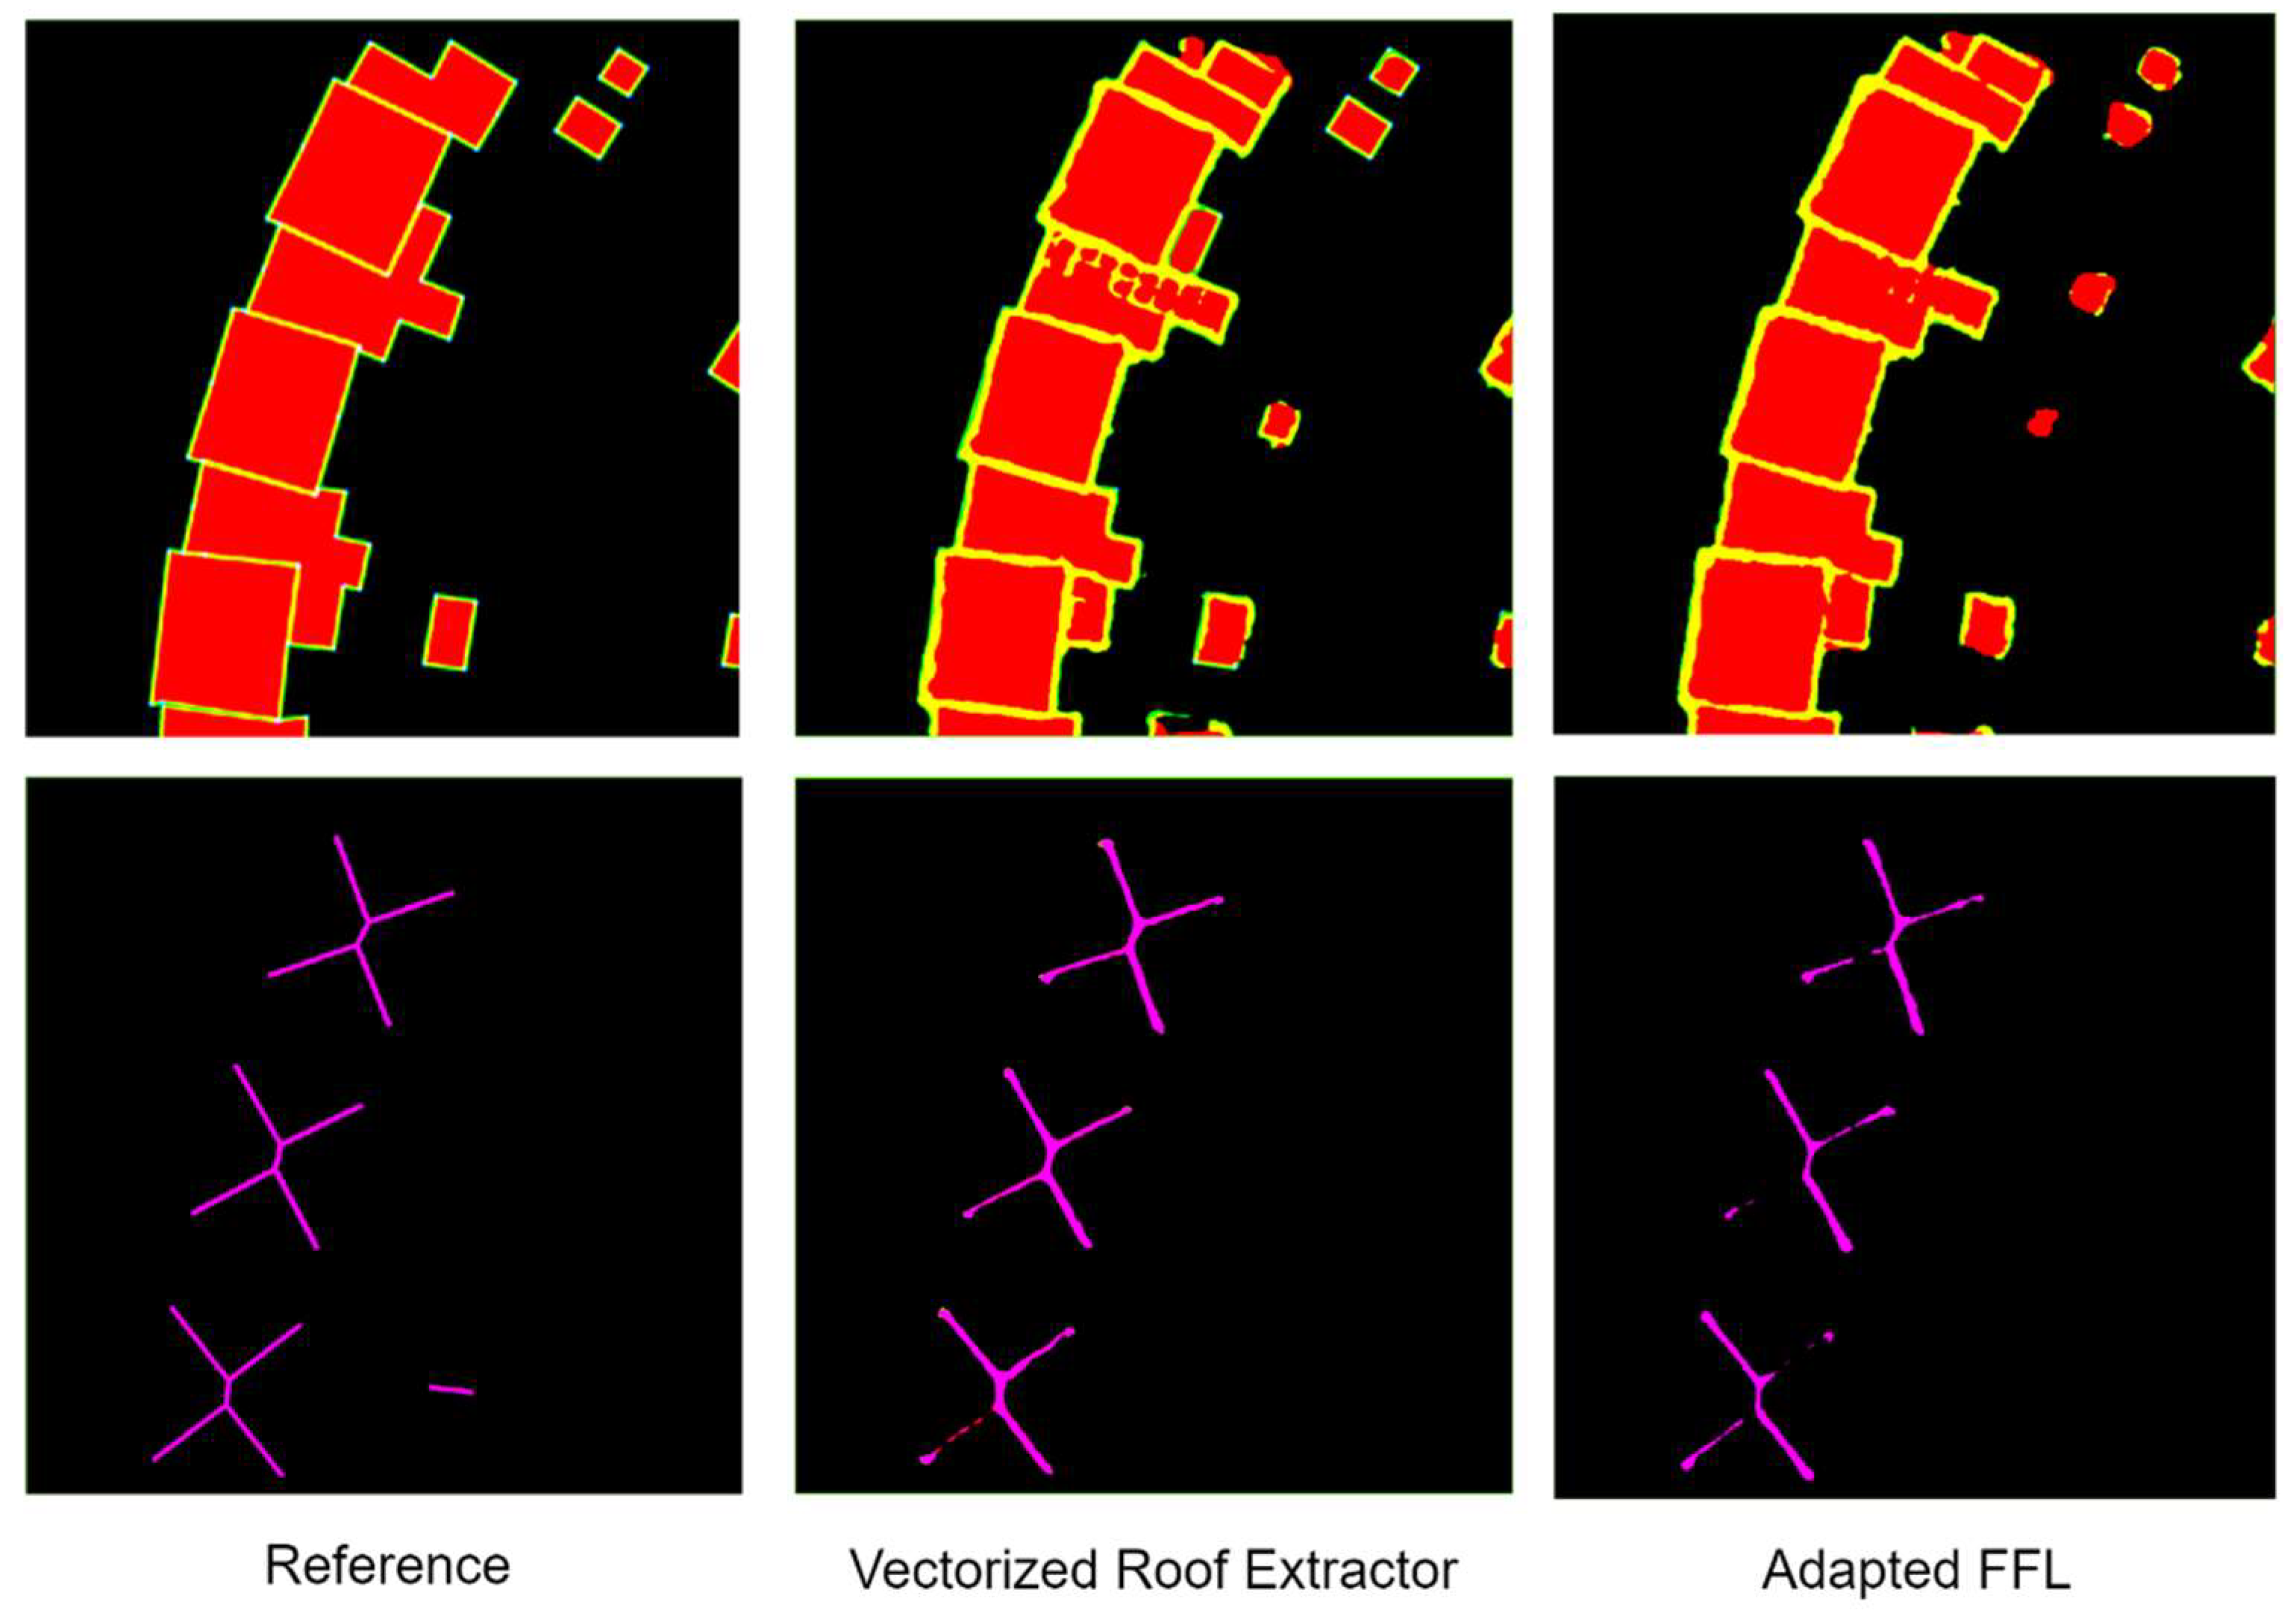
The segmentation results of the Vectorized Roof Extractor, as depicted in
Figure 11, exhibit slightly superior performance in delineating the outlines of smaller buildings compared to the performance of the Adapted FFL method. Moreover, they demonstrate a significant improvement in accurately capturing inner rooflines, resulting in the generation of connected edges.
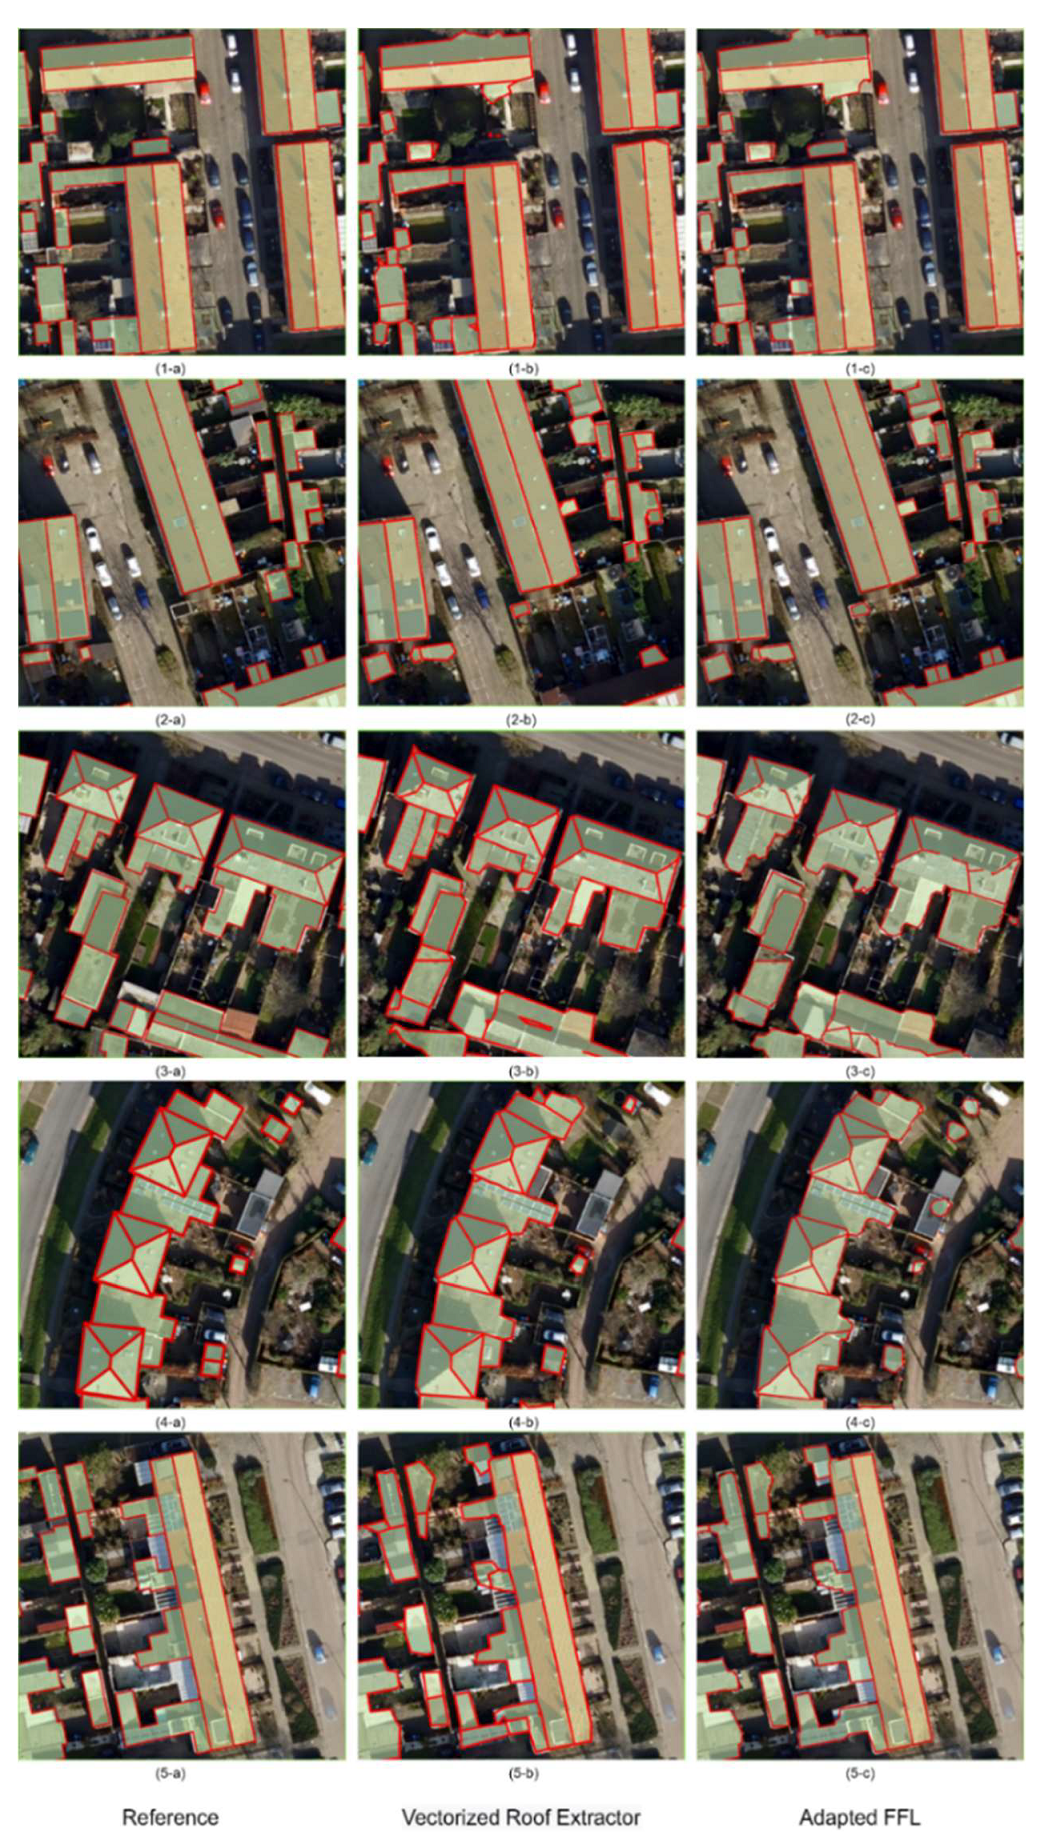
Figure 12 illustrates the post-processed results obtained with the two models as well as corresponding reference data. Both models perform well in general on the test data. However, the Vectorized Roof Extractor delivers considerably better results with straighter and accurately detected roof lines, more aligned to the roof outer and inner edges (Figure 15(1-5)-d). The adapted FFL model performs slightly worse than Vectorized Roof Extractor by misdetecting (Figure 15.4-c) or missing inner rooflines (Figure 15.3-c). Nonetheless, we can observe the contribution of the frame field to the corner detection procedure. Both models are better trained at predicting outer rooflines and ridges, the horizontal line on the intersection of two opposite roof slopes because the reference dataset has much more of their examples. With more examples of roof hips and valleys, the outwards and inwards diagonal joints formed by the intersection of two roof slopes, it is certain that the model predictions will have substantial improvement on them too. Also, both models misdetect trees as part of the buildings (Figure 15.1-(b-c)) since some of the buildings in our training data are also covered by a tree, and secondly, perhaps the 4
th band nDSM, in which trees sometimes have the same height as the near building, confuses the network. False positives for small buildings are observed in the outputs of both models. Most of them are gardens or storage sheds, and, as mentioned before, not all of them are digitized as ground truth data.
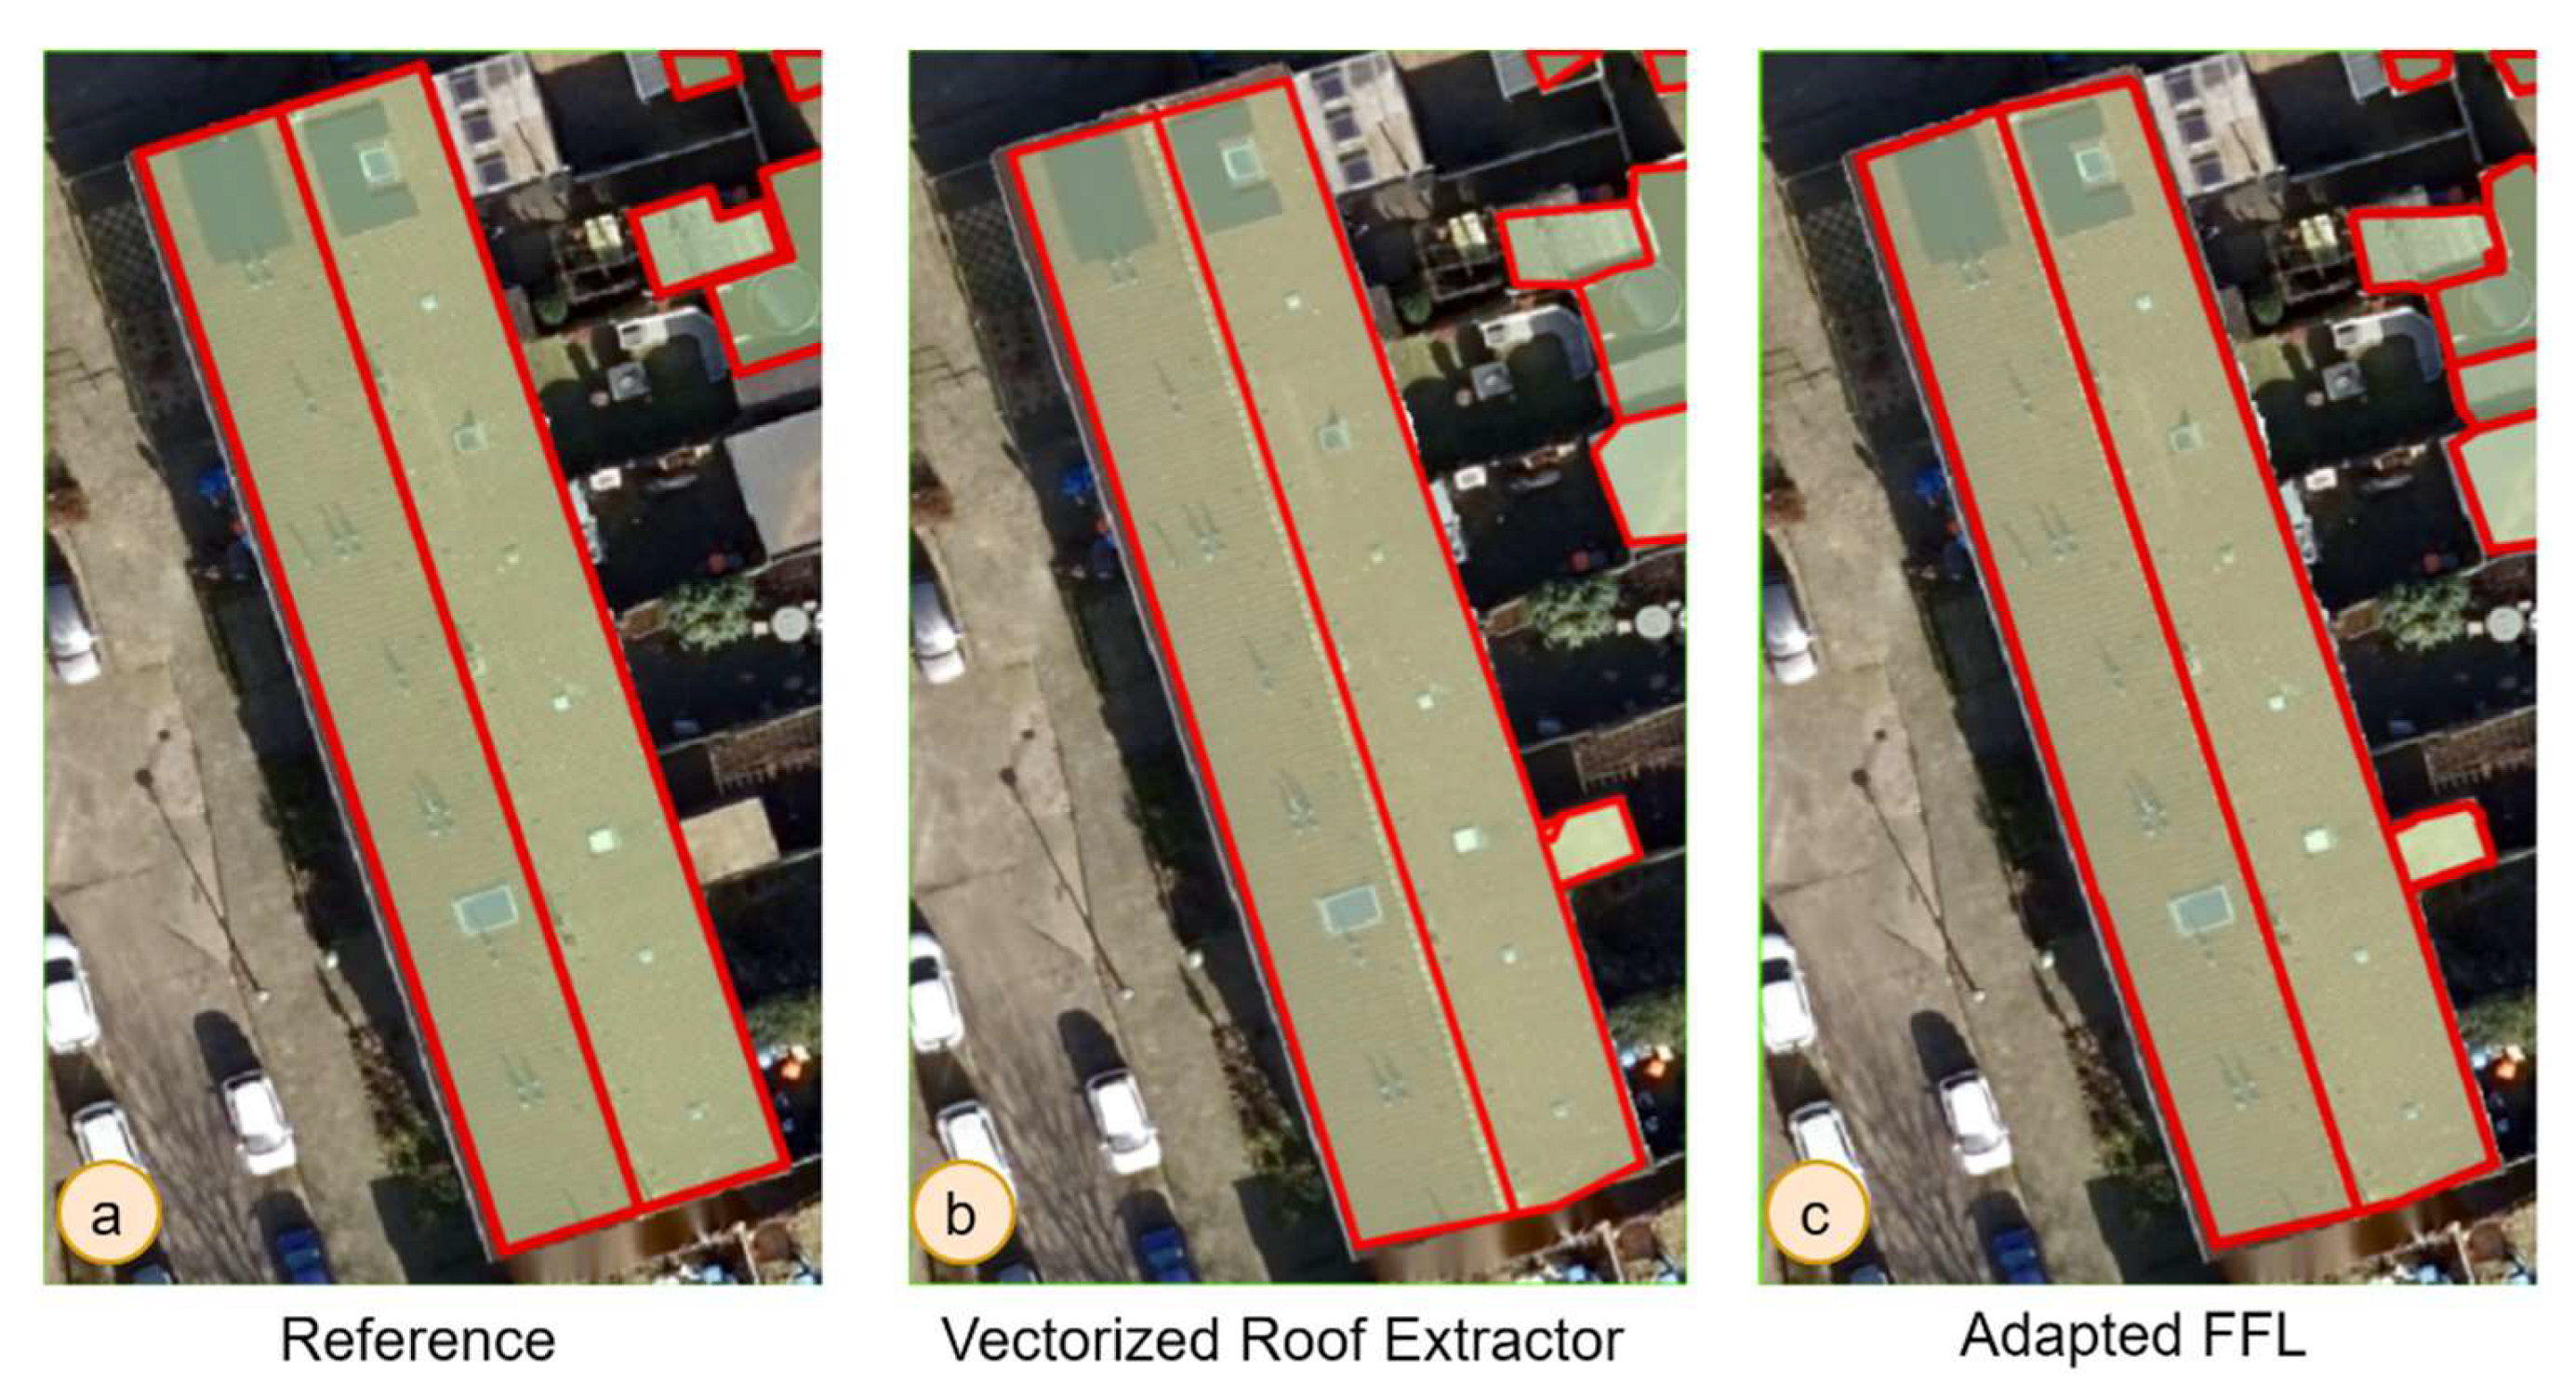
Figure 13 shows the rooflines extracted by two models, as well as the corresponding reference data for comparison. The outlines and inner rooflines extracted by the FFL model (Figure 16-c) have PoLiS distances of 0.16 m and 0.05 m, respectively. The Vectorized Roof Extractor (Figure 16-b) obtained almost the same results as the FFL model while not having frame fields for rooflines.
4. Discussion
4.1. Benefits and drawbacks of the Vectorized Roof Extractor
In this section, we outline the advantages and disadvantages of the Vectorized Roof Extractor. The benefits of the method are given as followings:
- 1)
No handcrafted features were used. In our models’ comparison, to improve the segmentation, vectorization and corner detection we implement frame field learning. Even though it adds only a small cost to the training and inference time, it does not improve the results.
- 2)
The model can perform roof structure extraction for multiple buildings in one image patch compared to other state-the-art roof structure extraction methods. This advantage facilitates both training and prediction since for training there is no need to selectively generate an image patch and reference having one building, and during prediction, we can output multiple roof structures at once.
- 3)
The model can detect the shared walls of the buildings with the usage of outline segmentation and computation of the skeleton graph.
- 4)
The method outputs the closed building outlines thanks to the separate branching for the building interior and outline segmentation and correction of outlines with the contour of the building interior.
The proposed method, however, has the following drawbacks:
- 1)
The output can have missed detections for which we apply post-processing with the extend/trim lines tools.
- 2)
Since the extension is automatic and attempts to join the closest endpoints, it can also lead to odd results such as overextensions. In contrast, the model is better at predicting simpler roofs consisting of only outlines and ridges. Most of the inner rooflines in our dataset belong to the ridges from what we can deduce that the model prediction could improve if the reference dataset had more examples of other roof elements such as hips and valleys.
- 3)
The model predicts objects such as trees as part of the building if they stand at a near distance since they may have a similar height to the building.
The main causes of the method’s drawbacks are the limited number of training data and the mismatch of the buildings in the training data with their real-life appearance. Even though the pre-processing was performed on the reference dataset, the manual correction was only made on the outlines and inner rooflines with severe mismatches. Another cause is mismatching between the RGB image and nDSM as they have been generated in different years, 2021 and 2019 respectively.
4.2. General applicability and recommendations for improvement
We trained and tested our model in a typical Dutch residential neighbourhood with a variety of roof types. When the same method is used in different geographical locations, the results may vary. Our pre-trained model can have good spatial transferability to the other residential area in the Netherlands or another country if the area has similar residential buildings. However, if the new test area has non-similar buildings with complicated roof structures, the pre-trained model may produce poor results. Even if we retrain the model on a subset of building roofs in the selected area, the test results may be unsatisfactory because the roof types are complex and unique to the training and test sets. On the other hand, if most of the buildings in the test area have flat roof types and are not connected, the model will perform better because there will be no need to detect the inner rooflines and outlines of the buildings with adjacent walls. Furthermore, as the model can detect buildings with shared walls, this method can also be used for slum areas where the built-up environment is very dense. Besides, with some modifications, the method can be used for the extraction of road maps, cadastral or agricultural boundaries.
Considering the aforementioned benefits and drawbacks of the approach, it can be deemed valuable for urban applications. The method can be improved using the following recommendations which can be seen as suggestions for further studies:
- 1)
The collection of a larger amount of training data; can definitely improve the performance of the model, particularly for the inner rooflines.
- 2)
Performing nDSM refinement before using an input to the network. This has been done in the proposed method [
15]. Using refined nDSM will facilitate the elimination of trees in the predictions of the model.
- 3)
Incorporation of an additional final block based on Graph Neural Networks (GNN) will help to ensure the connectivity of the rooflines, which was done in [
7], [
22]. For this task besides predicting rooflines, we can add an extra branch for predicting vertices and take advantage of existing skeleton graph computation. This will be practical as it can possibly substitute the imperfect post-processing step of extension and trimming of rooflines.
5. Conclusion
According to our experiments, Vectorized Roof Extractor showed promising performance in extracting building roof structures based on Dutch buildings. Our method adapted and combined FFL method with the simple skeletonization procedure. The FFL model slightly outperformed the Vectorized Roof Extractor on inner roofline segmentation with the IoU value of 0.35 and performed a little worse on outlines, 0.37, while the Vectorized Roof Extractor showed better results on PoLiS distance with the values of 3.5 m and 1.2 m for outlines and inner rooflines respectively. Besides the proposed model scored higher on the PoLiS-thresholded F-score for outlines and inner rooflines, having 0.31 and 0.57 respectively. Visually, the Vectorized Roof Extractor obtained better results with straighter walls and fewer missed detections of inner rooflines. Thanks to the computation of the skeleton graph, it can predict buildings with common walls. However, it still has limitations such as predicting trees as false positives, extracting building shapes inaccurately, and having an imperfect post-processing procedure that can lead to odd outcomes. Using recommendations provided, such as nDSM refinement and incorporation of GNN, the model can be further improved and applied for roof structure extraction task.
Author Contributions
Conceptualization, M.Kenzhebay C.Persello, M.Koeva, W. Zhao; Methodology, M.Kenzhebay, C.Persello, M.Koeva, W. Zhao; Data Curation, M.Kenzhebay; Writing—Original Draft Preparation, M.Kenzhebay; Writing—Review and Editing, M.Kenzhebay, C.Persello, M.Koeva, W. Zhao; Visualization, M.Kenzhebay.; Supervision, C.Persello, M.Koeva. All authors have read and agreed to the published version of the manuscript.
Conflicts of Interest
The authors declare no conflict of interest.
References
- N. Girard, D. Smirnov, J. Solomon, and Y. Tarabalka. Polygonal Building Segmentation by Frame Field Learning. ArXiv 2020, 1–30. [CrossRef]
- Sun, X.; Zhao, W.; Maretto, R.V.; Persello, C. Building outline extraction from aerial imagery and digital surface model with a frame field learning framework. International Archives of the Photogrammetry, Remote Sensing and Spatial Information Sciences - ISPRS Archives 2021, 43, 487–493. [Google Scholar] [CrossRef]
- Moreia, J.M.M.; Nex, F.; Agugiaro, G.; Remondino, F.; Lim, N.J. From DSM To 3D Building Models: a Quantitative Evaluation. The International Archives of the Photogrammetry, Remote Sensing and Spatial Information Sciences 2013, XL-1/W1, 213–219. [Google Scholar] [CrossRef]
- Qin, Y.; Wu, Y.; Li, B.; Gao, S.; Liu, M.; Zhan, Y. Semantic Segmentation of Building Roof in Dense Urban Environment with Deep Convolutional Neural Network: A Case Study Using GF2 VHR Imagery in China. Sensors 2019, 19, 1164. [Google Scholar] [CrossRef] [PubMed]
- Alidoost, F.; Arefi, H. Knowledge Based 3D Building Model Recognition Using Convolutional Neural Networks From Lidar and Aerial Imageries. ISPRS - Int. Arch. Photogramm. Remote. Sens. Spat. Inf. Sci. 2016, XLI-B3, 833–840. [Google Scholar] [CrossRef]
- Luo, L.; Li, P.; Yan, X. Deep Learning-Based Building Extraction from Remote Sensing Images: A Comprehensive Review. Energies 2021, 14, 7982. [Google Scholar] [CrossRef]
- Zhang, F.; Nauata, N.; Furukawa, Y. “Conv-MPN: Convolutional message passing neural network for structured outdoor architecture reconstruction,” Proceedings of the IEEE Computer Society Conference on Computer Vision and Pattern Recognition, pp. 2795–2804, 2020. [CrossRef]
- Alidoost, F.; Arefi, H.; Tombari, F. 2D Image-To-3D Model: Knowledge-Based 3D Building Reconstruction (3DBR) Using Single Aerial Images and Convolutional Neural Networks (CNNs). Remote. Sens. 2019, 11, 2219. [Google Scholar] [CrossRef]
- Nauata, N.; Furukawa, Y. Vectorizing World Buildings: Planar Graph Reconstruction by Primitive Detection and Relationship Inference,” Springer, vol. 12353, no. Computer Vision – ECCV 2020. ECCV 2020. Lecture Notes in Computer Science(), pp. 711–726, 2020. [CrossRef]
- Zhao, W.; Persello, C.; Stein, A. End-To-End Roofline Extraction From Very-High-Resolution Remote Sensing Images, International Geoscience and Remote Sensing Symposium (IGARSS), pp. 2783–2786, 2021. [CrossRef]
- Hang, L.; Cai, G.Y. CNN based Detection Of Building Roofs From High Resolution Satellite Images. ISPRS - Int. Arch. Photogramm. Remote. Sens. Spat. Inf. Sci. 2020, XLII-3- W10, 187–192. [Google Scholar] [CrossRef]
- Wang, L.; Chu, C.-H.H. 3D building reconstruction from LiDAR data. Conf Proc IEEE Int Conf Syst Man Cybern 2009, 3054–3059. [Google Scholar] [CrossRef]
- Novacheva, A. Building roof reconstruction from LiDAR data and aerial images through plane extraction and colour edge detection. The International Archives of the Photogrammetry 2008, 53–59. [Google Scholar]
- Li, L.; Song, N.; Sun, F.; Liu, X.; Wang, R.; Yao, J.; Cao, S. Point2Roof: End-to-end 3D building roof modeling from airborne LiDAR point clouds. ISPRS J. Photogramm. Remote. Sens. 2022, 193, 17–28. [Google Scholar] [CrossRef]
- Wang, Y.; Zorzi, S.; Bittner, K. “Machine-learned 3D building vectorization from satellite imagery,” in IEEE Computer Society Conference on Computer Vision and Pattern Recognition Workshops, 2021, pp. 1072–1081. [CrossRef]
- Awrangjeb, M.; Zhang, C.; Fraser, C.S. Automatic extraction of building roofs using LIDAR data and multispectral imagery. ISPRS J. Photogramm. Remote. Sens. 2013, 83, 1–18. [Google Scholar] [CrossRef]
- Liu, K.; Ma, H.; Ma, H.; Cai, Z.; Zhang, L. Building Extraction from Airborne LiDAR Data Based on Min-Cut and Improved Post-Processing. Remote. Sens. 2020, 12, 2849. [Google Scholar] [CrossRef]
- Partovi, T.; Fraundorfer, F.; Azimi, S.; Marmanis, D.; Reinartz, P. Roof type selection based on patchbased classification using deep learning for high resolution satellite imagery. ISPRS - Int. Arch. Photogramm. Remote. Sens. Spat. Inf. Sci. 2017, XLII-1-W1, 653–657. [Google Scholar] [CrossRef]
- Muftah, H.; Rowan, T.S.L.; Butler, A.P. Towards open-source LOD2 modelling using convolutional neural networks. Model. Earth Syst. Environ. 2021, 8, 1693–1709. [Google Scholar] [CrossRef]
- Nauata, N.; Furukawa, Y. “Vectorizing World Buildings: Planar Graph Reconstruction by Primitive Detection and Relationship Inference,” Lecture Notes in Computer Science (including subseries Lecture Notes in Artificial Intelligence and Lecture Notes in Bioinformatics), vol. 12353 LNCS, pp. 711–726, 2020. [CrossRef]
- Gui, S.; Qin, R. Automated LoD-2 model reconstruction from very-high-resolution satellite-derived digital surface model and orthophoto. ISPRS J. Photogramm. Remote. Sens. 2021, 181, 1–19. [Google Scholar] [CrossRef]
- Zhao, W.; Persello, C.; Stein, A. Extracting planar roof structures from very high resolution images using graph neural networks. ISPRS J. Photogramm. Remote. Sens. 2022, 187, 34–45. [Google Scholar] [CrossRef]
- PDOK,” 2013. Available online: https://www.pdok.nl/introductie/-/article/basisregistratie-adressen-en-gebouwen-ba-1 (accessed on 24 November 2021).
- Ronneberger, P. U-Net: Convolutional Networks for Biomedical Image Segmentation. LNCS 2015, 234–241. [Google Scholar] [CrossRef]
- He, K.; Zhang, X.; Ren, S.; Sun, J. Deep residual learning for image recognition. In Proceedings of the IEEE Computer Society Conference on Computer Vision and Pattern Recognition (CVPR), Las Vegas, NV, USA, 27–30 June 2016; pp. 770–778. [Google Scholar] [CrossRef]
- Deng, J.; Dong, W.; Socher, R.; Li, L.-J.; Li, K.; Fei-Fei, L. ImageNet: A large-scale hierarchical image database. In Proceedings of the 2009 IEEE Conference on Computer Vision and Pattern Recognition, Miami, FL, USA, 20–25 June 2009; pp. 248–255. [Google Scholar] [CrossRef]
- S. S. M. Salehi, D. S. S. M. Salehi, D. Erdogmus, and A. Gholipour, “Tversky loss function for image segmentation using 3D fully convolutional deep networks,” Lecture Notes in Computer Science (including subseries Lecture Notes in Artificial Intelligence and Lecture Notes in Bioinformatics), vol. 10541 LNCS, pp. 379–387, Jun. 2017. [CrossRef]
- Zhang, T.Y.; Suen, C.Y. A fast parallel algorithm for thinning digital patterns. Commun. ACM 1984, 27, 236–239. [Google Scholar] [CrossRef]
- Ramer, U. An iterative procedure for the polygonal approximation of plane curves. Comput. Graph. Image Process. 1972, 1, 244–256. [Google Scholar] [CrossRef]
- Kass, M.; Witkin, A.; Terzopoulos, D. Snakes: Active contour models. Int. J. Comput. Vis. 1988, 1, 321–331. [Google Scholar] [CrossRef]
Figure 1.
a) Building outlines; b) Inner rooflines ; c) Building roof structure.
Figure 1.
a) Building outlines; b) Inner rooflines ; c) Building roof structure.
Figure 3.
Tiles distribution : train(purple), validation(green), test (red).
Figure 3.
Tiles distribution : train(purple), validation(green), test (red).
Figure 4.
Pre-processing: rasterization of the reference data.
Figure 4.
Pre-processing: rasterization of the reference data.
Figure 5.
Methodological flowchart of Vectorized Roof Extractor.
Figure 5.
Methodological flowchart of Vectorized Roof Extractor.
Figure 6.
Building segmentation, same for outer and inner rooflines [1.]
Figure 6.
Building segmentation, same for outer and inner rooflines [1.]
Figure 7.
Skeleton vectorization.
Figure 7.
Skeleton vectorization.
Figure 8.
Post-processing: a) raw predicted output; b) post-line extension output; c) post-line trimming output.
Figure 8.
Post-processing: a) raw predicted output; b) post-line extension output; c) post-line trimming output.
Figure 9.
Frame field learning for roof structure extraction[
1,
1,
30,
1,
1].
Figure 9.
Frame field learning for roof structure extraction[
1,
1,
30,
1,
1].
Figure 10.
Cases with high PoLiS distance: a -missed detections of adjacent walls (PoLiS – 1.56 m); b – storage sheds on the backyard which are not included in the reference data (PoLiS – 3.56 m 7.01 m for both sheds).
Figure 10.
Cases with high PoLiS distance: a -missed detections of adjacent walls (PoLiS – 1.56 m); b – storage sheds on the backyard which are not included in the reference data (PoLiS – 3.56 m 7.01 m for both sheds).
Figure 11.
Segmentation results: first row - interior (red) and outline(yellow) probability maps; second row – inner roofline(purple) probability maps.
Figure 11.
Segmentation results: first row - interior (red) and outline(yellow) probability maps; second row – inner roofline(purple) probability maps.
Figure 12.
Results obtained with Vectorized Roof Extractor and adapted FFL and corresponding reference data.
Figure 12.
Results obtained with Vectorized Roof Extractor and adapted FFL and corresponding reference data.
Figure 13.
Rooflines of the building extracted by the Vectorized Roof Extractor: PoLiS outline – 0.13 m, PoLiS inner roofline – 0.17 m; Adapted FFL: PoLiS outline – 0.16 m, PoLiS inner roofline – 0.05 m.
Figure 13.
Rooflines of the building extracted by the Vectorized Roof Extractor: PoLiS outline – 0.13 m, PoLiS inner roofline – 0.17 m; Adapted FFL: PoLiS outline – 0.16 m, PoLiS inner roofline – 0.05 m.
Table 1.
Dataset content.
Table 1.
Dataset content.
| Data |
Source |
| BAG building footprints (vector format) |
Public Services On the Map (PDOK)[23] |
| Roofline (Eave, Ridge, Hip) (vector format) |
Digitized by ITC Master’s degree graduate M. Golnia, M. Kenzhebay |
| Orthophoto (8 cm) from aerial imagery, 2021 |
PDOK |
| nDSM (50 cm), 2019 |
PDOK |
Table 2.
Dataset tiles distribution.
Table 2.
Dataset tiles distribution.
| Type |
Tile size |
Number of tiles |
| Training |
500x500 |
584 |
| Validation |
500x500 |
84 |
| Testing |
1000x1000 |
42 |
Table 3.
IoU of the predicted interior, outlines and inner rooflines probability maps.
Table 3.
IoU of the predicted interior, outlines and inner rooflines probability maps.
| Model |
↑IoUinterior
|
↑IoUoutlines
|
↑IoUinner rooflines
|
| Adapted FFL model |
0.85 |
0.37 |
0.35 |
| Vectorized Roof Extractor, our model |
0.85 |
0.38 |
0.32 |
Table 4.
PoLiS distance of outlines and inner rooflines.
Table 4.
PoLiS distance of outlines and inner rooflines.
| Model |
↓PoLiSoutlines (m)
|
↓PoLiSinner rooflines (m)
|
| Adapted FFL model |
3.6 |
2 |
| Vectorized Roof Extractor, our model |
3.5 |
1.2 |
Table 5.
Precision, Recall and F-score for the inner rooflines and outlines with PoLiS≤0.5.
Table 5.
Precision, Recall and F-score for the inner rooflines and outlines with PoLiS≤0.5.
| Model |
Outlines |
Inner rooflines |
↑Precision
PoLiS≤0.5 |
↑Recall
PoLiS≤0.5 |
↑F-score
PoLiS≤0.5 |
↑Precision PoLiS≤0.5 |
↑Recall
PoLiS≤0.5 |
↑F-score
PoLiS≤0.5 |
| Adapted FFL model |
0.26 |
0.34 |
0.29 |
0.59 |
0.39 |
0.47 |
Vectorized Roof
Extractor, our model |
0.28 |
0.34 |
0.31 |
0.72 |
0.47 |
0.57 |
|
Disclaimer/Publisher’s Note: The statements, opinions and data contained in all publications are solely those of the individual author(s) and contributor(s) and not of MDPI and/or the editor(s). MDPI and/or the editor(s) disclaim responsibility for any injury to people or property resulting from any ideas, methods, instructions or products referred to in the content. |
© 2023 by the authors. Licensee MDPI, Basel, Switzerland. This article is an open access article distributed under the terms and conditions of the Creative Commons Attribution (CC BY) license (https://creativecommons.org/licenses/by/4.0/).
