Preprint
Article

Analysis of Acoustic Flow Field Characteristics of Key Components of High-speed Train Bogies

Altmetrics

Downloads

85

Views

11

Comments

0

A peer-reviewed article of this preprint also exists.

This version is not peer-reviewed

Submitted:

11 September 2023

Posted:

13 September 2023

You are already at the latest version

Alerts
Abstract
In this paper, we aim to address the challenge of airflow interference during fault detection in high-speed train bogies by introducing a flow field and investigating the characteristics of the sound field distribution of critical components under its influence. This approach overcomes the limitation observed in previous studies that ignored the impact of the flow field. Furthermore, we evaluate and compare various layouts for inter-track acoustic sensor arrays. The proposed sensing methods hold significant practical engineering value, and the collected data serves as a valuable reference for acquiring acoustic signals from key bogie components in future research.
Keywords: 
Subject: Engineering  -   Mechanical Engineering

1. Introduction

Mechanical failure has a major impact on rail car safety, with bogie failure accounting for 30–40% of all failures[1].A key component of high-speed trains, the bogie supports the entire body of the vehicle, transmits various loads and forces, and regulates how the train's body interacts with the track. It is essential to quickly locate and address any mechanical bogie issues in order to ensure safe train running.
Currently, in addition to manual detection methods, bogie fault detection technologies are also being developed using signal sensors. Commonly, there is on-board detection, where sensors are installed at key bogie components. For example, the on-board detection device of JK00430 type locomotive walking part jointly developed by Beijing Bureau of Locomotive Service and Beijing Tangzhi Technology Development Co[2]. The device is combined of sensors to extract signals and process them, while an online host with DSP as the core saves the information to achieve online diagnosis of railway vehicles without disintegration. Although this type of method can obtain vibration signals in time, the installation location is restricted, prone to interference, omission of data and other problems. In response to the above shortcomings, in the 1980s, acoustic testing technology began to develop continuously, from the earliest single-point testing methods gradually developed to array testing technology, the use of sound source positioning and imaging and other technologies to achieve acoustic imaging of complex structures, and can effectively identify all kinds of faults in them. For example, Zhou Mingyu[3]. studied a track side non-contact acoustic sensor array to achieve acoustic detection of train bogie axle box bearings. Alsalaet Jaafar K[4] used normalized diagnostic feature maps and convolutional neural networks for bearing fault diagnosis. In practical applications, the fault diagnosis capability of acoustic signals is often combined with other indicators, such as vibration signals and statistical indicators etc.Farzin [5] studied a hybrid fuzzy v-structure fuzzy fault estimator for fault diagnosis and crack size identification bearings using vibration signals.
However, high speed trains cause changes in airflow when traveling, and any fluid motion must obey the three laws of conservation, i.e., the law of conservation of mass, the law of conservation of momentum, and the law of conservation of energy [6]. The conservation of momentum for viscous incompressible fluids is described by the Navier-Stokes equation i.e. N-S equation. This equation was established by Navier and Strokes in 1827 and 1845, respectively, on the basis of the equation of motion of an ideal fluid, which reflects the basic mechanical laws of real fluids. Later, with the development of Reynolds theorem, boundary layer theory and turbulence theory, the development of fluid mechanics and aerodynamics was promoted. In the field of acoustics, Rayleigh summarized the results of a large number of past acoustic researches in 1877 and published The theory of sound, which marked the establishment of the classical acoustic theoretical system and the beginning of modern acoustics [7].In 1952, the British scientist Lighthill decouple the flow field and acoustic field from the set of equations including the Navier-Stokes equations, and derived the Lighthill equation [8,9], which establishes the connection between the flow field parameters and acoustic fluctuation quantities. The equations point out that the flow-causing noise in free space is equivalent to the noise generated by the perturbation of quadrupole sources, which can effectively solve the jet noise problem, and is widely regarded as the beginning of aerodynamic acoustics research with great theoretical significance.In 1955, Curle applied the Kirchhoff method in Lighthill aerodynamic acoustics theory based on the existence of static solid boundary influence of the flow field noise radiation integral solution.Curle [10] theory shows that the solid boundary of the influence of the flow noise can be seen as a dipole source dispersed in the flow field on the solid boundary, and the strength of the source is directly proportional to the surface of the object of the fluid force, in addition to the quadrupole source action constitutes the acoustic field. In addition to the quadrupole source action constitutes an acoustic field.Curle's theory effectively solves the problems of cylindrical flow noise and windblown sound in turbulent flows with stationary objects. However, it is not possible to solve the noise problems of the moving solid boundary coupled with the flow field, such as rotor noise, propeller noise, and other complex streaming noise.In 1964, Powell [11] adopted the vortex volume term to describe the unknown source term of Lighthill's equation to form the vortex acoustic equation, which was used to study the acoustic-fluid interactions, and the noise problems caused by pulsating heat sources.In 1969, based on Curle's theory, Ffowcs Williams and Hawkings used the generalized function method [12,13] to effectively solve the the flow sounding problem influenced by the existence of a moving solid boundary, and obtained the famous Ffowcs Williams-Hawkings equation (FW-H equation for short) [14]. This equation states that the flow field noise in the presence of moving solids includes three kinds of sound sources: monopole, dipole and quadrupole sources [15]. Subsequently, after continuous refinement, the equation has been widely used for far-field and near-field prediction of noise. However, both Curle's theory and the FW-H equation are obtained under the condition of propagation in a stationary flow field medium. Therefore, in 1975 Goldstein [16] applied the Green (Green) function method to generalize the theory of aerodynamic acoustics to the problem of sound generation of moving objects in a uniformly moving medium, such as aerodynamic noise of turbulent shear flow, turbulent jet noise, and so on. His results are known as the generalized Lighthill equation.
Shi Yan [17] used computational fluid dynamics method to simulate the acoustic characteristics of the muffler, and analyzed the spectral structure of the exhaust noise after installing the muffler in the vehicle, so as to form a complete set of simulation and calculation method of the sound quality of the exhaust noise of the vehicle. The State Key Laboratory of Internal Combustion Engine Reliability of Weichai Power Co., Ltd [18] analyzed the transfer loss calculation method and characteristics of the perforated pipe muffler under non-uniform-flow conditions, applied CFD software to calculate the flow field inside the muffler and then transferred the fluid properties to the LMS Virtual Lab acoustic finite element model through the way of mesh mapping, and chose different perforated impedance models to calculate the transfer loss. Different perforated impedance models were chosen to calculate the transmission loss of the muffler. Xu Lei [19] of Hefei University of Technology applied three-dimensional numerical methods to analyze the effect of airflow velocity on the acoustic performance of cross-flow perforated pipe, and the results show that there is a positive correlation between airflow velocity and muffling volume, i.e., an increase in the velocity of the airflow will make the muffling volume increase. Yan Tang [20] investigated the effect of the flow field inside the antisocial muffler on the transmission loss, using the principle of fluid dynamics and the acoustic finite element method, and carried out numerical simulation experiments, and concluded that the calculation based on the analysis of the flow field to improve the efficiency of the noise reduction can be achieved by the optimization of the structure of the multi-objective. Chu Z [21] used the finite element method to analyze the transmission loss of the muffler under the three conditions of no-flow, uniform-flow, and non-uniform-flow. Soenarko and Seybert [22,23] suggested that the boundary element method can be used to predict the propagation law of acoustic waves in mufflers, confirming that the method is able to predict the behavior of acoustic wave propagation in high frequencies where the plane wave theory fails, and that it can be used to simulate and analyze the mufflers with complex internal structures.
In summary, the existence of flow field will have an impact on the sound field distribution. Therefore, this paper will introduce the flow field, study the intact field distribution characteristics of the key components of the bogie of high-speed trains under the influence of the flow field, and compare and analyze them. This will provide a new reference and choice for the subsequent acoustic signal acquisition of the fundamental components of the bogie..

2. Calculation model

2.1. Theoretical Basis of Acoustic Flow Field Calculation

When the train is running at a lower speed, the airflow Mach number does decrease accordingly, and at this time the effect of the acoustic field on the flow field can be considered relatively weak or negligible. In this case, it can be assumed that only the effect of the flow field on the acoustic field is considered, and calculations can be performed using the acoustic flow field control equation to determine the calculation method of the acoustic flow field control equation.

2.1.1. Basic equations of control for fluid dynamics

In the field of fluid dynamics, the governing equations are derived from three fundamental physical principles: conservation of mass, Newton's second law, and conservation of energy [24]. These equations play a crucial role in describing the motion of a flow field. As acoustic fields are a type of flow field, they too are governed by hydrodynamic equations, particularly when it comes to describing fluid-generated noise. Therefore, when studying fluid-generated noise, it is necessary to solve the problem through acoustic and hydrodynamic calculations. In this section, we will provide a brief introduction to the fundamental equations of fluid motion.
(1) Continuity equation - derived from the law of conservation of mass
The continuity equation represents a specific manifestation of the law of mass conservation in fluid dynamics, which is employed to describe the preservation of mass during fluid motion. It is based on the utilization of the continuum medium model for fluids [25], wherein the fluid is perceived as a continuous and uniformly distributed medium, with both velocity and density being continuously differentiable functions of spatial coordinates and time. In all instances of fluid motion, adherence to the law of mass conservation is observed, and the continuity equations derived from this principle [26] can be applied even in non-constant flows. The corresponding differential expressions are provided below:
ρ t + ( ρ u ) x + ( ρ v ) y + ( ρ w ) z = 0
where the corresponding fluid velocity components u, v, and w in the coordinate x, y, and z directions.
(2) Momentum equation - derived from the law of conservation of momentum (Newton's second law)
u t + u u x + v u y + w u z = f x 1 ρ p x + v 2 u x 2 + 2 u y 2 + 2 u z 2
v t + u v x + v v y + w v z = f y 1 ρ p y + v 2 v x 2 + 2 v y 2 + 2 v z 2
Where fx、fy、fz, i.e., correspond to the force per unit mass of each axis, i.e., the p-surface force distribution function, and v is the fluid kinematic viscosity [27].
(3) Energy equation (also known as Bernoulli's equation) - derived from the law of conservation of energy
The energy equation in fluid mechanics describes how energy transforms within a fluid by considering factors such as density, temperature, internal energy, and other relevant parameters. This equation reflects the fundamental principle of conserving energy by incorporating the internal energy associated with circulation processes. Consequently, changes in fluidic energetics are considered while still upholding the law of conservation of energy. The differential expression is provided below:
T t + u T x + v T y + w T z = α 2 T x 2 + 2 T y 2 + 2 T z 2
Where T is the temperature, t is the coefficient of dynamic hysteresis, α is the coefficient of thermal conductivity, the corresponding relationship is shown in the following equation:
α = k h ρ c p
where kh is the coefficient of thermal conductivity and cp is the specific heat of pressure, which is approximately equal to the specific heat, c.

2.1.2. Acoustic Finite Element Method (AFEM)

Acoustic Finite Element Method (AFEM) is a numerical calculation method developed on the basis of classical acoustic equations. It employs numerical computation techniques to help us analyze and solve complex acoustic field problems, such as acoustic wave propagation, sound system design, noise control and so on. Integrating the classical acoustic equations gives:
V p 2 p ( x , y , z ) k 2 p ( x , y , z ) + j ρ 0 ω q 0 ( x , y , z ) d V = 0
Eq:
p denotes the weight function and V is the computational domain.
According to Gaussian theory, the conversion relationship between volume and area fractions transforms the above equation into the following relationship:
V ( p p ) d V ω 2 V 1 c 2 p p d V = V j p ρ 0 ω q 0 d V S j ρ 0 ω p v n d S
Eq:
S denotes the boundary of V.
The above equation is discretized for a finite element mesh and collapsed to obtain a system of equations in numerical form:
K a + j ω C a ω 2 M a p i = Q i + V n i + P i = F a i
Eq:
Qi is the input sound source vector; Vni is the input velocity vector of the acoustic plenum, i.e., the velocity boundary condition of the acoustic plenum; Pi is the input sound pressure vector, i.e., the boundary condition of the acoustic pressure; Fai is the acoustic excitation; pi is the acoustic pressure of the grid node where the solution is to be solved; and K a + j ω C a ω 2 M a matrix of equations, is a sparse matrix.

2.2. Body and bogie model

2.2.1. Body model

During actual operation, the head and tail cars of high-speed trains exhibit distinct shapes and structures compared to the intermediate cars, and this variation is not standardized. Given that this study primarily focuses on the flow field area between the bogie and the track6, we have chosen the intermediate car model as our research object. To better analyze the sound field distribution around the bogie, a high-speed train model with one bogie for each intermediate car was established. The dimensions of this car are 3.4 m in height, 3.1 m in width, and 17 m in length. The distance between the bogie and the front of the car is set at 7 m to ensure proper fluid development before entering into the bogie area while maintaining consistency with real-life high-speed train's flow field around its bogie (Figure 2.1). Similarly, there is also a distance of 7 m between the rear end of each car and its respective bogie to allow sufficient improvement in wake turbulence without disturbingthe flow field around it.

2.2.2. Bogie model

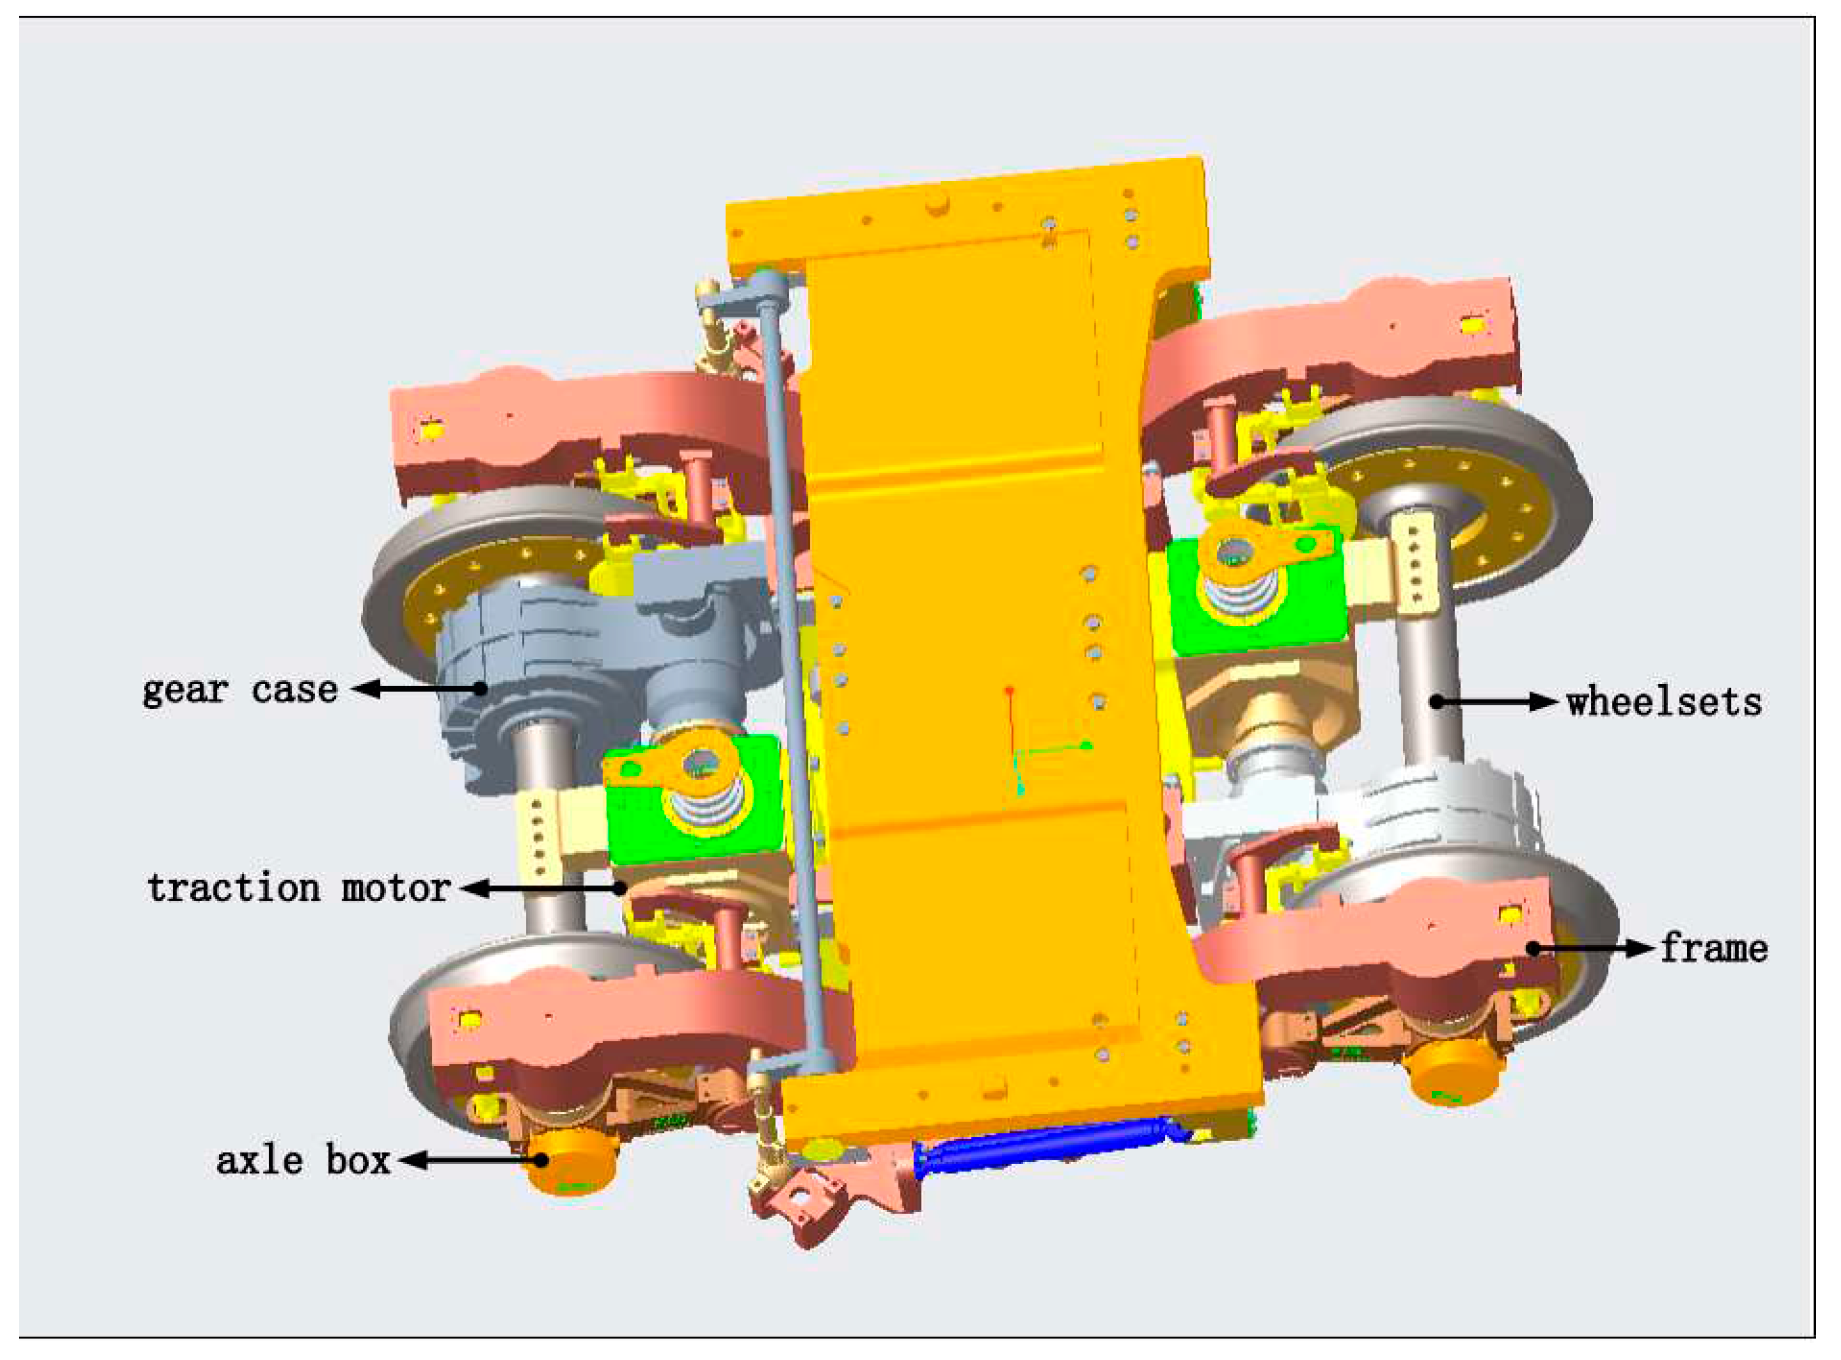
The bogie, located between the track and the car body, is an essential component of a high-speed train. It supports the entire car body, ensures the normal operation of the train, and enables smooth movements on both straight tracks and curves[28]. Therefore, various parameters of the bogie directly affect the safety and stability of the train. Common train bogies today typically consist of a frame, gearbox, traction motor, and axle box (as shown in Figure 2.2).
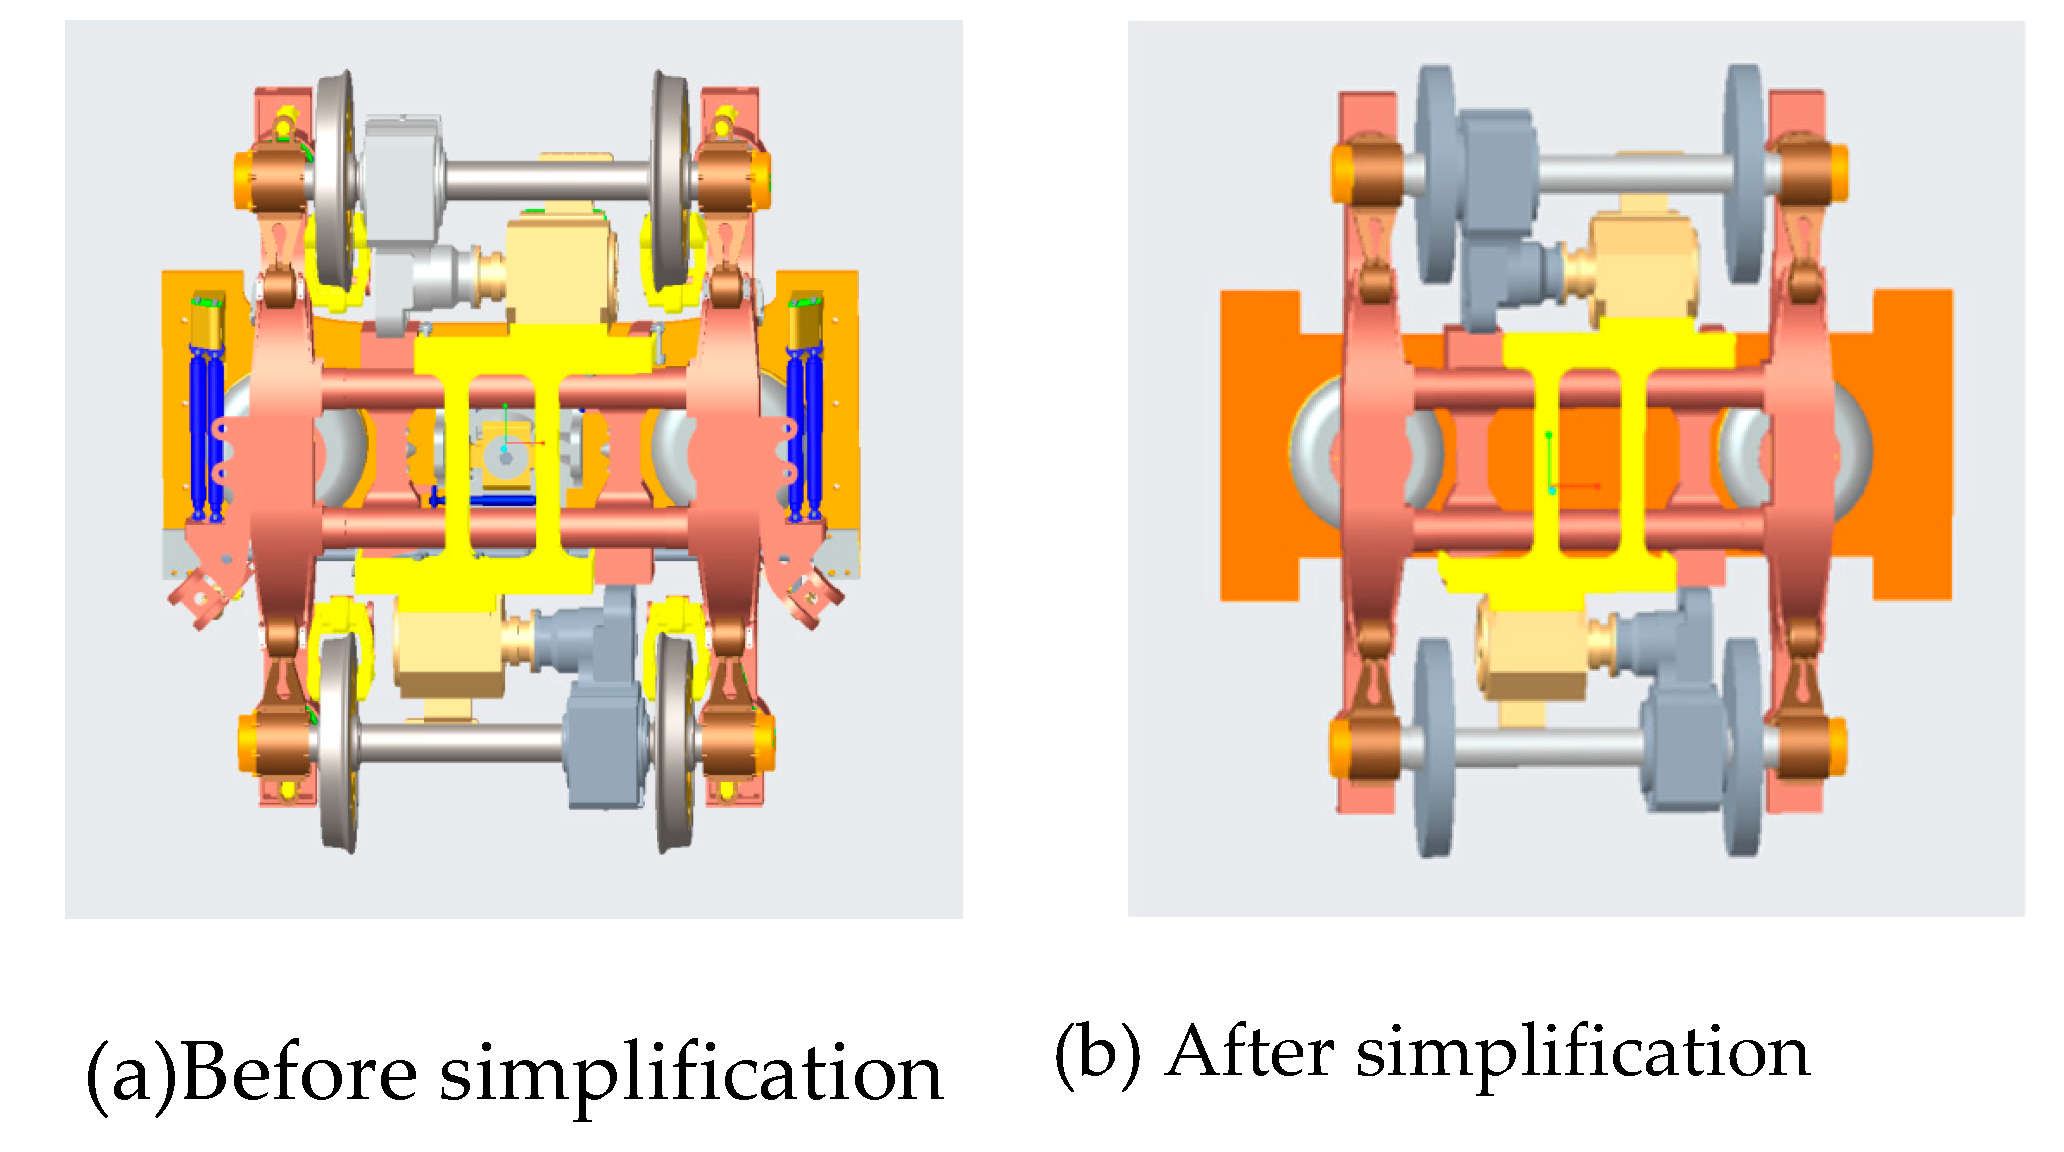
From Figure 2.2 it can be seen that the bogie structure is intricately composed and certain components are constructed with small dimensions. If the un-simplified 3D solid model of the bogie is used directly for analysis and calculation and meshing, it will greatly increase the computational effort of the latest finite element analysis, increase the possibility of errors, and finally will not improve the accuracy of the final results. Therefore, this paper would simplify the bogie model as follows, as shown in Figure 1.3.
(1) Simplifying the bogie model
As the goal of this paper is to examine the key components of the bogie, a simplified model will be used to improve computational efficiency without affecting the analysis of the sound field simulation. The model retained the main components and removed the components that have less influence on the results. The reserved parts were the bogie frame, traction motor, traction motor frame, gearbox, axle box, wheel pair, and air spring. The removed parts were the single traction tie rod, swivel arm positioning device, anti-snake damper, motor fan, and screws and nuts.
(2) Smoothing of key components
The surfaces of key components such as bogie axle boxes and motors are often uneven, especially at the connection between axle box and axle box cover and at the surface of the gearbox motor. These details often have a small impact on the final result and if they are not simplified they will increase the calculation volume significantly, wasting both time and effort. Therefore, the fundamental components of the bogie were smoothed to improve the efficiency of the calculation.
By simplifying the model in the above way, the key components that have a large impact on the final simulation results were retained, and the computational resources were greatly saved, which improves the running speed and efficiency of the finite element analysis at a later stage, and also ensures the accuracy of the final results. The final simplified bogie model is shown in Figure 2.3, with a bogie wheel diameter of 0.9m and a bogie wheelbase of 2.5m.

2.3. Flow field area

In practical terms, it can be seen that high-speed trains are theoretically influenced by the surrounding flow field over an infinite range during operation. However, a larger computational domain requires more resources and has a negligible impact on the accuracy of the results, so the computational area should be selected in a practical way and within a limited area.
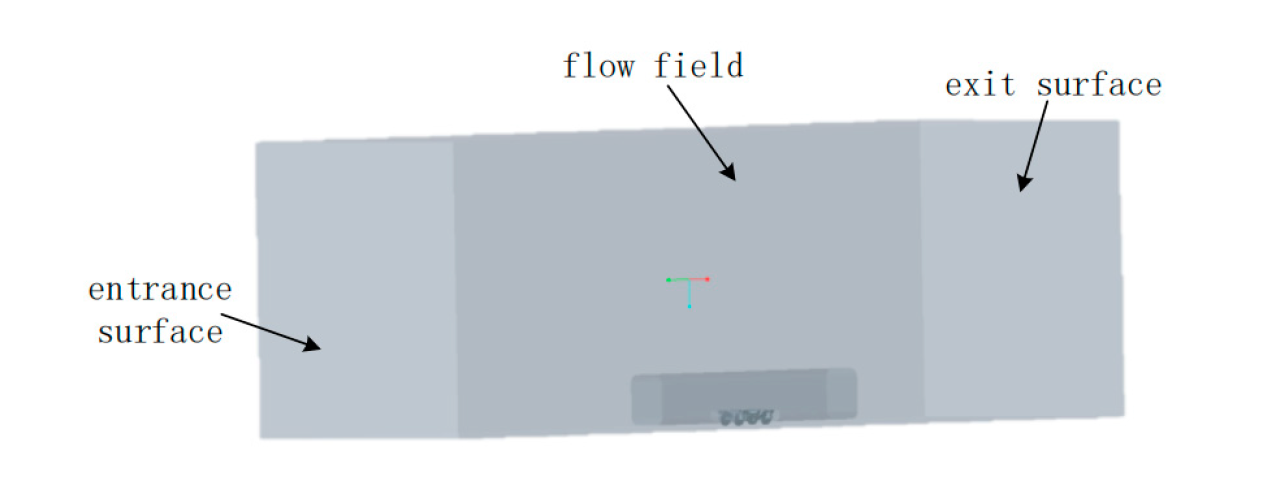
Since the main focus of this paper is to study the sound field distribution between the bogie and the track, it is essential to establish a numerical simulation calculation domain that is as consistent with reality as possible. Thus, the flow field area was set to be 60 m, 20 m, and 20 m in length, width, and height, respectively. The bogie is situated 0.3 m above the ground of the flow field area, while the front end of the car body is located 20 m away from the entrance surface of the flow field and 40 m away from the exit surface of the flow field. This ensures that the fluid entering and leaving the bogie area is fully developed. The flow field area is shown in Figure 2.4.

2.4. Mesh model

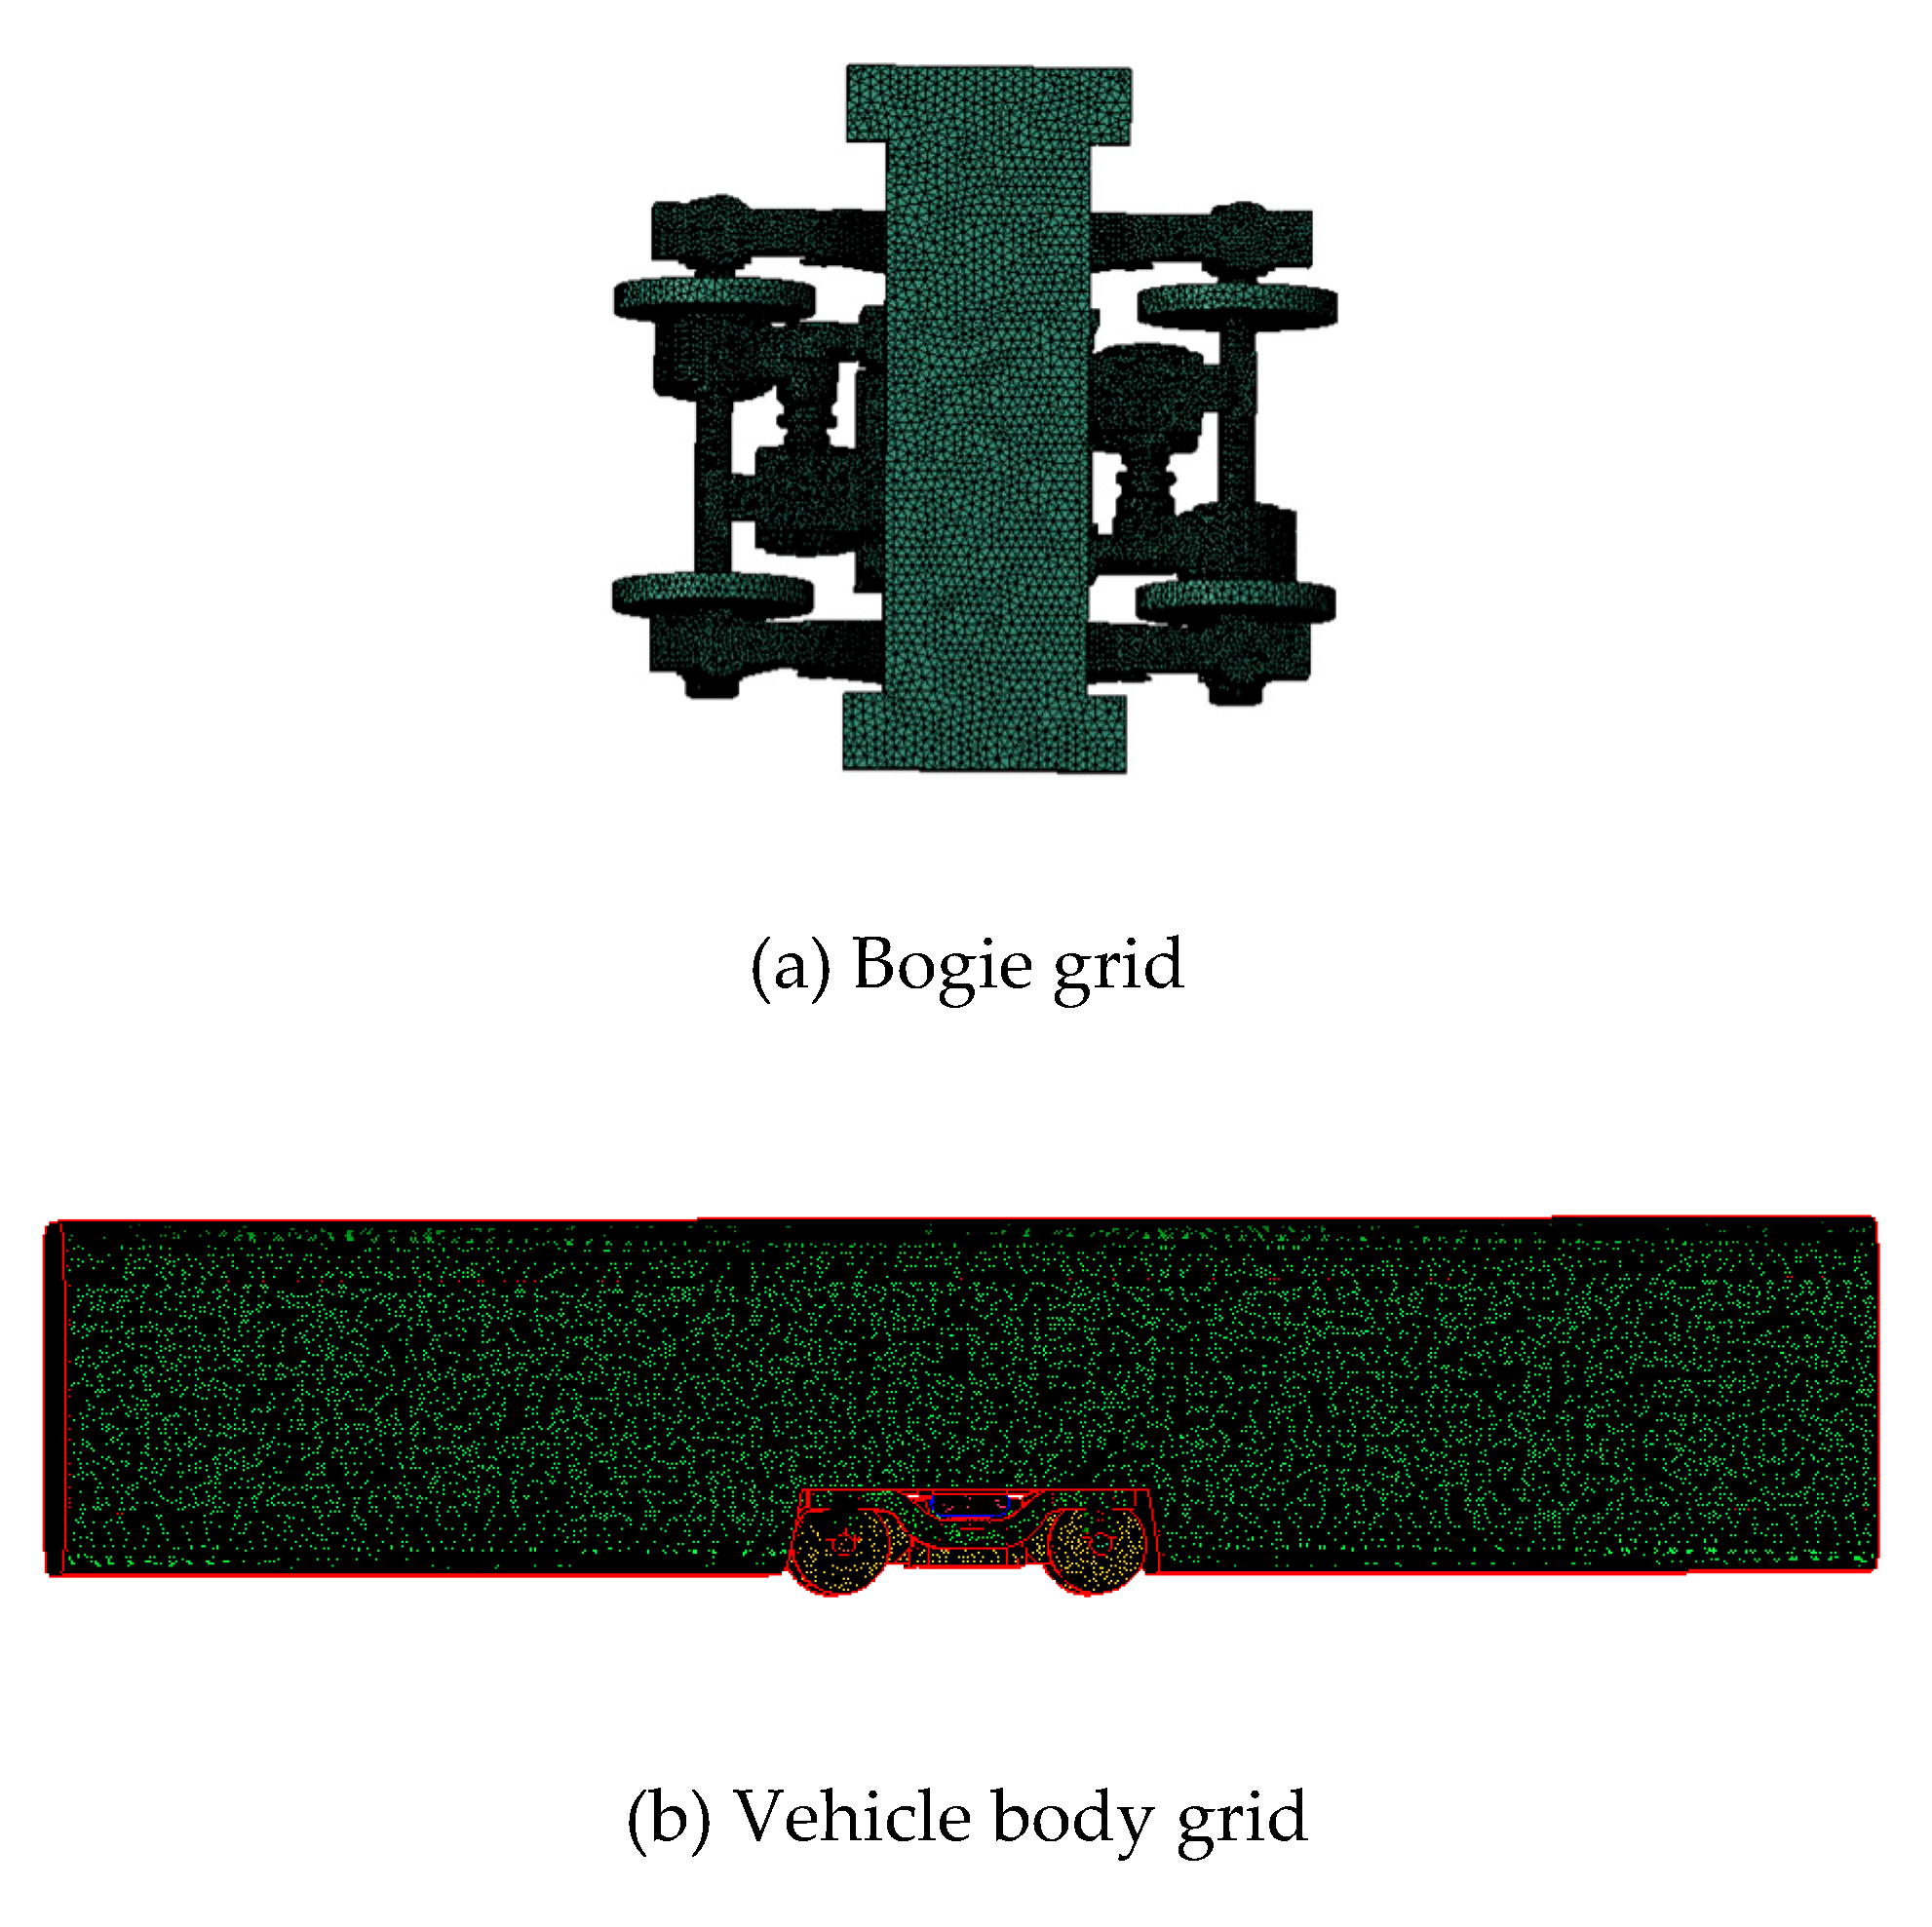
The computational model was initially imported into ICEM, and subsequently, the simplified model underwent a topological check to confirm the presence of all necessary surfaces. Any missing surfaces encountered during the import process were also repaired. Due to the bogie's complex structure and significant size difference with the flow field and body area, the mesh size was chosen to be defined in blocks. Since the bogie area structure is denser, a non-structural mesh was selected. The meshes were encrypted in the direction of the body to avoid an abrupt mesh and ensure its quality. In order to ensure the calculation accuracy of acoustic simulation, at least six cells need to be divided within each minimum wavelength. When the linear cell simulation is performed, The speed of sound c and the highest calculated frequency f m a x are known, and the cell length should be adjusted by equation (10) to meet the maximum frequency range that can be covered.
L c 6 f m a x
As the bogie area structure is multifaceted, an unstructured mesh was generated. The body surface size is 70mm, the minimum grid size for the bogie axle box is 7mm, and the total number of grids is approximately 12 million. The mesh model of the bogie and the exterior of the car body is shown in Figure 2.5.

2.5. Acoustic flow field simulation flow

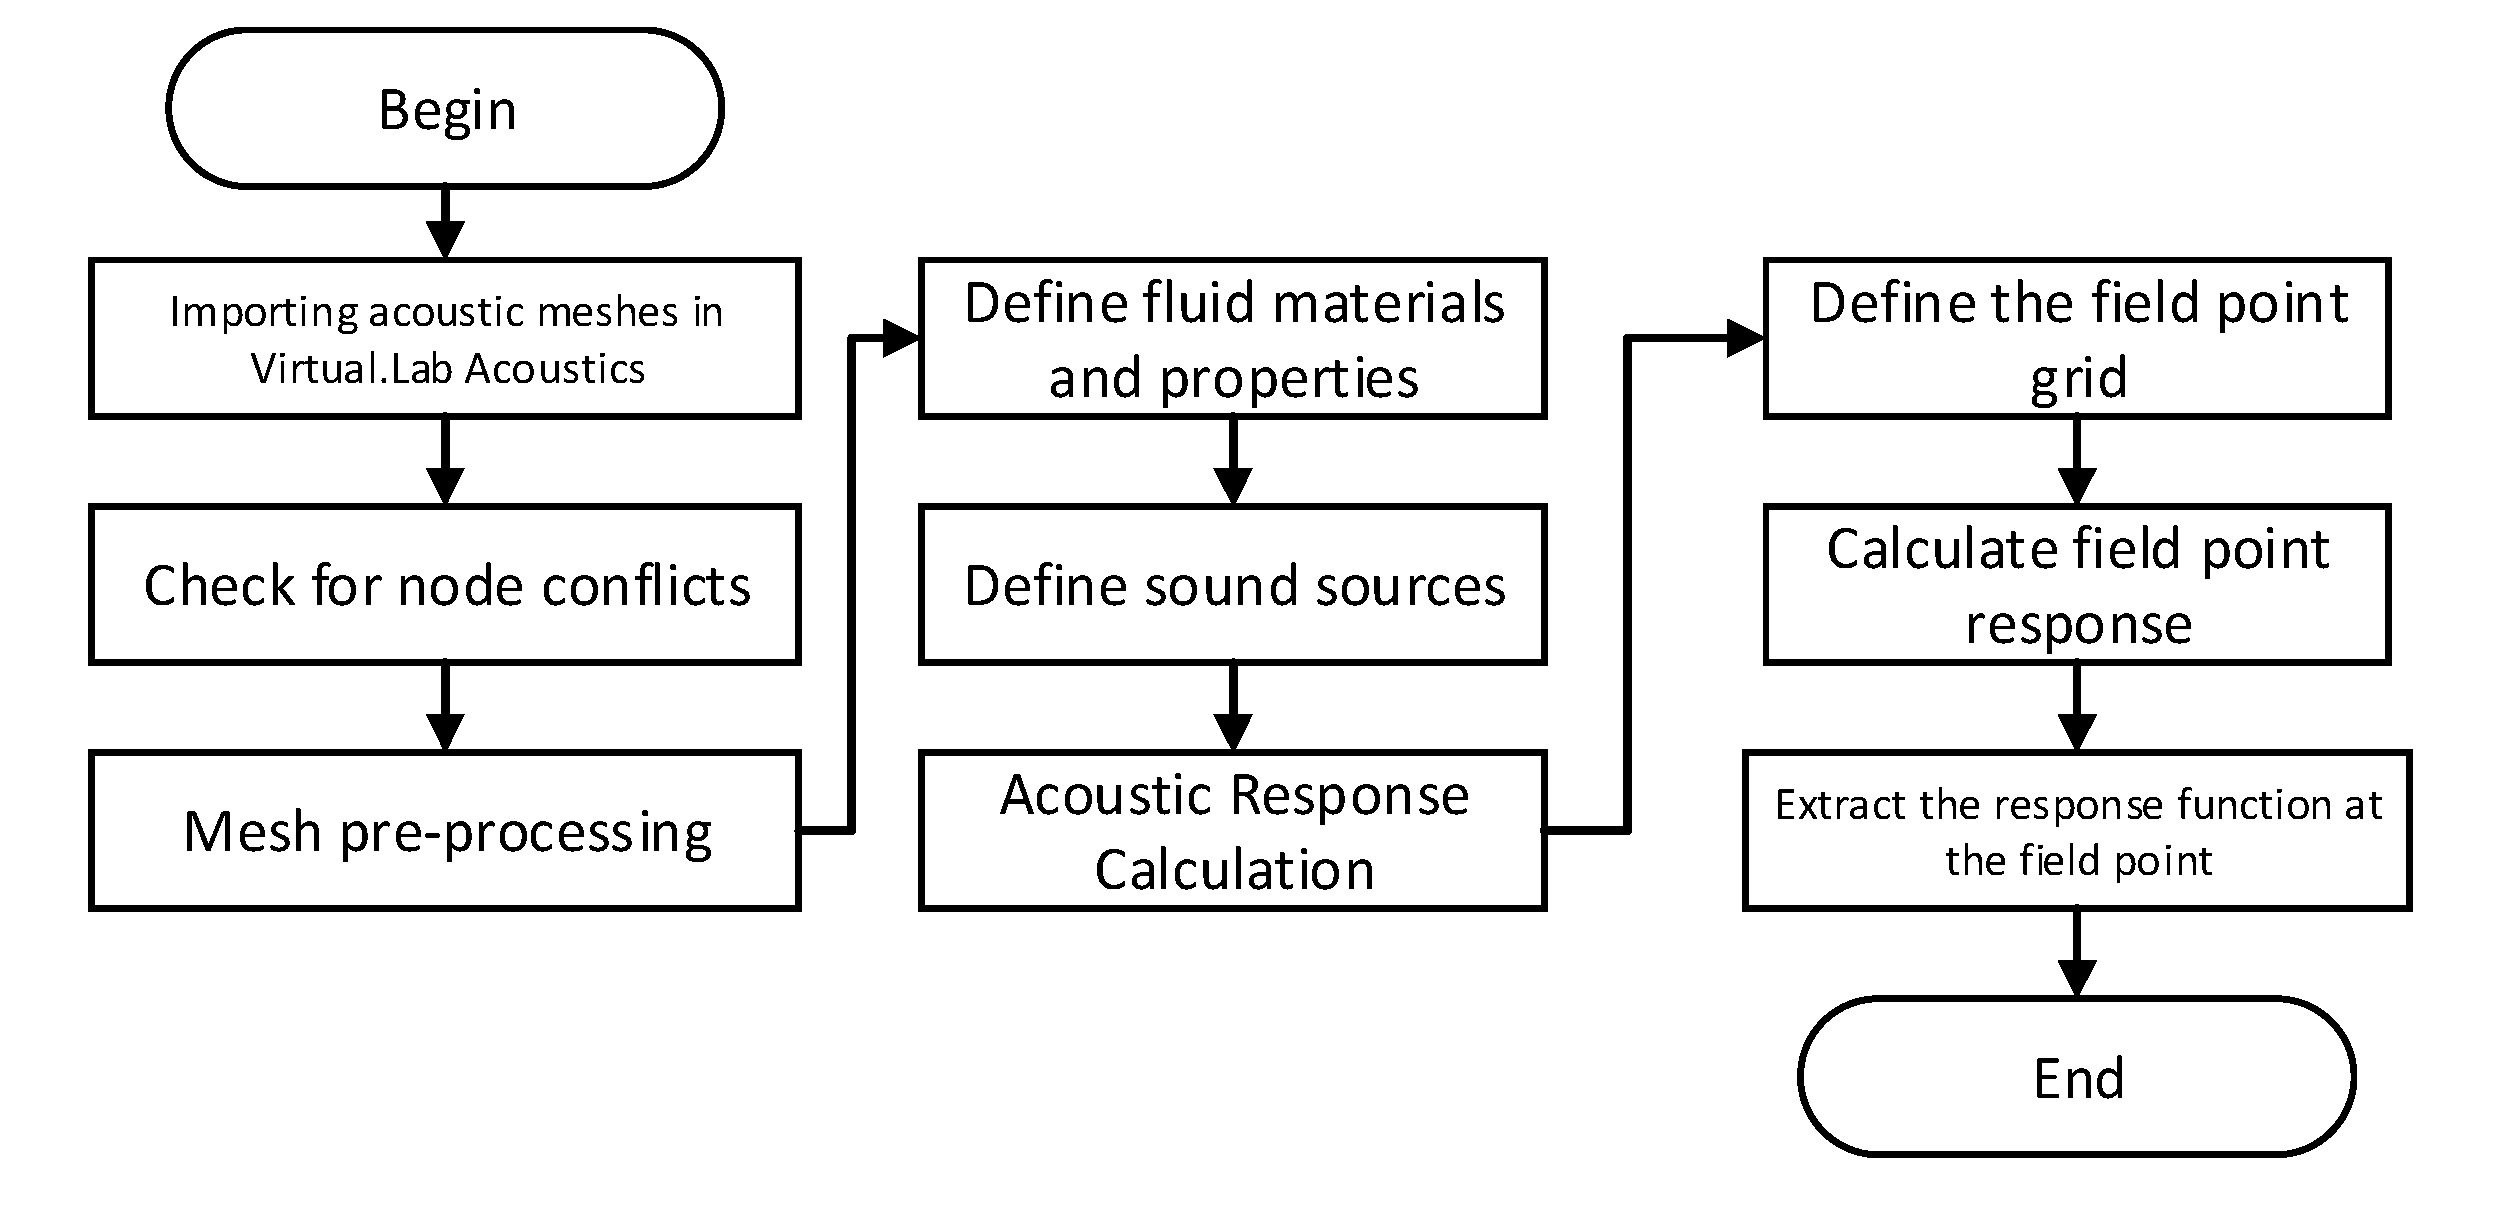
The finite element analysis method under the acoustic module of LMS Virtual.Lab software is applied to simulate the trackside sound field of a high-speed train. The specific flow chart is shown in Figure 2.6:

3. Analysis of the results

3.1. Influence of train speed on the sound field distribution

When a high-speed train is traveling within the range of 30 km/h to 120 km/h, the Mach number is low, and there is no turbulence effect in the fluid. Consequently, the main train speed detected by the acoustic diagnostic system falls within this interval. This paper therefore defined the speeds at the entrance end of the flow field as 30 km/h, 60 km/h, 90 km/h and 120 km/h. This section focuses on the effects of vehicle speed and sound source location on the bogie field distribution.

3.1.1. Cloud distribution of bogie motors

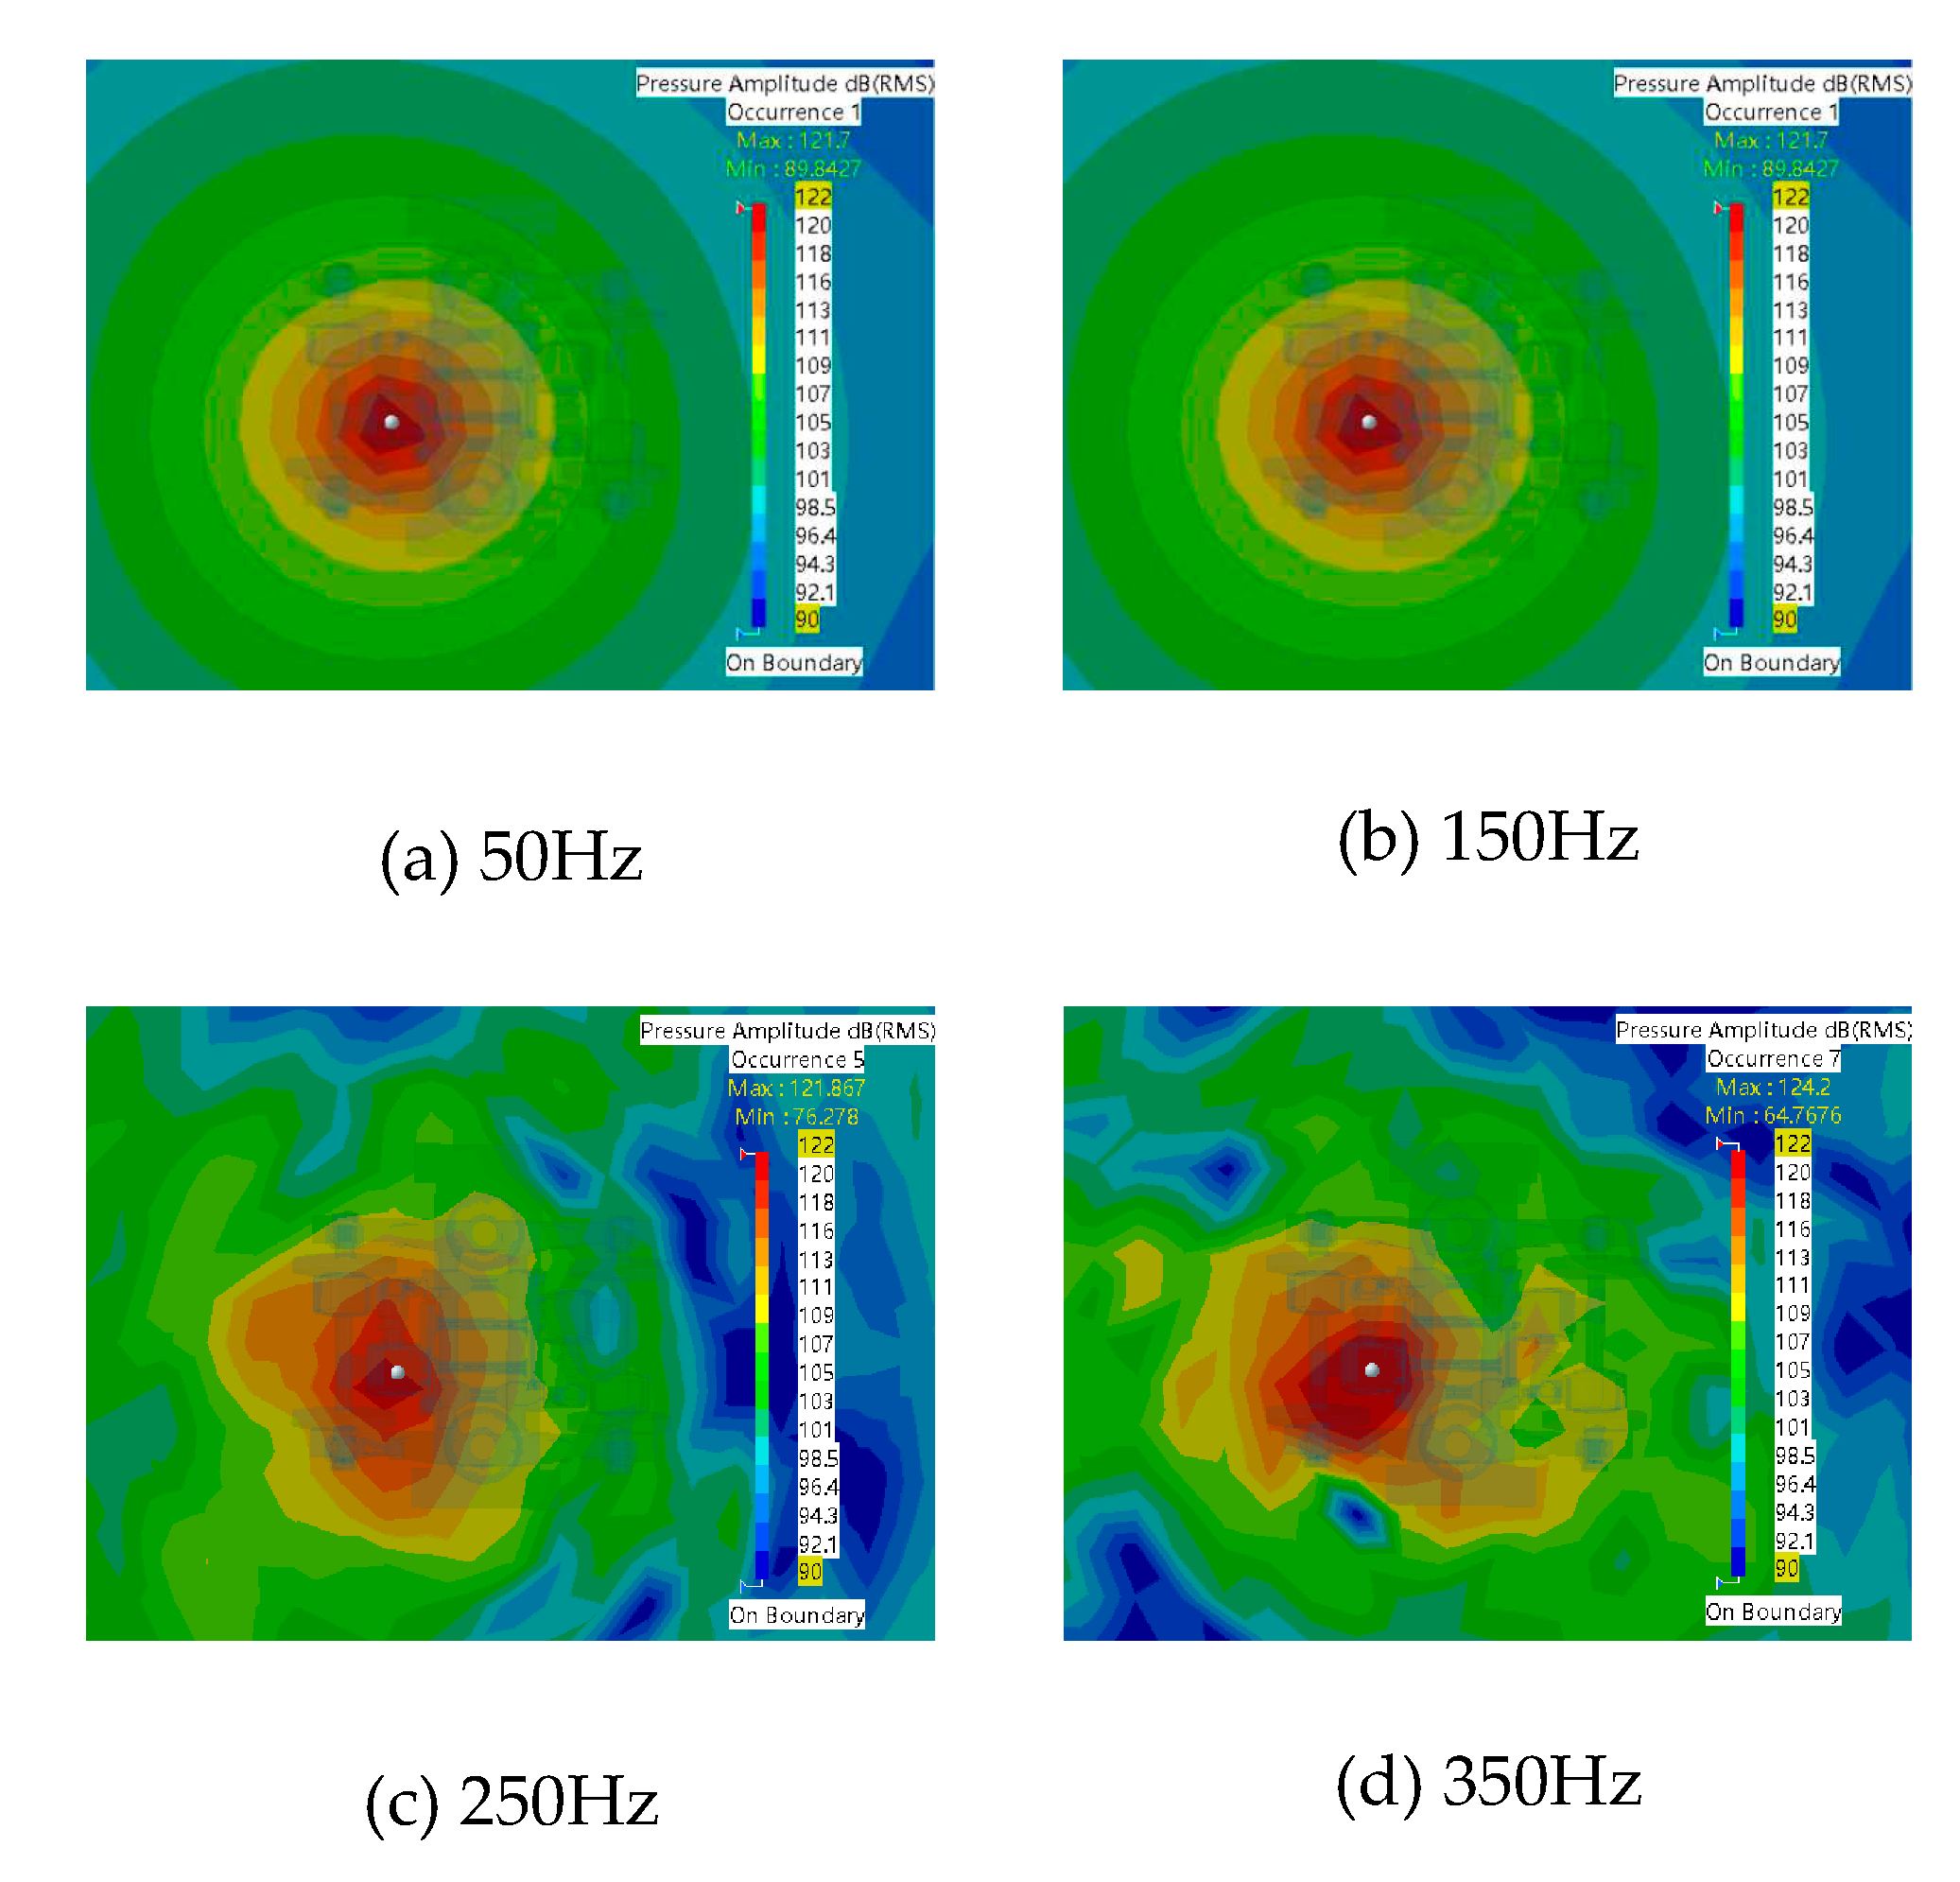
The sound field distribution in the bogie region is depicted in Figure 3.1 for a vehicle speed of 30 km/h. As the frequency increases, the cloud pattern becomes less distinct. At 50 Hz, the sound pressure level predominantly concentrates around the sound source and radiates outward in a circular manner. With increasing frequency, the sound field exhibits greater chaotic behavior. However, overall, the maximum sound pressure level is situated beneath the sound source and shows more lateral variation than vertical within the pressure level cloud. The maximum value of sound pressure level surrounding the bogie rises from 121.7 dB at 50 Hz to 124.2 dB at 350 Hz for a vehicle speed of 30 km/h, resulting in an increase of approximately 2.5 dB. Conversely, there is a continuous decrease in minimum values for sound pressure levels with an overall reduction of about 15 dB.
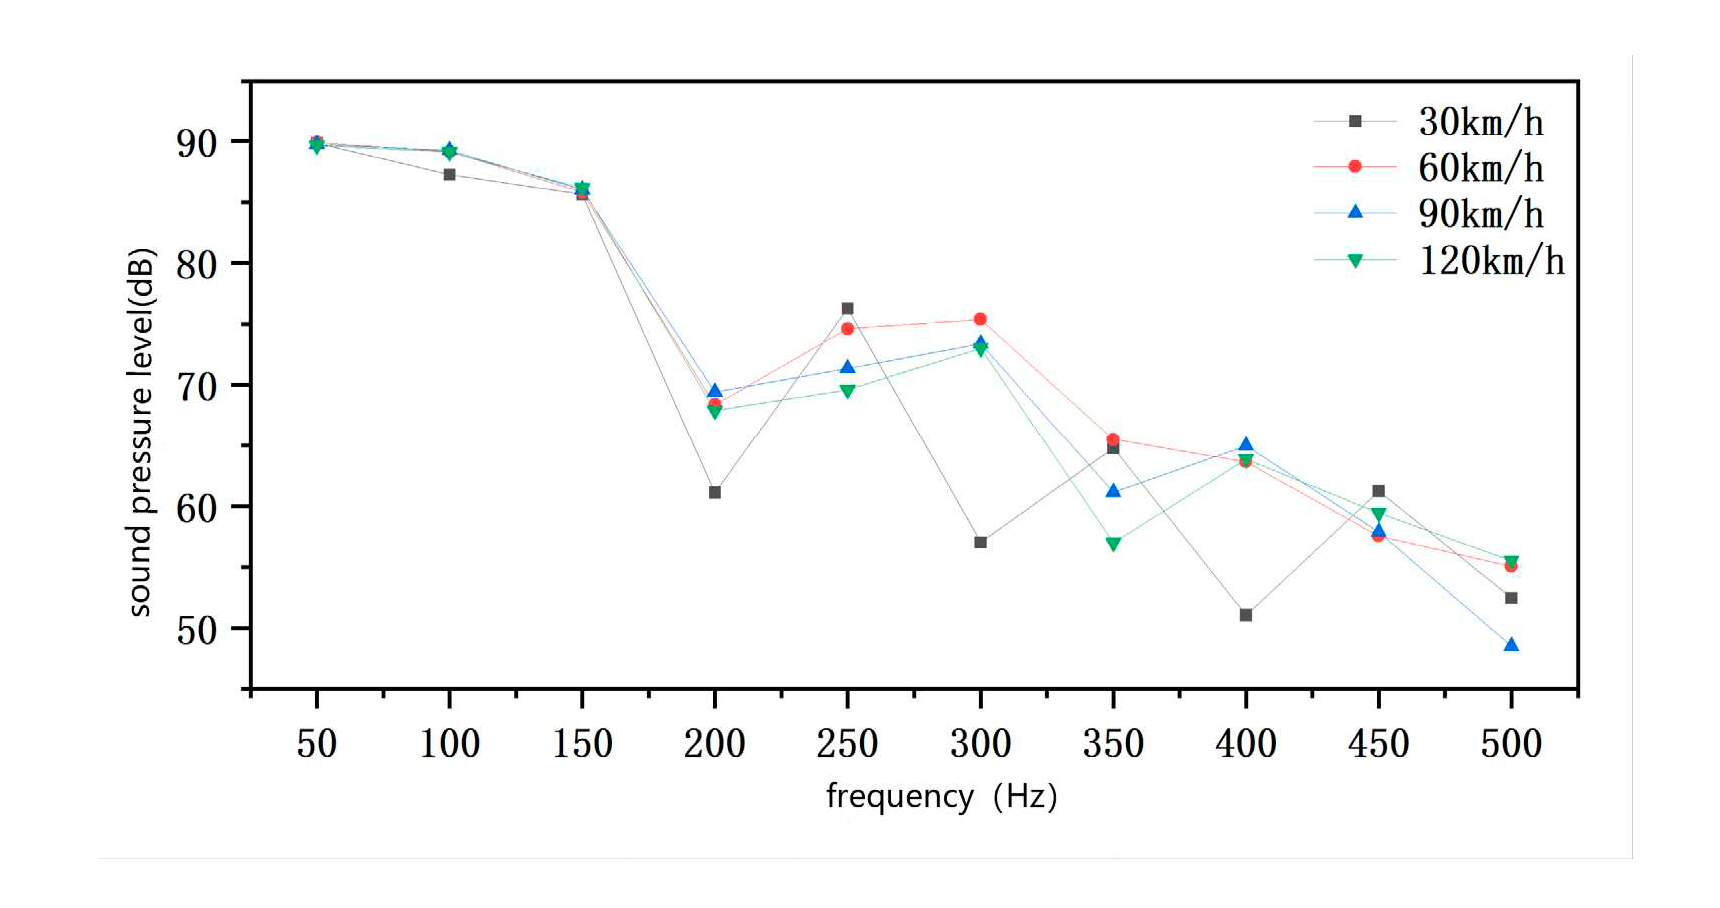
To better observe the effect of vehicle speed on the bogie sound field distribution, the corresponding sound pressure level at each vehicle speed is plotted as a line graph in Figure 3.2. It can be observed from the graph that as the vehicle speed increases from 30km/h to 120km/h, the effect on the maximum value of the sound pressure level is not evident. However, the effect on the minimum value of the sound pressure level is more apparent, especially at frequencies above 150Hz.
At a speed of 30km/h, the minimum value of sound pressure level reduces from 89.8dB to 64.8dB, resulting in a reduction of 25dB. At a speed of 60km/h, the minimum value of sound pressure level decreases from 89.9dB to 65.5dB, resulting in a reduction of 24.4dB. At a speed of 90km/h, the minimum value of sound pressure level decreases from 89.8dB to 61.1dB, resulting in a reduction of 28.7dB. At a speed of 120km/h, the minimum value of sound pressure level decreases from 89.6dB to 57dB, resulting in a reduction of 32.6dB. The higher the speed, the more significant the reduction in the minimum value of sound pressure level.
Overall, the effect of vehicle speed on the change in the sound pressure level magnitude becomes more pronounced after 150Hz.

3.1.2. Cloud distribution of bogie gearboxes

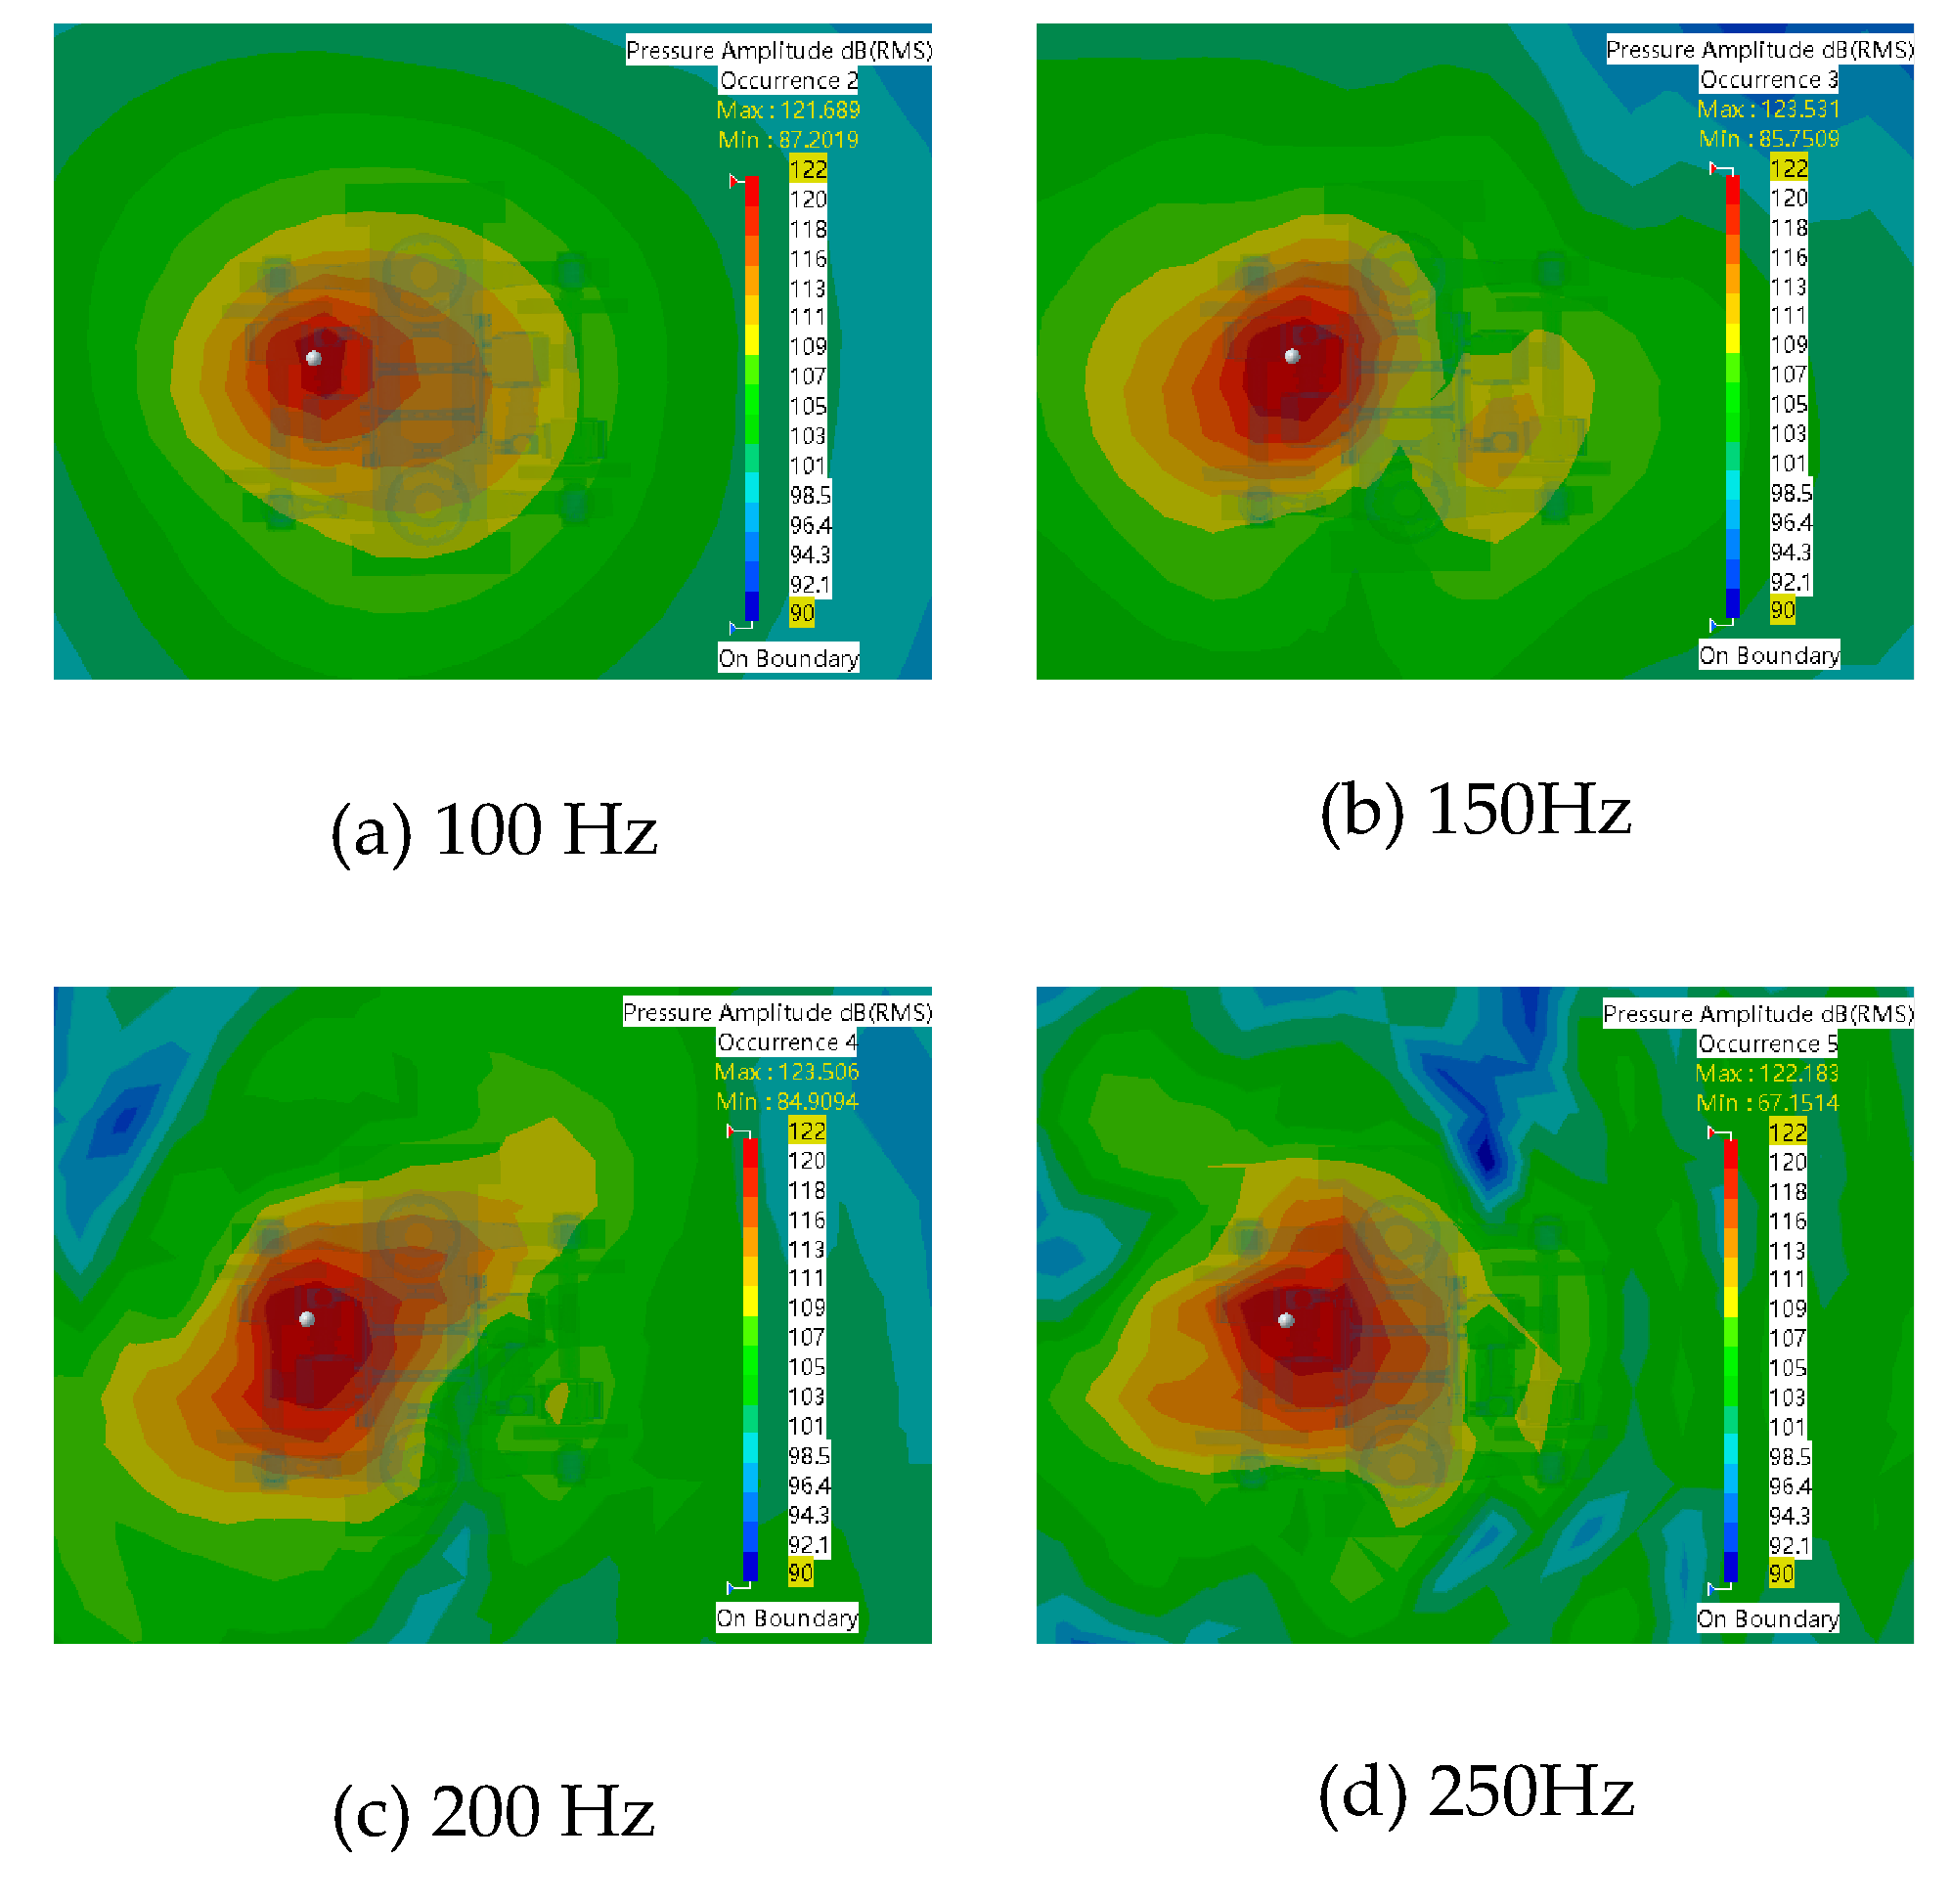
At a vehicle speed of 30km/h, Figure 3.3 illustrates the sound field distribution in the bogie area. The distribution of the cloud map around the bogie increased with frequency, and the change pattern becomes less noticeable. When the frequency was 100Hz, the cloud pattern spreads outward in a circle with the sound source as the center. Generally, the sound pressure level around the source was the largest, and the lateral variation was significantly greater than the vertical variation.
In terms of numerical values, the minimum value of sound pressure level decreased as the frequency of the source increases, from 87dB to 67dB, resulting in a total decrease of 20dB. Meanwhile, the maximum value of sound pressure level increased and then decreases, yielding an overall increase of 1.5dB.
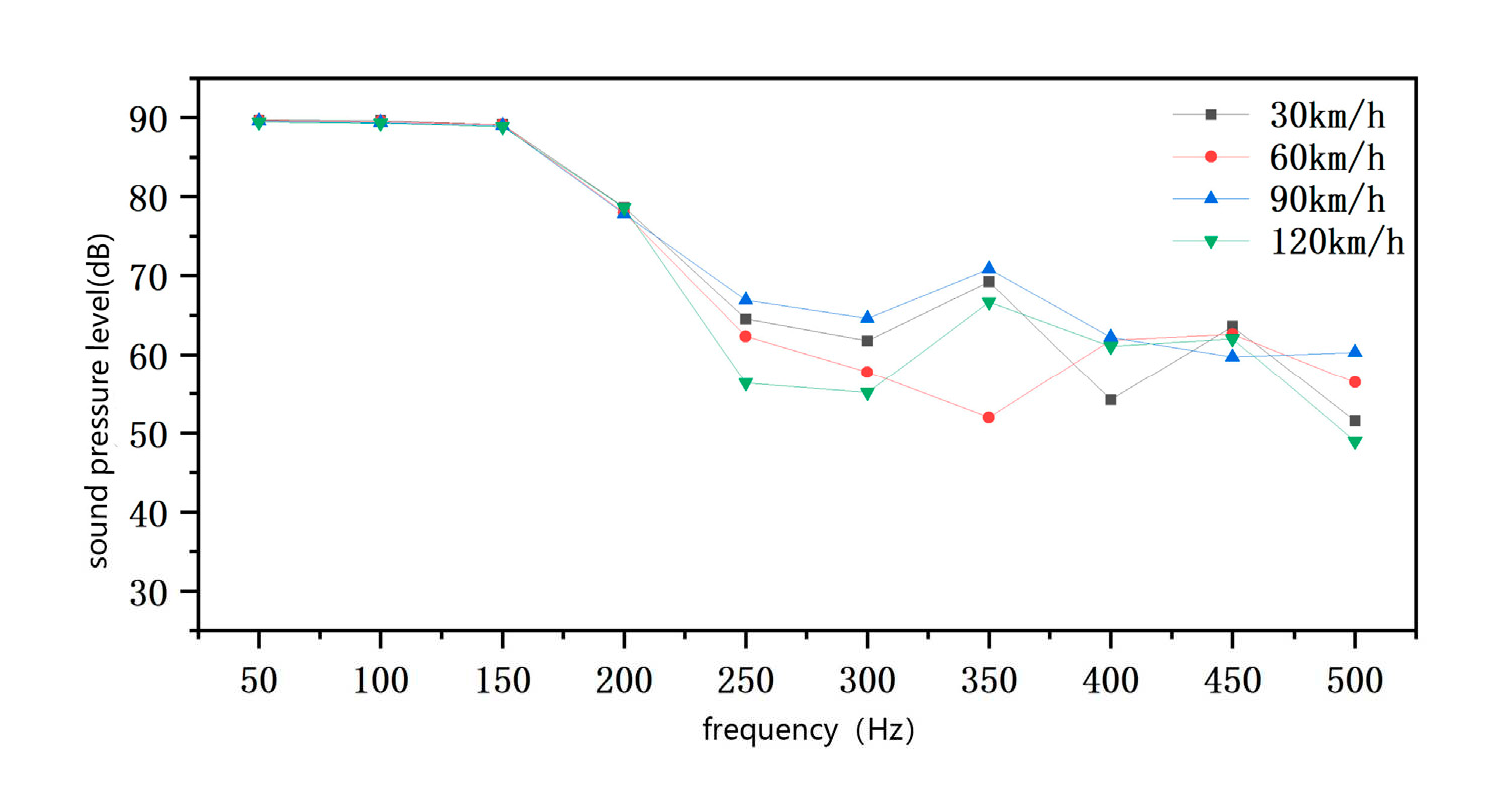
To better observe the effect of vehicle speed on the sound field distribution of the bogie, the corresponding sound pressure level at each vehicle speed is plotted as a line graph in Figure 3.4. It can be observed from the graph that between 50Hz and 200Hz, the minimum value of the sound pressure level increases as the frequency increases. Furthermore, at the same frequency with different speeds, the gradient of the sound pressure level change is roughly the same, with a value of about 1dB. This indicates that when the sound source is located at the gearbox, the speed of the vehicle has less influence on 50Hz-200Hz, but only affects the size of the sound pressure level.
Above 200Hz, the gradient of the sound pressure level change increases significantly, with the maximum gradient being 32dB at 500Hz.

3.1.3. Distribution of bogie axle box clouds

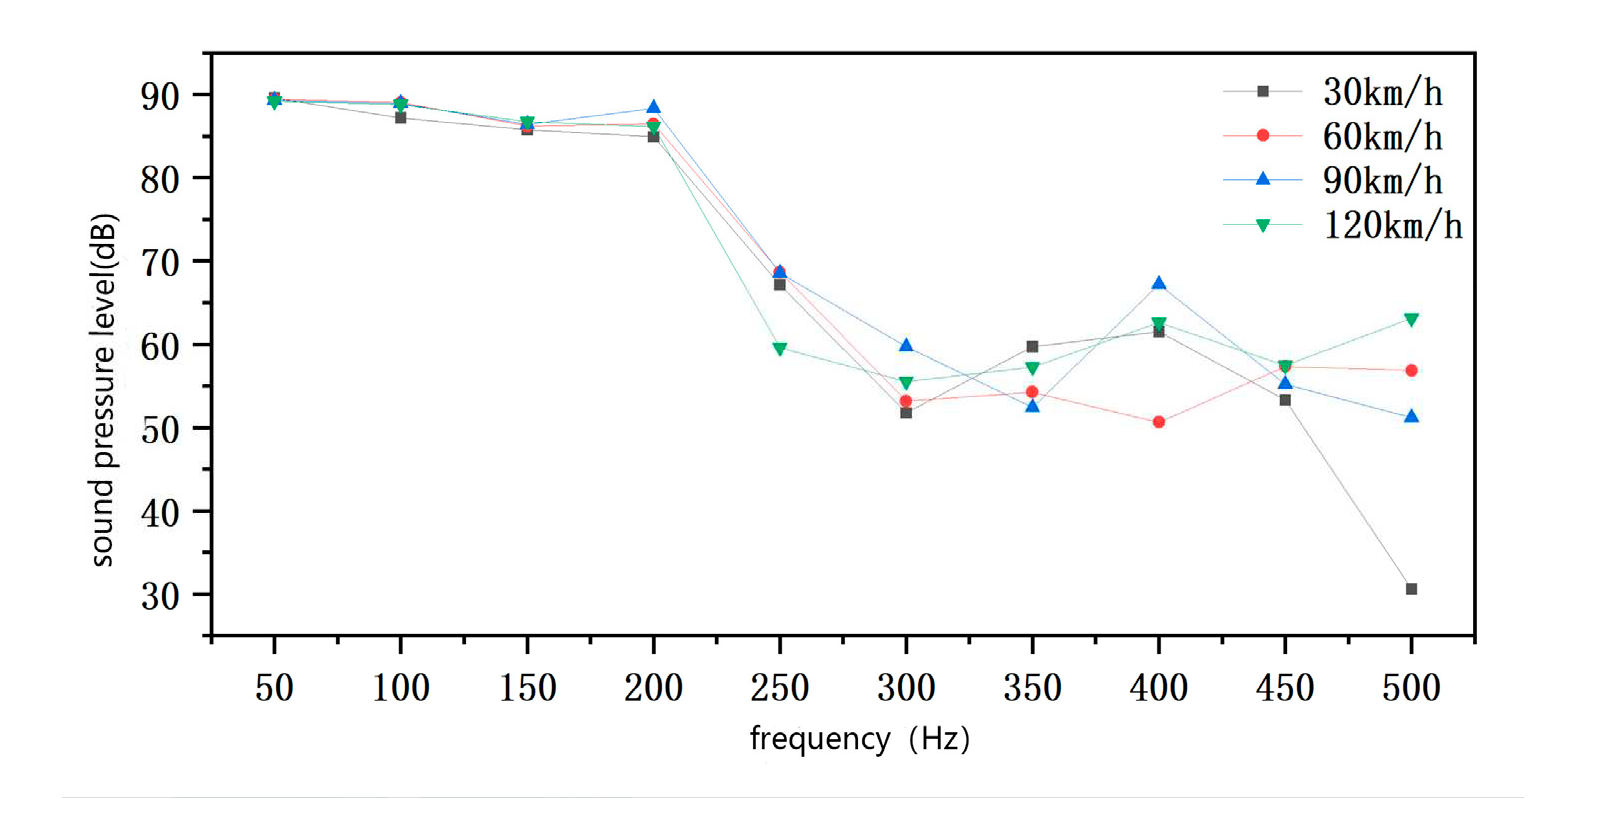
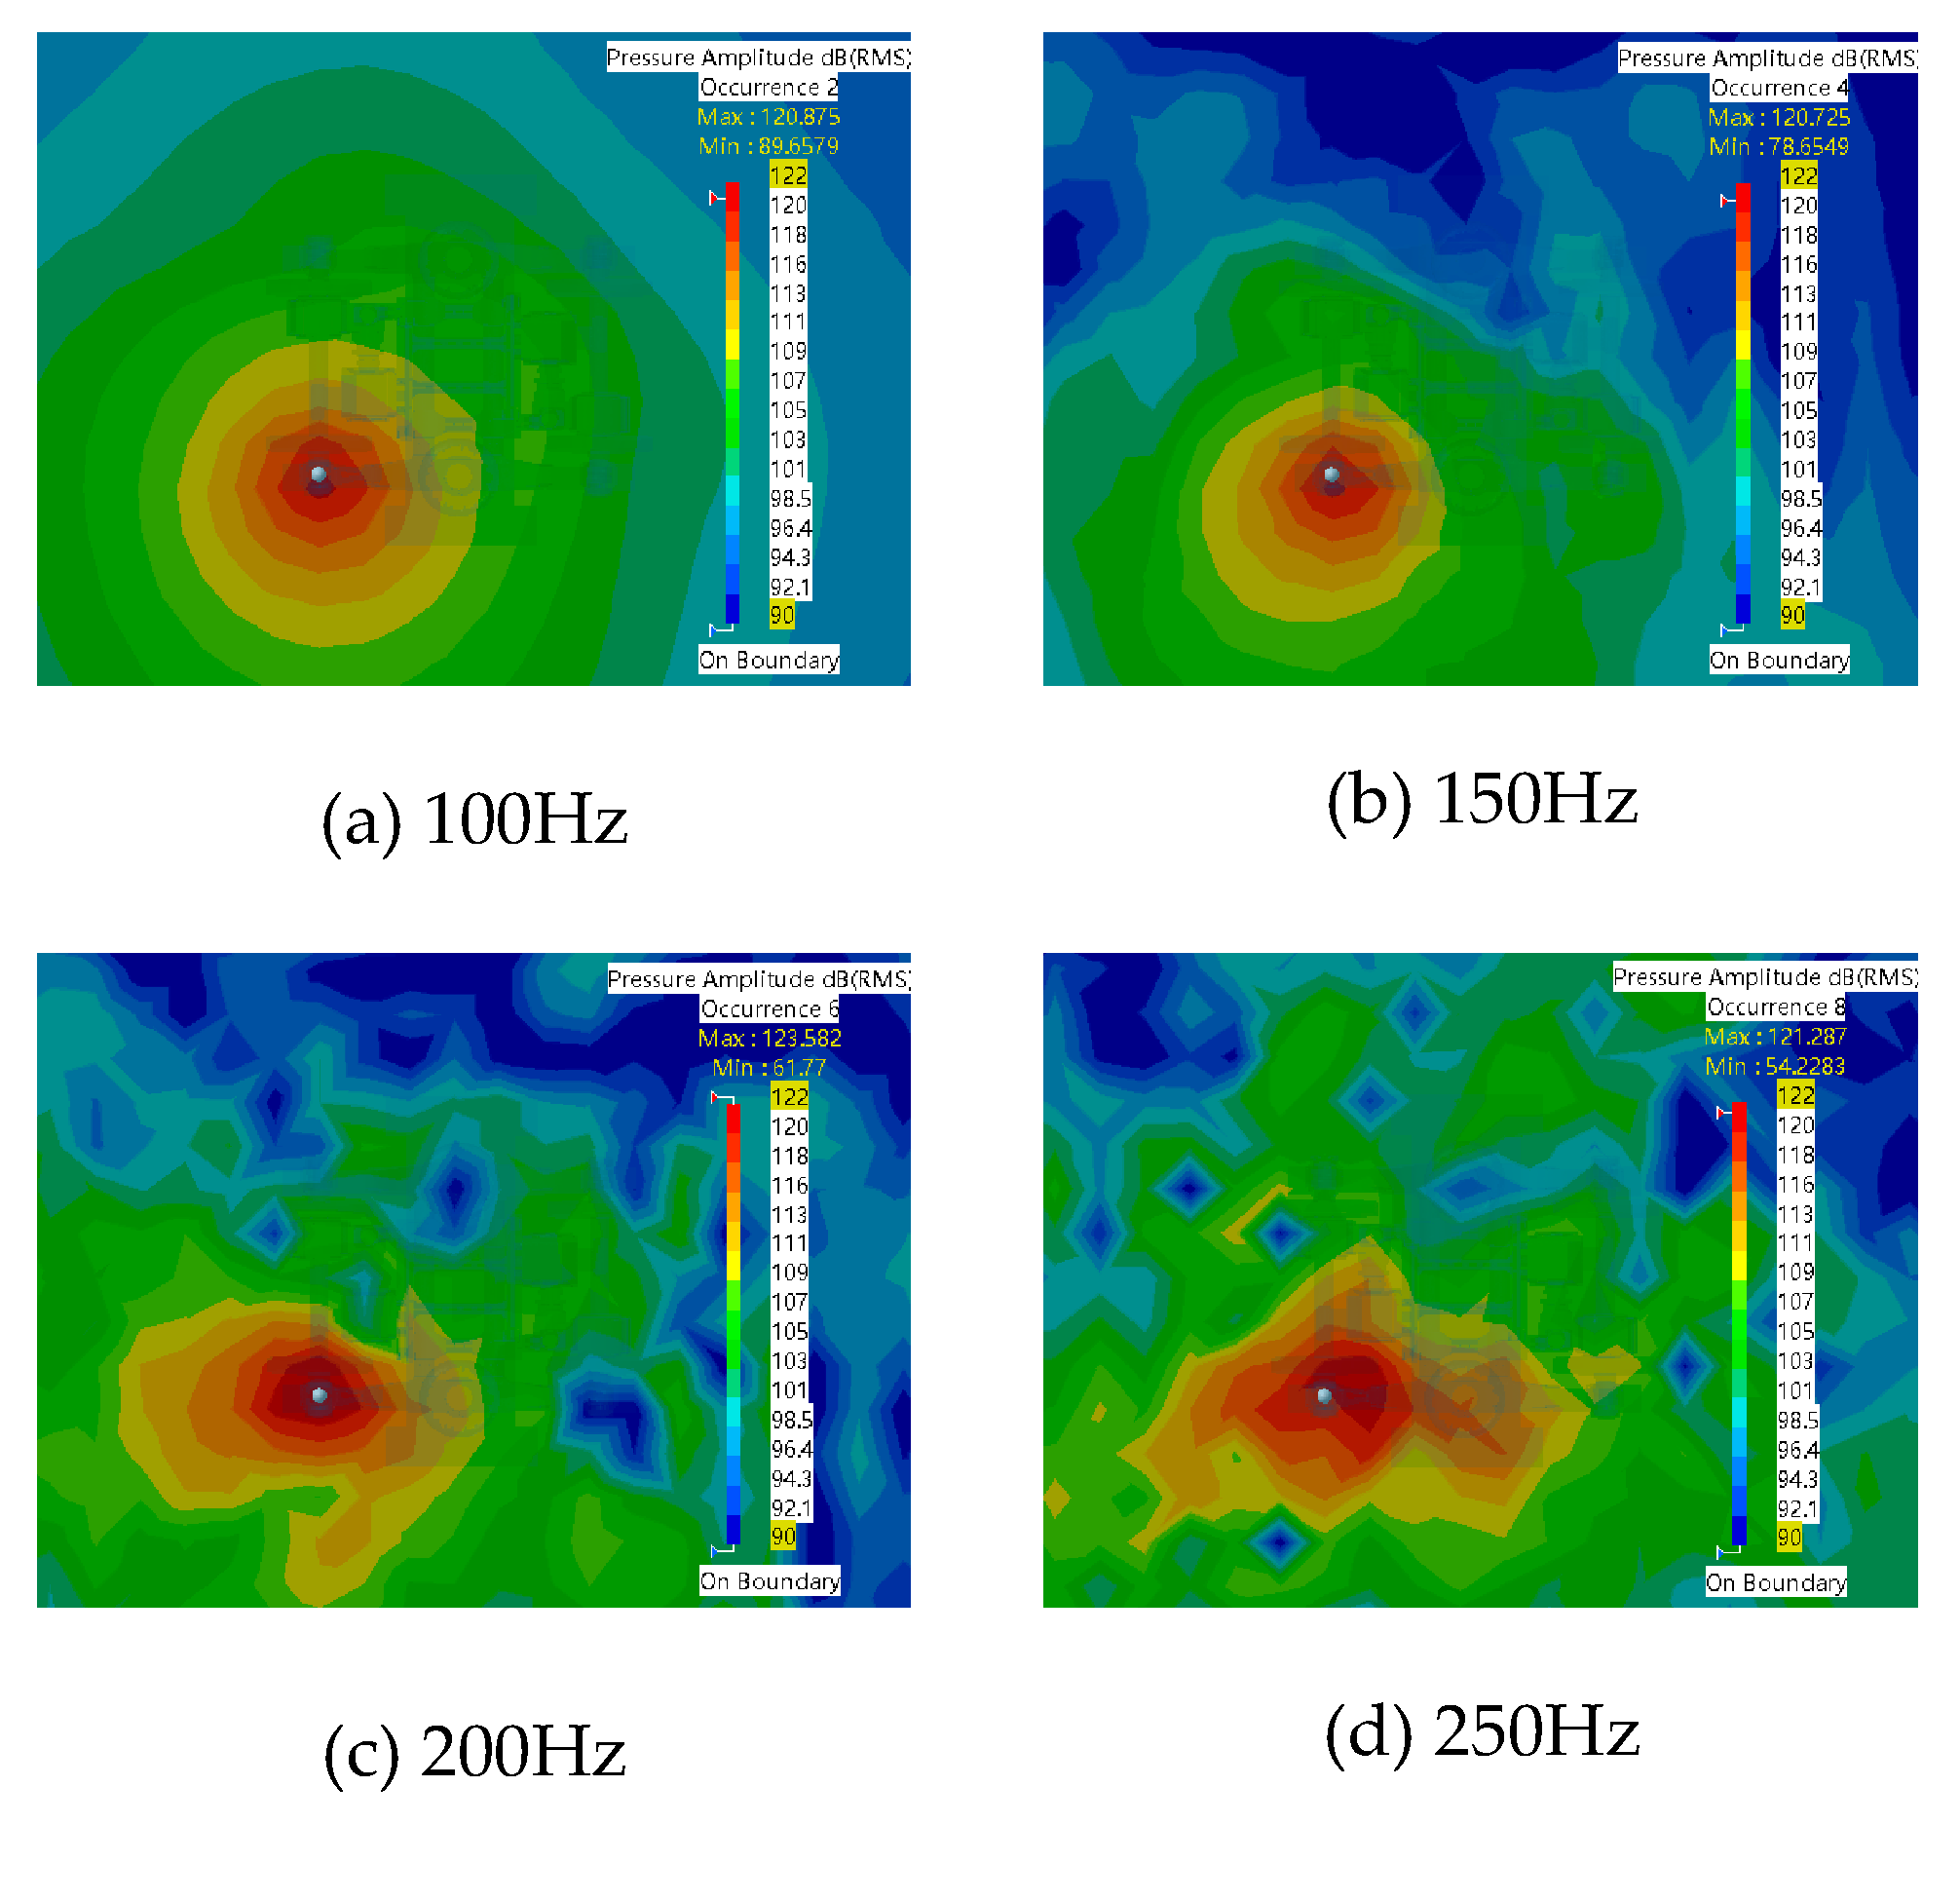
At a speed of 30km/h, Figure 3.5 illustrates the sound field distribution in the bogie area. The sound pressure level distribution at a frequency of 100Hz was mainly spread outwards in a circle with the sound source as the center. As the frequency increases, the longitudinal variation of the cloud distribution became significantly greater than the lateral variation.
In terms of numerical values, at a speed of 30km/h, the maximum value of the sound pressure level around the bogie increased with increasing frequency, from 120.9dB at 100Hz to 122.1dB at 250Hz, resulting in an increase of 1.2dB. Meanwhile, the minimum value of the sound pressure level continuously decreased, from 89.7dB to 64.5dB, representing a total decrease of approximately 25.2dB.
In order to observe more intuitively the influence of vehicle speed on the sound field distribution of the bogie, the corresponding sound pressure level magnitude at each speed is plotted as a line graph, as shown in Figure 3.6. From the graph, it can be concluded that when the sound source frequency is between 50Hz and 200Hz, the gradient of the minimum value of the sound pressure level changes almost equally with the increase of the vehicle speed, and the change is not significant. Therefore, it can be inferred that the flow field generated by the vehicle speed exerts little influence on the sound field distribution around the bogie in this frequency range.
However, after 200Hz, the values start to change significantly, especially when the frequency reaches 350Hz, the gradient of the minimum value of the sound pressure level reaches a maximum of 19dB.
By comparing the distribution of the sound pressure level cloud diagrams for the sound source located in the motor, gearbox and axle box, it can be concluded that the maximum value of the sound pressure value for all three is located below the sound source, and the lateral change of the cloud diagram is significantly larger than the longitudinal change, which may be due to the introduction of the flow field, which leads to the change of the propagation of the sound wave in the direction of the flow field. When the frequency magnitude is the same, changing the vehicle speed, the frequency bands mainly affected by the motor and the axle box are after 200 Hz and the motor after 150 Hz. In addition, the sound pressure level at the axle box is significantly lower than that at the motor and gearbox.

3.2. Effect of sound source intensity on sound field distribution

In the previous section, we had compared the pattern of sound pressure level changes around the bogie by altering the sound source frequency and vehicle speed. In this section, our focus was on ensuring consistent sound source frequency while observing the sound pressure level distribution pattern around the bogie by varying the sound source vibration intensity.

3.2.1. Distribution of bogie motor clouds

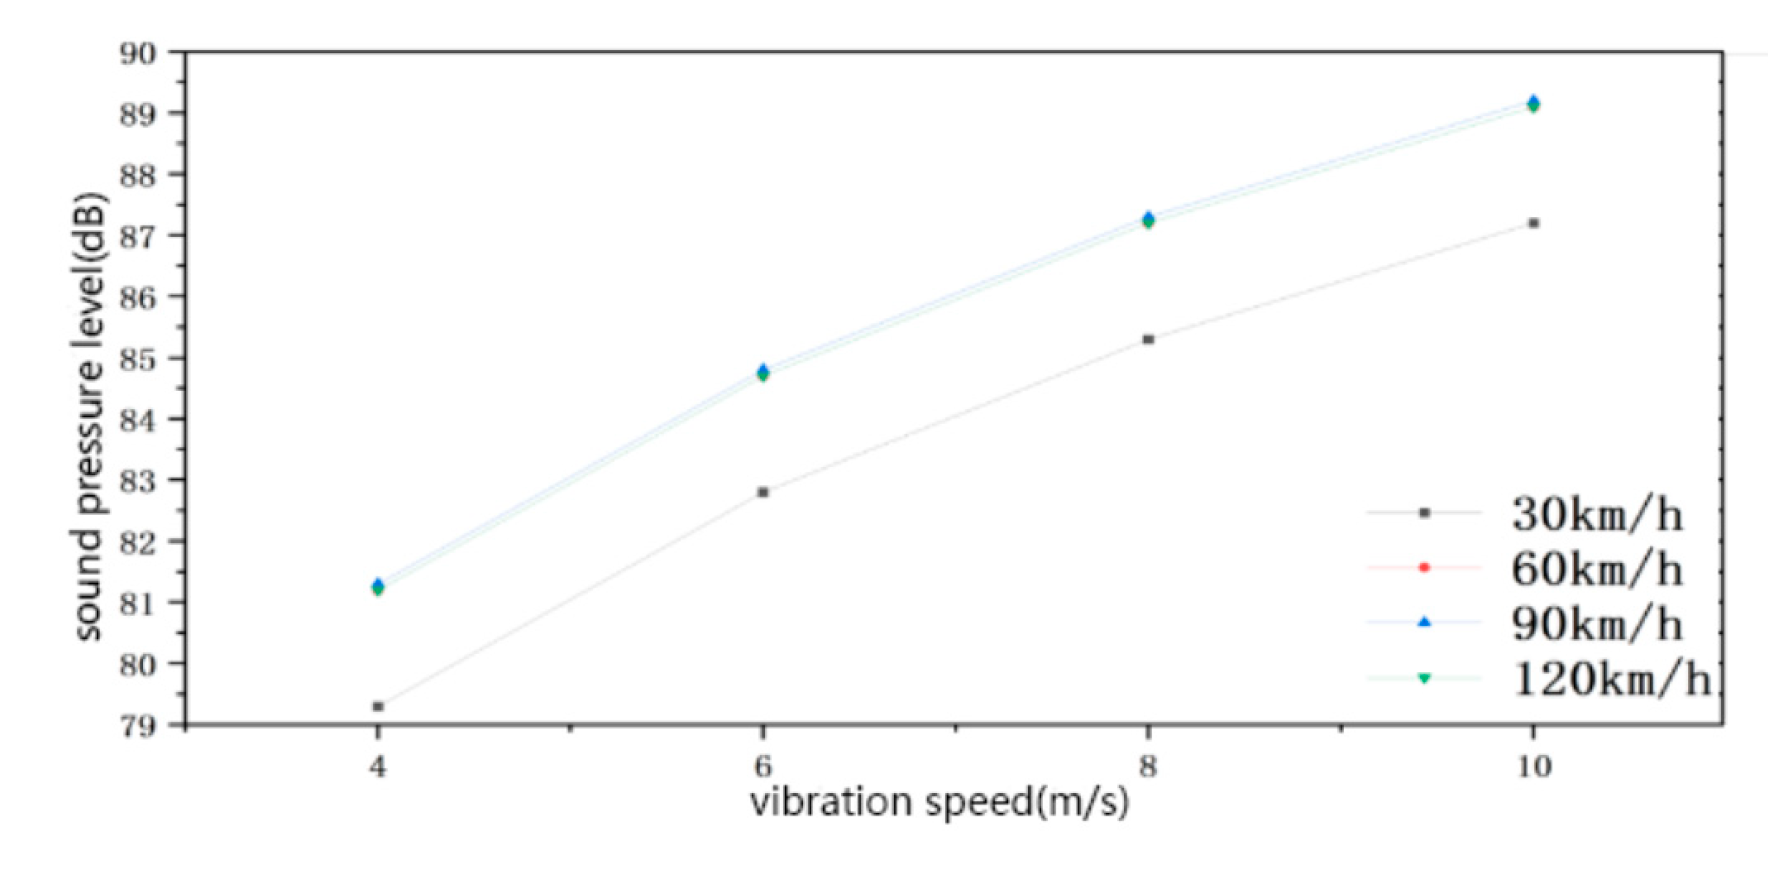
Figure 3.7 presents the sound field distribution in the bogie area when the vehicle speed is 30km/h. As the intensity of the sound source vibration increased, the sound pressure level also increased. The maximum value of sound pressure level increased from 113.6dB to 121.5dB, with a total increase of 7.9dB. Similarly, the minimum value of sound pressure level also increased from 79.3dB to 87.2dB, with a total increase of 7.9dB. Hence, by varying the source vibration speed, the effect on the sound pressure level was the same for both the maximum and minimum values.
To provide a better comparative analysis, a line graph illustrating the change in sound pressure level is drawn and presented in Figure 3.8. When the speed of the vehicle remains constant, the maximum and minimum values of the sound pressure level increase with the increase of the vibration intensity of the sound source. Moreover, the gradient of the change of the maximum and minimum values is identical, at 8dB. Therefore, it can be concluded that the change of vibration intensity only has an effect on the size of the sound pressure level, and the maximum and minimum values of the sound pressure level are affected to the same degree.When the vibration intensity of the source is the same and the speed of the vehicle is increasing, the gradient of change in sound pressure level is also the same, with a small change in the maximum value and a gradient of change in the minimum value of about 2dB. Therefore, it can be concluded that when the vibration intensity is the same, the speed of the vehicle on the change in sound pressure level is only the size of the change, and the impact on the minimum value is significantly greater than the impact on the maximum value.

3.2.2. Cloud distribution of bogie gearboxes

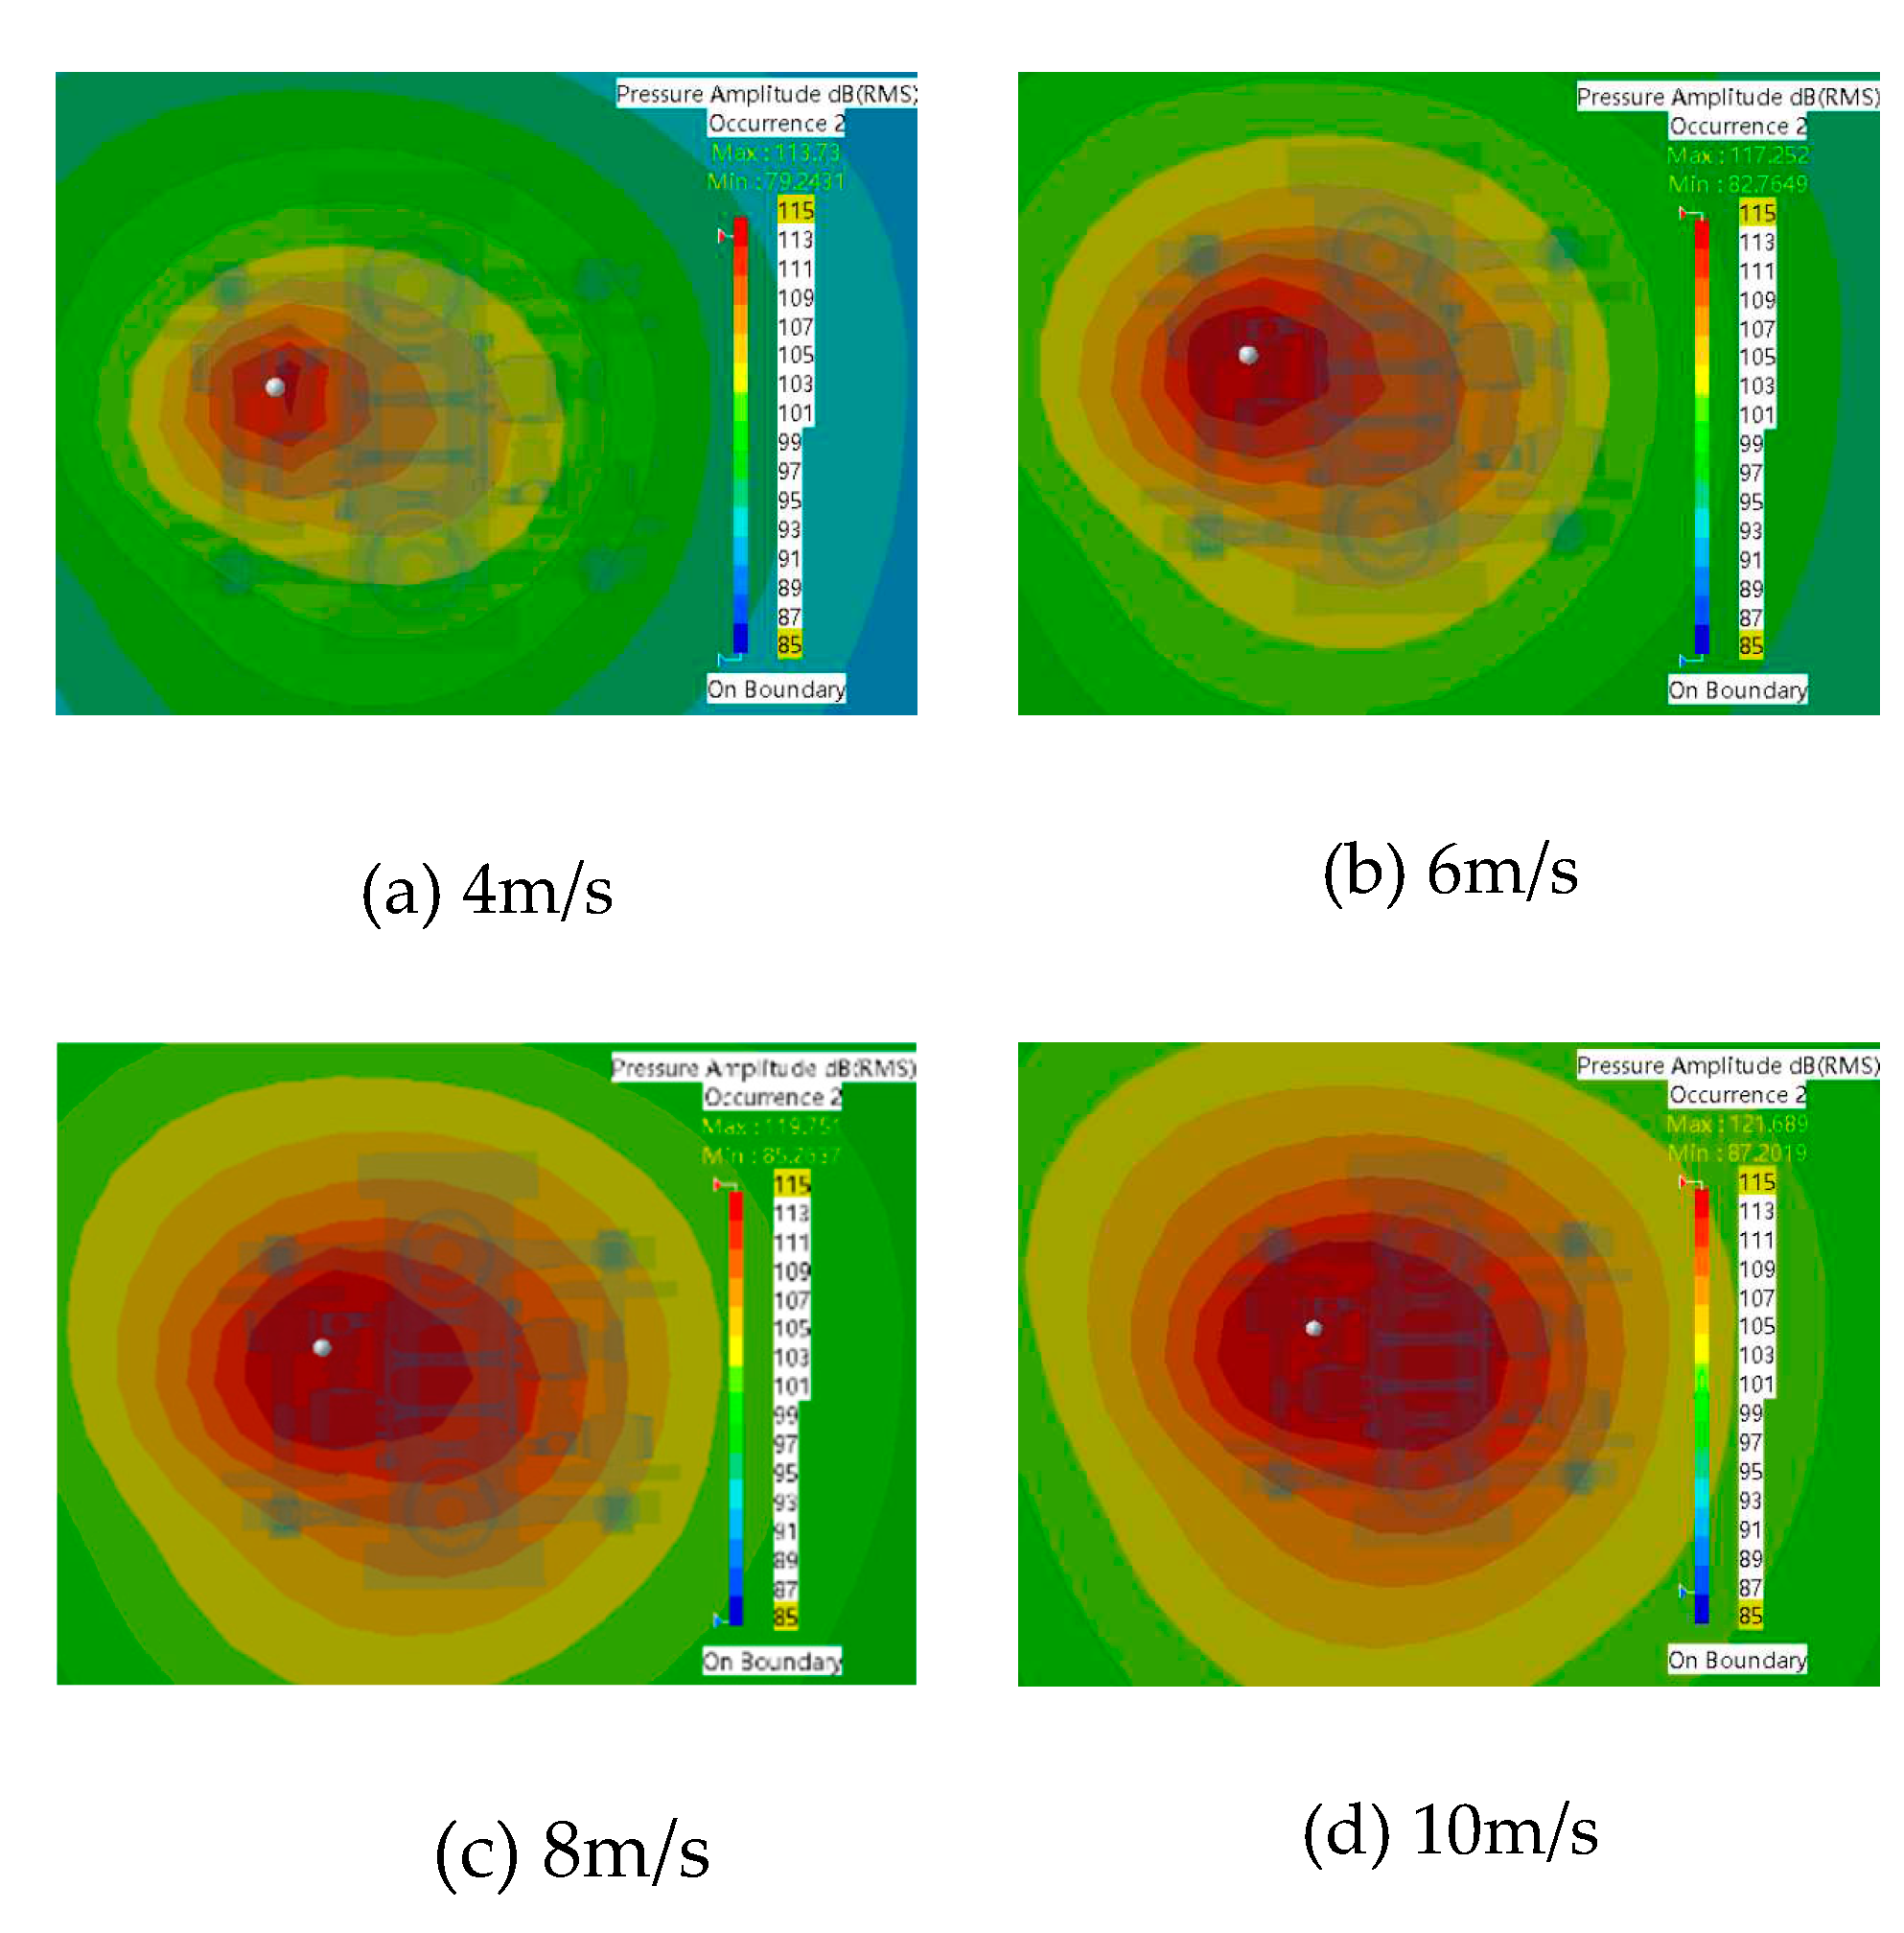
Figure 3.9 shows the sound field distribution in the bogie area at a speed of 30km/h. It is evident from the sound pressure level distribution cloud diagram that the sound pressure level increased with the increase in sound source vibration intensity. The maximum value increased from 113.7dB to 121.7dB, with a total increase of 8dB, while the minimum value increased from 79.2dB to 87.2dB, also with a total increase of 8dB. Moreover, the distribution pattern of the sound pressure level cloud map is basically the same, centered on the sound source at the gear box, spreading outward in a circle, with the maximum value located at the lowest part of the sound source.
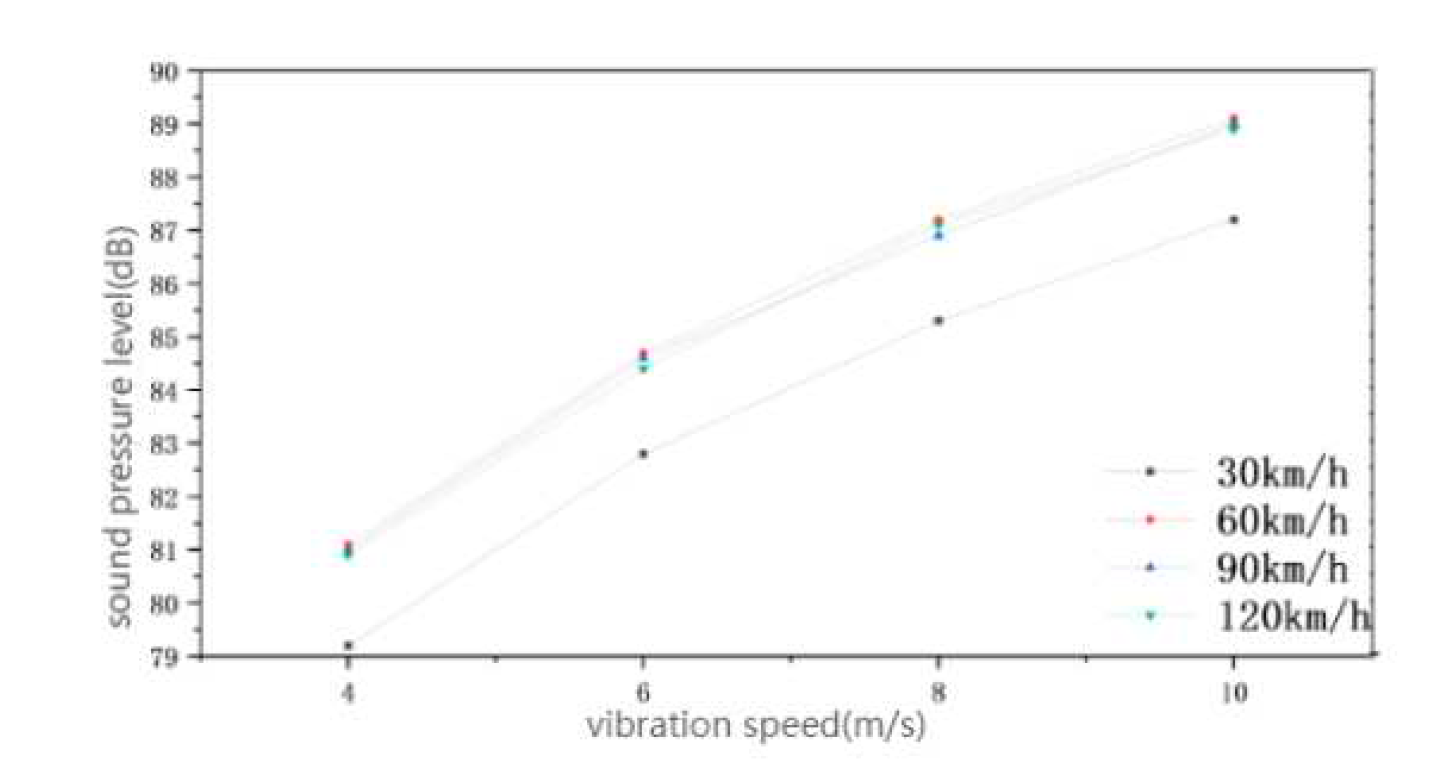
In summary, for better comparative and analysis the sound pressure level change the line graph is drawn, as shown in Figure 3.10. When the speed of the vehicle is the same, the maximum and minimum values of the sound pressure level will increase with the increase of the vibration intensity of the sound source, and the gradient of the change of the maximum and minimum values is also the same, both are 8dB, so the change of the vibration intensity only has an impact on the size of the sound pressure level, and the degree of impact on the maximum and minimum values of the sound pressure level is basically the same. When the vibration intensity of the source is the same and the speed of the vehicle is increasing, the gradient of change in sound pressure level is also the same, with the maximum value remaining almost constant and the minimum value changing by about 1.9dB. Therefore, it can be concluded that when the intensity of vibration is the same, the speed of the vehicle on the change in sound pressure level is only a change in size, and the effect on the minimum value is significantly greater than the effect on the maximum value.

3.2.3. Distribution of bogie axlebox clouds

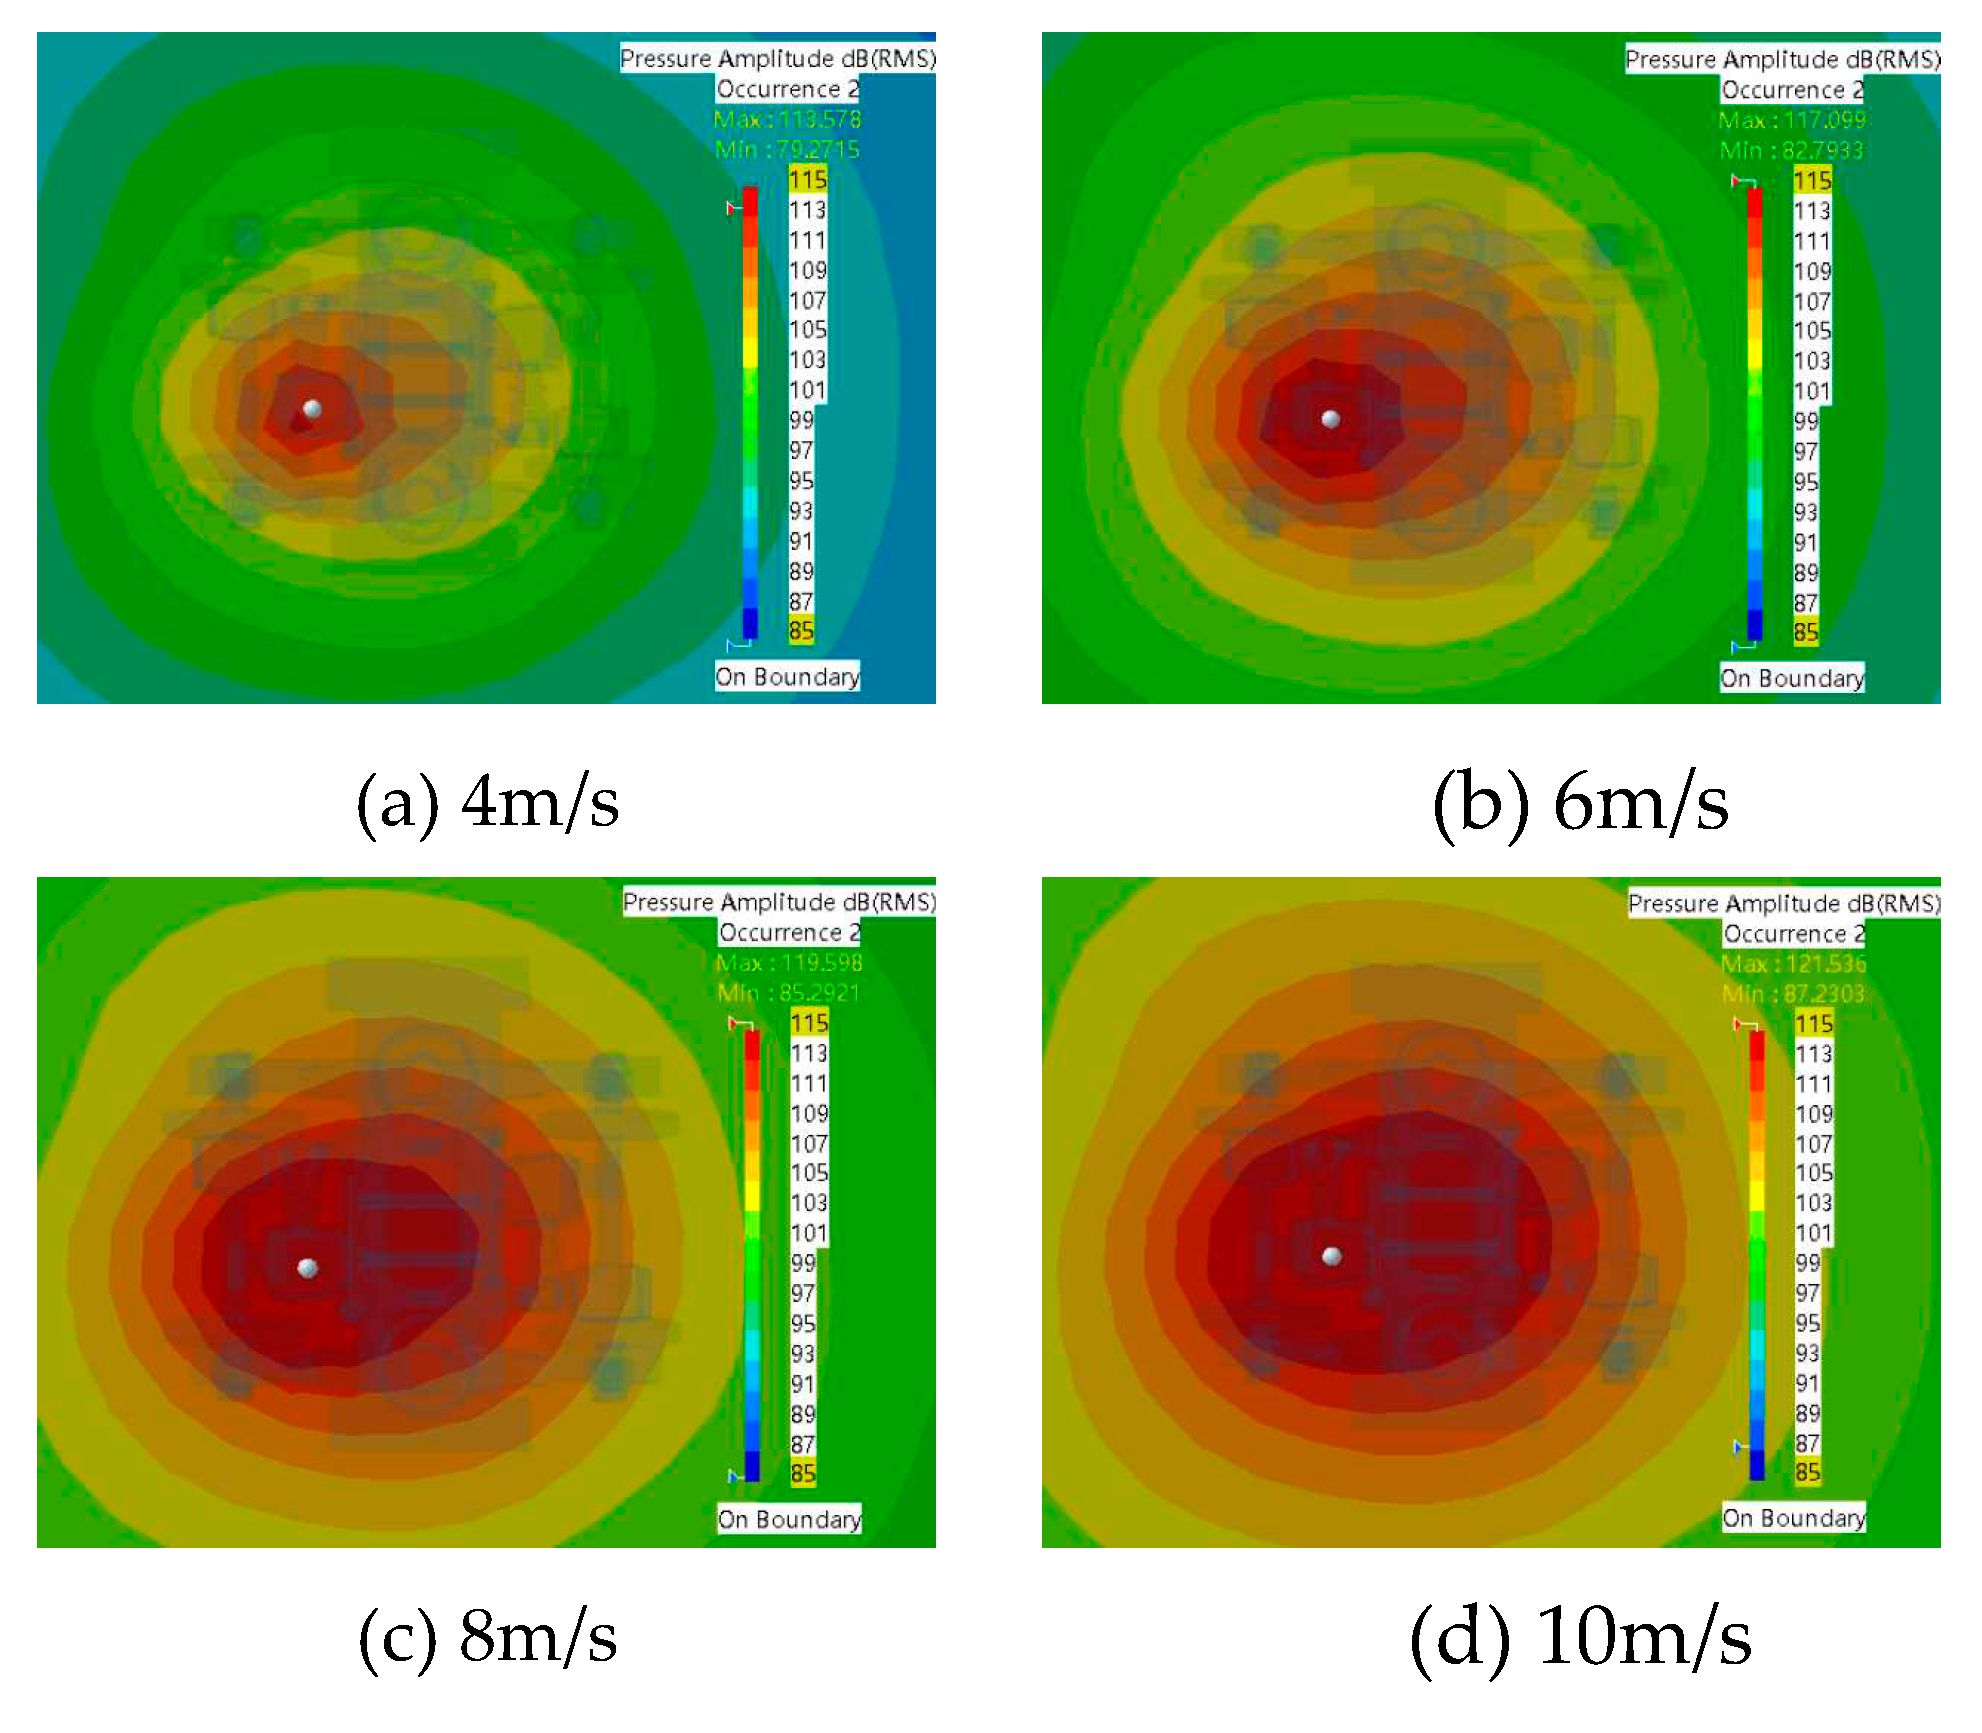
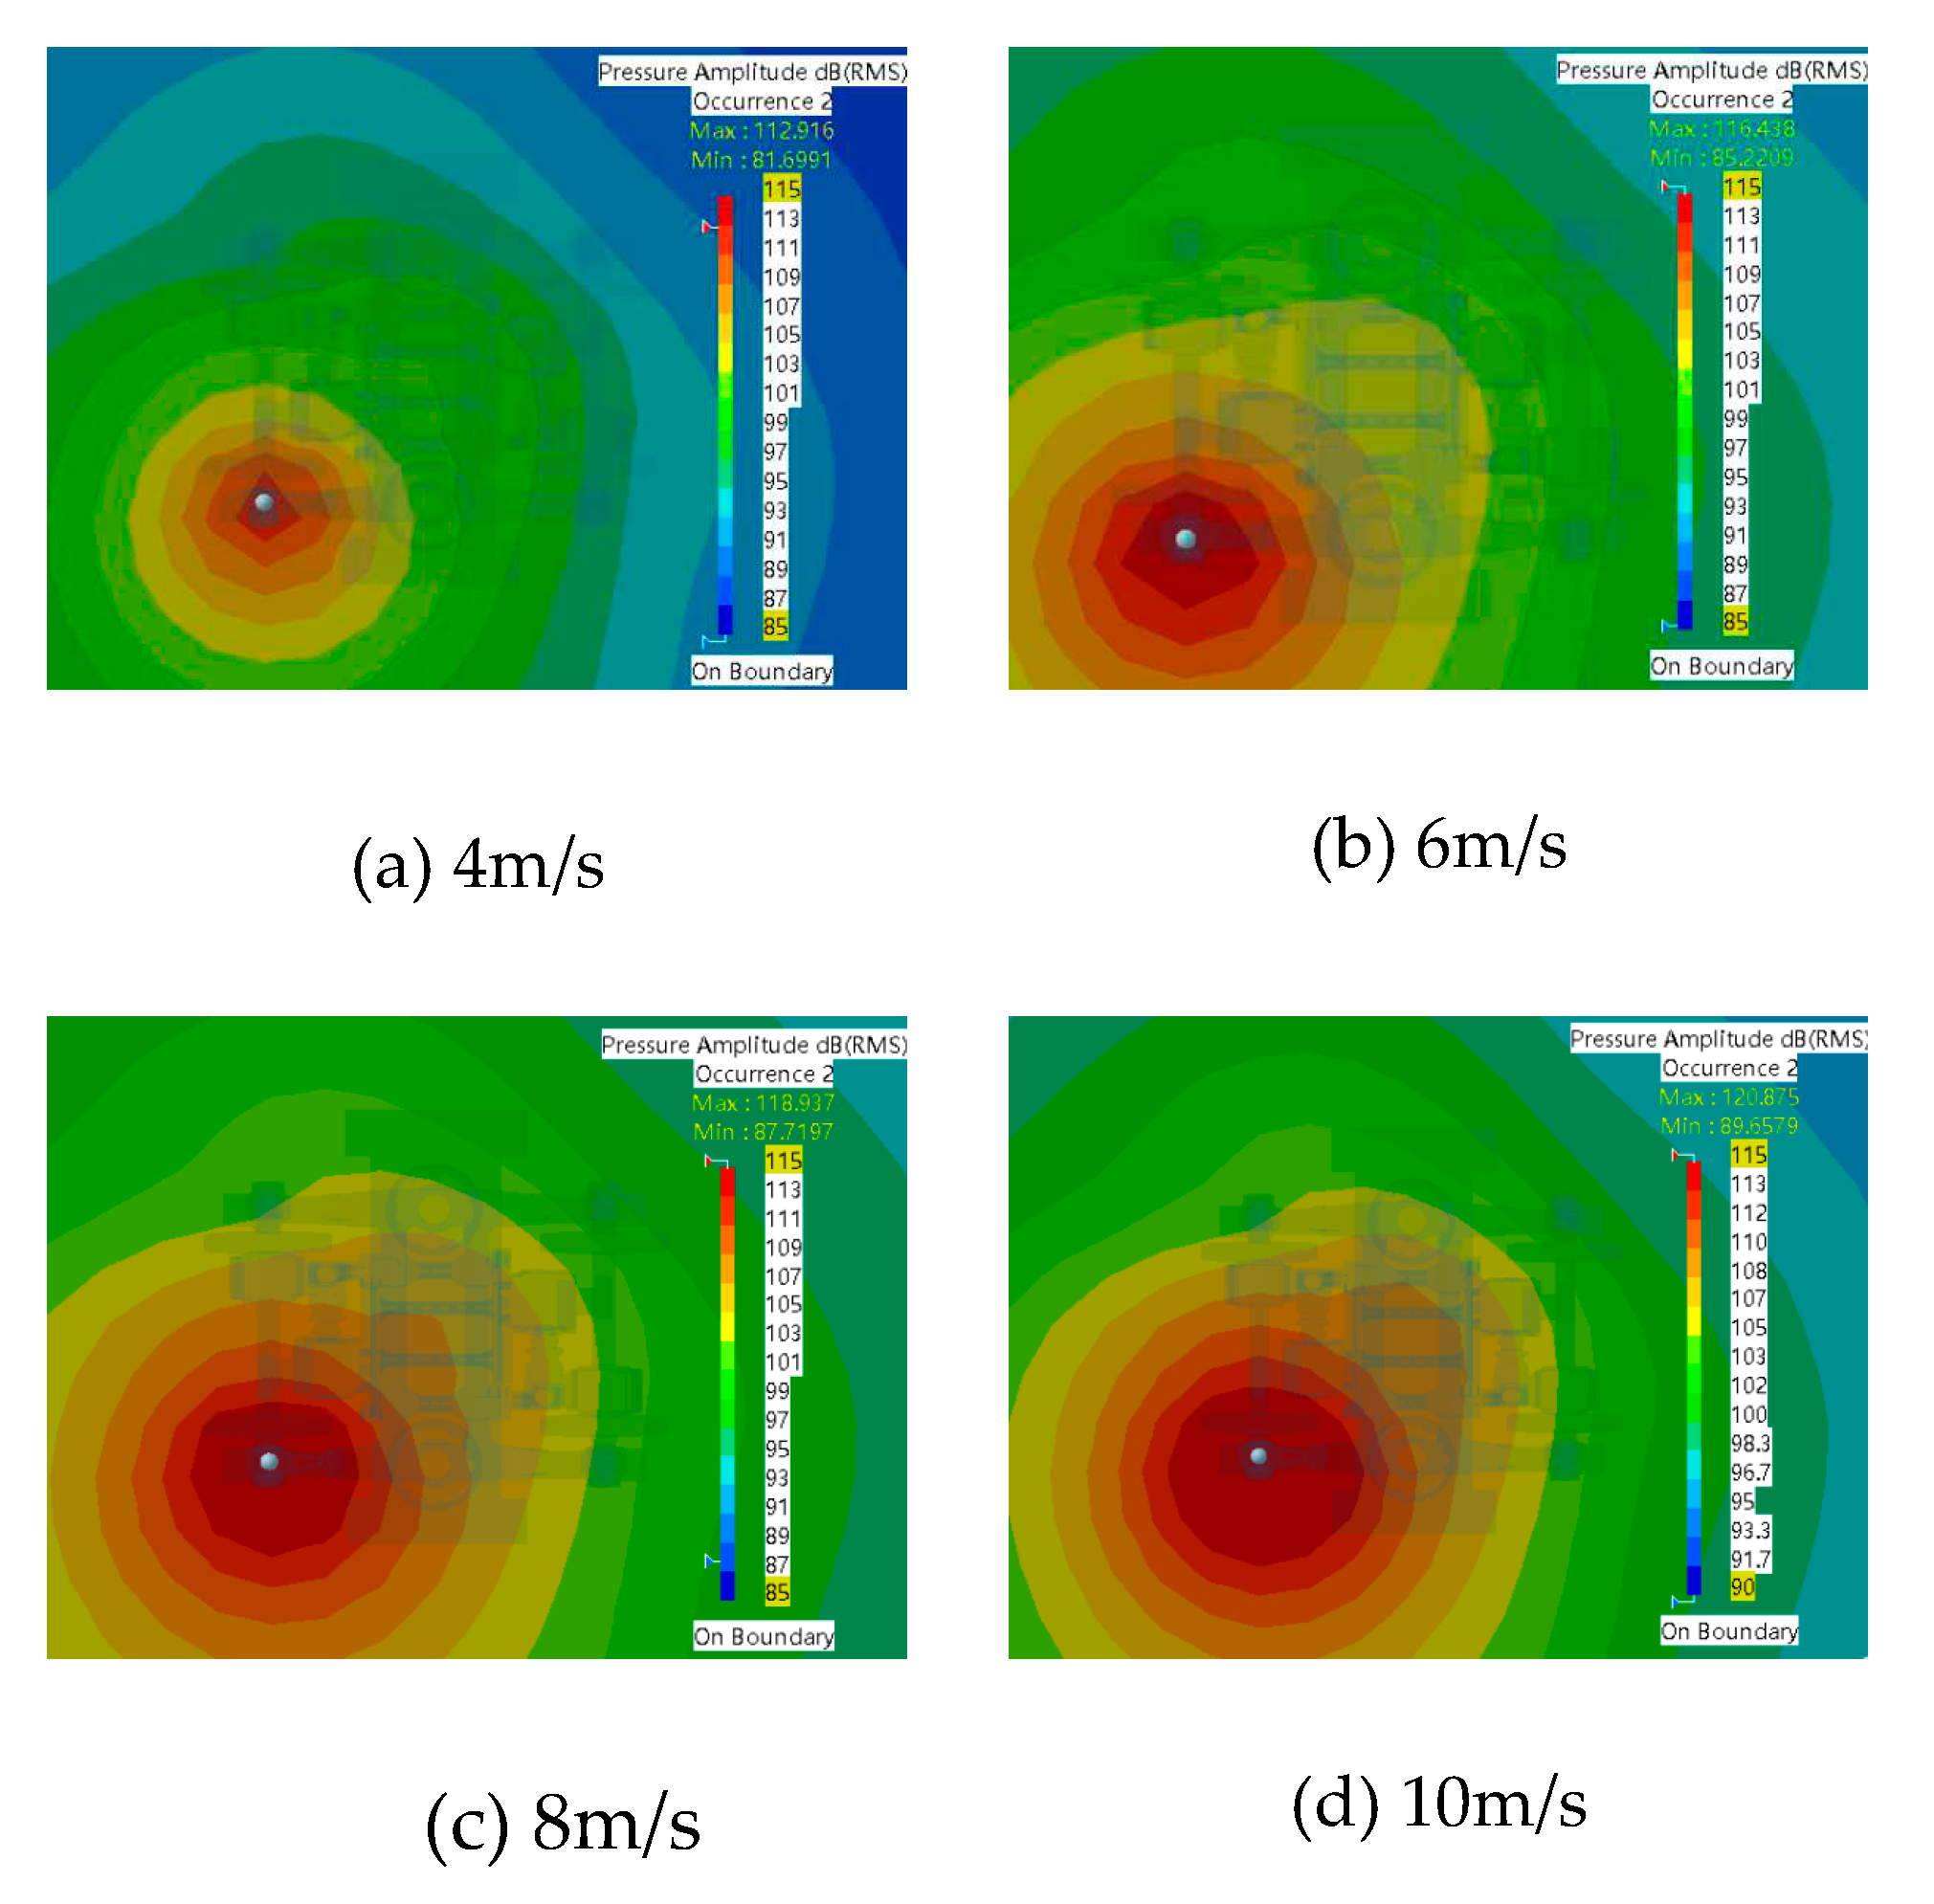
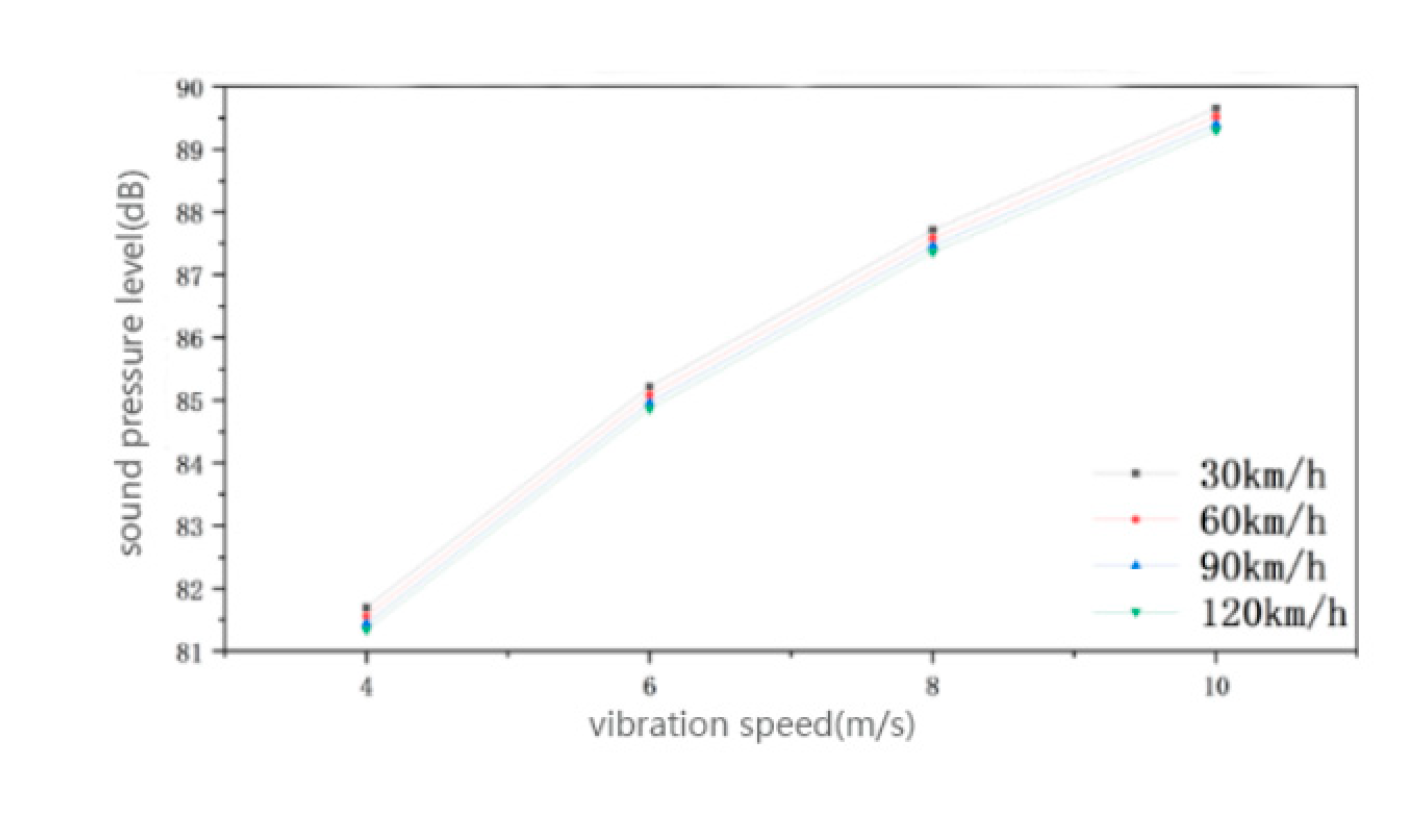
Based on Figure 3.11, it can be observed that the sound pressure level at the bogie axle box increases as the sound source intensity increases at a speed of 30km/h. When the sound source vibration speed was 4m/s, the sound pressure level ranged between 81.7dB-112.91dB. Meanwhile, when the sound source vibration speed was 6m/s, the sound pressure level ranged between 85.22dB-116.44dB. Further, when the sound source vibration speed was 8m/s, the sound pressure level ranged between 87.72dB-118.94dB, and finally, when the sound source vibration speed was 10m/s, the sound pressure ranged between 89.66dB-128.88dB. It could be deduced that with increasing sound source intensity, the sound pressure level in the bogie area also increases. Nonetheless, the distribution of the sound pressure cloud remains consistent, and the maximum value of the sound source is located below the sound source.
Given the data presented, a line graph illustrating the change in sound pressure level is drawn, and it is presented as Figure 3.12 for better comparative analysis. When the speed of the vehicle is the same, the maximum and minimum values of the sound pressure level will increase with the increase of the vibration intensity of the sound source, and the gradient of the change of the maximum and minimum values is also the same, both are 8dB, so the change of the vibration intensity only has an impact on the size of the sound pressure level, and the degree of impact on the maximum and minimum values of the sound pressure level is basically the same. When the vibration intensity of the source is the same and the speed of the vehicle is increasing, the gradient of the change in sound pressure level is also the same, and the change in both the maximum and minimum values of sound pressure level is not too insignificant, with the minimum value of sound pressure level increasing by 0.4dB and the maximum value of sound pressure level increasing by 0.2dB. The effect is not significant.Therefore, it can be concluded that when the vibration intensity is the same, the change of vehicle speed on the sound pressure level is only a change in magnitude, and the effect on both the minimum and maximum values of the sound pressure level is not significant.

4. Conclusions

The effect of vehicle speed on the distribution of the bogie sound field: when changing the vehicle speed, it wa found that the main influence on the axle box and gearbox was in the frequency band after 200Hz, and for the motor after 150Hz. Also the speed of the vehicle had the greatest effect on the motor, followed by the gearbox and finally the axle box. And comparing to the other two factors, vehicle speed had the least effect on the bogie sound field distribution.
(2) When there was a change in the vibration frequency of the sound source, the minimum value of the sound pressure level decreased as the frequency increases. Additionally, the gradient of the sound pressure level changed in the motor, gearbox, and axle box was more significant than when there was a change in the speed and intensity of the sound source vibration. Therefore, under the influence of the flow field, the vibration frequency had a greater impact on the sound field distribution of the bogie.
(3) When the vibration intensity of the sound source was varied, the gradient of the maximum and minimum valued of sound pressure level changed in the motor, gearbox, and axle box were almost the same. Therefore, the effect of vibration intensity on the change of sound pressure level was similar at these three locations. However, the impact on the size of the sound pressure level differed.

Author Contributions

Conceptualization, X.Z; methodology, X.Z.; software, X.J.; validation, X.J. and L.L.; formal analysis, X.J. and L.L; Writing - Original Draft, X.J. and H.W.; Writing - Review and Editing, L.L. and H.W.; All authors rigorously reviewed the submitted manuscript and read and approved its final version for publication.

Funding

The National Science Foundation of China Youth Science Fund Project (62001079). Dalian High-level Talents Innovation Support Program (2021RQ134). Basic Scientific Research Project Fund of the Education Department of Liaoning Province (LJKMZ20220839)

Data Availability Statement

The data presented in this study are available upon request from the corresponding author.

Acknowledgments

Then authors would like to thank the anonymous reviewers and editors for their valuable suggestions to improve the quality of this work

Conflicts of Interest

The authors declare no conflict of interest.

References

  1. Xu,X.; Wang,Y,; Mou, G. Fault Analysis of Key Components of Rail vehicle Bogies. Science & Technology Wind, 2020; 120–121.
  2. Zhang,C. Research on Fault Diagnosis Technology for key components of HX locomotive. Beijing: China Academy of Railway Sciences, 2021.
  3. ZHOU,Mingyu. ;JIN,Jian.;SHI,Pengpeng.;LI,Dongfang,ZHANG Jun.Intelligent Detection System of Metro Vehicle Axle Box Bearing Fault. Urban Rail Transit Research 2023, 26, 223–227. [Google Scholar]
  4. Alsalaet Jaafar, K. ; Hajnayeb Ali.; Bahedh Adulbaseer S. Bearing fault diagnosis using normalized diagnostic feature-gram and convolutional neural network. Measurement Science and Technology, 2023; 34(4). [Google Scholar]
  5. Piltan Farzin.; Kim JongMyon. Bearing Fault Diagnosis Using a Hybrid Fuzzy V-Structure Fault Estimator Scheme. Sensors, 2023; 23(2).
  6. Li Zhaojin. NUMERICAL SIMULATION OF AERODYNAMIC NOISE OF HIGH-SPEED TRAIN IN THE EXTERIOR FLOW FIELD. Shanghai: Shanghai University of Engineering and Technology, 2016.
  7. Ke Hao. ;Xu Xin. Release of Academician Ta-You Ma's Theoretical Foundations of Modern Acoustics. ACTS ACUSTICA 2004, 287. [Google Scholar]
  8. Lighthill M., J. On sound generated aerodynamically: Part I: general theory. Proceeding of the Royal Society of London(Series A) 1952, 211, 564–587. [Google Scholar]
  9. Lighthill M., J. On sound generated aerodynamically: Part II:turbulence as a source of sound. Proceeding of the Royal Society of London(Series A) 1954, 222, 1–32. [Google Scholar]
  10. Curle, N. The influence of solid boundaries upon aerodynamically sound. Proceeding of the Royal Society of London(Series A). 1955, 231, 506–514. [Google Scholar]
  11. Powell. Theory of vortex sound. The Journal of Acoustic Society of America. 1964, 32, 982–990. [Google Scholar]
  12. Hu Binfei. Numerical simulation study on aerodynamic noise of commercial vehicles based on external flow field and internal sound field. Guilin: Guilin University of Electronic Science and Technology, 2020.
  13. Wang Chunxu. ;WU Chongjian.; CHEN Lejia. A comprehensive review on the mechanism of flow-induced noise and related prediction methods. Chinese Journal of Ship Research 2016, 11, 57–71. [Google Scholar]
  14. J. E. Ffowcs-Williams.;D.L. Hawkings. Sound generation by turbulence and surface in arbitrary motion. Philosophical Transactions of the Royal Society of London. 1969, 264, 321–342.
  15. Luo Dan. STUDY ON CARBON FIBER COMPOSITE PANTOGRAPH SHROUD OF HIGH-SPEED TRAINS BASED ON REDUCING NOISE. Chengdu: Southwest Jiaotong University, 2014.
  16. Goldstein, M.V. Unified approach to aerodynamic sound generation in the presence of boundaries. The Journal of Acoustic Society of America 1974, 56, 497–509. [Google Scholar] [CrossRef]
  17. Shi Yan. ; Shu Gequn.; Bi Fengrong. Study on Simulation Method for Sound Quality Evaluation of Vehicle Exhaust Noise. Noise and Vibration Control 2011, 31, 62–65. [Google Scholar]
  18. Chen Zhizhong. ; Ji Zhenlin.;Ma Qingzhen. Transmission loss calculation and performance analysis of perfo-rated-tube mufflers with non-uniform flow. Technical Acoustics 2022, 41, 705–710. [Google Scholar]
  19. Hou Qinzhong. Simulation and Optimization of Vehicle Muffler Based on Computational Fluid Dynamics. Jinan: Shandong Institute of Transportation, 2022.
  20. Yan,Tang. ; Li-Ming Zhao.;Yin-Yin Sun. Study on the Influence of Internal Flow Field of Resistance Muffler on Transmission Loss. Machinery Design & Manufacture 2022, 372, 143–147. [Google Scholar]
  21. Chu,Z. ;Kuang F.; Kang R. Effects of airflow on the acoustic attenuation performance of reactive muffler. Journal of Vibroengineering 2016, 18, 637–648. [Google Scholar]
  22. Soenarko. ; Seybert. Visualization of Wave Propagation in Muffler. Journal of visualization 2000, 3, 229–235. [Google Scholar] [CrossRef]
  23. Li,Wei. Design and Research of Exhaust Muffler for Single-cylinder Diesel Engine Based on the Principle of Split-Stream Rushing. Hohhot: Inner Mongolia Agricultural University, 2021.
  24. Yangming, Chen.;Numerical simulation on wake flow of wind turbine on complex terrain based on actuation models. North China Electric Power University(Beijing),China,2021. 2021.
  25. Gong Xiaobin. Temperature field analysis of PMSM based on thermo-fluid-magnetic couplingo. Qingdao: Shandong University of Science and Technology, 2020.
  26. Zhang Yizhao. Analysis and Collaborative Optimization of Aerodynamic Noise and Resistance of Rearview Mirror of a Vehicle. Chongqing,Chongqing University of Technology, 2020.
  27. Wang, TB. The analysis and optimization of Flow Field and Strength Calculation in Turbocharge on CFD and ANSYS. Dalian: Dalian Jiaotong University, 2018.
  28. Huang, Z.; Chi, M.; Feng, Y. Study on the Aerodynamic Change Law of EMU Bogies of Running-across-lines under Cross-wind Effect. Journal of Mechanical Engineering 2019, 56, 219–226. [Google Scholar]
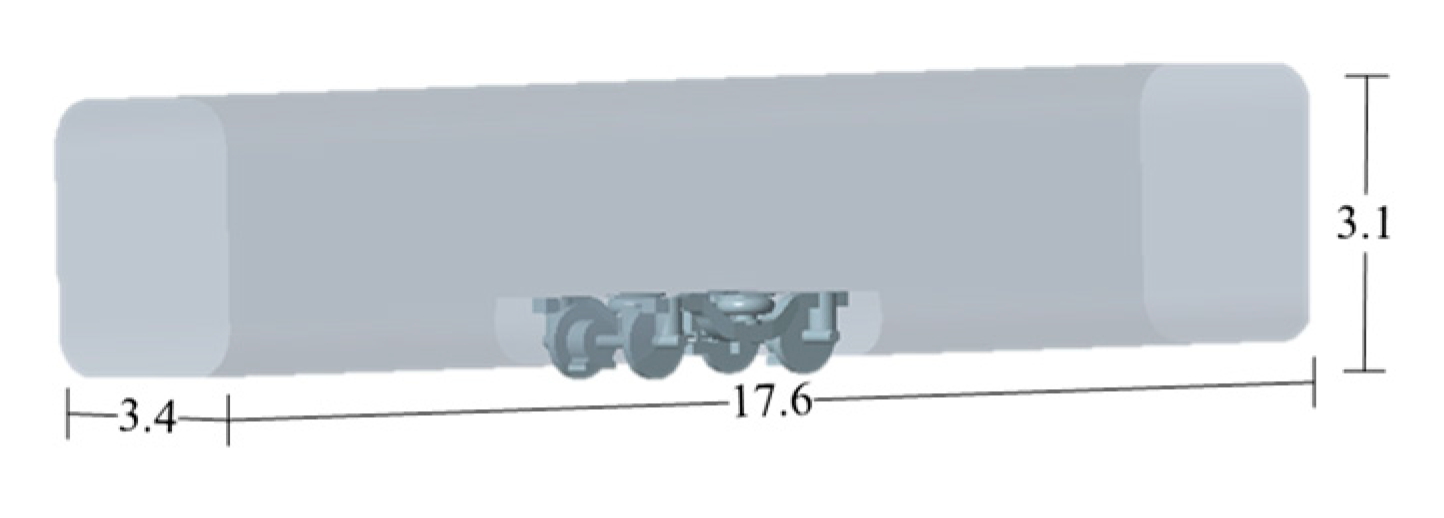
Figure 2.1. The geometry of the train (Unit: m).
Preprints 84845 g001
Figure 2.2. Bogie structure diagram.
Preprints 84845 g002
Figure 2.3. Comparison Chart of bogie model.
Preprints 84845 g003
Figure 2.4. Fluid Calculation Area.
Preprints 84845 g004
Figure 2.5. Meshing of the Model.
Preprints 84845 g005
Figure 2.6. Flowchart of the acoustic simulation process.
Preprints 84845 g006
Figure 3.1. Sound field distribution at a speed of 30km/h.
Preprints 84845 g007
Figure 3.2. Line Chart of Sound Pressure Level Change.
Preprints 84845 g008
Figure 3.3. Sound field distribution at a speed of 30km/h.
Preprints 84845 g009
Figure 3.4. Line Chart of Sound Pressure Level Change.
Preprints 84845 g010
Figure 3.5. Sound field distribution at a speed of 30km/h.
Preprints 84845 g011
Figure 3.6. Line Chart of Sound Pressure Level Change.
Preprints 84845 g012
Figure 3.7. Sound field distribution at a speed of 30km/h.
Preprints 84845 g013
Figure 3.8. Line Chart of Sound Pressure Level Change.
Preprints 84845 g014
Figure 3.9. Sound field distribution at a speed of 30km/h.
Preprints 84845 g015
Figure 3.10. Line Chart of Sound Pressure Level Change.
Preprints 84845 g016
Figure 3.11. Sound field distribution at a speed of 30km/h.
Preprints 84845 g017
Figure 3.12. Line Chart of Sound Pressure Level Change.
Preprints 84845 g018
Disclaimer/Publisher’s Note: The statements, opinions and data contained in all publications are solely those of the individual author(s) and contributor(s) and not of MDPI and/or the editor(s). MDPI and/or the editor(s) disclaim responsibility for any injury to people or property resulting from any ideas, methods, instructions or products referred to in the content.
Copyright: This open access article is published under a Creative Commons CC BY 4.0 license, which permit the free download, distribution, and reuse, provided that the author and preprint are cited in any reuse.
Prerpints.org logo

Preprints.org is a free preprint server supported by MDPI in Basel, Switzerland.

Subscribe

© 2024 MDPI (Basel, Switzerland) unless otherwise stated