Submitted:
12 September 2023
Posted:
13 September 2023
You are already at the latest version
Abstract
Keywords:
1. Introduction
1.1. Research Background
1.2. The Literature Review
1.3. Research Aims
2. Materials and Methods
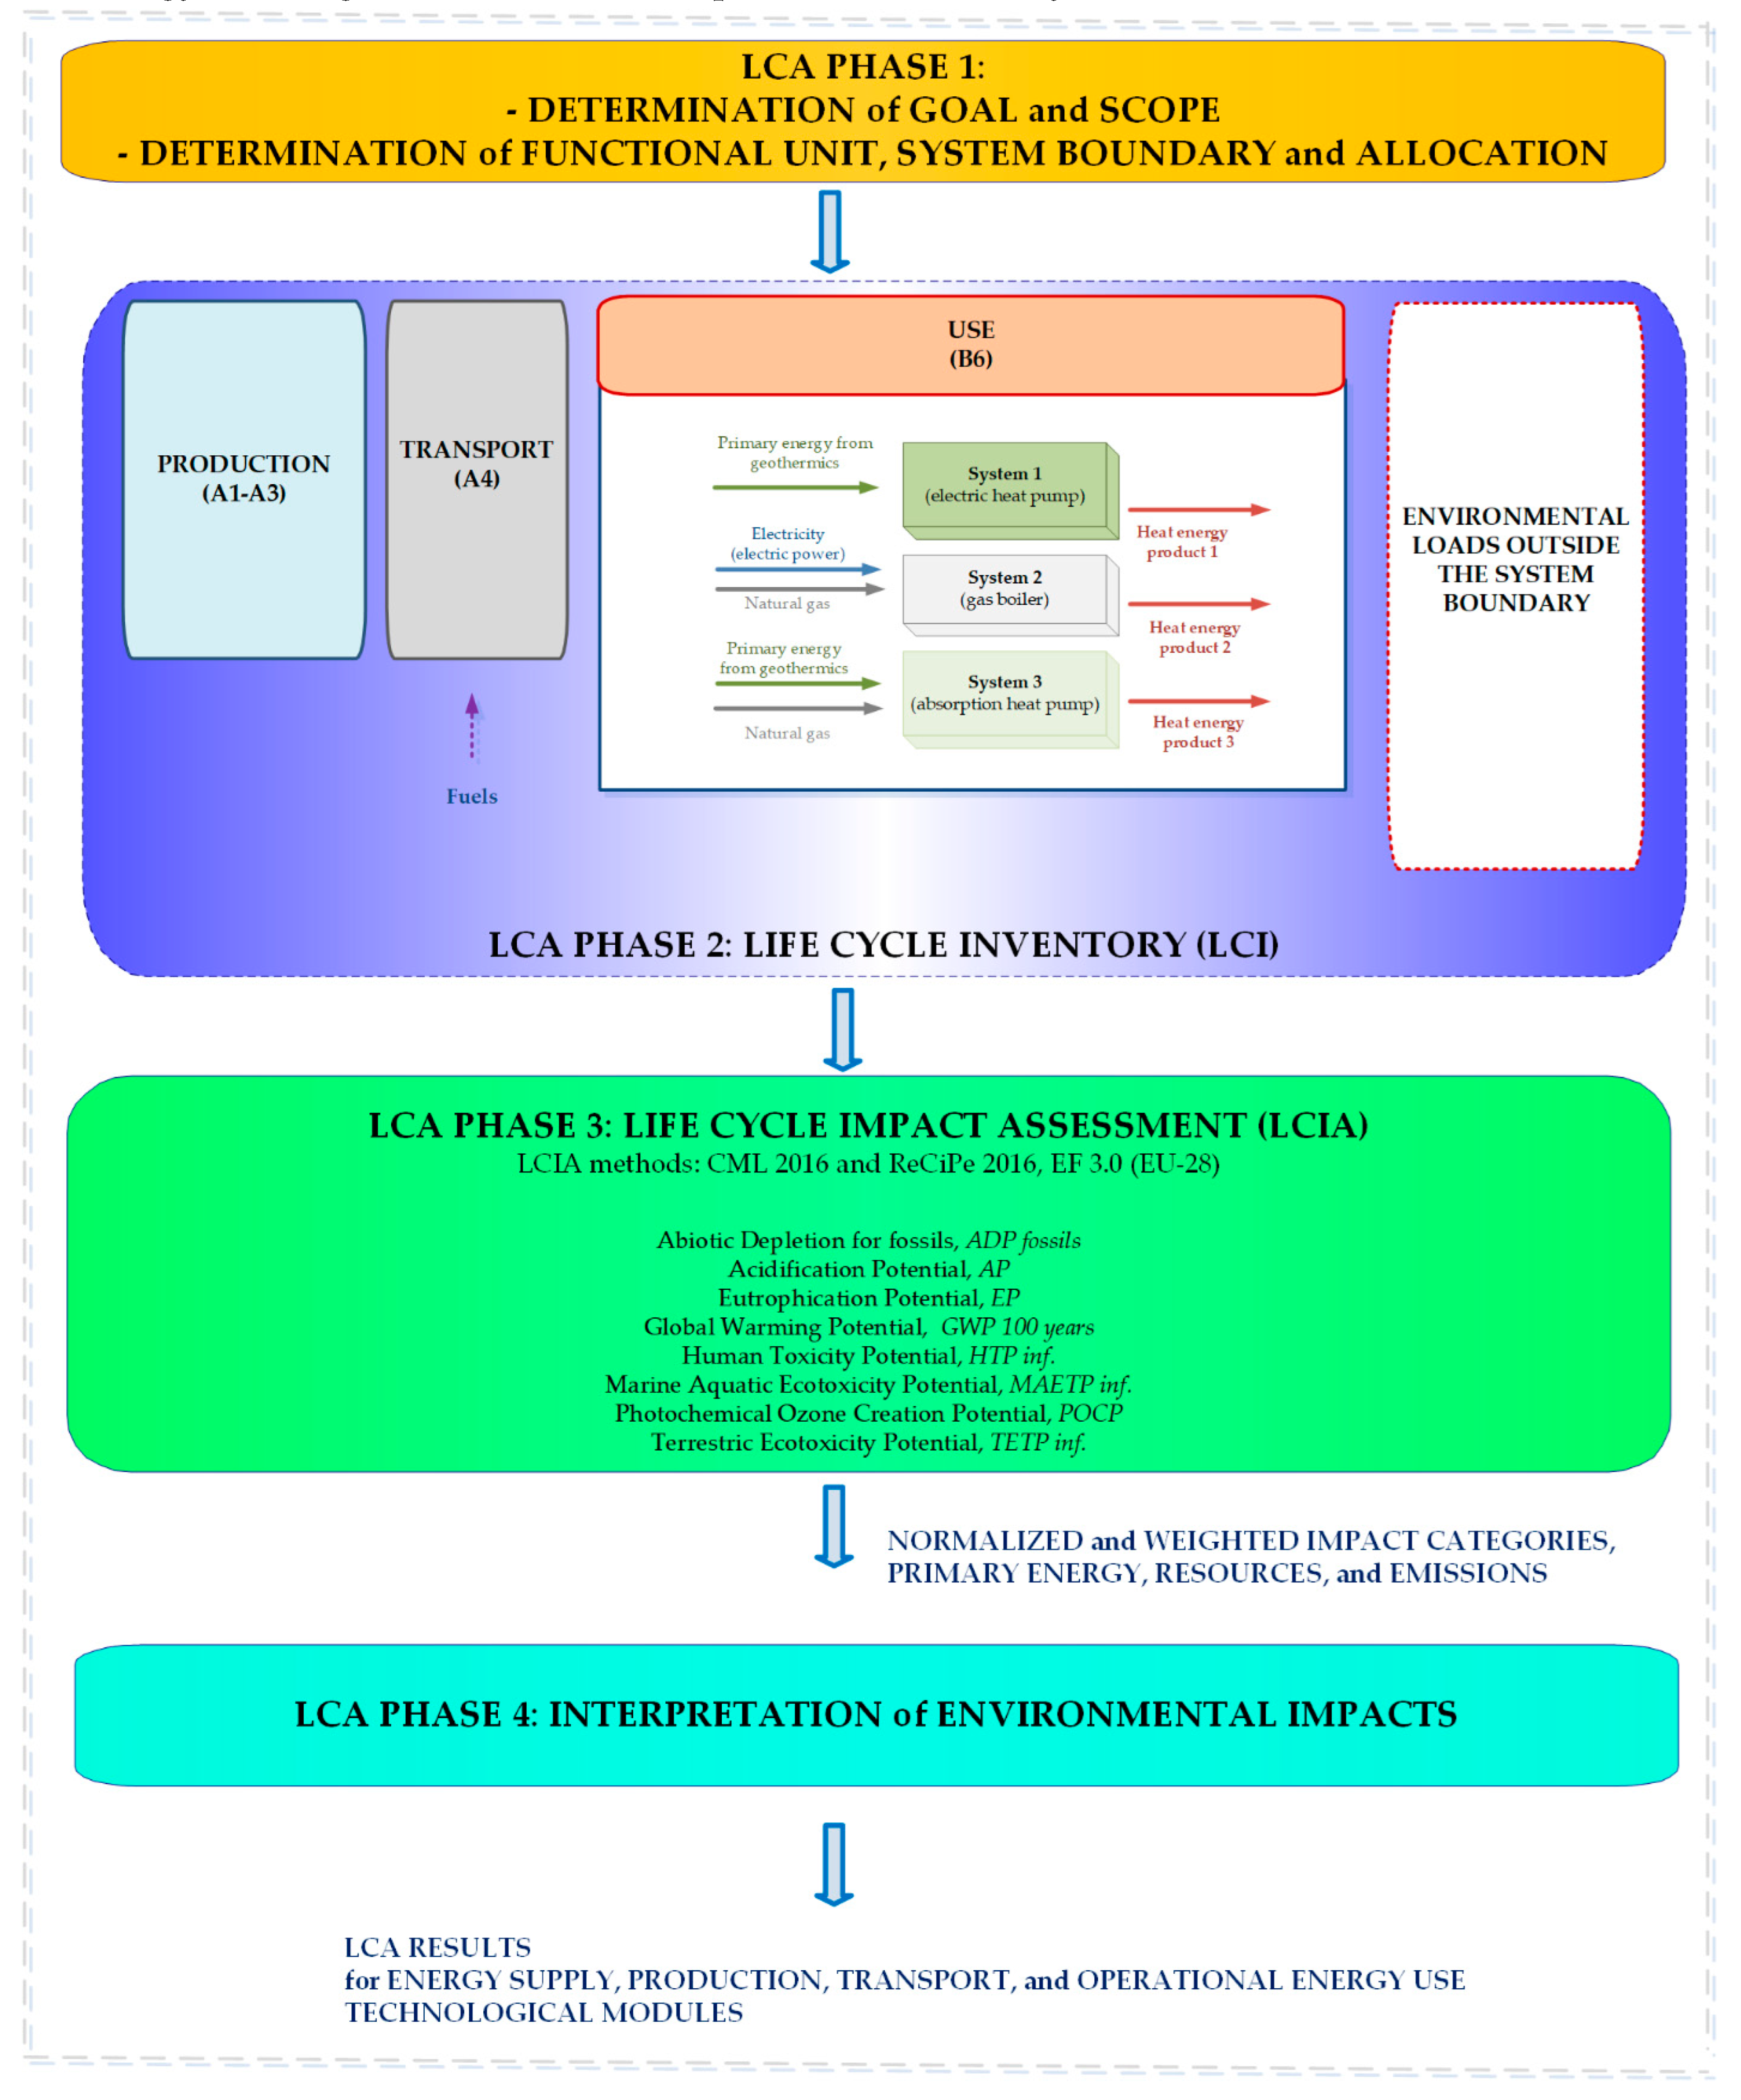
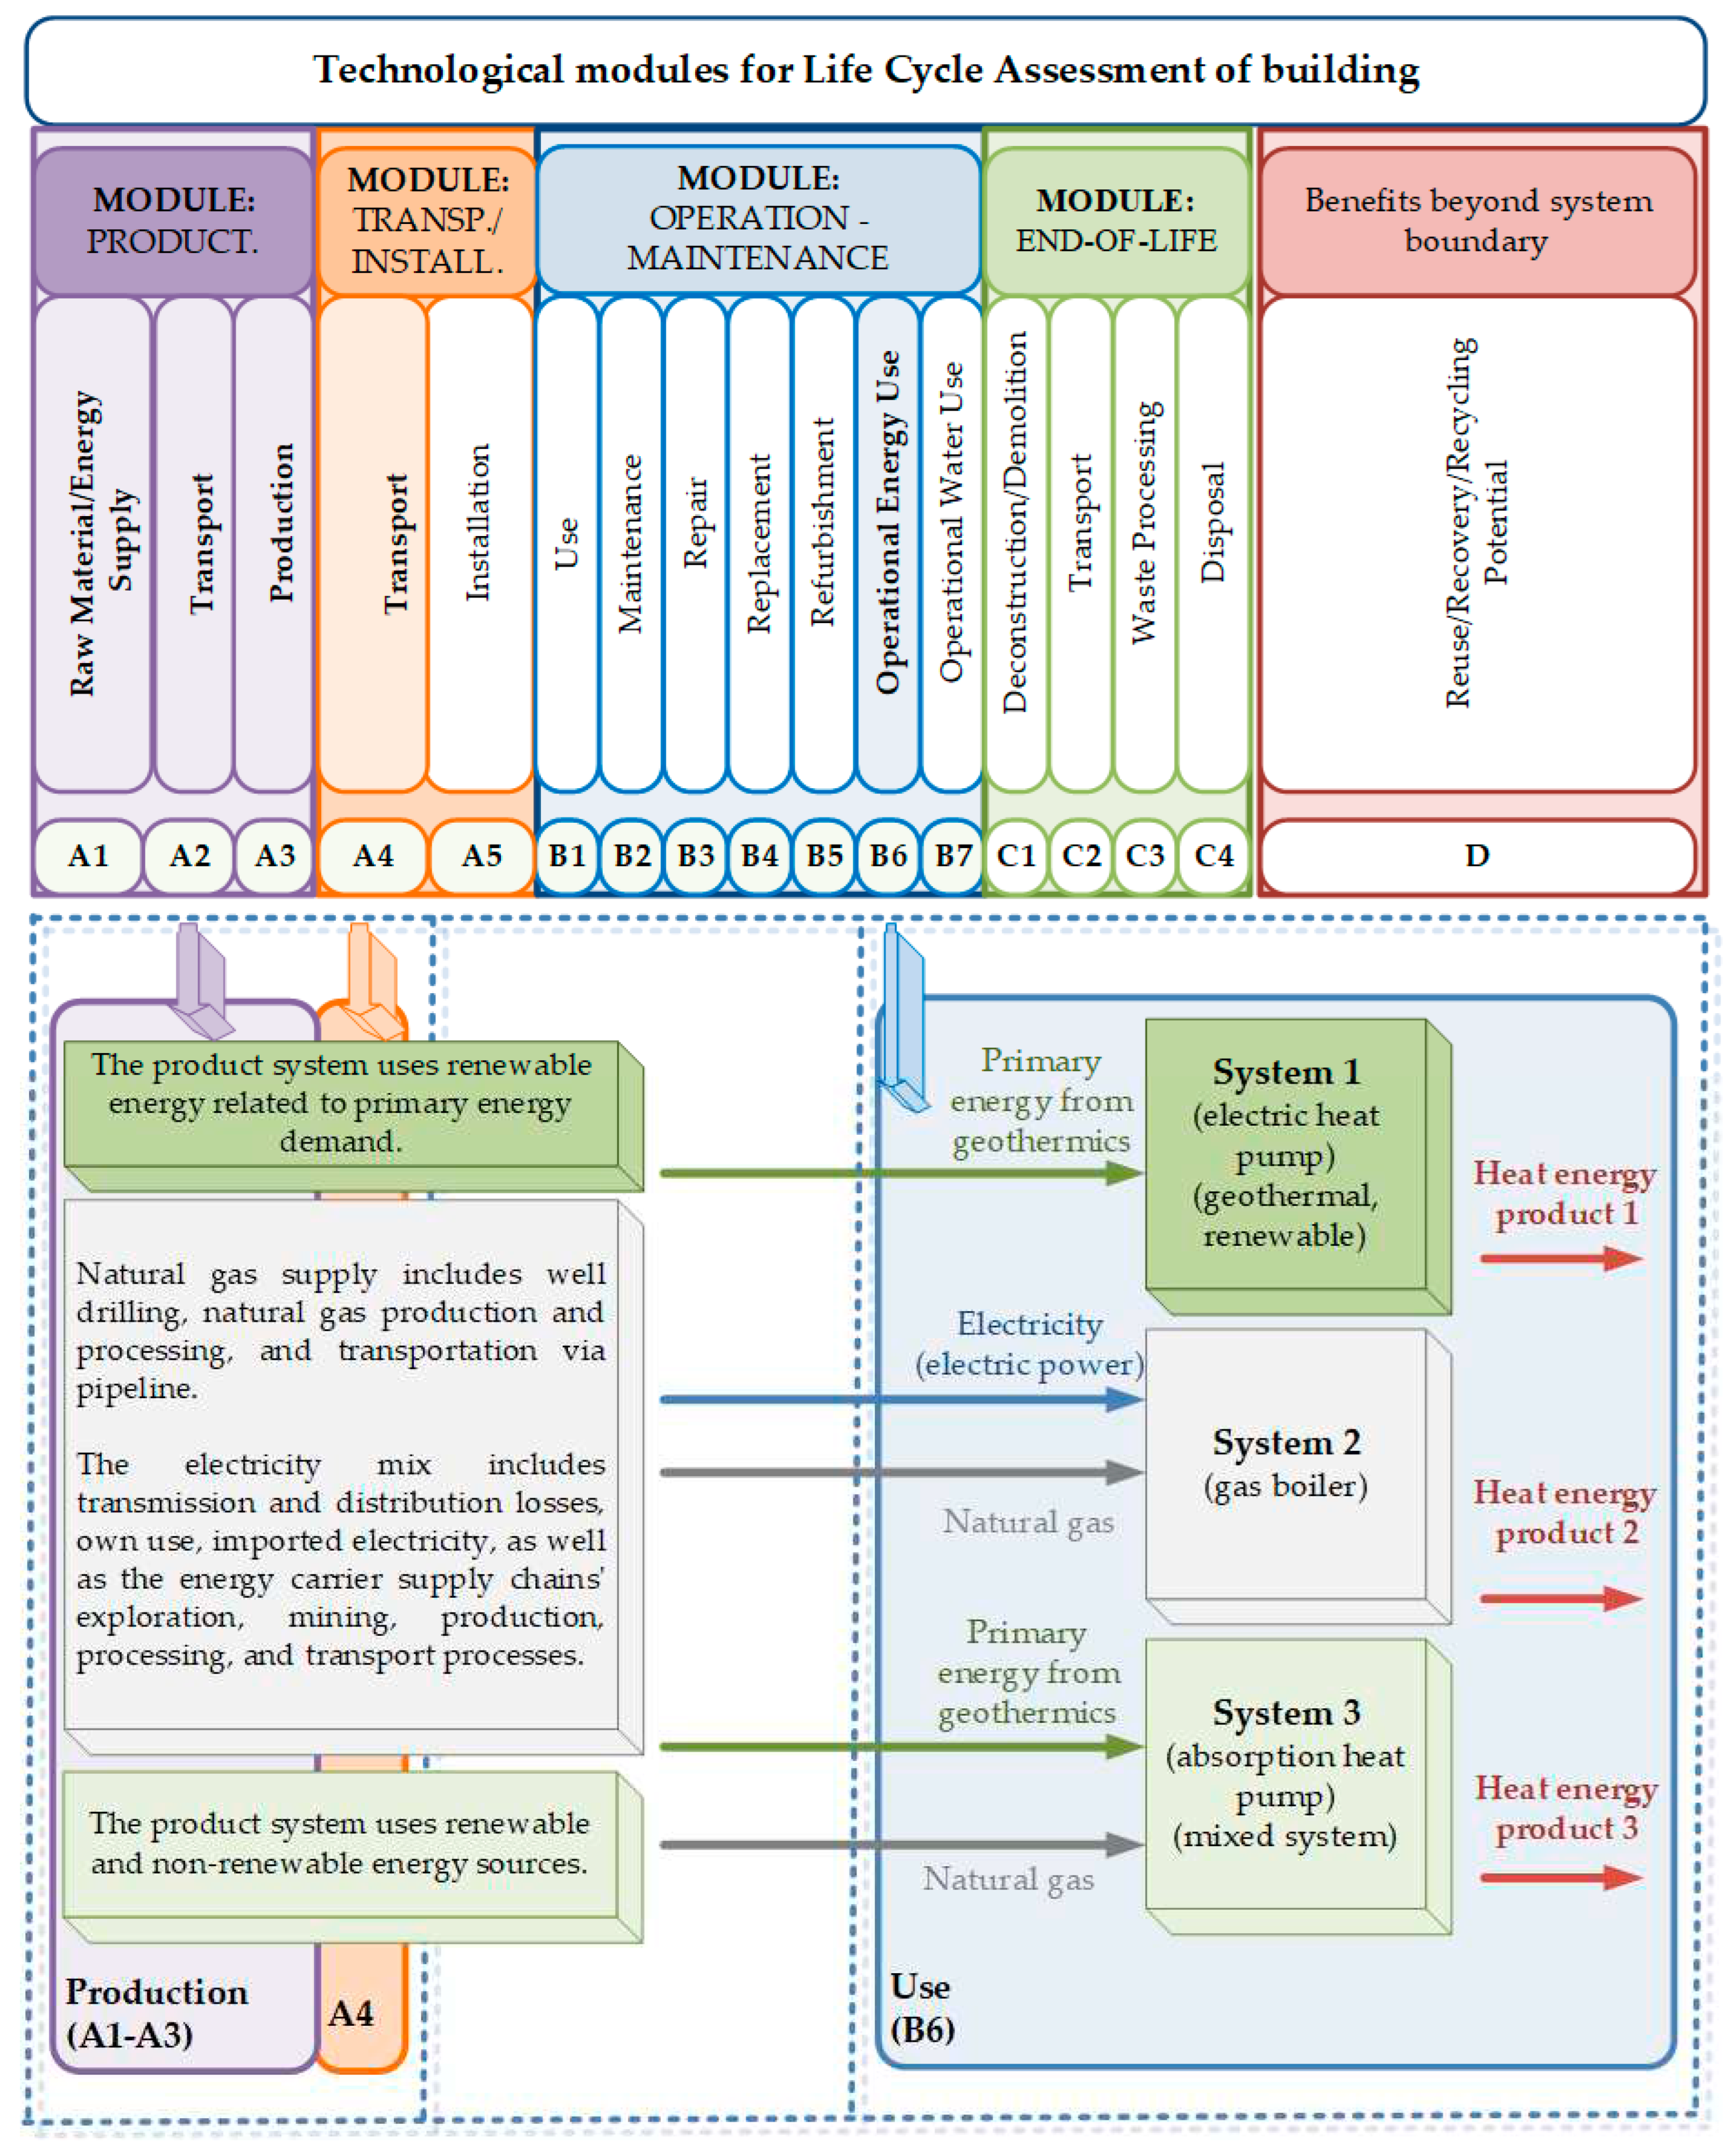
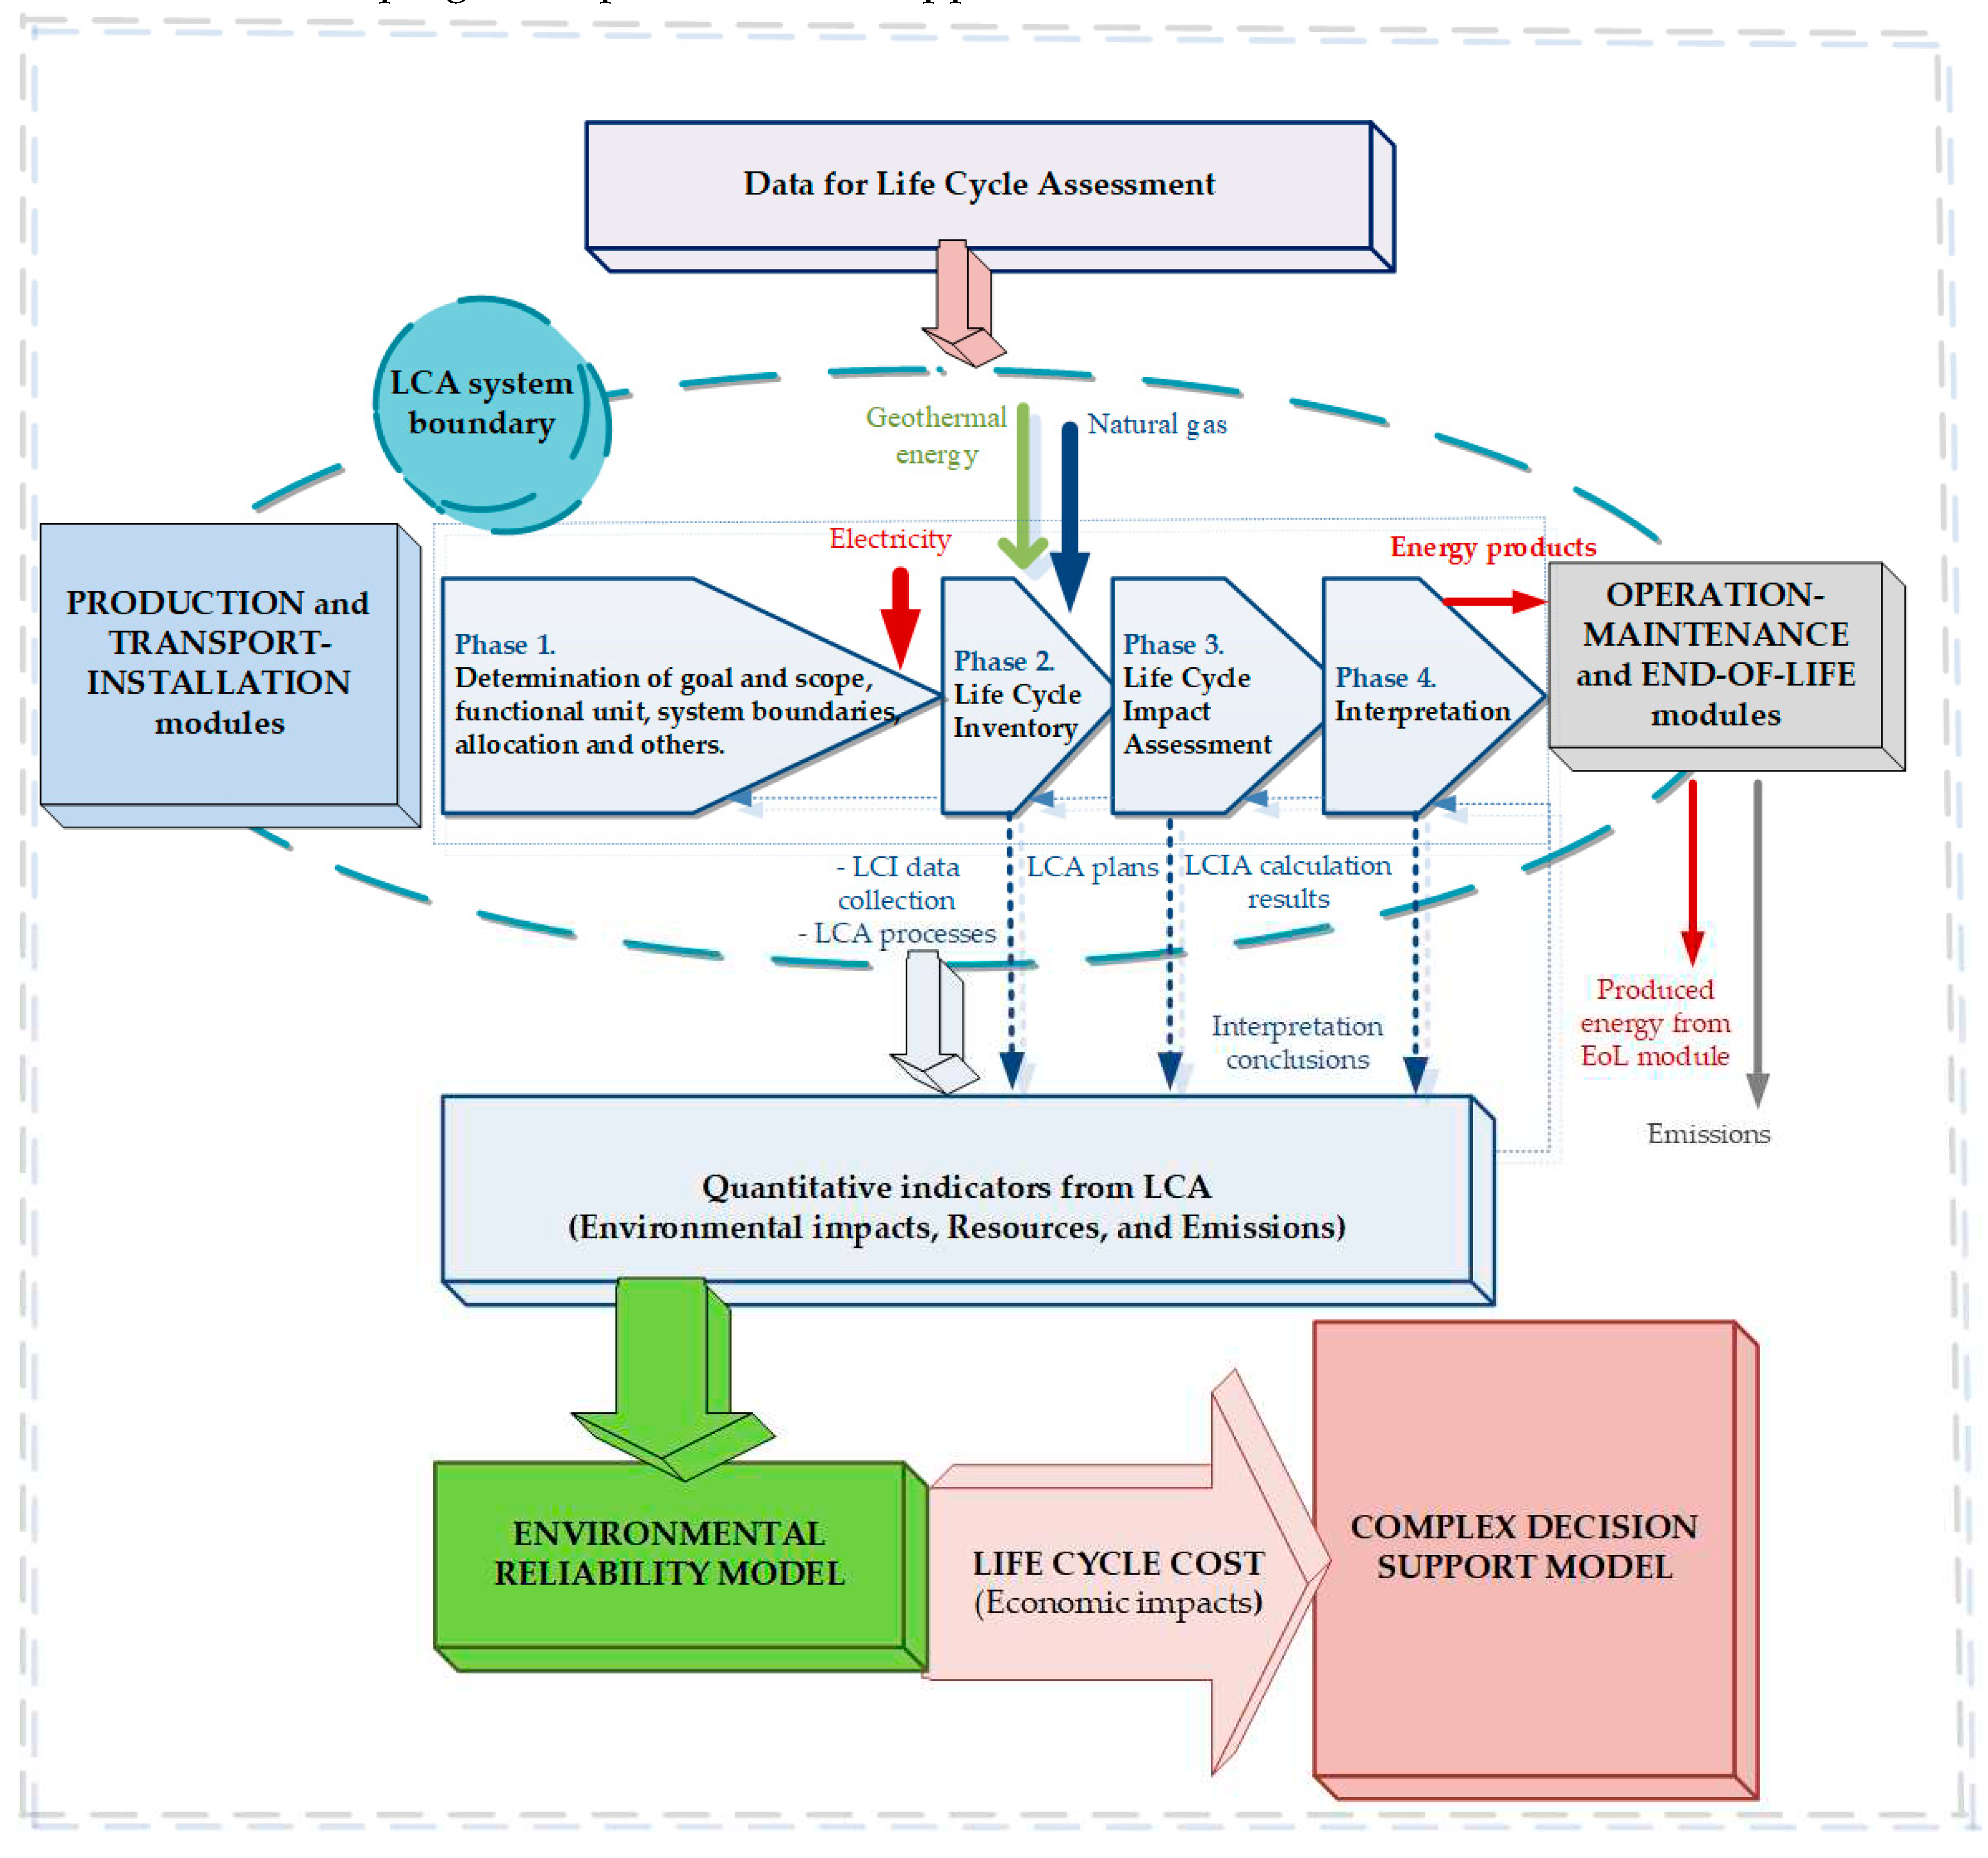
2.1. Life Cycle Assessment Method and System Boundary
2.2. Life Cycle Inventory and Functional Unit
2.3. Life Cycle Impact Assessment Method
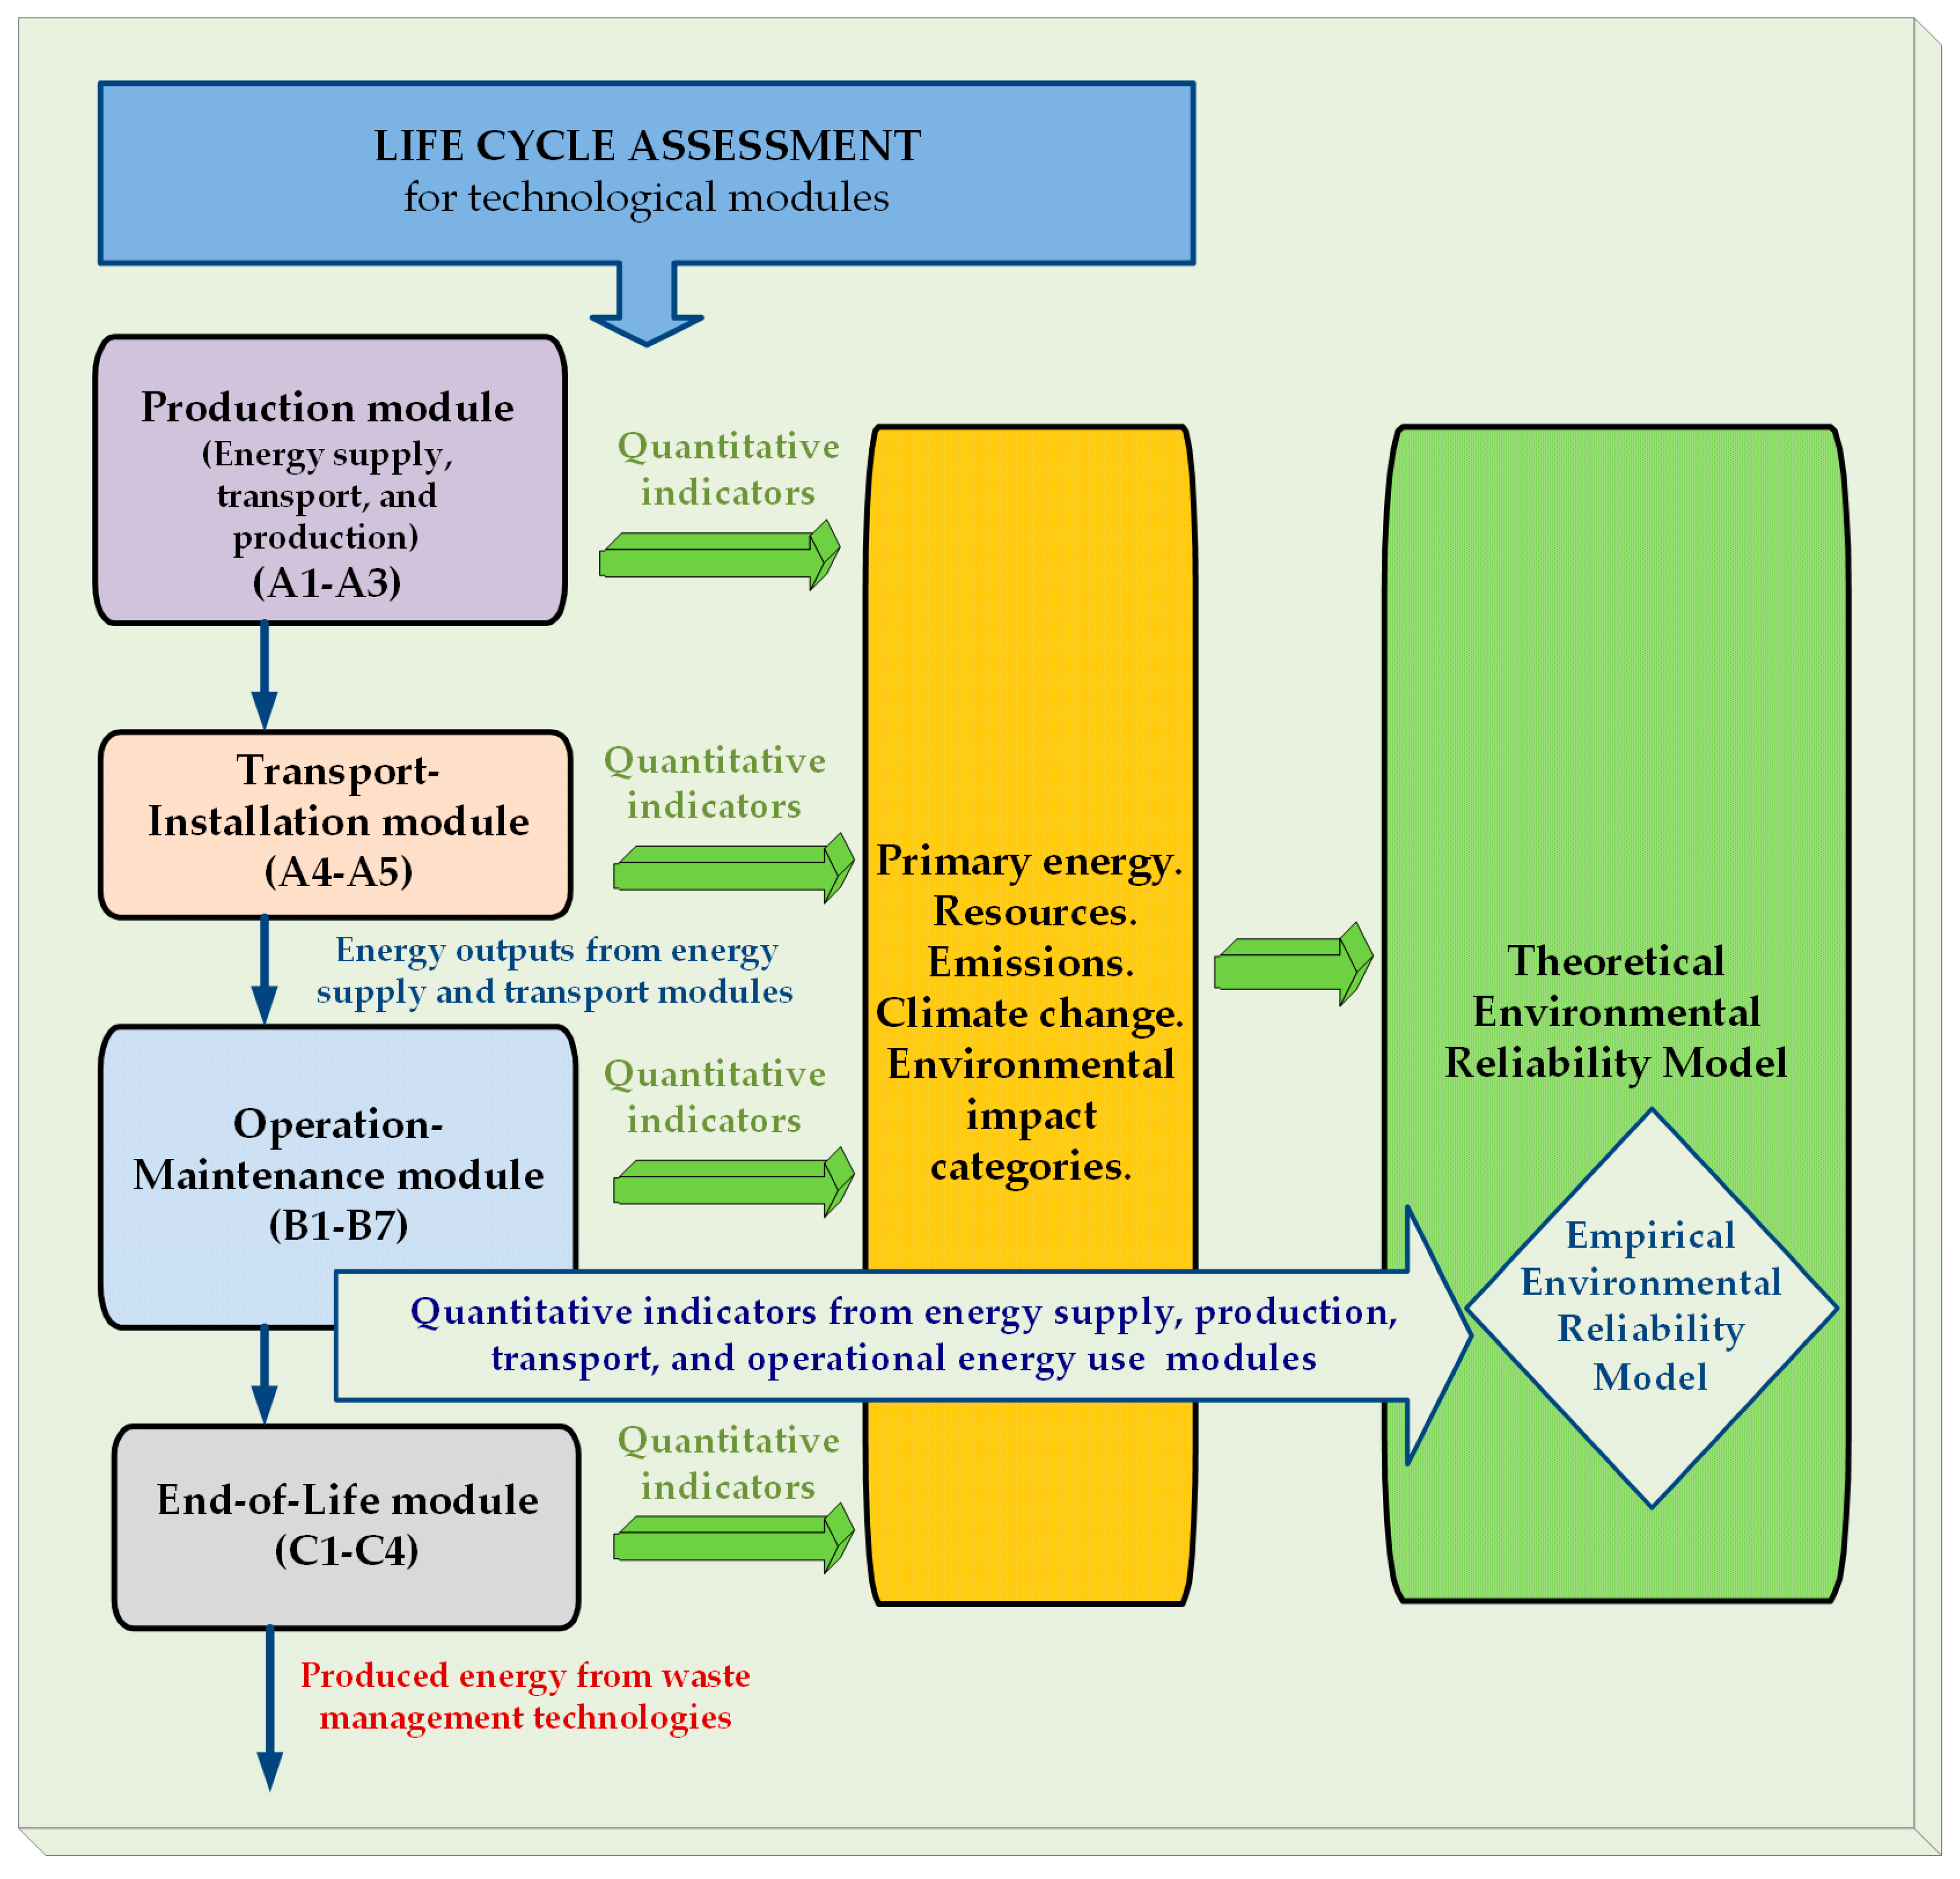
2.4. Empirical Method for the Development of an Environmental Reliability Model
2.5. Theoretical Method for the Development of a Complex Decision-Support Model
3. Results
4. Discussion
5. Conclusions
Author Contributions
Acknowledgments
Conflicts of Interest
Abbreviations
| ADPE | Abiotic Depletion Potential for Elements |
| ADPF | Abiotic Depletion Potential for fossils |
| AP ASHP |
Acidification Potential Air Source Heat Pump |
| CE CGB EAHX |
Circular Economy Condensing Gas Boiler Earth-to-Air Heat Pump |
| EGD | European Green Deal |
| EP | Eutrophication Potential |
| EU FAETP GSHP |
European Union Freshwater Aquatic Ecotoxicity Potential Groubd Source Heat Pump |
| GWP | Global Warming Potential |
| HTP HVAC |
Human Toxicity Potential Heating, Ventilation and Air Condition |
| LCA | Life Cycle Assessment |
| LCI | Life Cycle Inventory |
| LCIA MAETP |
Life Cycle Impact Assessment Marine Aquatic Ecotoxicity Potential |
| POCP | Photochemical Ozone Creation Potential |
| SDGs TETP WSHP |
Sustainable Development Goals Terrestric Ecotoxicity Potential Water Source Heat Pump |
References
- Santamouris, M.; Vasilakopoulou, K. Present and future energy consumption of buildings: Challenges and opportunities towards decarbonization. e-Prime - Advances in Electrical Engineering, Electronics and Energy, 2021, 1, 100002. [Google Scholar] [CrossRef]
- Impact assessment report 2021: Accompanying the Proposal for a Directive of the European Parliament and of the Council on energy efficiency (recast); Commission staff working document, SWD (2021b), 623 final. European Commission: Brussels, 2021. Available online: https://eur-lex.europa.eu/resource.html?uri=cellar:daf643a4-5da2-11ec-9c6c-01aa75ed71a1.0001.02/DOC_1&format=PDF (accessed on 15 Dezember 2021).
- Emissions Gap Report 2022: The Closing Window — Climate Crisis Calls for Rapid Transformation of Societies. United Nations; Environment Programme (UNEP): Nairobi, 2022. Available at: https://www.unep.org/resources/emissions-gap-report-2022 (accessed on 22 October 2022).
- Moran, P.; O’ Connell, J.; Goggins, J. Sustainable energy efficiency retrofits as residenial buildings move towards nearly zero energy building (NZEB) standards. Energy and Buildings 2020, 211/5, 109816. [Google Scholar] [CrossRef]
- Dodd, N.; Cordella, M.; Traverso, M.; Donatello, S. JRC Technical Reports: Level(s) – a Common EU Framework of Core Sustainability Indicators for Office and Residential Buildings Part 3. European Commission Joint Research Centre, Luxembourg, 2017. Available at: https://publications.jrc.ec.europa.eu/repository/handle/JRC109286 . (accessed on 3 January 2018).
- Moran, P.; Goggins, J.; Hajdukiewicz, M. Super-insulate or use renewable technology? Life cycle cost, energy and global warming potential analysis of nearly zero energy buildings (NZEB) in a temperate oceanic climate. Energy and Buildings 2017, 139, 590–607. [Google Scholar] [CrossRef]
- The Global Risks Report 2020; The World Economic Forum: Geneva, Switzerland, 2020. Available online: https://www.weforum.org/reports/the-global-risks-report-2020 (accessed on 15 October 2021).
- Pintanel, M.T.; Martinez-Gracia, Uche, H. ; del Amo, A.; Bayod-Rújula, Á.; Uson, S.; Arauso, I. Energy and environmental benefits of an integrated solar photovoltaic and thermal hybrid, seasonal storage and heat pump system for social housing. Applied Thermal Engineering 2022, 213, 118662. [Google Scholar] [CrossRef]
- Hunter, A. K. Comparative Life Cycle Assessment: ground source heat pump system versus gas furnace and air conditioner system. 2017.
- Rodríguez, J.; Bangueses, I.; Castro, M. Life cycle analysis of a geothermal heatpump installation and comparison with a conventional fuel boiler system in a nursery school in Galicia (Spain), EPJ Web of Conferences 33 2012, 05003. [CrossRef]
- Huang, B.; Mauerhofer, V. Life cycle sustainability assessment of ground source heat pump in Shanghai, China. Journal of cleaner production 2016, 119, 207–214. [Google Scholar] [CrossRef]
- Michopoulos, A.; Voulgari, V.; Tsikaloudaki, A.; Zachariadis, Th. Evaluation of ground source heat pump systems for residential buildings in warm Mediterranean regions: the example of Cyprus. Energy Efficiency 2016, 9, 1421–1436. [Google Scholar] [CrossRef]
- Bristow, D.; Kennedy, C. A. Potential of building-scale alternative energy to alleviate risk from the future price of energy. Energy Policy 2010, 38/4, 1885–1894. [Google Scholar] [CrossRef]
- Saner, D.; Juraske, R.; Kübert, M.; Blum, P.; Hellweg, S.; Bayer, P. Is it only CO2 that matters? A life cycle perspective on shallow geothermal systems. Renewable and Sustainable Energy Reviews 2010, 14.7, 1798–1813. [Google Scholar] [CrossRef]
- Tariq, S.; Safder, U.; Yoo, C. Exergy-based weighted optimization and smart decision-making for renewable energy systems considering economics, reliability, risk, and environmental assessments. Renewable and Sustainable Energy Reviews 2022, 162, 112445. [Google Scholar] [CrossRef]
- Milousi, M.; Pappas, A.; Vouros, A.P.; Mihalakakou, G.; Souliotis, M.; Papaefthimiou, S. Evaluating the Technical and Environmental Capabilities of Geothermal Systems through Life Cycle Assessment. Energies 2022, 15, 5673. [Google Scholar] [CrossRef]
- Greco, A.; Gundabattini, E.; Solomon, D.G.; Singh Rassiah, R.; Masselli, C. A Review on Geothermal Renewable Energy Systems for Eco-Friendly Air-Conditioning. Energies 2022, 15, 5519. [Google Scholar] [CrossRef]
- Clark, C.; Sullivan, J.; Harto, C.; Han, J.; Wang, M. Life cycle environmental impacts of geothermal systems. In: Proceedings of the 37th workshop on geothermal reservoir engineering, Stanford, CA. 2012.
- Martínez-Corona, J.I.; Gibon, T.; Hertwich, E.G.; Parra-Saldívar, R. Hybrid life cycle assessment of a geothermal plant: From physical to monetary inventory accounting. Journal of Cleaner Production 2017, 142, 2509–2523. [Google Scholar] [CrossRef]
- Greening, B.; Azapagic, A. Domestic heat pumps: Life cycle environmental impacts and potential implications for the UK. Energy 2012, 39/1, 205–217. [Google Scholar] [CrossRef]
- Nitkiewicz, A.; Sekret, R. Comparison of LCA results of low temperature heat plant using electric heat pump, absorption heat pump and gas-fired boiler. Energy Conversion and Management 2014, 87, 647–652. [Google Scholar] [CrossRef]
- Naumann, G.; Schropp, E.; Gaderer, M. Life Cycle Assessment of an Air-Source Heat Pump and a Condensing Gas Boiler Using an Attributional and a Consequential Approach. Procedia CIRP 2022, 105, 351–356. [Google Scholar] [CrossRef]
- Sevindik, S.; Spataru, C.; Domenech Aparisi, T.; Bleischwitz, R. A Comparative Environmental Assessment of Heat Pumps and Gas Boilers towards a Circular Economy in the UK. Energies 2021, 14, 3027. [Google Scholar] [CrossRef]
- Abusoglu, A.; Sedeeq, M.S. Comparative exergoenvironmental analysis and assessment of various residential heating systems. Energy and Buildings 2013, 62, 268–277. [Google Scholar] [CrossRef]
- Kim, H.G.; Jeong, D.W.; Kwon, S.J.; Kim, S.S. Development of Building Energy Performance Benchmark for Hospitals. Buildings 2023, 13, 12. [Google Scholar] [CrossRef]
- Lee, J.-H.; Kim, D.-G.; Jeong, S.-K.; Song, Y.-h. Analysis of Heat Source System Degradation Due to Aging and Evaluation of Its Effect on Energy Consumption. Energies 2022, 15, 9217. [Google Scholar] [CrossRef]
- Bolteya, A.M.; Elsayad, M.A.; El Monayeri, O.D.; Belal, A.M. Impact of Phase Change Materials on Cooling Demand of an Educational Facility in Cairo, Egypt. Sustainability 2022, 14, 15956. [Google Scholar] [CrossRef]
- Banks, A.; Grist, C.; Heller, J.; Lim, H. Field Measurement of Central CO2 Heat Pump Water Heater for Multifamily Retrofit. Sustainability 2022, 14, 8048. [Google Scholar] [CrossRef]
- Zhang, Z.; Wang, J.; Yang, M.; Gong, K.; Yang, M. Environmental and Economic Analysis of Heating Solutions for Rural Residences in China. Sustainability 2022, 14, 5117. [Google Scholar] [CrossRef]
- AlAli, M.; Mattar, Y.; Alzaim, M.A.; Beheiry, S. Analysis of Electricity and Water Consumption in Existing Mosque Buildings in the UAE. Buildings 2023, 13, 1007. [Google Scholar] [CrossRef]
- Shirazi, A.; Ashuri, B. Embodied Life Cycle Assessment (LCA) comparison of residential building retrofit measures in Atlanta. Building and Environment 2020, 171, 106644. [Google Scholar] [CrossRef]
- Asdrubali, F.; Grazieschi, G. Life cycle assessment of energy efficient buildings. Energy Reports 2020, 6, 270–285. [Google Scholar] [CrossRef]
- Grazieschi, G.; Gori, P.; Lombardi, L.; Asdrubali, F. Life cycle energy minimization of autonomous buildings. Journal of Building Engineering 2020, 30, 101229. [Google Scholar] [CrossRef]
- Li, Mo. Life Cycle Assessment of Residential Heating and Cooling Systems in Minnesota A comprehensive analysis on life cycle greenhouse gas (GHG) emissions and cost-effectiveness of ground source heat pump (GSHP) systems compared to the conventional gas furnace and air conditioner system. University of Minnesota 2013. Available online at: https://hdl.handle.net/11299/146449.
- Mannheim, V.; Feher, Z. S.; Siménfalvi, Z. Innovative solutions for the building industry to improve sustainability performance with Life Cycle Assessment modelling. In: Solutions for sustainable development. CRC Press, 2019; 245–253. [Google Scholar] [CrossRef]
- Asdrubali, F.; Ballarini, I.; Corrado, V.; Evangelisti, L.; Grazieschi, G.; Guattari, C. Energy and environmental payback times for an NZEB retrofit. Building and Environment 2019, 147, 461–472. [Google Scholar] [CrossRef]
- ISO 14040:2006; Environmental Management—Life Cycle Assessment—Principles and Framework. ISO: Geneva, Switzerland, 2006. Available online: https://www.iso.org/standard/37456.html (accessed on 6 June 2019).
- ISO 14044:2006; Environmental Management—Life Cycle Assessment—Requirements and Guidelines. ISO: Geneva, Switzerland, 2006. Available online: https://www.iso.org/standard/38498.html (accessed on 6 June 2019).
- CML. Institute of Environmental Sciences, Leiden University. CML-IA Characterisation Factors Portal. 2016. Available online: https://www.universiteitleiden.nl/en/research/researchoutput/science/cml-ia-characterisation-factors (accessed on 29 June 2018).
- Van Oers, L.; De Koning, A.; Guinée, J.B.; Huppes, G. Abiotic resource depletion in LCA. In Improving Characterisation Factors for Abiotic Resource Depletion as Recommended in the New Dutch LCA Handbook; RWS-DWW: Delft, The Netherlands, 2002; Available online: http://www.leidenuniv.nl/cml/ssp/projects/lca2/report_abiotic_depletion_web.pdf (accessed on 29 February 2016).
- Kupfer, T.; Baitz, M.; Colodel, CM.; Kokborg, M.; Schöll, S.; Rudolf, M.; Thellier, L.; Bos, U.; Bosch, F.; Gonzalez, M. GaBi Database & Modeling Principles. In GaBi Thinkstep AG; Sphera: Chicago, IL, USA, 2018. [Google Scholar]
- Buyle, M.; Braet, J.; Audenaert, A. Life cycle assessment in the construction sector: A review. Renewable and Sustainable Energy Reviews. 2013, 26, 379–388. [Google Scholar] [CrossRef]
- Bahramian, M.; Yetilmezsoy, K. Life cycle assessment of the building industry: An overview of two decades of research (1995– 2018). Energy and Buildings. 2020, 219, 109917. [Google Scholar] [CrossRef]
- Bałdowska-Witos, P.; Kruszelnicka, W.; Tomporowski, A. LCA analyzes were also performed for the production of PET bottle. Life cycle assessment of beverage bottles. J. Phys. Conf. Ser. 2020, 1426, 012038. [Google Scholar] [CrossRef]
- Mannheim, V. Life Cycle Assessment Model of Plastic Products: Comparing Environmental Impacts for Different Scenarios in the Production Stage. Polymers 2021, 13, 777. [Google Scholar] [CrossRef] [PubMed]
- Alwaeli, M.; Mannheim, V. Investigation into the Current State of Nuclear Energy and Nuclear Waste Management—A State-of-the-Art Review. Energies 2022, 15, 4275. [Google Scholar] [CrossRef]
- Kasner, R. The Environmental Efficiency of Materials Used in the Lifecycle of a Wind Farm. Sustainable Materials and Technologies 2022, 34, e00512. [Google Scholar] [CrossRef]
- Danko, G.L.; Baracza, M.K. Numerical Demonstration of an Unconventional EGS Arrangement. Energies 2022, 15, 20. [Google Scholar] [CrossRef]
| Flow type | Process flow name | Plan flow name | Amount |
|---|---|---|---|
| System 1 | |||
| Input | Primary energy from geothermics (renewable energy) |
Electricity from geothermal (European Union) |
75.2 MJ 20.9 kWh |
| Output | Thermal energy from heating (thermal energy) |
Product heat energy | 75.2 MJ |
| System 2 | |||
| Input | Natural gas (at consumer Hungary) |
Natural gas mix (Hungary) |
8.8 kg 412 MJ 114,4 kWh |
| Input | Electricity (electric power) | Electricity grid mix (production mix, Hungary) |
7.92 MJ 2.2 kWh |
| Output | Thermal energy from heating (thermal energy) |
Product heat energy | 419.92 MJ |
| System 3 | |||
| Input | Natural gas (at consumer Hungary) |
Natural gas mix (Hungary) |
4.82 kg 226 MJ 62.7 kWh |
| Input | Primary energy from geothermics (renewable energy) |
Electricity from geothermal (European Union) |
11.9 MJ 3.3 kWh |
| Output | Thermal energy from heating (thermal energy) |
Product heat energy | 237.9 MJ |
| Input names | Background of system inputs |
|---|---|
| Natural gas | The LCI dataset covers the entire natural gas supply chain. This includes drilling, natural gas production, processing, and transportation via pipelines. The main technologies in Hungary include conventional (primary, secondary, and tertiary) and unconventional production (shale gas, tight gas, coal seam gas). These technologies encompass various parameters such as energy consumption, transport distances, and gas processing technologies. Pipeline transportation between the gas field and the coast is being considered. Hungarian natural gas consumption consists of a combination of domestically produced natural gas and imported natural gas from the respective producing countries. An average regional distribution (via pipelines) is estimated for the total supply of natural gas, including domestic production and imports. The inventory is primarily based on secondary data. |
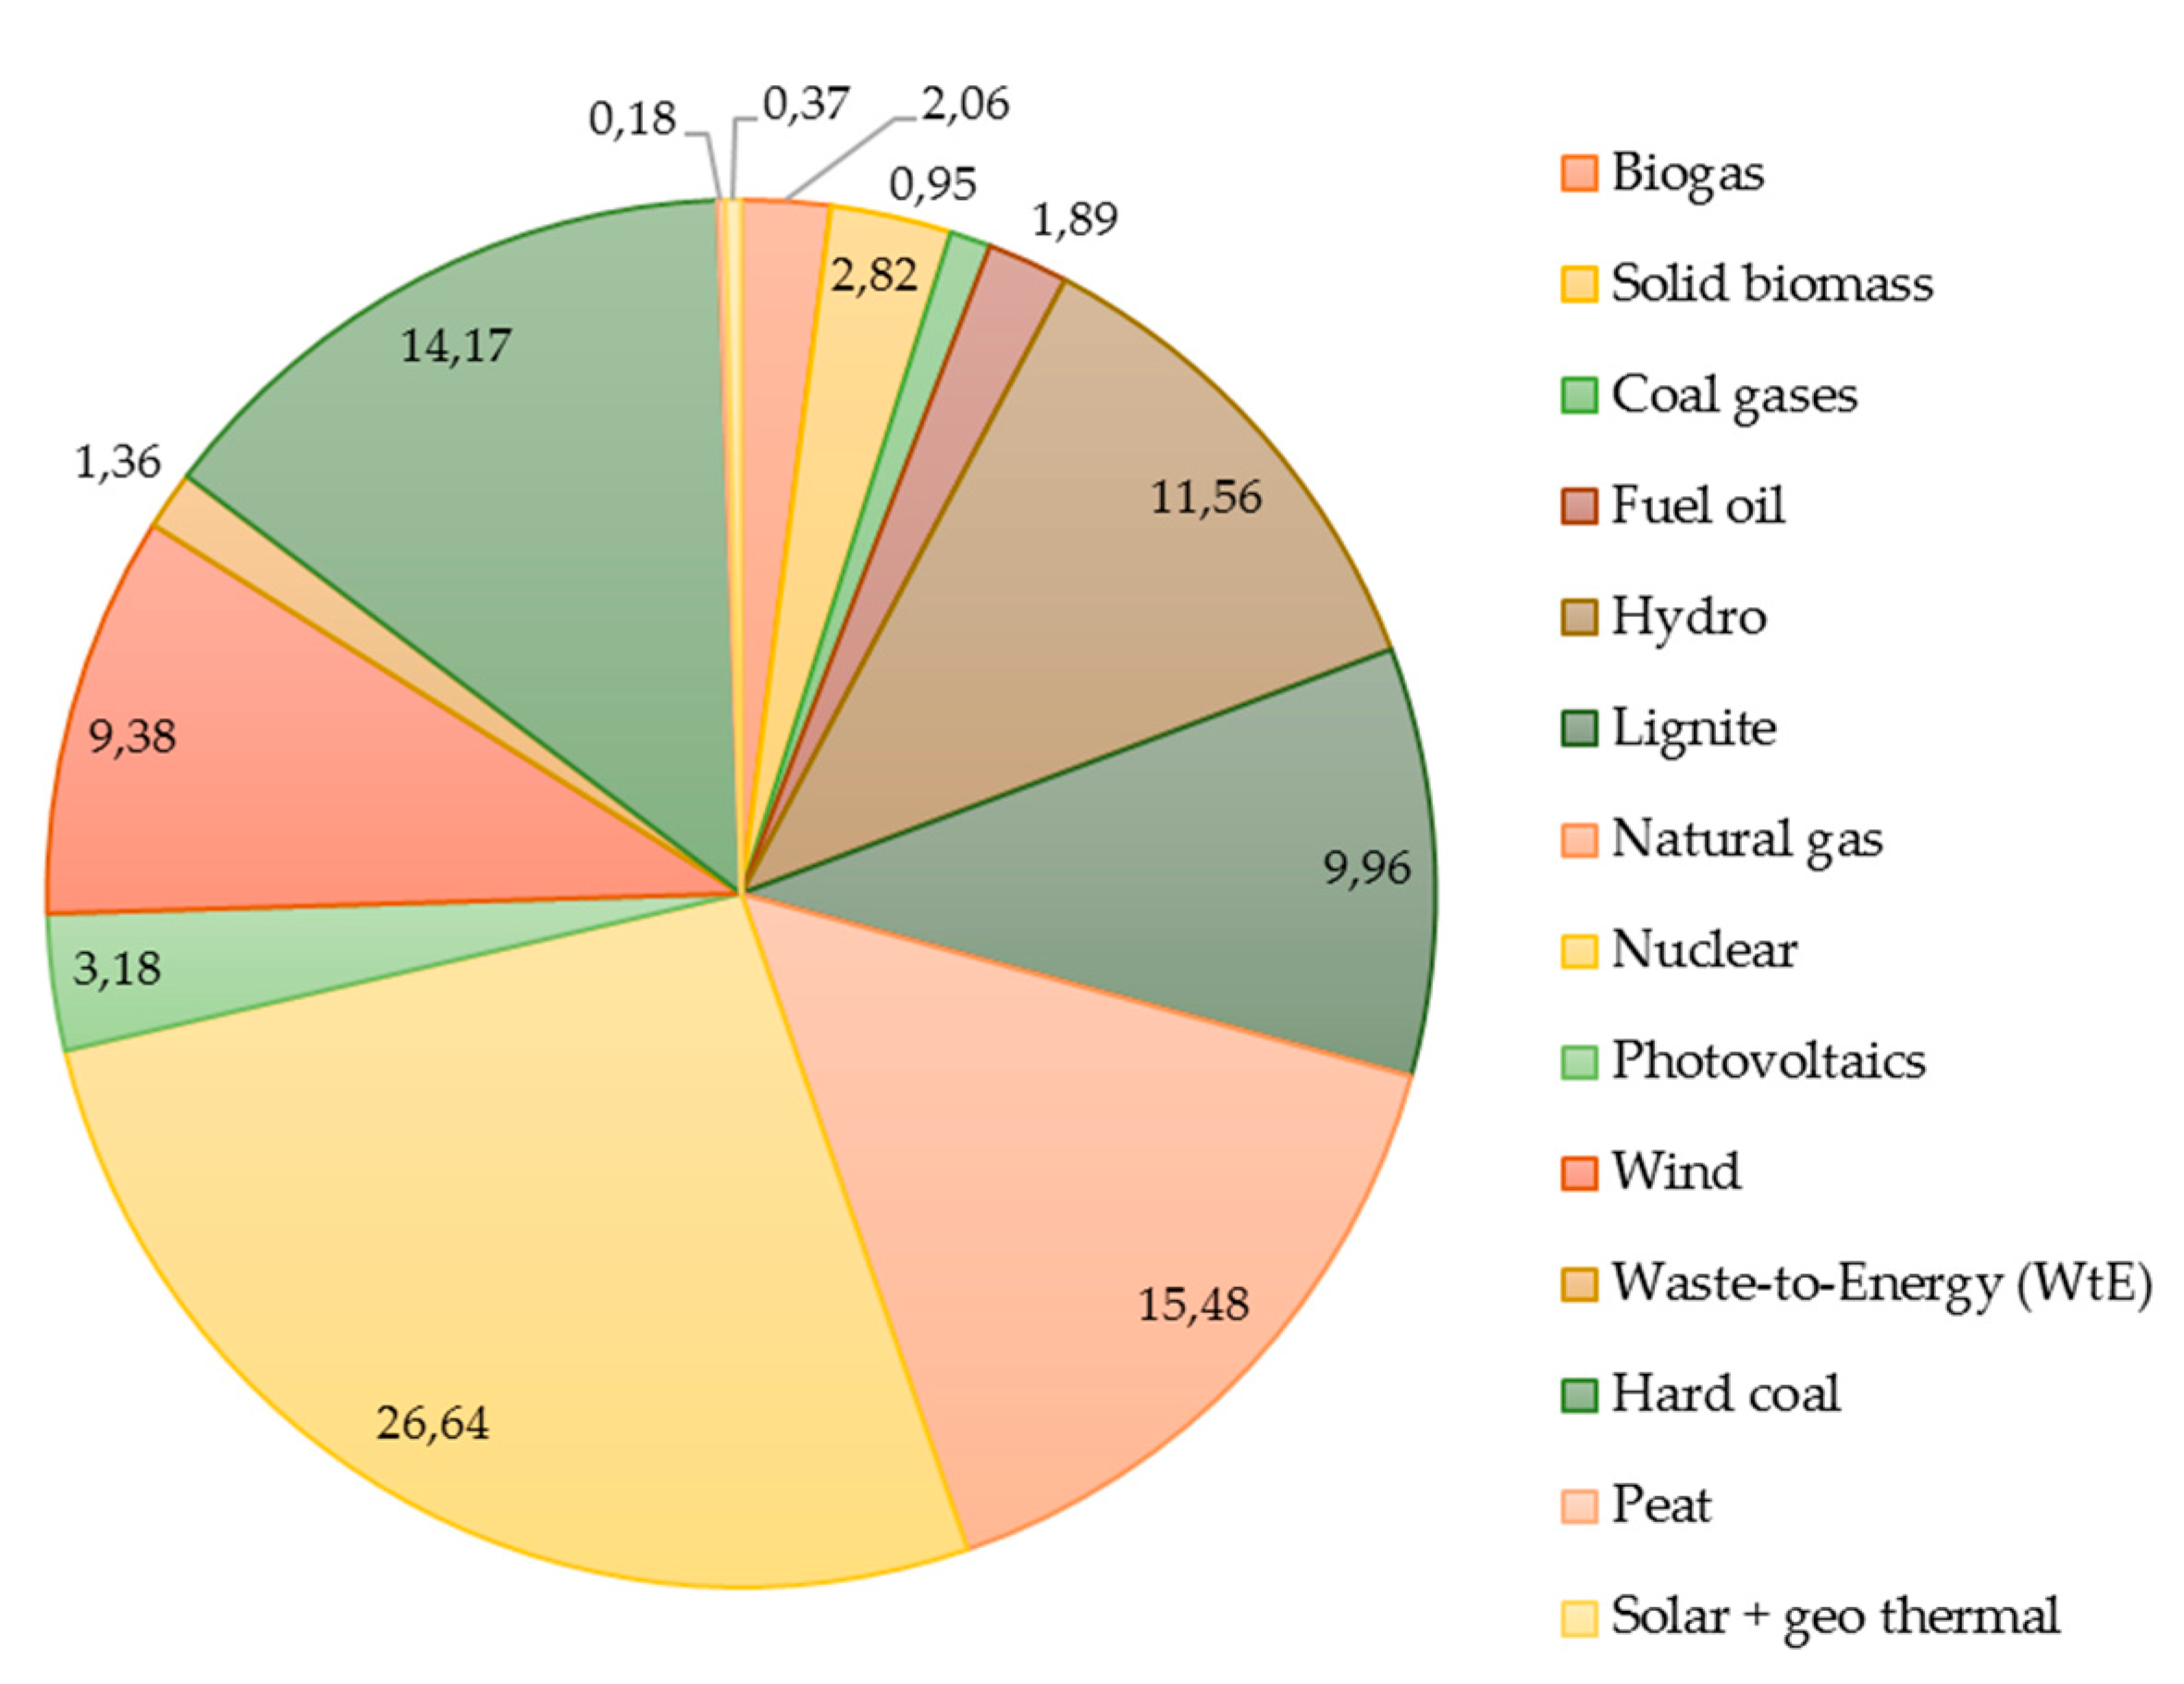
| Electricity | Electricity is modelled according to the specific circumstances of the European Union. The modelling of the electricity mix includes accounting for transmission and distribution losses, as well as self-consumption by energy producers, such as power plants and other sources like pumped storage power plants. It also takes into consideration imported electricity. Secondly, the national emission and efficiency standards of power plants are modelled, as well as the proportion of electricity plants and combined heat and power (CHP) plants. Thirdly, the analysis considers the supply of specific energy carriers, considering both imported and domestically produced energy sources. This includes examining the properties of the energy carriers, such as their composition and energy content. The exploration, extraction, production, processing, and transport processes of the energy carrier supply chains are modelled according to the EU situation. |
| Geothermal energy | The product system uses renewable energy-related primary energy demand; for 1 MJ of electricity from geothermal power, 1.98 MJ of primary geothermal power is used. |
| Energy carriers and refinery products | The energy carriers are modelled based on the specific supply situation (refer to the electricity section above). A parameterized refinery model simulates diesel fuel, gasoline, technical gases, fuel oils, lubricants, and residues, such as bitumen, with specific models for each country. The refinery model represents the current national standard in refining techniques, including emission levels, internal energy consumption, and other factors. It also takes into consideration the specific product output spectrum of each country, which can vary from one country to another. The supply of crude oil is modelled based on the specific situation of each country and the properties of the available resources. |
| Name of parameters | |
|---|---|
| Economic aspects | Productivity |
| Delivery, installation, operation, and maintenance costs | |
| Energy costs, decommissioning costs during replacement, operational and life-cycle costs | |
| The management cost of system units that have become waste | |
| Method and safety of energy supply, type of energy, type of used fuel | |
| Rate and unit price of energy and water consumption | |
| Primary energy saving, energy transmission loss | |
| Power generation method, utilization of generated heat | |
| The life cycle of thermal engineering units, downtime, amortization | |
| Property, work and fire protection, safety technology | |
| Building value, financing options, and innovation | |
| Environmental aspects | Reduction of energy and material resources |
| Lifetime and life cycle of the building | |
| Emissions, carbon footprint, environmental impact categories, and reduction | |
| Primary energy savings | |
| Inspection and control of heat engineering units and utilities | |
| Indoor air quality, thermal comfort | |
| Environmental building assessment system, building environmental performance | |
| Environmental impact of installation, use, and end-of-life stages | |
| Use of low-carbon, renewable technologies | |
| Polluting substances, type of waste, amount, and treatment method | |
| Energetic aspects | Method of energy supply and heating system |
| Energy/primary energy consumption and savings | |
| Percentage of use of renewable and fossil energy sources | |
| Building technical systems, system design | |
| Building energy requirements | |
| Energy efficiency and its improvement, energy efficiency measures, and certificates | |
| Energy transmission loss | |
| Peak winter heating performance and reduction | |
| Off-peak heating performance and its increase | |
| Application of storage tanks and temperature control | |
| Reduction of the mass flow of primary district heating water | |
| Utilization and recovery rate of heat generated during electricity and energy production | |
| Energy and waste heat utilization technology from the treatment of units that have become waste | |
| Type and efficiency of thermal energy storage techniques | |
| Building energy performance | |
| Building qualification and certification system |
| Environmental impact quantities (CML 2016) |
System 1 (electric heat pump) |
System 2 (gas boiler) |
System 3 (absorption heat pump) |
|---|---|---|---|
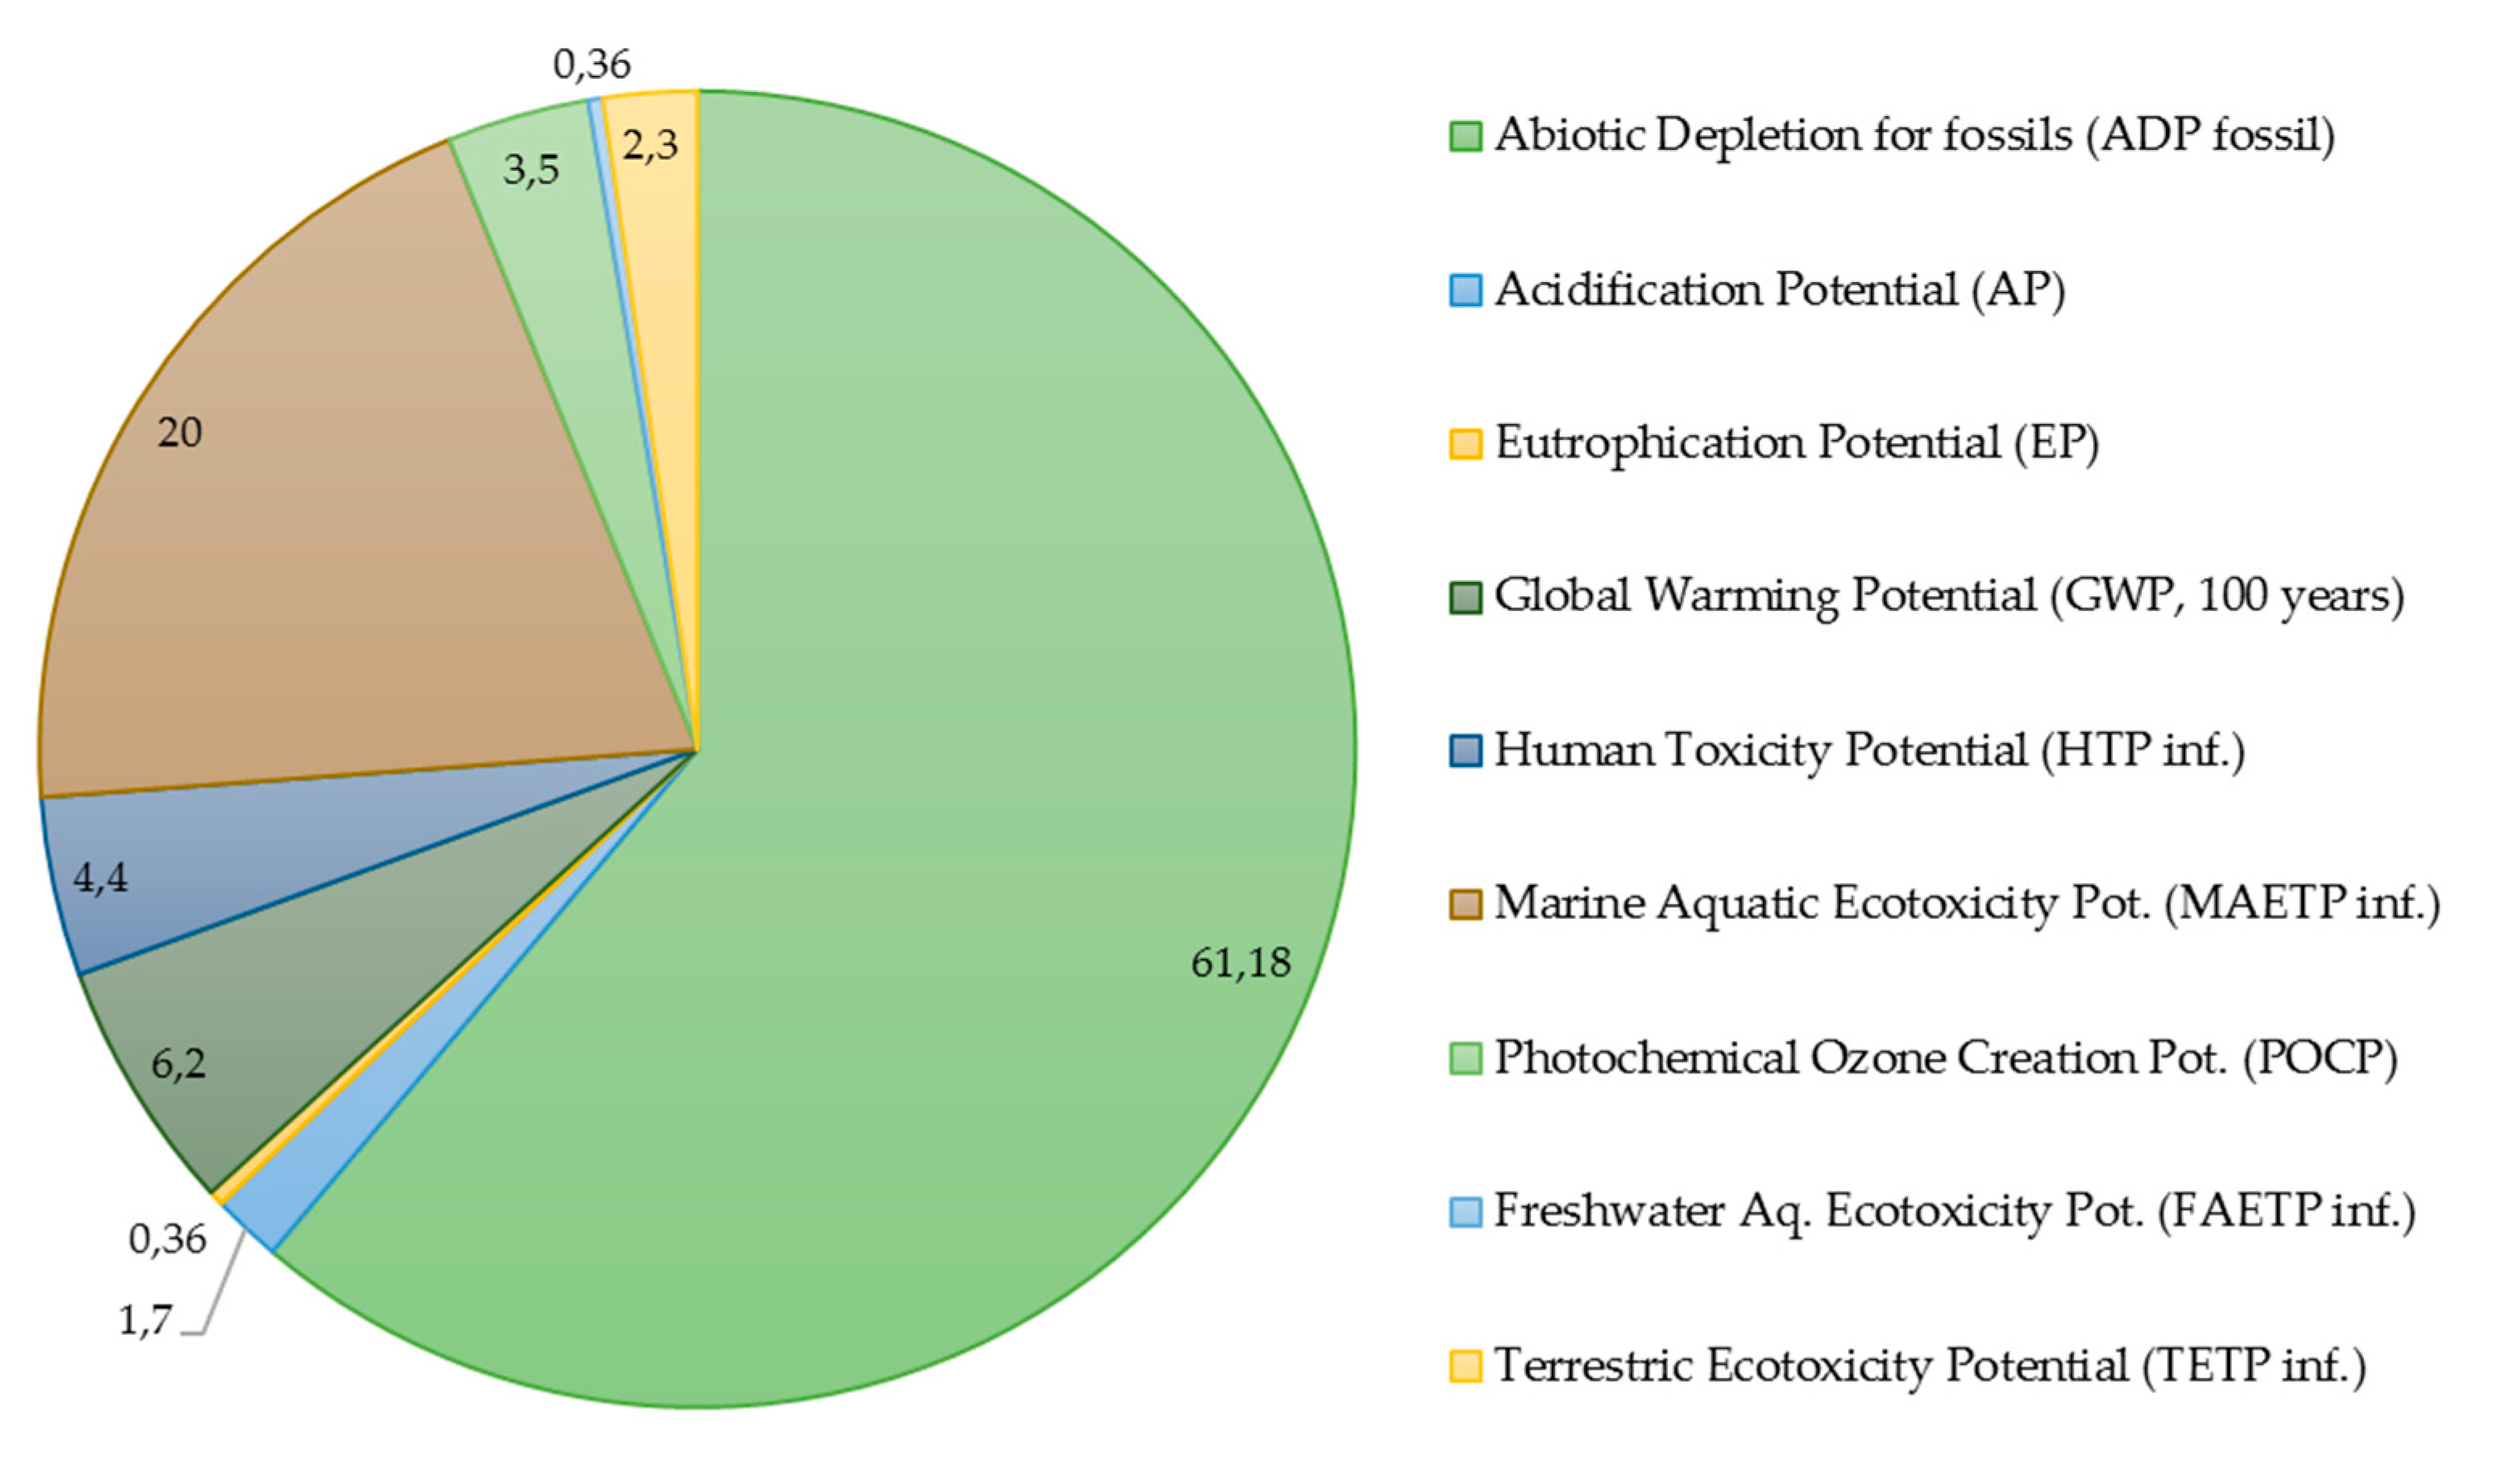
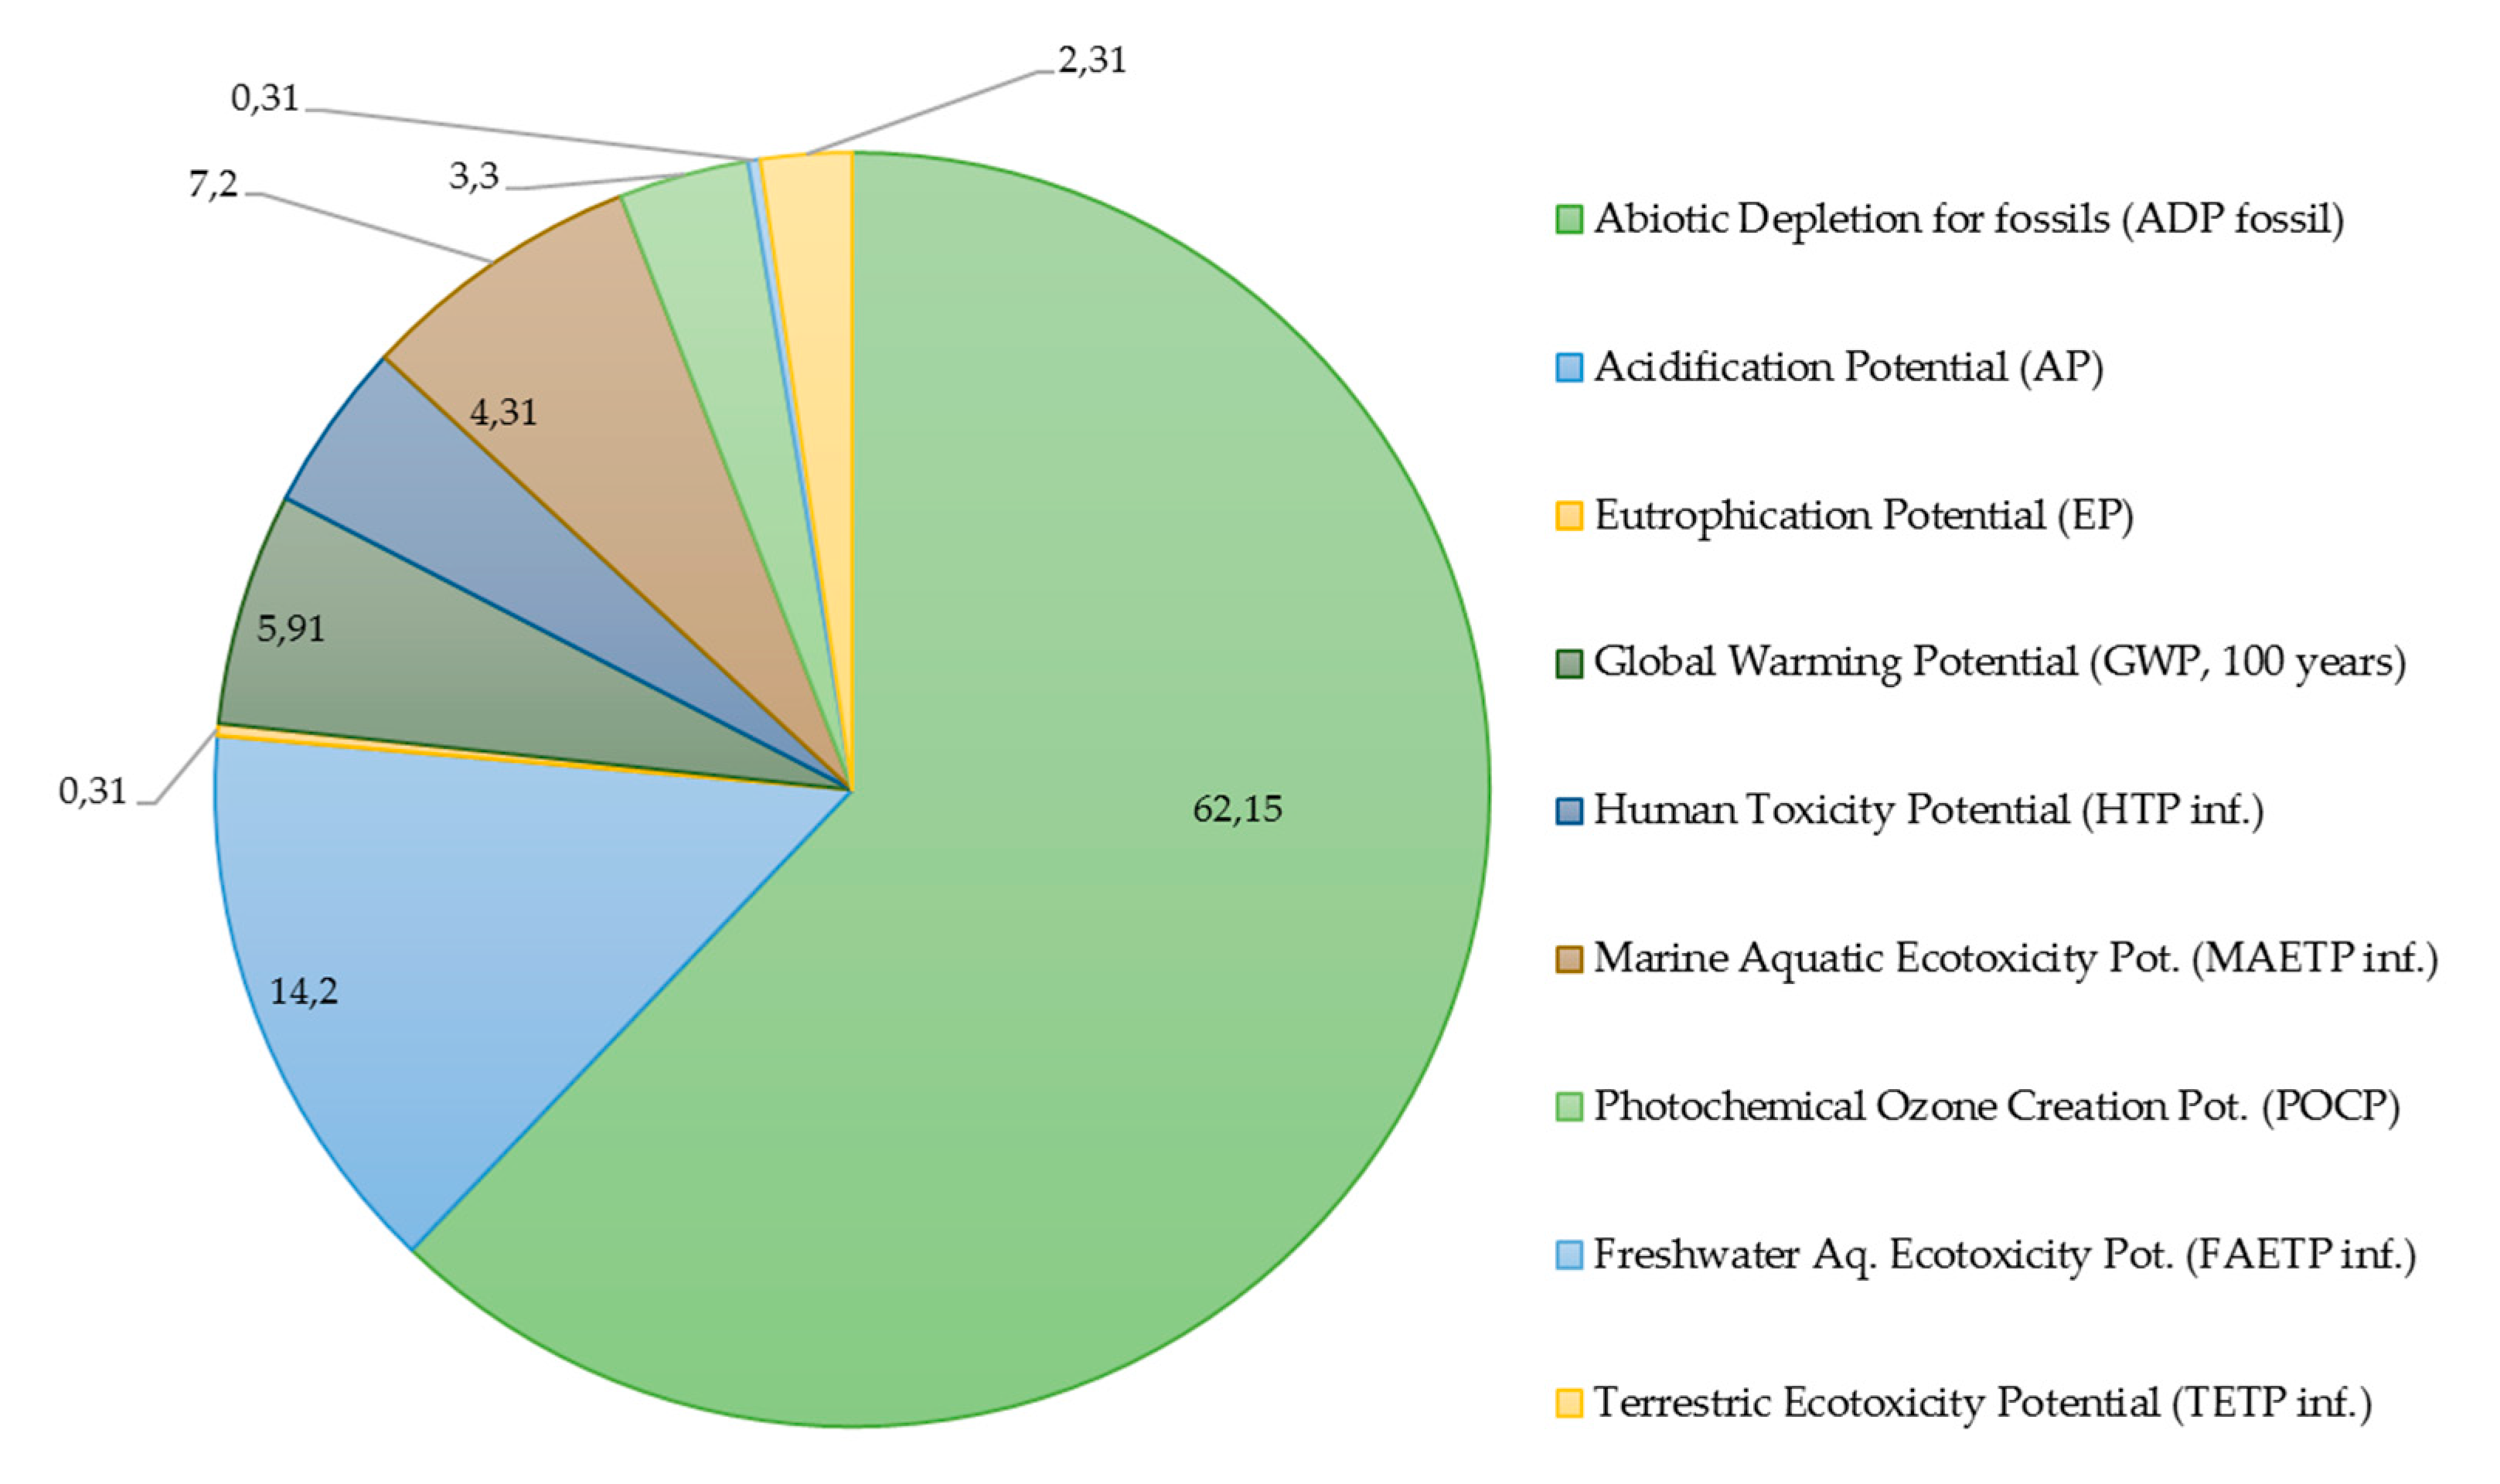
| Abiotic Depletion ADP fossils | 0.09 | 88.20 | 47.4 |
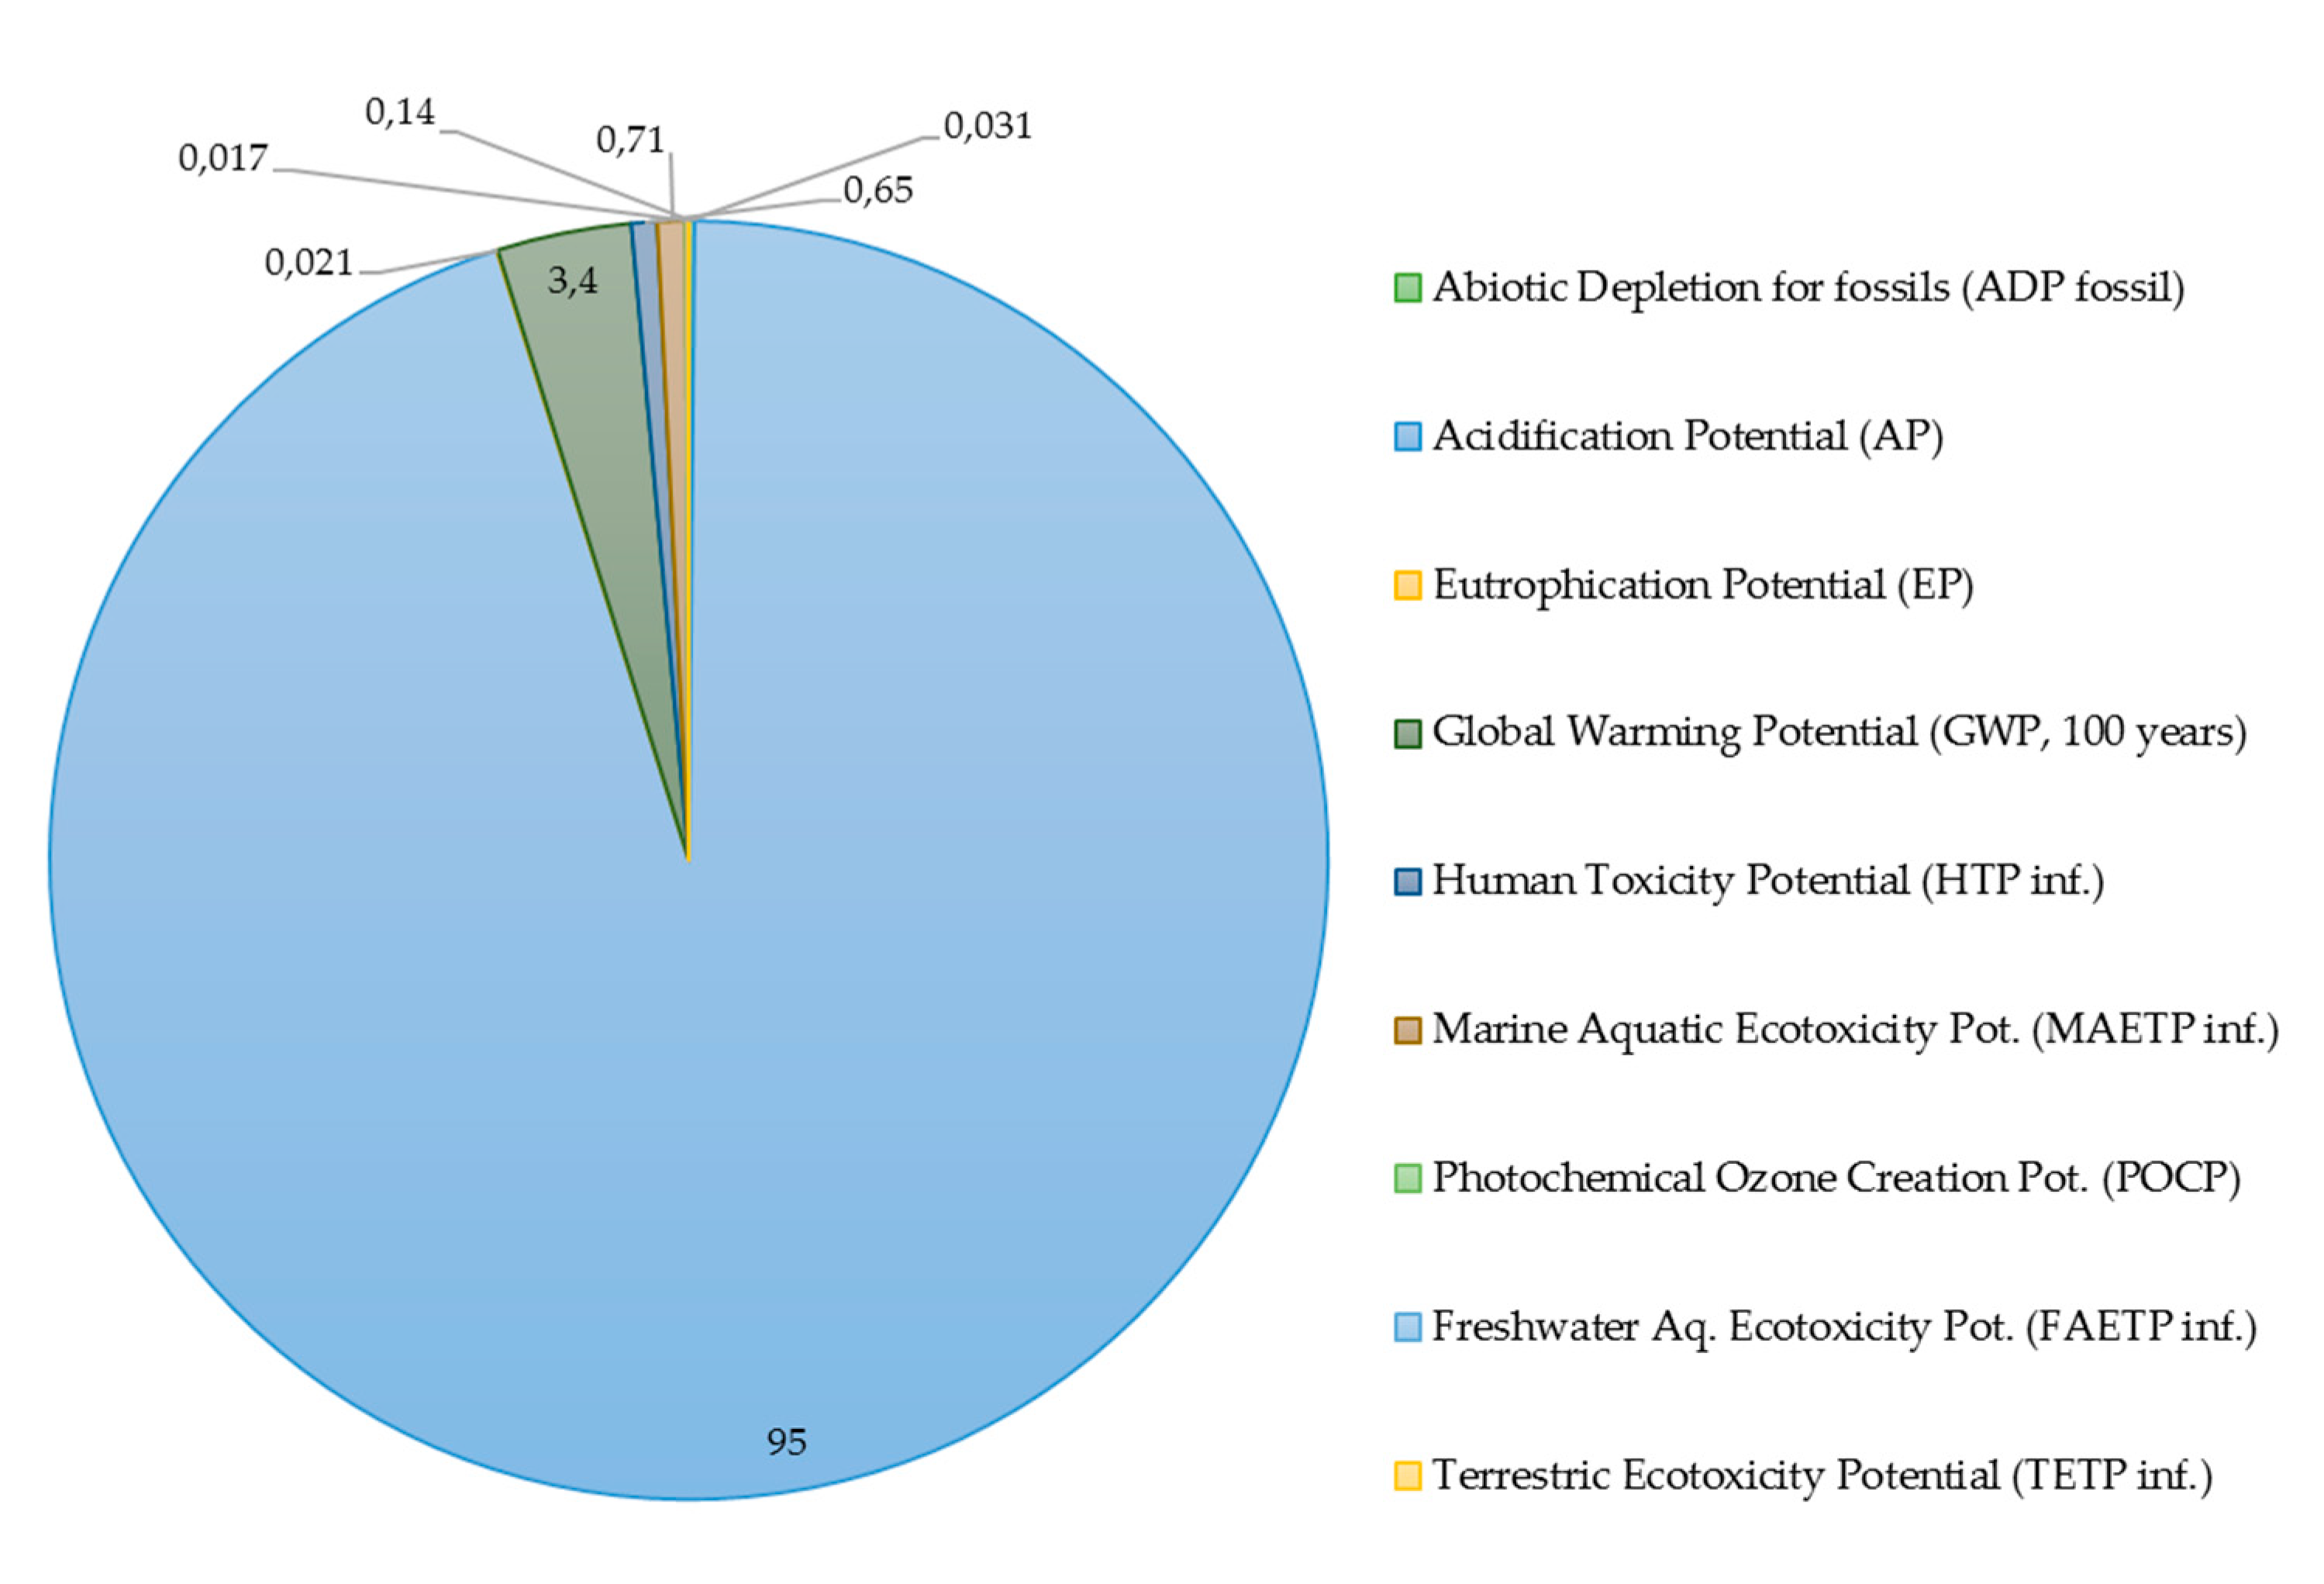
| Acidification Potential AP | 62.90 | 2.41 | 11.0 |
| Eutrophication Potential EP | 0.01 | 0.516 | 0.24 |
| Global Warming Pot. GWP 100 years | 2.28 | 9.0 | 4.55 |
| Human Toxicity Potential HTP inf. | 0.46 | 6.38 | 3.32 |
| Marine A. Ecotox. Pot. MAETP inf. | 0.47 | 28.9 | 5.54 |
| Photochem. Ozone Creat. Pot. POCP | 0.02 | 5.11 | 2.57 |
| Terrestric Ecotoxicity Pot. TETP inf. | 0.02 | 3.36 | 1.80 |
| Environmental impact quantities (ReCiPe 2016) |
System 1 | System 2 | System 3 |
|---|---|---|---|
| Climate change human health (default) | 0.0508 | 0.216 | 0.11 |
| Fossil depletion | 0.00423 | 3.6 | 1.95 |
| Human toxicity (cancer) | 0.0148 | 0.0159 | 0.0813 |
|
Environmental impact quantities (EF 3.0) |
System 1 | System 2 | System 3 |
| Climate change - total | 0.00352 | 0.0151 | 0.00767 |
| Land Use | 1.92E-006 | 6.67E-006 | 5.56E-006 |
| Particulate matter | 3.88E-005 | 1200E-005 | 585E-005 |
| Water use | 482E-005 | 3.09E-005 | 76.8E-005 |
| Primary energy quantities | System 1 | System 2 | System 3 |
|---|---|---|---|
| Primary energy demand from ren. and non-ren. resources (gross cal. value) | 341 | 552 | 343 |
| Primary energy demand from ren. and non-ren. resources (net cal. value) | 341 | 499 | 314 |
| Primary energy from non-renewable resources (gross cal. value) | 0.556 | 548 | 289 |
| Primary energy from non-renewable resources (net cal. value) | 0.52 | 496 | 260 |
| Primary energy from renewable resources (gross cal. value) | 341 | 3.56 | 54 |
| Primary energy from renewable resources (net cal. value) | 341 | 3.56 | 54 |
| Resources and Emissions | System 1 | System 2 | System 3 |
|---|---|---|---|
| Energy resources | 0.0142 | 11.3 | 5.93 |
| Material resources | 173 | 1240 | 183 |
| Emissions to air | 153 | 29.5 | 28.5 |
| Emissions to fresh water | 17.9 | 1500 | 145 |
| Emissions to sea water | 0.041 | 1.02 | 0.535 |
Disclaimer/Publisher’s Note: The statements, opinions and data contained in all publications are solely those of the individual author(s) and contributor(s) and not of MDPI and/or the editor(s). MDPI and/or the editor(s) disclaim responsibility for any injury to people or property resulting from any ideas, methods, instructions or products referred to in the content. |
© 2023 by the authors. Licensee MDPI, Basel, Switzerland. This article is an open access article distributed under the terms and conditions of the Creative Commons Attribution (CC BY) license (http://creativecommons.org/licenses/by/4.0/).


