Submitted:
11 September 2023
Posted:
13 September 2023
You are already at the latest version
Abstract

Keywords:
1. Introduction
2. Phenomenological Model for Creep Crack Growth
3. CCG in Grade 22 and Grade 91 Materials
3.1. CCG Behavior of Grade 22 Materials:
3.2. CCG Behavior of Grade 91 Materials
4. CFCG in Grade 22 and Grade 91 Steels
4.1. CFCG in Grade 22 Steel
4.2. CFCG in Grade 91 Steel
5. Recommendations for Future Work and Conclusions
- Conduct a round-robin study of CCGR and C-FCGR testing consisting of several laboratories and using well-established cavitation resistant material with well documented creep deformation behavior, tensile data, well characterized microstructure, documented chemistry including levels of trace elements that cause embrittlement, and cyclic stress-strain data. This will more definitively establish the expected levels of scatter in the data from experimental sources.
- A standard protocol should be established to report chemical composition and microstructure of the test material as part of testing. Principles of quantitative metallography and the capabilities of automated imaging equipment should be utilized fully to obtain statistically meaningful results.
- Changes to the ASTM standards for CCG and CFCG testing must be made to include results from the proposed study.
- Document a procedure for qualifying test equipment used by participants for testing prior to commencing the tests.
6. Summary and Conclusions
- A phenomenological model for rationalizing the effects of temperature and microstructural characteristics on the CCG and CFCG behavior of ferritic steels is proposed in this paper and was evaluated using extensive amounts of data gathered from the literature. The ability of the model to rationalize the effects of temperatures is clearly demonstrated in the paper. The model contains a characteristic microstructural parameter that can only be determined by quantitative microstructural evaluation of the test materials, typically not reported in CCG studies.
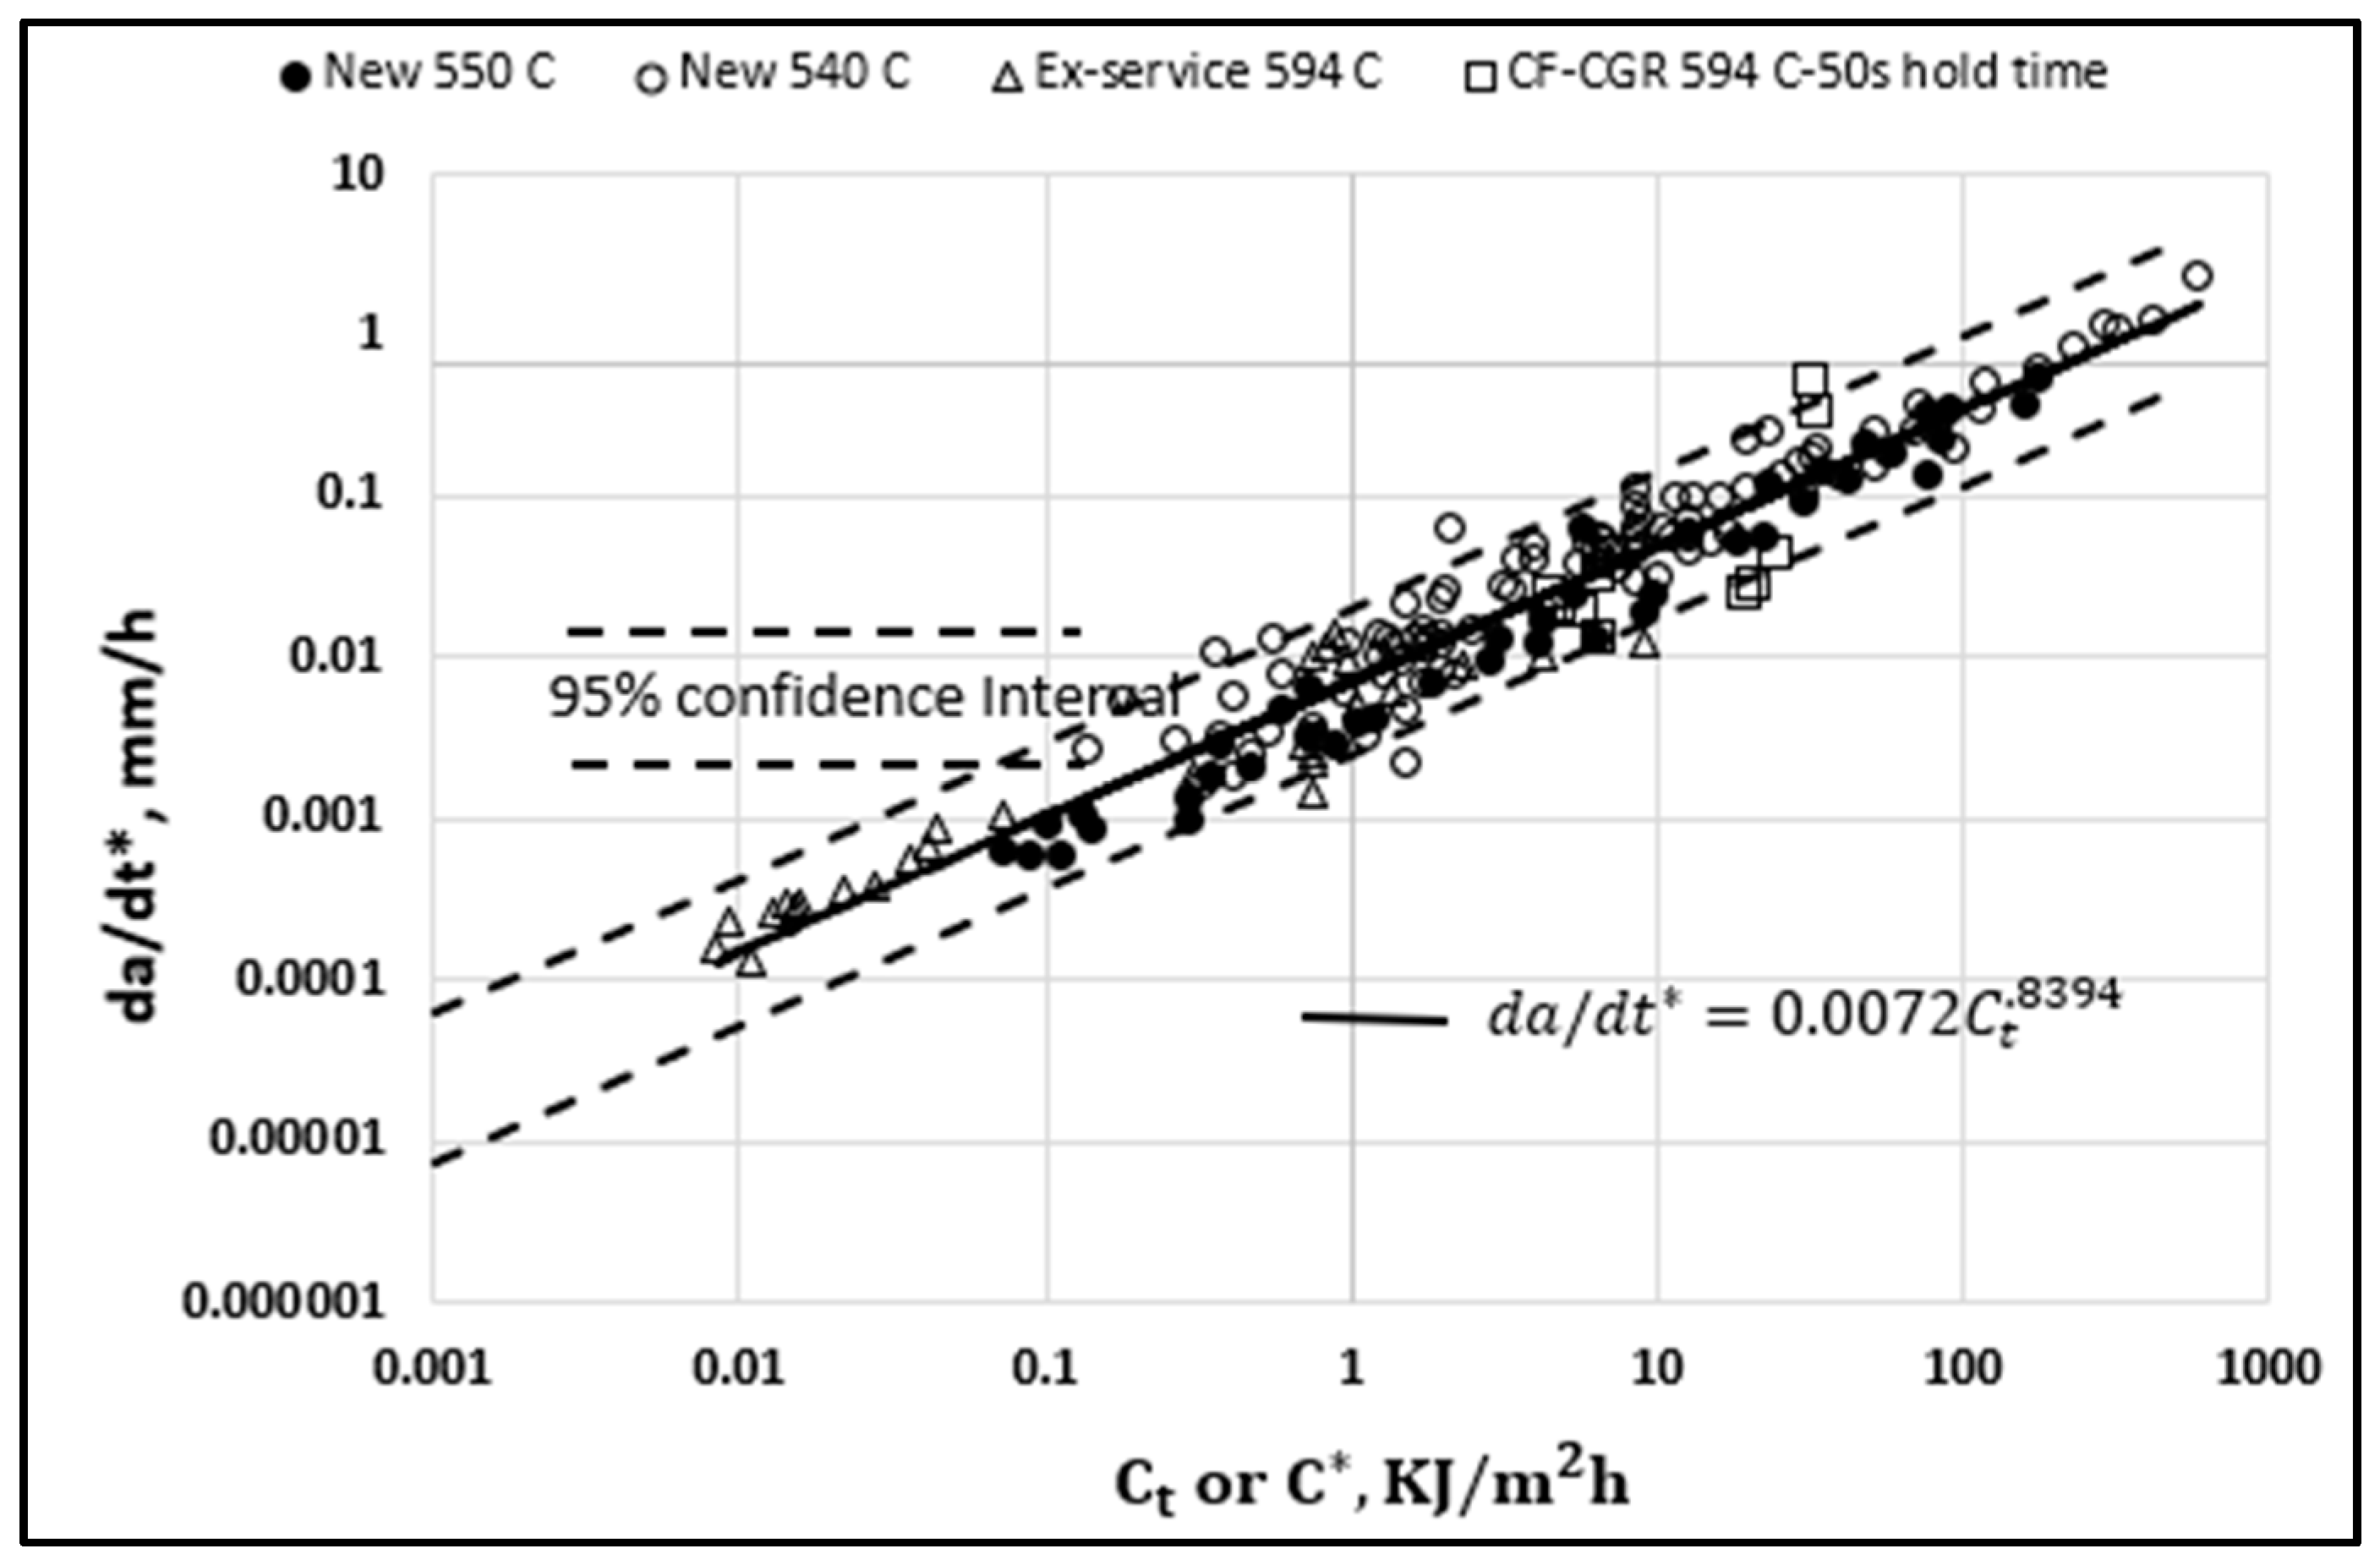
- Basemetal (BM) CCG and CFCG data for Grade 22 steels in new and ex-service materials in the temperature range of 538 to 594 0C were indistinguishable.
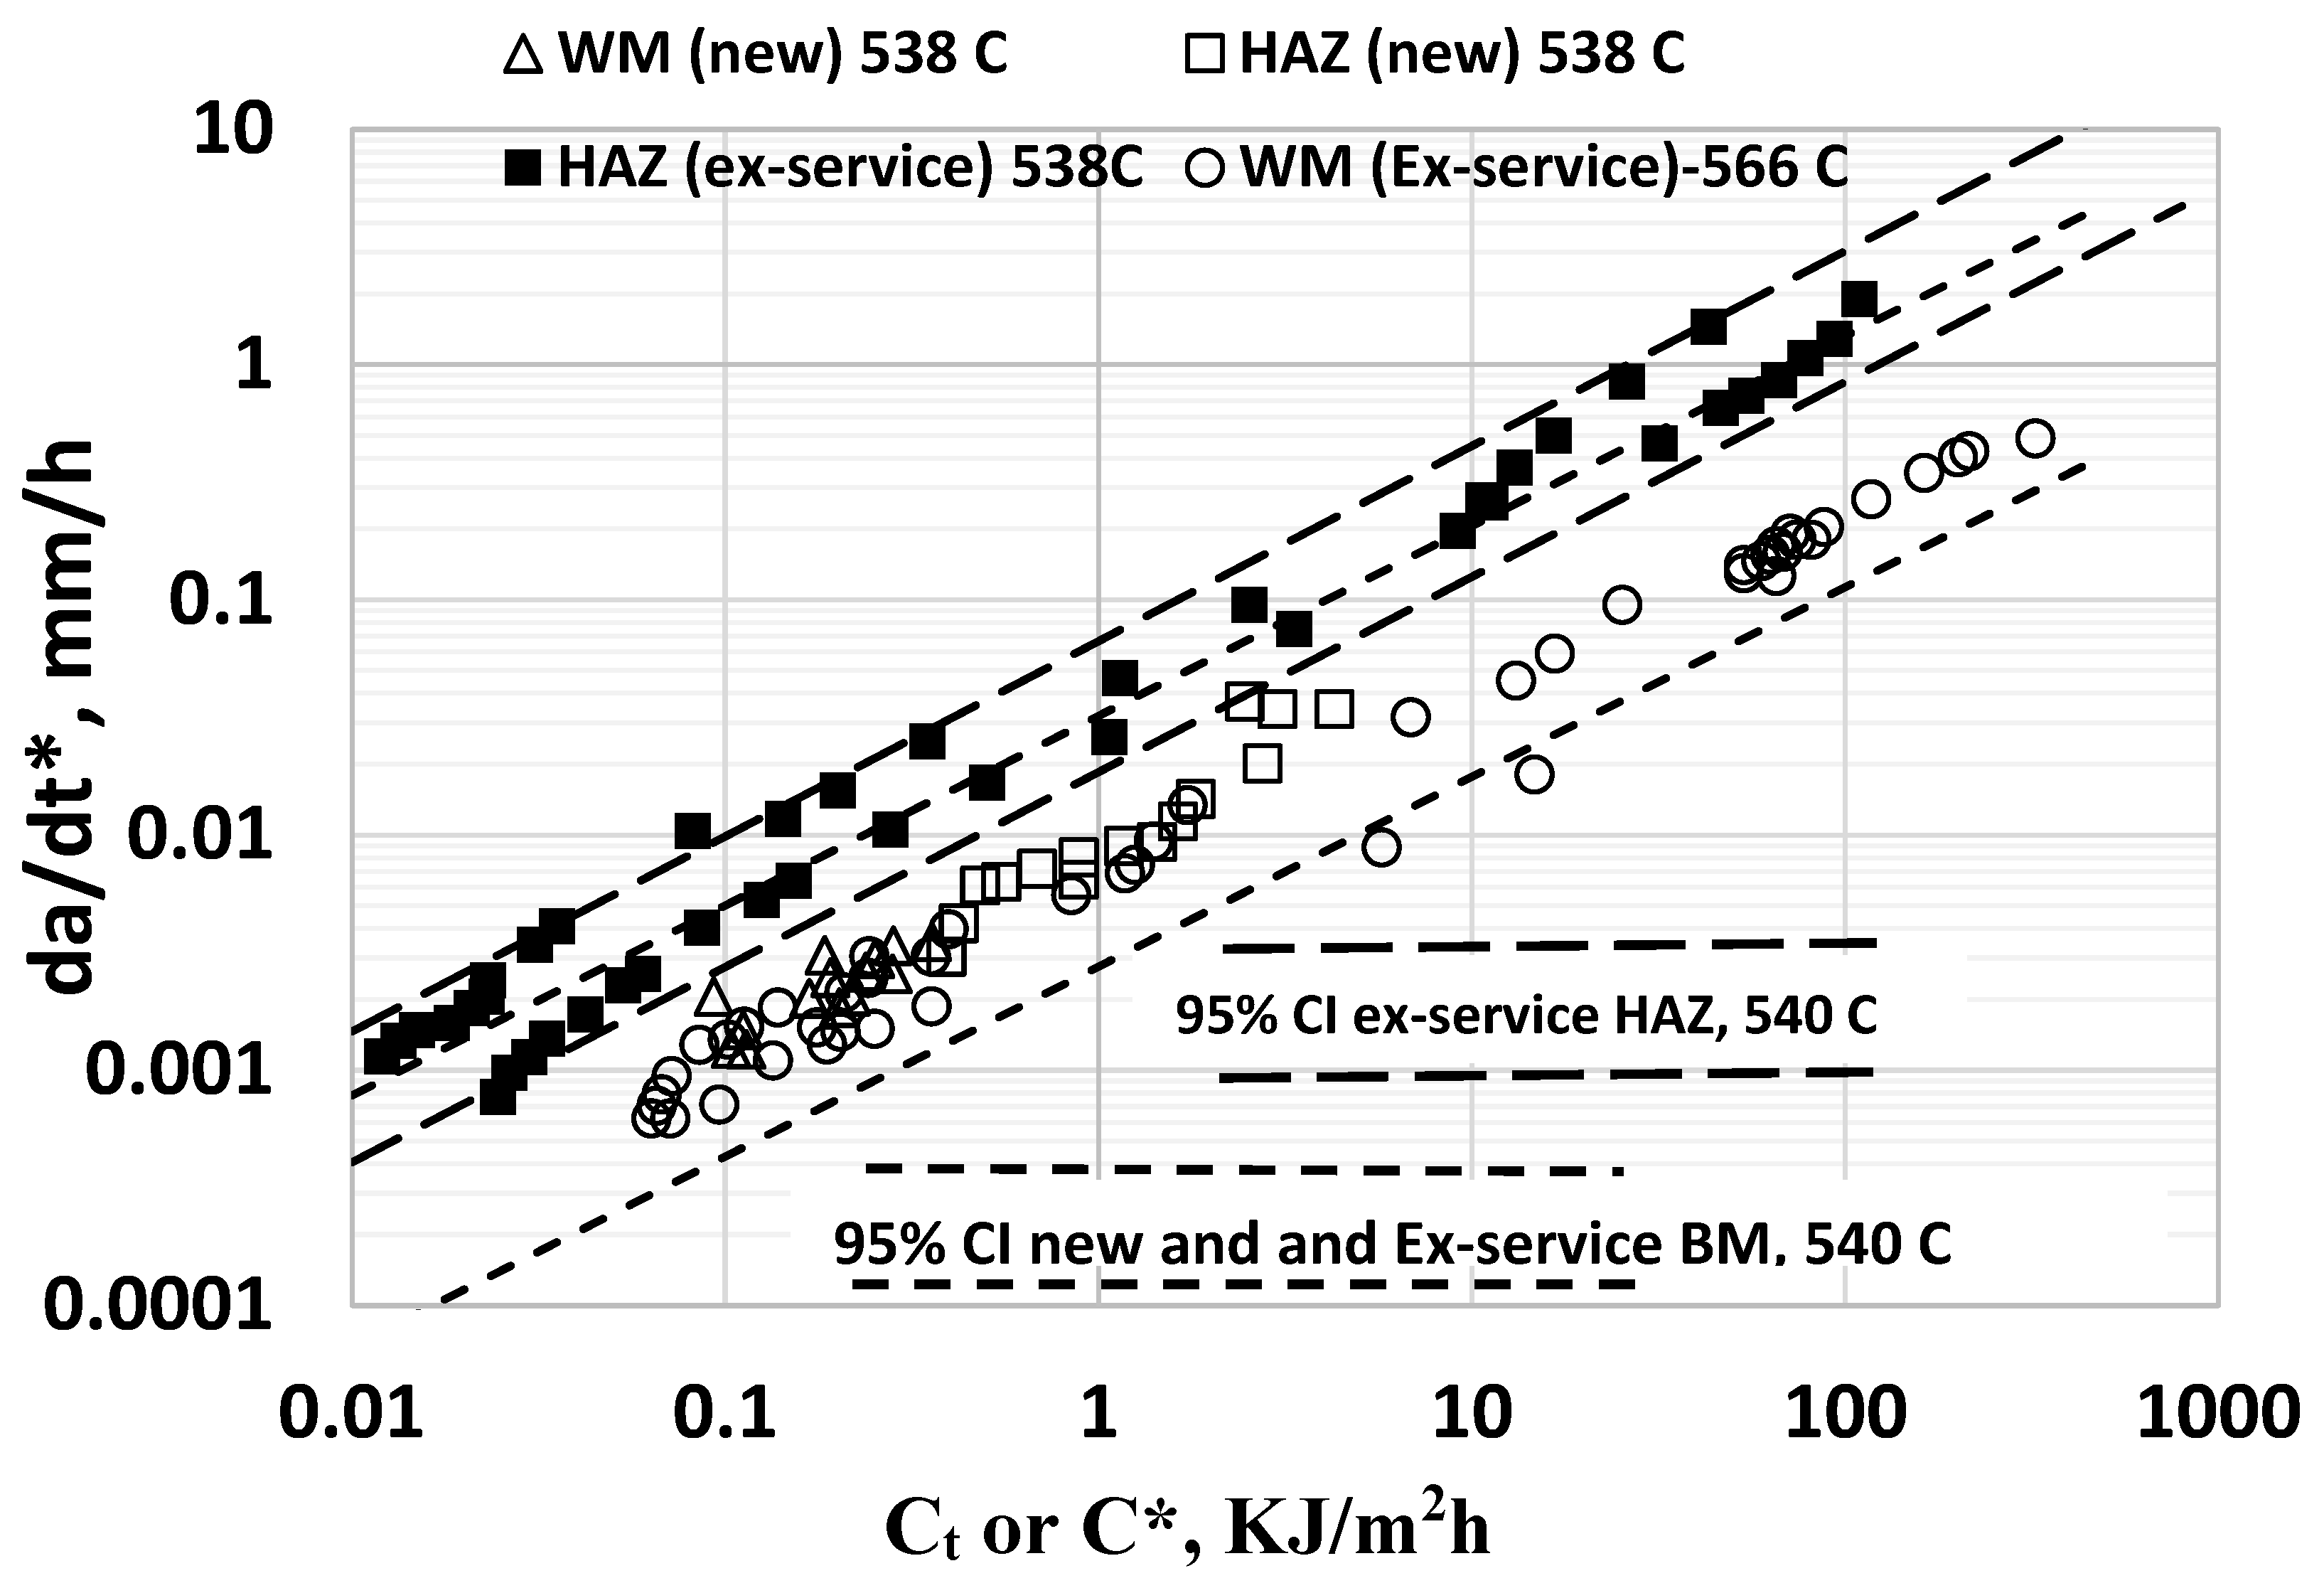
- The weldmetal (WM) CCG data for Grade 22 steels in new and ex-service conditions on average followed the same trend as the BM.
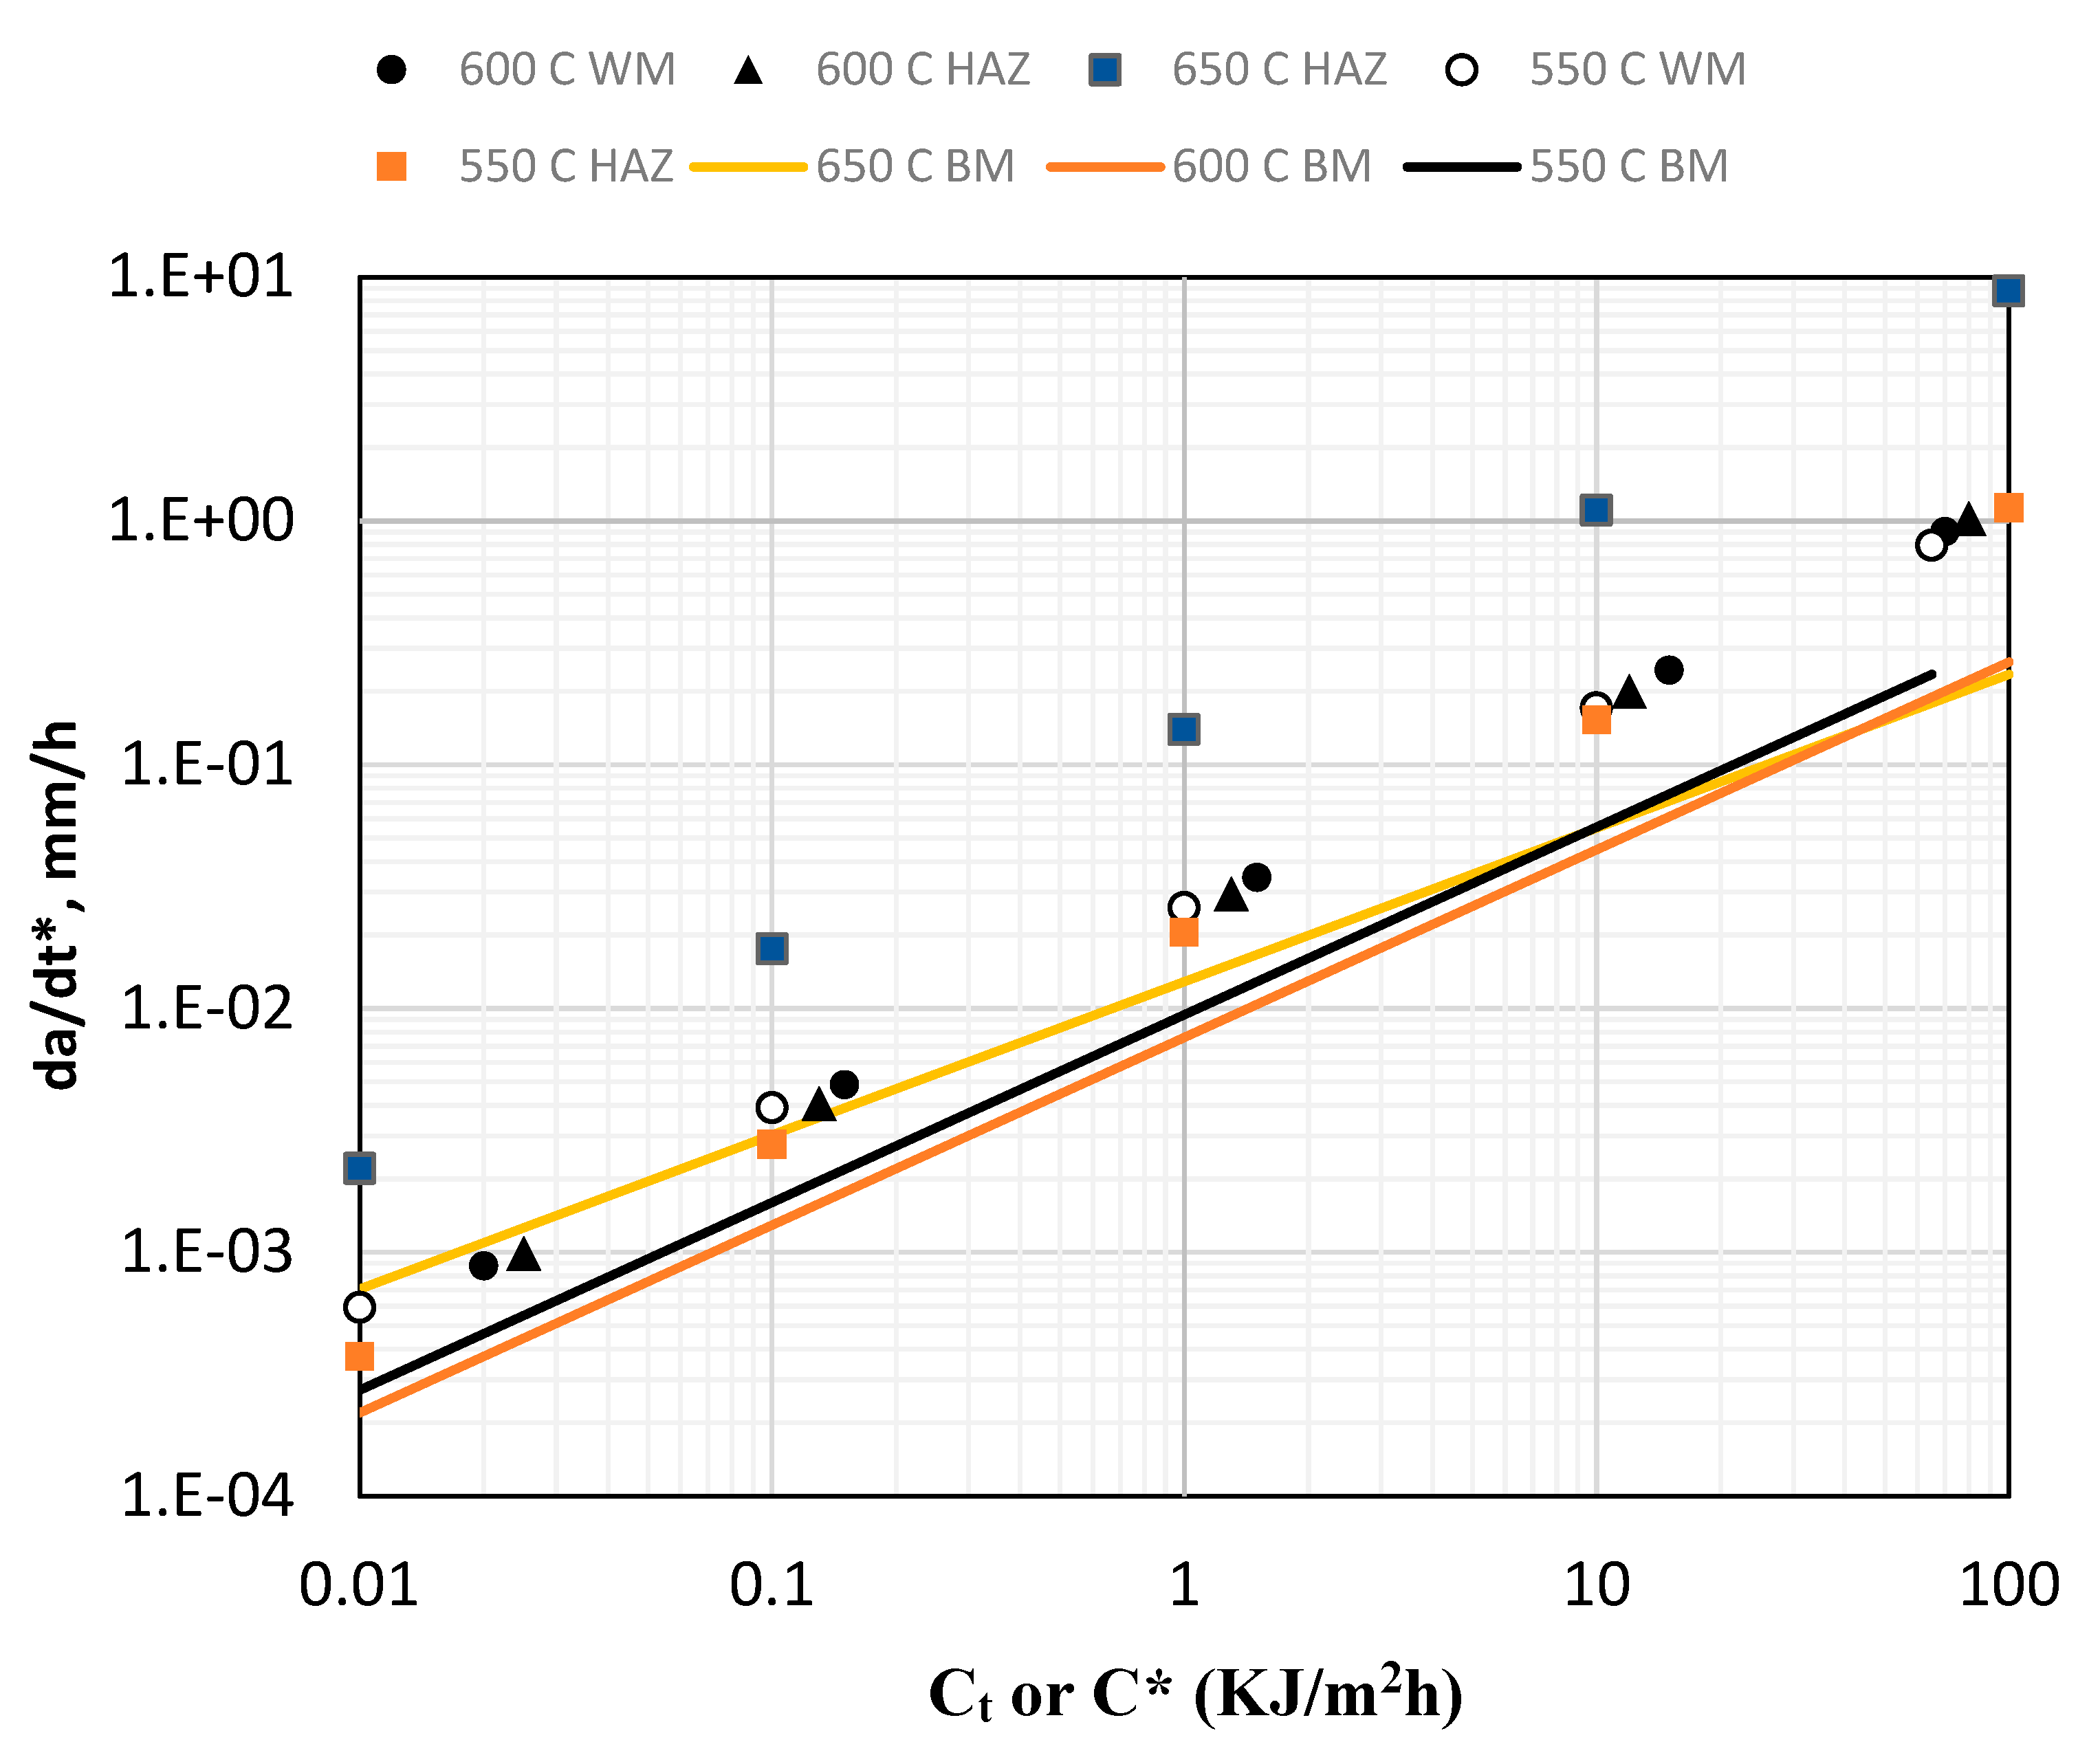
- CCG rates in the heat-affected zone (HAZ) region of Grade 22 materials are comparable to the CCG rates in BM and WM, but the CCG rates after service exposure were on average approximately four times higher.
- CFCG and CCG behaviors in Grade 22 steels were indistinguishable from each other.
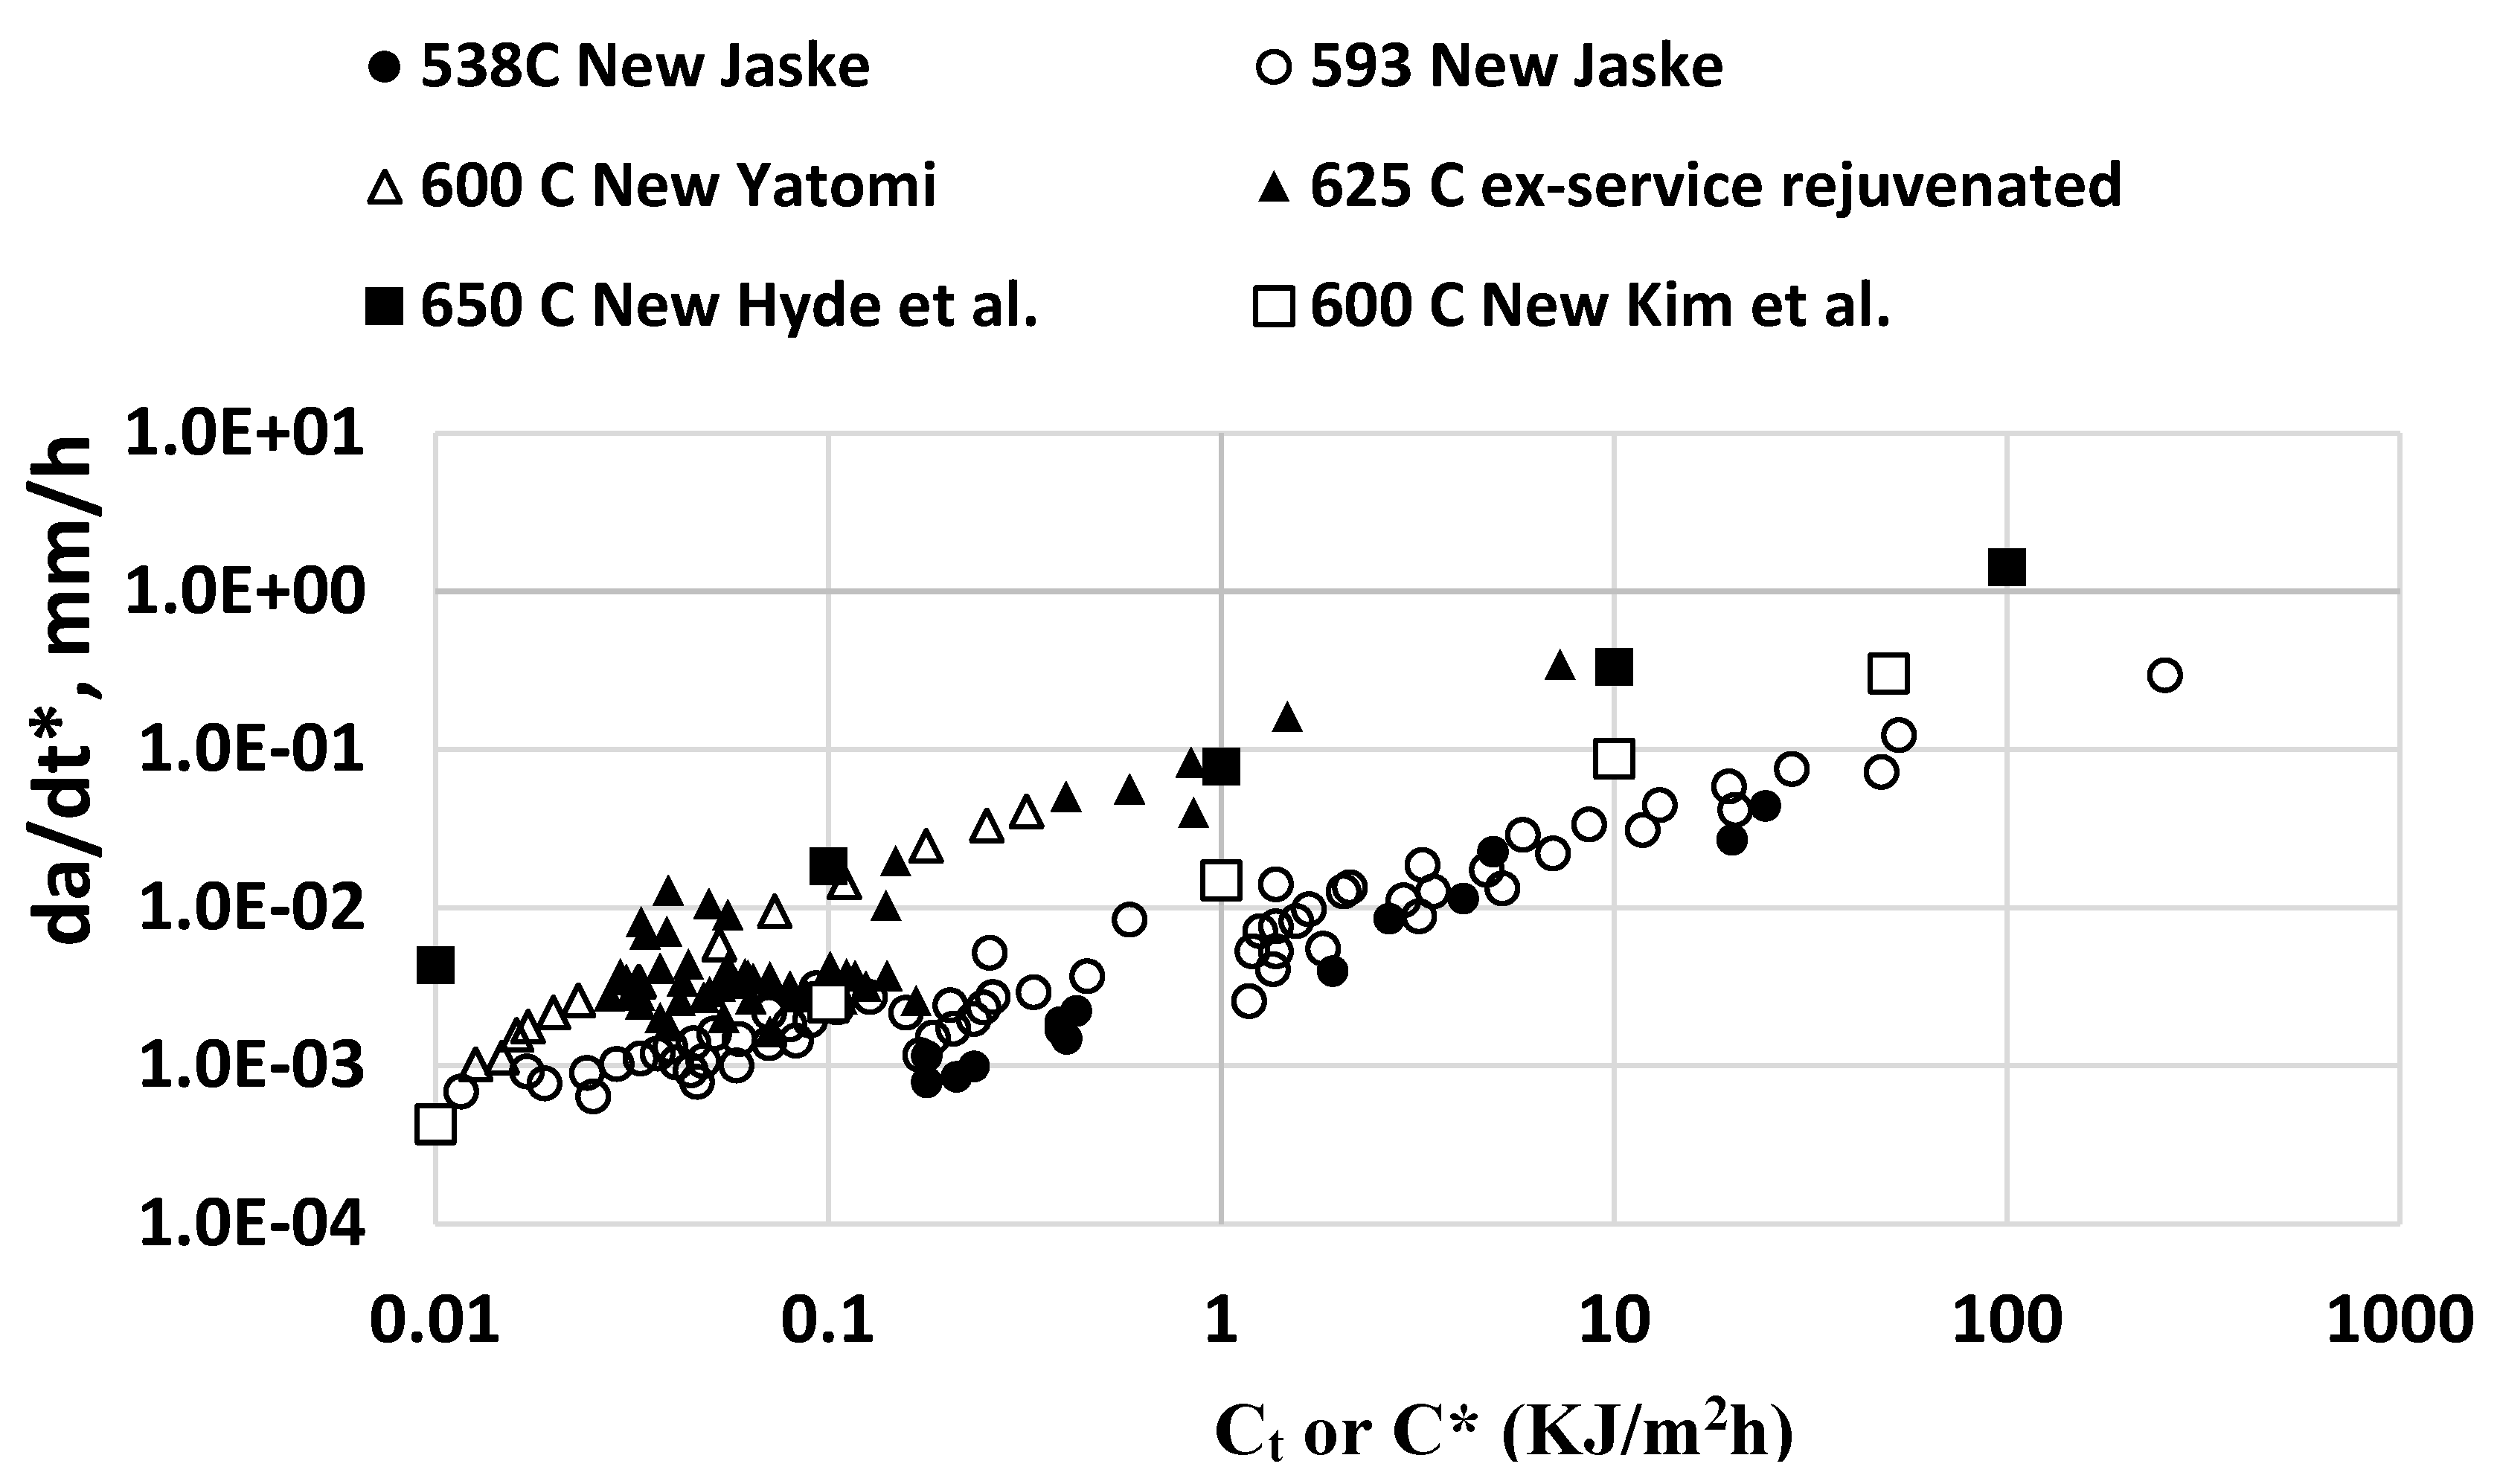
- Extensive amounts of BM CCG and CFCG data for new and rejuvenated ex-service Grade 91 steels in the temperature range of 538 0C to 650 0C are reported from the literature. The tests were conducted on four separate heats of material.
- The variability among the BM CCG behavior in Grade 91 steels was significantly higher than found in Grade 22 steels.
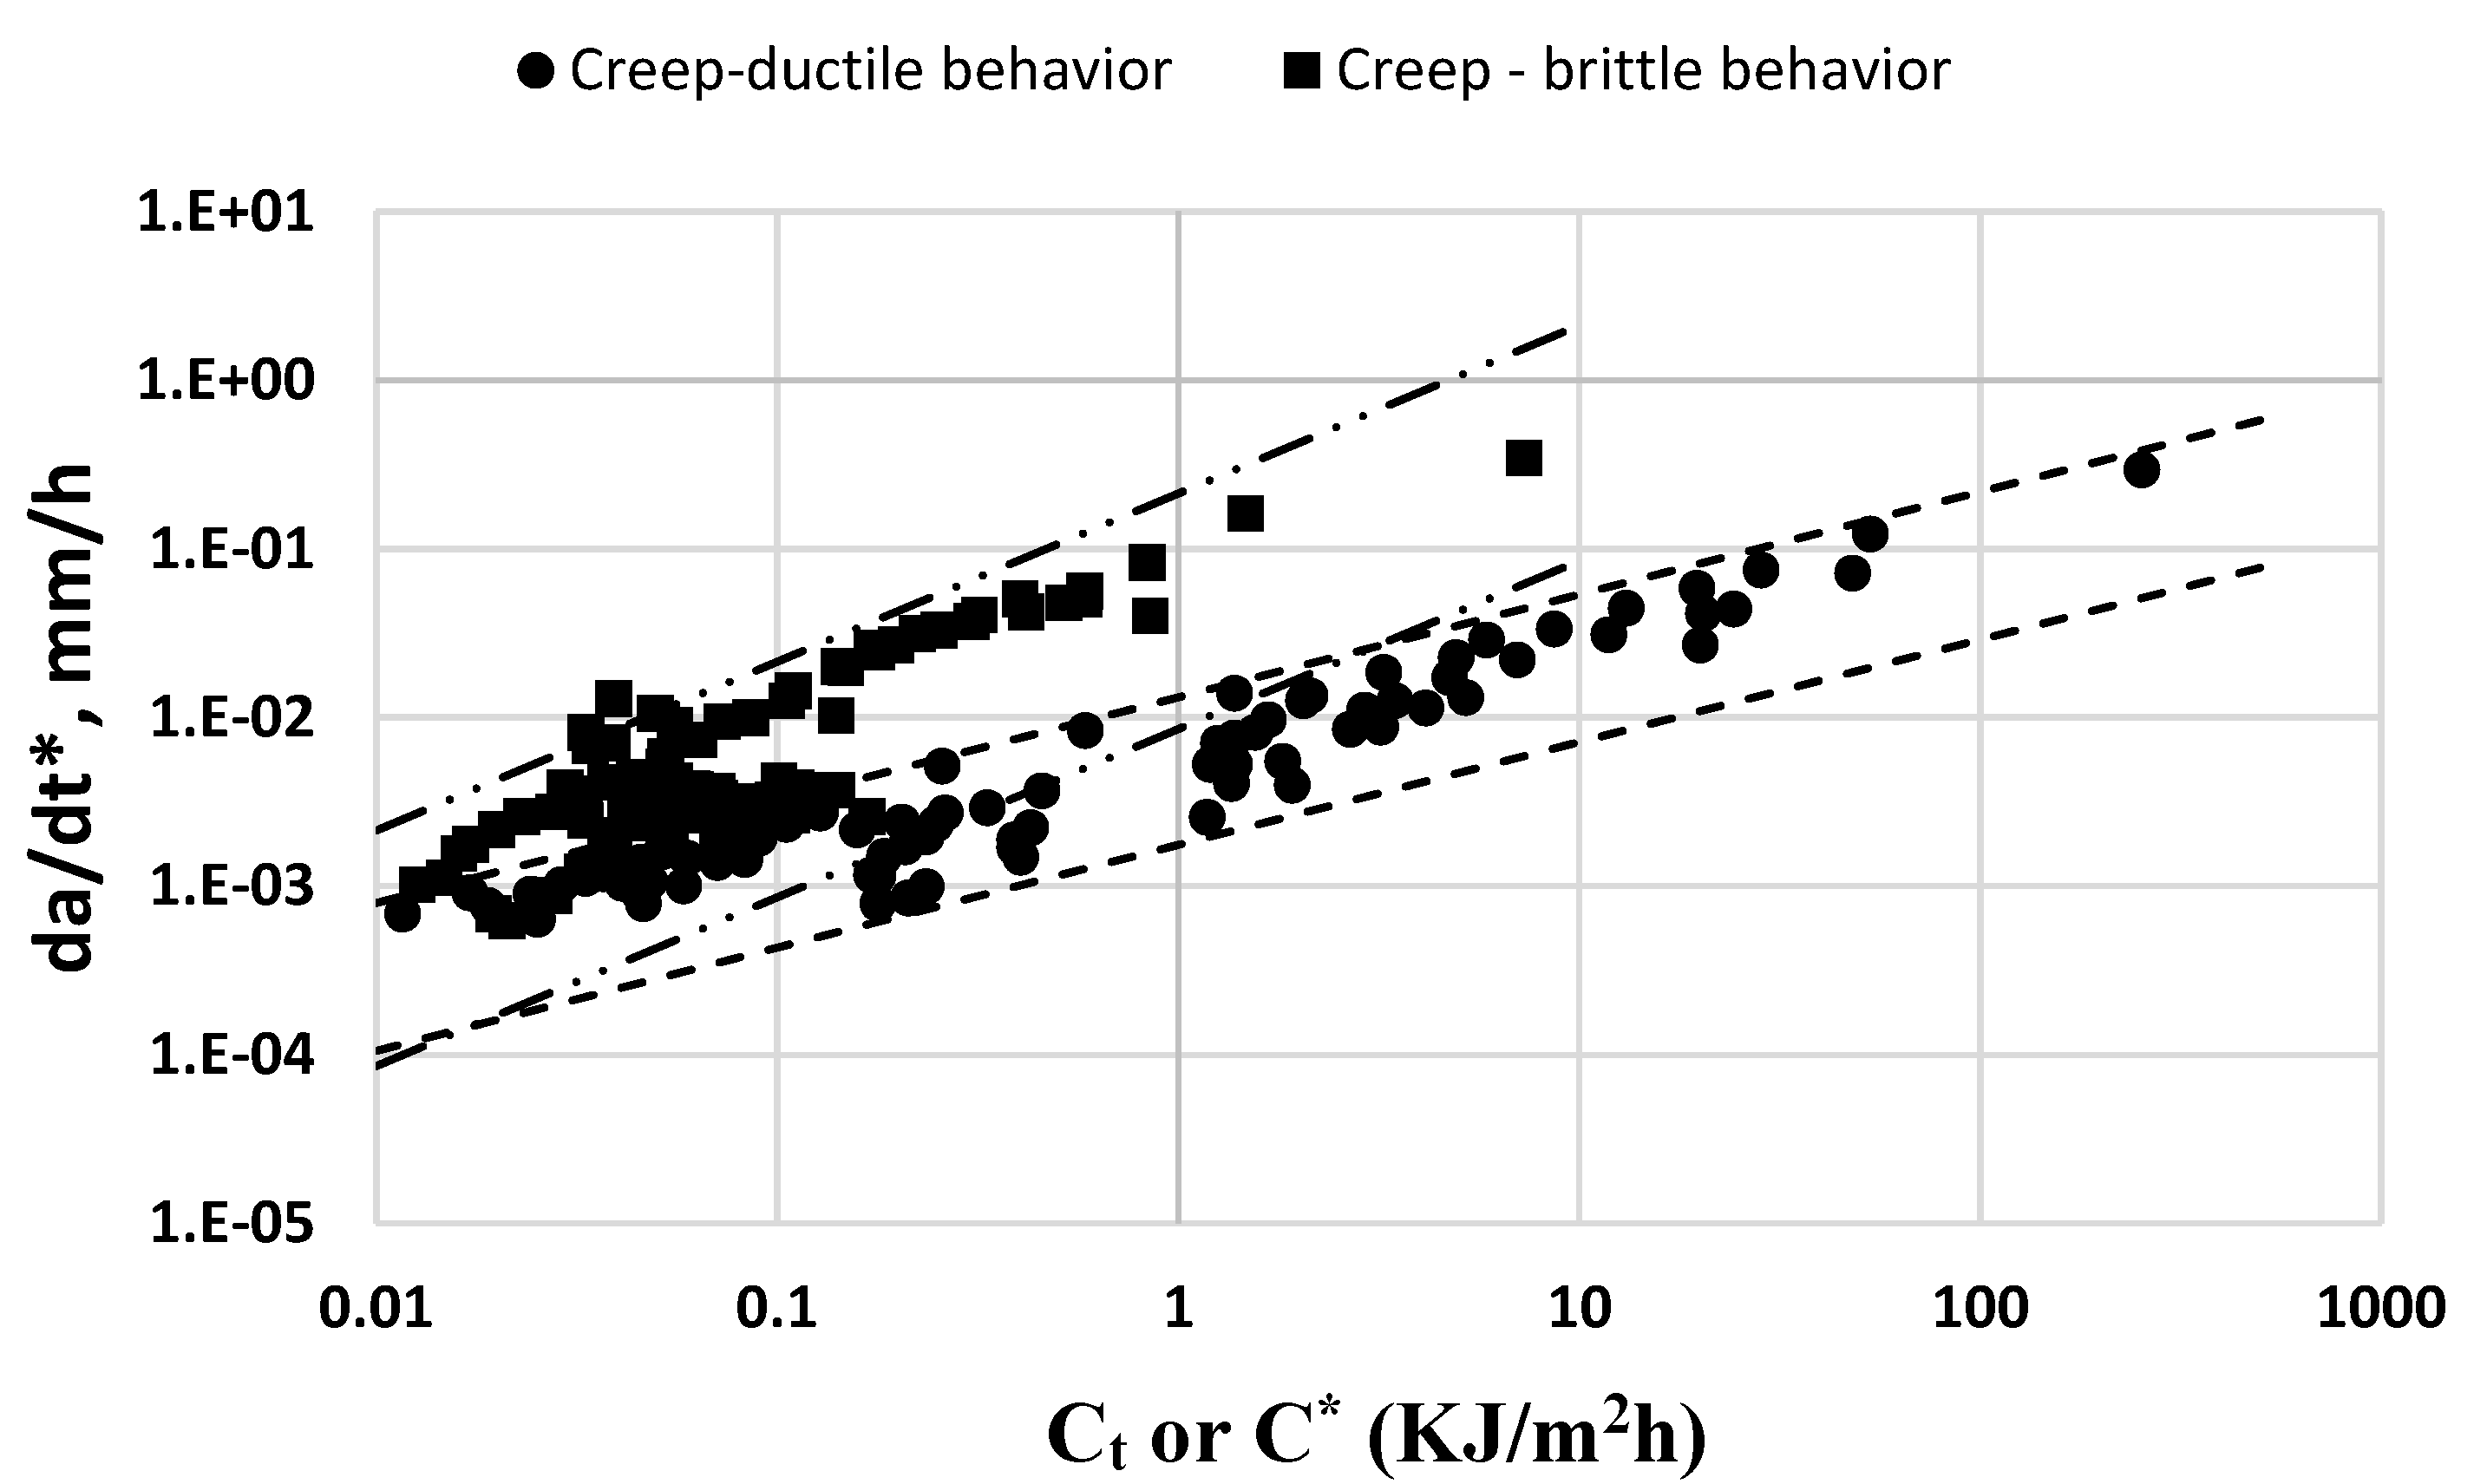
- It was observed that the CCG in the BM of Grade 91 steels at temperatures of 538 0C, 593 0C, and some at 600 and at 650 0C follow creep-ductile tendencies implying higher CCG resistance than those under creep-brittle behavior observed in some heats tested at 600 0C and 625 0C. It is hypothesized, based on results from a study conducted by Parker and Seifert [27], that subtle chemical compositions among the trace impurity elements cause creep-brittle tendencies. This strongly suggests the need for reporting the full chemistry including levels of trace elements as standard practice when reporting CCG and CFCG test results.
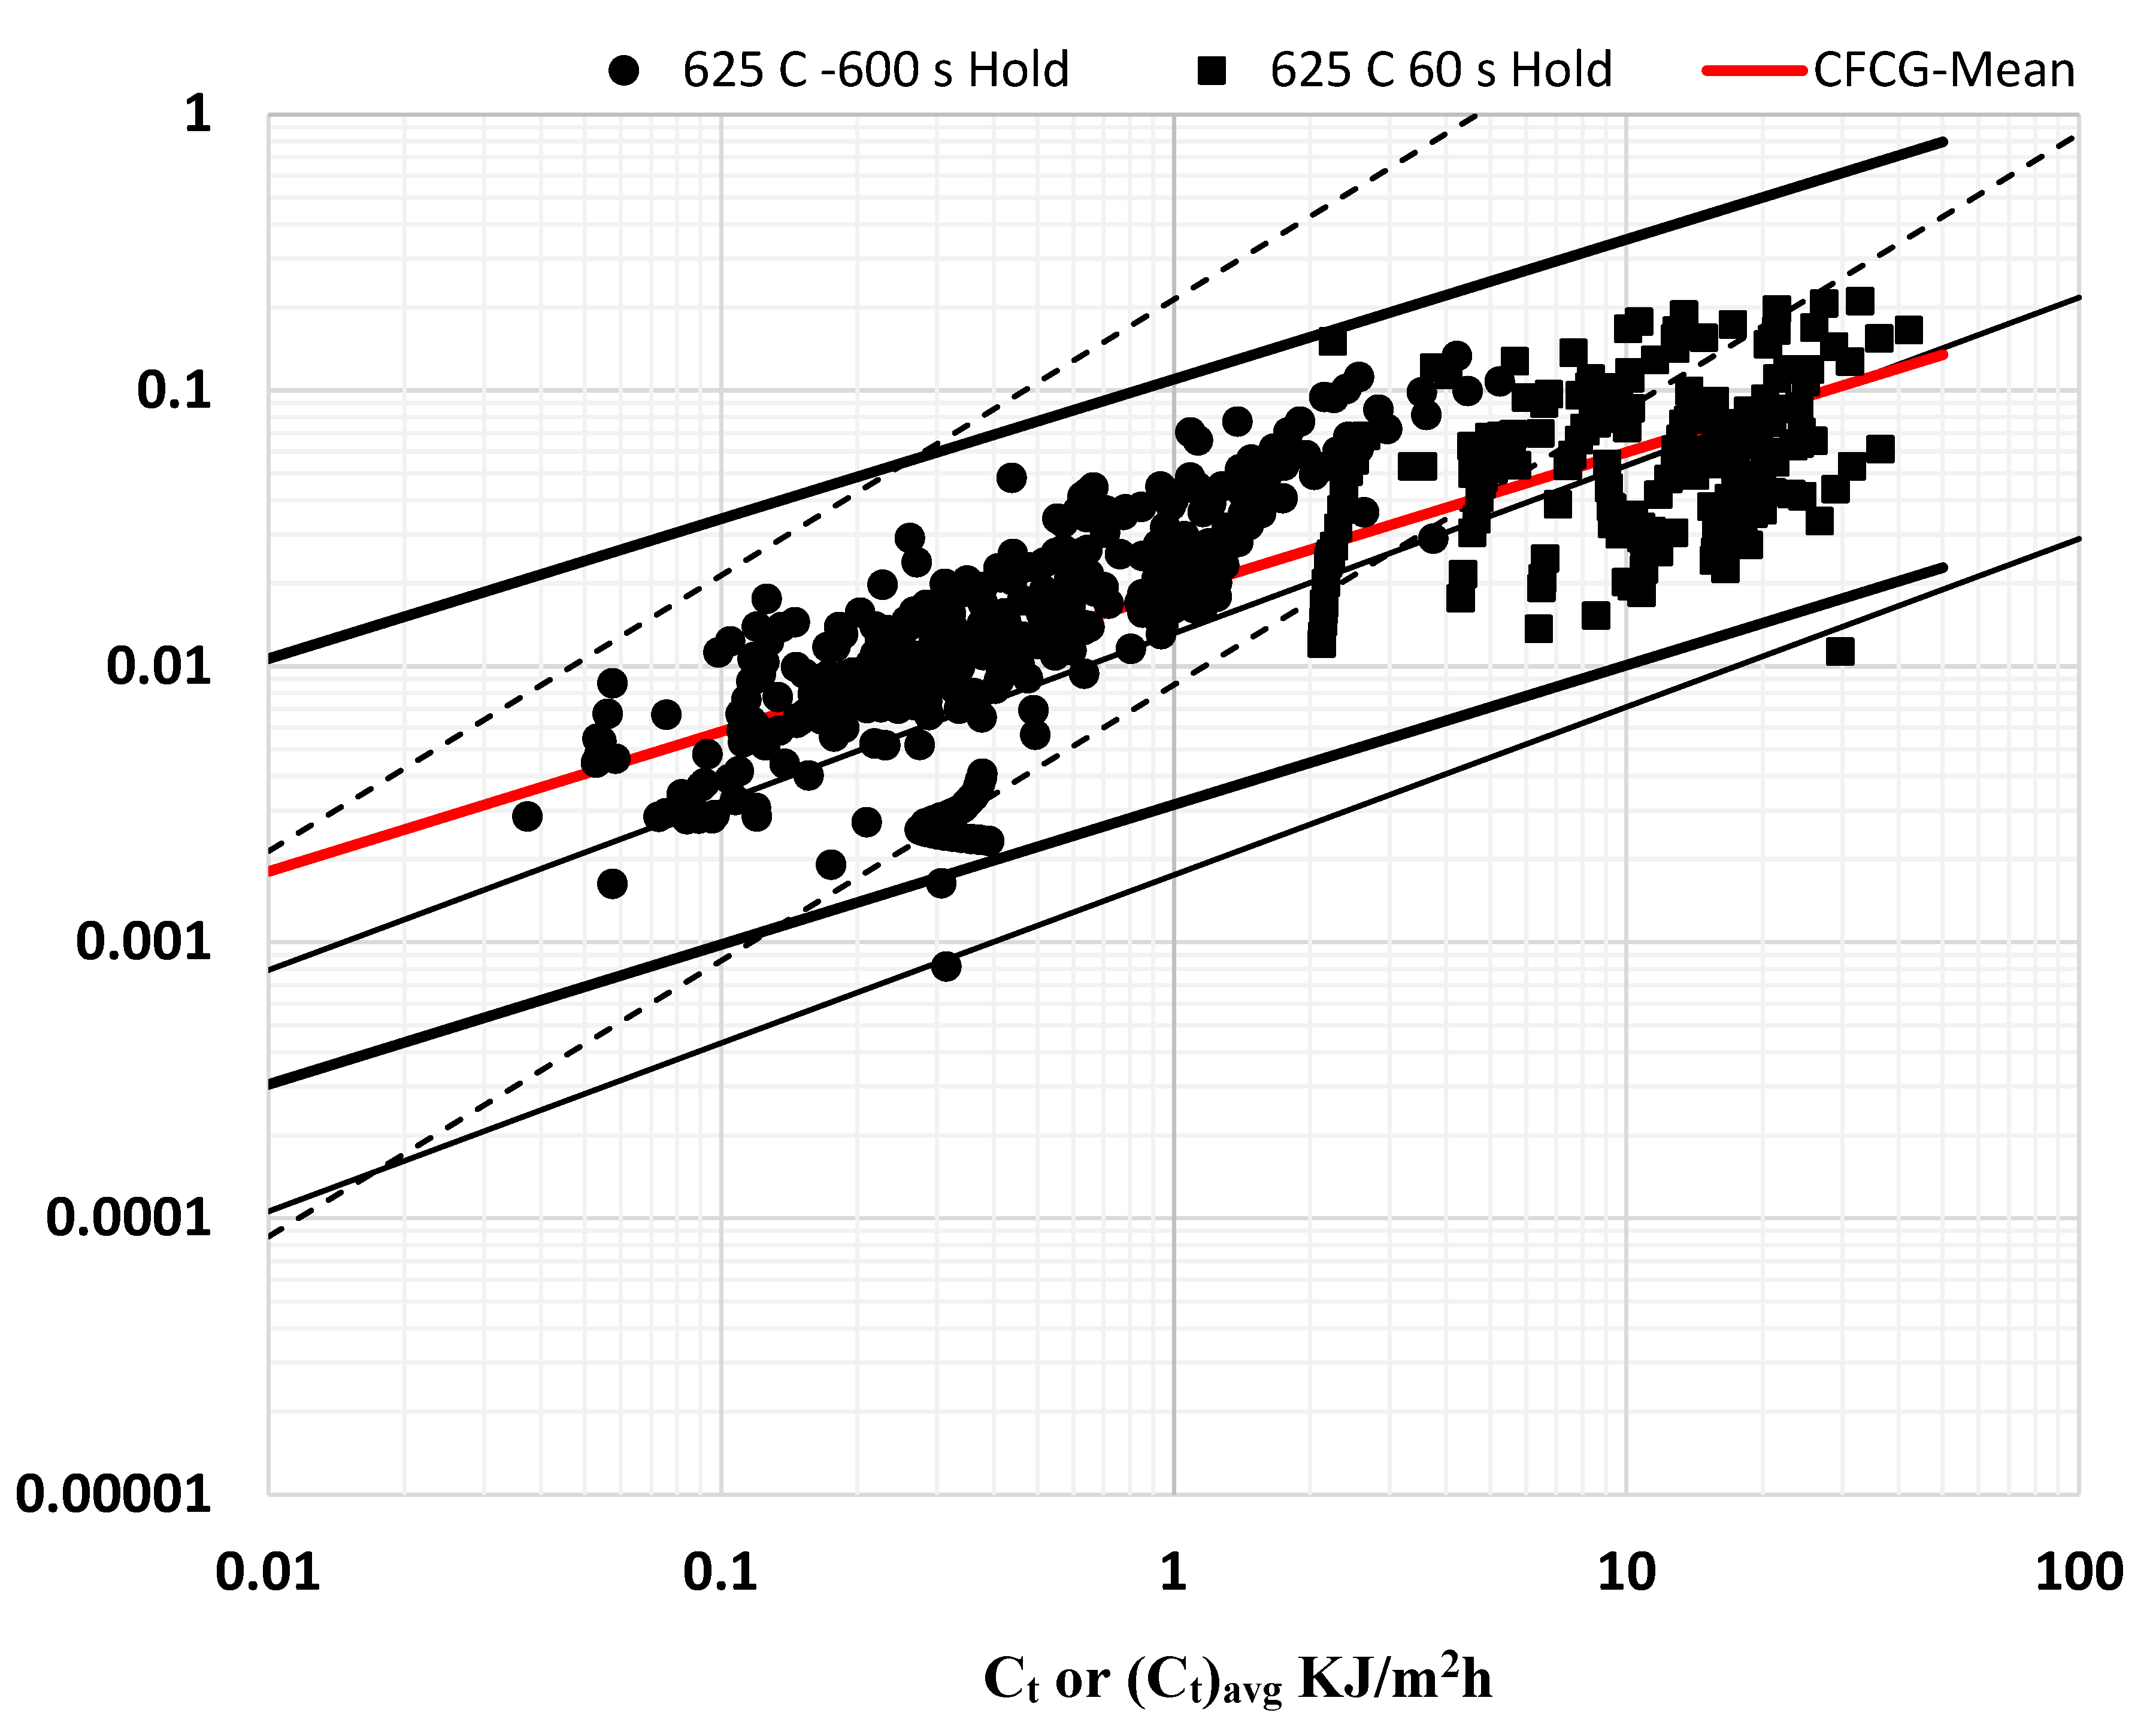
- CCG constants for Grade 22 and Grade 91 steels representing the mean, upper bound (UB), and lower bound (LB) trends were calculated and reported in the paper. For Grade 91, the constants were reported separately for creep-ductile and creep-brittle trends.
7. Acknowledgements
References
- API 579-1/ASME FFS-1 (2016), Fitness for Service, American Petroleum Institute, USA.
- BS 7910:2013+A1, (2015), Guide to Methods for Assessing the Acceptability of Flaws in Metallic Structures” British Standard, UK.
- Wilkinson DS and Vitek, V., (1982), Propagation of Cracks by Cavitation- A General Theory”, Acta Metallurgica, 30:1723-1732. [CrossRef]
- Saxena, A and Bassani, JL (1984), Time-Dependent Fatigue Crack Growth Behavior at Elevated Temperature, in Fracture: Interactions of Microstructure, Mechanisms and Mechanics, TMS-AIME, Warrendale, PA 357-383.
- Saxena A (1980), Evaluation of C* for Characterization of Creep Crack Growth Behavior of 304 Stainless-Steel”, in Fracture Mechanics: Twelfth Conference, ASTM STP 700, American Society for Testing and Materials, Philadelphia, 131–151.
- Landes JD and Begley JA (1976), A Fracture Mechanics Approach to Creep Crack Growth, Mechanics of Crack Growth, ASTM STP 590, American Society for Testing and Materials, Philadelphia, 128-148.
- Nikbin KM, Smith DJ, and Webster GA, (1986), An Engineering Approach to the Prediction of Creep Crack Growth, J. Engineering Materials and Technology, ASME, 108: 186-191. [CrossRef]
- Saxena A (1986), Creep Crack Growth under Non-steady State Conditions, Fracture Mechanics: Seventeenth Volume, ASTM STP 905, American Society for Testing and Materials, Philadelphia, 185-201.
- Yoon KB, Saxena, A., and Liaw PK (1993), Characterization of Creep-Fatigue Crack Growth Behavior under Trapezoidal Wave Shape Using Ct Parameter, International J of Fracture, 59: 95-114. [CrossRef]
- Grover PS and Saxena, A (1995), Characterization of Creep-Fatigue Behavior in 2.25Cr-1Mo Steel Using (Ct)avg Parameter, International J. Fracture, 73: 273-286. [CrossRef]
- Saxena, A., Han, J. and Banerji, K., (1988) Creep Crack Growth Behavior in Power Plant Boiler and Piping Materials, Journal of Pressure Vessel Technology, Vol. 110, pp. 137-146. [CrossRef]
- Riedel, H, Detampel, V, (1987) Creep Crack Growth in Ductile, Creep-resistant Steels, International Journal of Fracture, Vol 33, pp 239-262. [CrossRef]
- Liaw, P.K., Saxena, A. and Schaffer, J., (1989) Determination of Inspection Criterion for Seam Welded Steam Pipes, Part I: Mechanical Properties, Engineering Fracture Mechanics, vol. 32, pp. 675-708. [CrossRef]
- Norris, RH (1994), Creep Crack growth Behavior in Weld Metal/Base Metal/Fusion Zone Regions in Chromium Molybdenum Steels, PhD Dissertation, Georgia Institute of Technology.
- Grover PS and Saxena, A, (1995) Characterization of Creep-Fatigue Crack Growth Behavior in 2.25 cr-1 Mo Steels, International Journal of Fracture, Vol. 73, pp 273-286. [CrossRef]
- Liaw, PK, Rao, GV, Burke, MG, (1991) “Creep Fracture Behavior of 2 1/4Cr-1Mo Welds from a 31-year-Old Fossil Power Plant, Materials Science and Engineering A, Vol. 131, pp 187-201. [CrossRef]
- Bangs, S, (1986) When Welds Fail, Welding Design and fabrication, Vol. 59, pp 79-82.
- Jaske, CE and Swindeman, RW, (1987) Long-term-creep and creep-crack-growth behavior of 9Cr-1Mo-V-Nb steel, Advances in Material Technology for Fossil Power Plants, Viswanathan, R. and Jaffe, R.I. Editors, ASM International, Metals Park, OH, pp 231-241.
- Yatomi M, Yoshida K, Kimura T, (2011), “Difference of creep crack growth behavior for base, heat-affected zone and welds of modified 9Cr – 1Mo steel”, Materials at High Temperature, 28: 109-113. [CrossRef]
- Shingledecker, J, (2018) “Creep Crack Growth Behavior of P91 Material at 6250C” unpublished data, Electric Power Research Institute, Charlotte, NC.
- Hyde, TH, Saber, M, and Sun, W, (2010) Creep Crack Growth Data and Prediction for P91 Weld at 650 0C, International Journal of Pressure Vessel and Piping. Vol. 87, pp 721-729. [CrossRef]
- Kim, WG, Park, JY, Lee, HY, Kim, ES, Kim, SJ, (2018), Assessment of Creep Crack Growth Rates for Grade 91 Weld Joint at 550 0C, Proceedings of the ASME 2018 Pressure Vessel and Piping Conference, PVP2018, July 15 – 20, 2018, Prague, Czech Republic.
- Kim W.G., Park, JY, Lee, HY, Hong, SD, Kim, YW, Kim, SY, (2013), International Journal of Pressure Vessel and Piping, Vol. 110, pp 66-71.
- Saxena A and Narasimhachary, SB, (2019) Accounting for Crack Tip Cyclic Plasticity and Creep Reversal in Estimating (Ct)avg During Creep-Fatigue Crack Growth, Fatigue and Fracture of Engineering Materials and Structures. [CrossRef]
- Narasimhachary SB and Saxena A, (2013) “Crack Growth Behavior of 9 Cr-1 Mo Steel under Creep-fatigue Conditions”, International Journal of Fatigue, 56, 106-113. [CrossRef]
- Saxena A and Narasimhachary SB, (2018), “Creep-fatigue Crack Growth Testing of P91 Steel: Results of the Round Robin for Assessing ASTM Standard E 2760-10” EPRI, Palo Alto, CA, 3002014273.
- Parker J and Siefert J, “Metallurgical and Stress State Factors Which Affect the Creep and Fracture Behavior of 9%Cr Steels”, (2018) Advances in Materials Science and Engineering. [CrossRef]

| T 0C | from equation (8) | |||
| A(T) | n | |||
| 540 (Ref Temp, Tref) | 2.2x10⁻²⁰ | 6.6 | 0.00259 | 1 |
| 550 | 3.94x10⁻²² | 7.79 | 0.00367 | 1.41 |
| 566 | 6.36x10⁻²³ | 9.36 | 0.007243 | 2.78 |
| 594 | 1.94x10⁻²⁴ | 10.08 | 0.00724 | 2.8 |
| Material | Temperature 0C | Mean/Upper Bound | c | q |
| BM/Ex-service BM | 540 -594, referenced to 540 | Mean | 0.0072 | 0.8394 |
| UB | 0.0205 | |||
| LB | 0.0025 | |||
| New and ex-service WM, New HAZ | 540, referenced to 540 | Mean | 0.0072 | 0.8394 |
| UB | 0.02050 | |||
| LB | 0.0025 | |||
| Ex-service HAZ | 538, assumed to be same as at 540 | Mean | 0.037 | 0.8294 |
| UB | 0.00666 | |||
| LB | 0.0185 |
| Temperature (0C) | |||||
| A(T) | n | ||||
| 538 (Ref Temp) | 4 x 10-47 | 17.536 | 0.00313 | 1.00 | |
| 550 (BM) | 1.29 x 10-37 | 13.7 | 0.00309 | 0.989 | |
| 550 (WM) | 1.07 x 10⁻³¹ | 11.4 | 0.00318 | 1.016 | |
| 550 (HAZ) | 2.45 x 10⁻³⁵ | 12.9 | 0.003236 | 1.034 | |
| 575 | 6 x 10-31 | 11.202 | 0.003336 | 1.066 | |
| 593 | 1 x 10-36 | 14.195 | 0.004274 | 1.365 | |
| 600 | 1 x 10-26 | 9.834 | 0.003982 | 1.272 | |
| 625 | 1 x 10-22 | 8.383 | 0.004522 | 1.445 | |
| 650 (BM) | 1.092 x 10⁻²⁰ | 8.462 | 0.007706 | 2.46 | |
| 650 (WM) | 1.37 x 10⁻²⁰ | 7.65 | 0.05054 | 1.615 | |
| 650 (HAZ) | 2.3 x 10⁻²⁰ | 8.462 | 0.008404 | 2.685 | |
| c | Si | Mn | P | S | Ni | Cr | Mo | As | V | Nb | Al | Cu | N | Sb,Sn | Fe | |
| Shingledecker | 0.11 | 0.31 | 0.45 | 0.011 | 0.009 | 0.19 | 8.22 | 0.94 | .005 | 0.21 | 0.07 | .006 | 0.16 | .039 | .001 | Bal |
| Hyde et al. BM | 0.11 | 0.022 | 0.36 | NR | NR | NR | 8.74 | 0.98 | NR | 0.21 | 0.12 | NR | 0.08 | 0.048 | NR | Bal |
| Hyde et al. WM | 0.087 | 0.28 | 1.04 | NR | NR | NR | 8.6 | 1.02 | NR | 0.22 | 0.24 | NR | 0.03 | 0.04 | NR | Bal |
| Kim et al. BM | 0.115 | 0.23 | 0.415 | 0.012 | 0.014 | 0.22 | 8.9 | 0.87 | NR | .0194 | 0.073 | 0.02 | 0.038 | 0.0513 | NR | Bal |
| Nominal | 0.1 | 0.38 | 0.46 | 0.02 | .002 | 0.33 | 8.1 | 0.92 | - | 0.18 | 0.073 | 0.034 | - | 0.049 | - | Bal |
| S | Cu | Sn | As | Sb | Pb | |
| Actual | 0.009 | 0.16 | 0.001 | 0.005 | 0.001 | ? |
| Damage Prone | 0.01 | 0.19 | 0.008 | 0.0128 | 0.0023 | 0.00075 |
| Damage Resistant | 0.002 | 0.05 | 0.003 | 0.0042 | 0.00063 | 0.00003 |
| Material | Temperature 0C | Mean/Upper Bound | c | q |
| CCG-Creep-ductile behavior | 538 – 593, referenced to 538 | Mean | 0.0048 | 0.6093 |
| UB | 0.01314 | |||
| LB | 0.001752 | |||
| CCG-Creep-brittle behavior | 600 -625, referenced to 538 | Mean | 0.0427 | 0.9991 |
| UB | 0.2130 | |||
| LB | 0.008557 | |||
| CFCG | 625 but referenced to 538 | Mean | 0.0186 | 0.5061 |
| UB | 0.1099 | |||
| LB | 0.003149 |
Disclaimer/Publisher’s Note: The statements, opinions and data contained in all publications are solely those of the individual author(s) and contributor(s) and not of MDPI and/or the editor(s). MDPI and/or the editor(s) disclaim responsibility for any injury to people or property resulting from any ideas, methods, instructions or products referred to in the content. |
© 2023 by the authors. Licensee MDPI, Basel, Switzerland. This article is an open access article distributed under the terms and conditions of the Creative Commons Attribution (CC BY) license (http://creativecommons.org/licenses/by/4.0/).


