Submitted:
12 September 2023
Posted:
13 September 2023
You are already at the latest version
Abstract
Keywords:
1. Introduction
Materials and Methods
2.1. Study Area
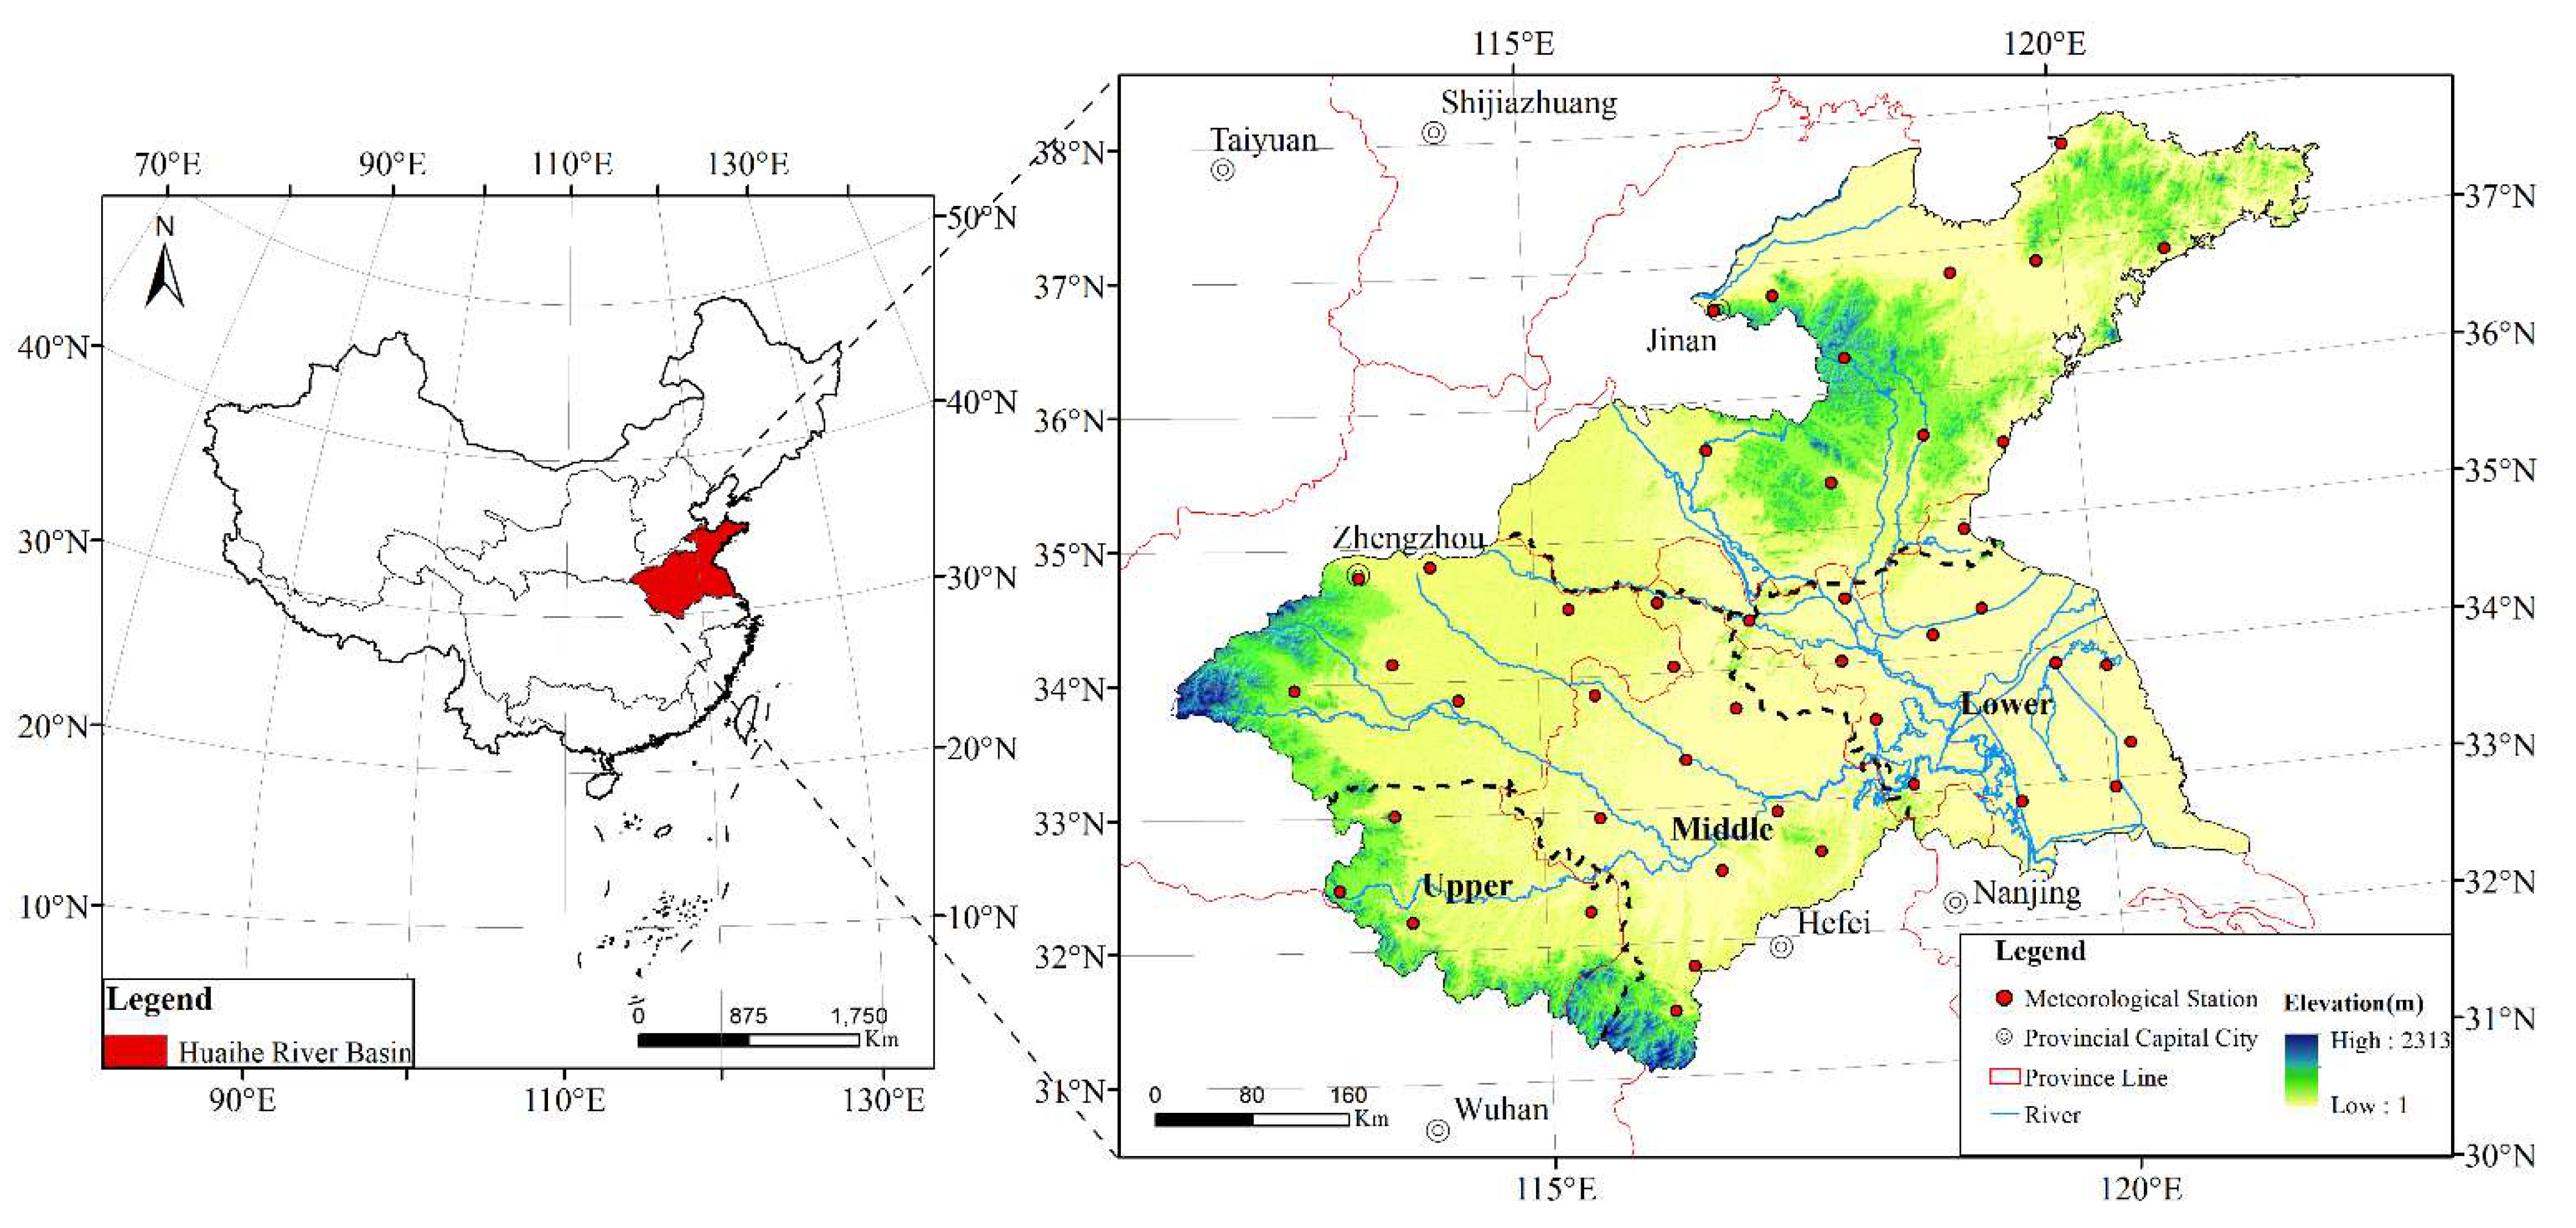
2.2. Data Source
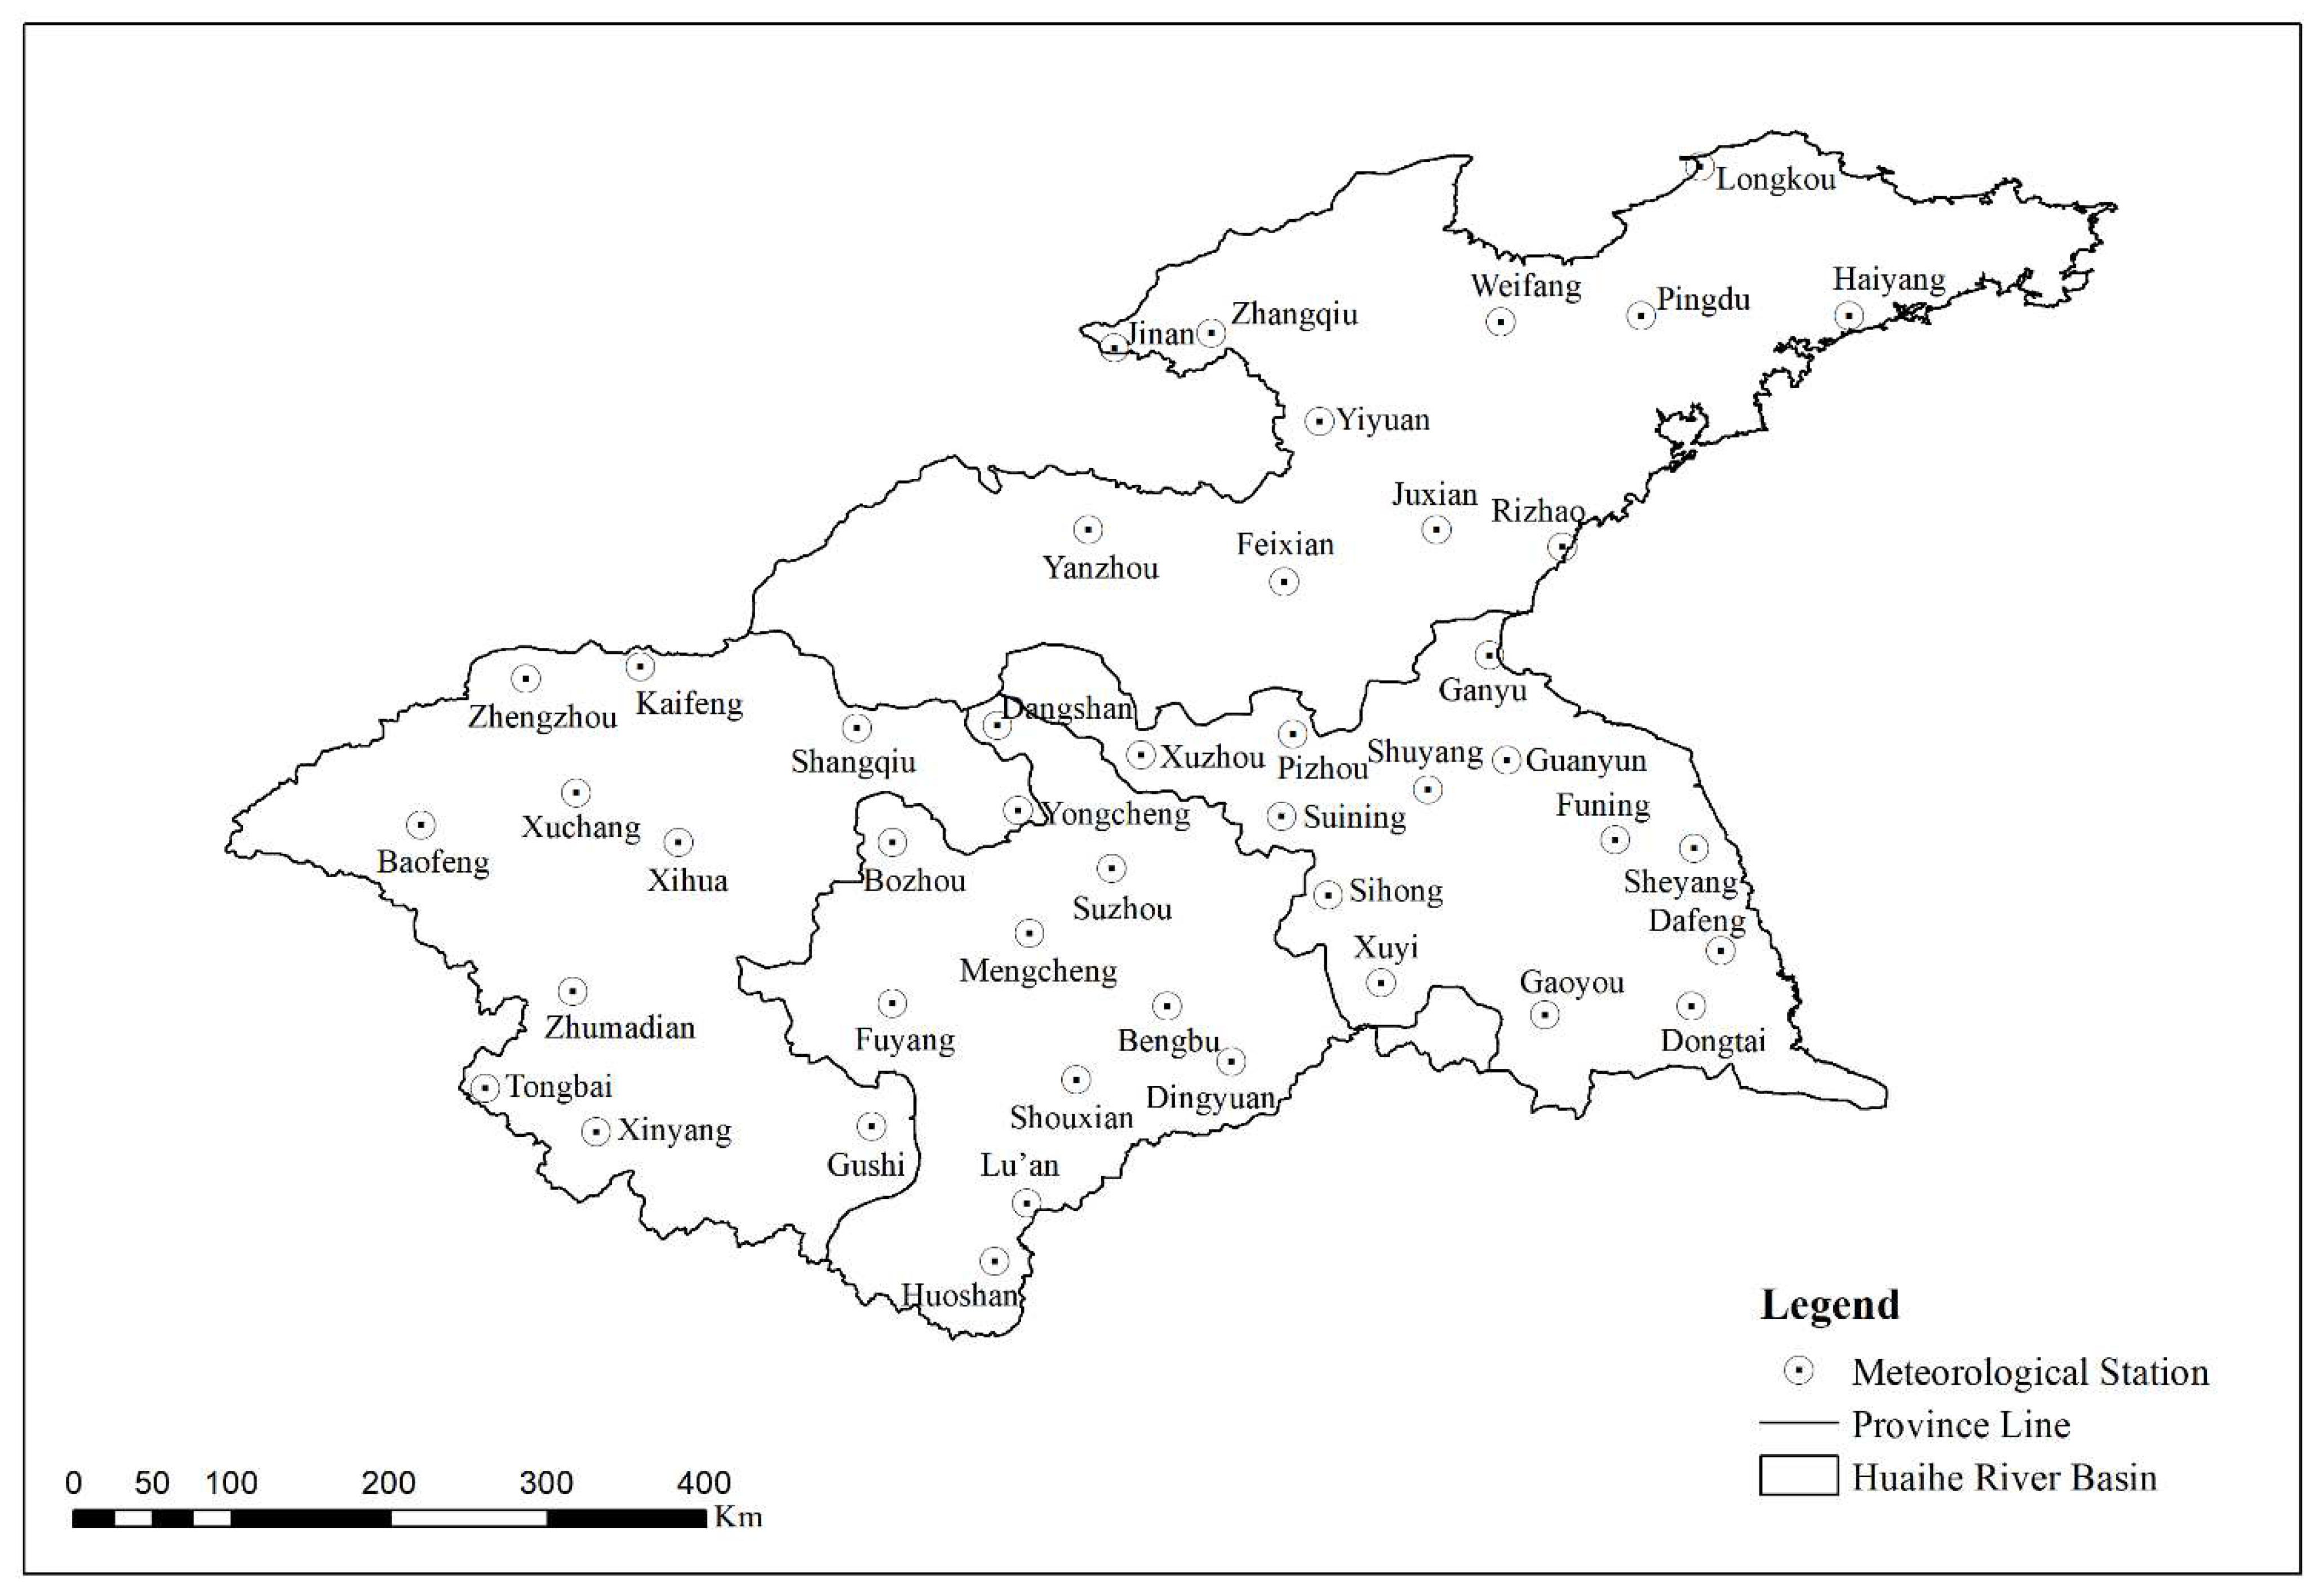
2.2.1. Historically measured climate data
2.2.2. NEX-GDDP-CMIP6 Dataset
2.3. Methods
2.3.1. Extreme precipitation index
2.3.2. RclimDex model
2.3.3. Taylor diagram
2.3.4. Sen+Mann-Kendall trend analysis
3. Results
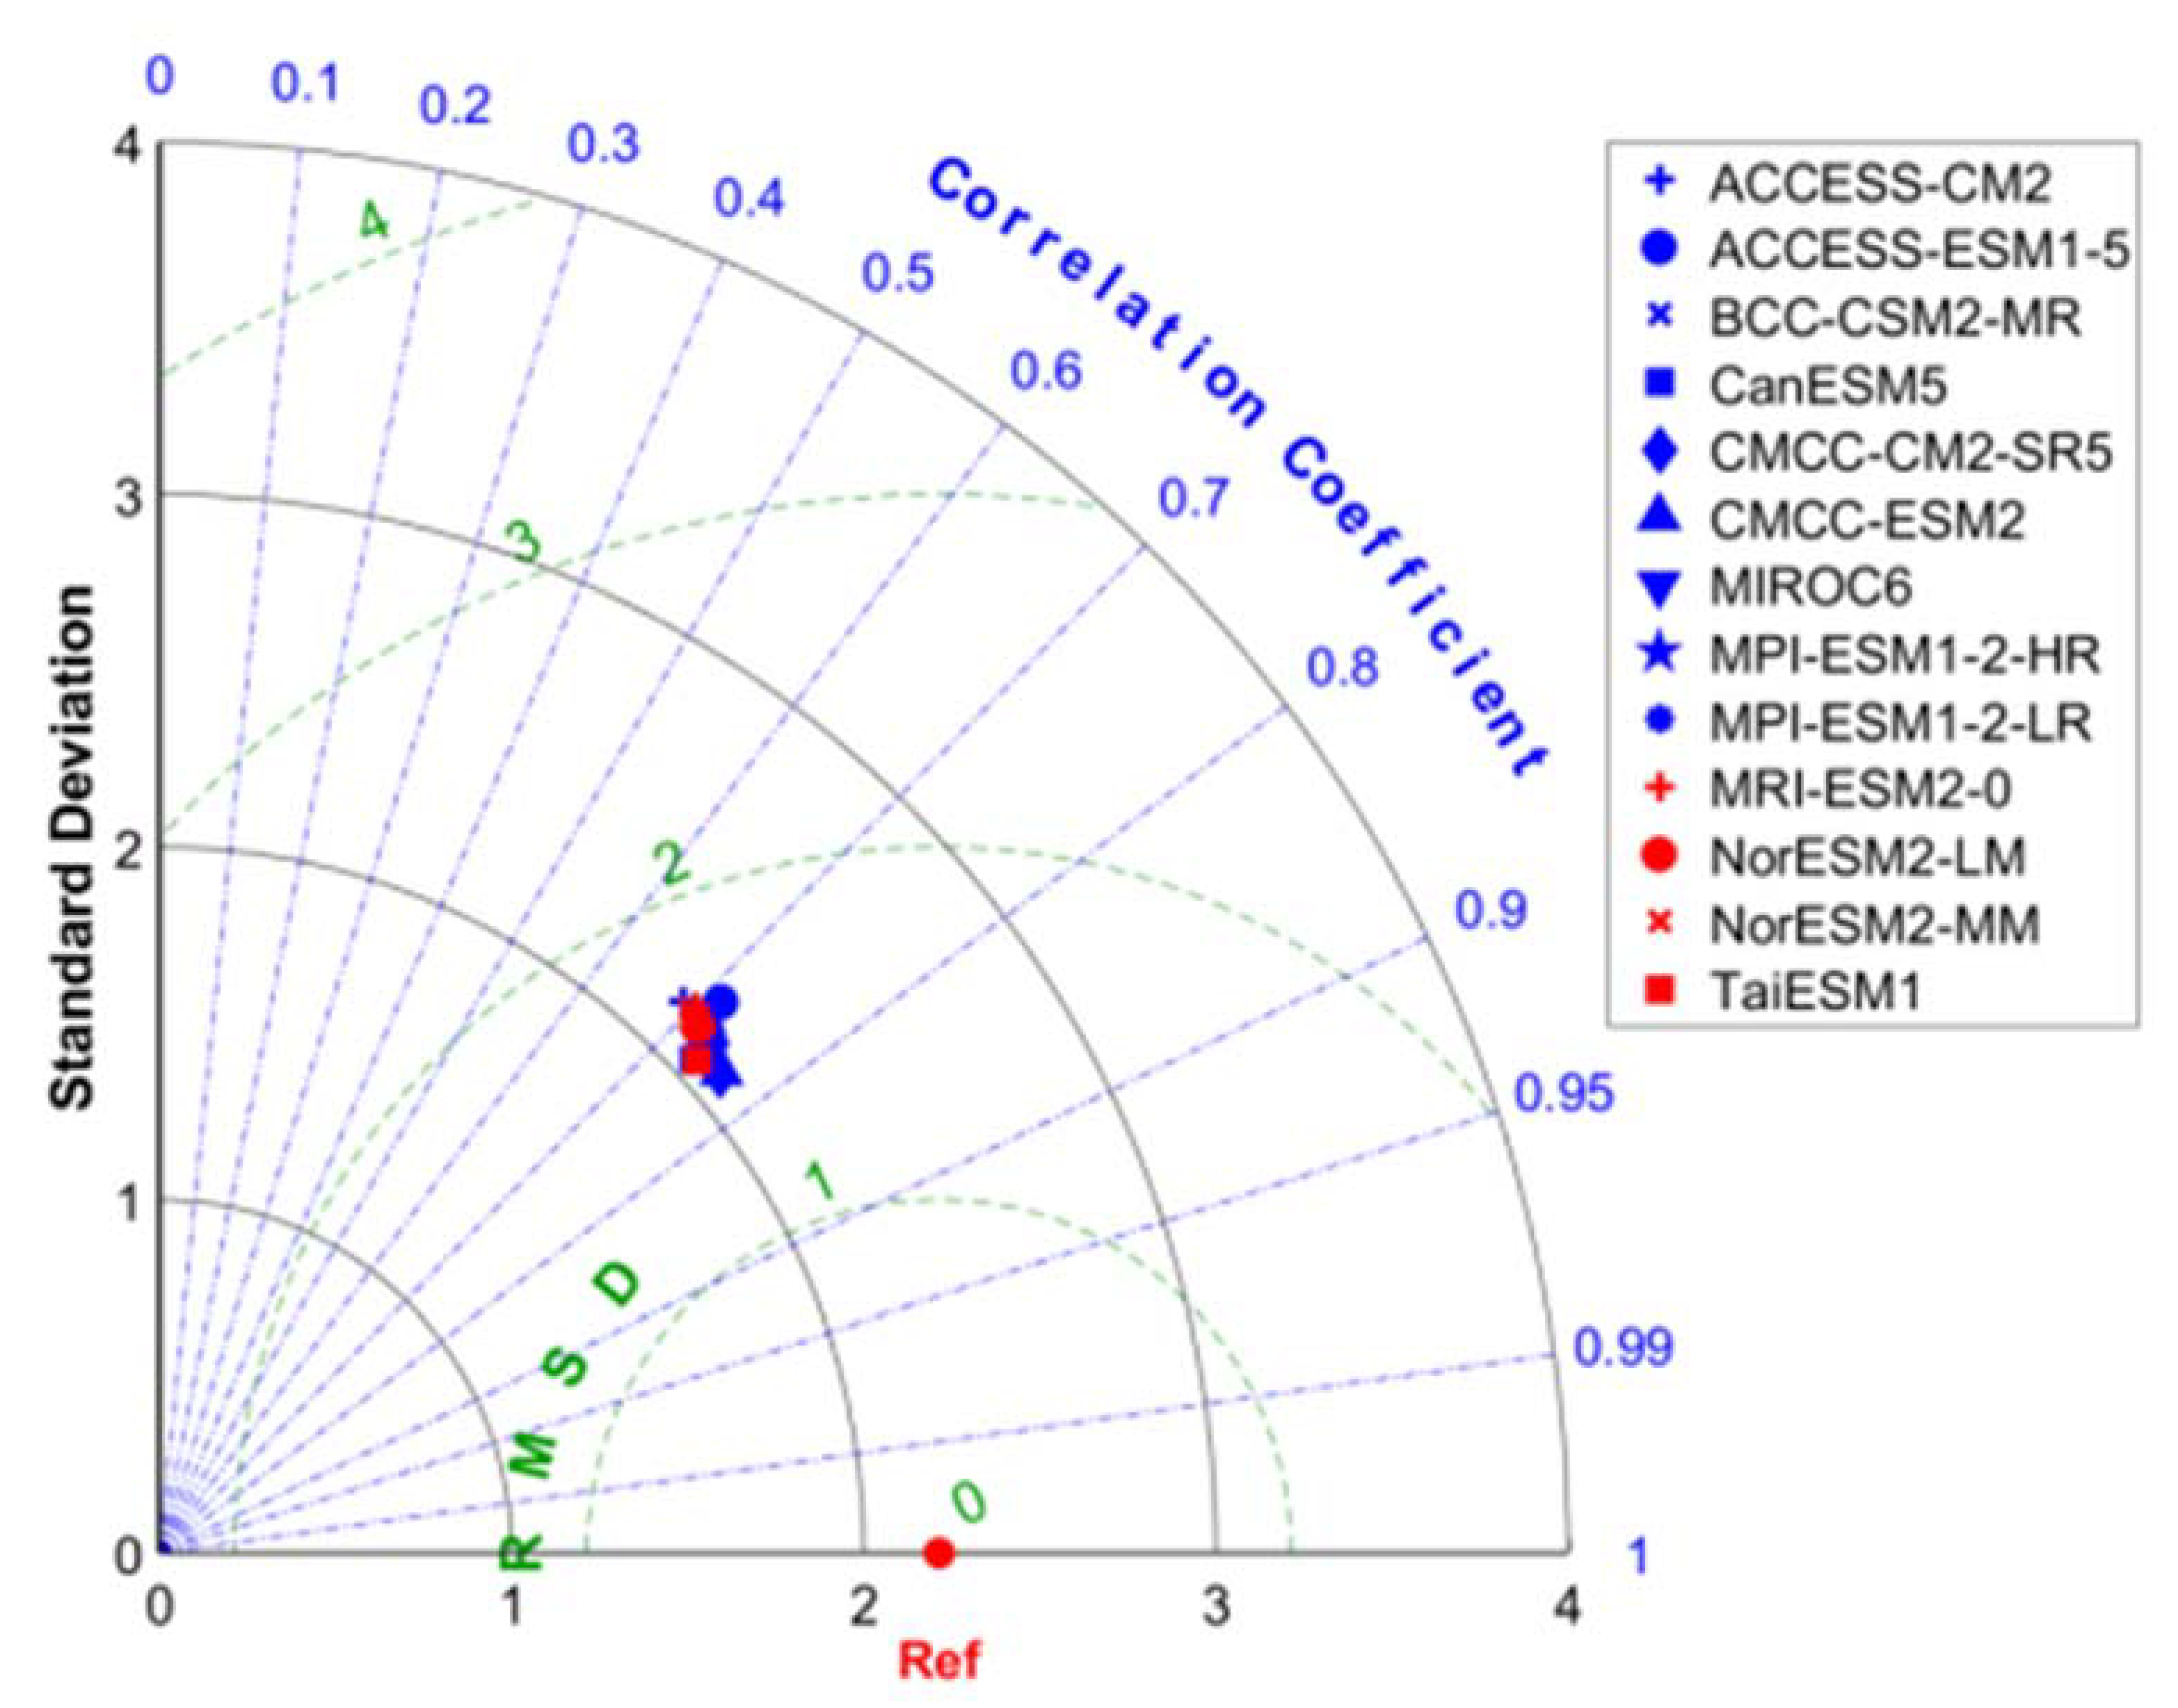
3.1. Taylor Diagram Climate Model Evaluation
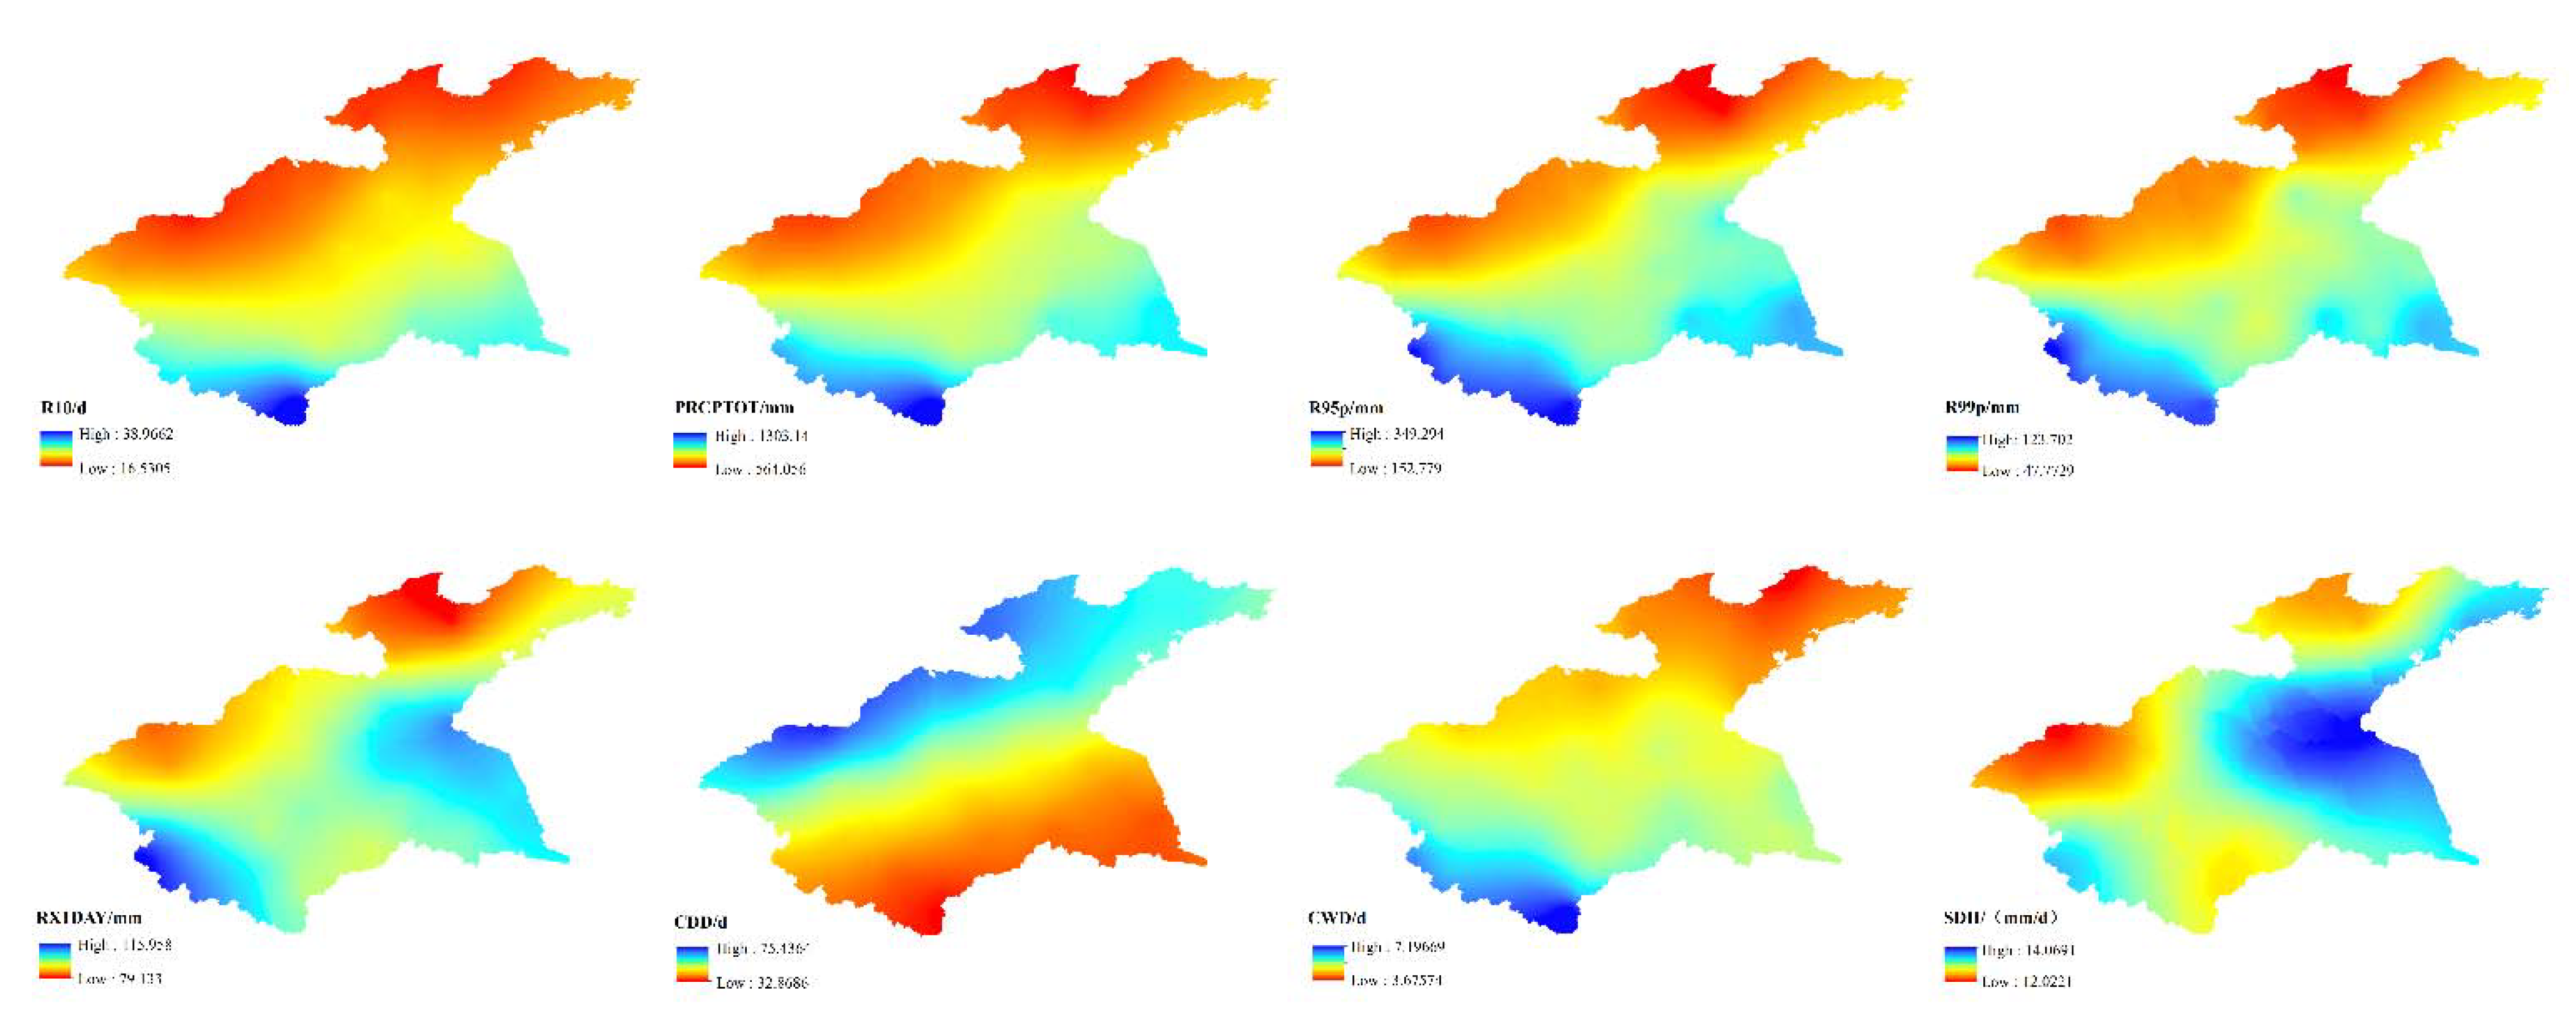
3.2. Spatiotemporal distribution characteristics of extreme precipitation indices in the Huaihe River Basin in the historical period
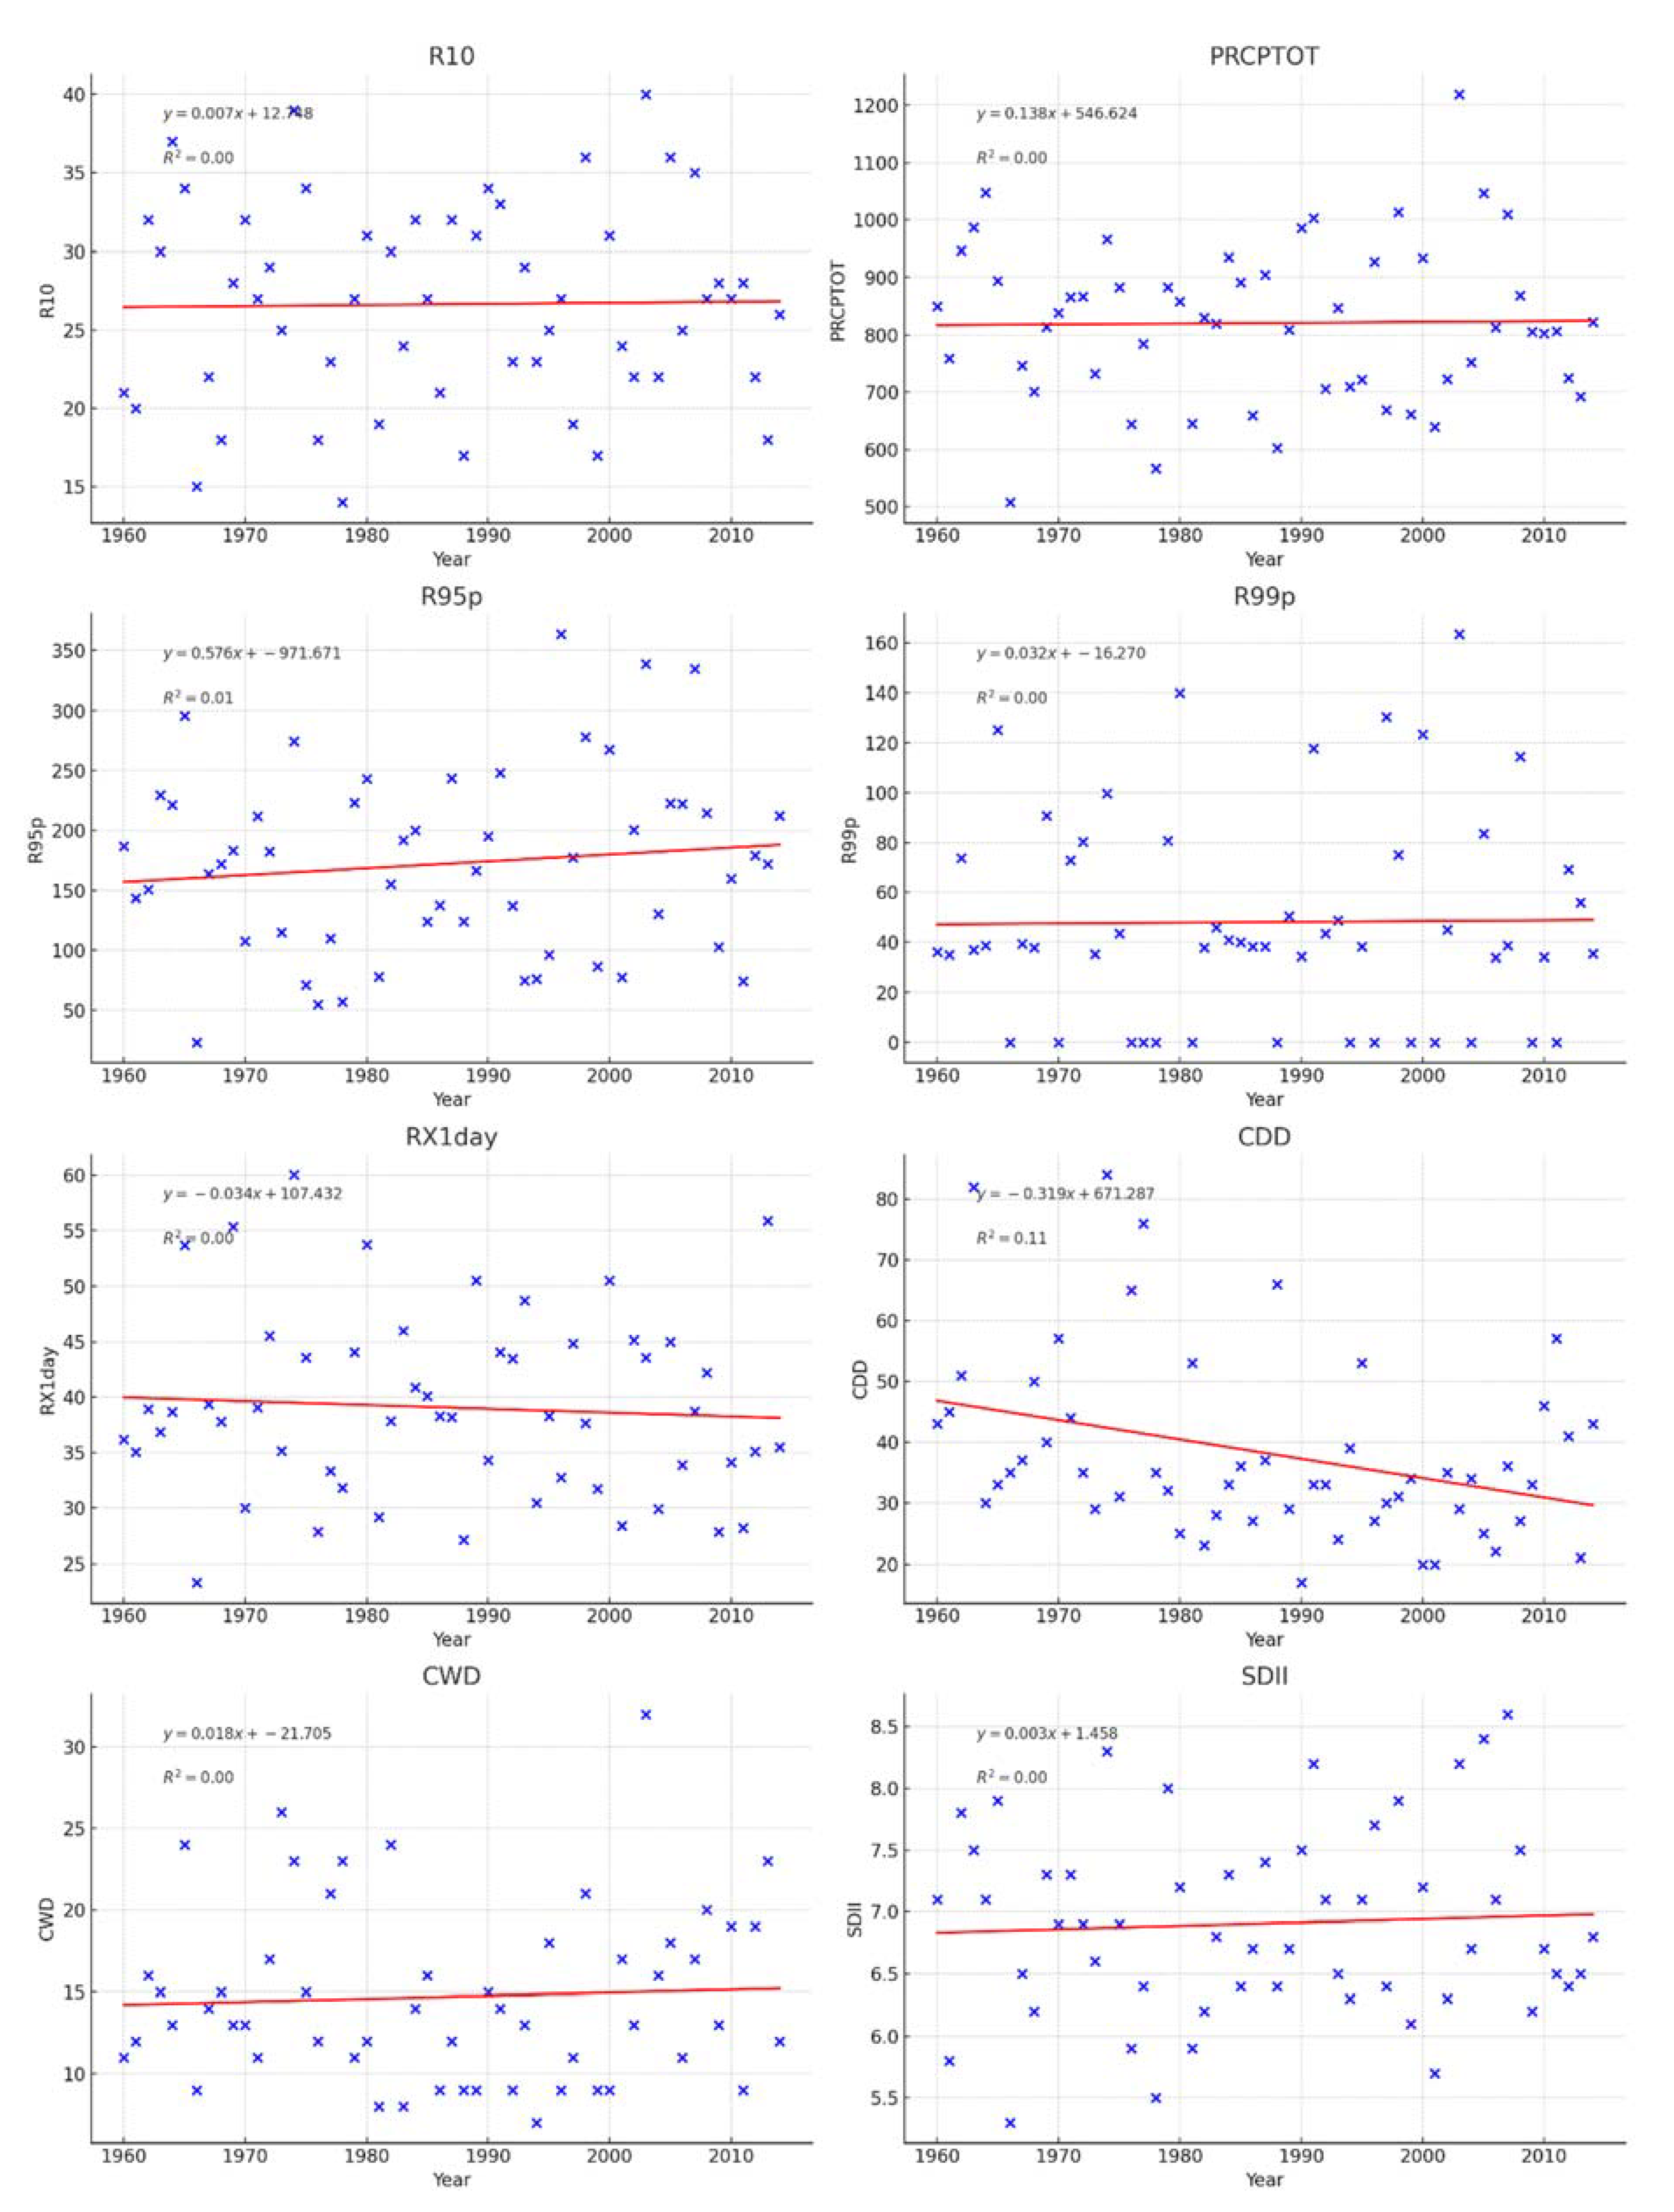
3.2.1. Time distribution characteristics of the extreme precipitation index in the Huaihe River Basin in the historical period
3.2.2. Time distribution characteristics of the extreme precipitation index in the Huaihe River Basin in the historical period
3.3. Spatiotemporal distribution characteristics of extreme precipitation index in the Huaihe River Basin in the future
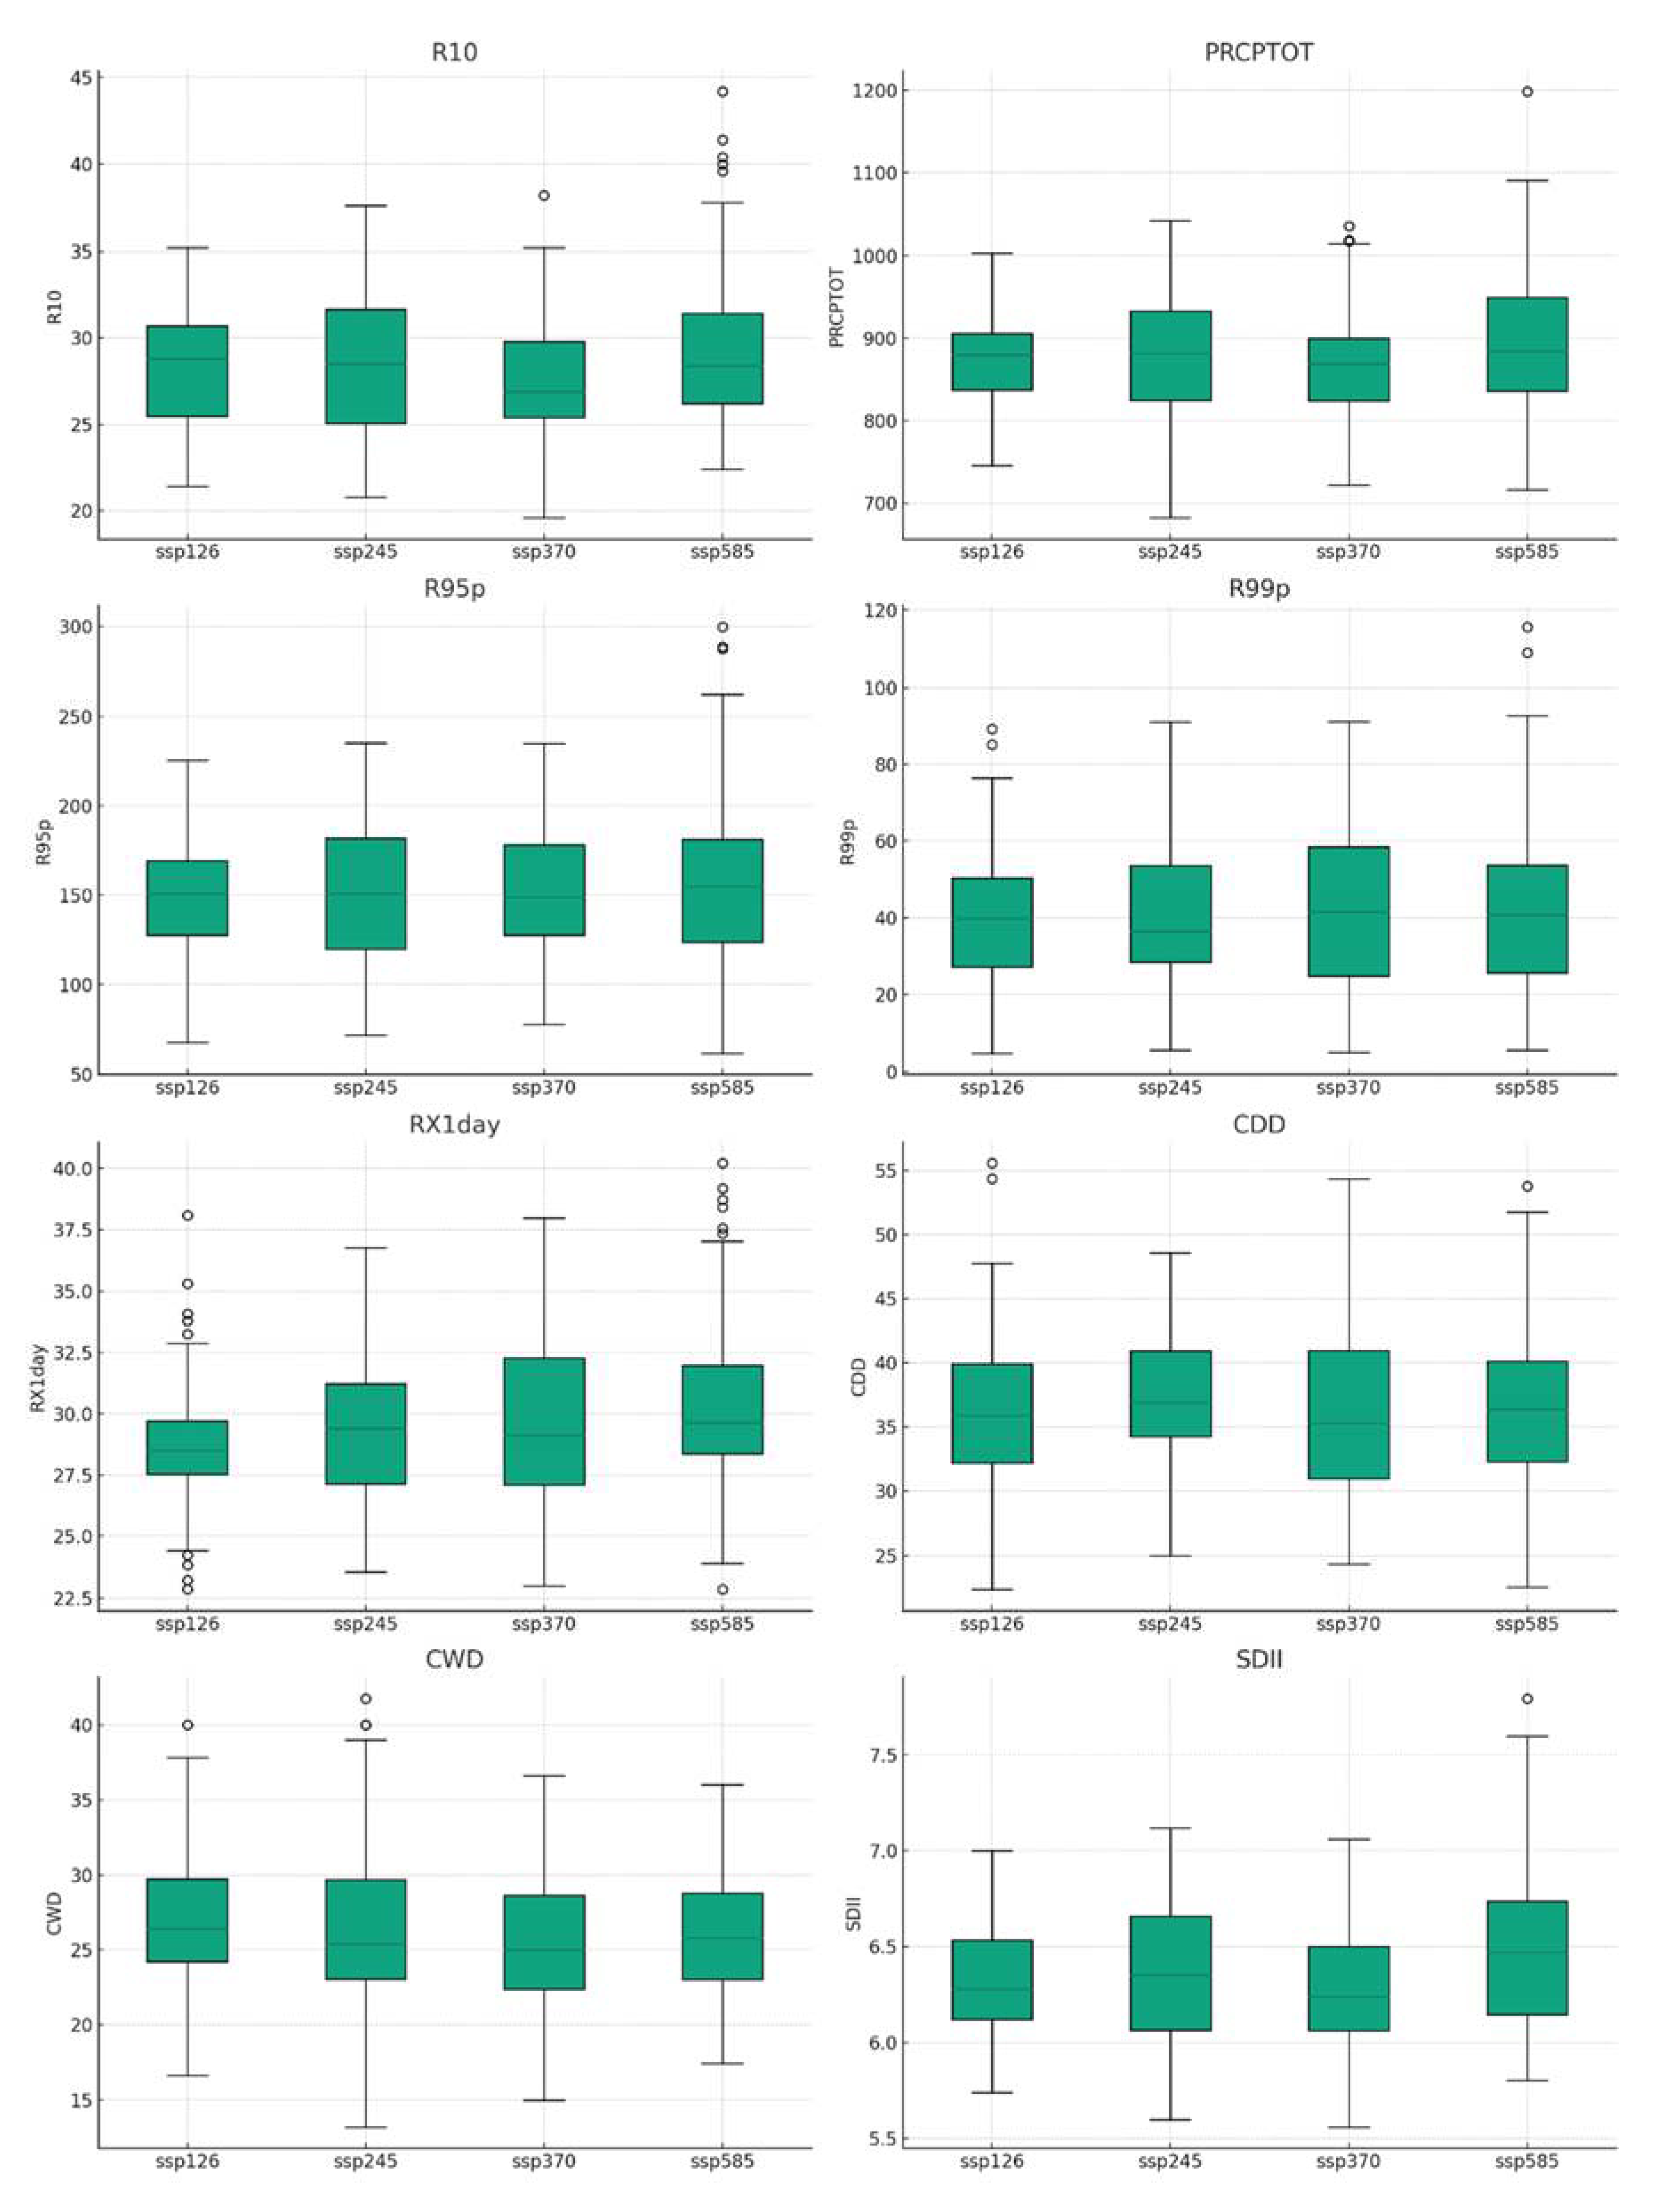
3.3.1. Time distribution characteristics of extreme precipitation index in the Huaihe River Basin in the future period
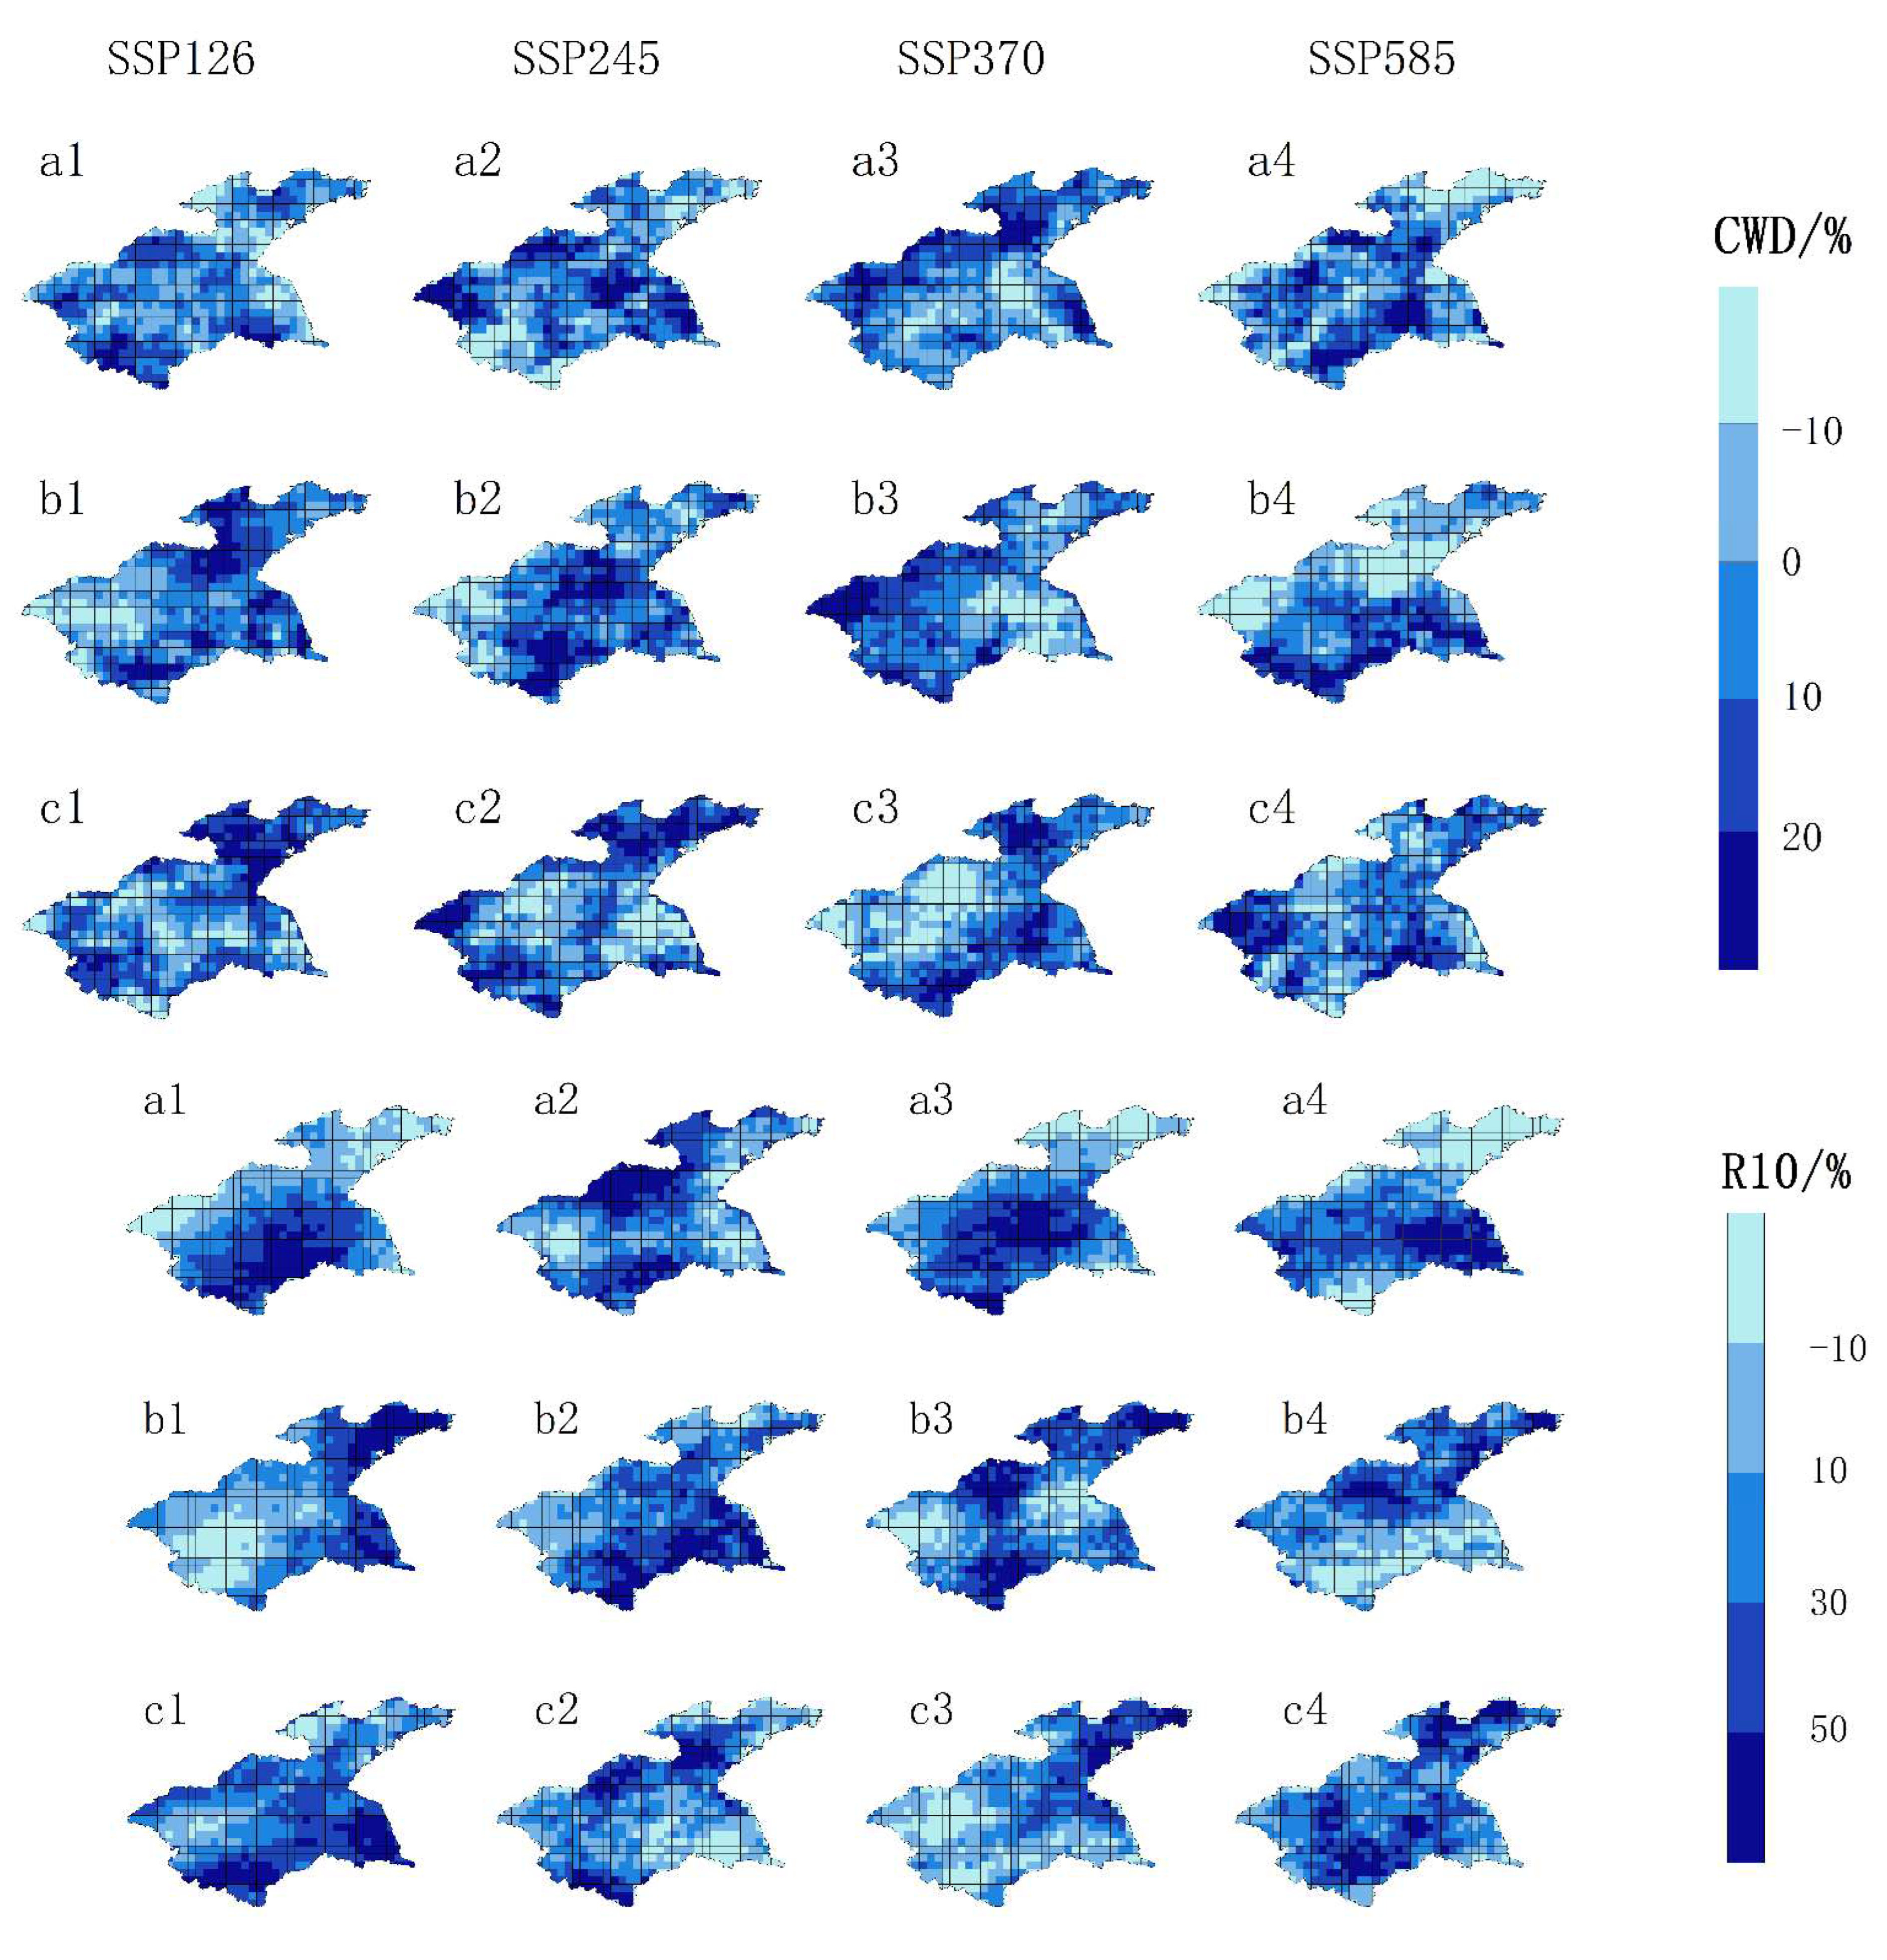
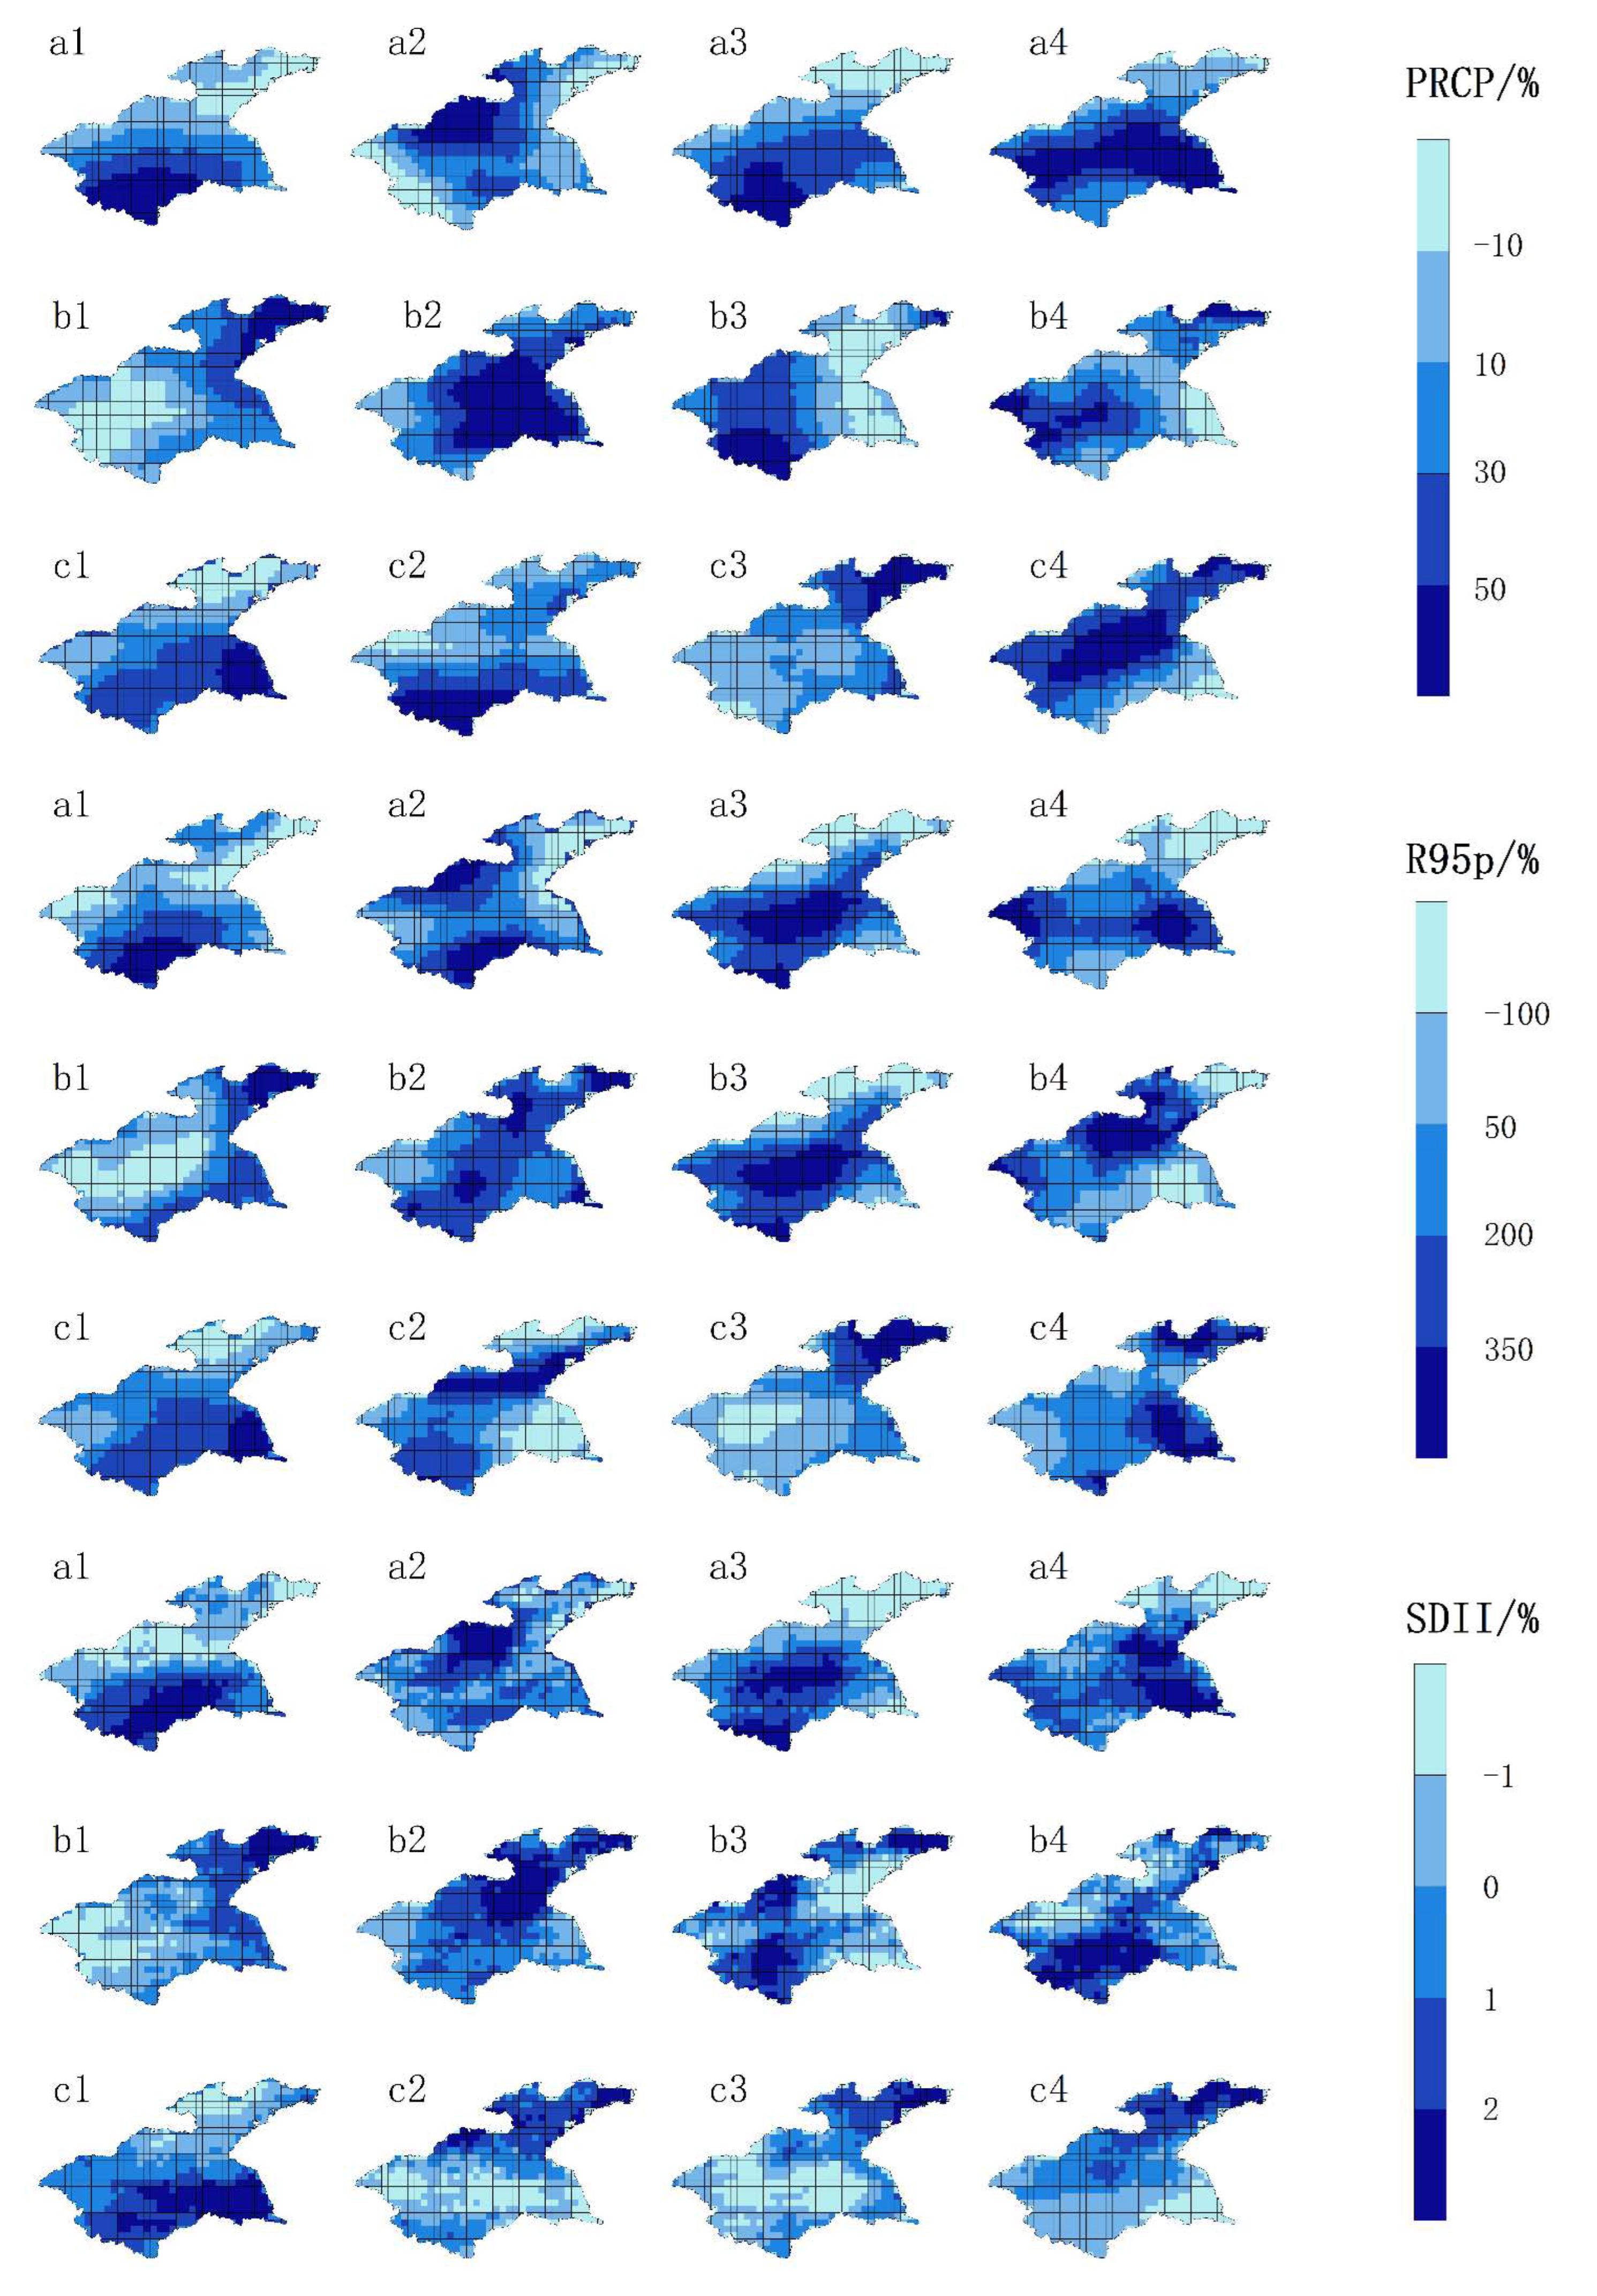
3.3.2. Spatial distribution characteristics of extreme precipitation index in the Huaihe River Basin in the future period
4. Discussion
4.1. Model Evaluation and Historical Analysis
4.2. Spatial Variation and Regional Disparities
4.3. Future Projections and Implications
5. Conclusions
Author Contributions
Funding
Data Availability Statement
Acknowledgments
Conflicts of Interest
References
- Adopted, I. P. C. C. (2014). Climate change 2014 synthesis report. IPCC: Geneva, Szwitzerland, 1059-1072.
- Xu, D.; Liu, D.; Yan, Z.; Ren, S.; Xu, Q. Spatiotemporal Variation Characteristics of Precipitation in the Huaihe River Basin, China, as a Result of Climate Change. Water 2023, 15, 181. [Google Scholar] [CrossRef]
- Lin, H.; Wang, J.; Li, F.; Xie, Y.; Jiang, C.; Sun, L. Drought Trends and the Extreme Drought Frequency and Characteristics under Climate Change Based on SPI and HI in the Upper and Middle Reaches of the Huai River Basin, China. Water 2020, 12, 1100. [Google Scholar] [CrossRef]
- Khaing, Z.M.; Zhang, K.; Sawano, H.; Shrestha, B.B.; Sayama, T.; Nakamura, K. Flood hazard mapping and assessment in data-scarce Nyaungdon area, Myanmar. PLOS ONE 2019, 14, e0224558. [Google Scholar] [CrossRef] [PubMed]
- Wang, G.; Zhang, Q.; Yu, H.; Shen, Z.; Sun, P. Double increase in precipitation extremes across China in a 1.5 °C/2.0 °C warmer climate. Sci. Total. Environ. 2020, 746, 140807. [Google Scholar] [CrossRef] [PubMed]
- Allan, R.P.; Soden, B.J. Atmospheric Warming and the Amplification of Precipitation Extremes. Science 2008, 321, 1481–1484. [Google Scholar] [CrossRef] [PubMed]
- Yazdandoost, F.; Moradian, S.; Izadi, A.; Aghakouchak, A. Evaluation of CMIP6 precipitation simulations across different climatic zones: Uncertainty and model intercomparison. Atmospheric Res. 2020, 250, 105369. [Google Scholar] [CrossRef]
- Masson-Delmotte, V. , Zhai, P., Pirani, A., Connors, S. L., Péan, C., Berger, S.,... & Zhou, B. (2021). Climate change 2021: the physical science basis. Contribution of working group I to the sixth assessment report of the intergovernmental panel on climate change, 2.
- Yao, Y.; Qu, W.; Lu, J.; Cheng, H.; Pang, Z.; Lei, T.; Tan, Y. Responses of Hydrological Processes under Different Shared Socioeconomic Pathway Scenarios in the Huaihe River Basin, China. Water 2021, 13, 1053. [Google Scholar] [CrossRef]
- Xu Feng, & Niu Jiqiang. (2004). Flood disasters and countermeasures in the Huaihe River Basin. Journal of Xuchang University, 23(5), 105–109.
- Bi Baogui, Jiao Meiyan, & Li Zechun. (2004). Meteorological and hydrological characteristics of floods and rainstorms in the Huaihe River Basin in 2003. Journal of Nanjing Meteorological Institute. 27(5), 577–586.
- Jiao Meiyan, Jin Ronghua, & Qi Dan. (2008). Meteorological and hydrological characteristics of Huaihe River rainstorm and flood in 2007. Journal of Applied Meteorology. 19(3), 257–264.
- Nashwan, M.S.; Shahid, S. A novel framework for selecting general circulation models based on the spatial patterns of climate. Int. J. Clim. 2019, 40, 4422–4443. [Google Scholar] [CrossRef]
- Huang Xiaoyuan, & Li Xiehui. (2022). Future prediction of rainstorm and flood disaster risk in southwest China based on CMIP6. Journal of Applied Meteorology. 33(2), 231–243.
- Feng Yelin, He Zhonghua, Jiao Shulin & Liu Wei. (2023). Prediction of extreme precipitation scenarios in Guizhou Province based on CMIP6 climate model. Soil and Water Conservation Research(01). 282–290.
- Dewan, A.M.; Corner, R.; Hashizume, M.; Ongee, E.T. Typhoid Fever and Its Association with Environmental Factors in the Dhaka Metropolitan Area of Bangladesh: A Spatial and Time-Series Approach. PLOS Neglected Trop. Dis. 2013, 7, e1998. [Google Scholar] [CrossRef] [PubMed]
- Minh, P.T.; Tuyet, B.T.; Thao, T.T.T.; Hang, L.T.T. Application of ensemble Kalman filter in WRF model to forecast rainfall on monsoon onset period in South Vietnam. J. Sci. Earth 2018, 40, 367–394. [Google Scholar] [CrossRef]
- Zhang, Q. , Li, J., Singh, V. P., & Xu, C. Y. (2013). Copula-based spatio-temporal patterns of precipitation extremes in China. international Journal of Climatology, 33(5), 1140-1152.
- Field, C. B. (Ed.). (2012). Managing the risks of extreme events and disasters to advance climate change adaptation: special report of the intergovernmental panel on climate change. Cambridge University Press.
- Ma Jianing, & Gao Yanhong. (2019). Analysis of annual average and extreme precipitation changes in the upper reaches of the Yellow River in the past 50 years. Plateau Meteorology. 124–135.
- Jin Ruimeng, & Yang Yang. Evaluation of the CMIP5 global climate model for the simulation of the northward extension of rain belts in eastern China. Meteorological Hydro-Oceanic Instruments, 39(3), 19-23, 2022.
- Wang Qiong, Zhang Mingjun, Wang Shengjie, Luo Shufei, Wang Baolong, & Zhu Xiaofan. (2013). Analysis of extreme temperature events in the Yangtze River Basin from 1962 to 2011. Acta Geographica Sinica. 68(5), 611–625.
- Taylor, K.E. Summarizing multiple aspects of model performance in a single diagram. J. Geophys. Res. Atmos. 2001, 106, 7183–7192. [Google Scholar] [CrossRef]
- Liu Xianfeng, Hu Baoyi, & Ren Zhiyuan. (2018). Temporal and spatial changes and driving factors of water use efficiency of vegetation ecosystems on the Loess Plateau. Chinese Agricultural Sciences. 51(2), 302–314.
- Li Shuangshuang, Yang Saini, & Liu Xianfeng. (2015). Spatiotemporal variation characteristics and influencing factors of extreme precipitation in the north and south of Qinling-Huaihe River from 1960 to 2013. Advances in Geographical Sciences, (3), 354-363.
- Wang, D.; Liu, J.; Wang, H.; Shao, W.; Mei, C.; Ding, X. Performance evaluations of CMIP6 and CMIP5 models for precipitation simulation over the Hanjiang River Basin, China. J. Water Clim. Chang. 2022, 13, 2089–2106. [Google Scholar] [CrossRef]
- Xu, D.; Liu, D.; Yan, Z.; Ren, S.; Xu, Q. Spatiotemporal Variation Characteristics of Precipitation in the Huaihe River Basin, China, as a Result of Climate Change. Water 2023, 15, 181. [Google Scholar] [CrossRef]
- Ngoma, H.; Wen, W.; Ayugi, B.; Babaousmail, H.; Karim, R.; Ongoma, V. Evaluation of precipitation simulations in CMIP6 models over Uganda. Int. J. Clim. 2021, 41, 4743–4768. [Google Scholar] [CrossRef]
- Pan, H.; Jin, Y.; Zhu, X. Comparison of Projections of Precipitation over Yangtze River Basin of China by Different Climate Models. Water 2022, 14, 1888. [Google Scholar] [CrossRef]
- Pomee, M.S.; Hertig, E. Precipitation projections over the Indus River Basin of Pakistan for the 21st century using a statistical downscaling framework. Int. J. Clim. 2021, 42, 289–314. [Google Scholar] [CrossRef]
- Yao, Y.; Qu, W.; Lu, J.; Cheng, H.; Pang, Z.; Lei, T.; Tan, Y. Responses of Hydrological Processes under Different Shared Socioeconomic Pathway Scenarios in the Huaihe River Basin, China. Water 2021, 13, 1053. [Google Scholar] [CrossRef]
| Number | Model | Institution | Country | Resolution |
|---|---|---|---|---|
| 1 | ACCESS-CM2 | ACCESS | Australia | 0.25°×0.25° |
| 2 | ACCESS-ESM1-5 | ACCESS | Australia | 0.25°×0.25° |
| 3 | BCC-CSM2-MR | BBC | China | 0.25°×0.25° |
| 4 | CMCC-CM2-SR5 | CMCC | Italy | 0.25°×0.25° |
| 5 | CMCC-ESM2 | CMCC | Italy | 0.25°×0.25° |
| 6 | CanESM5 | CCCMA | Canada | 0.25°×0.25° |
| 7 | MIROC6 | MIROC | Japan | 0.25°×0.25° |
| 8 | MPI-ESM1-2-HR | MPI | Germany | 0.25°×0.25° |
| 9 | MPI-ESM1-2-LR | MPI | Germany | 0.25°×0.25° |
| 10 | MRI-ESM2-0 | MRI | Japan | 0.25°×0.25° |
| 11 | NorESM2-LM | NCC | Norway | 0.25°×0.25° |
| 12 | NorESM2-MM | NCC | Norway | 0.25°×0.25° |
| 13 | TaiESM1 | RCEC | China | 0.25°×0.25° |
| Index | Abbreviation | Definition | Unit |
|---|---|---|---|
| Moderate rainy days | R10 | Number of days with daily precipitation ≥ 10mm | d |
| Total annual precipitation | PRCPTOT | Cumulative precipitation with daily precipitation ≥ 1mm | mm |
| Heavy precipitation | R95p | Annual cumulative precipitation with daily precipitation > 95% quantile | mm |
| Very heavy precipitation | R99p | Annual cumulative precipitation with daily precipitation > 99% quantile | mm |
| 1 day maximum precipitation | RX1day | Maximum 1-day precipitation per month | mm |
| Continuous dry period | CDD | The maximum continuous number of days with daily precipitation < 1mm | d |
| Continuous wet period | CWD | The maximum continuous number of days with daily precipitation > 1mm | d |
| Precipitation intensity | SDII | The ratio of total annual precipitation to the number of wet days |
Disclaimer/Publisher’s Note: The statements, opinions and data contained in all publications are solely those of the individual author(s) and contributor(s) and not of MDPI and/or the editor(s). MDPI and/or the editor(s) disclaim responsibility for any injury to people or property resulting from any ideas, methods, instructions or products referred to in the content. |
© 2023 by the authors. Licensee MDPI, Basel, Switzerland. This article is an open access article distributed under the terms and conditions of the Creative Commons Attribution (CC BY) license (http://creativecommons.org/licenses/by/4.0/).


