I. INTRODUCTION
The interactivity between real and virtual objects geomet rically and temporally aligned in the real environment defines augmented reality (AR) [
1]. The technological advances observed over the last decade have stimulated the several implementation of several AR applications in industry [
2]. The rigor of the precision and accuracy requirements for placing virtual elements in real environments, combined with the progress achieved by devices in terms of these competencies, have driven the development of AR solutions.
Studies show that visual instructions are better assimilated than textual instructions [
3], [
4]. AR is a centralizing element in the initiatives of industry 4.0 that allows users to be smoothly integrated into the digital environment [
5]. The use of AR in this context is aligned with six design principles of industry 4.0 (interoperability, virtualization, decentralization, real-time capability, service orientation and modularity) [
6].
Successful cases of AR application in the industry encour age the adoption of this technology, as shown by Neges et al. [
7], whose tests revealed an average time savings of up to 51% when using object localization instructions compared to performing the same activity without the application of AR.
Currently, the compound annual growth rate of the industrial AR market is projected at approximately 74% between 2018 and 2025 and estimated to reach US
$ 76 billion by 2025 [
8]. This growth is likely to be sustained or accelerated due to the maturity of AR and the diversity of applications in the industrial sector [
5].
Localization and tracking approaches in AR systems can be based on sensors, visual elements or both [
9]. Regardless of the approach used, factors such as the occlusion of markers, moving objects, noise, electromagnetism and low light are often observed in industrial environments. They hinder or limit the ability to accurately determine the location and orientation of a device, adding tracking failures to an AR system [
10]. Given these challenges, the ability to align virtual and real components with precision and accuracy can determine the feasibility of AR systems in industrial environments [
9]. The common challenges inherent to this process include the reliability and scalability in the tracking of device movement [
5], [
10]; calibration [
2]; and the precise contextualization of overlapping information in the real environment [
10].
The literature describes the basic architectural components of AR systems: cameras, tracking systems and user interfaces [
5]. Although there are several ways to integrate these elements, studies highlight the relevance of head-mounted displays (HMDs) because they allow operators to move around and access information hands-free [
5], [
11].
Of the devices currently available in the market, the Microsoft HoloLens mixed reality device stands out in terms of performance, presenting itself as a complete and self-contained AR tool [
12], i.e., an HMD with all the AR architectural elements embedded in a single device.
Considering the lack of studies related to the calibration of AR systems, specifically using HoloLens, the objective of this study is to propose two models of 3D coordinate calibration for AR applications in HoloLens in an industrial indoor environment.
This study is divided into six sections in addition to this introduction. Section II provides an overview of the localization and spatial recognition mechanisms available in HoloLens. Section III discusses the proposed calibration models. The methods and experiments described in section IV are applied to evaluate the precision and accuracy of the implemented models, and the results are discussed in section V. Lastly, in section VI, the final considerations, conclusions and future opportunities are presented.
II. LOCALIZATION AND SPACE RECOGNITION MECHANISMS OF HOLOLENS
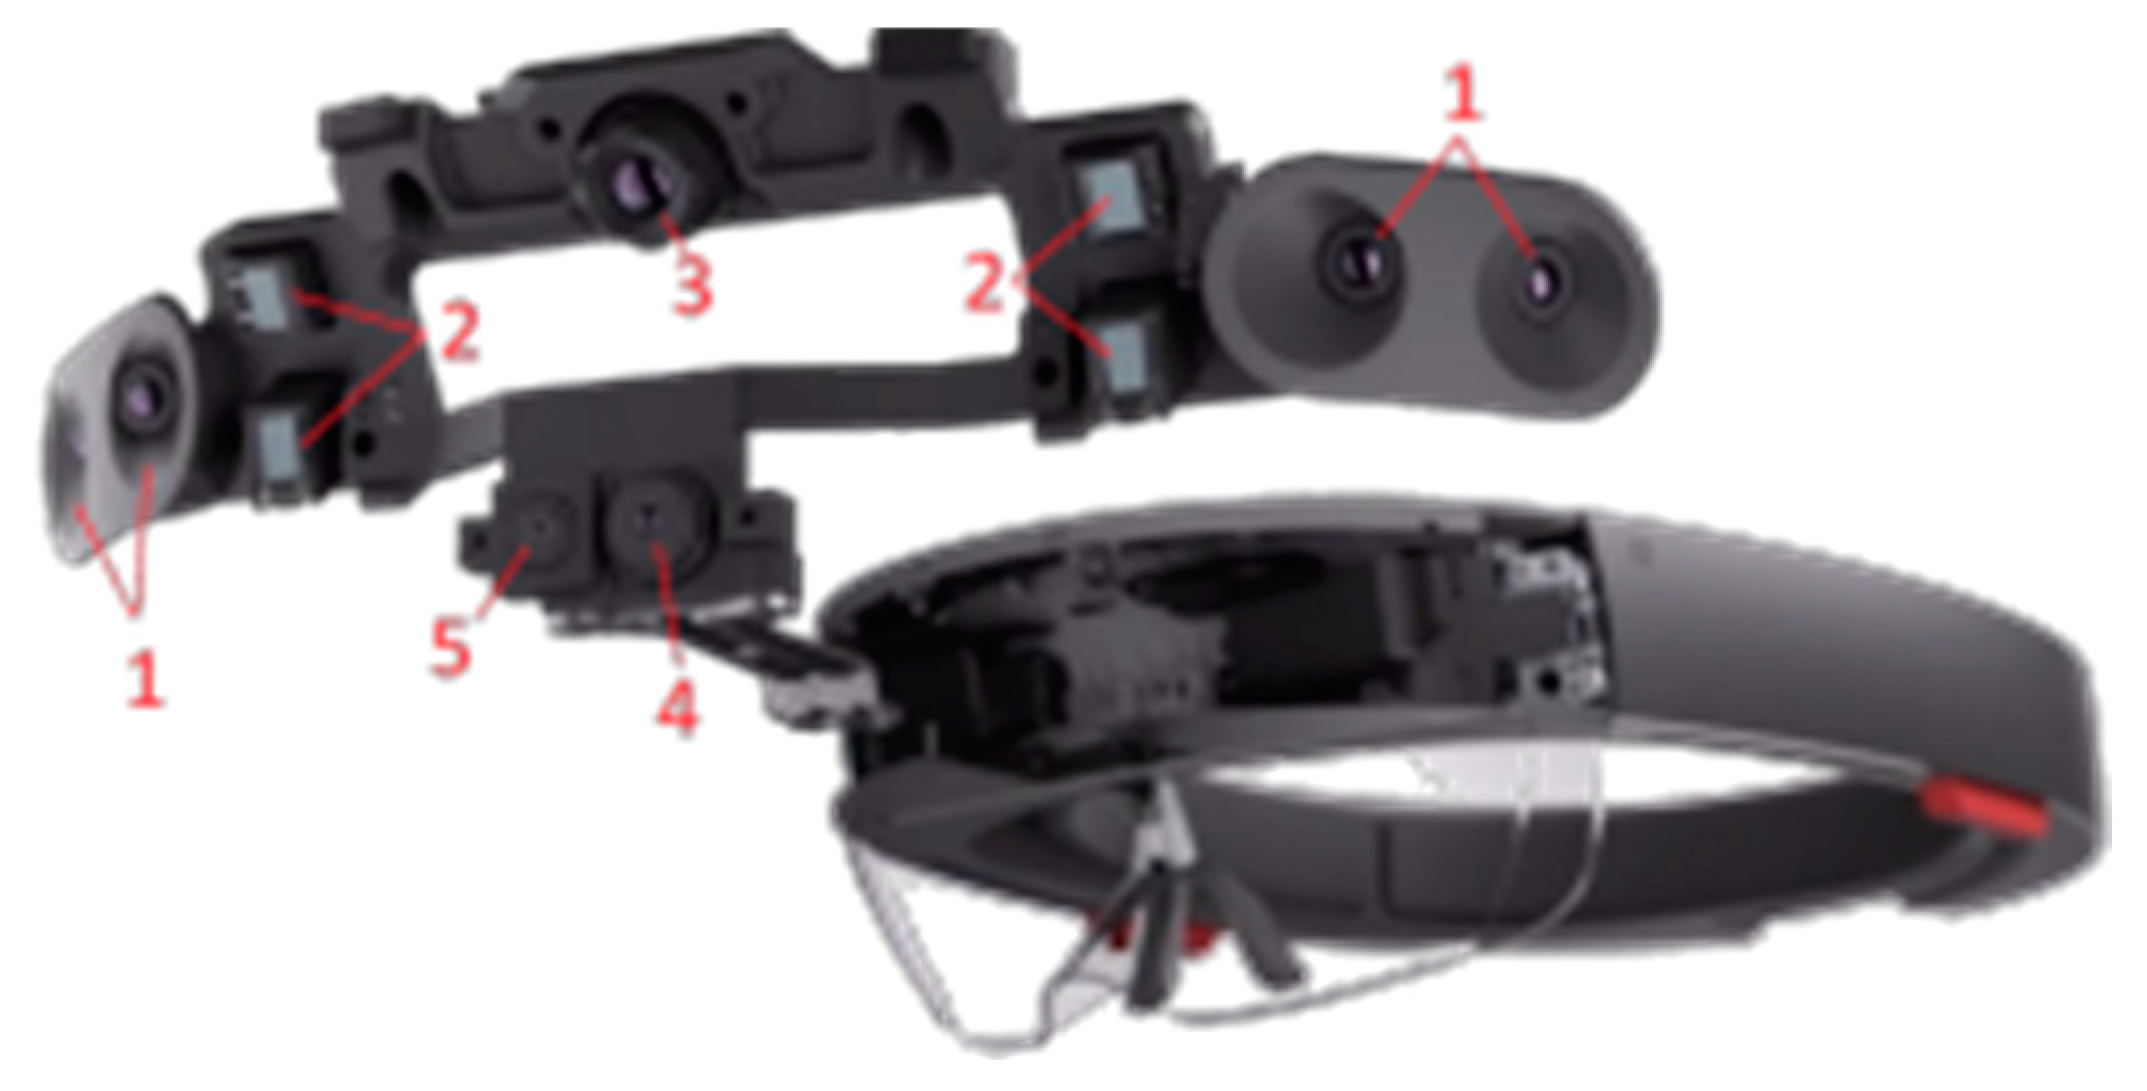
The AR device released by Microsoft Corporation in 2016 has several sensors, lenses and holographic projectors, as shown in
Figure 1. This set enables HoloLens to recognize the environment and measure its localization. The system uses depth and environmental understanding cameras to three dimensionally reconstruct the real environment. Infrared laser projectors, which make up the HoloLens, restrict the use of the device to environments free of sources emitting this light frequency.
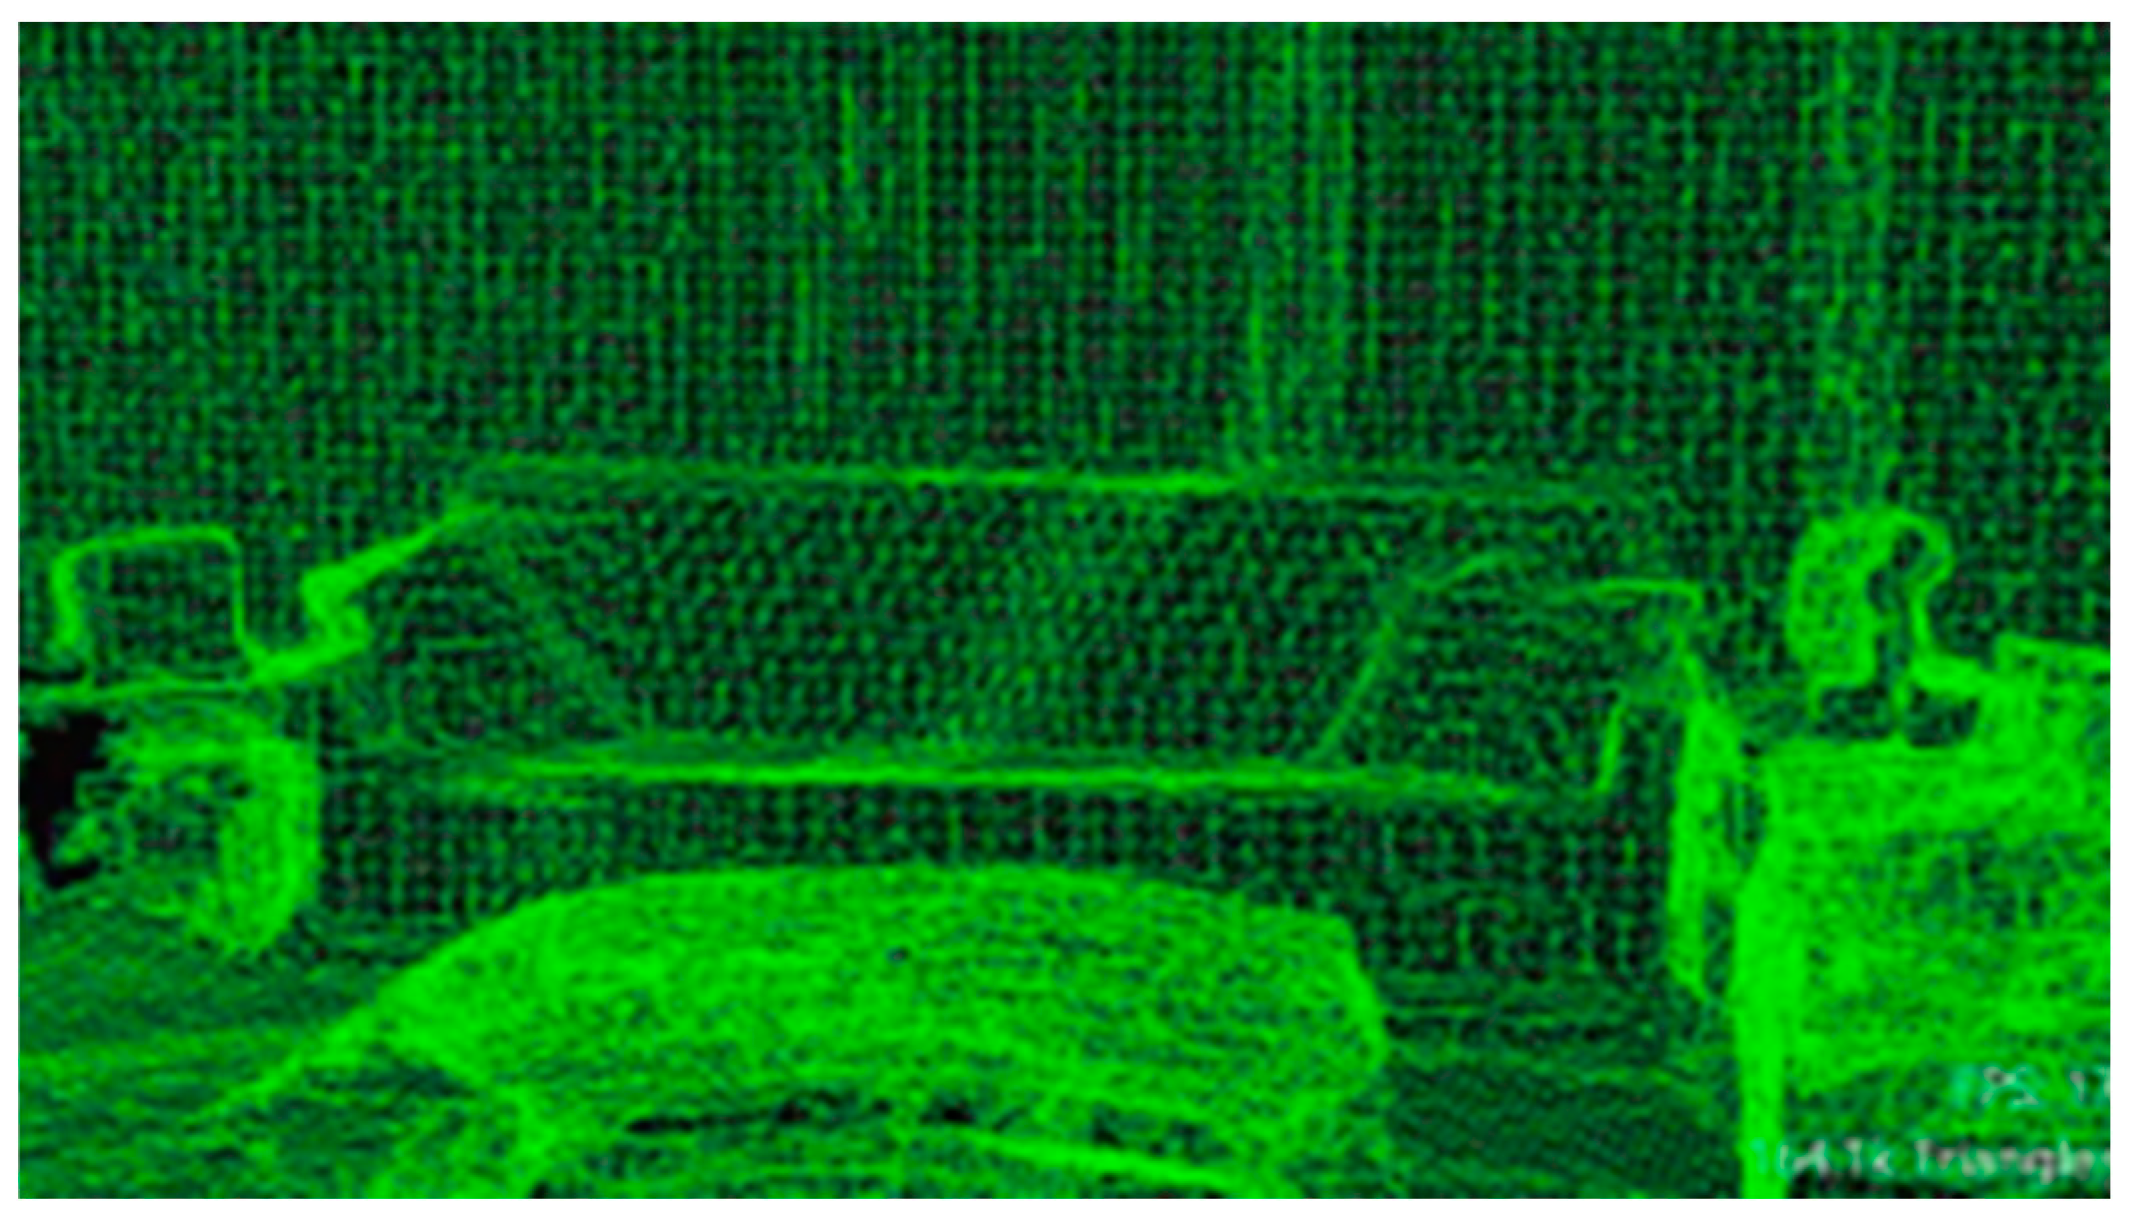
The process for representing real-world surfaces in the HoloLens is described by a triangular mesh connected to a system of spatial coordinates fixed in the mapped environment.
Figure 2 exemplifies the reconstruction as information is captured by the device sensors. The result of this process, continuously updated by the system, causes environmental changes to be reflected in the virtual context, keeping it adapted.
HoloLens allows associating virtual objects (anchors) with the mesh and reconstructing the real environment to which it is exposed. The function of an anchor is the maintenance of
location and orientation metadata relative to the real space. The documentation provided by Microsoft recommends the use of anchors in environments larger than five meters to achieve greater stability in the display of the holograms [
12].
III. PROPOSED CALIBRATION MODELS
To meet the challenges inherent to industrial environments, the scenario defined for this testing stage was the logistics warehouse of SENAI CIMATEC, located at Avenida Orlando Gomes, in Salvador, Bahia state, Brazil. This warehouse has approximately 10, 000m3, is composed of numerous equipment and components, and has characteristics such as dynamism in the composition of its internal layout and variability of lighting, noise and obstacles.
Two tests were planned. The first test was to verify and compare, in an industrial environment, the precision of the proposed two-step calibration model with a simple calibration model. The second test was to check if in fact the proposed model achieved the objective of locating and assisting in the identification of components within an industrial environment.
It is important to note that HoloLens uses its own method for creating the system of coordinates, mapping and understanding of the environment. When opening an application in HoloLens, it uses its position, i.e., its top, side and front reference to create its coordinate system. Thus, if the same application is opened with the device pointing to another direction, for example, the coordinate system will be different. Therefore, when it is necessary for holograms to appear in the same location as the physical environment, a fiducial marker (
Figure 3) is used as a calibration point to always generate the same coordinate system.
When the HoloLens moves through the scenario from a point A to any point B, it uses algorithms for mapping and understanding the world to virtually determine its position in the virtually reconstructed real setting. These algorithms will be called device self localization. They are proprietary and cannot be modified.
For use of the glasses in spaces larger than 5 meters, the documentation provided by the HoloLens manufacturer recommends the use of spatial anchors to stabilize the holograms. That is, when instantiating a hologram in space without using a spatial anchor, it is unstable and, consequently, inaccurate. A spatial anchor is a virtual representation of a set of characteristics extracted from the real world over which the system will maintain control over time and its objective is to provide a more precise position for the hologram [
12]. However, to ensure adequate precision, another important manufacturer recommendation is to always position a hologram less than three meters from a spatial anchor.
The use of anchors improves, but does not guarantee, high accuracy. There are other variables that influence the results of hologram precision and stability in an industrial scenario. One of these is calibration. As previously mentioned, the calibration strategy proposed in this study is the use of fiducial markers. The quality of the recognition of the markers proportions and orientation is indispensable to ensure the correct alignment between the virtual three-dimensional coordinates with their corresponding real three-dimensional coordinates. However, as accurate as computer vision systems may be, distortions in the dimensions and characteristics used to determine the distance and perspective of the marker add erroneous information in the translation and rotation of points in the virtual environment relative to their equivalent location in the real environment. As a consequence, there is incorrect alignment between the holograms of the virtual environment and their corresponding points in the real environment.
With the objective of mitigating the discrepancy associated with the recognition of the fiducial marker in AR systems developed for HoloLens, in this study a calibration model was developed to address the distortions caused by incorrect recognition of the marker. This model was called two-step calibration and is detailed in the next section.
A. Simple calibration
Among the possible ways to translate and rotate the points for the alignment of the virtual coordinates with the real coordinates, a typical way is to use calibration, herein called simple calibration. In this calibration, the Vuforia framework is used for marker recognition [
13].
Vuforia is used in this context to recognize the fiducial marker through computer vision and then instantiate a hologram that respects the orientation and proportions of this marker. From there, the position and orientation of this hologram are treated as the origin of the virtual coordinate system. Next, previously knowing the coordinates of any fixed point within the physical scenario which will be the origin of the real coordinate system as well as the orientation and the distance in meters between these two origins, it is possible to determine the orientation and position of the axes of both coordinate systems and thus calibrate the system.
B. Two-step calibration
The identification of the direction of the marker axes through Vuforia has an angular nature. That is, the larger this angle, the greater the divergence between the idealized virtual plane with the virtual plane created by the system. Despite the good quality of computer vision algorithms for marker recognition, distortions are still present, and small divergences in the identification of these angles can generate large inconsistencies as the user wearing the device moves away from the origin. To mitigate this axis angulation problem, we proposed a two-step calibration system. This calibration system consists of adding a second marker with a fixed and known distance and orientation relative to the first marker. This second marker aims to determine angles forming the axes more precisely. In other words, unlike simple calibration, which uses Vuforia to recognize the first marker, instantiate a hologram based on the orientation and proportions of the marker and use the position and direction of this hologram to create the axes, two-step calibration uses the first marker to determine the position of the hologram and the second marker to rotate the hologram. Only after recognizing the second marker will the axes be generated based on the hologram. It is important that the two markers are facing each other at a distance of approximately 1.5 meters.
To analyze the improvements obtained with the proposed calibration, a comparative experiment was performed between the simple, typical calibration and the two-step calibration.
IV. MATERIALS AND METHODS
To evaluate the precision (dispersion an of the samples) and accuracy (exactness) of the simple and two-steps calibrations in an industrial scenario, the prototype was programmed to perform each calibration separately so that, after the calibration step, it would be able to measure the virtual coordinates relative to the calibration system origin of markers placed in different locations within the scenario.
To configure the experimental environment, 5 points were first selected inside the warehouse. The criteria for choosing these points were as follows:
- 1)
Locations that remained the same throughout the experiment. Changes in these locations would require measurements to be reperformed;
- 2)
Locations where it was possible to measure with a laser tape measure from the point chosen as the origin to obtain a rigorous measurement (gold standard);
- 3)
Locations at different distances from the point chosen as origin;
- 4)
Locations where all markers could be placed at the same height, facilitating data analysis;
- 5)
Locations where the markers could be viewed from the front, with at least one meter of distance, so that the marker could be viewed by the HoloLens camera.
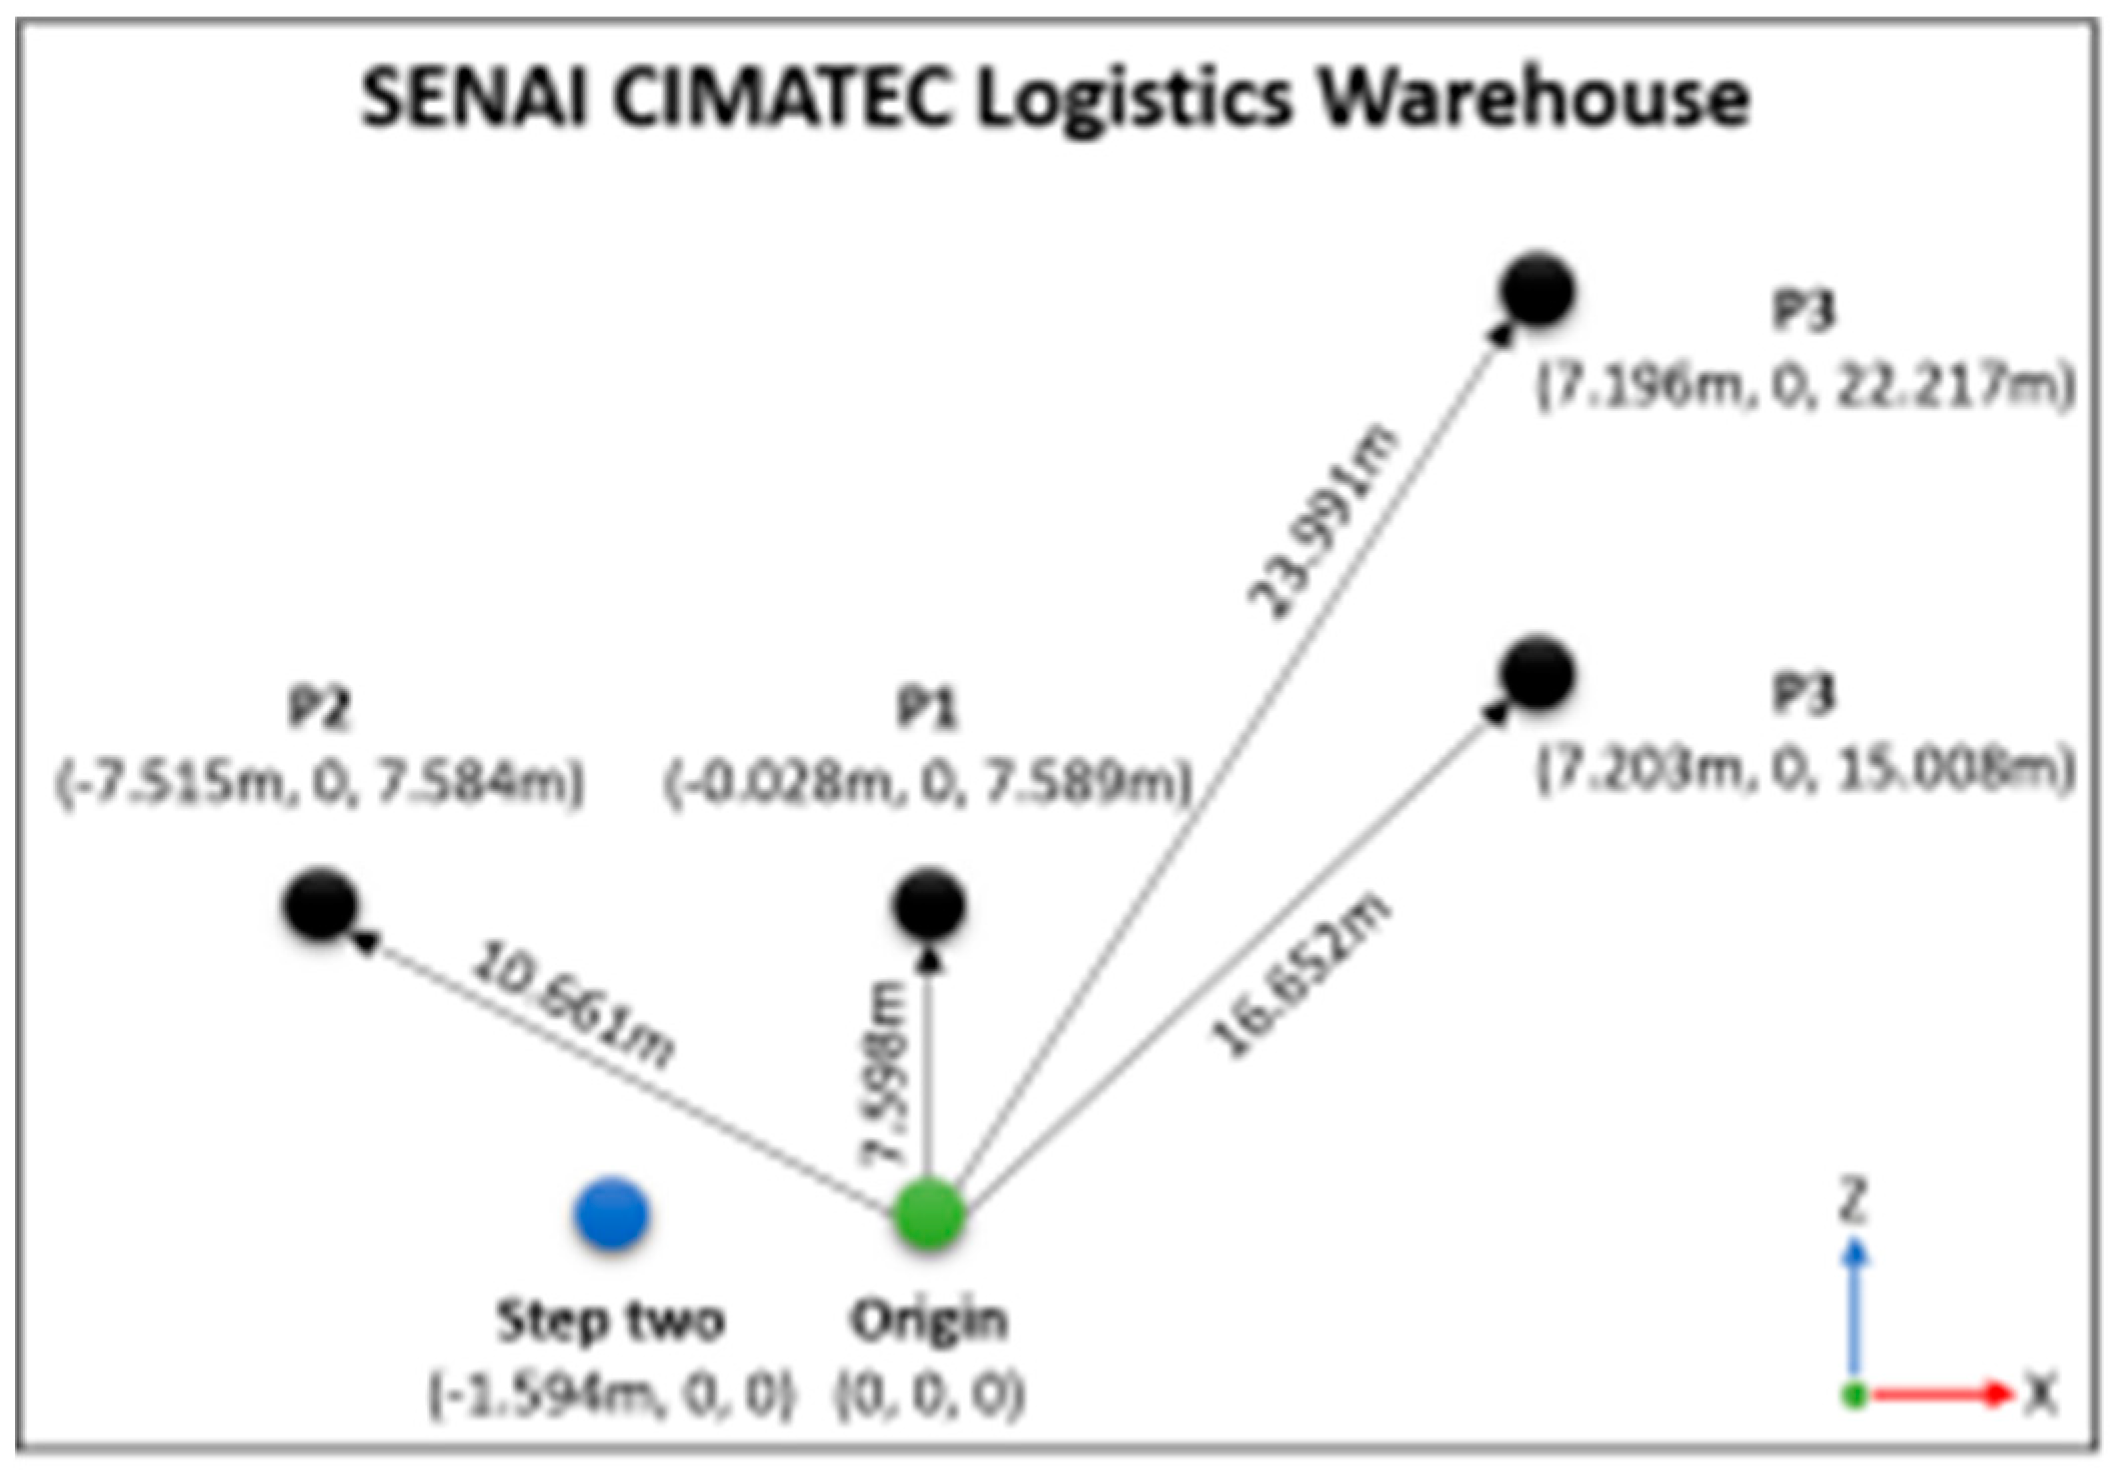
Once the points were selected, one of them was defined as the origin and a fiducial marker was placed at this point, and the exact center of this marker was used as a reference for the position of origin of both the virtual and the real coordinate systems. In addition to these markers, an additional marker was added at the same height (y-coordinate) in the direction of the negative x-axis and at 1,594 meters away from the marker of origin. In general, the second fiducial marker should be aligned with the first. This last marker is used for two-step calibration. Lastly, with the laser tape measure, the x and z coordinates of the other markers were measured from the origin.
Figure 4 shows the arrangement of the points within the scenario, as well as the measured coordinates of each point and the distance vector from the origin for each of the points.
V. RESULTS AND DISCUSSION
After setting up the environment, the experiment was started. For each type of calibration, 5 sample collections of spatial coordinates were performed at each point. Each collection consisted of running the application developed for the experiment, performing the calibration procedure, moving toward the point in question, collecting 500 samples of spatial coordinates from the marker and closing the application. To ensure equality of conditions in the behavior of the application, each time that collection was started at one of the points, the HoloLens mapping information was deleted.
The experiment generated 2,500 samples for each point, resulting in 10,000 samples for each type of calibration. To evaluate the accuracy (mean distance between the virtually measured position and the real measured position) and the precision (dispersion of the samples) of the simple and two step calibration, the following values were measured:
- 1)
Euclidean distance between the virtual coordinates and the real coordinates;
- 2)
Magnitude of the error in the evaluation of distances, which in this study is defined as the difference between the absolute value of the measured vector (actual distance from the origin to the chosen point) and the distance from the origin to the chosen point returned by the HoloLens.
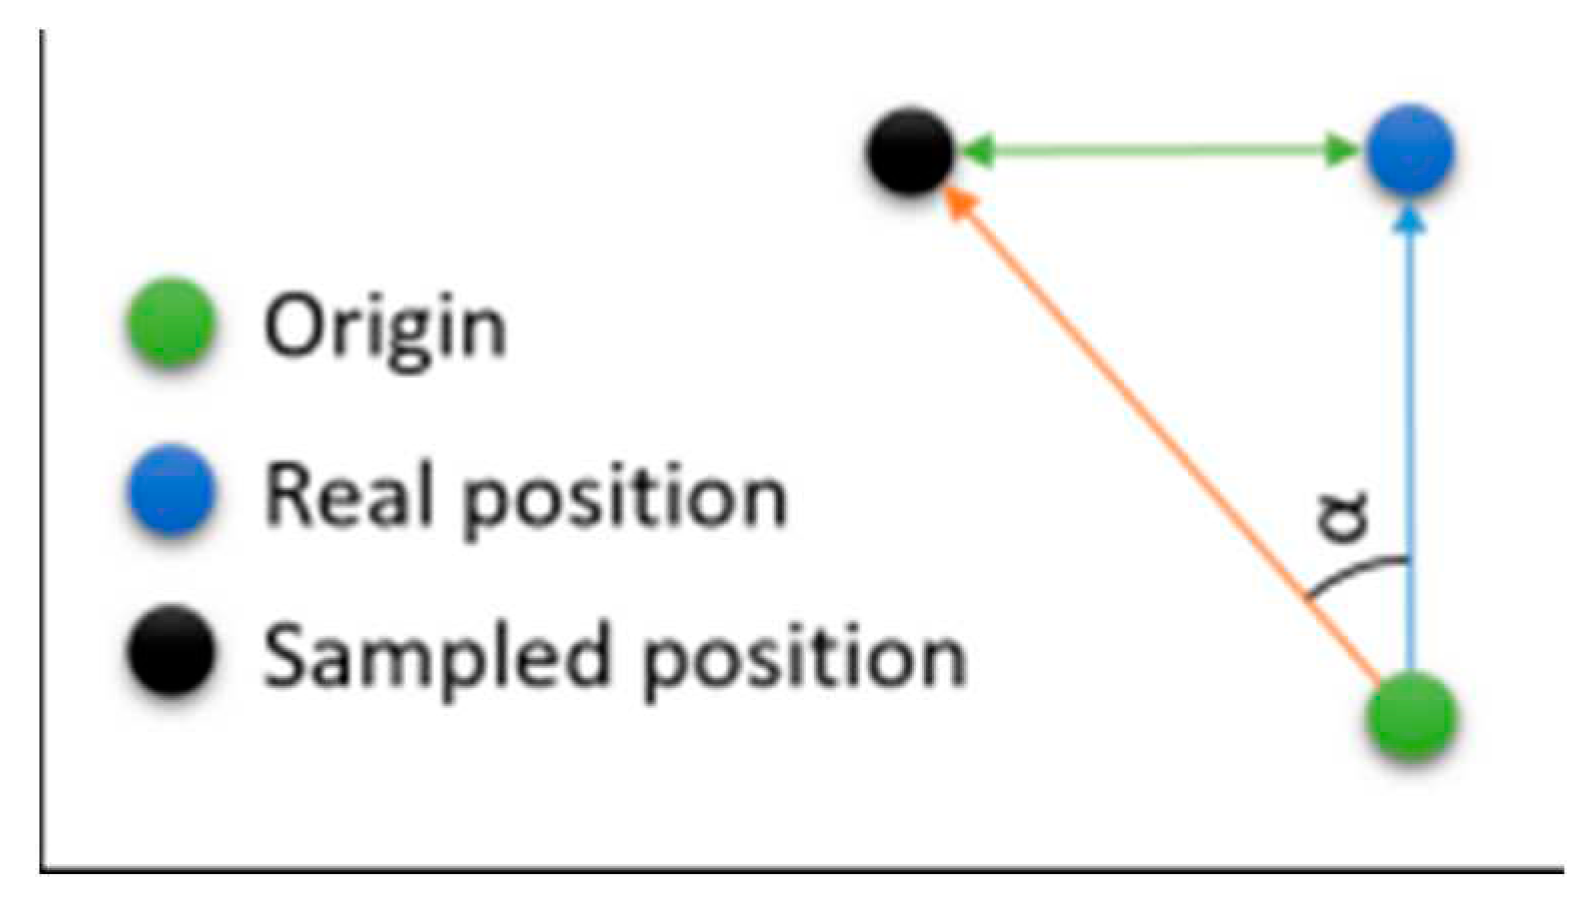
As a way to visualize the angular dispersion of the error, we also mapped the value of the angle formed at the origin between the corresponding vector to the coordinates provided by the HoloLens and the real coordinates of the points (
Figure 5). This angle, of course, is determined by the Euclidean distance obtained in (1) and by the absolute value of the real distances and those provided by the HoloLens.
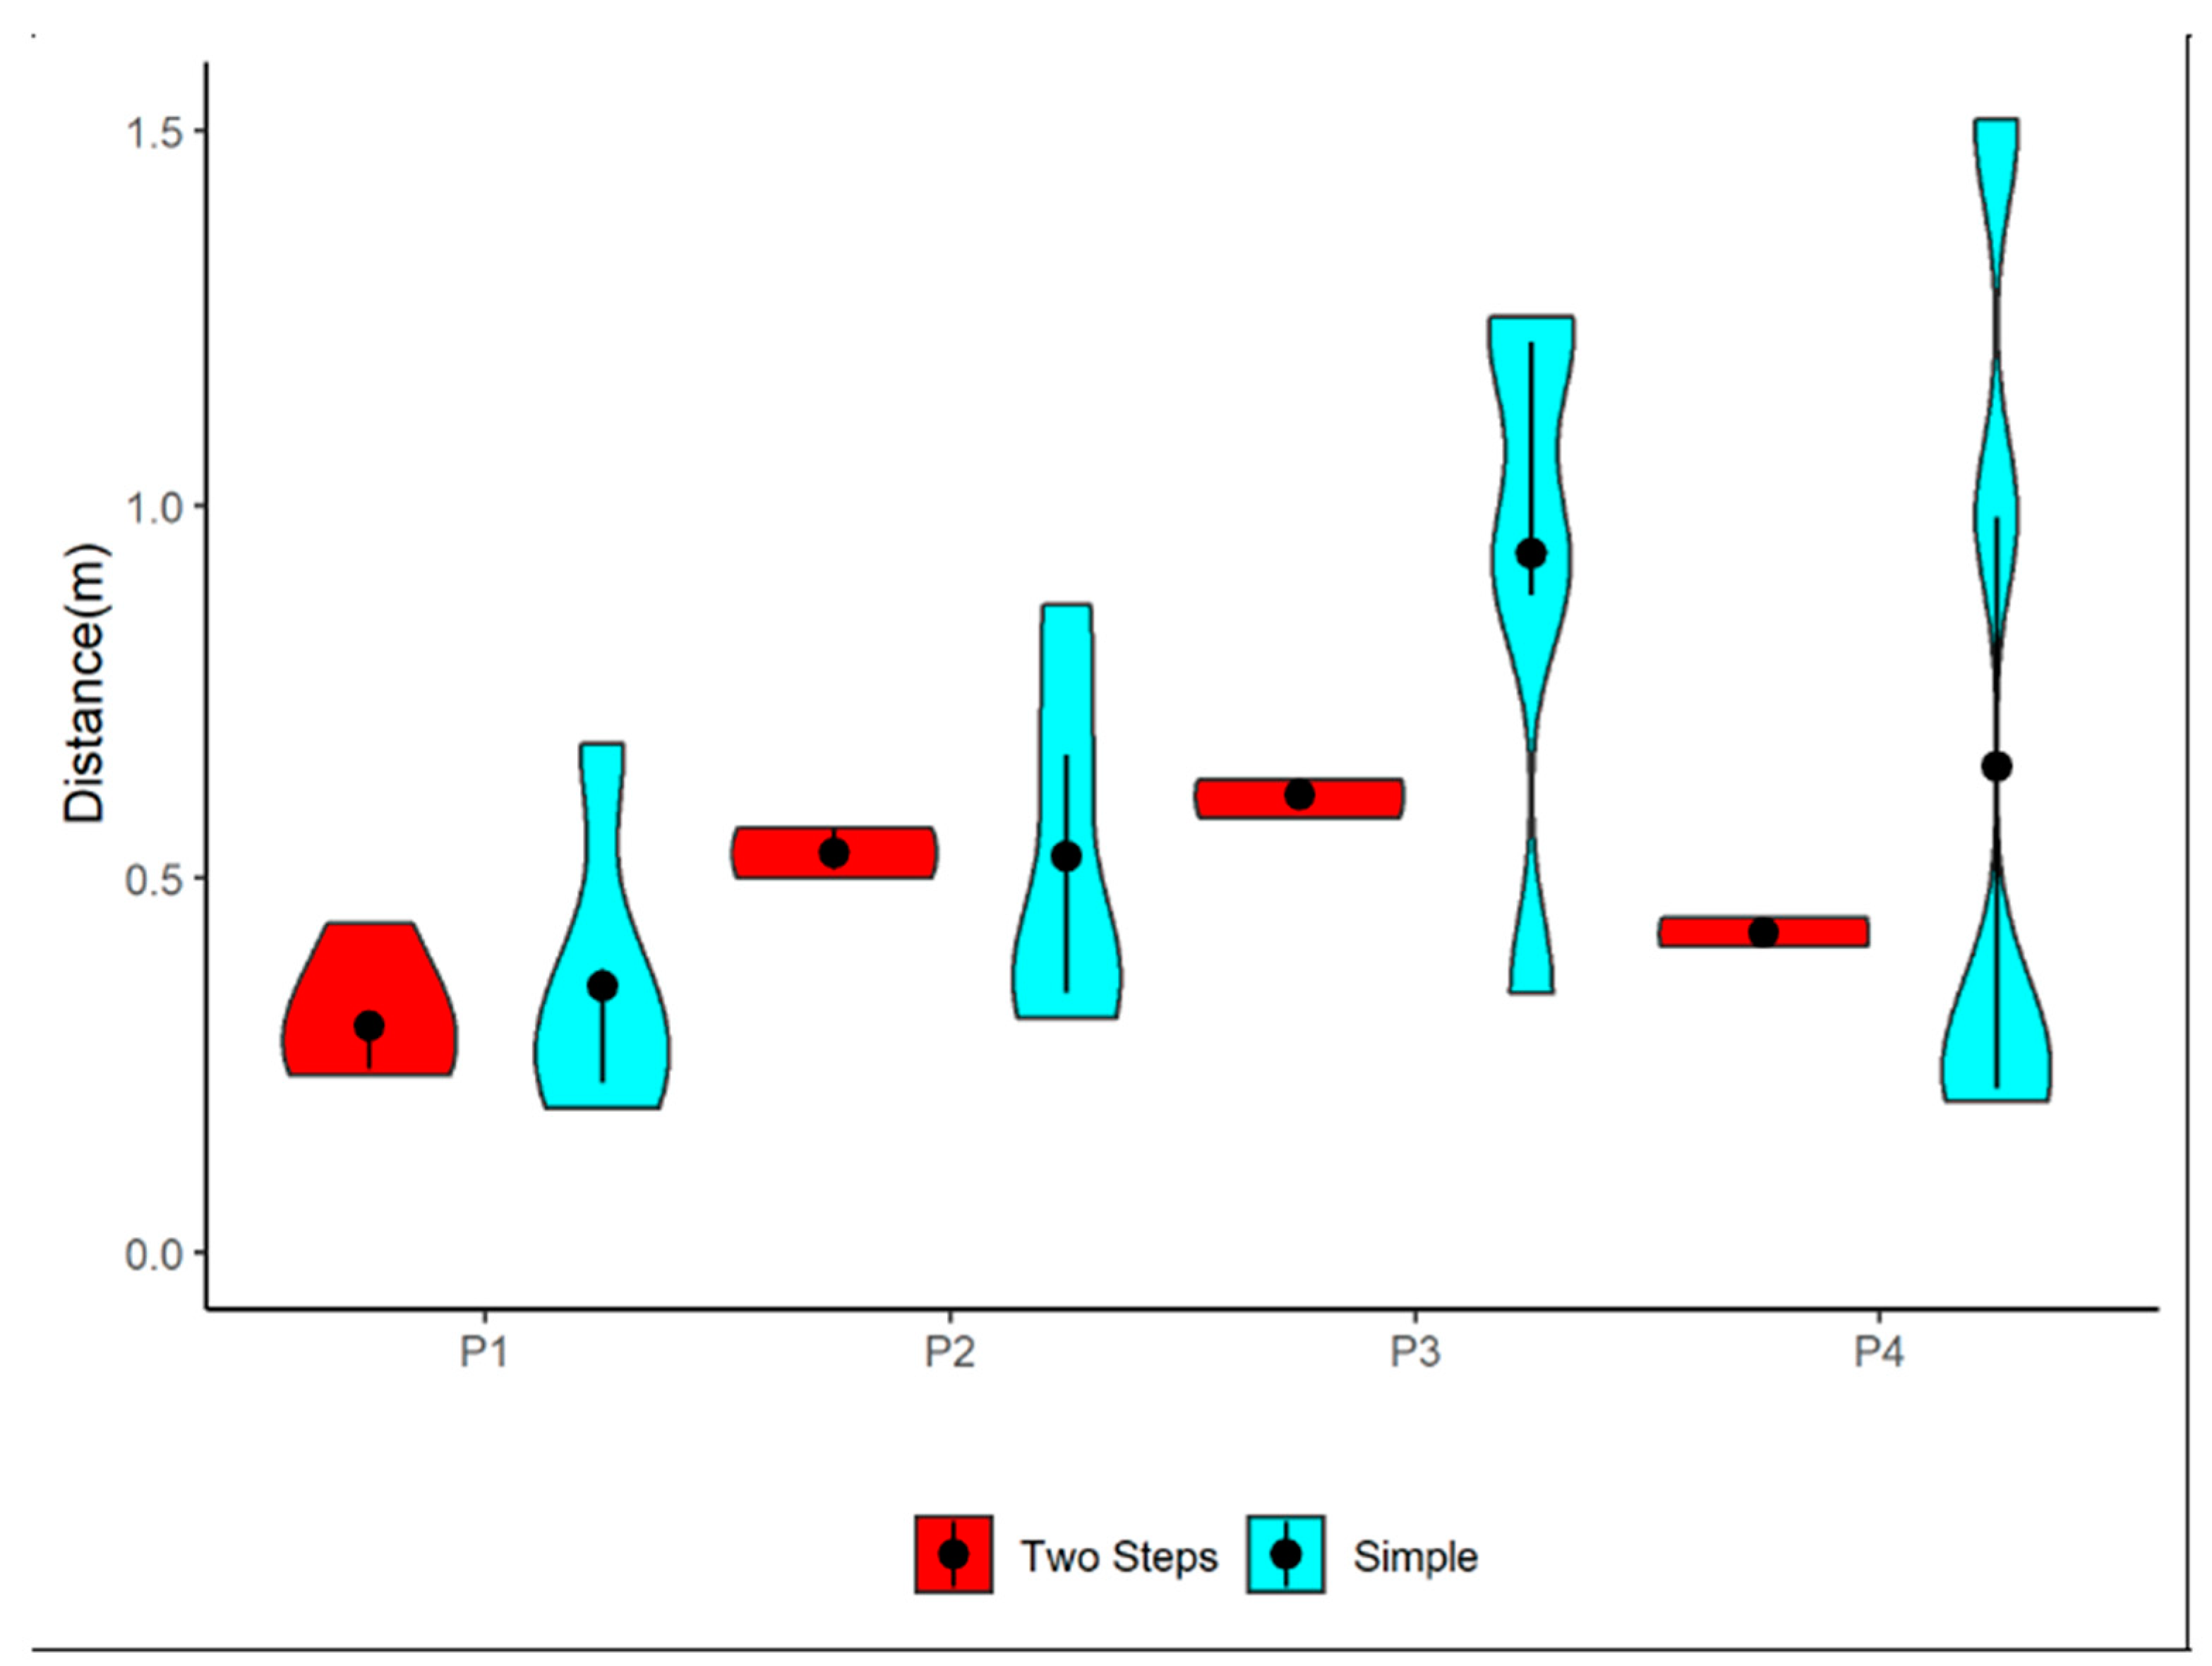
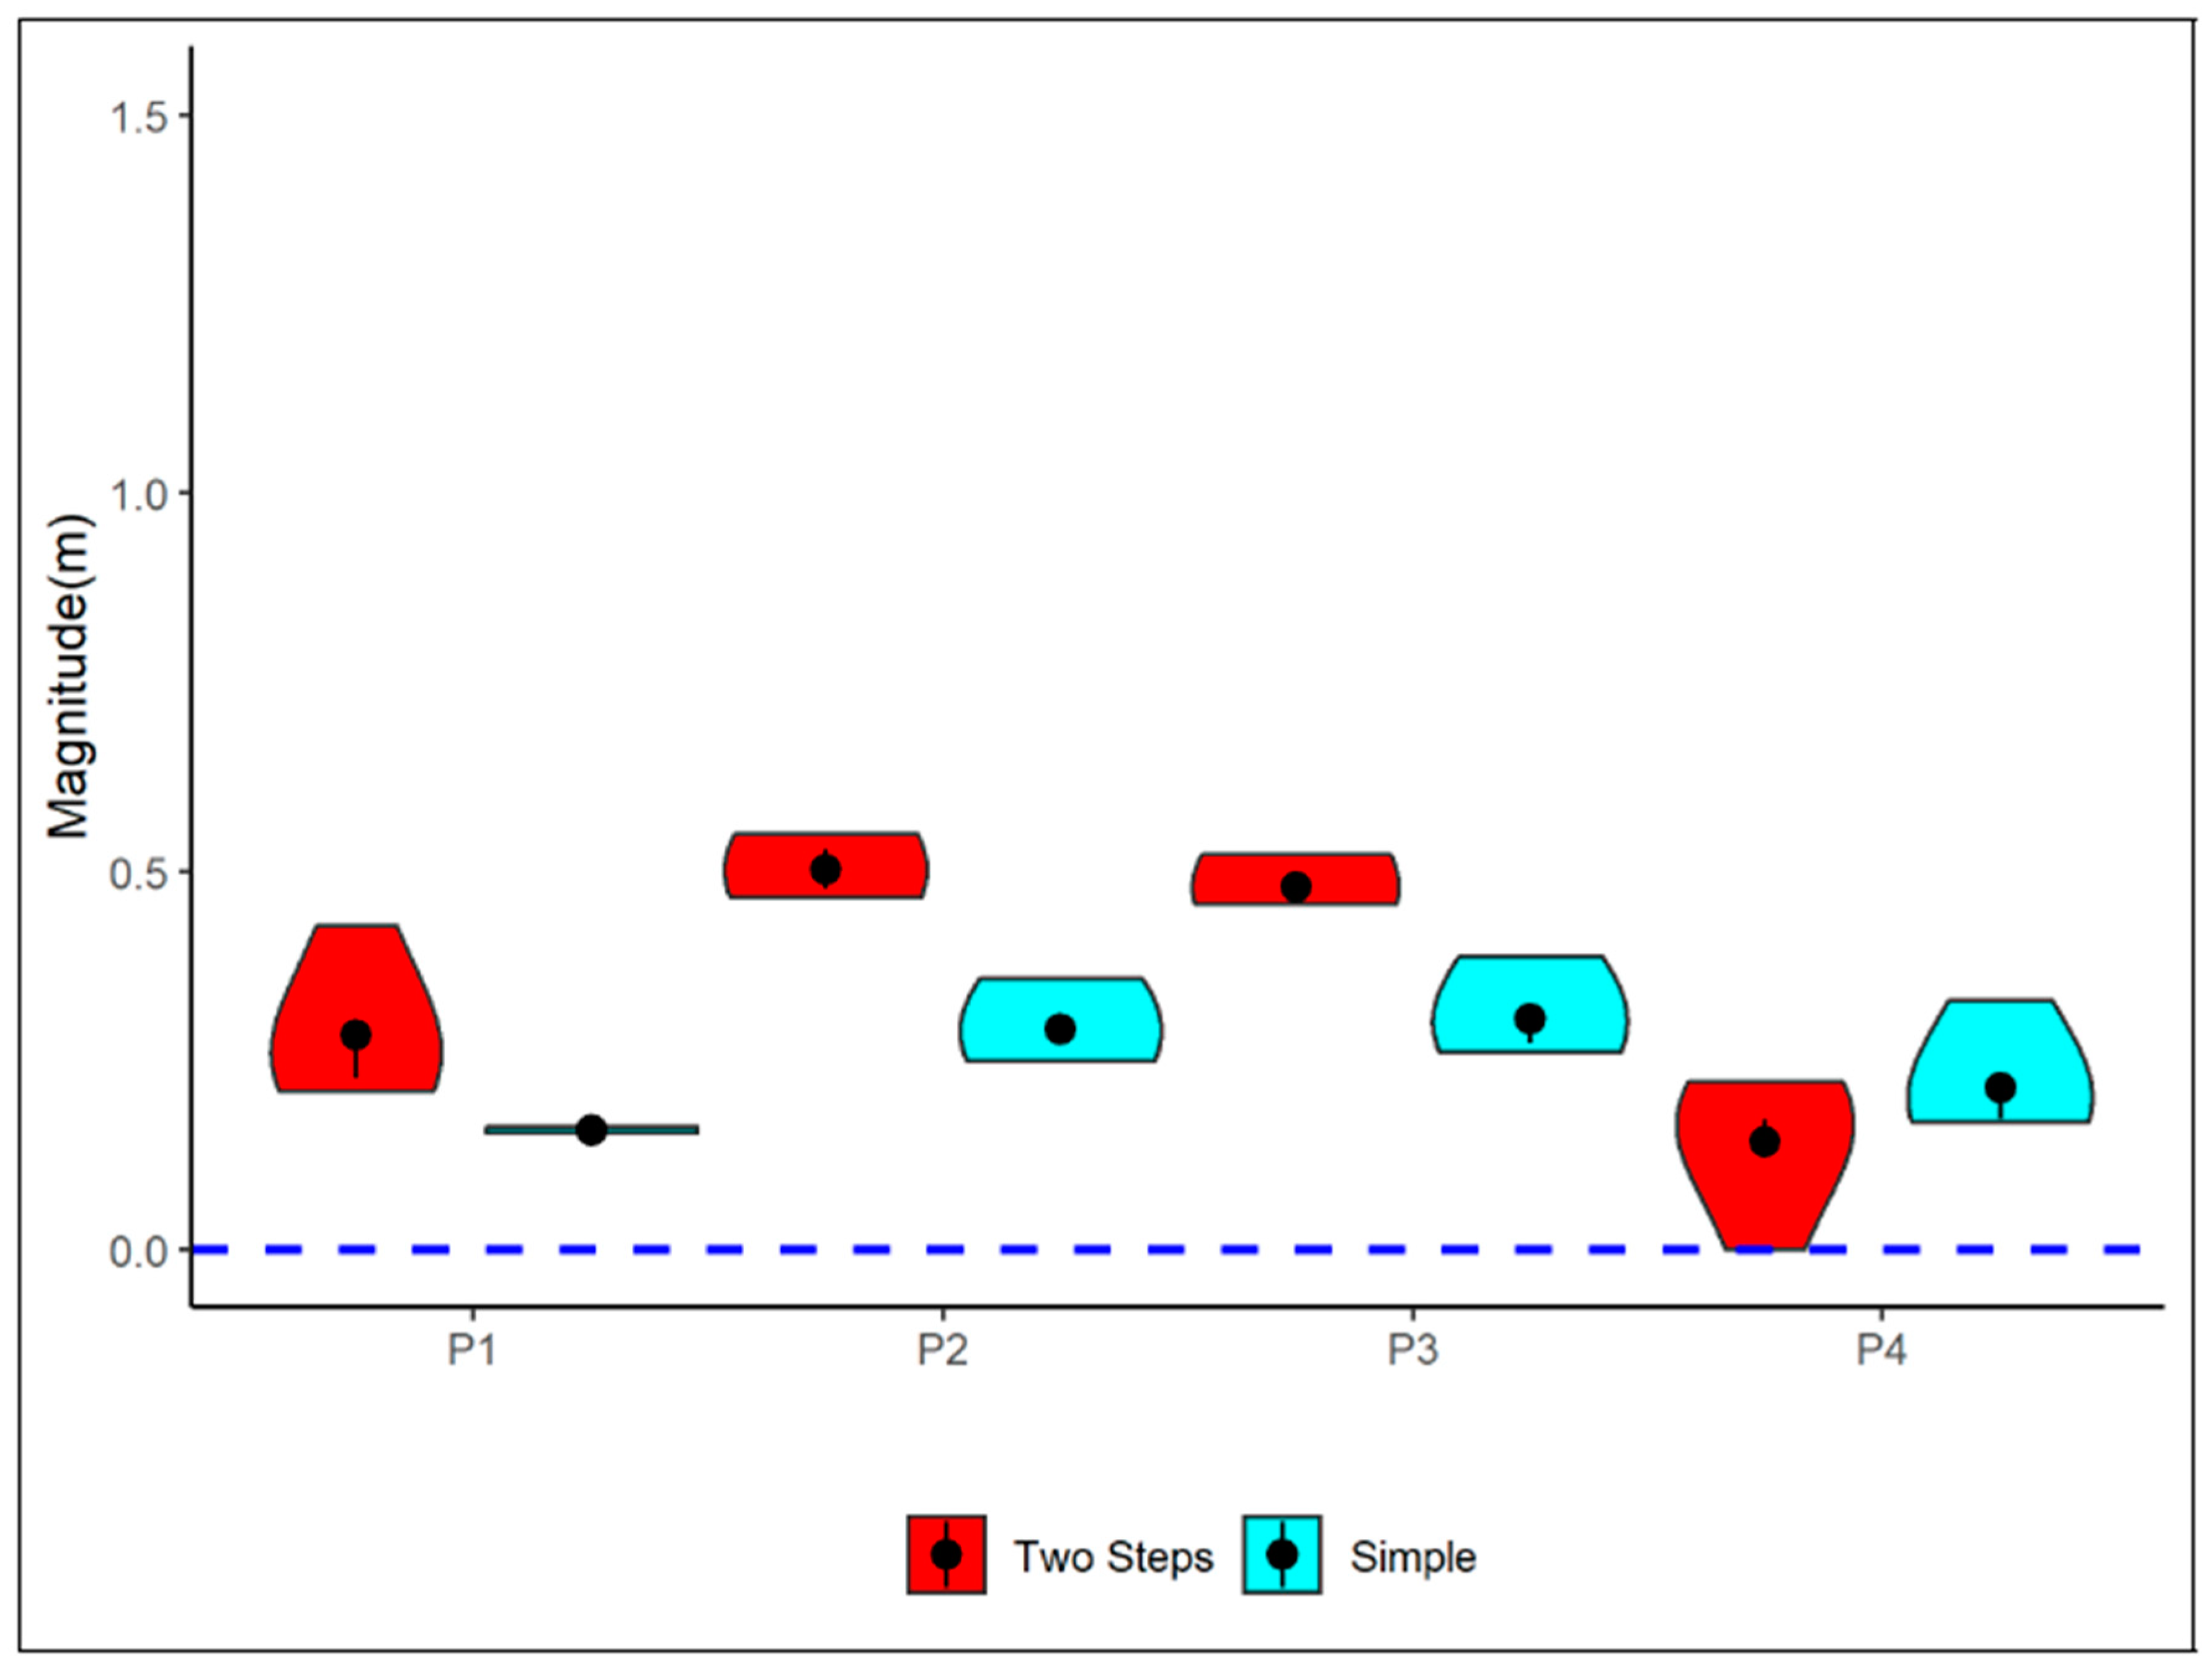
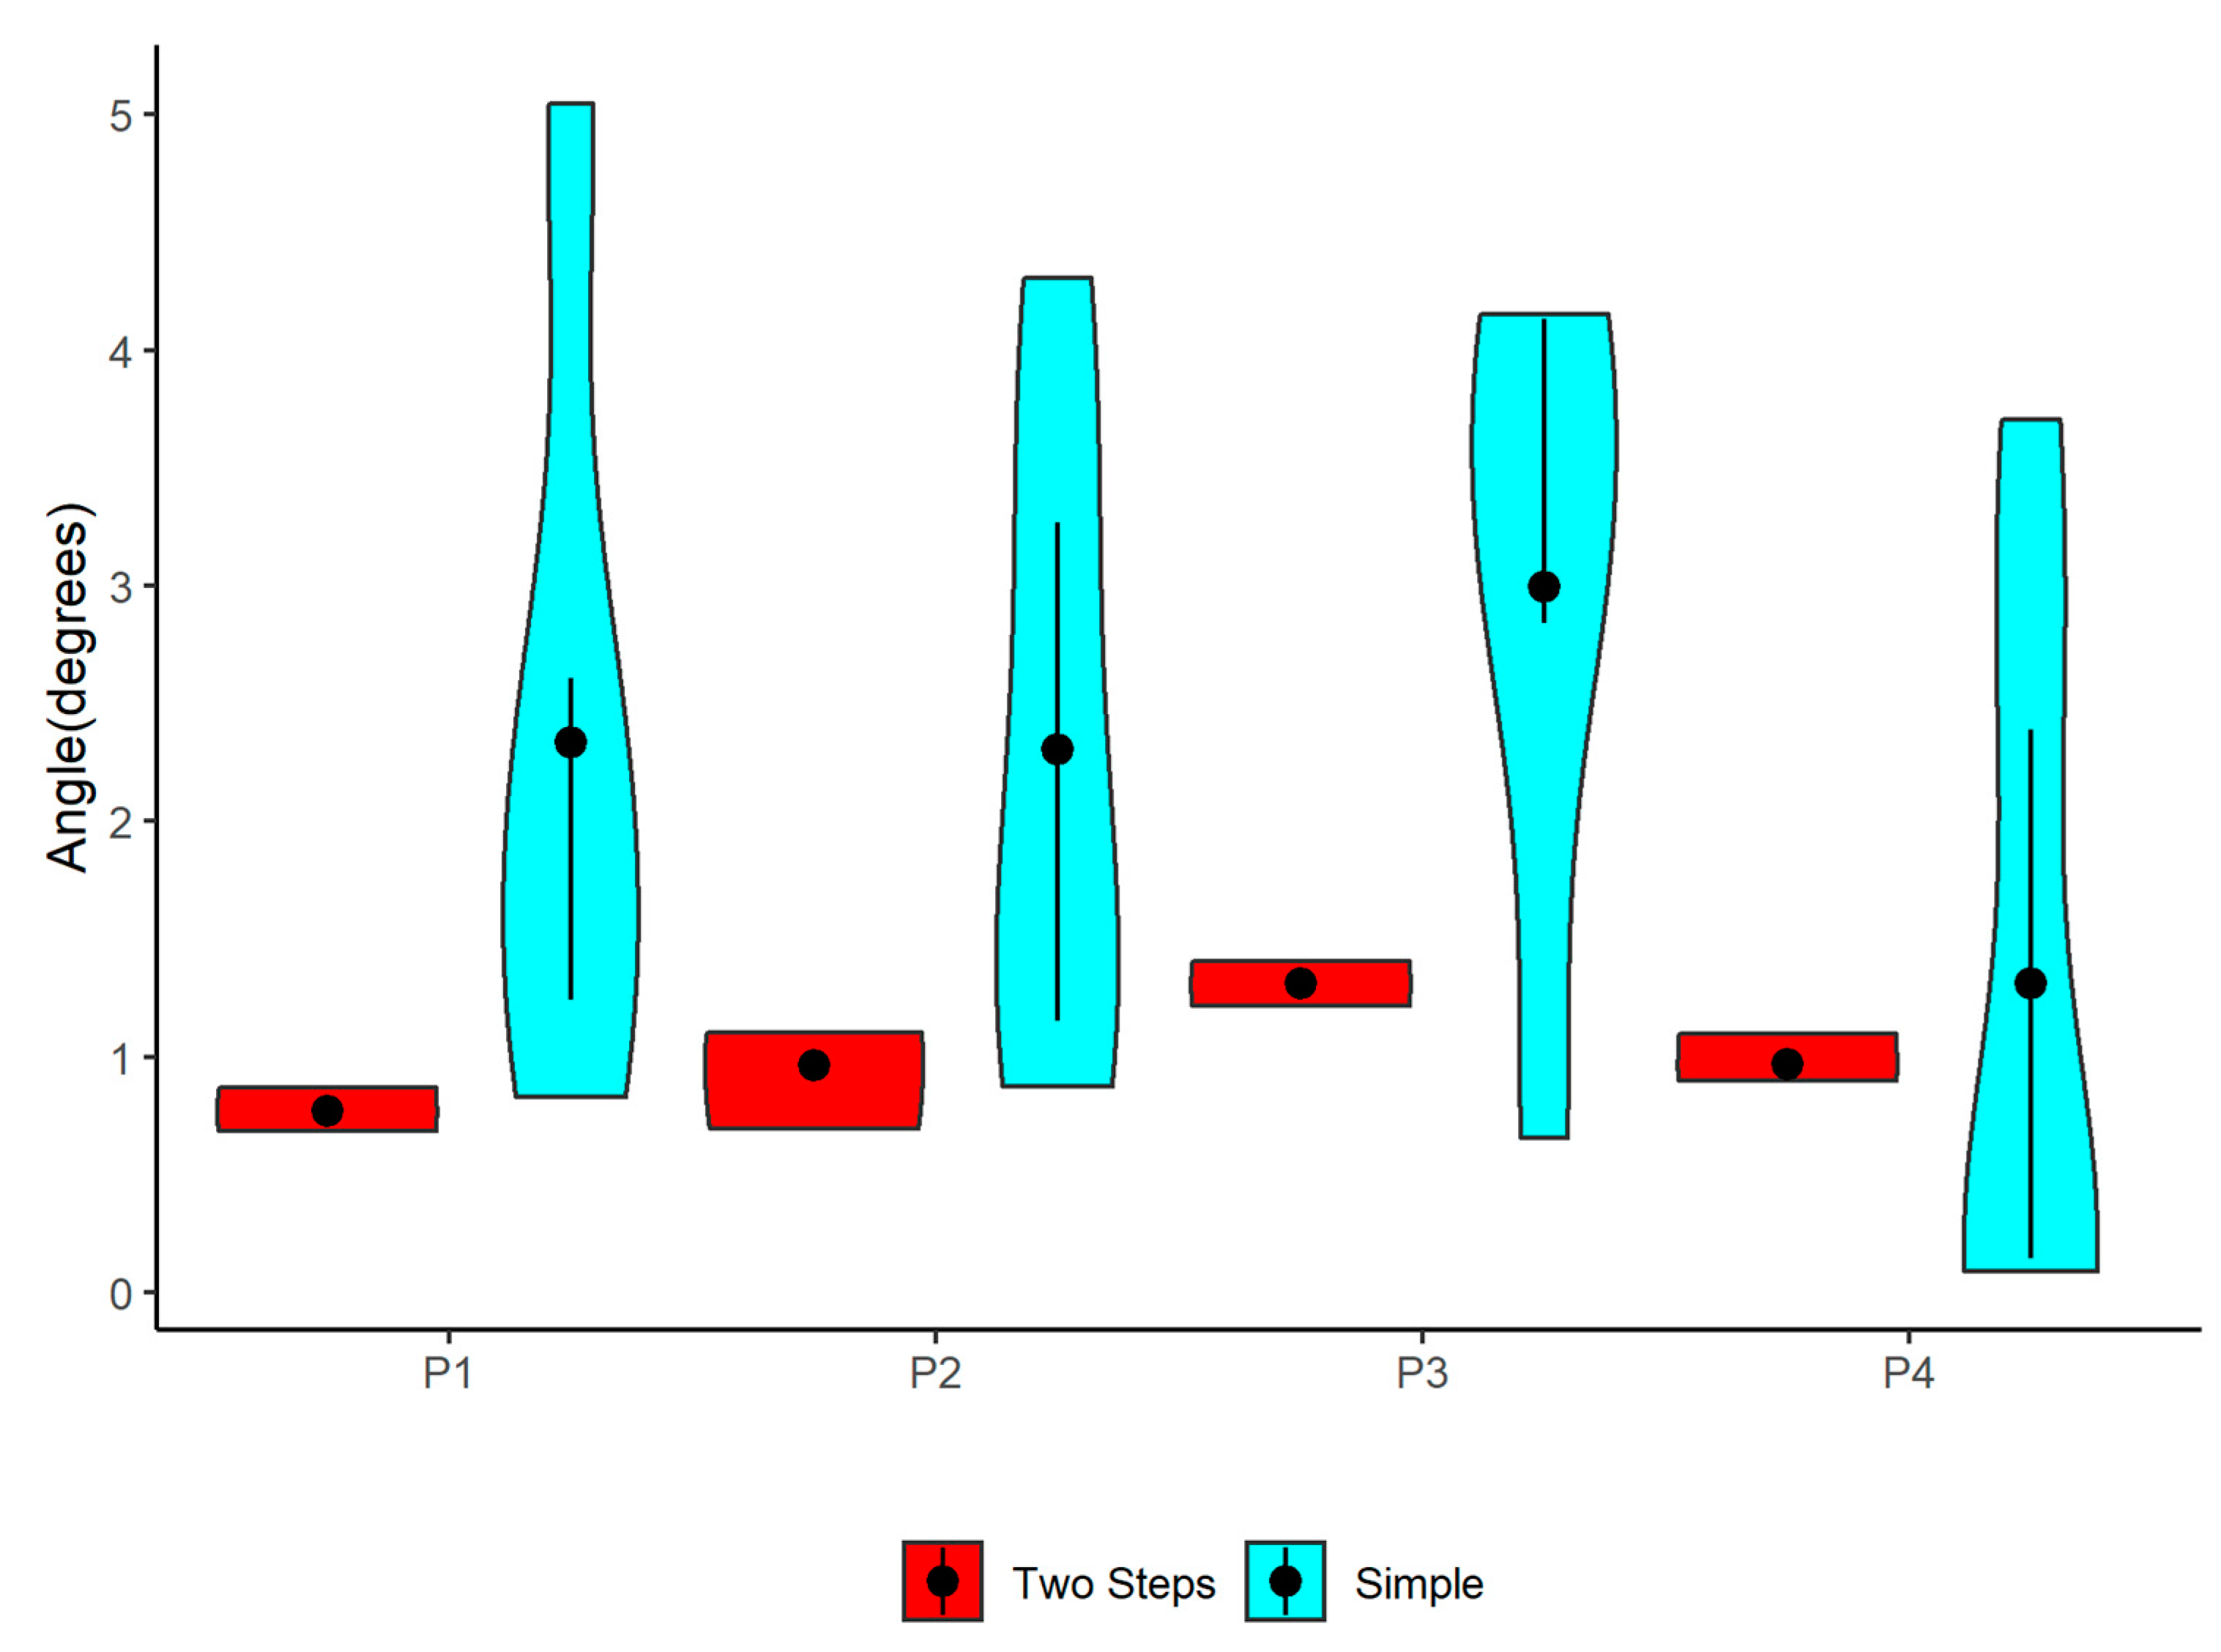
The Euclidean distance of the samples relative to the real point. Magnitude is the difference between the absolute value of the measured vector (actual distance from the origin to the chosen point) and the distance returned by the HoloLens. Angular distance is the angle formed at the origin between the corresponding vector to the coordinates provided by the HoloLens and the real coordinates of the points.
Figure 6 contains the graph containing the dispersion and the median of the Euclidean distances between the virtual coordinates and the real coordinates obtained from the samples. The graph shows that the two-step calibration was always more precise than the simple calibration at all points. Thus, we conclude that the two-step calibration contributes significantly not only to reducing the Euclidean distance between the virtual and the real coordinates but also to reducing the dispersion of the results.
Figure 7 shows the dispersion of the difference between the magnitude of the samples and the measured magnitude. Note that at some moments, the two-step calibration had a lower magnitude and/or dispersion; in others, the simple calibration was less dispersed and more precise. This seems to indicate that the error associated with the magnitude is not influenced by the calibration method.
Figure 8 shows how much the two-step calibration contributes positively to reducing the size and dispersion of the angles obtained in the samples.
VI. CONCLUSIONS
The experiments performed indicated that the calibration methods do not affect the mapping and the self-localization that the HoloLens performs when moving through the scenario. In turn, the data obtained allow us to conclude that the HoloLens mapping and self-localization system influences the measurement of virtual coordinates. The precision of the applications developed for the glasses in general depends substantially on this mapping and self- localization feature.
One factor that directly influences precision is the angular distance. Here, the two-step calibration proposed in this study has a significant influence. The tests allow us to conclude that the two-step calibration increases the precision compared to the simple calibration, and it also decreases sample dispersion.
We conclude that the two-step calibration is more suitable for use in industrial scenarios where the localization of objects with good precision is required.
References
- R. T. Azuma, “A survey of augmented reality,” Presence: Teleoperators & Virtual Environments, vol. 6, no. 4, pp. 355–385, 1997. [CrossRef]
- E. Bottani and G. Vignali, “Augmented reality technology in the manufacturing industry: A review of the last decade,” IISE Transactions, vol. 51, no. 3, pp. 284–310, mar 2019. [Online]. [CrossRef]
- Sanna, F. Manuri, F. Lamberti, G. Paravati, and P. Pezzolla, “Using handheld devices to sup port augmented reality-based maintenance and assembly tasks,” in 2015 IEEE International Conference on Consumer Electronics, ICCE 2015, 2015, pp. 178–179, cited By :16. [Online]. Available: www.scopus.com. [CrossRef]
- M. Funk, T. Kosch, and A. Schmidt, “Interactive worker assistance: Comparing the effects of in-situ projection, head-mounted displays, tablet, and paper instructions,” in Proceedings of the 2016 ACM International Joint Conference on Pervasive and Ubiquitous Computing, ser. UbiComp ’16. New York, NY, USA: ACM, 2016, pp. 934–939. [Online]. [CrossRef]
- T. Masood and J. Egger, “Augmented reality in support of Industry 4.0—Implementation challenges and success factors,” Robotics and Computer-Integrated Manufacturing, vol. 58, pp. 181–195, aug 2019. [Online]. Available: https://linkinghub.elsevier.com/retrieve/pii/S0736584518304101. [CrossRef]
- M. Gattullo, G. W. Scurati, M. Fiorentino, A. E. Uva, F. Ferrise, and M. Bordegoni, “Towards augmented reality manuals for industry 4.0: A methodology,” Robotics and Computer-Integrated Manufacturing, vol. 56, pp. 276 – 286, 2019. [Online]. Available: http://www.sciencedirect.com/science/article/pii/S0736584518301236. [CrossRef]
- M. Neges, C. Koch, M. Konig, and M. Abramovici, “Combining visual ¨ natural markers and imu for improved ar based indoor navigation,” Advanced Engineering Informatics, vol. 31, pp. 18–31, 2017. [CrossRef]
- BIS Research, “Global Augmented Reality and Mixed Reality Market-Analysis and Forecast (2018-2025),” BIS Research, Tech. Rep., 2018. [Online]. Available: https://bisresearch.com/industry report/global-augmented-reality-mixed-reality-market-2025.html.
- Martinetti, H. C. Marques, S. Singh, and L. van Dongen, “Reflections on the Limited Pervasiveness of Augmented Reality in Industrial Sectors,” Applied Sciences, vol. 9, no. 16, p. 3382, aug 2019. [Online]. Available: https://www.mdpi.com/2076-3417/9/16/3382. [CrossRef]
- Syberfeldt, M. Holm, O. Danielsson, L. Wang, and R. L. Brewster, “Support systems on the industrial shop-floors of the future operators perspective on augmented reality,” Procedia CIRP, vol. 44, pp. 108 – 113, 2016, 6th CIRP Conference on Assembly Technologies and Systems (CATS). [Online]. Available: http://www.sciencedirect.com/science/article/pii/S2212827116002341. [CrossRef]
- Y. Liu, H. Dong, L. Zhang, and A. El Saddik, “Technical evaluation of hololens for multimedia: a first look,” IEEE MultiMedia, vol. 25, no. 4, pp. 8–18, 2018. [CrossRef]
- “Spatial mapping - mixed reality,” 2018. [Online]. Available: https://docs.microsoft.com/en-us/windows/mixed-reality/spatial mapping.
- PTC, “Vuforia,” 2018, available from: https://developer.vuforia.com/. Accessed on: May 2020.
|
Disclaimer/Publisher’s Note: The statements, opinions and data contained in all publications are solely those of the individual author(s) and contributor(s) and not of MDPI and/or the editor(s). MDPI and/or the editor(s) disclaim responsibility for any injury to people or property resulting from any ideas, methods, instructions or products referred to in the content. |
© 2023 by the authors. Licensee MDPI, Basel, Switzerland. This article is an open access article distributed under the terms and conditions of the Creative Commons Attribution (CC BY) license (http://creativecommons.org/licenses/by/4.0/).
