
Submitted:
11 September 2023
Posted:
13 September 2023
You are already at the latest version
Abstract
The results of muonographic study of two objects in the cave complex of the unique historical and archaeological memorial, the Holy Dormition Pskovo-Pechersky Monastery, are presented. The experimental technology is based on the use of nuclear emulsion detectors.
Keywords:
nuclear emulsions
; cosmic ray muons
; muonography
; automatic scanning systems
1. Introduction
The muonography method which is the "shining through" the extended objects underground and on the Earth surface using cosmic radiation, was first proposed by Academician P.P. Lazarev in 1926. However, muon, the particle of the cosmic origin most relevant for such shining through, was discovered later - in 1936. The practical application of the muonography method based on electronic equipment began in 1955. [1]. The peculiarities of electronic detectors (the need for power supply, continuous monitoring during exposure, lower limits of the detector size, etc.) significantly limited the possibilities of the method. The recent years’ renaissance of the muonography method owes to advances in experimental techniques utilizing photographic nuclear emulsions [2,3]. The creation of high-performance automated microscope complexes has solved the problem of emulsion scanning and efficient processing of large volumes of experimental data [4,5,6,7,8,9,10]. One scanning station processes tens of thousands of tracks in an emulsion layer per second, which in manual processing takes years of work by a skilled operator.
The muonography method is used to study large, up to kilometer-sized objects: natural (mountains, volcanoes, glacial plates, structural features on other planets), industrial (mines, bridges, dams, blast furnaces, nuclear reactors), historical and architectural (pyramids, buildings, temples, grottoes, etc.) [11,12,13,14,15,16,17]. Numerous muonography experiments are currently being conducted around the world [18,19,20,21,22,23,24,25,26,27,28,29,30,31,32]. A key feature of the method is non-invasiveness of the research, i.e. it allows studying the internal structure of objects without violation their integrity. This virtue is of fundamental importance in the study of engineering structures and historical memorials.
The first muonographic study of a cultural heritage site was the study of the internal structure of Chephren’s Pyramid in Egypt by the team of Nobel laureate L. Alvarez [33,34] during which about ten percent of the pyramid's volume was studied, and a conclusion of absence of internal voids or compactions was made. In 2016-2017, an international research team conducted a muonography experiment based on emulsion track detectors in Khufu’s Pyramid [35], which uncovered a previously unknown large chamber, marking the first major discovery in Egyptian pyramid research since the 19th century. This remarkable result convincingly demonstrated the success of the muonography method based on emulsion detectors, particularly in the study of historical and archaeological sites.
The authors of the presented work carried out several muonographic projects, which included the study of cultural heritage sites on the territory of the Russian Federation. In the architectural complex of the Naryn-Kala Citadel (Derbent, Dagestan), a UNESCO World Heritage Site, an underground cross-dome structure was surveyed. The data obtained allowed to determine the thickness of its walls [36].
Another experiment by the method of muonography was successfully performed on the territory of the Holy Trinity Danilov Monastery in Pereslavl-Zalessky (Yaroslavl region), the object of federal significance. Two hidden rooms in the walled-in part of the basement of the Church of the Praise of the Mother of God, areas of increased density in inaccessible parts of the basement of this building, and two large cavities of unknown purpose located underground in the area between the churches, possibly ancient crypts, were discovered [37]. In 2022, research at the Holy Trinity Danilov Monastery was awarded one of the most prestigious prizes in Russia in the field of natural sciences, the prize by Metropolitan of Moscow and Kolomna Macarius, in the nomination "Methods of natural and exact sciences in the study of the history of the Church, Christian antiquities and cultural heritage of Russia and Slavic countries, innovative technologies ensuring high quality of heritage preservation" [38].
This paper presents the results of the study of two objects of the unique cave church in the Holy Dormition Pskovo-Pechersky Monastery: the crypt hidden behind a large icon at the entrance to the caves and the Trinity Street in the caves.
2. Method
Muons are formed as a result of decays of charged π- and Κ-mesons, which are products of primary cosmic particle interactions with the nuclei of atmospheric atoms. Cosmic muon fluxes account for about 80% of all observed secondary cosmic ray particles at sea level. In its physical properties, muon is similar to electron, except its mass (106 MeV) which is two orders of magnitude greater than the electron mass. Since the intensity of bremsstrahlung is inversely proportional to the squared particle mass, the muon radiation losses are negligible compared to the electron, and at the same initial velocity, the muon path is thousands of times greater than that of the electron.
The muon lifetime τ0 in the intrinsic coordinate system is about 2.197×10⁻⁶ seconds. However, according to the special theory of relativity, due to relativistic time dilation, atmospheric muons at a speed close to the speed of light, in the Earth's reference frame live significantly longer and can cover considerable distances. For example, the lifetime of a muon with a relatively small energy E = 1 GeV makes τ = τ0 γ ≈ 21 μs, and this muon is able to pass about cτ≈ 6.3 km.
Muons, which are not nuclear-active particles, lose their energy mainly in electromagnetic interactions with electrons and nuclei of a substance. The absence of strong interactions and the relatively large rest mass of muons determine their high penetrating power compared to hadrons, electrons and γ-quanta. As a result, muons not only overcome the entire atmosphere, but also penetrate into the ground to a depth determined by the magnitude of their energy. Muons with energies E ~ 1012 – 1013 eV reaching sea level were recorded in underground experiments at a depth of up to 8.6 km of water equivalent (about 2 km of rocky soil) [39]. The flux of penetrating muons makes about 104 particles/(m2⸳min) at sea level.
The principle of the muonography method is based on comparing the degree of absorption of atmospheric muons by different parts of the object under study. The varying degree of attenuation of muon fluxes from different directions makes it possible to recognize the location and size of inhomogeneities inside the object. Since the absorption of muons depends on the amount of matter they pass in the direction (θ, φ), variations in the recorded muon fluxes in these variables may indicate features in the distribution of material inside the object under study in the corresponding direction. Thus, to study the features of the internal structure of an object, one has to analyze the angular distributions of muon fluxes passing through the object and registered in the detectors. The most informative is the setting up of an experiment with several detectors, which makes it possible to obtain a 3D distribution of the material in the selected directions.
Charged particle emulsion detectors have the highest spatial (<1 µm) and angular (~1 msr) resolution compared to the other ones. The advantages of nuclear emulsions also include continuous sensitivity, large information capacity, compact dimensions (from 10 cm2 to 1 m2), ease of transportation and operation in conditions of limited availability. In addition, as mentioned before, the nuclear emulsion technology is independent from power supply sources, electronic reading systems, etc., i.e. no additional infrastructure is required during the exposure.
After the development of irradiated nuclear emulsions, measurements in emulsion films are performed on automated optical microscopes that provide scanning speeds of up to hundreds of cm2/hour, which allows processing large amounts of data in real time. Data processing makes it possible to obtain angular distributions of the registered muon tracks, the density of which, depending on the duration of exposure, can reach several thousand per square meter. The experiment presented in this article was carried out using thirteen emulsion detectors.
The modern level of data processing and analysis of emulsion experiments in Russia has been achieved at the PAVICOM high-tech measuring complex [40]. Using the author's software, PAVICOM in full automation mode searches and digitizes the spatial and angular coordinates of the charged particles tracks, recognizes and follows tracks in the detector volume, systematizes and processes data.
3. Experiment
Currently, two objects of the cave temple of the Holy Dormition Pskovo-Pechersky Monastery are being studied by the muonography method (Figure 1a). The Monastery, founded in 1473, is located in the town of Pechory, Pskov region, in a natural depression on a sandstone hill. Under the hill there is a system of caves of presumably natural origin ("God-made caves", Figure 1b). The oldest temple of the monastery is the Assumption Cave Church, on the facade of which there is an entrance to the underground cave galleries. Used since the foundation of the Monastery as an underground necropolis, seven cave galleries of total length more than 200 m are located at a depth of 3 to 15 m.
Scientific studies of the caves that could confirm or refute versions of their origin have not been carried out until recently. At the same time, there is an assumption that there may be some hidden rooms underground in addition to the available ones, for example, in the form of a continuation of already known galleries. As the first objects of research, there were taken a) the crypt located behind the large icon at the entrance to the caves (the question concerns its size and the possible continuation of underground corridors behind the crypt) and b) the area behind the dead end of Trinity Street (the question concerns its possible continuation behind the altar).
The detectors developed for the experiment consisted of an assembly of six double-sided emulsion plates of 10×12.5 cm2, packed under vacuum in light-tight packages. The emulsion packages were fixed in a vertical position with special constructions (Figure 2a), which base made 35×62 cm2, and the altitude was about 20 cm. In the experiment, emulsion plates produced by the Russian company Slavich were used. Figure 2b shows the direction of the X, Y and Z coordinate axes in the detector system.
For the emulsion scanning and data processing, a coordinate system (XD, YD, ZD) associated with the detector was adopted, as shown in Figure 2b (black axes). For data presentation, the coordinate system associated with the Earth's surface (XS, YS, ZS) was used, which can be obtained from the detector system by rotating 90⁰ around the XD axis. In Figure 2b, its axes are shown in red. In the data presentation the angles (θ, φ) are used, where θ is the zenith angle of the muon trajectories relative to the axis ZD, i.e., the range of angles θ = 0-180⁰ corresponds to the "back" direction relative to the detector plane, and θ = 180⁰-360⁰ corresponds to the "forward" direction. The angle φ is the azimuthal angle in the detector plane. Further, the plots of muon fluxes at different values (θ, φ) are given in the coordinate system (XS, YS, ZS).
In total, it was installed 13 emulsion detectors, two of which were placed in the attic of the Assumption Church to register the background muon flux, and the rest were located in underground galleries (their installation scheme is shown in Figure 3).
Geodetic and LIDAR surveys were carried out to link the spatial position of the installed detectors, which made it possible to determine the position of the detectors with the centimeter accuracy necessary for the interpretation of the data obtained [41].
The exposure time of the main detectors was determined by the results of irradiation of the control emulsion layers placed on some detectors. Nuclear emulsions were found to gain the track density necessary for analysis when exposed for 3.5 to 4 months. After 112 days from the date of installation, all detectors were removed, disassembled, and the emulsion plates were developed. The developed emulsion plates were scanned on PAVICOM; muon tracks in the range of zenith angles ±45° were recorded.
4. Results and Discussion
In each detector, particle tracks were reconstructed in two or more consecutive emulsion plates. The experimental results are presented as muon distributions over the angular variables θ and φ. For this purpose, the upper hemisphere around the detector (90⁰ by θ, 360⁰ by φ) was divided into solid angle elements (bins) Δφ·Δθ. For each element, the number of muon hits was counted. The obtained distribution (histogram) reflects the difference in the degree of muon absorption in different directions, i.e., the difference in the distribution of material in the viewing area. The processing program uses two variants of corner partitioning into bins: 1) Δφ=10⁰, Δθ=5⁰ (36 and 18 bins, respectively); 2) Δφ=5⁰, Δθ=3⁰ (72 and 30 bins). The second option was adopted to process the experiment data; in some cases, both options were used for comparison. The results of processing the detectors installed in the attic to record the background radiation have shown the same recorded flux in both the "forward" and "backward" directions, which is consistent with expectations, since the detectors measured the isotropic flux of muons coming from the atmosphere [42]. Measurements of these detectors are used to calibrate the detectors installed underground and to account for background effects.
Figure 4 shows the data obtained with Detector 2 installed for the study of the crypt behind the icon on the wall at the entrance to the caves. The color scale in Figure 4a,b reflects the number of muons in a solid angle; blue color corresponds to the minimum particle fluxes, and red - to the maximum one. In the "backward" direction, the detector recorded an increase in the number of muons in the angle φ range from 75⁰ to 110⁰ and in the θ range from 62⁰ to 75⁰ (see Figure 4a). This direction corresponds to the entrance corridor to the caves. In the "forward" direction, an increase in flow was recorded in the φ range from 262° to 288° and in the θ range from 64⁰ to 70⁰ (Figure 4b), indicating a cavity behind the wall icon at the entrance of the caves. The greater accuracy of the investigated cavity location can be achieved with the plots demonstrating the number of muons registered in solid angles (Δφ, Δθ) (Figure 4c,d). In the distributions of the number of particles by the angle φ, different curves correspond to different θ values, as indicated in the legend. The right peaks in the figures indicate the passage of muons through the crypt cavity.
The ability of the muonography method to identify architectural features of a building can be used to control the results obtained. In particular, in the sector of view of the Detector 10 (Figure 5), also oriented to the investigated crypt, got the edge of the window on which the detector was mounted. After the data processing, it formed a "step" noticeable in the φ range from 250° to 268°, best seen at θ=75° (Figure 5a).
The reconstruction of the volumetric picture of the internal structure of an investigated object requires the use of several detectors. In this experiment, the 3D structure reconstruction algorithm involved constructing angle distributions in steps of 2° in θ and 3° in φ, where the positions of local maxima of the φ distributions were determined for each given angle θ (Figure 6). A local maximum of the flux generally corresponds to a void in a given direction, or at least a reduced density of the object material.
The function of the maxima position can take only two values: 1, when there is a maximum at the given point, and 0 when there is no maximum. Figure 6 demonstrates that the algorithm, in general, correctly determines the position of the local maxima of the muon flux distributions. Similarly, for each fixed φ, the maximum fluxes by θ were determined. For each detector, all possible directions of φ and θ were pored over.
A third variable, the elevation of the point above sea level, was added to determine the boundaries of the anomalous density region from the three measurements. The elevation of different points of the hill above sea level is indicated in Figure 3. In further data analysis, the intersection points of the local maxima with the 1-meter-thick layers of soil between fixed elevations above sea level were plotted on a presentation map. As a result, with account for the altitude (more precisely, the altitude interval), a two-dimensional pictures of muon fluxes maxima with a step of 1 m in altitude were obtained. In some points, the fluxes maxima from two or more detectors overlapped, then we can speak about the intersection of local flux maxima based on data from two or more detectors.
The area of the first site under study, the crypt at the entrance, was viewed by Detectors 2, 6, 8, 10, and 11. The obtained results of intersection of the fluxes local maxima with planes at given altitudes are presented in Figure 7.
In Figure 7, altitudes in the 77-81 m range are of particular interest. To the right of detectors 2 and 8 is a purple band, the width of which is comparable to the transverse dimensions of individual caves. It denotes the intersection of the local maxima of at least four detectors, and in some points at a altitude of 77-78 m the maxima of all five detectors intersect (see Figure 8 and Figure 9).
The results obtained from the data of five detectors allow to roughly estimate the position and geometric shape of the crypt, and demonstrate the presence of an unknown corridor beginning behind it. Assuming the results of crossing the local maxima of the muon fluxes registered by the four detectors to be the most reliable, and guided by Figure 7, Figure 8 and Figure 9, one can state that at a altitude of 77-79 m in front of Detectors 2 and 8, there is a crypt with dimensions ~2.5×2.5 m2, from which, in a direction perpendicular to Main Street, runs a corridor from 1 to 3 meters wide and up to 12 meters long.
Detectors 3, 4, 7, and 9 were oriented to the area behind the Trinity Street dead end (object II in Figure 3). The results of intersection of fluxes local maxima with planes at the indicated altitudes are shown in Figure 10.
Figure 10 shows two regions at the altitude of 77-79 m where the local maxima from all four detectors intersect. One is located to the left of the cave between Detectors 4 and 9 (between Bratskaya and Trinity Streets). The second area opposite Detector 9 looks like a continuation of the Trinity Street along its main direction. Figure 11 shows the detected cavities in an enlarged scale.
Assuming the results of crossing the local maxima of the muon fluxes registered by the four detectors to be the most reliable, and guided by Figure 10 and Figure 11, one can state that at a altitude of 77-79 m, i.e., directly above Trinity Street, between Detectors 4 and 9 there is a cavity stretched perpendicularly to the street. The altitude of the cavity is about 2 m, and the geometric dimensions in the horizontal plane are about 3×6 m2. In addition, the results demonstrate that Trinity Street has a continuation along the main direction.
5. Conclusions
On the example of the study of the cave temple of the Holy Dormition Pskovo-Pechersky Monastery, the possibilities of the non-invasive muonography method for studying the internal structure of natural, industrial and historical objects on the Earth surface and under it are demonstrated. The method is based on the measurement of the degree of absorption of atmospheric muons that have passed through the object under study. Based on the analysis of the angular distributions of muons registered in the detector, a conclusion is made about the features of the internal structure of the object, in particular, about the presence of large cavities or areas of increased density of the material.
The muonographic study of two objects of the monastery's cave temple (the crypt behind the wall at the entrance to the temple and the space behind the dead end of Troitskaya Street) revealed several previously unknown cavities of considerable size. According to the data obtained, the size of the crypt at the entrance to the temple is estimated as ~2.5×2.5 m2. A corridor with a width of 1 to 3 meters and a length of up to 12 meters departs from the crypt in a direction perpendicular to the Main Street. Underground between Fraternal and Trinity Streets a cavity was revealed, extending in the direction perpendicular to Troitskaya Street. The altitude of this cavity is estimated as 2 m and the geometric dimensions in the horizontal plane are approximately 3×6 m2. In addition, measurements show that Trinity Street has a continuation along its main direction.
The presented experiment demonstrates that Russian researchers have a well-developed and financially accessible technology that allows, at the level of modern scientific achievements, to study the internal structural features of objects of natural and artificial origin without destroying them, which opens up new opportunities, including for the study and preservation of monuments of cultural heritage. The author's methodological approaches and technical solutions for muonographic experiments based on emulsion track detectors, as well as the results obtained, are of great importance for further introduction in Russia of an effective, economical and environmentally safe method, which can be used in studies in the field of archeology, geology, nuclear power engineering, volcanology, defectoscopy and others. Based on the developed technologies, it is possible to create systems for monitoring problematic objects to minimize the consequences of possible natural and man-made disasters for the population, infrastructure and the environment.
Author Contributions
Conceptualization, N.P. and N.S.; methodology, T.R., A.P. and T.S.; software, A.Al. and V.G.; validation, A.An., A.G. and A.L.; formal analysis, A.M. and N.S.; investigation, I.M., S.P. V.T., Z.S. and M.C.; resources, Y.K.; data curation, S.V., S.G. and E.S.; writing—original draft preparation, N.P. and S.G.; writing—review and editing, N.K.; visualization, S.G. and I.M.; supervision, V.S.; project administration, N.P.; funding acquisition, N.O. All authors have read and agreed to the published version of the manuscript.
Funding
This research was funded by the Russian Science Foundation under the program "Conducting fundamental scientific research and exploratory scientific research by individual scientific groups" (project No. 23-12-00054).
Acknowledgments
World-class physicists with high h-indexes and scientific youth participated in the work on an equal footing. All worked without reference to the administrative position and authority. Here are more details about each author's contribution: Alexandrov: created original software for scanning nuclear emulsions in muonography experiments, physical data analysis; Anokhina: was engaged in removing detectors from exposure, fixing the position of detectors, disassembling the detector and extracting emulsions, repeatedly traveled to work in Pechory, physical analysis of data; Vasina: analysis of data from attic detectors to assess background muon fluxes on the ground, physical analysis of data; Gippius: physical analysis of the distributions of muon fluxes, preparation of a draft version of the text of the article; Gorbunov: scanning of nuclear photographic emulsions, construction of three-dimensional dependences of muon fluxes from detector data, determination of the sizes of discovered previously unknown cavities, repeatedly traveled to work in Pechory, physical analysis of data; Grachev: taking into account possible seasonal fluctuations in muon fluxes, editing the text, physical data analysis; Konovalova: assembly of detectors and installation for exposure, editing and translation of the text of the article, work with literature, repeatedly traveled to work in Pechory, physical analysis of data; Krasilnikova: work with archival maps of the monastery, involvement of engineering resources of MISiS, visit to plan the exposition, repeatedly traveled to work in Pechory, physical analysis of data; Larionov: coordination of places and procedures for installing detectors, transportation of equipment, analysis of the results obtained in relation to the terrain, repeatedly traveled to work in Pechory, physical analysis of the data; Managadze: pre-exposure modeling for measurement optimization, article editing, physical data analysis; Melnichenko: shooting with a drone and lidar of the object under study, building three-dimensional volumetric graphs, repeatedly traveled to work in Pechory, physical data analysis; Okateva: ensuring the operation of the elements of a scanning microscope, scanning of nuclear photographic emulsions developed after exposure, physical analysis of data; Paramonov: geodetic high-precision (centimetric accuracy) survey of detector positions for stitching their data when building a three-dimensional model, repeatedly traveled to work in Pechory, physical data analysis; Petrukhin: coordination of technical requirements for a manufacturer of nuclear emulsion, purchase of emulsion, development, physical analysis of data; Polukhina: project leader, participation at all stages of its implementation, presentation of reports at international conferences and meetings, repeatedly traveled to work in Pechory, physical analysis of data; Roganova: modeling of muon interaction processes, physical data analysis; Sadykov: modernization of scanning equipment to speed up the processing process, scanning of nuclear photographic emulsions, preparation of presentations, physical analysis of data; Starkov: exposure modeling, installation of detectors for exposure, construction of survey colored (three-dimensional) muon distributions, graphs of distributions of muon flux maxima, repeatedly traveled to work in Pechory, physical data analysis; Starkova: assembly of detectors, vacuum packing of emulsion layers, scanning of nuclear photographic emulsions, development of software for estimating the degree of loading of detectors, repeatedly traveled to work in Pechory, physical analysis of data; Tyukov: development of the concept of the experiment based on the experience of work on muonography in Italy, analysis and discussion of physical data, physical analysis of data; Chernyavsky: preparation of the mechanical design of the detectors, scanning of developed nuclear photographic emulsions, assembly and disassembly of detectors, discussion of the text of the article, physical analysis of data; Shevchenko: the idea of the experiment, the choice of its location, the coordination with all the necessary services of the implementation conditions, repeatedly traveled to work in Pechory, the physical analysis of the data; Shchedrina: testing batches of photographic emulsion, assembling and disassembling detectors at the exposure site, creating a basic software package for scanning a specific batch of emulsion, scanning emulsions, building preliminary muon sweat distributions, preparing reports at the conference, repeatedly traveled to work in Pechory, physical data analysis.
Conflicts of Interest
The authors declare no conflict of interest. The funders had no role in the design of the study; in the collection, analyses, or interpretation of data; in the writing of the manuscript; or in the decision to publish the results.
References
- George, E.P. Cosmic rays measure overburden of tunnel, Commonwealth Engineer 1955, 455–457.
- Ariga, A., Ariga, T., De Lellis, G., Ereditato, A., Niwa K. Nuclear Emulsions. In Particle Physics Reference Library, Fabjan, C.W., Schopper, H., Publisher: Springer, Cham, 2020, Volume 2, pp. 337-382. [CrossRef]
- Barkas, W.H. Nuclear research emulsion, Academic Press, New York, 1973.
- Alexandrov, A. , Buonaura, A., Consiglio, L., D’Ambrosio, N., De Lellis, G., Di Crescenzo, A., Galati, G., Gentile, V., Lauria, A., Montesi, M.C., et al. The Continuous Motion Technique for a New Generation of Scanning Systems. Sci. Rep. 2017, 7, 7310. [Google Scholar] [CrossRef] [PubMed]
- Niwa, K. 5. Niwa K. et al., Auto scanning and measuring system for the emulsion chamber, Proc. Int. Cosmic Ray Symp. on High Energy Phenomena, Cosmic Ray Lab. Univ. Tokyo (1974) 149, 1974.
- Aoki S. et al., Fully automated emulsion analysis system, Nucl. Instrum. Meth. B 51 , 466 (1990). [CrossRef]
- Armenise N. et al., High-speed particle tracking in nuclear emulsion by last-generation automatic microscopes, Nuclear Instruments and Methods in Physics Research A 551 (2005) 261–270. [CrossRef]
- Arrabito L. et al., Hardware performance of a scanning system for high speed analysis of nuclear emulsions, Nuclear Instruments and Methods in Physics Research A 568 (2006) 2, 578-587. [CrossRef]
- Bozza C. et al., An integrated system for large scale scanning of nuclear emulsions, Nuclear Instruments and Methods in Physics Research A 703 (2013), 204-212, https://doi.org/10.1016/j.nima.2012.11.099. 9. Morishima K. & Nakano T. Development of a new automatic nuclear emulsion scanning system, S-UTS, with continuous 3D tomographic image read-out, JINST 5 P04011, (2010). [CrossRef]
- Yoshimoto M. et al., Hyper-track selector nuclear emulsion readout system aimed at scanning an area of one thousand square meters, Progress of Theoretical and Experimental Physics 10, 103H01 (2017). [CrossRef]
- Gilboy, W.B. , Jenneson, P.M., Simons, S.J.R., Stanley, S.J., Rhodes, D. Muon radiography of large industrial structures. Nucl. Instrum. Methods Phys. Res. B 2007, 263, 317–319. [Google Scholar] [CrossRef]
- Procureur, S. Muon imaging: Principles, technologies and applications, Nucl. Instrum. Methods Phys. Res. A 2018, 878, 169–179. [Google Scholar] [CrossRef]
- Cimmino, L. , Baccani, G., Noli, P., Amato, L., Ambrosino, F., Bonechi, L., Bongi, M., Ciulli, V., D’Alessandro, R., D’Errico, M., et al. 3D Muography for the Search of Hidden Cavities. Sci. Rep. 2019, 9, 2974. [Google Scholar] [CrossRef] [PubMed]
- Zhang, Z.-X. , Enqvist, T., Holma, M., Kuusiniemi, P. Muography and Its Potential Applications to Mining and Rock Engineering. Rock Mech. Rock Eng. 2020, 53, 4893. [Google Scholar] [CrossRef]
- Yashin, I.I.; Davidenko, N.N.; Dovgopoly, A.O.; Fakhroutdinov, R.M.; Kaverznev, M.M.; Kompaniets, K.G.; Konev, Yu.N.; Kozhin, A.S.; Paramoshkina, E.N.; Pasyuk, N.A.; et al. Muon Tomography of Large-Scale Objects. Phys. At. Nucl. 2021, 84, 1171–1181. [Google Scholar] [CrossRef]
- Oláh, L. , Tanaka, H.K.M., Varga, D. Muography: Exploring Earth's Subsurface with Elementary Particles; American Geophysical Union, 2022. [Google Scholar] [CrossRef]
- Tanaka, H.K.M. Particle Geophysics. Ann. Rev. Earth Planet. Sci. 42, 535-549 (2014).
- Aleksandrov, A.B.; Vladymyrov, M.S.; Galkin, V.I.; Goncharova, L.A.; Grachev, V.M.; Vasina, S.G.; Konovalova, N.S.; Malovichko, A.A.; Managadze, A.K.; Okat’eva, N.M.; et al. Muon radiography method for fundamental and applied research. Phys. Usp. 2017, 60, 1277–1293. [Google Scholar] [CrossRef]
- Tioukov, V. , Alexandrov, A., Bozza, C., Consiglio, L., D’Ambrosio, N., De Lellis, G., De Sio, C., Giudicepietro, F., Macedonio, G., Miyamoto, S., et al. First muography of Stromboli volcano. Sci. Rep. 2019, 9, 6695. [Google Scholar] [CrossRef] [PubMed]
- Lo Presti, D. , Riggi, F., Ferlito, C., Bonanno, D.L., Bonanno, G., Gallo, G., La Rocca, P., Reito, S., Romeo, G. Muographic monitoring of the volcano-tectonic evolution of Mount Etna, Sci Rep. 2020; 10, 11351. 10. [CrossRef]
- Fujii, H. , Hara, K., Hayashi, K., Kakuno, H., Kodama, H., Nagamine, K., Sato, K., Kim, Sh.-H., Suzuki, A., Sumiyoshi, T., Takahashi, K., Takasaki, F., Tanaka, Sh., Yamashita, S. Investigation of the Unit-1 nuclear reactor of Fukushima Daiichi by cosmic muon radiography. Prog. Theor. Exp. Phys. 2020, 2020, 043C02. [Google Scholar] [CrossRef]
- Fujii, H., Hara, K., Hayashi, K., Kakuno, H., Kodama, H., Nagamine, K., Sato, K., Kim, Sh.-H., Suzuki, A., Sumiyoshi, T., Takahashi, K., Takasaki, F., Tanaka, Sh., Yamashita, S. Investigation of the status of Unit 2 nuclear reactor of the Fukushima Daiichi by Cosmic Muon Radiography, Prog. Theor. Exp. Phys. 2021, 2021, 023C01. [CrossRef]
- Kouzes, R.T., Bonneville, A., Lintereur, A., Mostafanezhad, I., Pang, R., Rotter, B., Snigdha, F., Tytgat, M., Aly, S., El Mahdy,B., et al. Novel Muon Tomography Detector for the Pyramids, Journal of Advanced Instrumentation in Science 2022, 2022, 240. [CrossRef]
- Oláh, L.; Tanaka, H.K.M.; Varga, D. Muography: Exploring Earth’s Subsurface with Elementary Particles, Geophysical Monograph 270; American Geophysical Union, John Wiley & Sons, Inc.: Hoboken, NJ, USA, ISBN 9781119723028. 2022. [Google Scholar]
- Giammanco, A., et al. Muon Imaging Present Status and Emerging Applications IAEA-TEC-DOC-2012 9789201427229 (2022).
- Scampoli, P. & Ariga, A. Cosmic Ray Muography, World Scientific, ISBN 9789811264900 (2023).
- Tanaka, K.K. M, Nagamine, K., Nakamura, S. N. & Ishida, K. Radiographic measurements of the internal structure of Mt. West Iwate with near-horizontal cosmic-ray muons and future developments. Nucl. Instr. Meth. Phys. Res. A, 2005; 555, 164–172. [Google Scholar] [CrossRef]
- Anastasio, A. et al. The MU-RAY detector for muon radiography of volcanoes. Nucl. Instr. Meth. Phys. Res. A, 2013; 732, 423–426. [Google Scholar] [CrossRef]
- Marteau, J. et al., Muon tomography applied to geosciences and volcanology, Nucl. Instr. Meth. Phys. Res. A, 695 23-28 (2012). [CrossRef]
- D'Errico, M. et al. The MURAVES Experiment: A Study of the Vesuvius Great Cone with Muon Radiography, J. Adv. Instr. Sci. 2022, 273, (2022). [Google Scholar] [CrossRef]
- Nyitrai, G.; Hamar, G.; Varga, D. Toward low gas consumption of muographic tracking detectors in field applications. J. Appl. Phys 2021, 732, 244901. [Google Scholar] [CrossRef]
- Tanaka, H.K.M. et al., Imaging the conduit size of the dome with cosmic-ray muons: The structure beneath Showa-Shinzan Lava Dome, Japan, Geophys. Res. Lett. 2007, 34, L22311. [CrossRef]
- Alvarez, L.W.; Anderson, J.A.; El Bedwei, F.; Burkhard, J.; Fakhry, A.; Girgis, A.; Goneid, A.; Hassan, F.; Iverson, D.; Lynch, G.; et al. Search for hidden chambers in the pyramids. Science 1970, 167, 832–839. [Google Scholar] [CrossRef] [PubMed]
- Wohl, C.G. Scientist as detective: Luis Alvarez and the pyramid burial chambers, the JFK assassination, and the end of the dinosaurs. Am. J. Phys. 2007, 75, 968–977. [Google Scholar] [CrossRef]
- Morishima, K.; Kuno, M.; Nishio, A.; Kitagawa, N.; Manabe, Y.; Moto, M.; Takasaki, F.; Fujii, H.; Satoh, K.; Kodama, H.; et al. Discovery of a big void in Khufu’s Pyramid by observation of cosmic-ray muons. Nature 2017, 552, 386–390. [Google Scholar] [CrossRef] [PubMed]
- Abiev, A.; Bagulya, A.; Chernyavsky, M.; Dashkina, A.; Dimitrienko, A.; Gadjiev, A.; Gadjiev, M.; Galkin, V.; Gippius, A.; Goncharova, L.; et al. Muon radiography method for non-invasive probing an archaeological site in the Naryn-Kala citadel. Appl. Sci. 2019, 9, 2040. [Google Scholar] [CrossRef]
- Alexandrov, A.B.; Vasina, S.G.; Galkin, V.I.; Gippius, A.A.; Grachev, V.M.; Kalinina, G.V.; Konovalov, A.S.; Konovalova, N.S.; Korolev, P.S.; Larionov, A.A.; et al. A Noninvasive Muonography-Based Method for Exploration of Cultural Heritage Objects. Phys. Part. Nucl. 2022, 53, 1146–1175. [Google Scholar] [CrossRef]
- The winners of the 2022 Macarius Prizes in Natural Sciences have been named (in Russian). Available online: https://new.ras.ru/activities/news/nazvany-laureaty-makarievskikh-premiy-v-oblasti-estestvennykh-nauk-2022-goda/ (accessed on 25 November 2022).
- Aglietta, M. et al. [The LVD Collaboration]. Study of single muons with the Large Volume Detector at Gran Sasso Laboratory, Phys. Atom. Nucl. 2003, 66, 123-129. [CrossRef]
- Alexandrov, A.; Konovalova, N.; Okateva, N.; Polukhina, N.; Starkov, N., Shchedrina, T. Upgrade and new applications of the automated high-tech scanning facility PAVICOM for data processing of track detectors, Measurement 2022, 187, 110244. [CrossRef]
- Melnichenko, I.A. Geoinformation modeling of the structure of soil surfaces obtained as a result of non-invasive research methods based on muography. Report at the XIX International forum-competition of students and young scientists "Actual problems of subsoil use", St. Petersburg, Russia, 22-26 May 2023.
- Alexandrov, A.; Anokhina, A.; Vasina, S.; Gippius, A.; Gorbunov, S.; Grachev, V.; Konovalova, N.; Larionov, A.; Managadze, A.; Melnichenko, I.; et al. , Nuclear Emulsion Detectors for the Muonography of Underground Structure of Holy Dormition Pskov-Caves Monastery, Phys. At. Nucl. 2023, in print.
Figure 1.
(a) A general view of the Holy Dormition Pskovo-Pechersky Monastery, the arrow shows the entrance to the cave temple; (b) The location of the known underground galleries on the monastery plan. The figures indicate the "streets" of the cave temple: 1- the Main street; 2 – the Elders street; 3 – the Temple street; 4 – the Fraternal street; 5- the Trinity street. The images were obtained using modern geodetic methods [41].
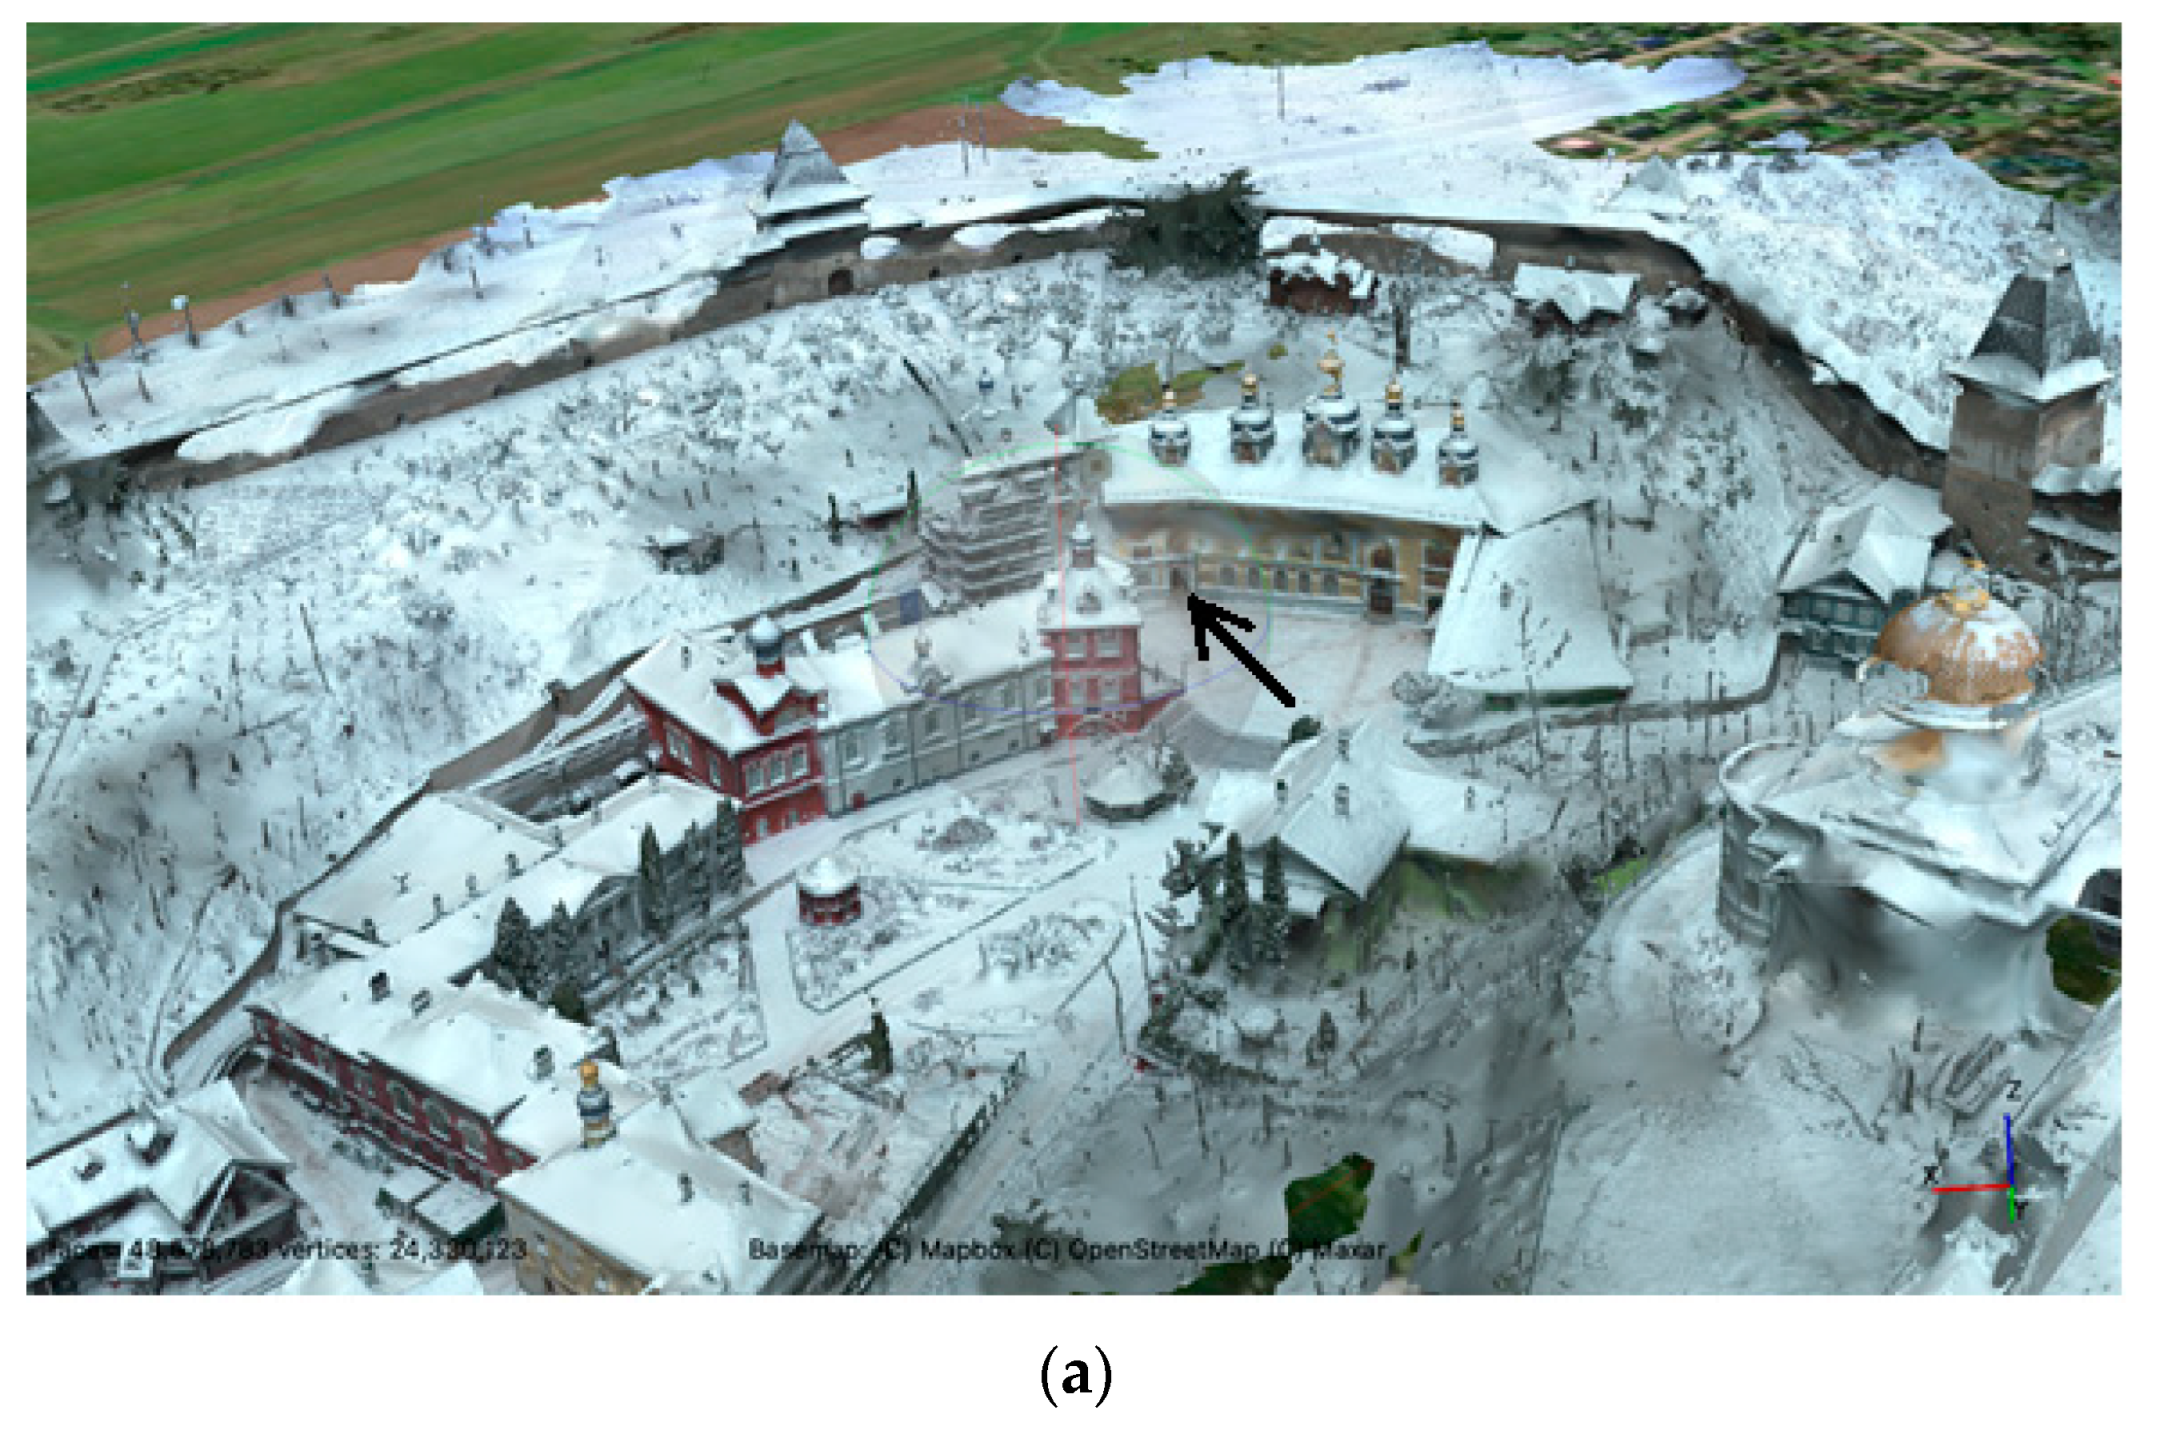
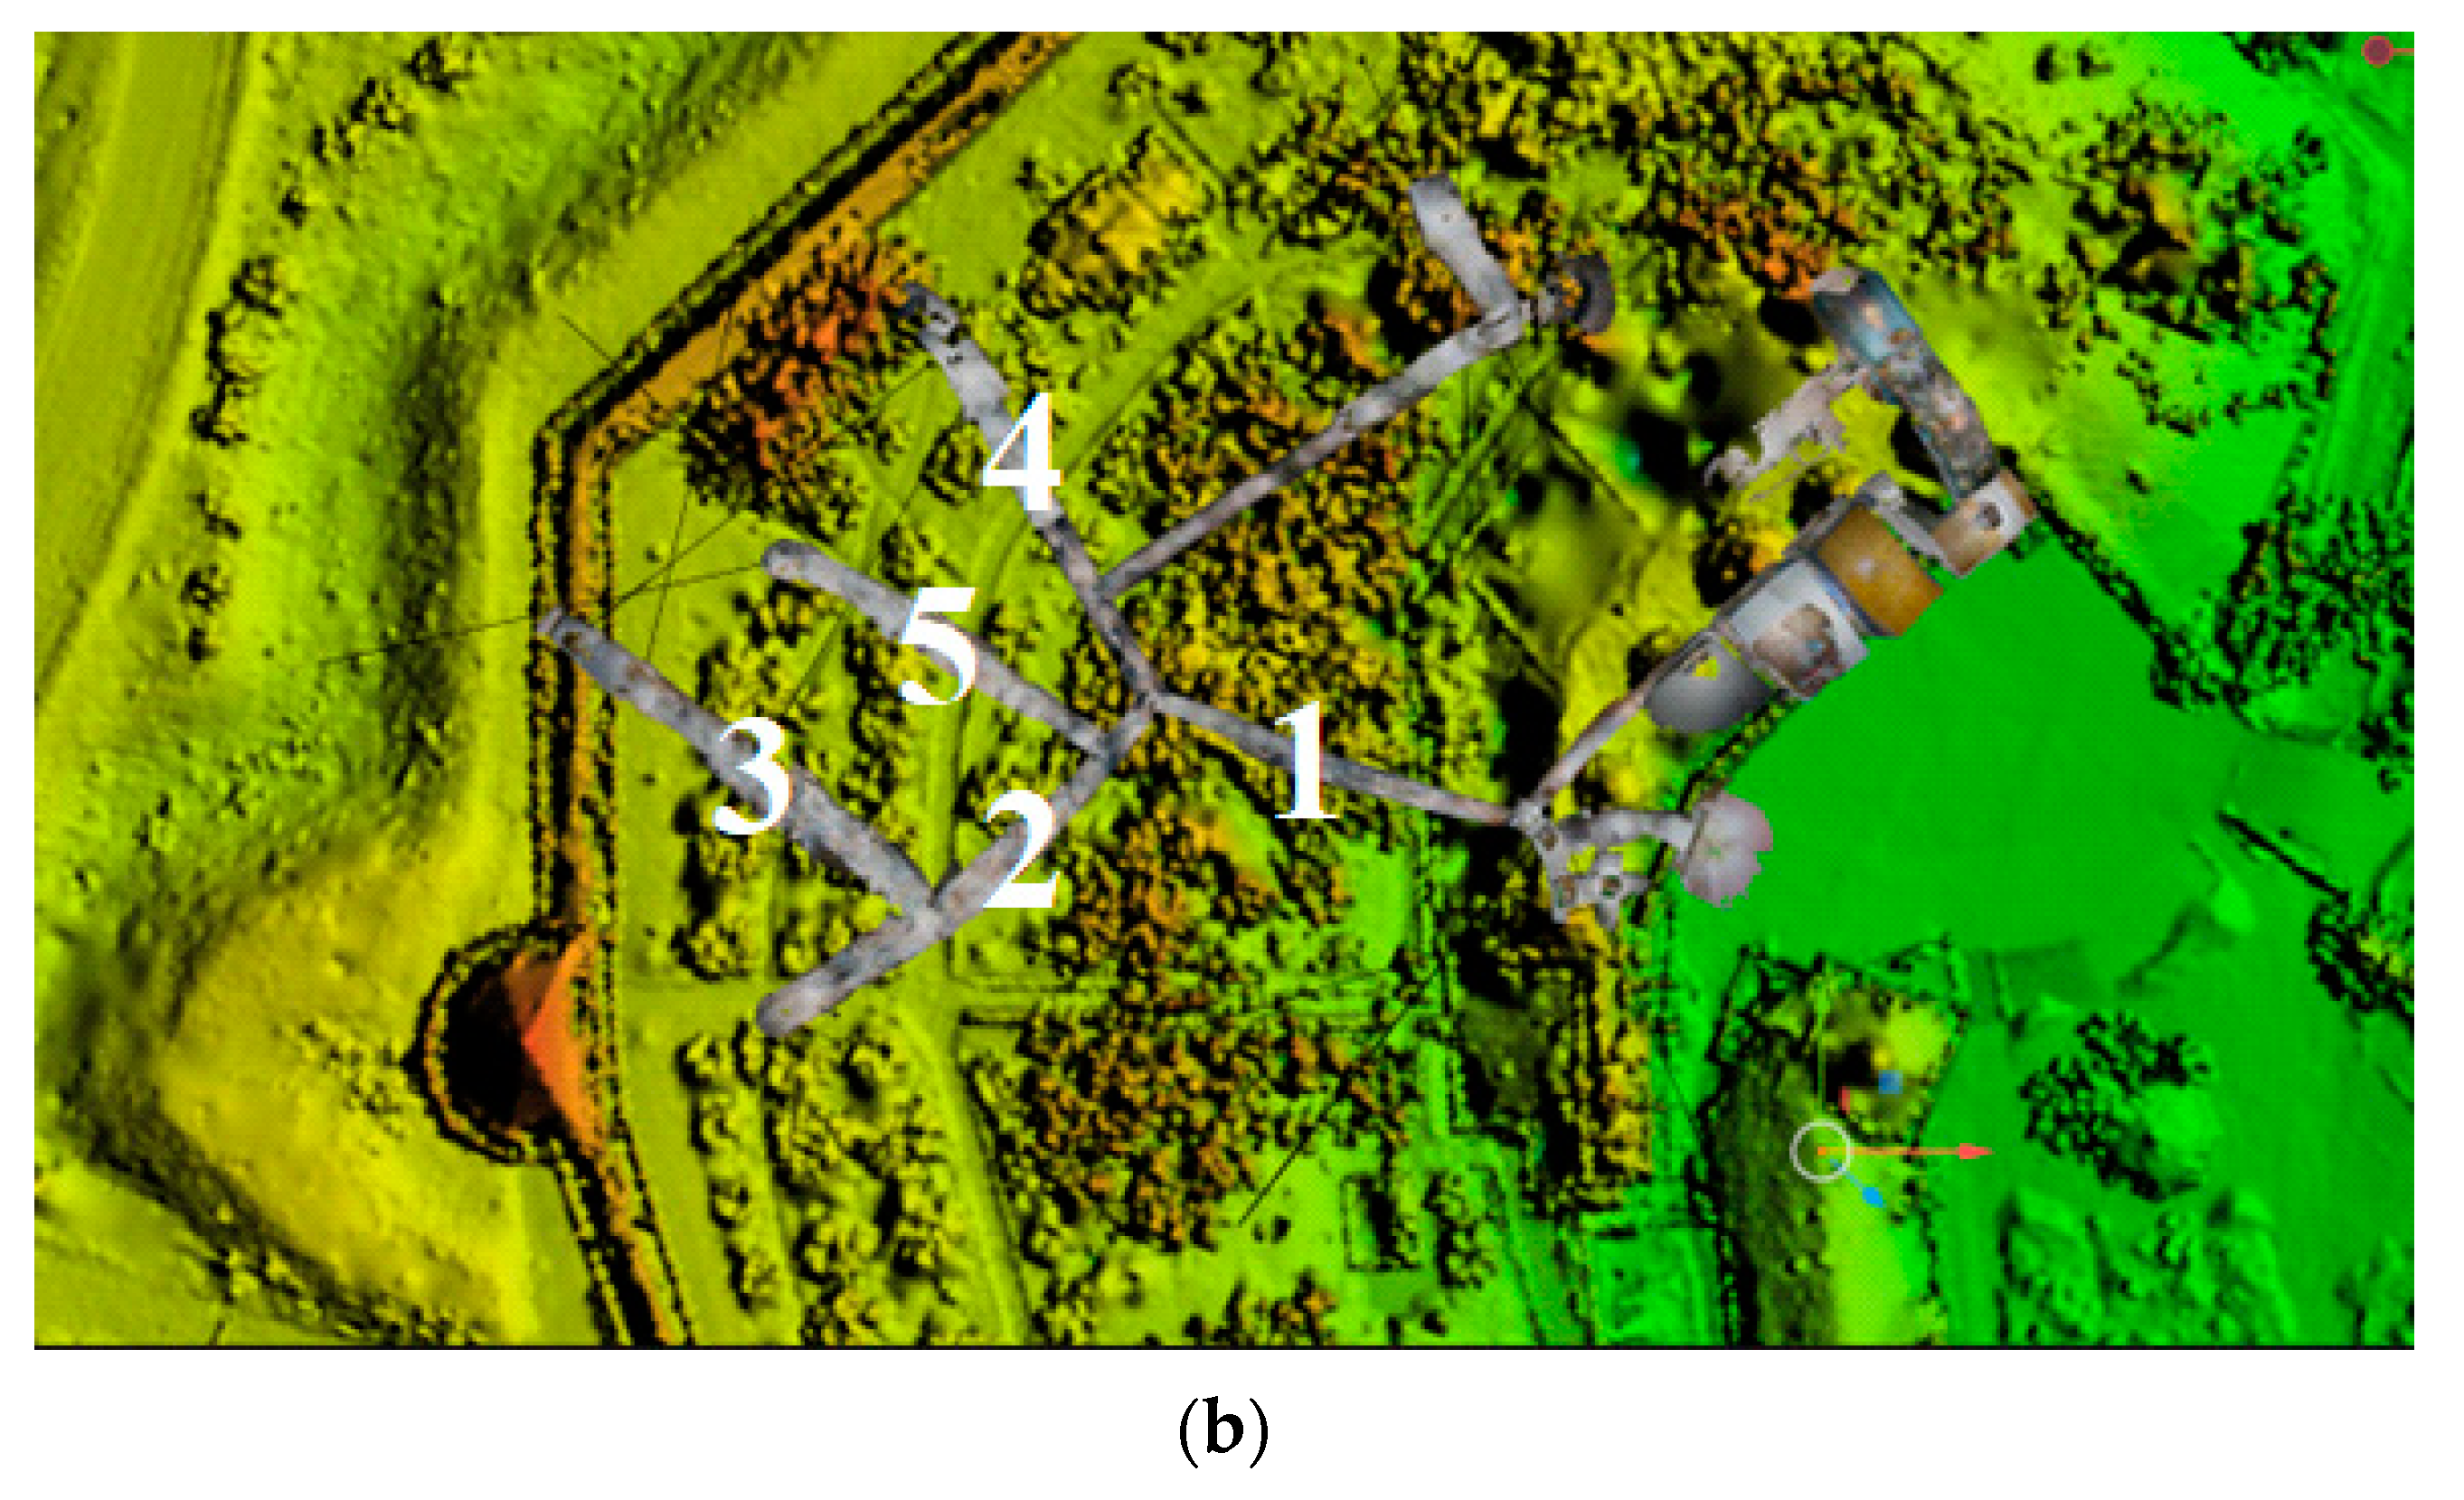
Figure 2.
(a) The appearance of the assembled emulsion detector; (b) The coordinate systems used in data processing and presentation.
Figure 2.
(a) The appearance of the assembled emulsion detector; (b) The coordinate systems used in data processing and presentation.
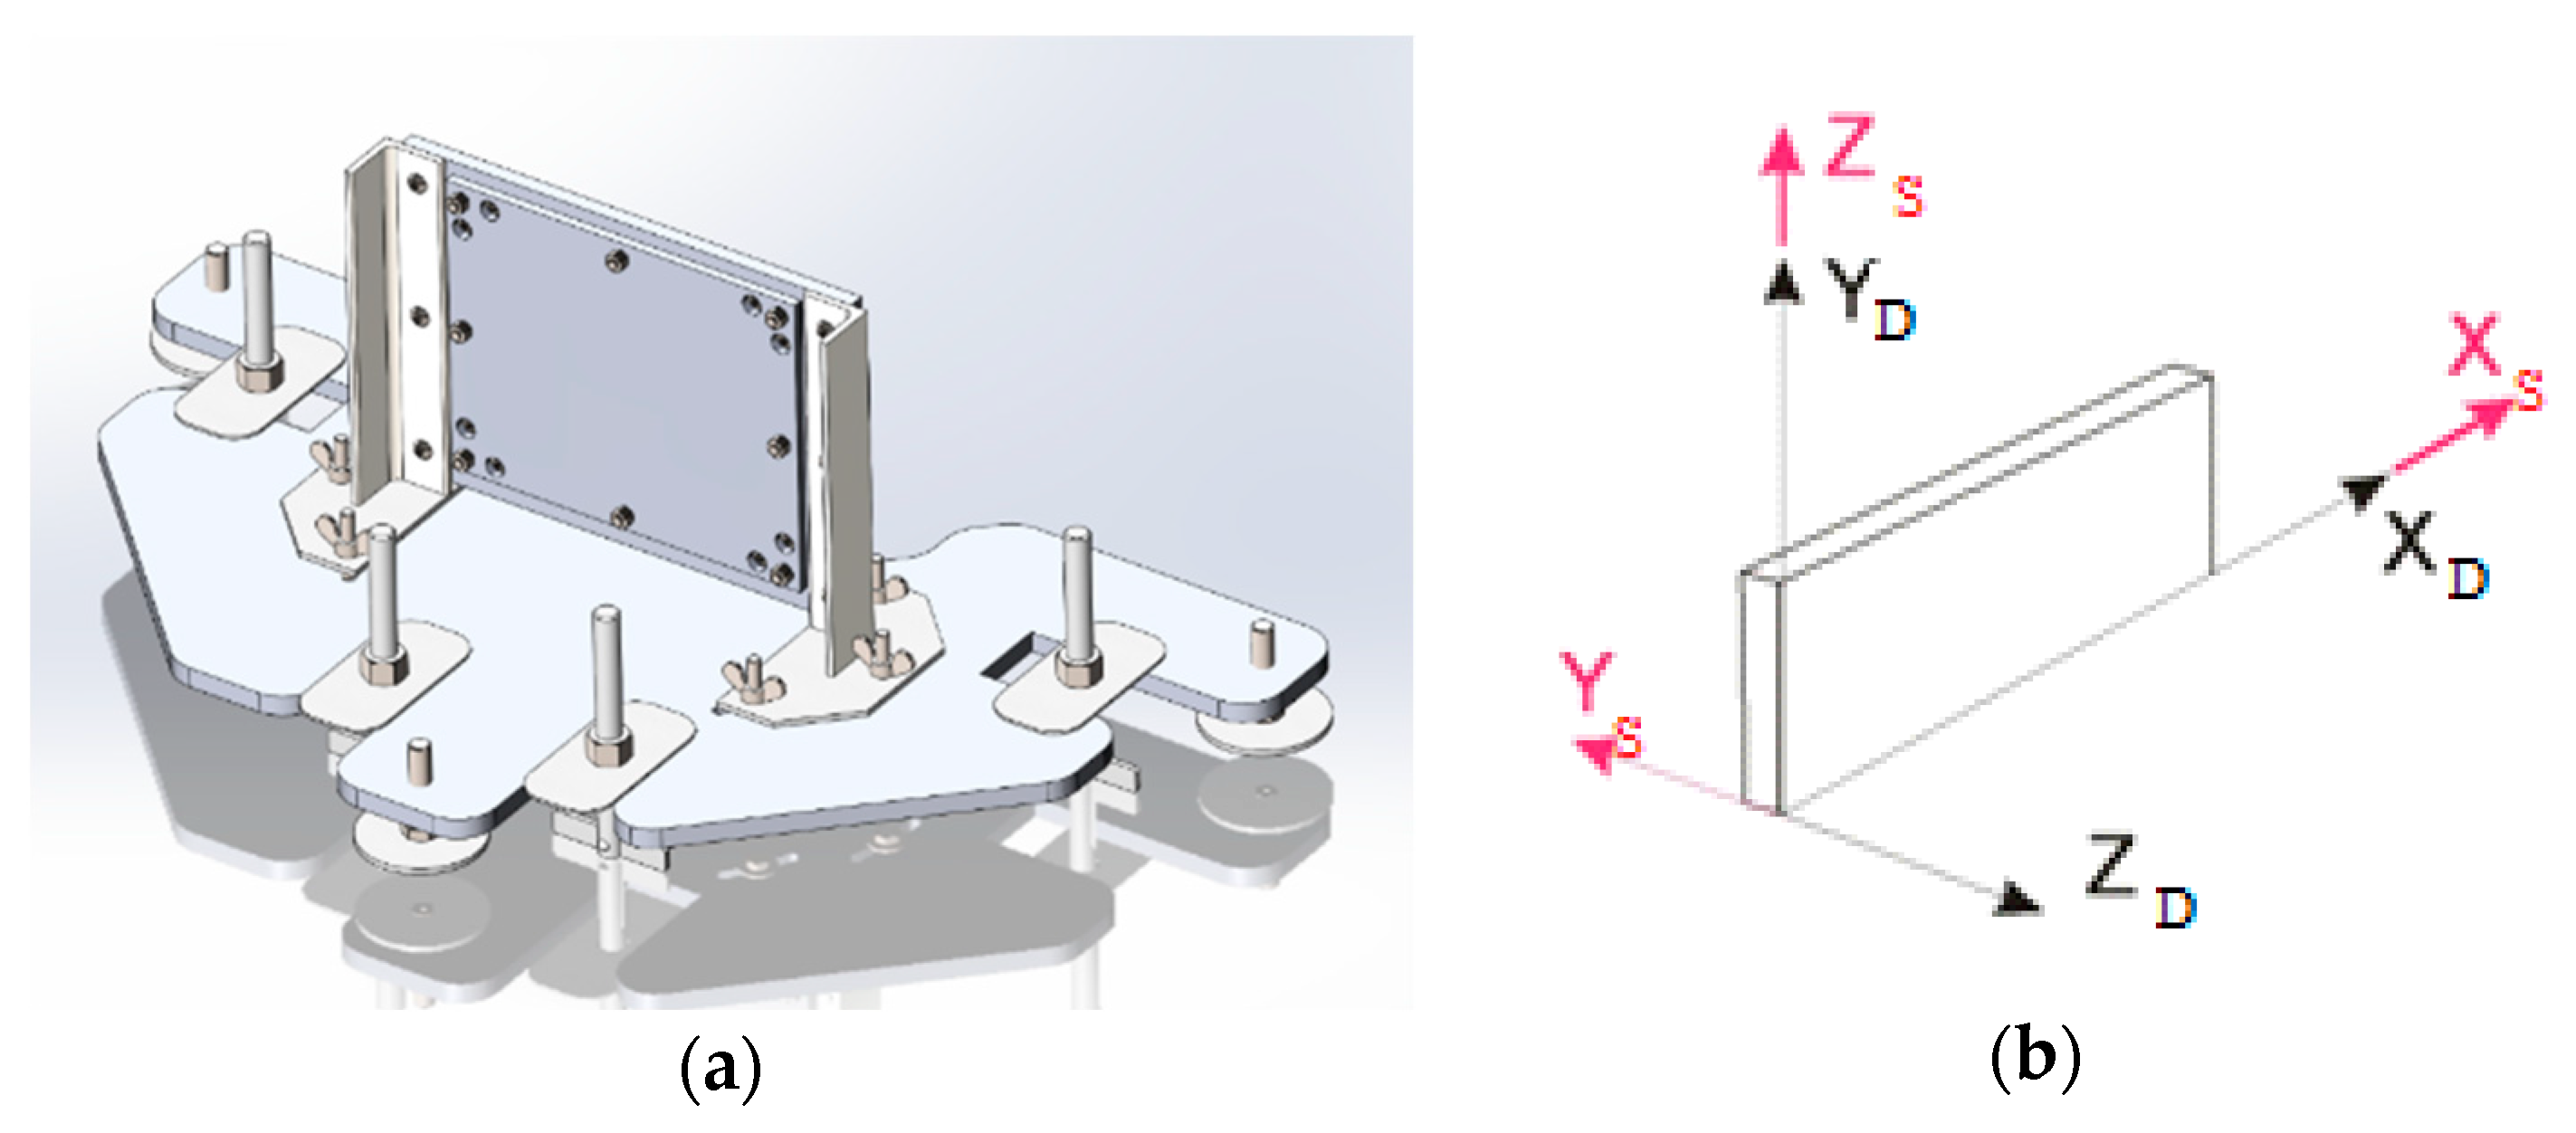
Figure 3.
The layout of detectors in the caves of the Holy Dormition Pskovo-Pechersky Monastery. Triangles indicate the position of the detectors. The sharp ends of the triangles indicate the direction of their view. Two circles labeled as I and II show the sites under study (the crypt behind the icon at the entrance to the caves and the area behind the dead end of Trinity Street).
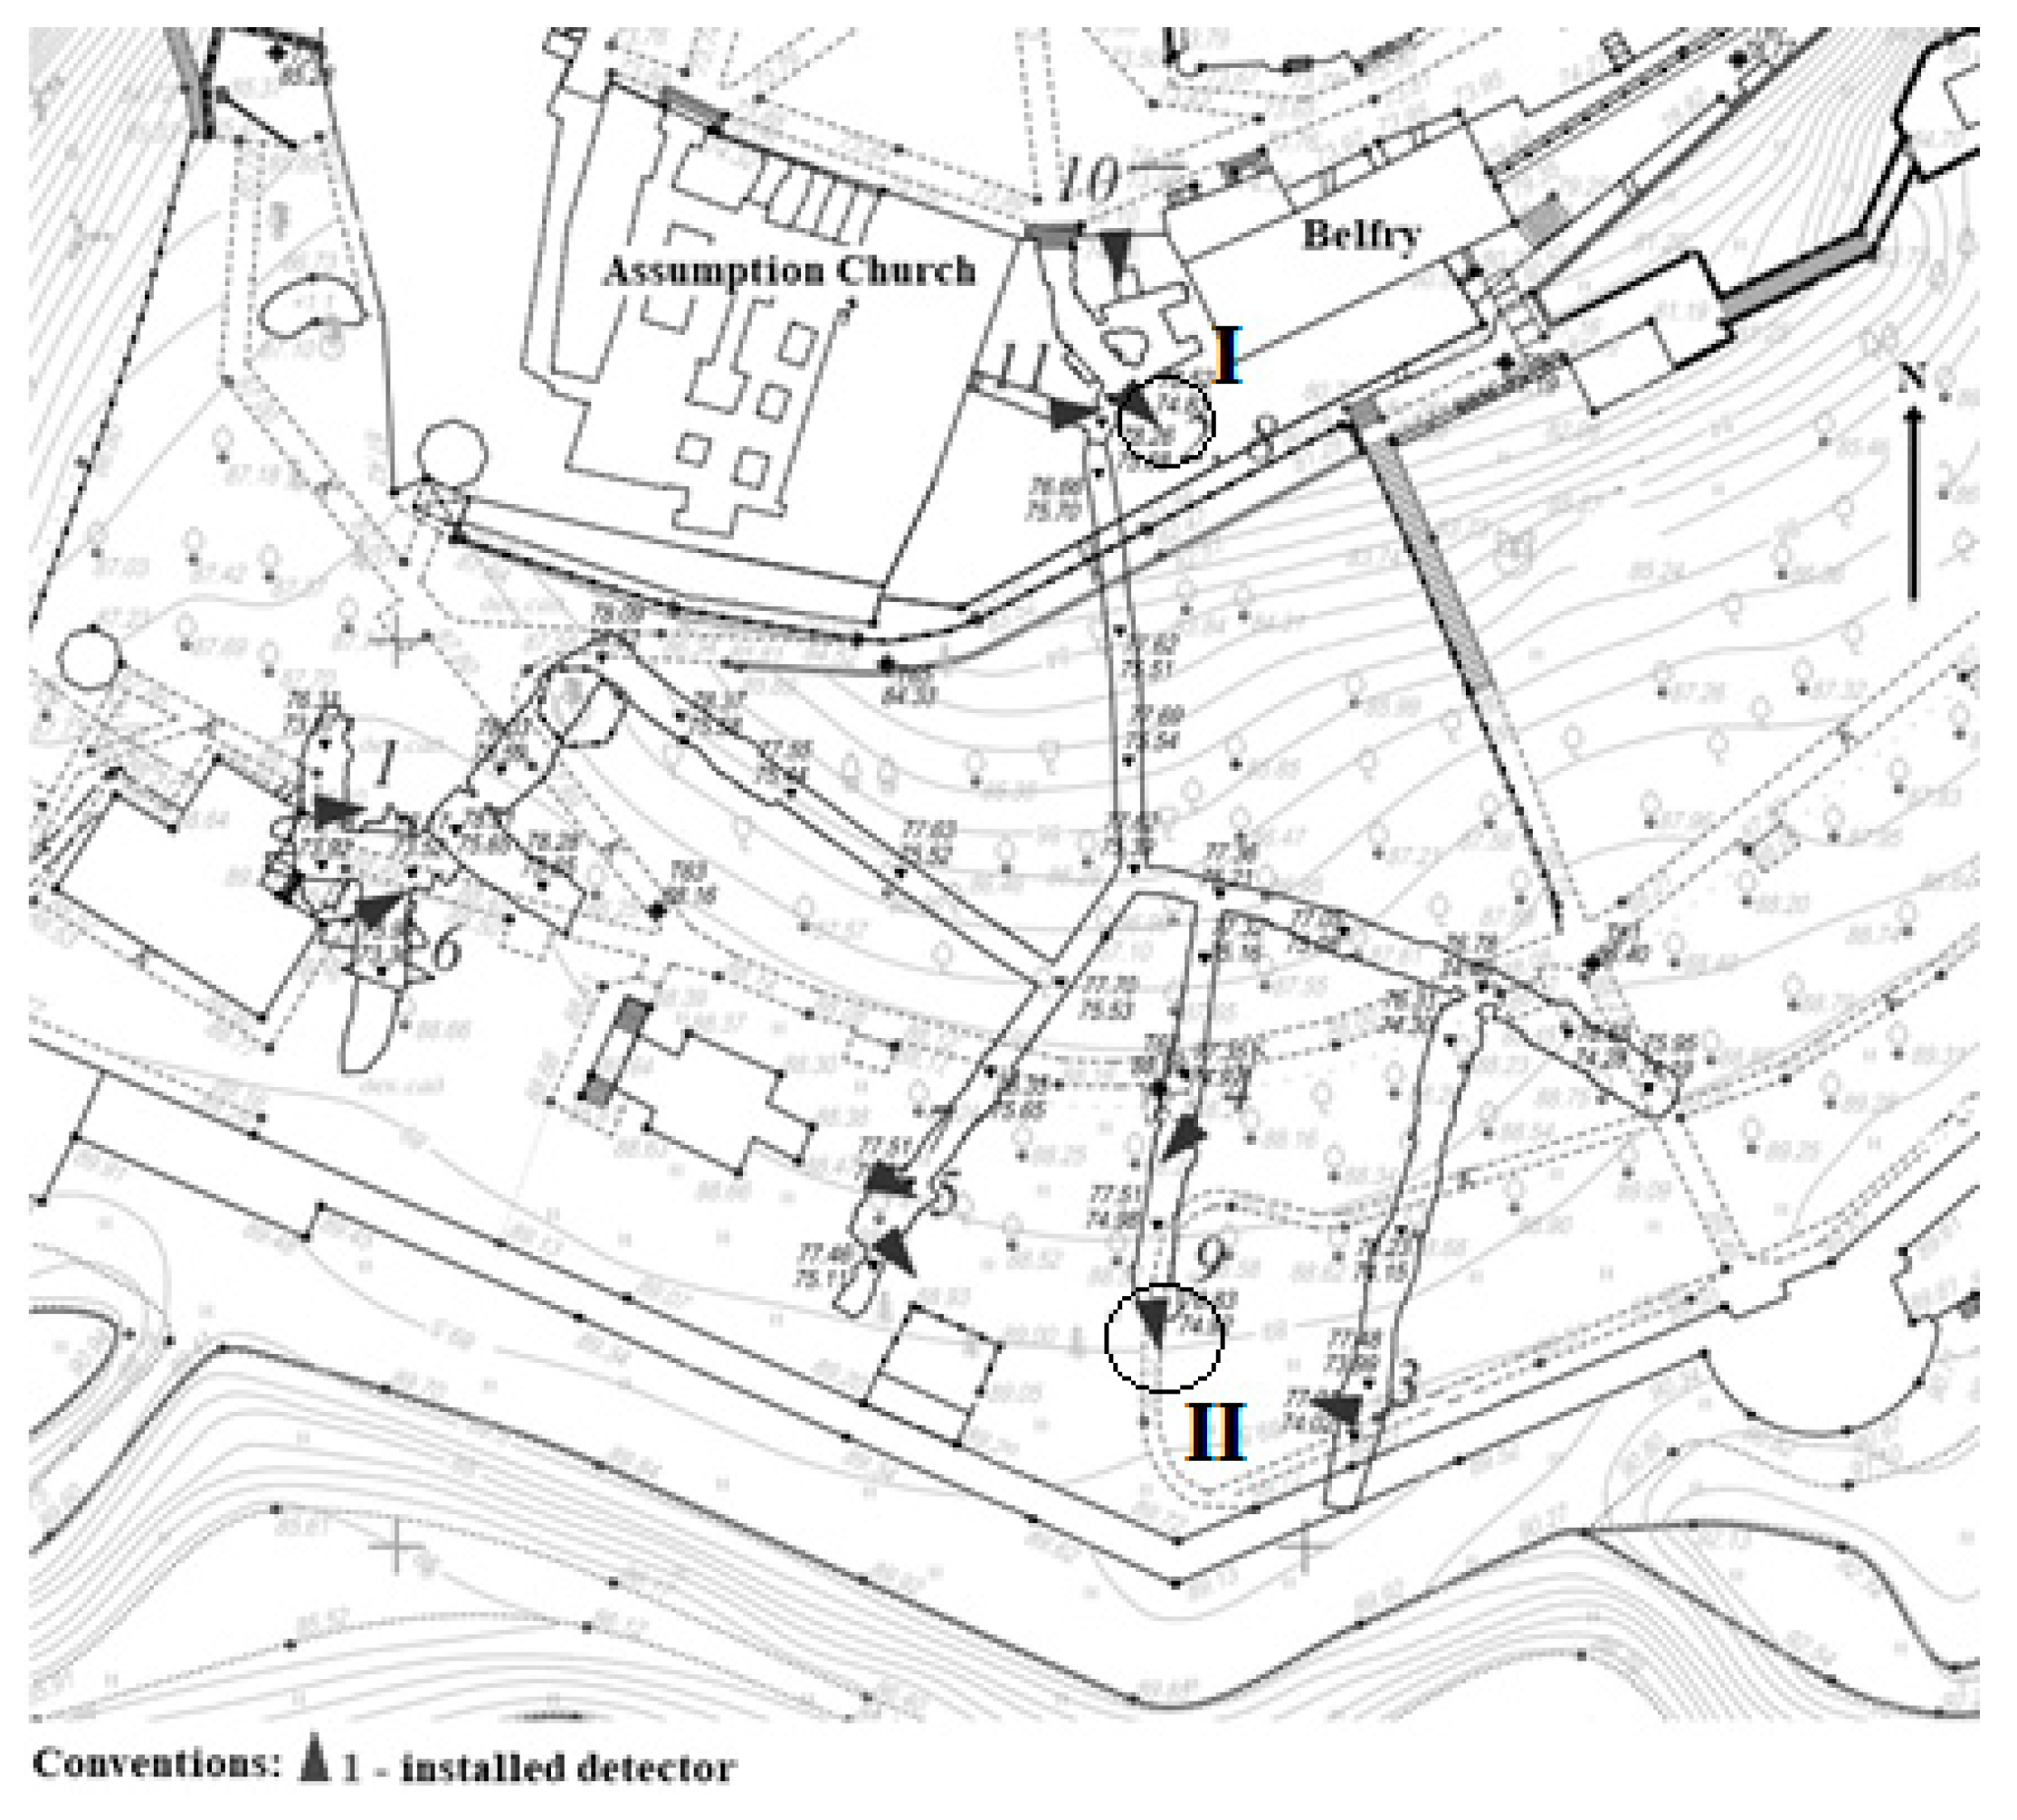
Figure 4.
Distributions of muon quantity registered in Detector 2: (a) The "backward" direction to the entrance to the caves; (b) The "forward" direction to the crypt area; (c), (d) The corresponding muon number distributions for bins Δφ=5⁰, Δθ=3⁰.
Figure 4.
Distributions of muon quantity registered in Detector 2: (a) The "backward" direction to the entrance to the caves; (b) The "forward" direction to the crypt area; (c), (d) The corresponding muon number distributions for bins Δφ=5⁰, Δθ=3⁰.
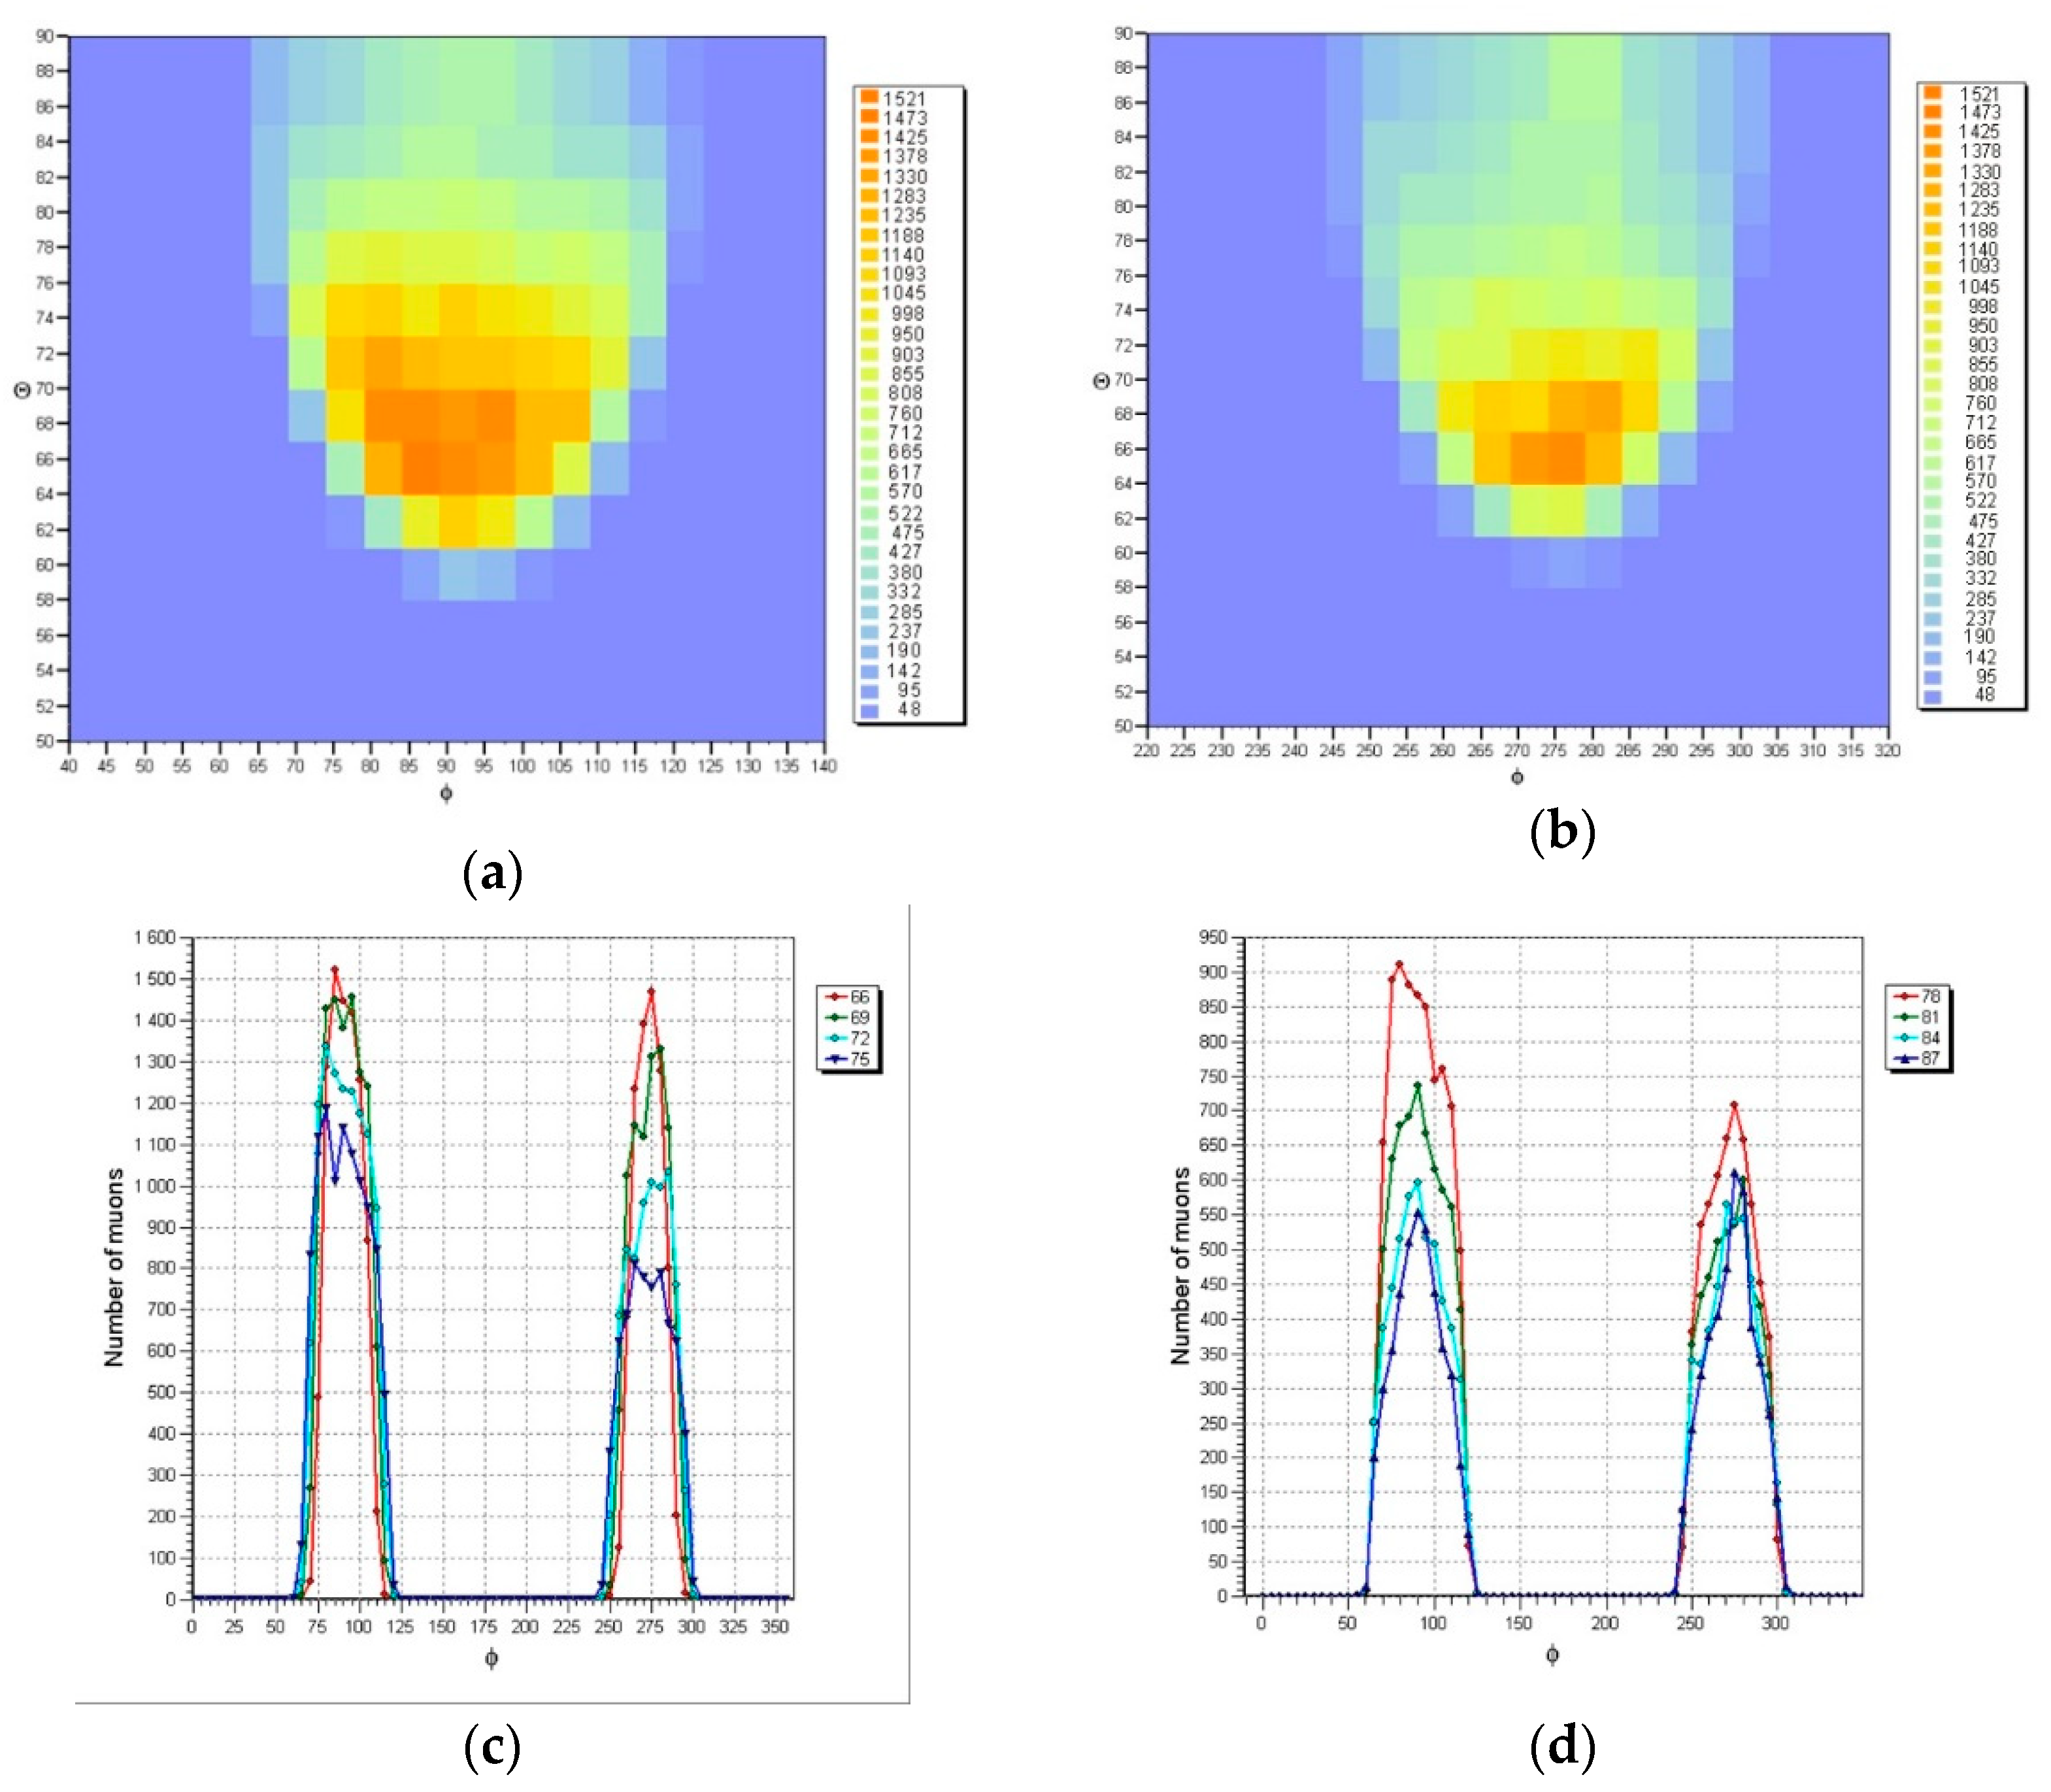
Figure 5.
Angular distributions of the registered muons from the Detector 10 data: (a) For θ=66⁰, 69⁰, 72⁰, 75⁰; (b) For θ=78⁰, 81⁰, 84⁰, 87⁰.
Figure 5.
Angular distributions of the registered muons from the Detector 10 data: (a) For θ=66⁰, 69⁰, 72⁰, 75⁰; (b) For θ=78⁰, 81⁰, 84⁰, 87⁰.
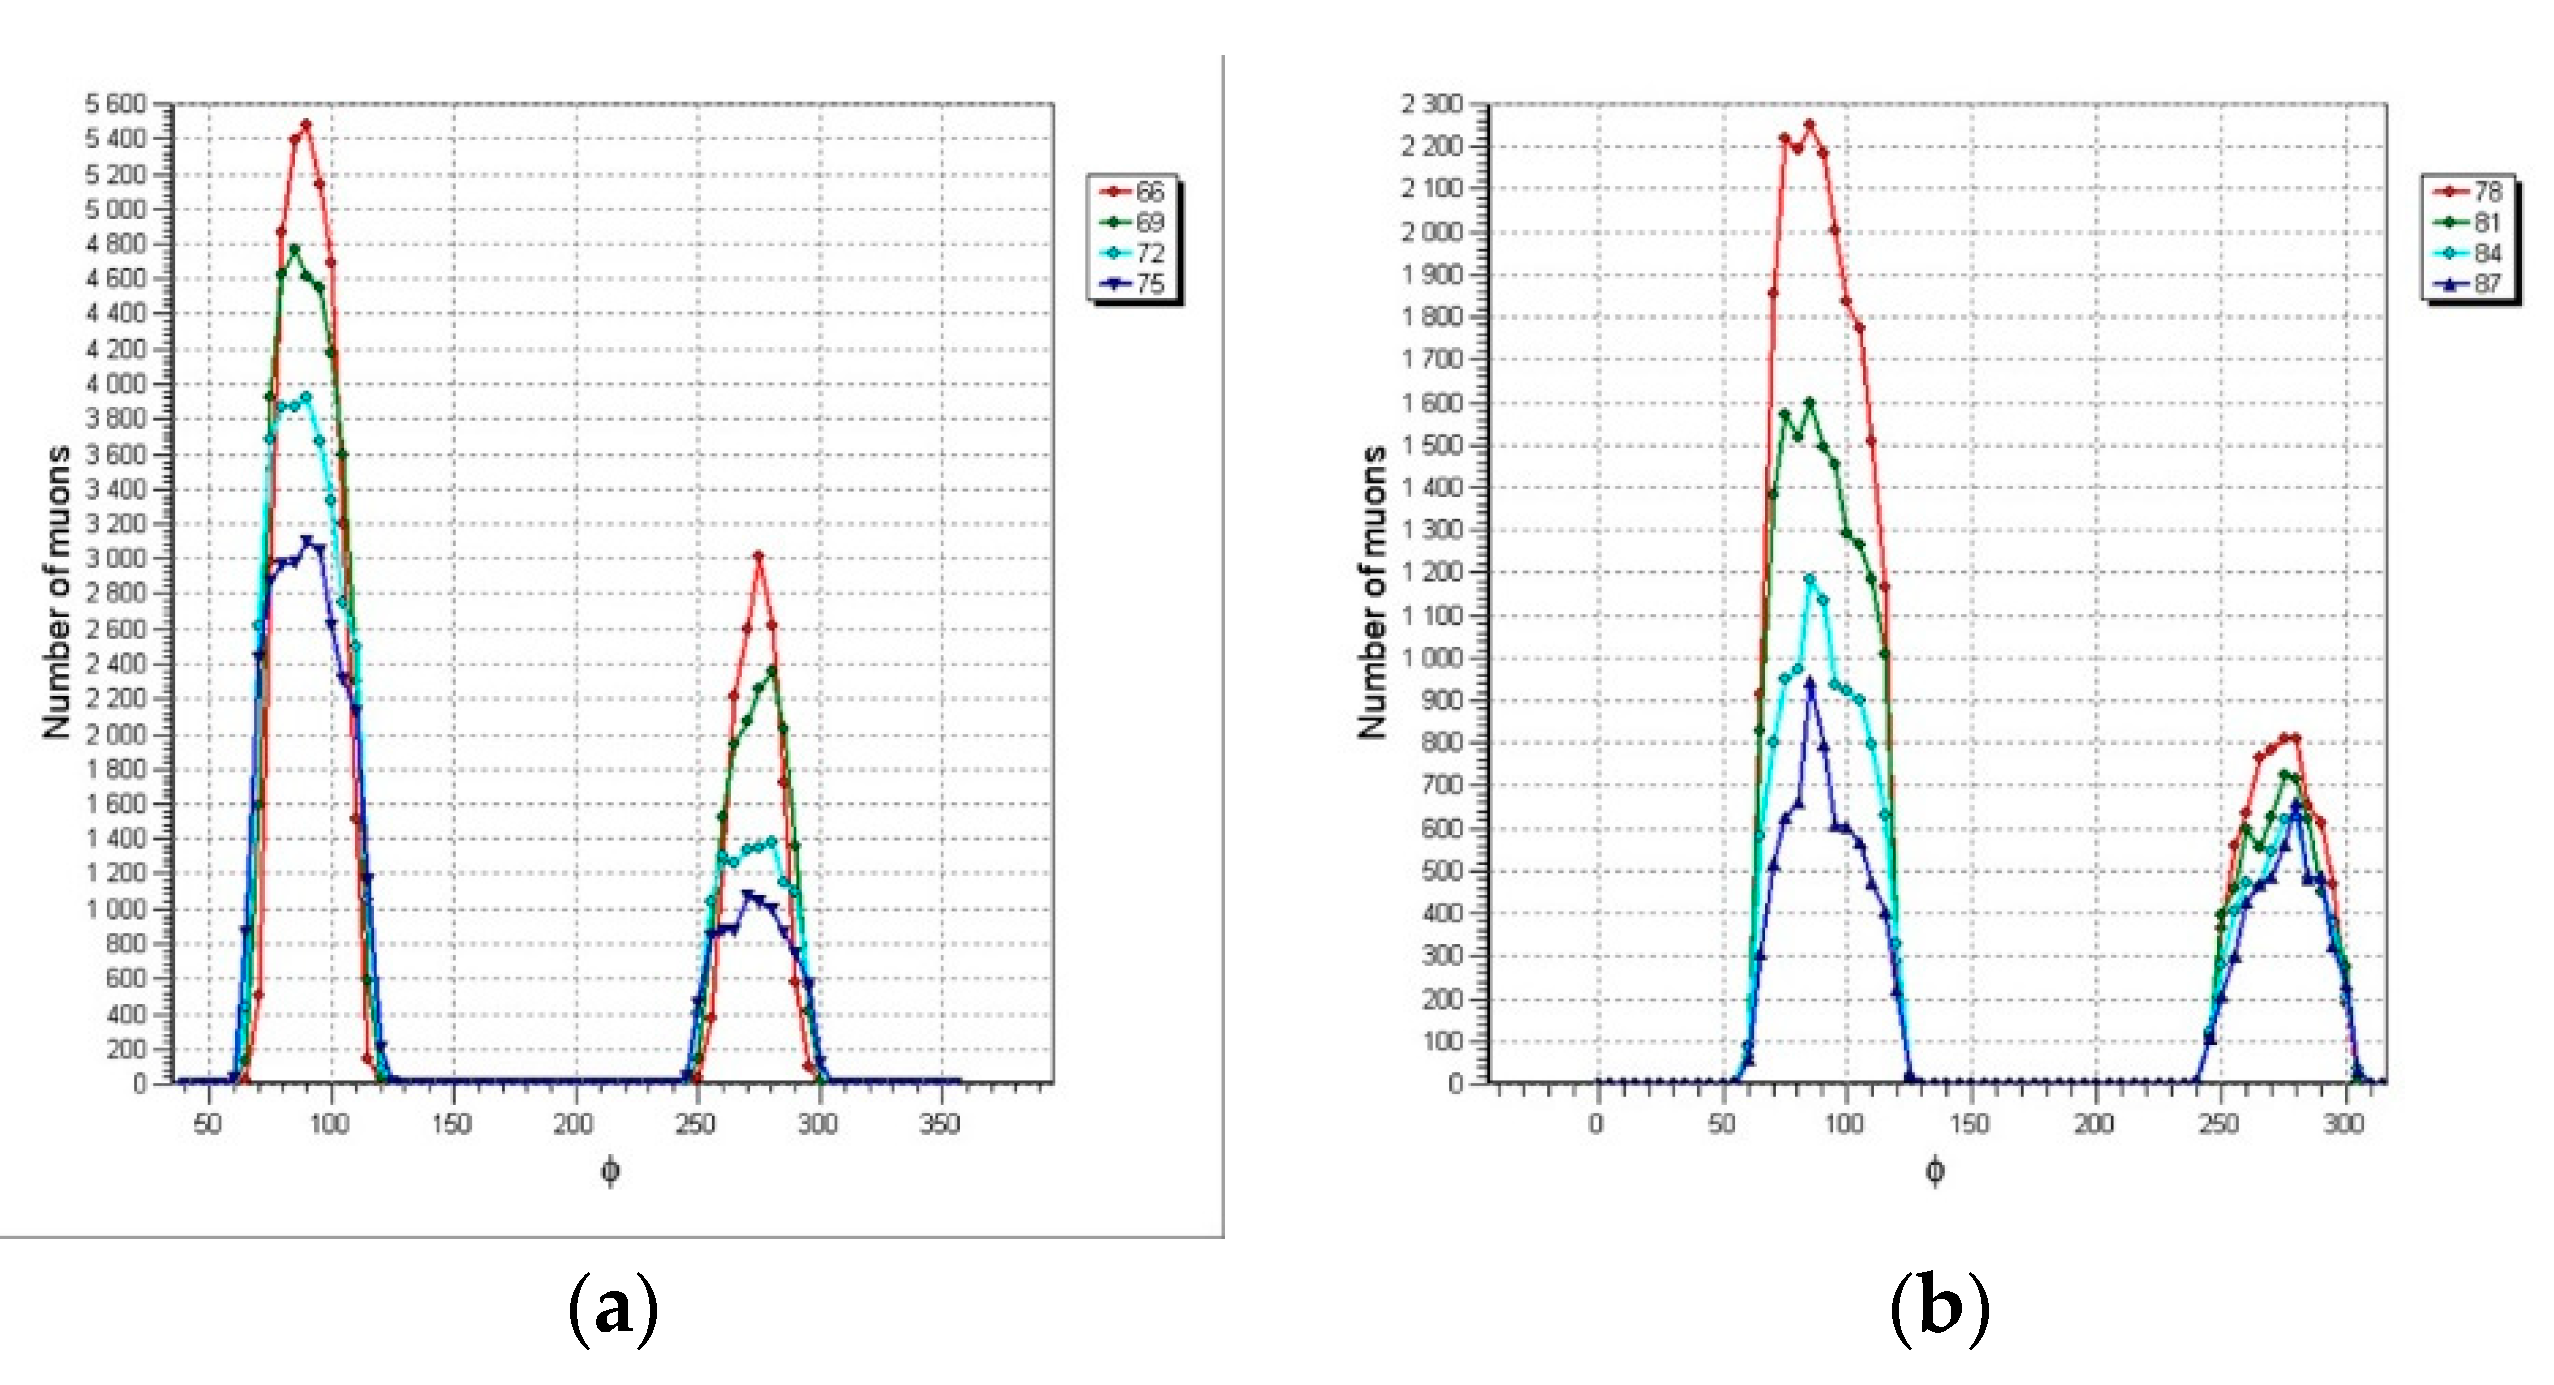
Figure 6.
Illustration of the algorithm for finding local maxima of muon flux distributions in φ at a given θ using data from detectors 6 (a) and 7 (b) as examples. The black dashed line shows the distribution of muons by φ at a given θ, and the blue line shows the position of local maxima on this distribution.
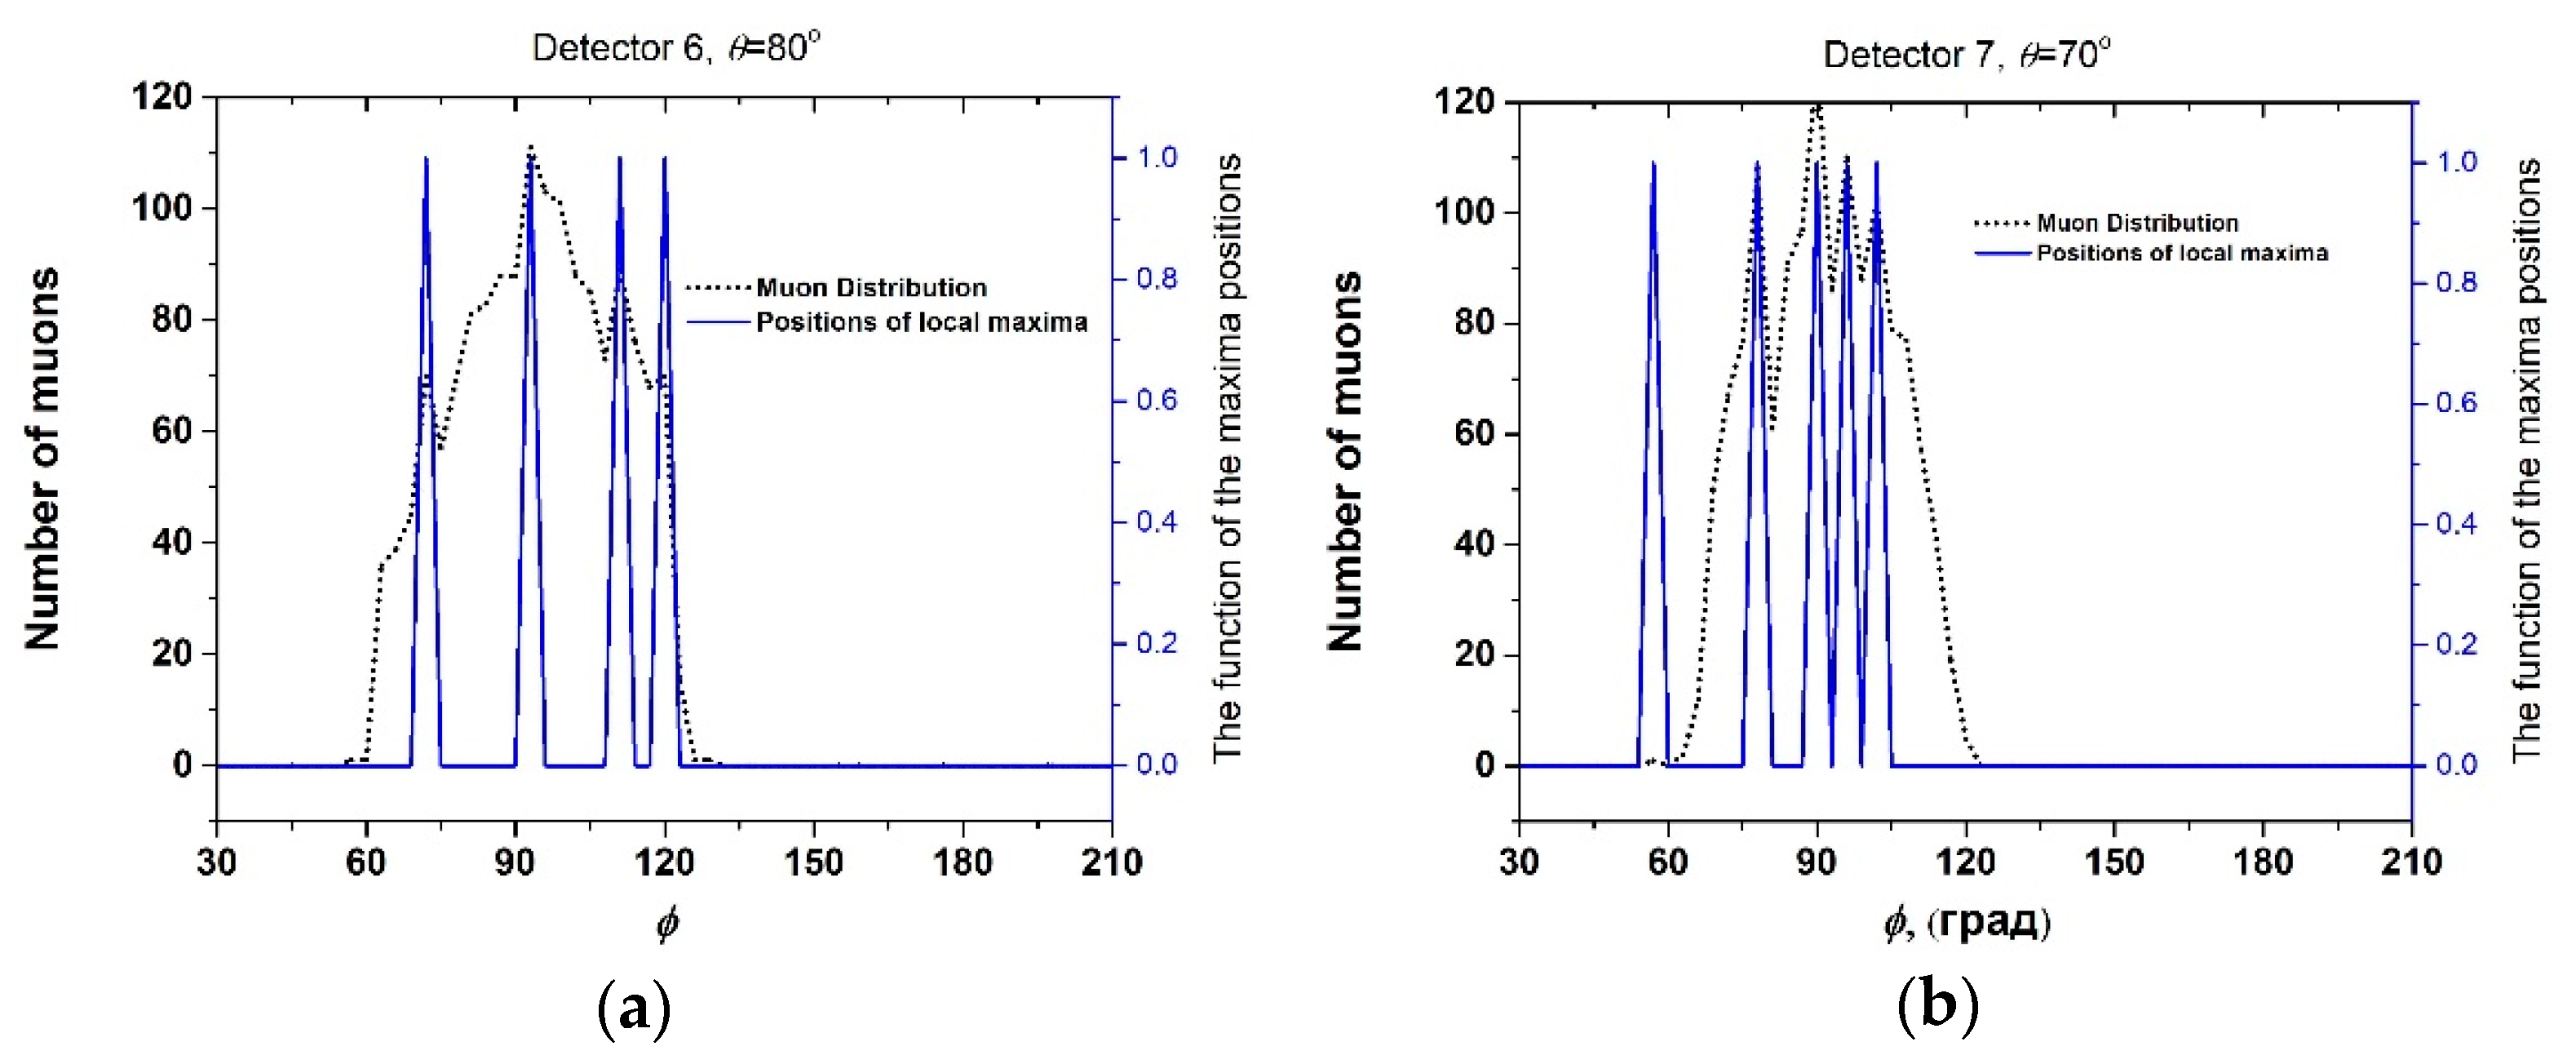
Figure 7.
Maps of the intersection of the directions of local maxima of muon fluxes with the planes between indicated altitudes for Detectors 2, 6, 8, 10, 11. Data from one detector is marked in blue, the intersection of two detectors - in orange, three detectors - in green, and four detectors - in violet.
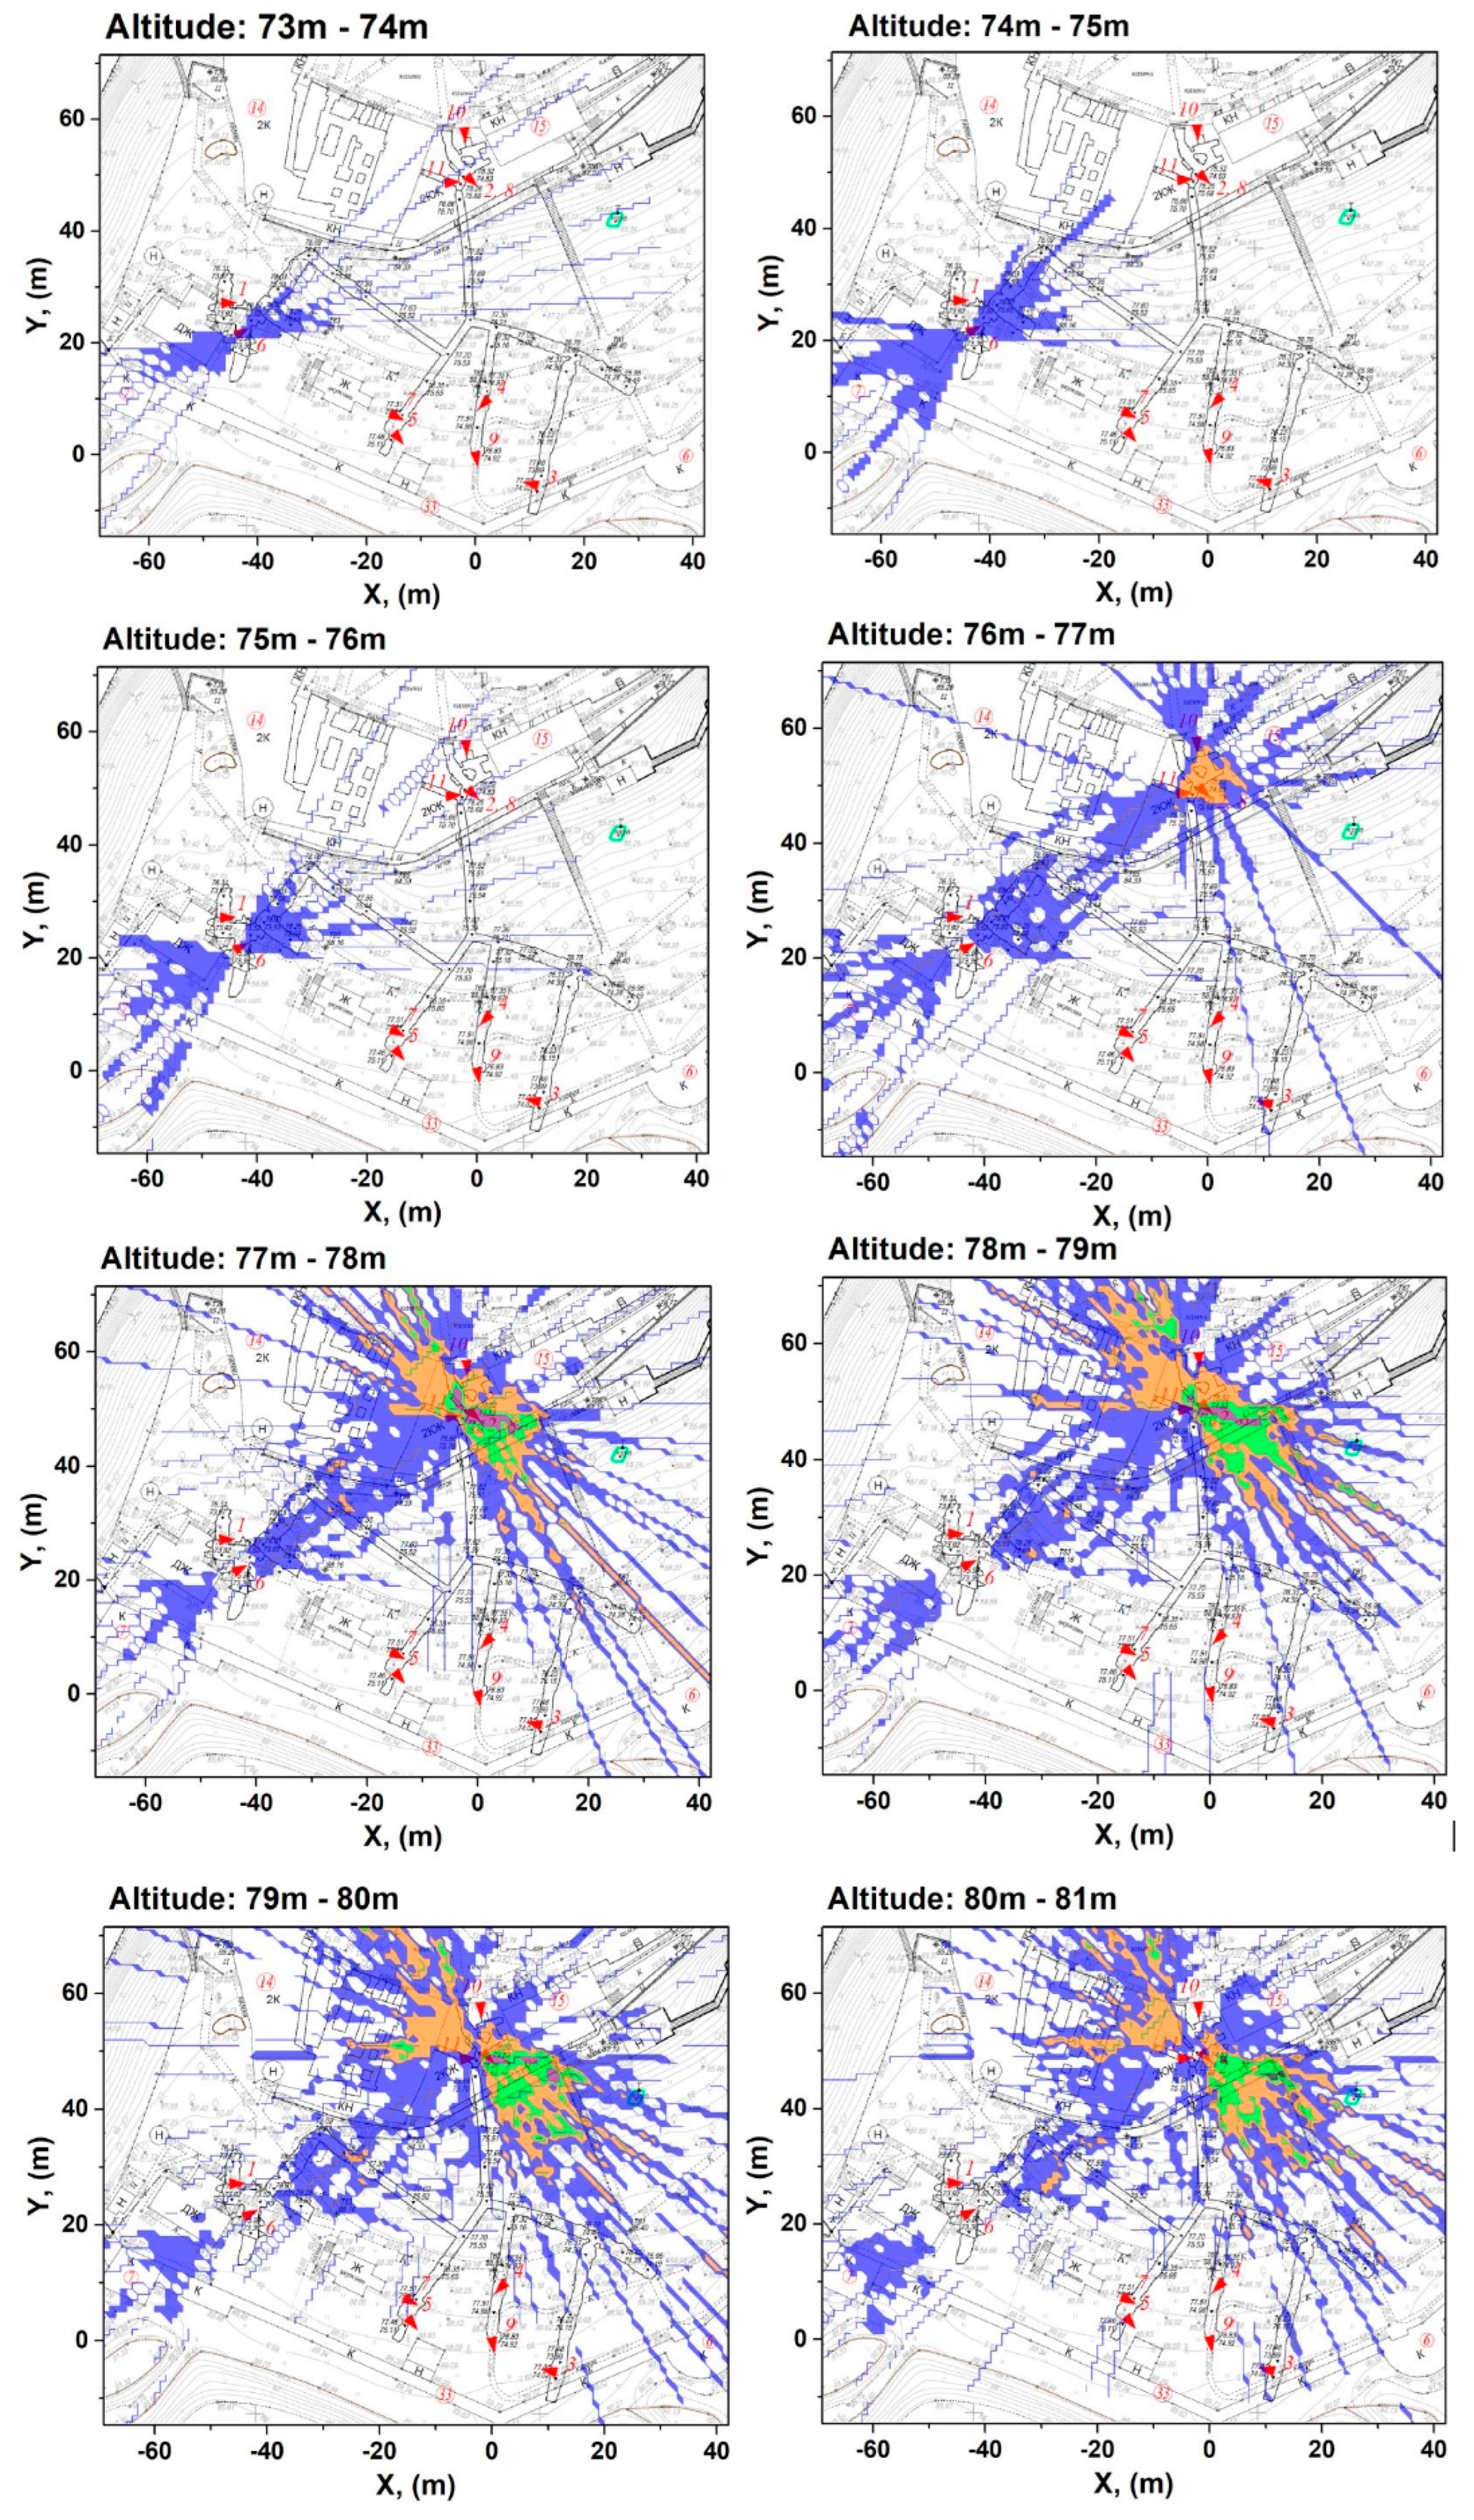
Figure 8.
Intersection of the directions of the muon flux local maxima of all five Detectors 2, 6, 8, 10 and 11 with the plane between altitudes of 77 and 78 m (marked by a white broken line on a purple background).
Figure 8.
Intersection of the directions of the muon flux local maxima of all five Detectors 2, 6, 8, 10 and 11 with the plane between altitudes of 77 and 78 m (marked by a white broken line on a purple background).
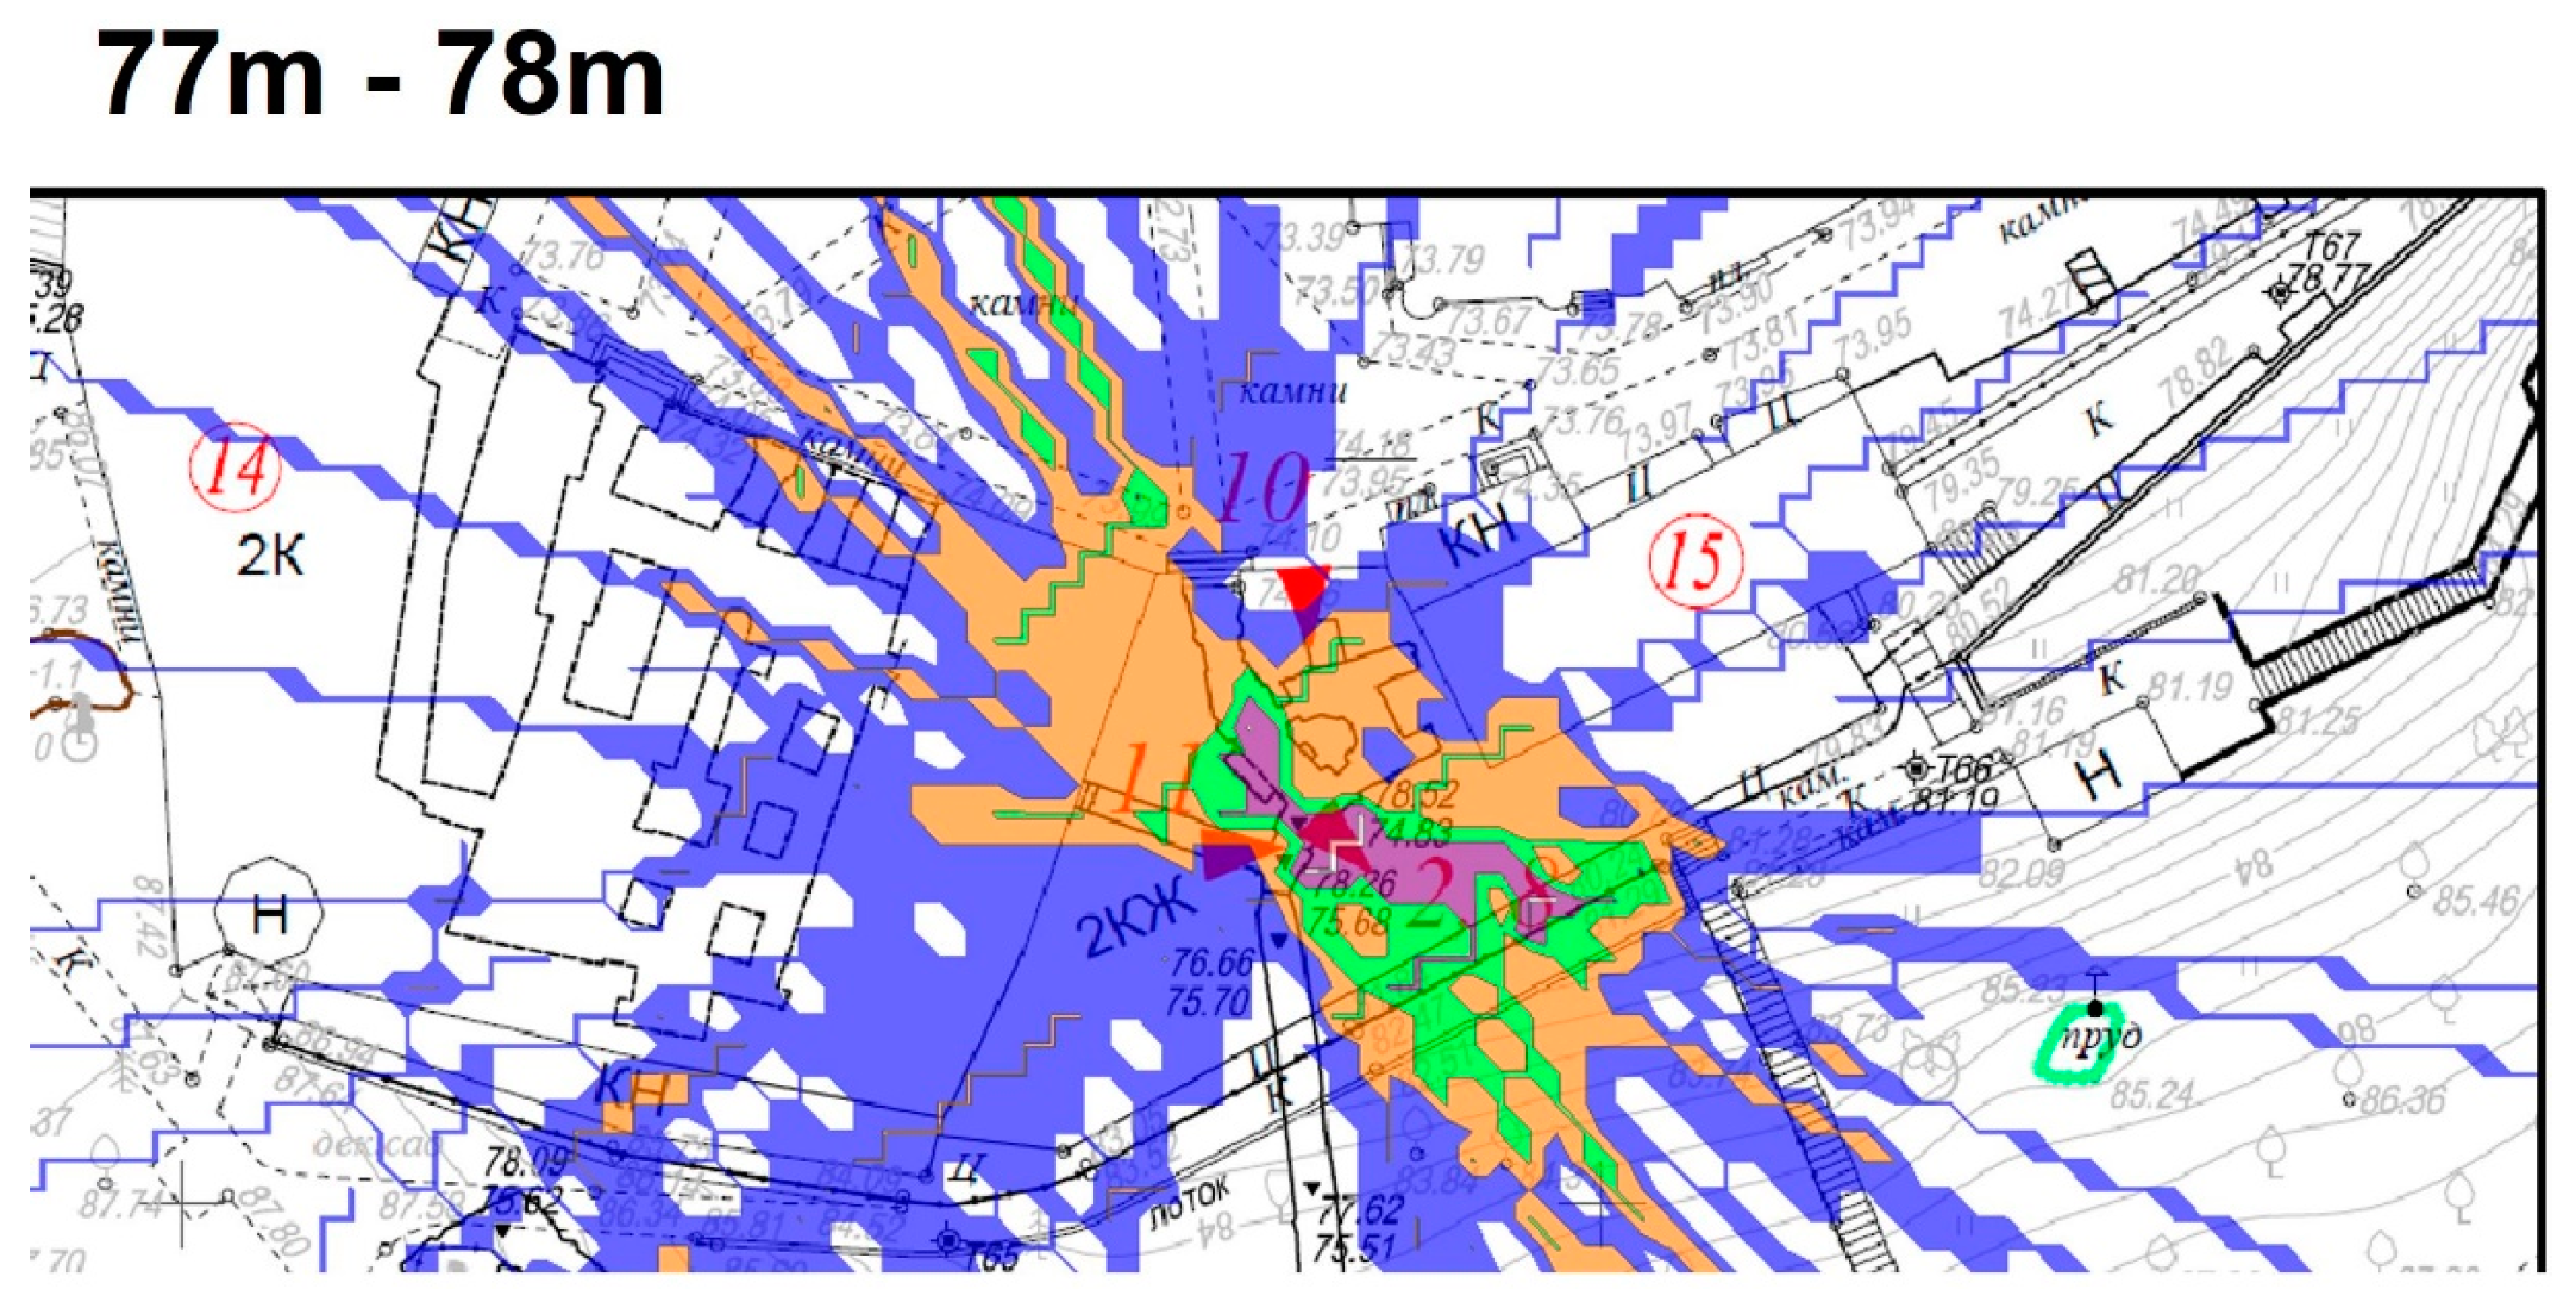
Figure 9.
Enlarged map of intersections of the muon flux local maxima with the planes between different altitudes for Detectors 2, 6, 8, 10, 11.
Figure 9.
Enlarged map of intersections of the muon flux local maxima with the planes between different altitudes for Detectors 2, 6, 8, 10, 11.
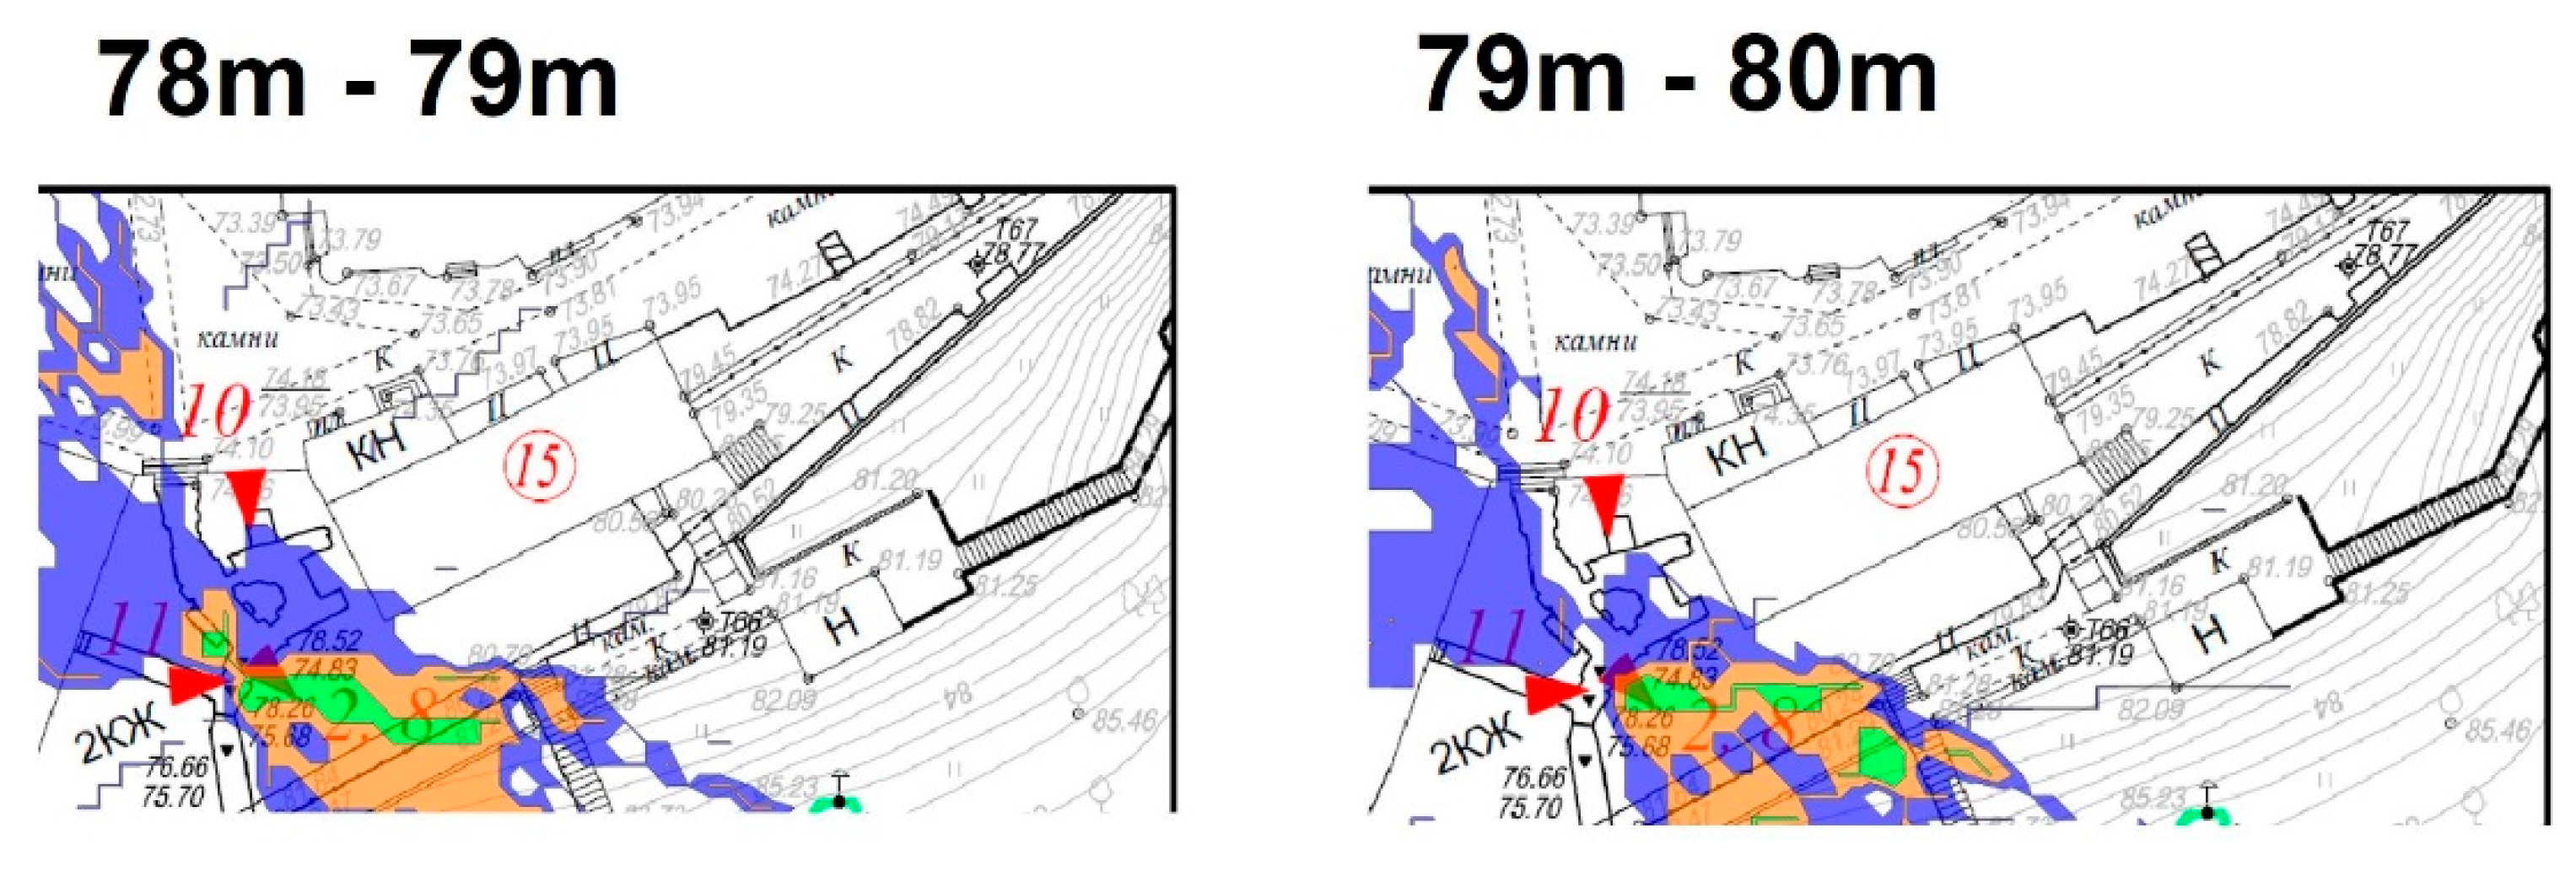
Figure 10.
Maps of intersection of the directions of muon fluxes local maxima with the planes between different altitudes for Detectors 3, 4, 7, 9. Data from one detector is marked in blue, the intersection of two detectors - in orange, three detectors - in green, and four detectors - in violet.
Figure 10.
Maps of intersection of the directions of muon fluxes local maxima with the planes between different altitudes for Detectors 3, 4, 7, 9. Data from one detector is marked in blue, the intersection of two detectors - in orange, three detectors - in green, and four detectors - in violet.
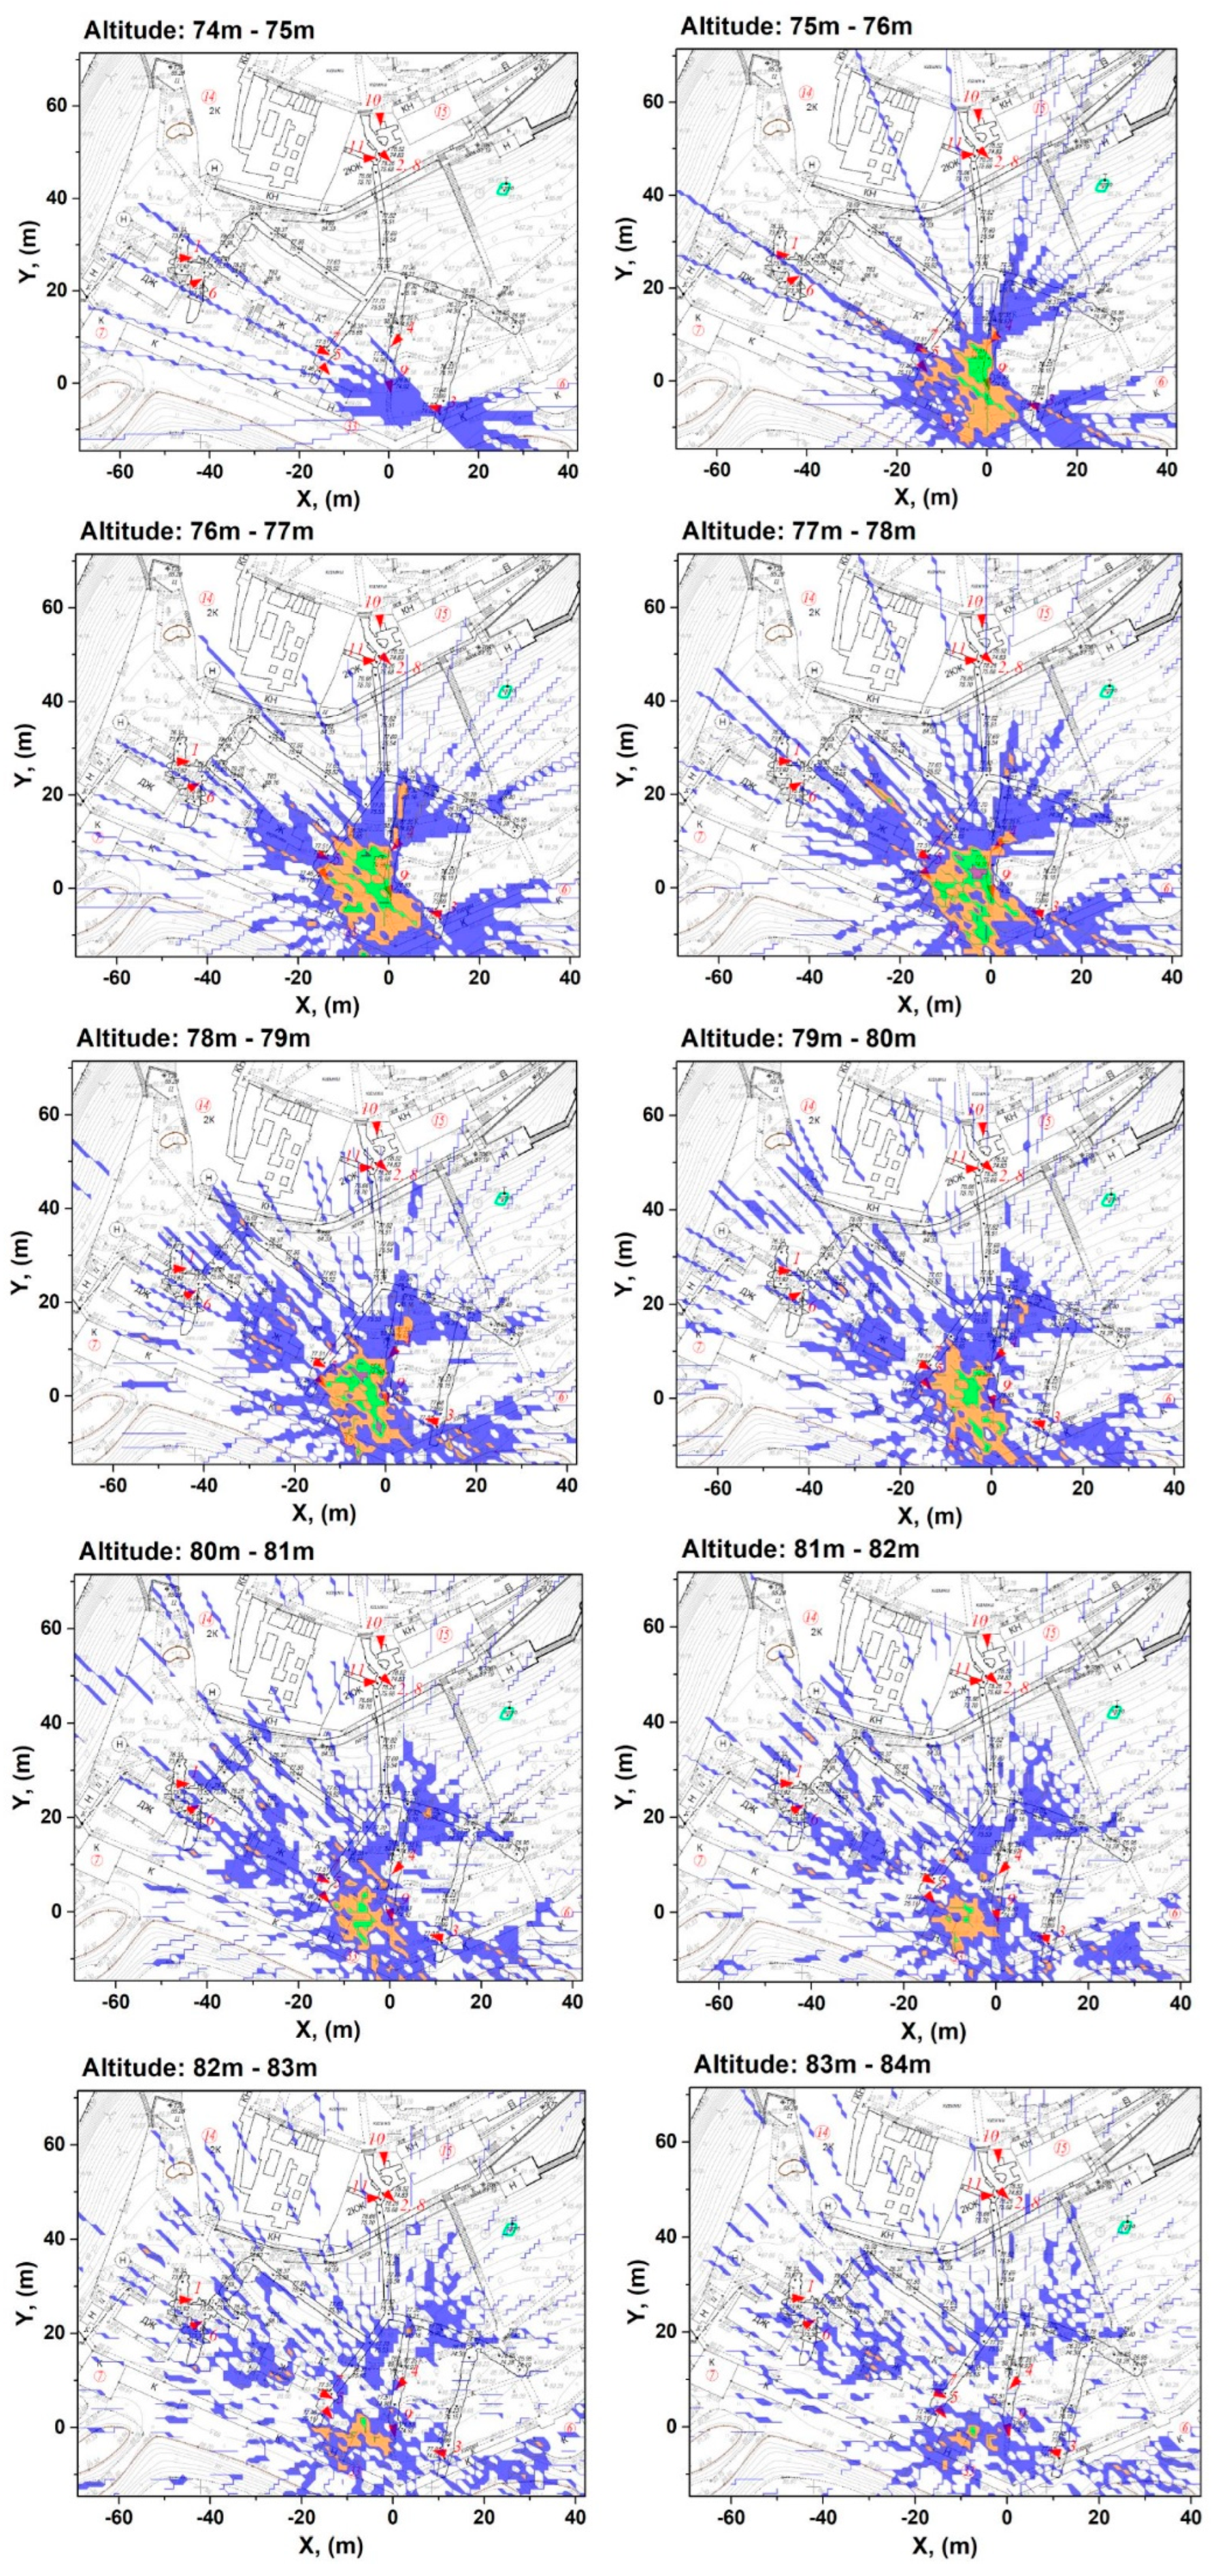
Figure 11.
Enlarged map of the intersection of the directions of the muon fluxes local maxima with the planes between indicated altitudes for Detectors 3, 4, 7, 9. Here: the intersection of two detectors is marked in blue, three detectors - in orange, four - in green.
Figure 11.
Enlarged map of the intersection of the directions of the muon fluxes local maxima with the planes between indicated altitudes for Detectors 3, 4, 7, 9. Here: the intersection of two detectors is marked in blue, three detectors - in orange, four - in green.
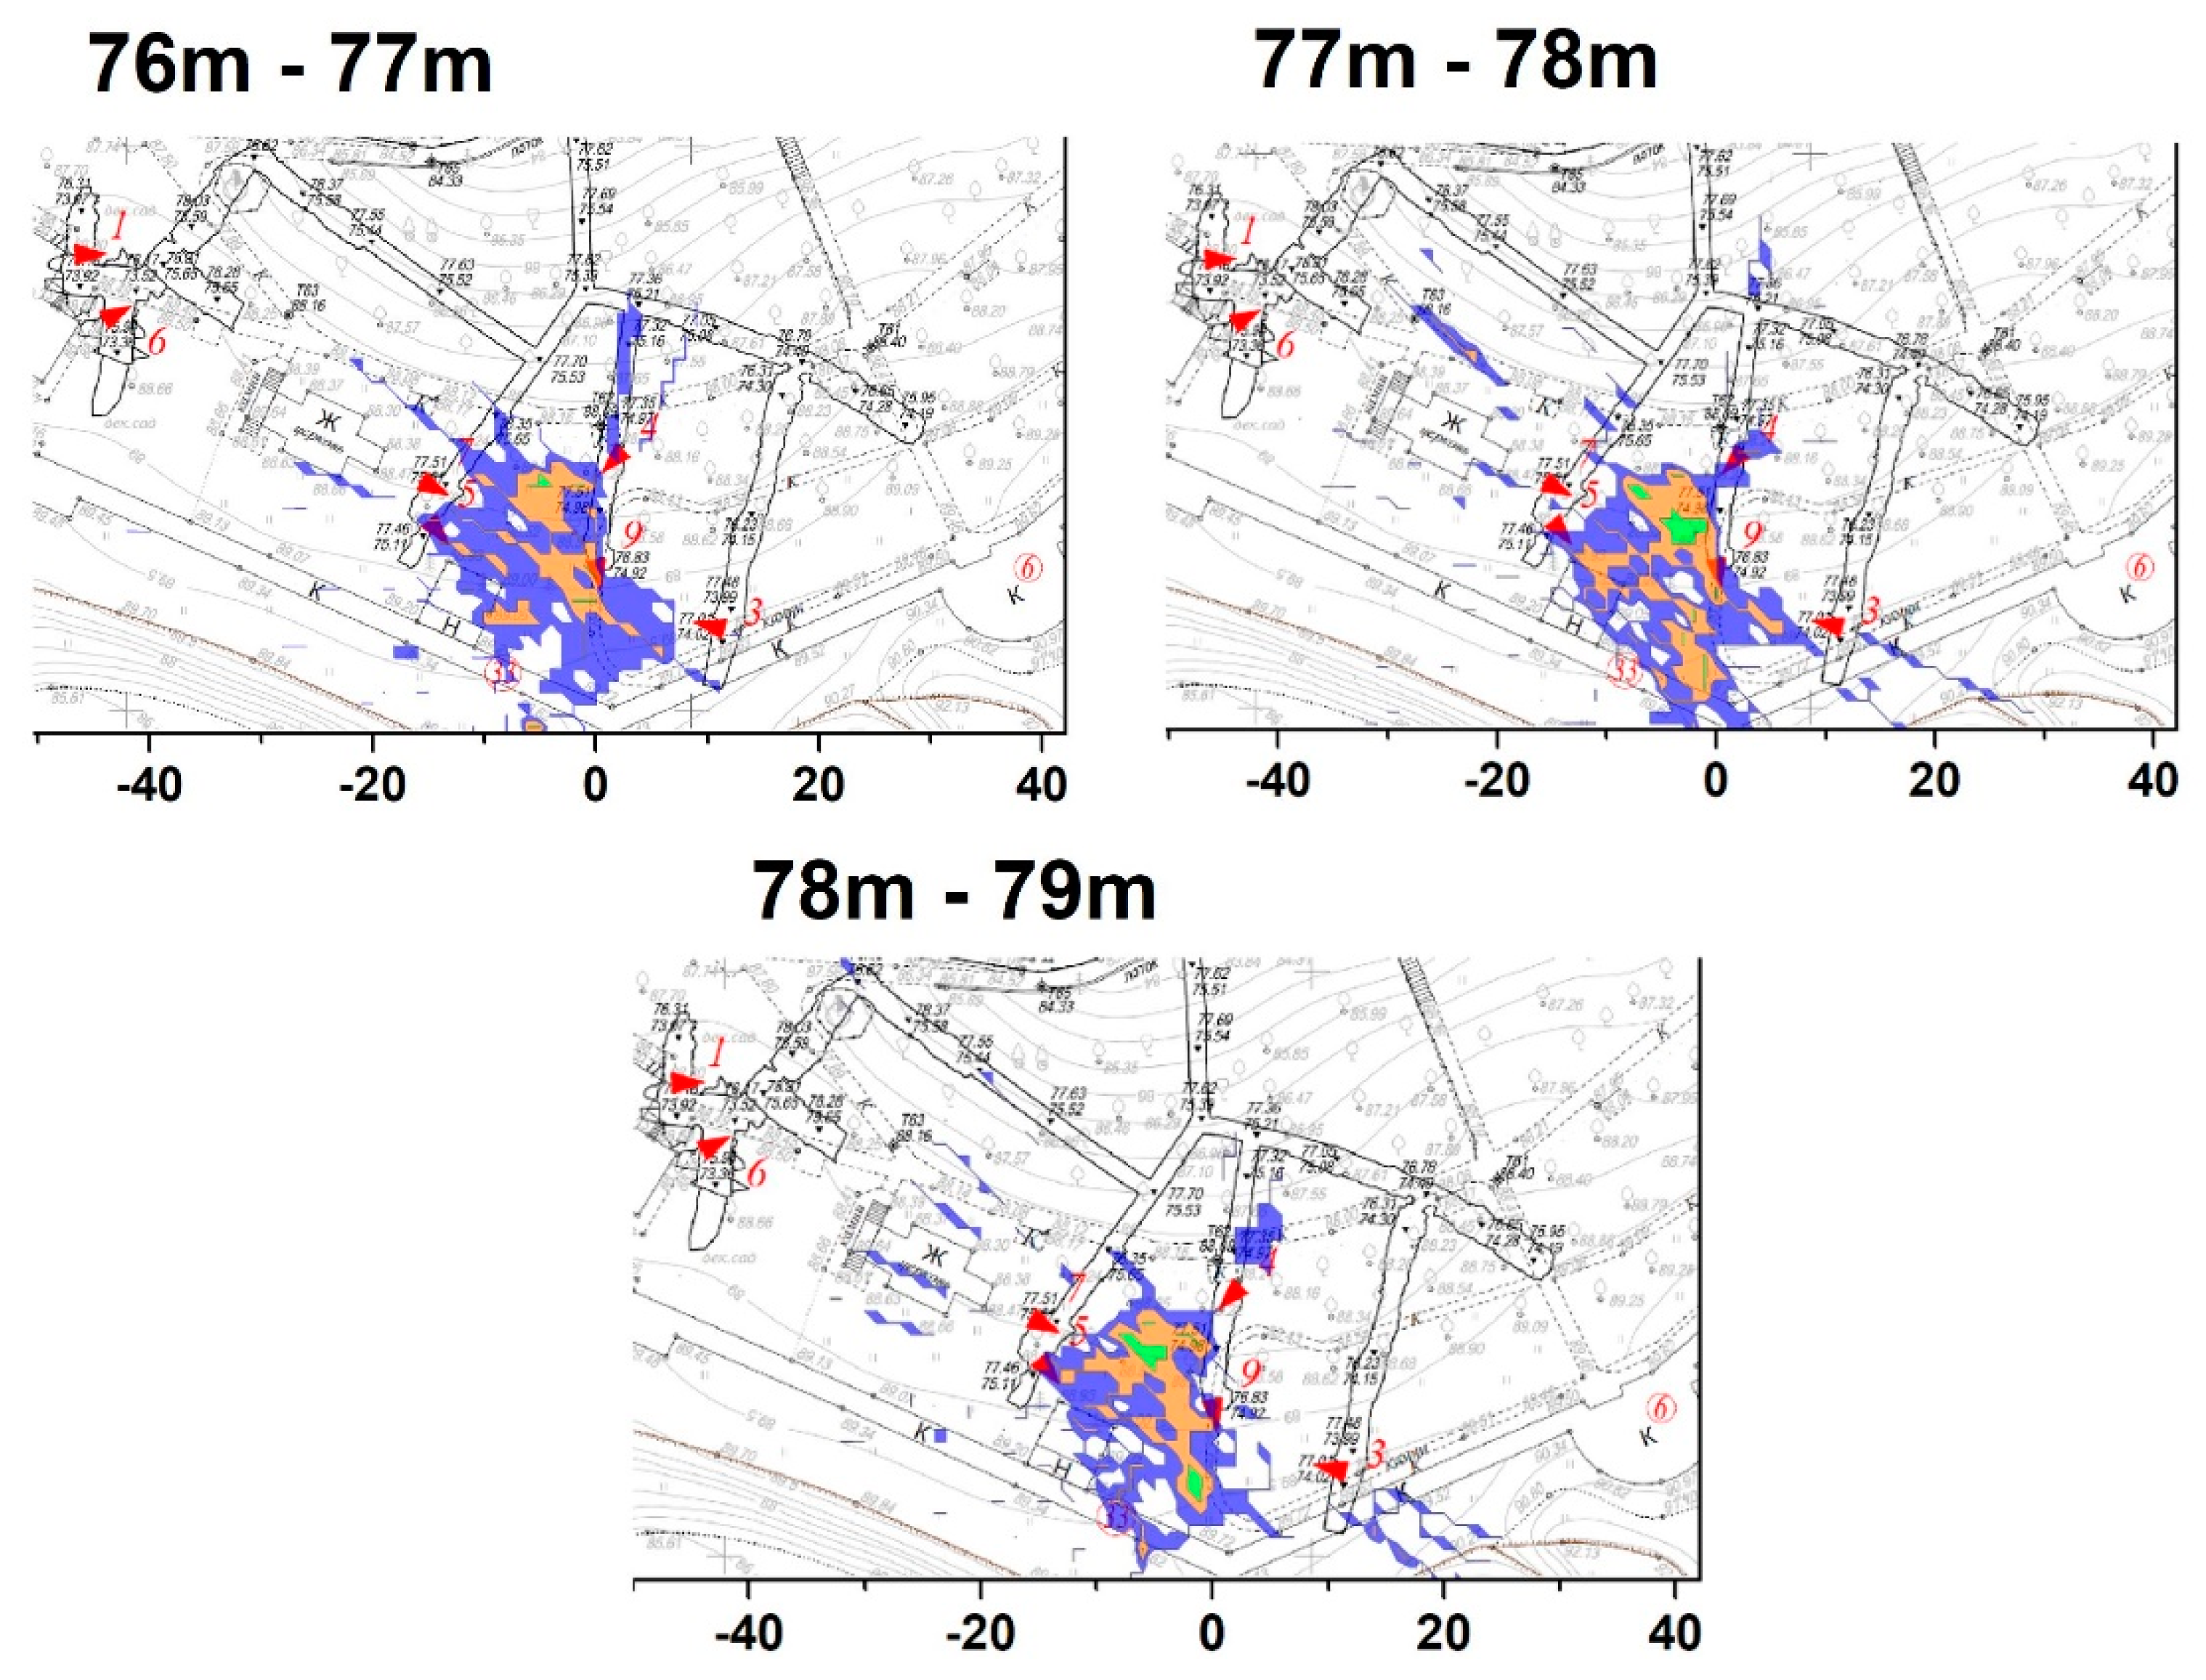
Figure 12.
Discovered underground cavities on the map of "God-made caves": the crypt (area I in Figure 3) and Trinity Street (area II in Figure 3).
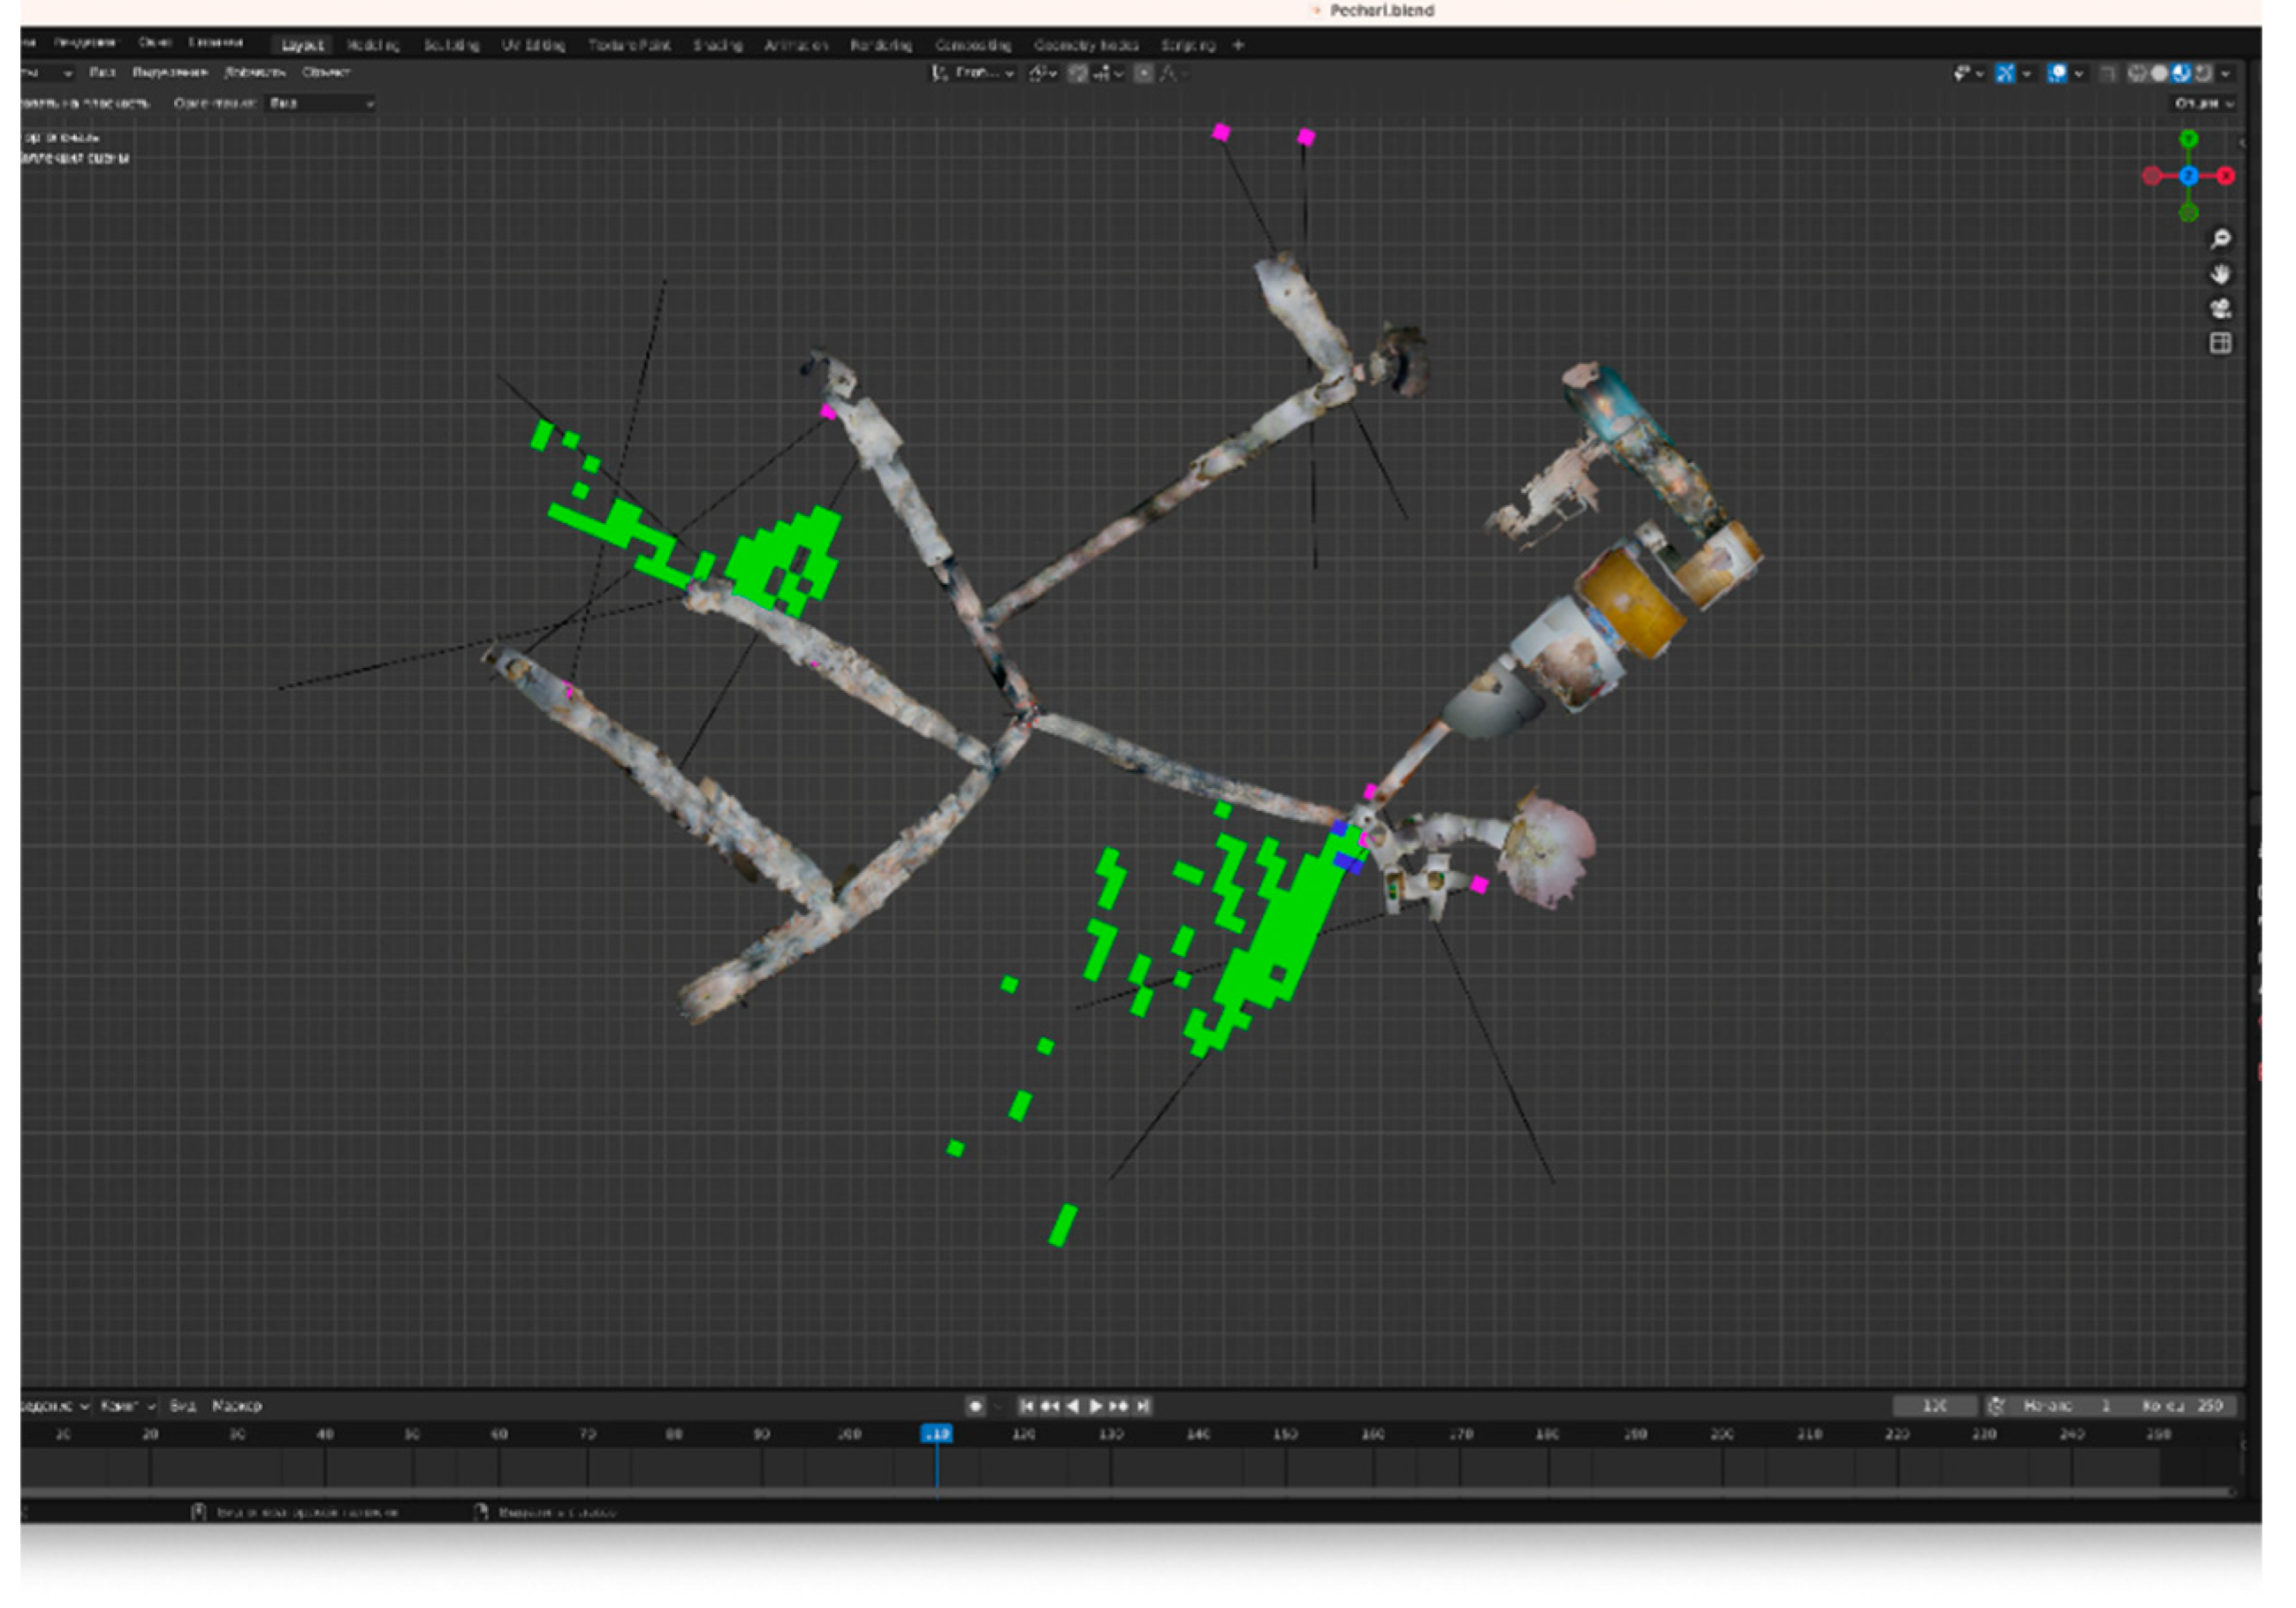
Figure 13.
The area of the discovered crypt from above (a) and from the side (b).
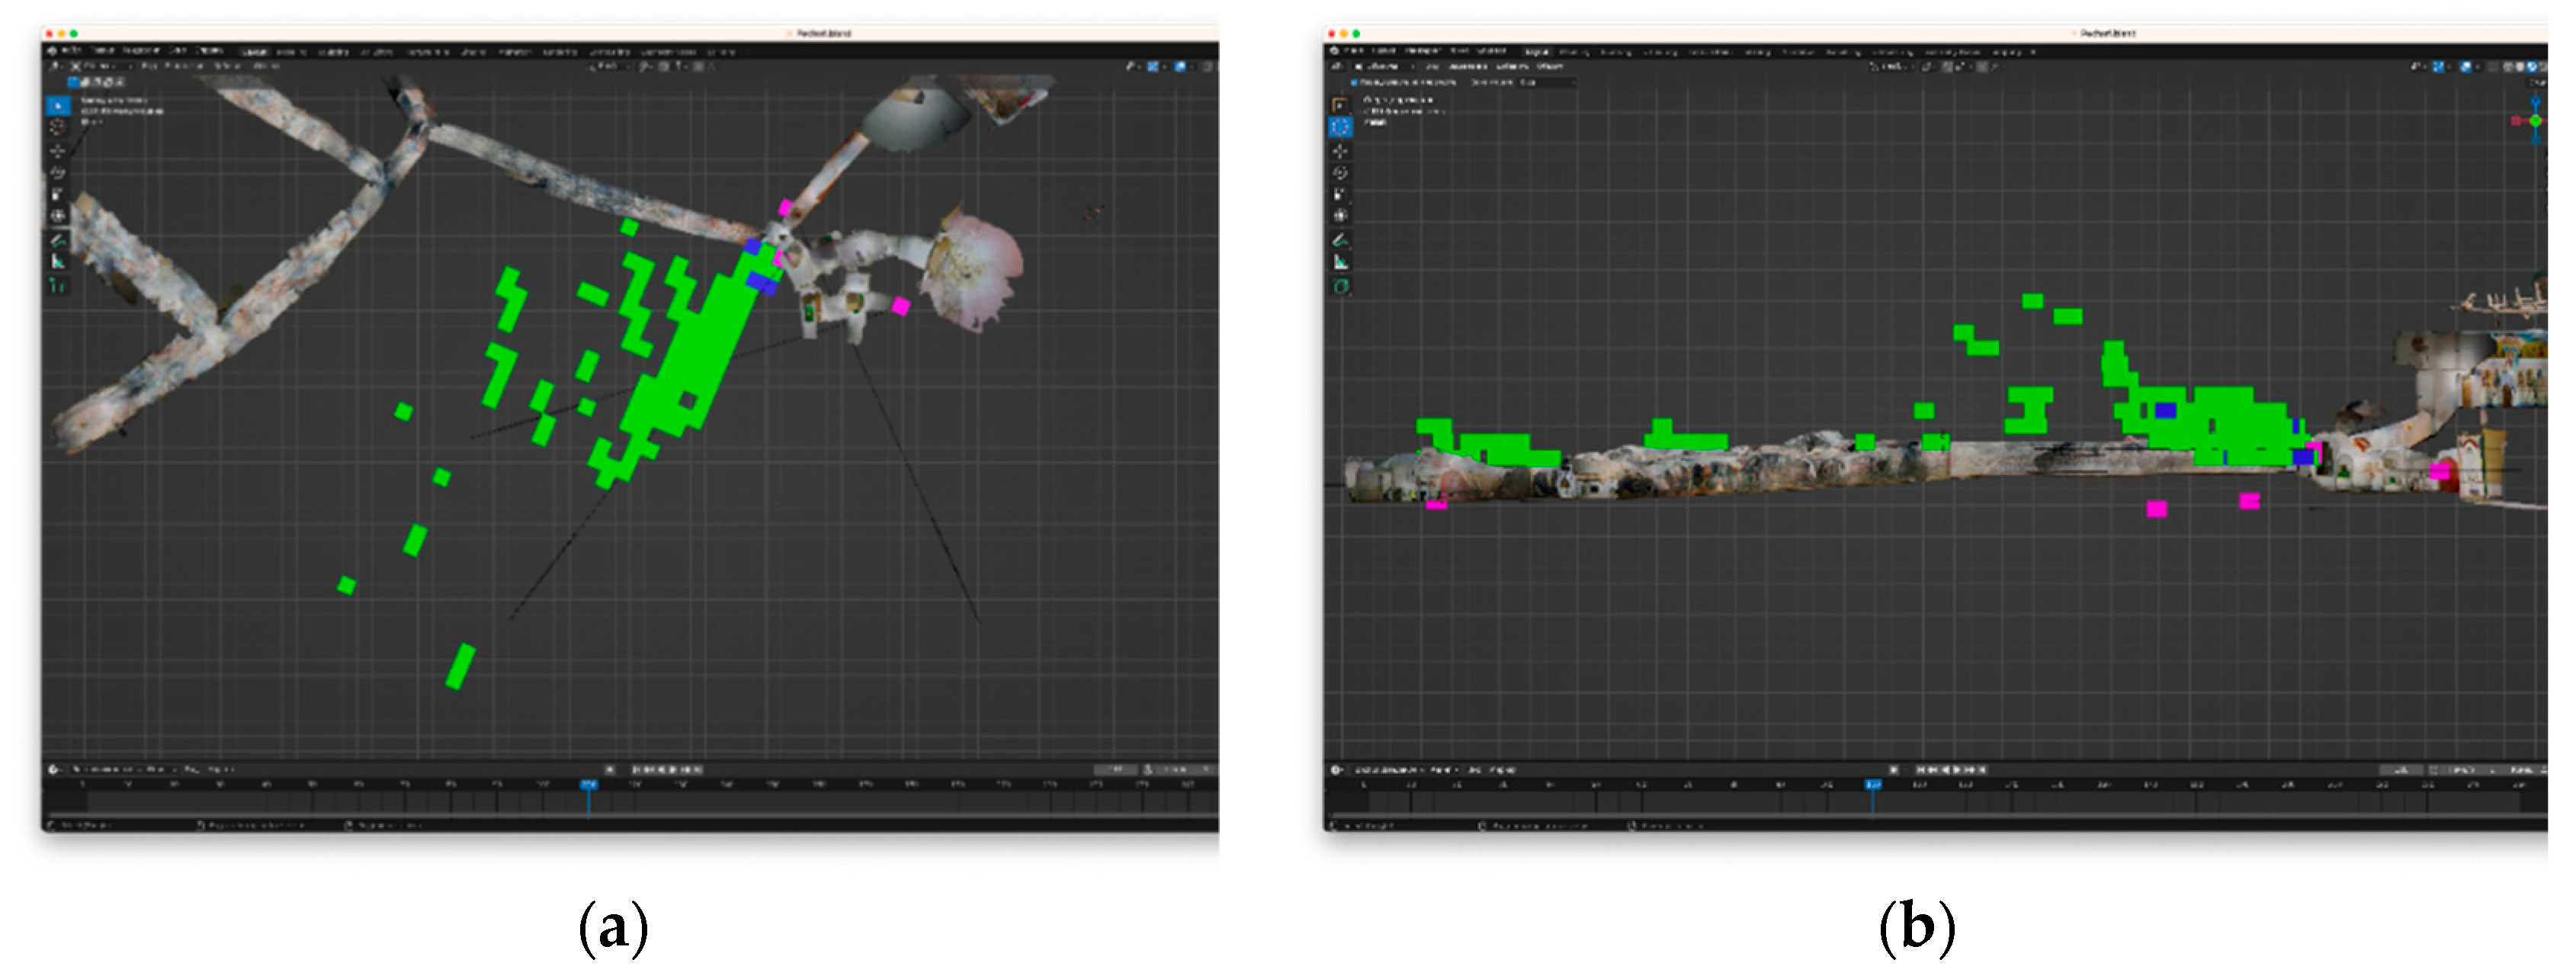
Figure 14.
Trinity Street area from above (a) and from the side (b).
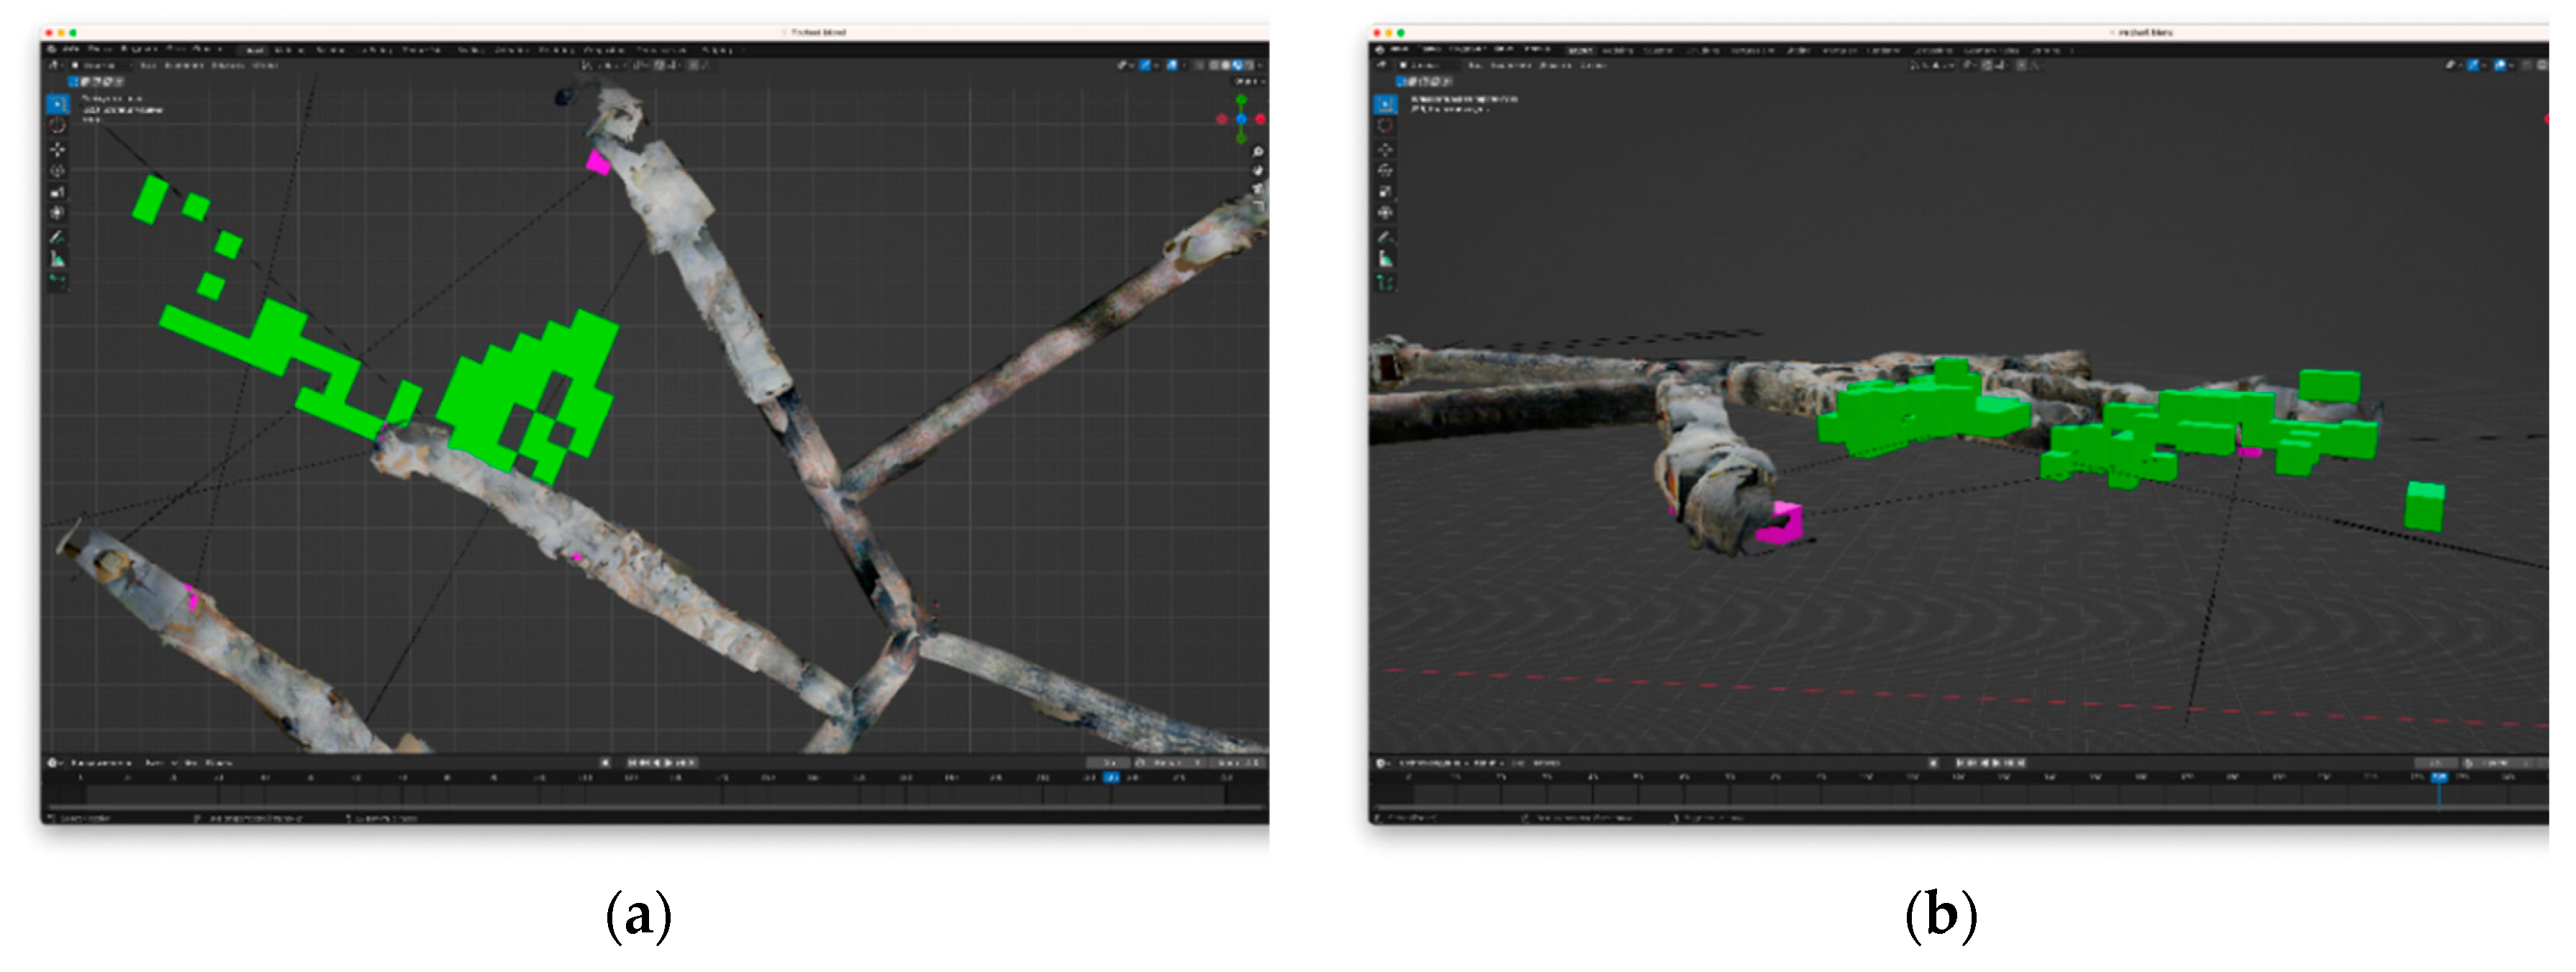
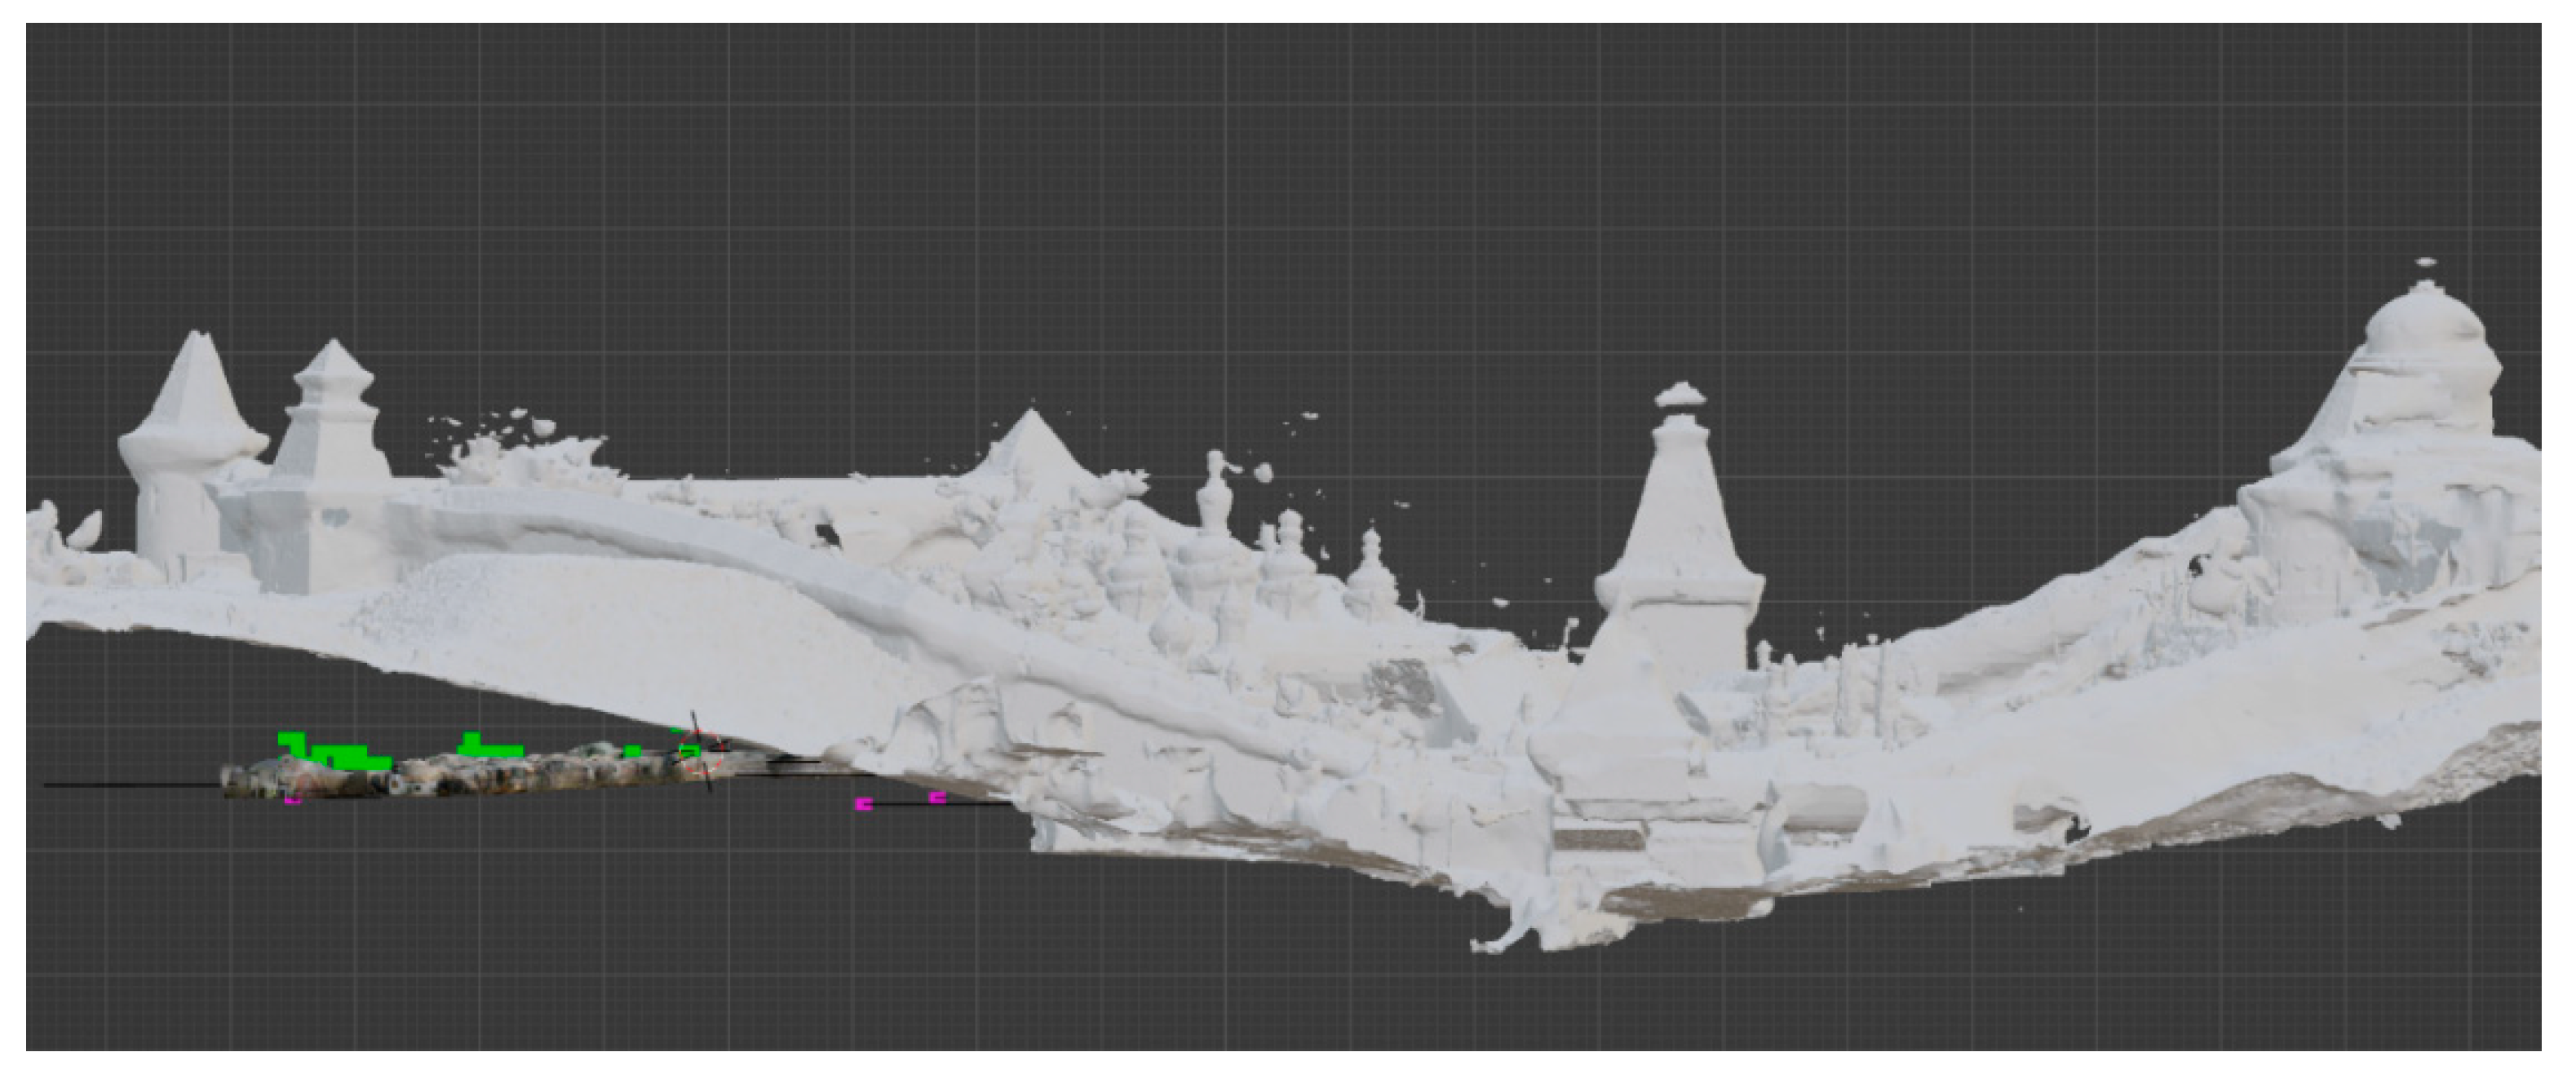
Figure 15.
The monastery wall with the marked location of newly discovered voids underground.
Disclaimer/Publisher’s Note: The statements, opinions and data contained in all publications are solely those of the individual author(s) and contributor(s) and not of MDPI and/or the editor(s). MDPI and/or the editor(s) disclaim responsibility for any injury to people or property resulting from any ideas, methods, instructions or products referred to in the content. |
© 2023 by the authors. Licensee MDPI, Basel, Switzerland. This article is an open access article distributed under the terms and conditions of the Creative Commons Attribution (CC BY) license (http://creativecommons.org/licenses/by/4.0/).
Copyright: This open access article is published under a Creative Commons CC BY 4.0 license, which permit the free download, distribution, and reuse, provided that the author and preprint are cited in any reuse.


