Submitted:
13 September 2023
Posted:
14 September 2023
You are already at the latest version
Abstract
Keywords:
1. Introduction
2. Results
2.1. Bacteria isolation
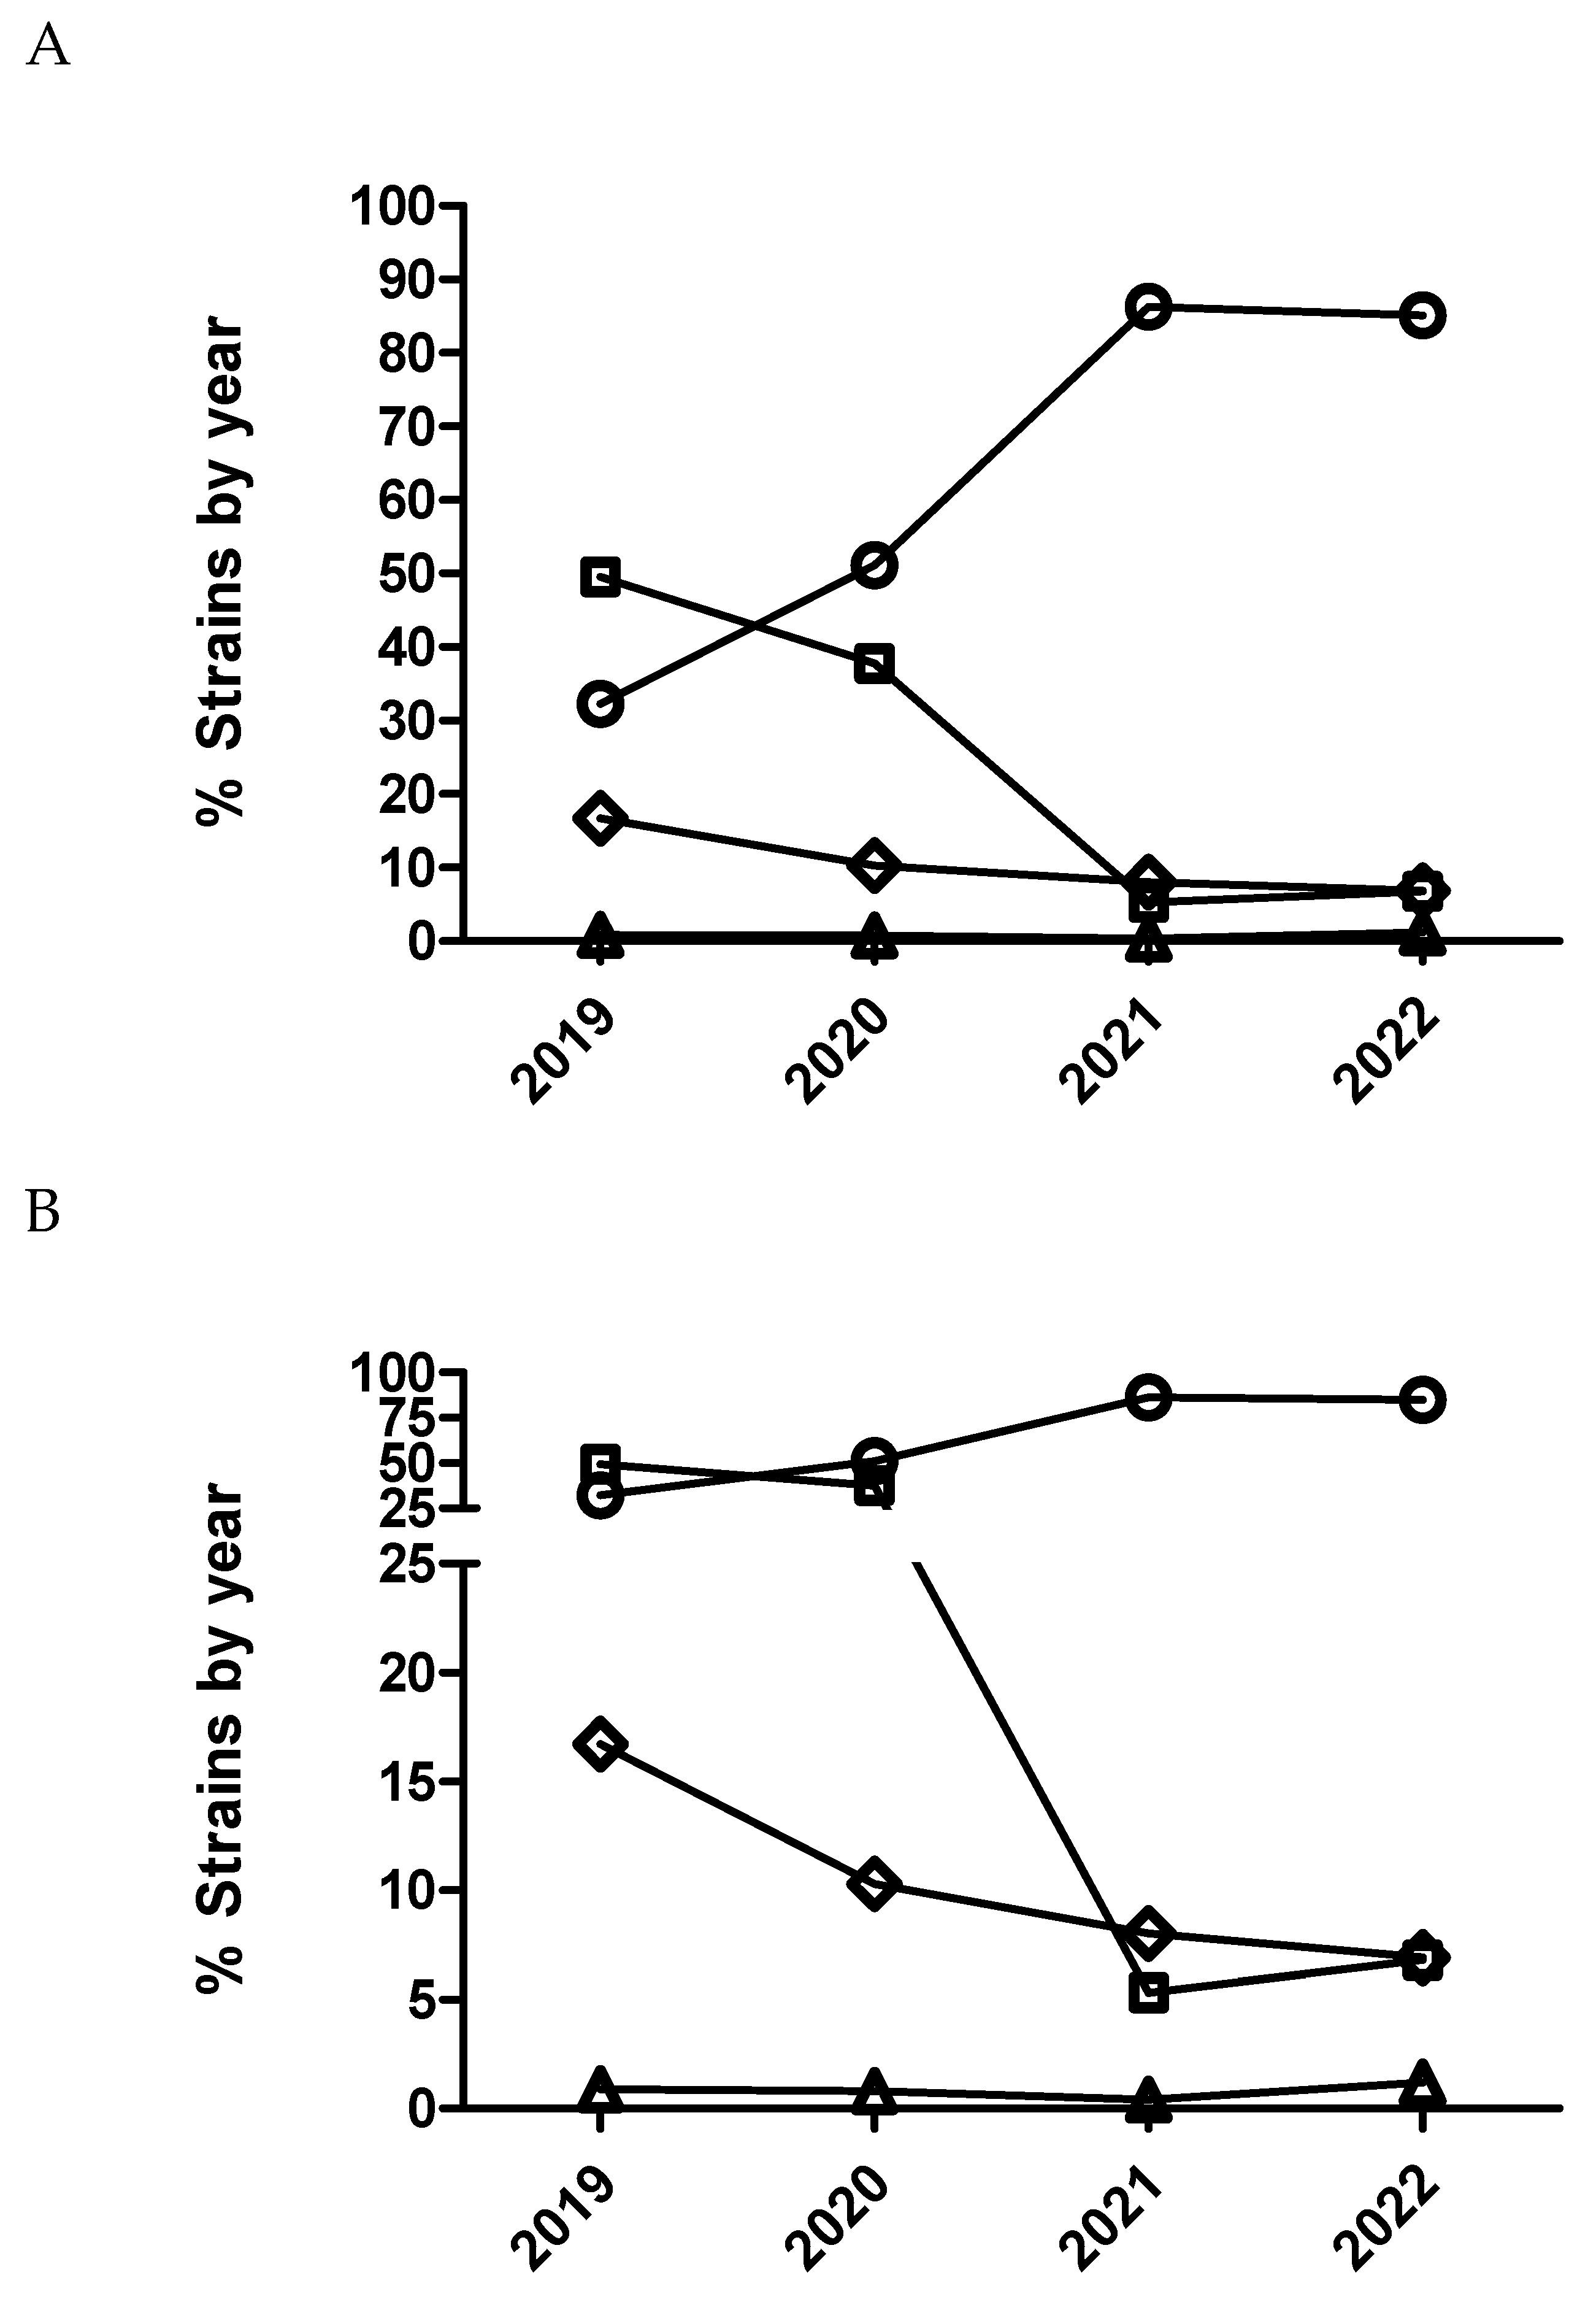
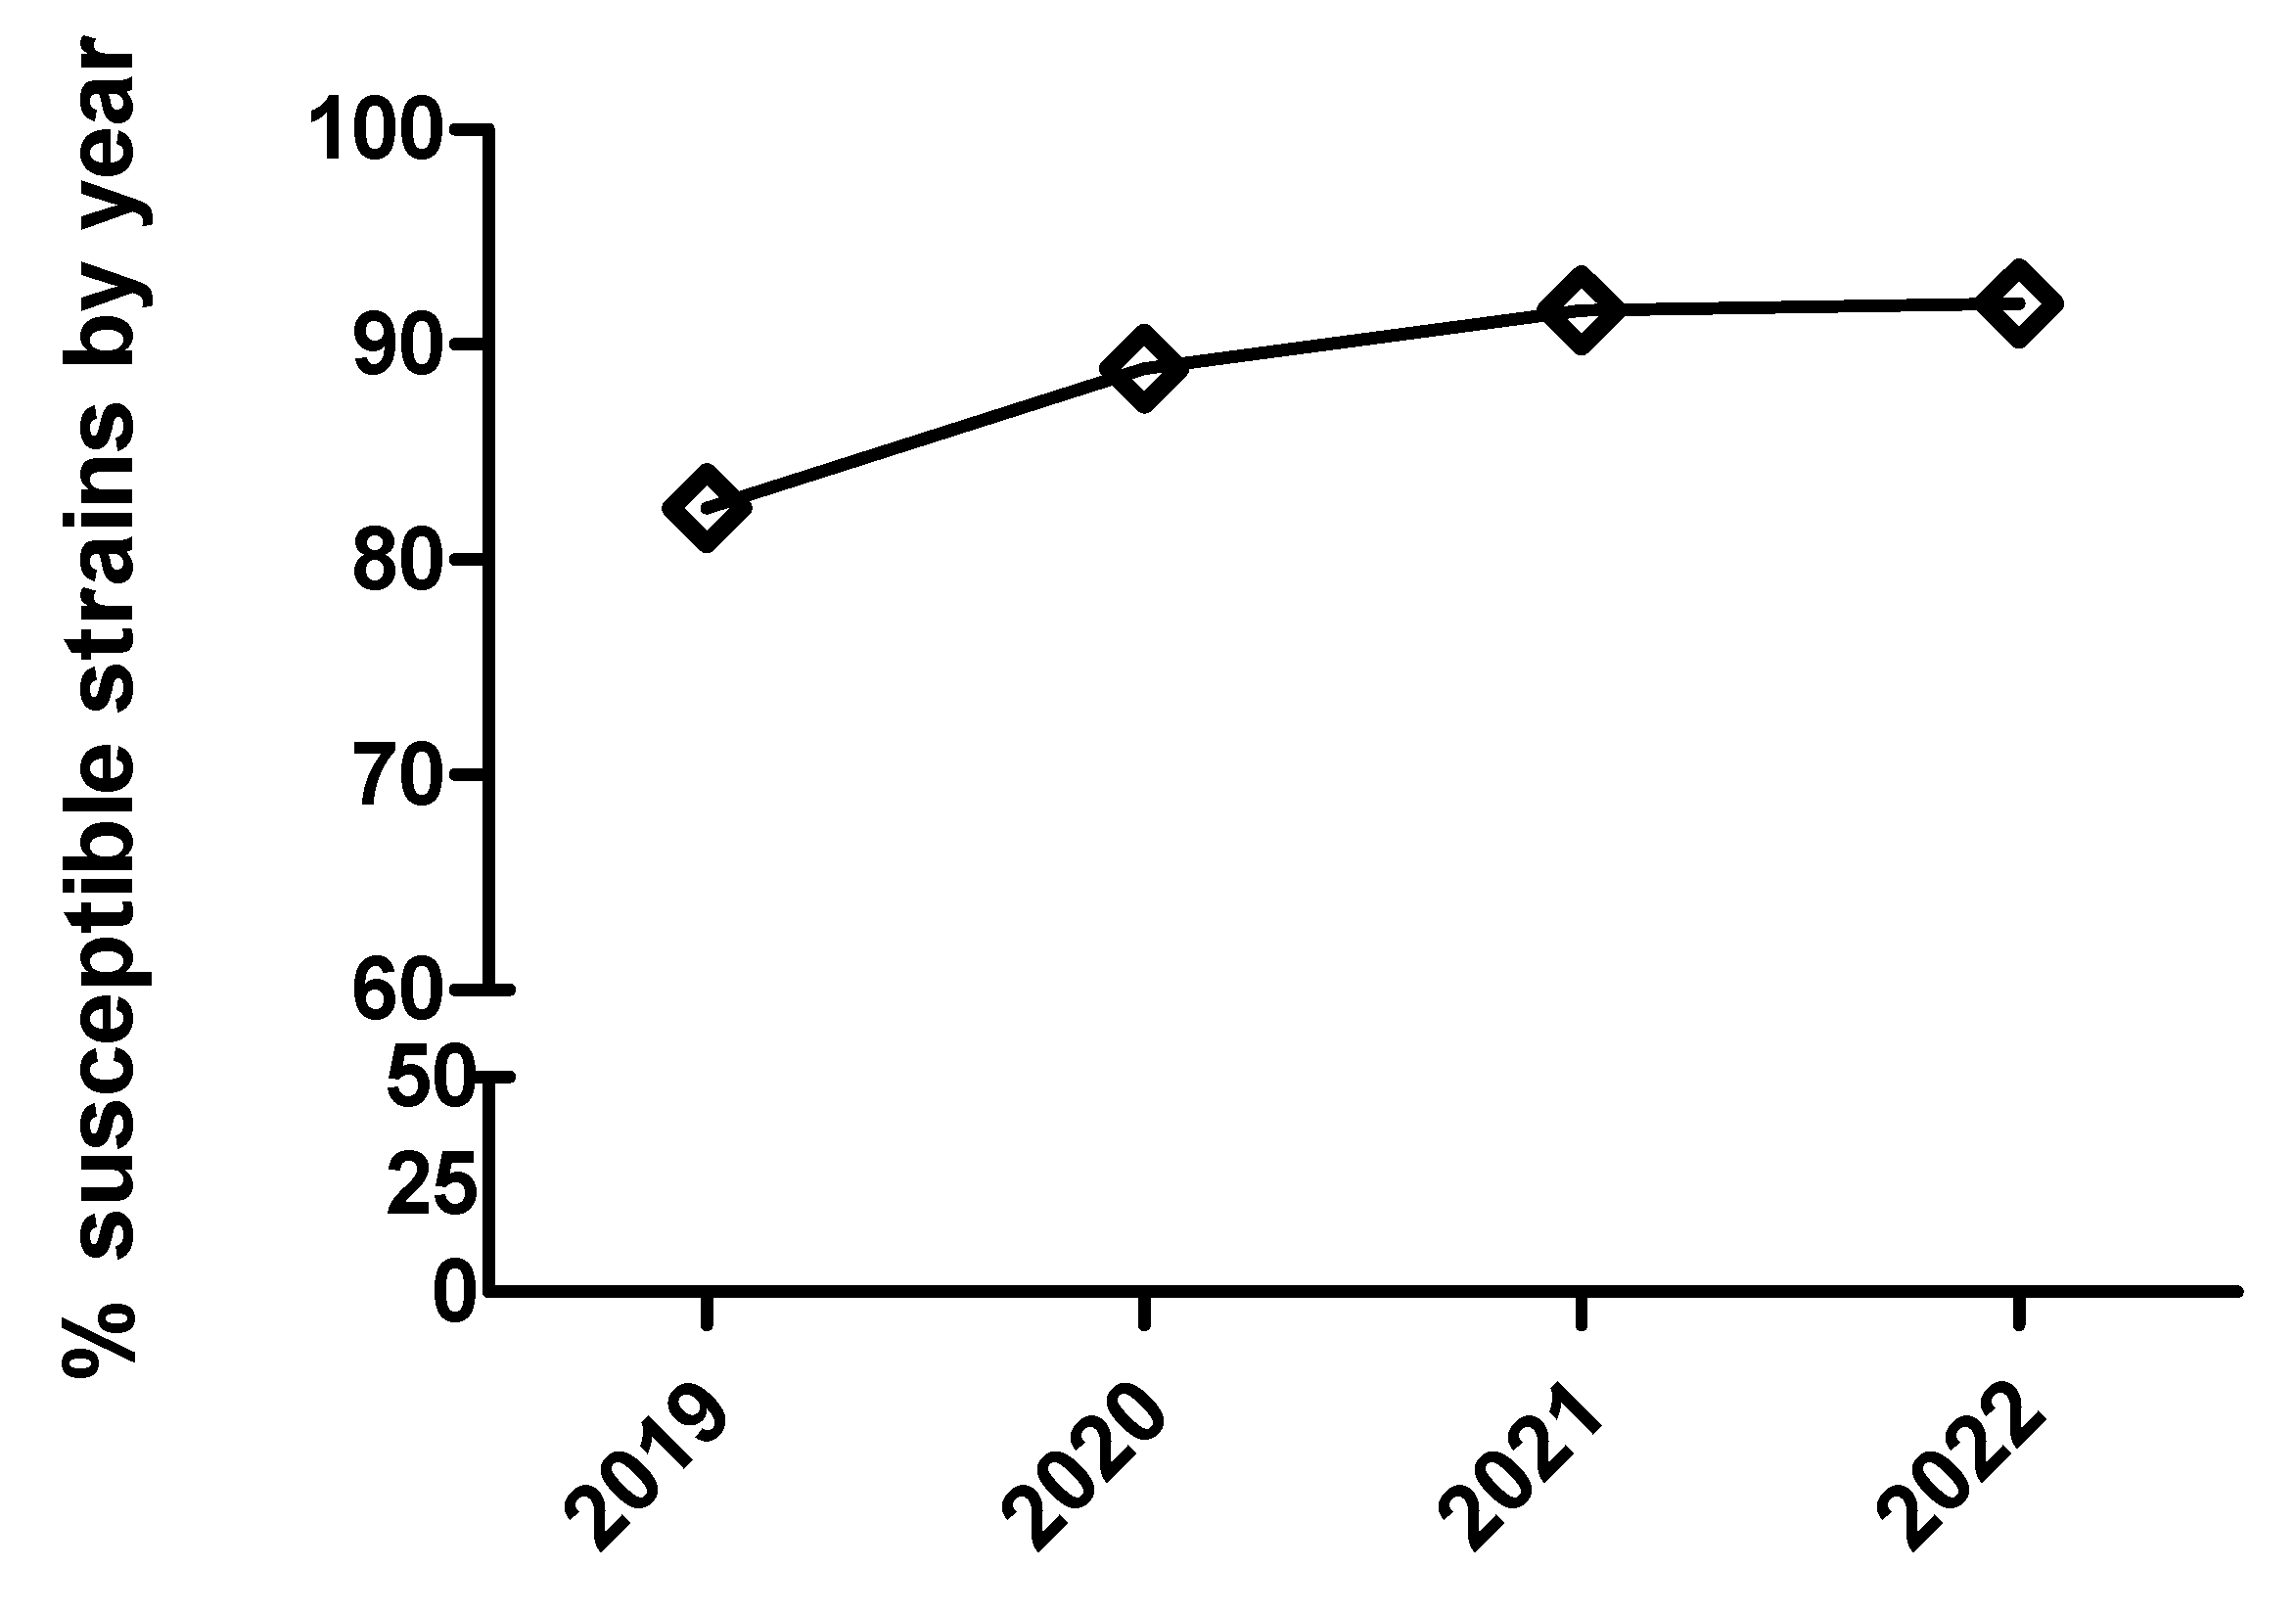
2.2. Distribution of MIC by antimicrobial and microorganism across the years
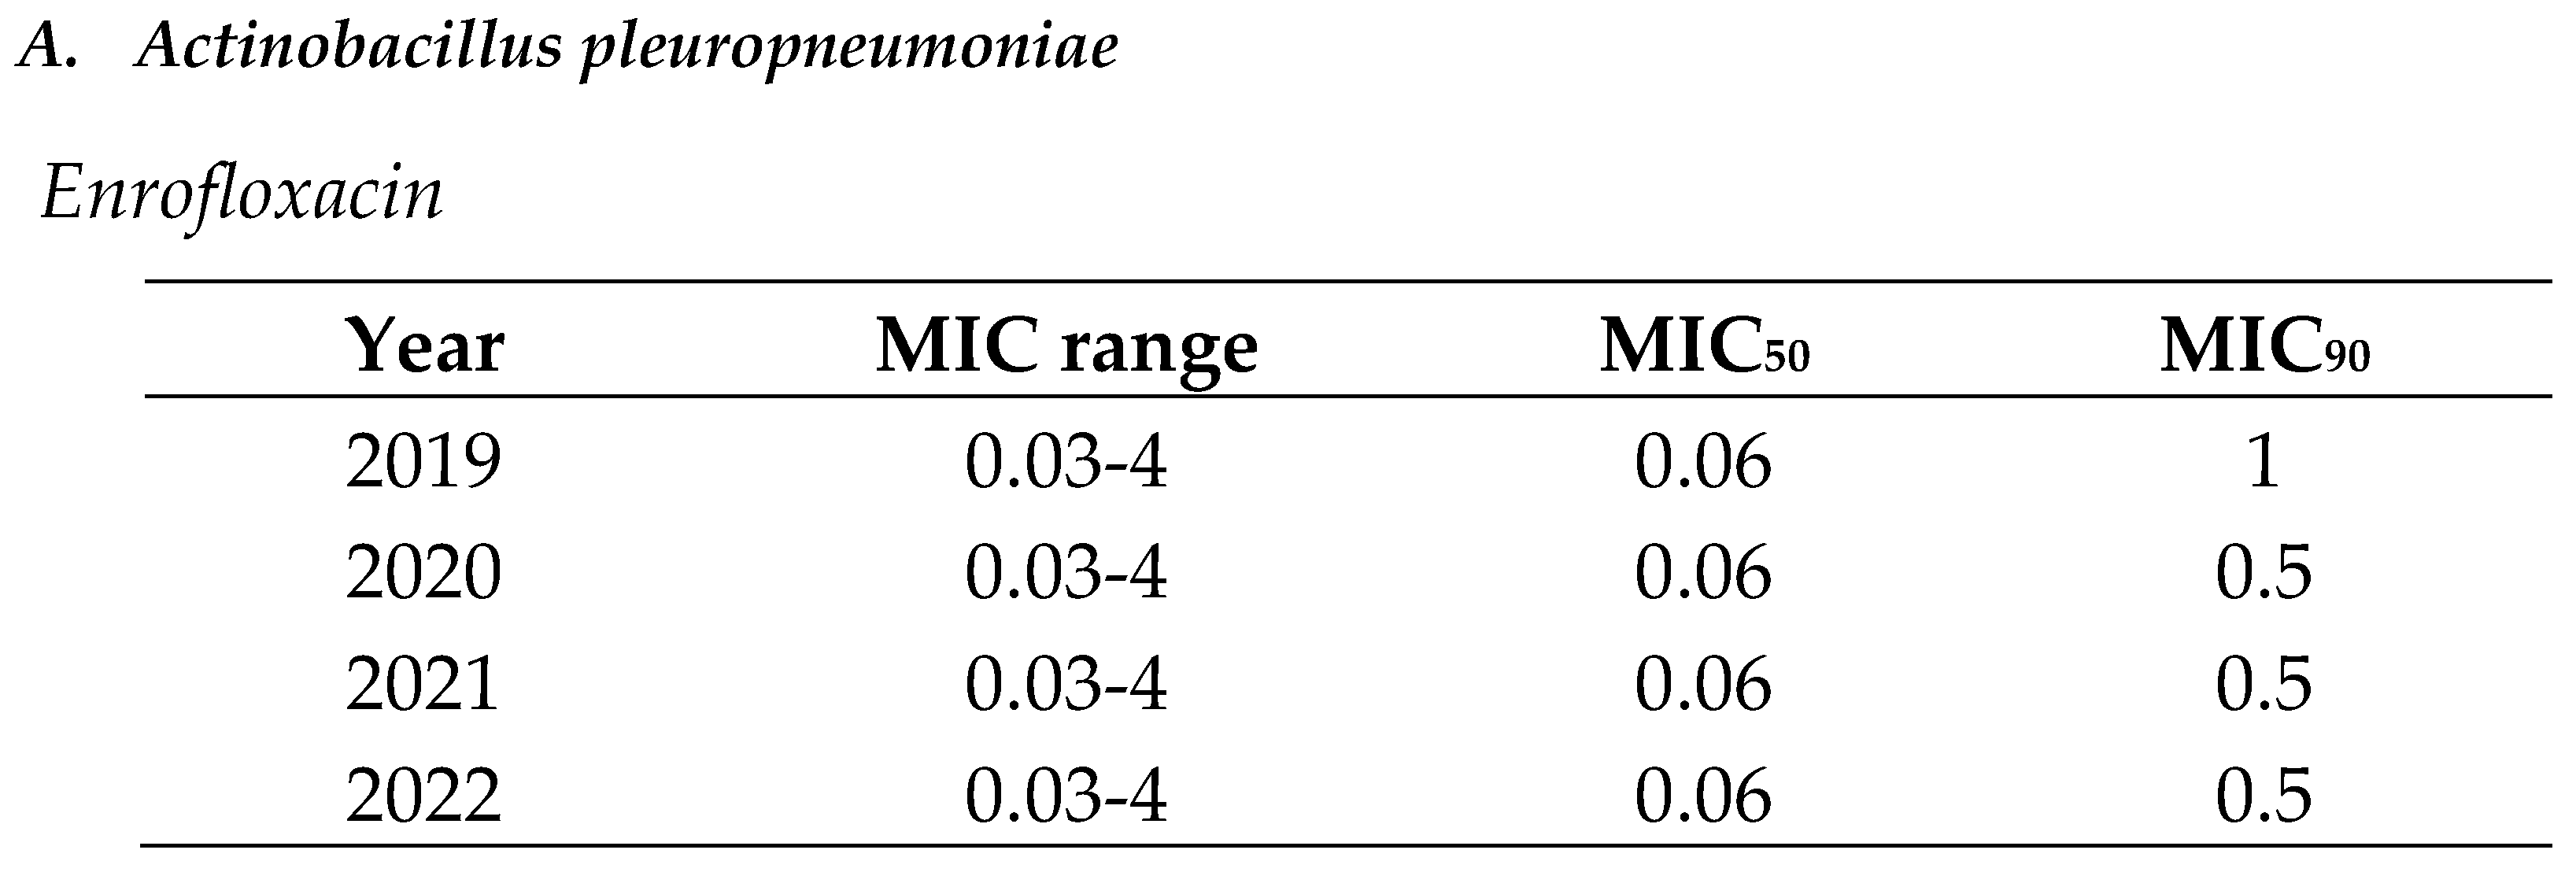
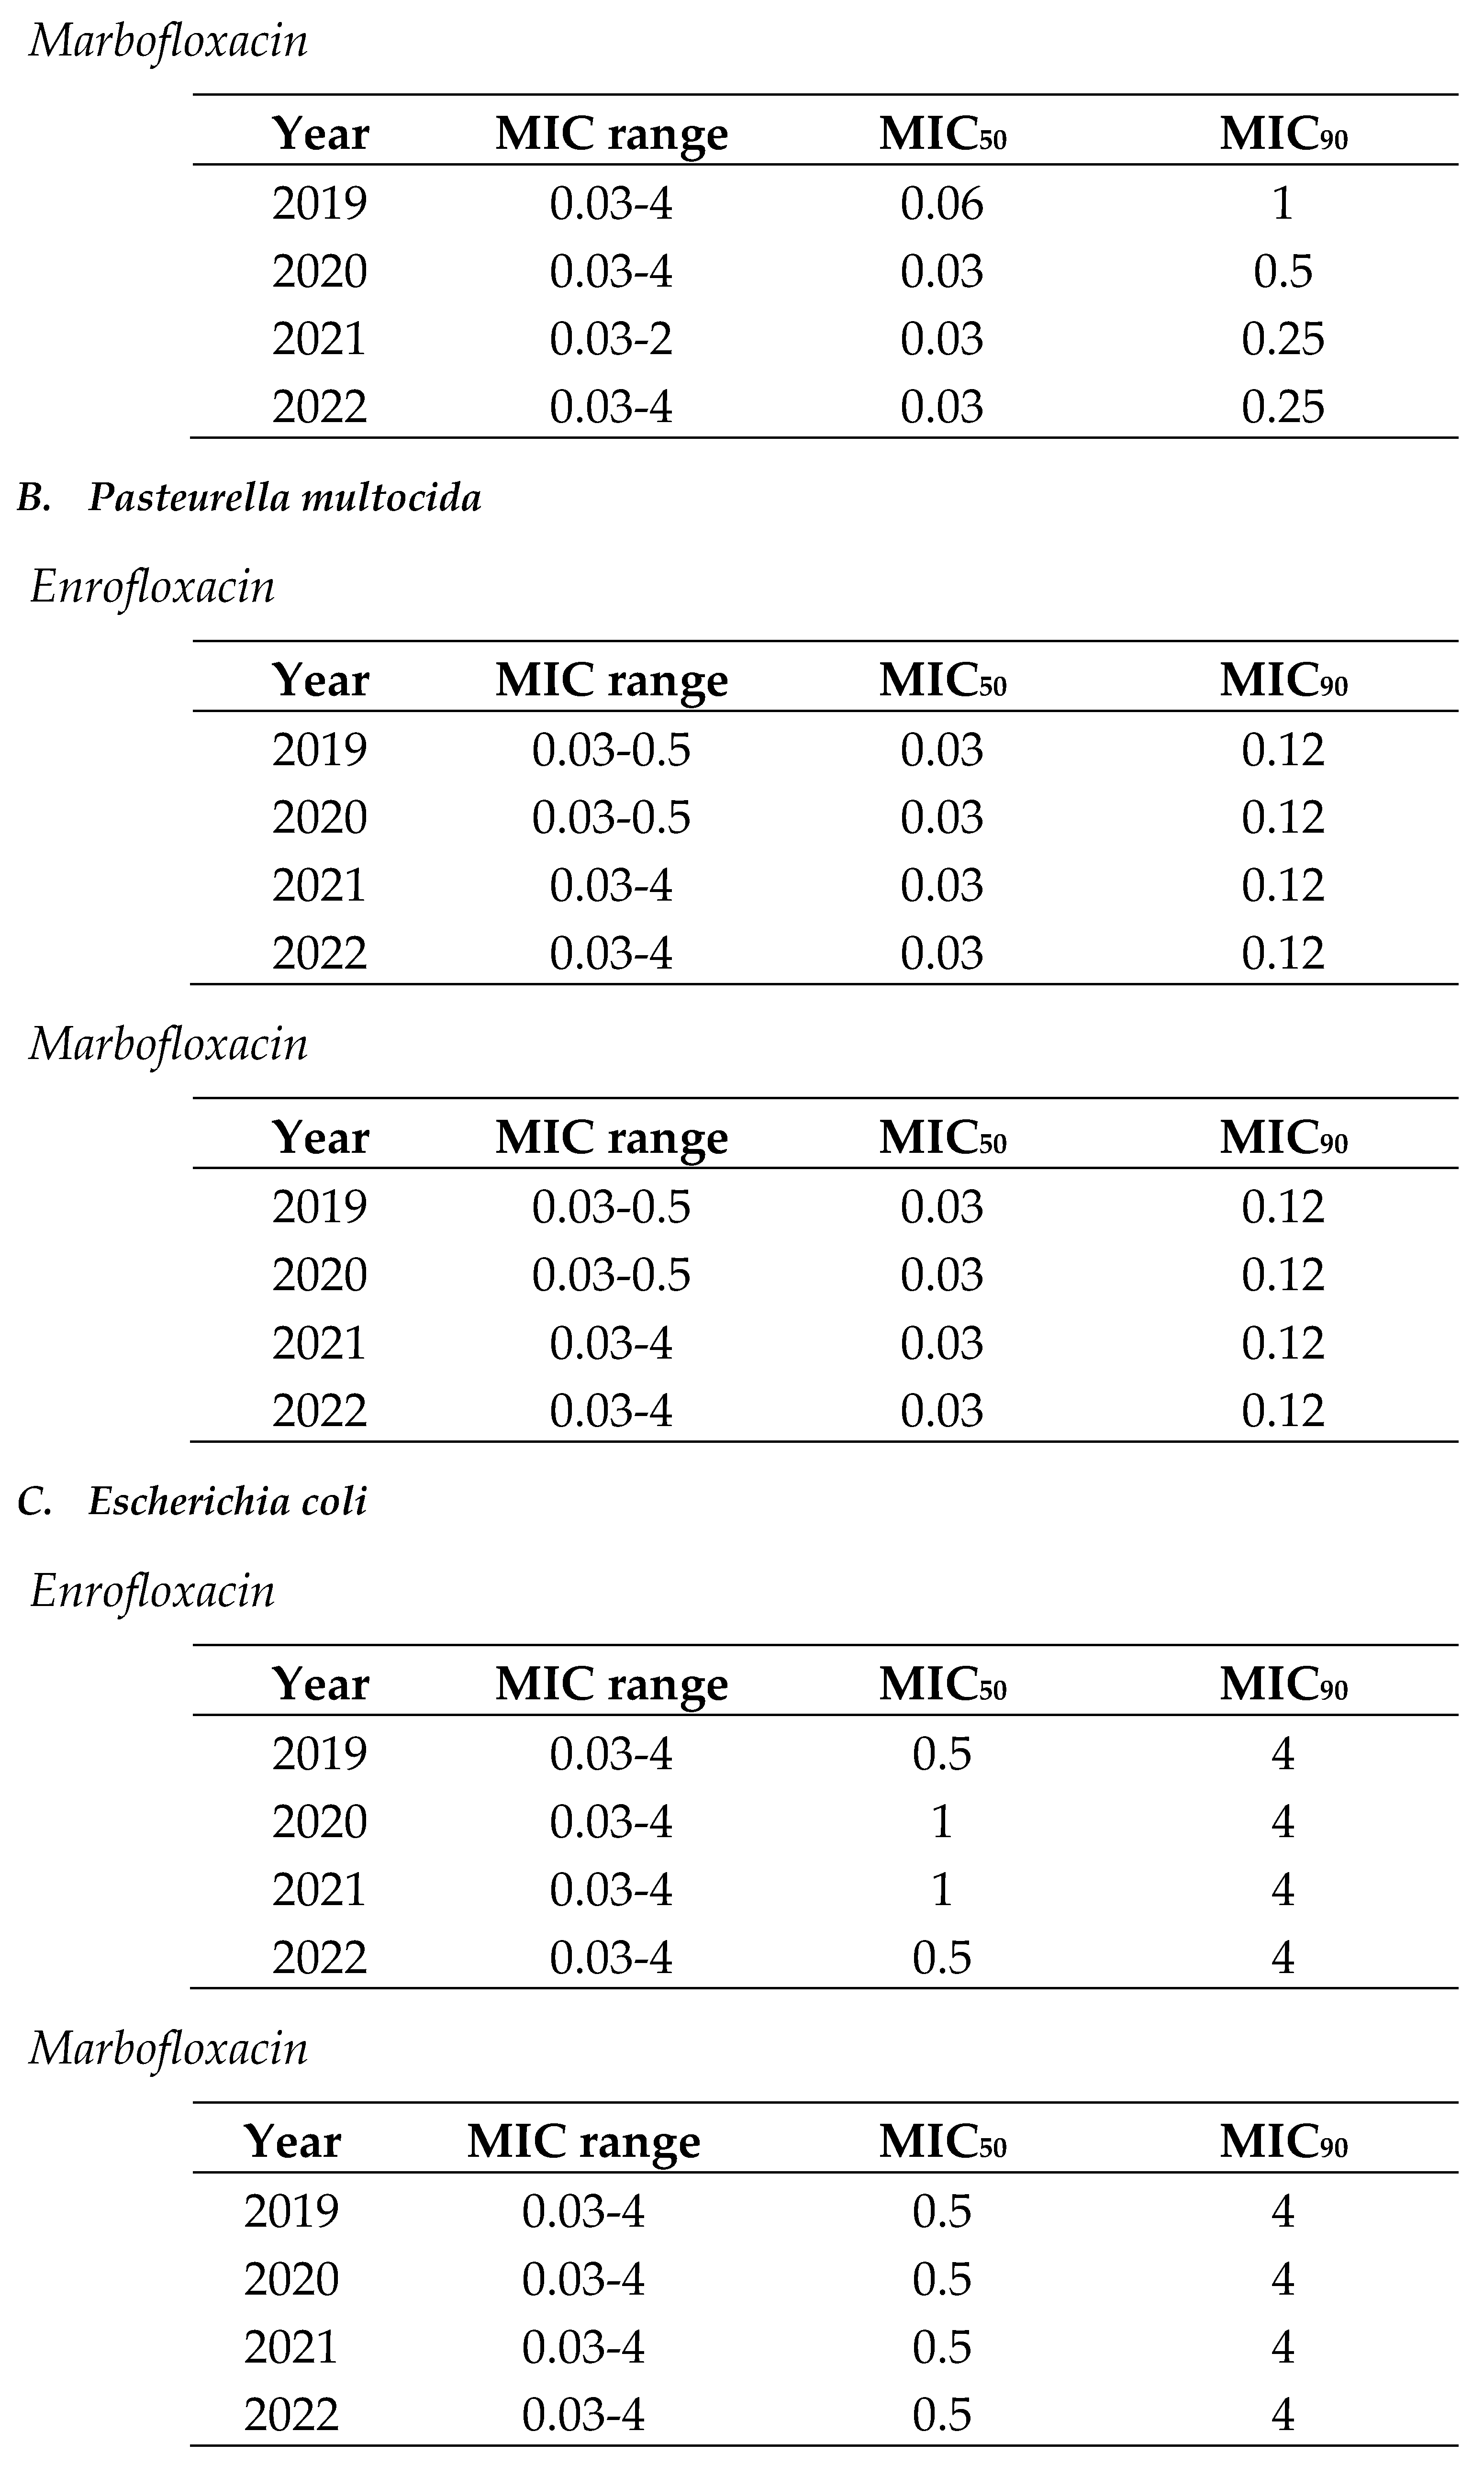
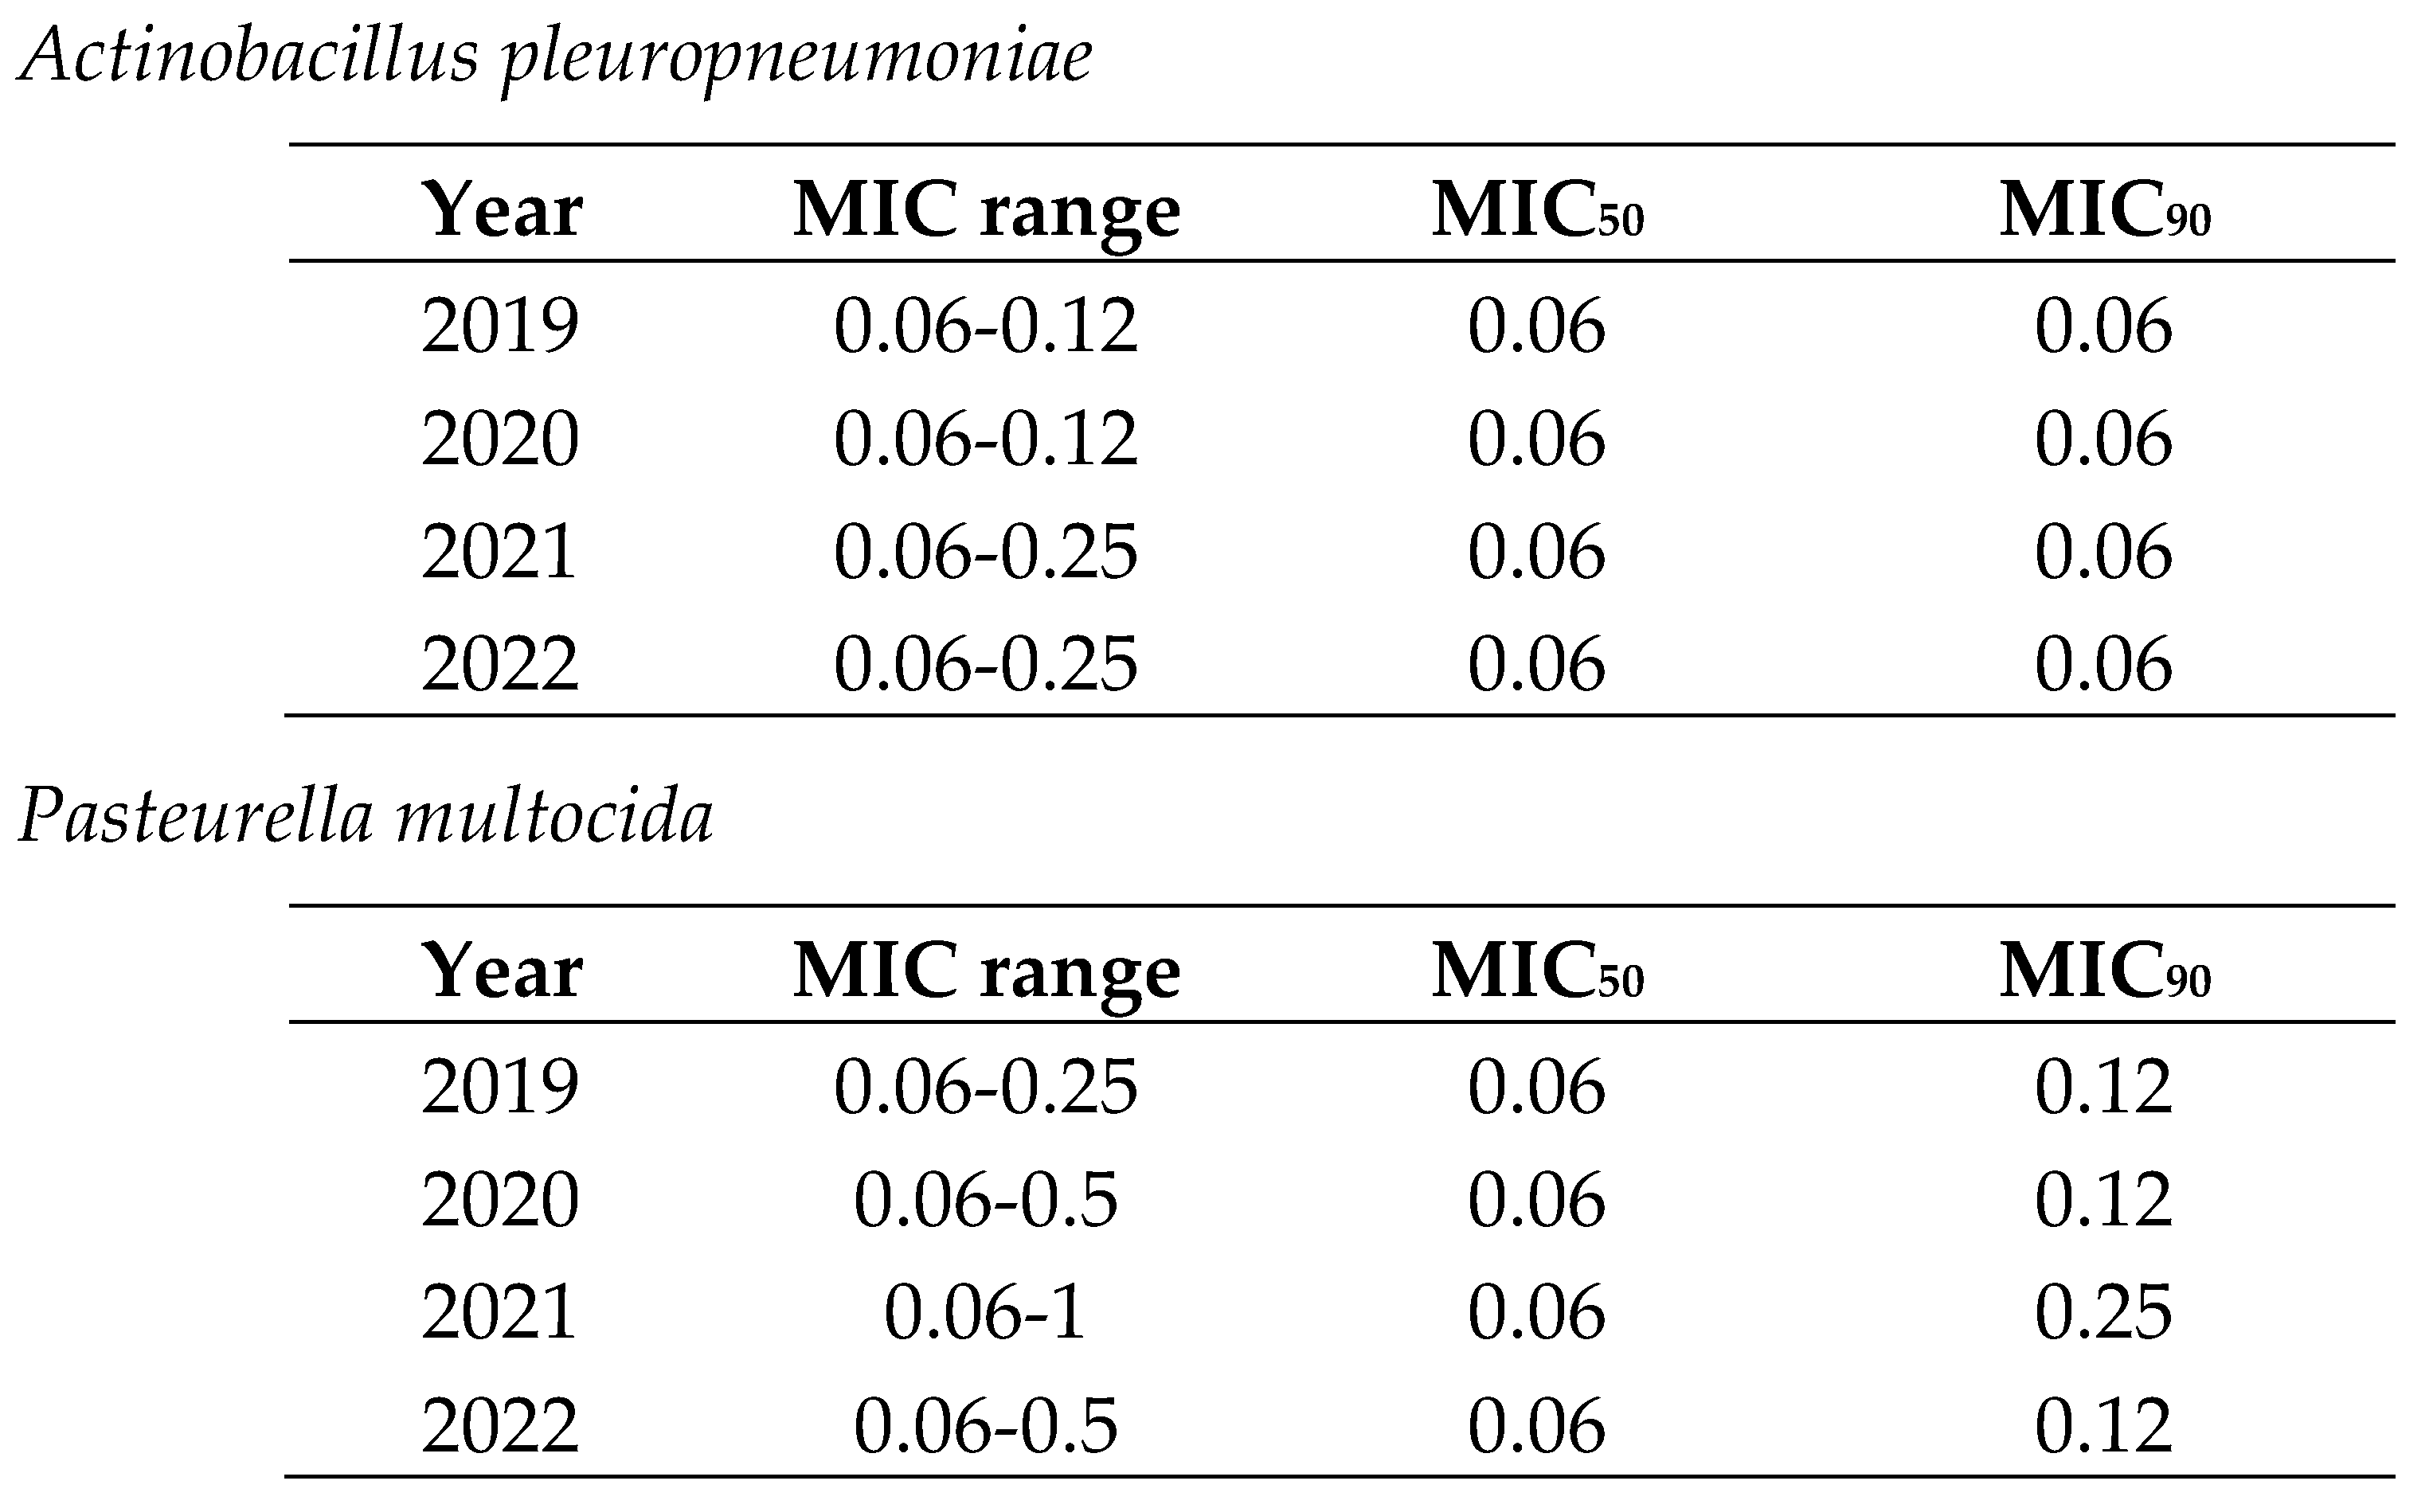
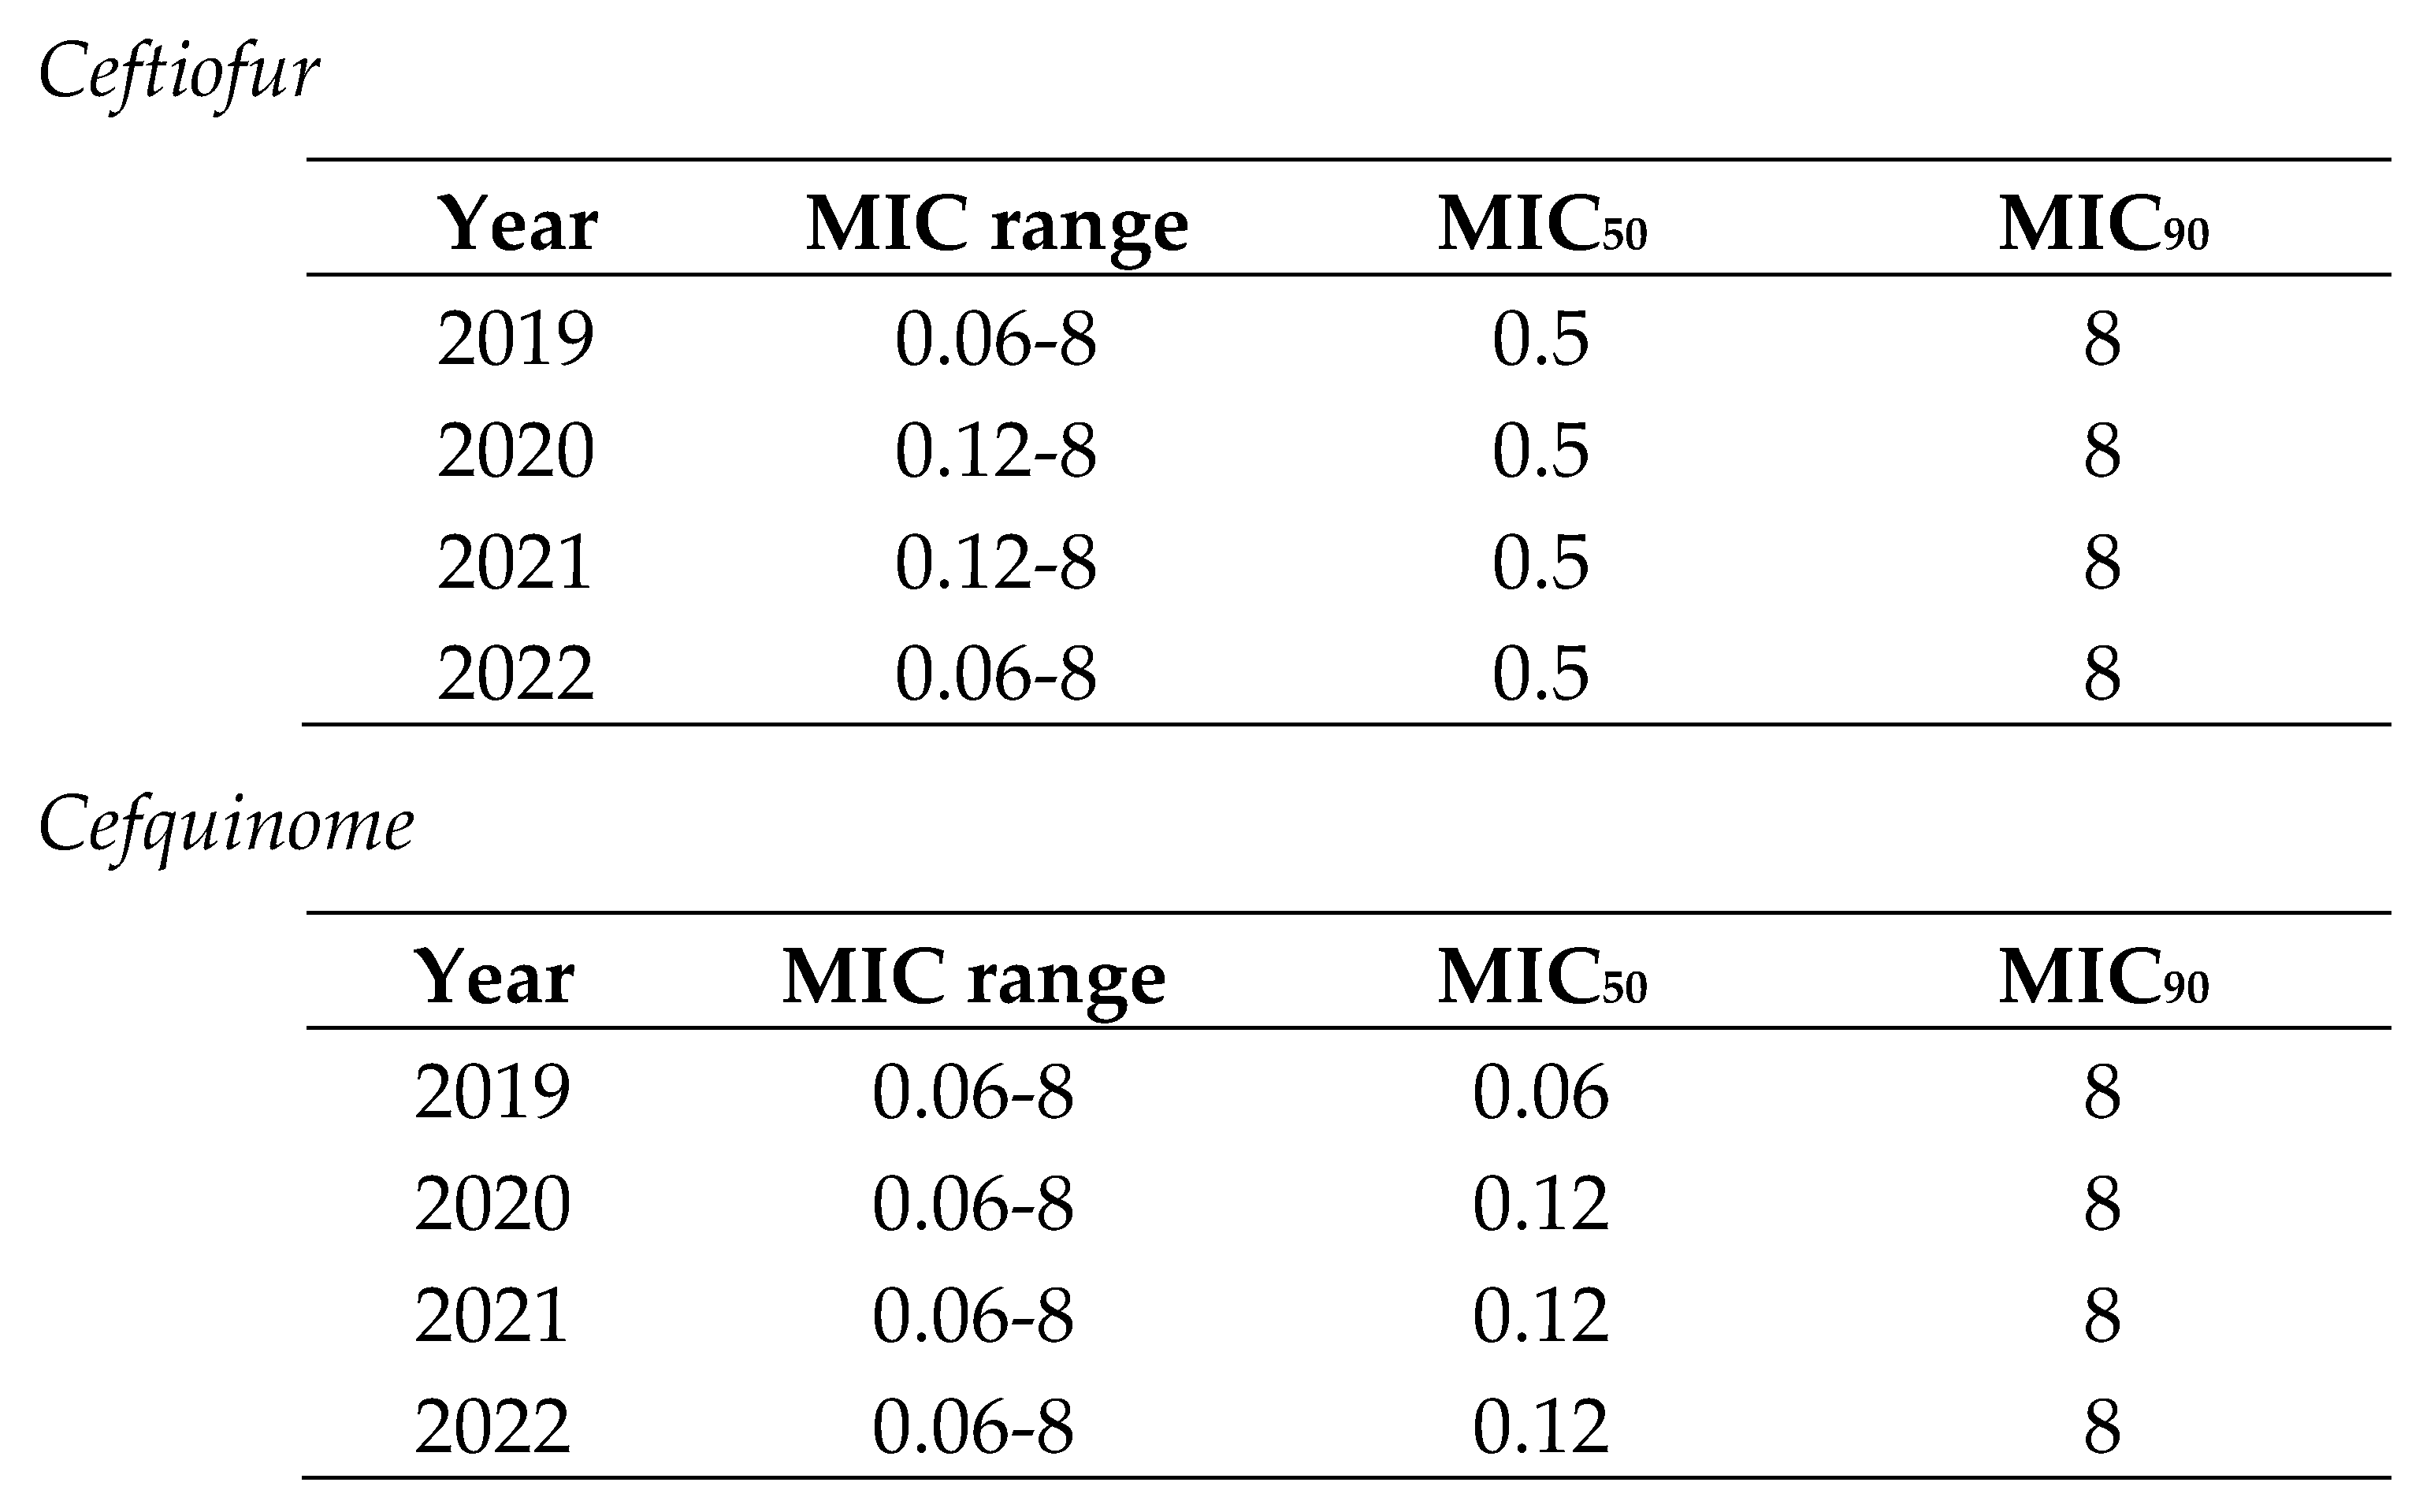
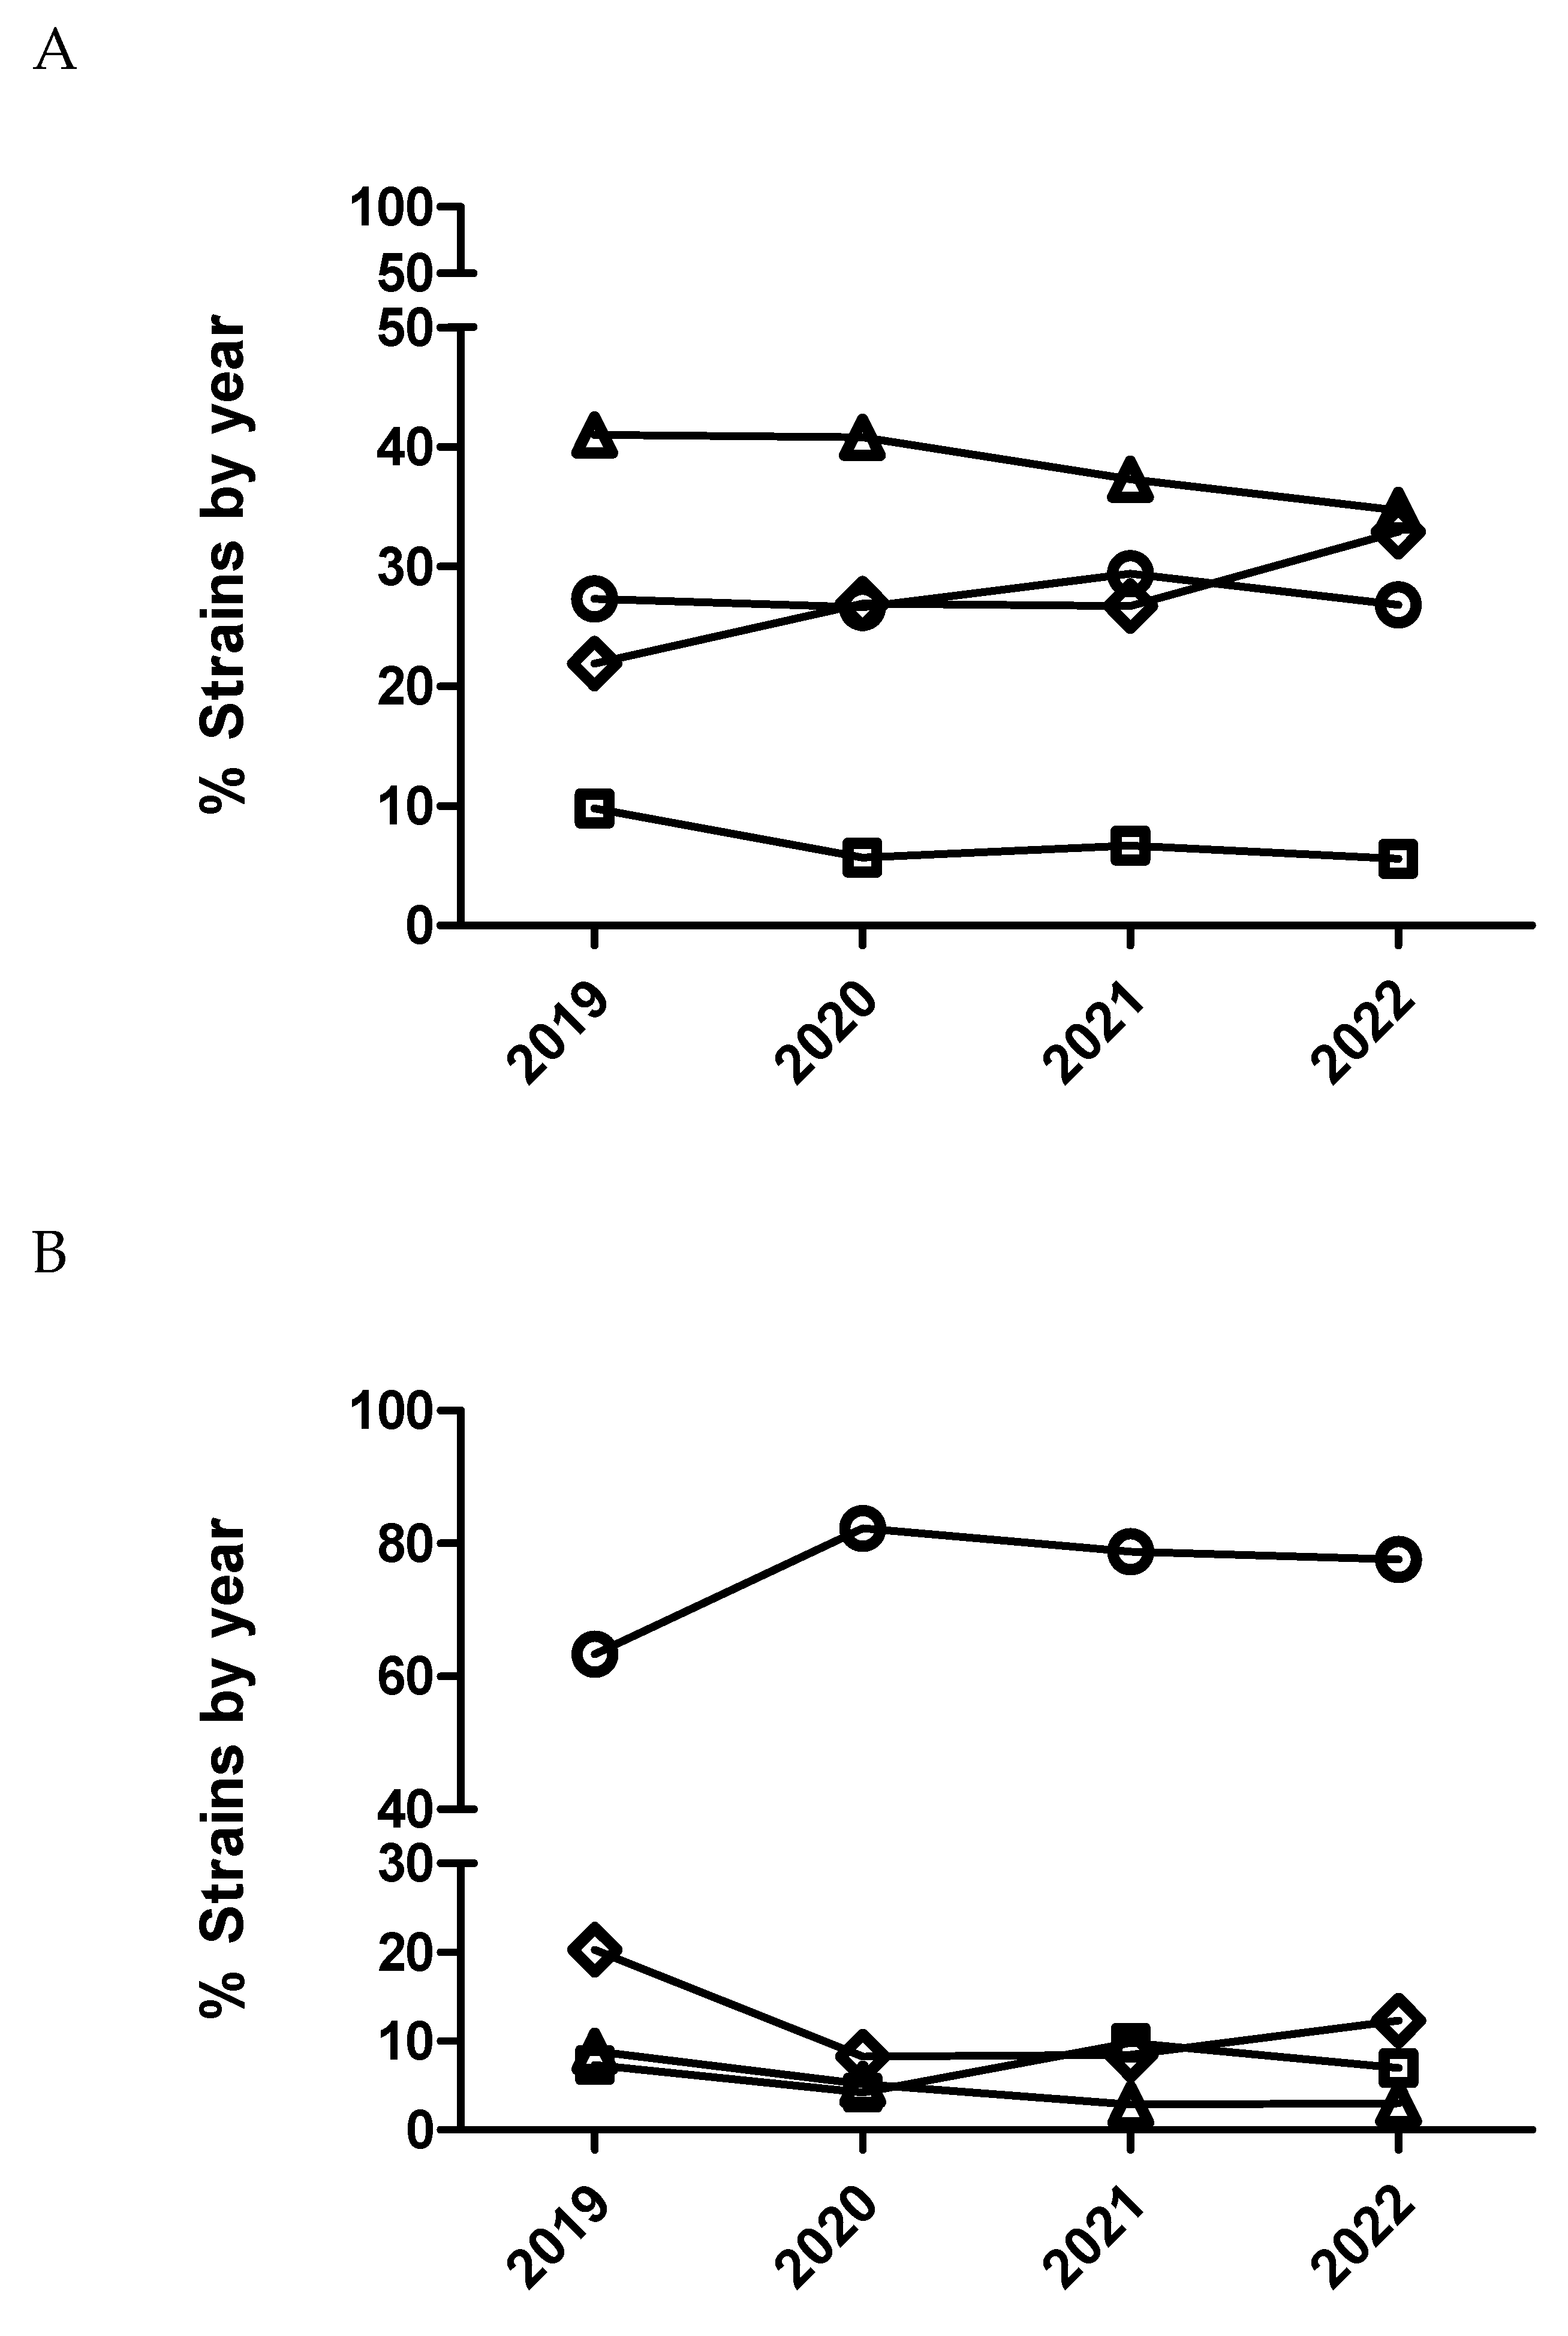
2.3. Logistic and multinominal model for quinolones
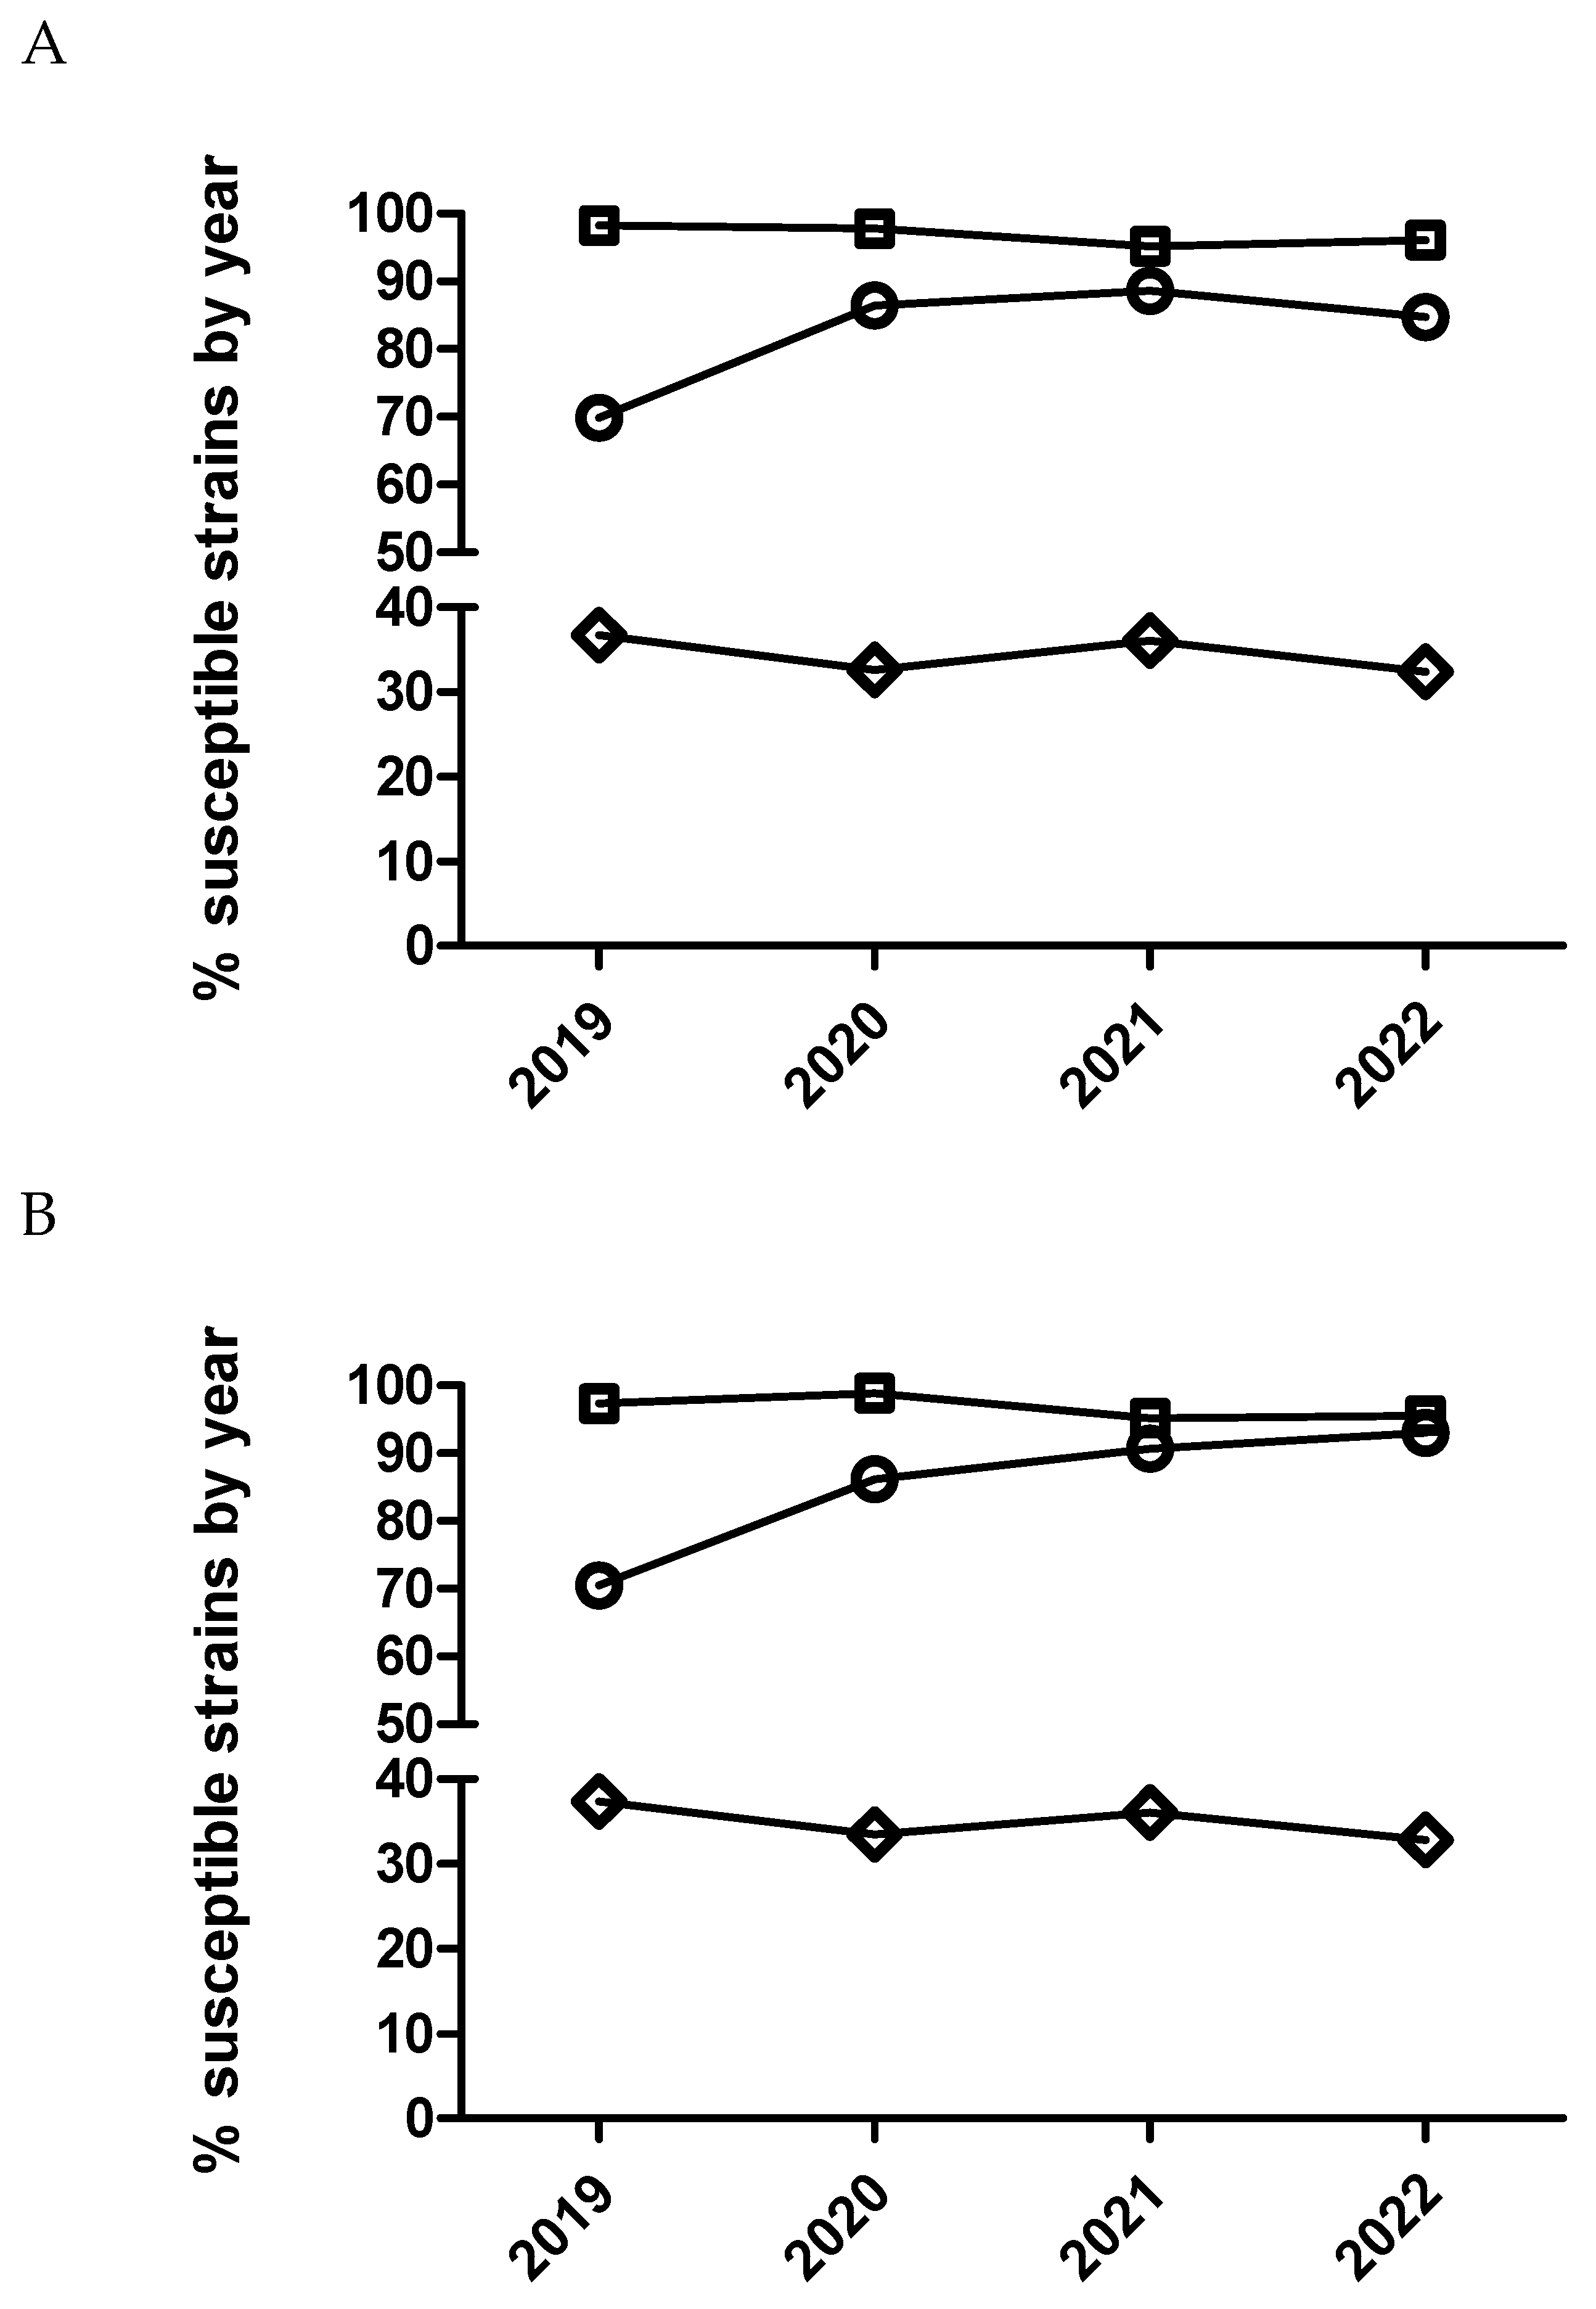
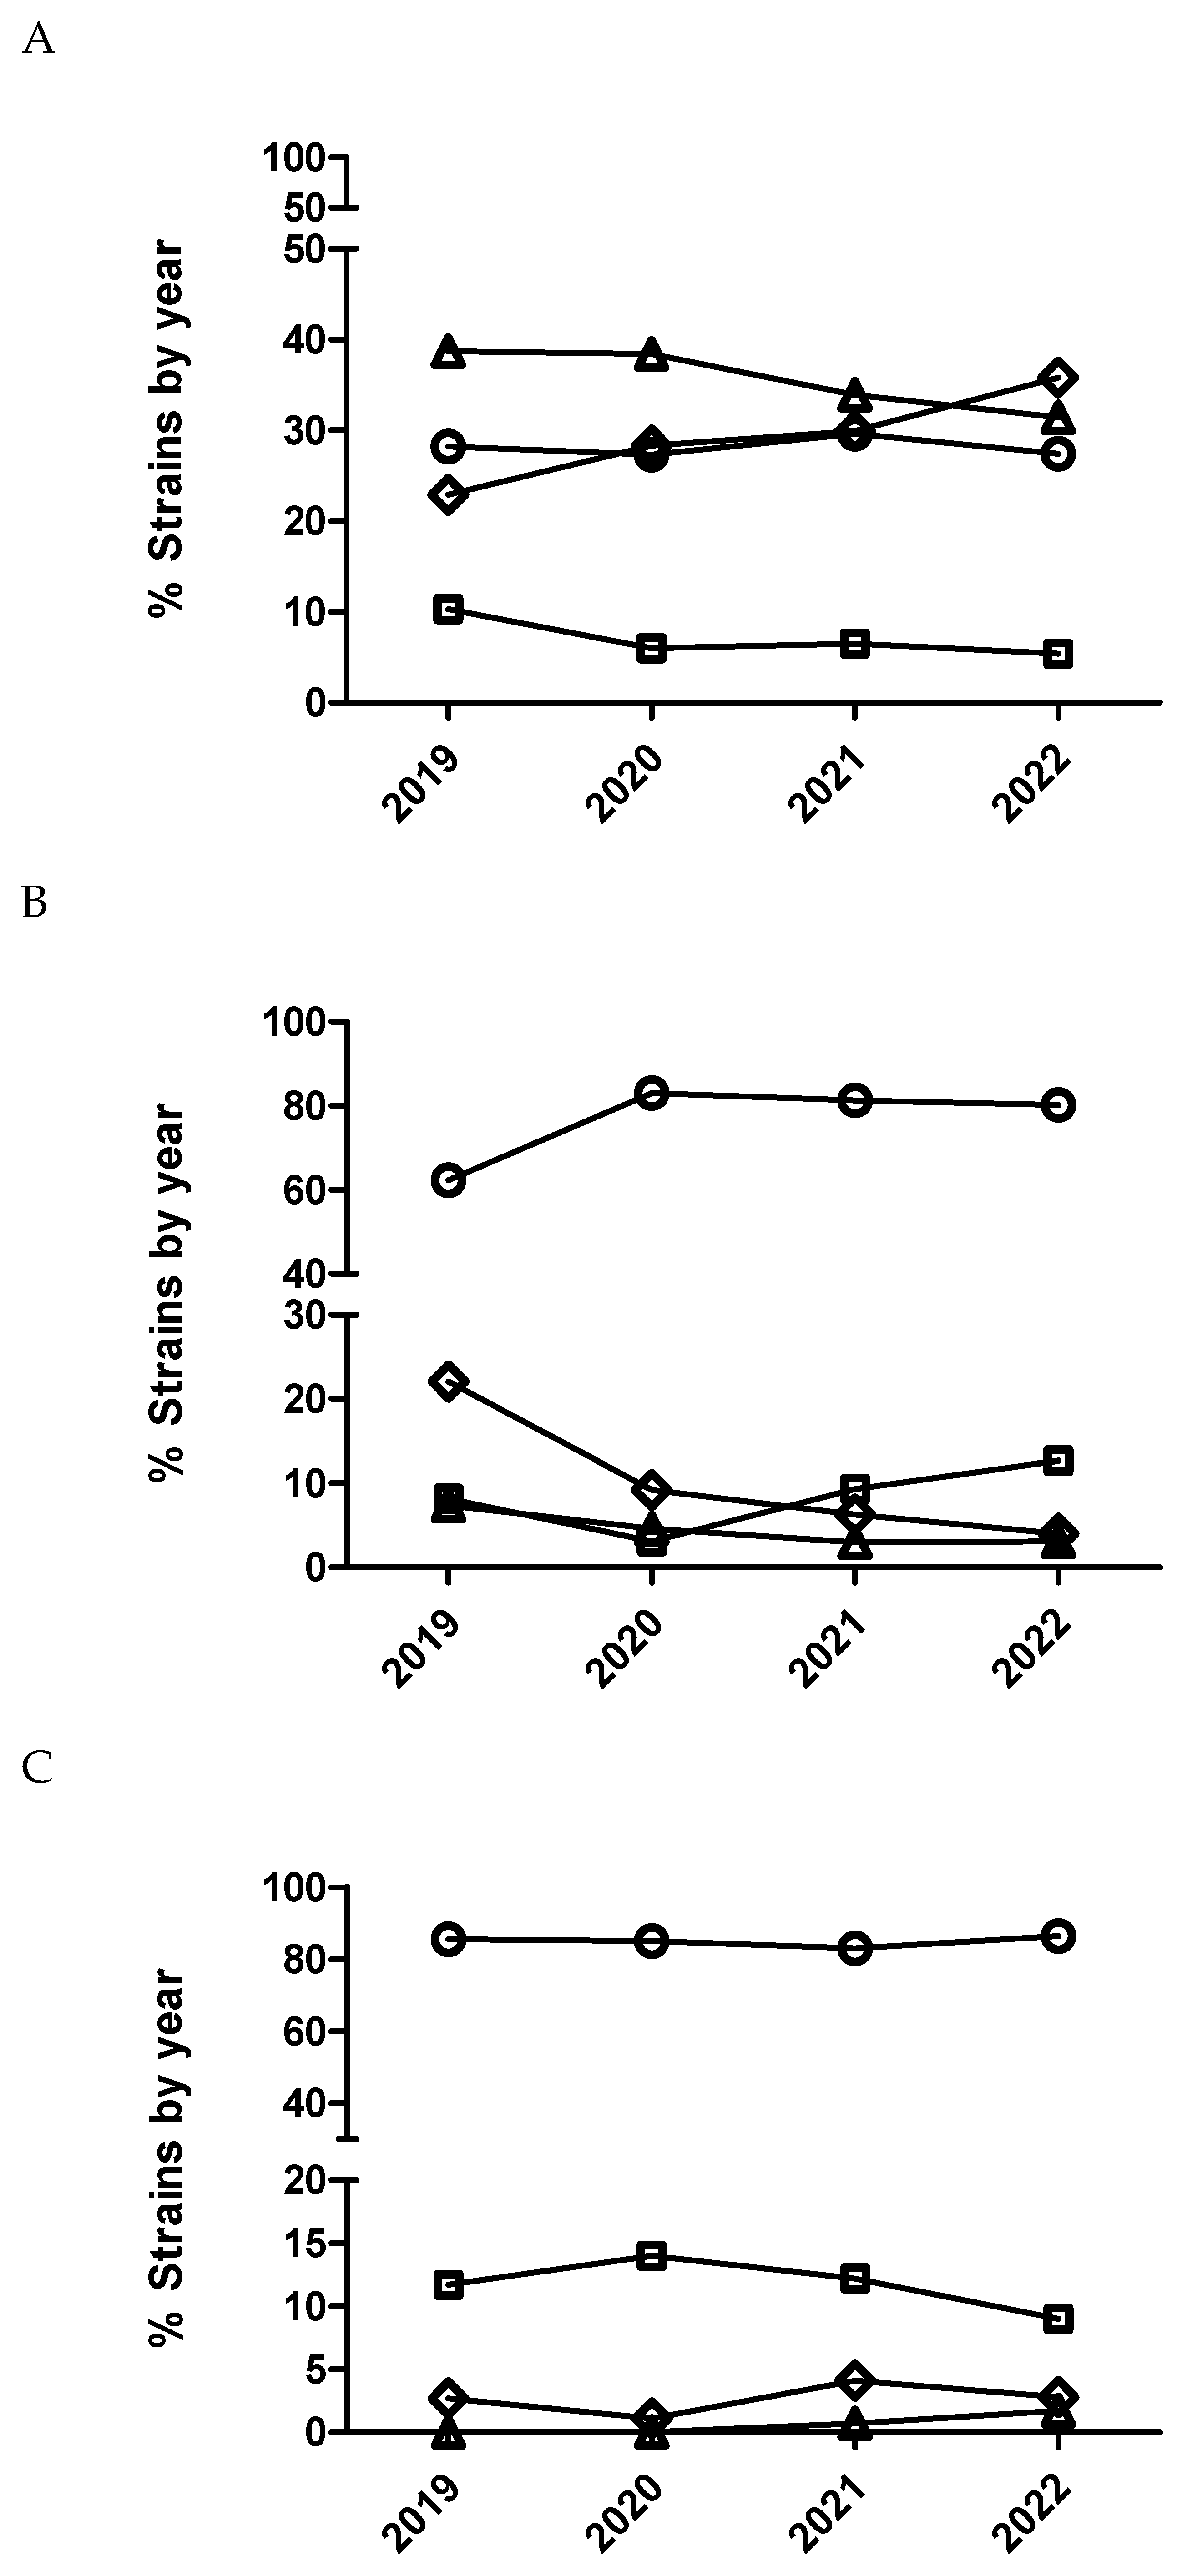
| Logistic analysis (susceptible/resistant) |
Multinominal analysis (MIC outcome categories being compared) | |||
|---|---|---|---|---|
| Predictor variable | NA | 1 vs 2 | 1 vs 3 | 1 vs 4 |
| Year | P<0.0001 | P<0.0001 | ||
| 20 vs 19 | 2.6 (1.5-4.6) | NS | 3.2 (2.1-4.8) | 2.2 (1.1-3.9) |
| 21 vs 20 | NS | 0.38 (0.18-0.69) | NS | NS |
| 22 vs 21 | NS | NS | NS | NS |
| Logistic analysis (susceptible/resistant) |
Multinominal analysis (MIC outcome categories being compared) | |||
|---|---|---|---|---|
| Predictor variable | NA | 1 vs 2 | 1 vs 3 | 1 vs 4 |
| Year | NS | P<0.0001 | ||
| 20 vs 19 | NS | 1.5 (1.2-1.9) | 0.8 (0.7-0.9) | NS |
| 21 vs 20 | NS | NS | NS | NS |
| 22 vs 21 | NS | NS | NS | NS |
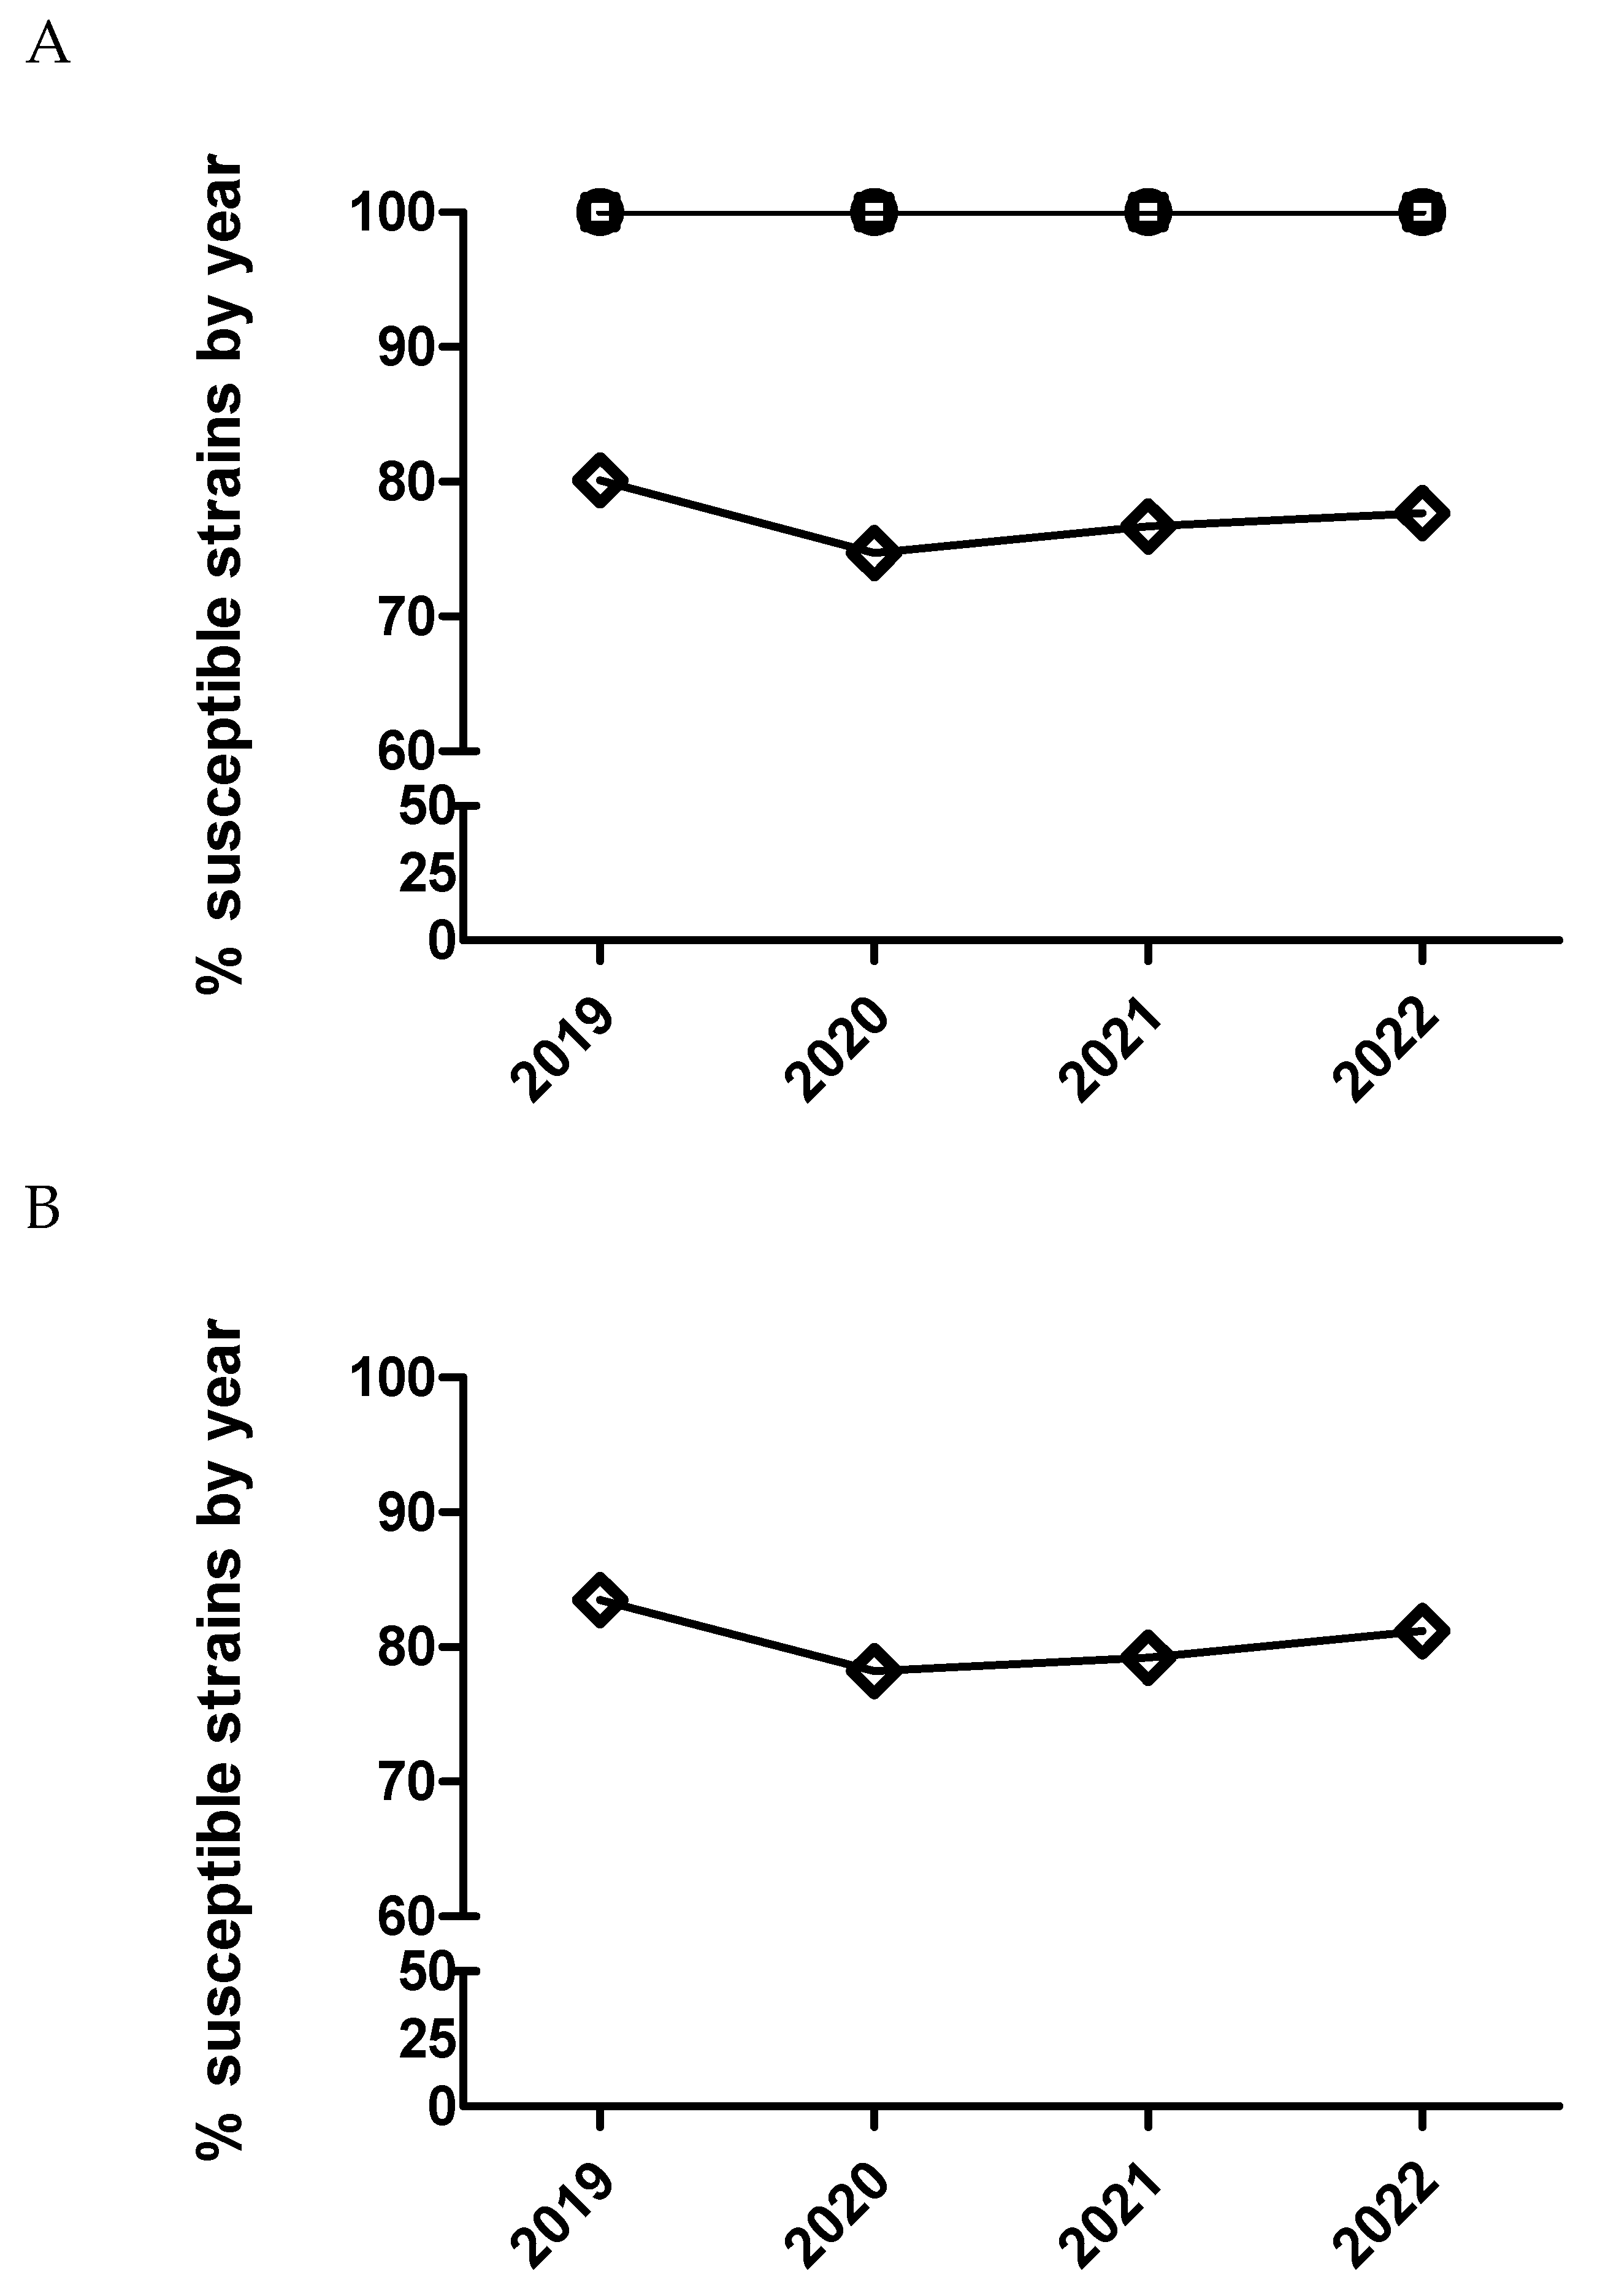
2.4. Logistic and multinominal model for 3rd and 4th cephalosporins
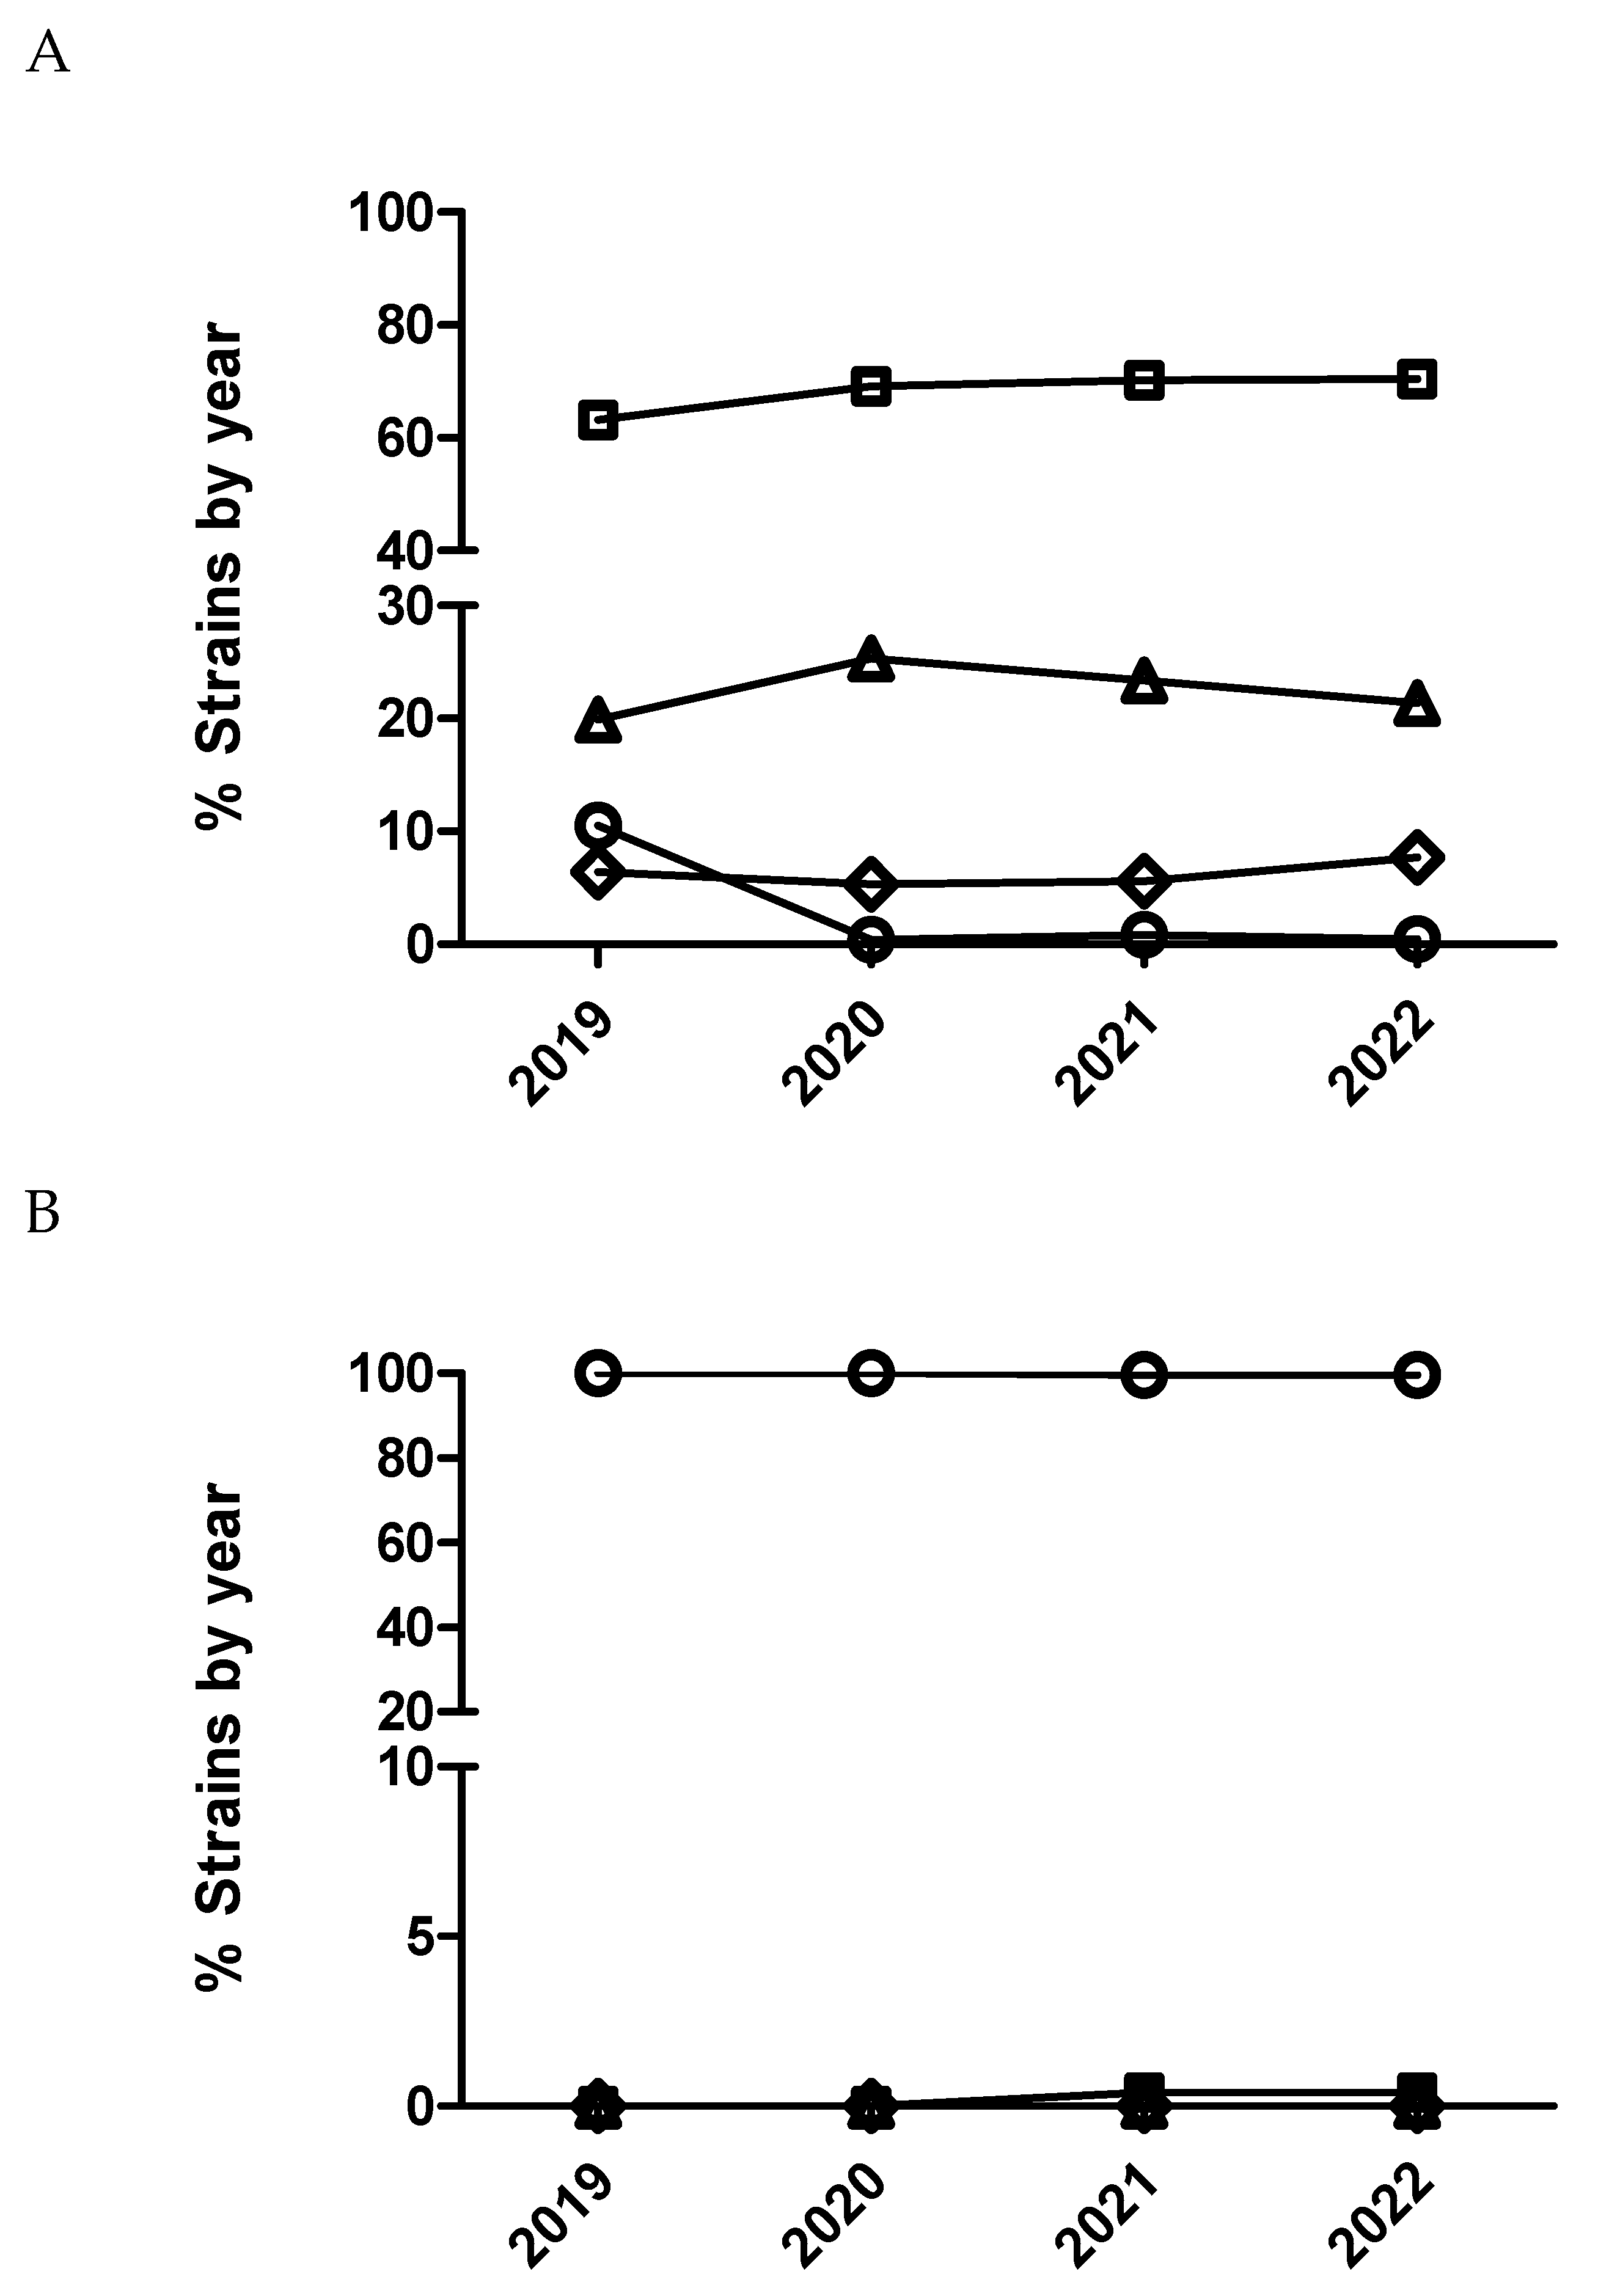
| Logistic analysis (susceptible/resistant) |
Multinominal analysis (MIC outcome categories being compared) | |||
|---|---|---|---|---|
| Predictor variable | NA | 1 vs 2 | 1 vs 3 | 1 vs 4 |
| Year | P=0.15 | P<0.0001 | ||
| 20 vs 19 | 0.73 (0.55-0.98) | 0.10 (0.06-0.16) | 0.11(0.06-0.19) | 0.10 (0.05-0.15) |
| 21 vs 20 | NS | NS | NS | 3.1 (1.2-12.4) |
| 22 vs 21 | NS | NS | NS | NS |
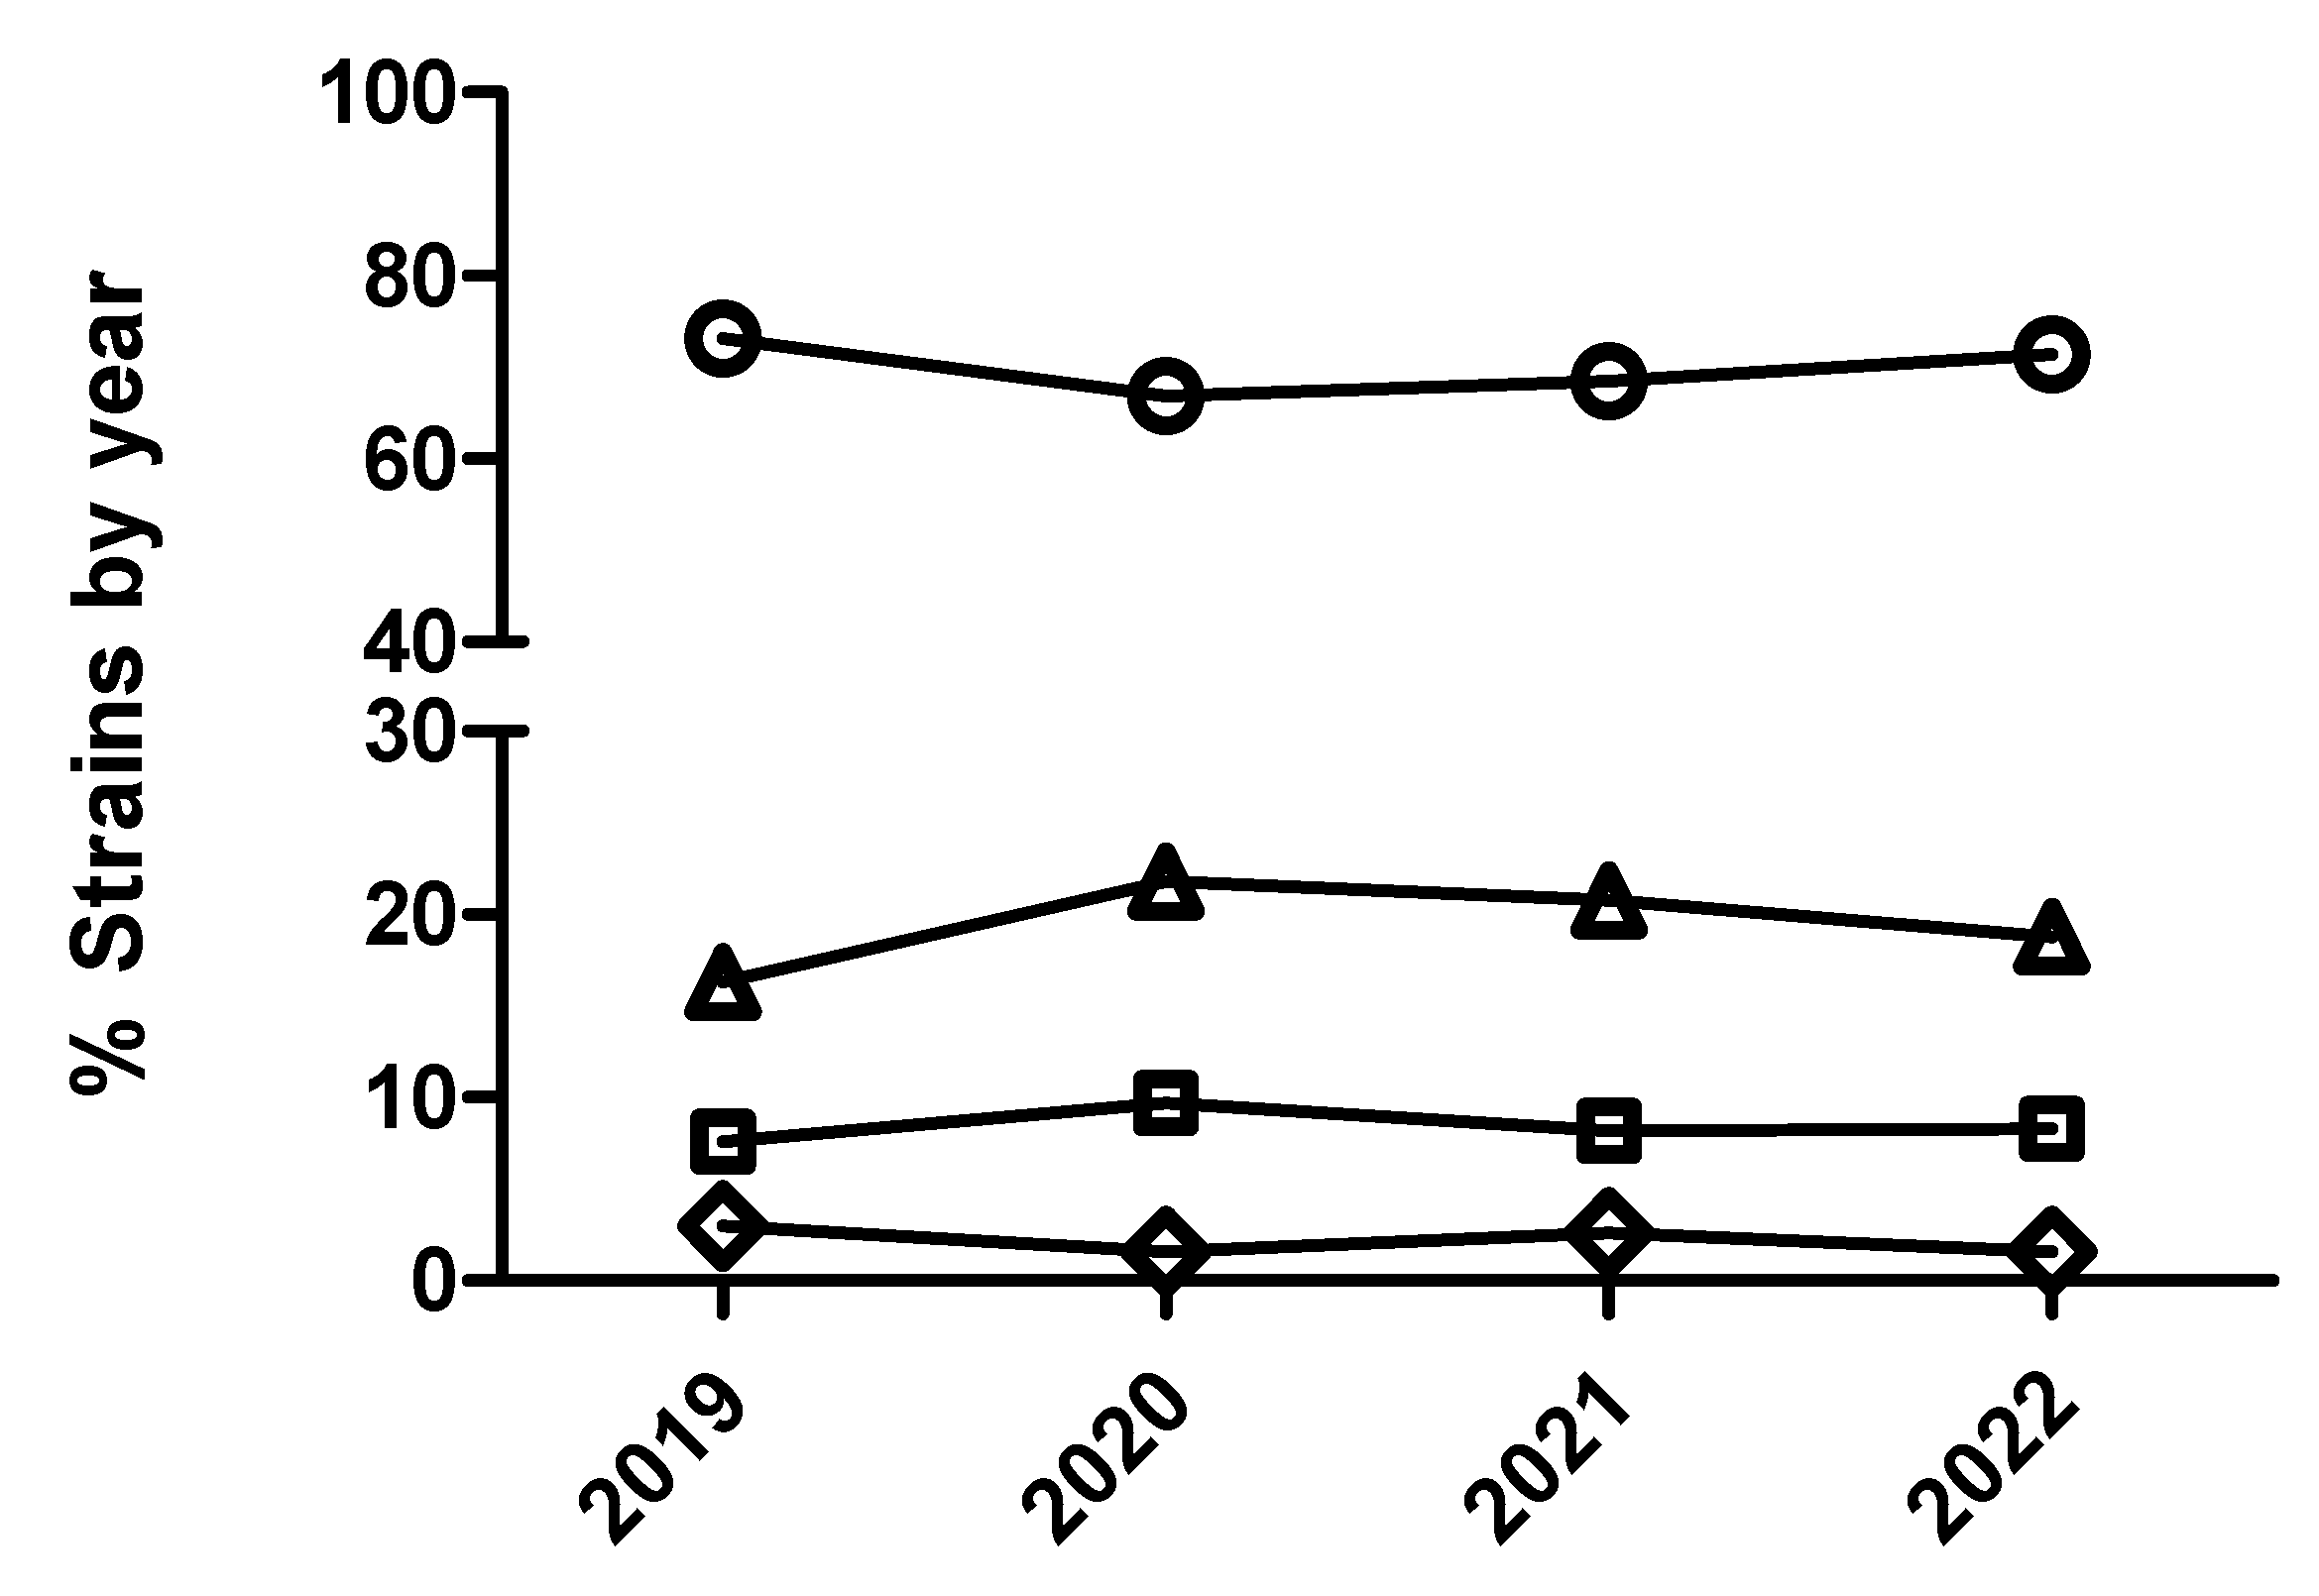
| Logistic analysis (susceptible/resistant) |
Multinominal analysis (MIC outcome categories being compared) | |||
|---|---|---|---|---|
| Predictor variable | NA | 1 vs 2 | 1 vs 3 | 1 vs 4 |
| Year | NS | p=0.0002 | ||
| 20 vs 19 | NS | 0.39 (0.13-0.88) | NS | NA |
| 21 vs 20 | NS | NS | NS | NA |
| 22 vs 21 | NS | 3.1 (1.8-5.3) | NS | NA |
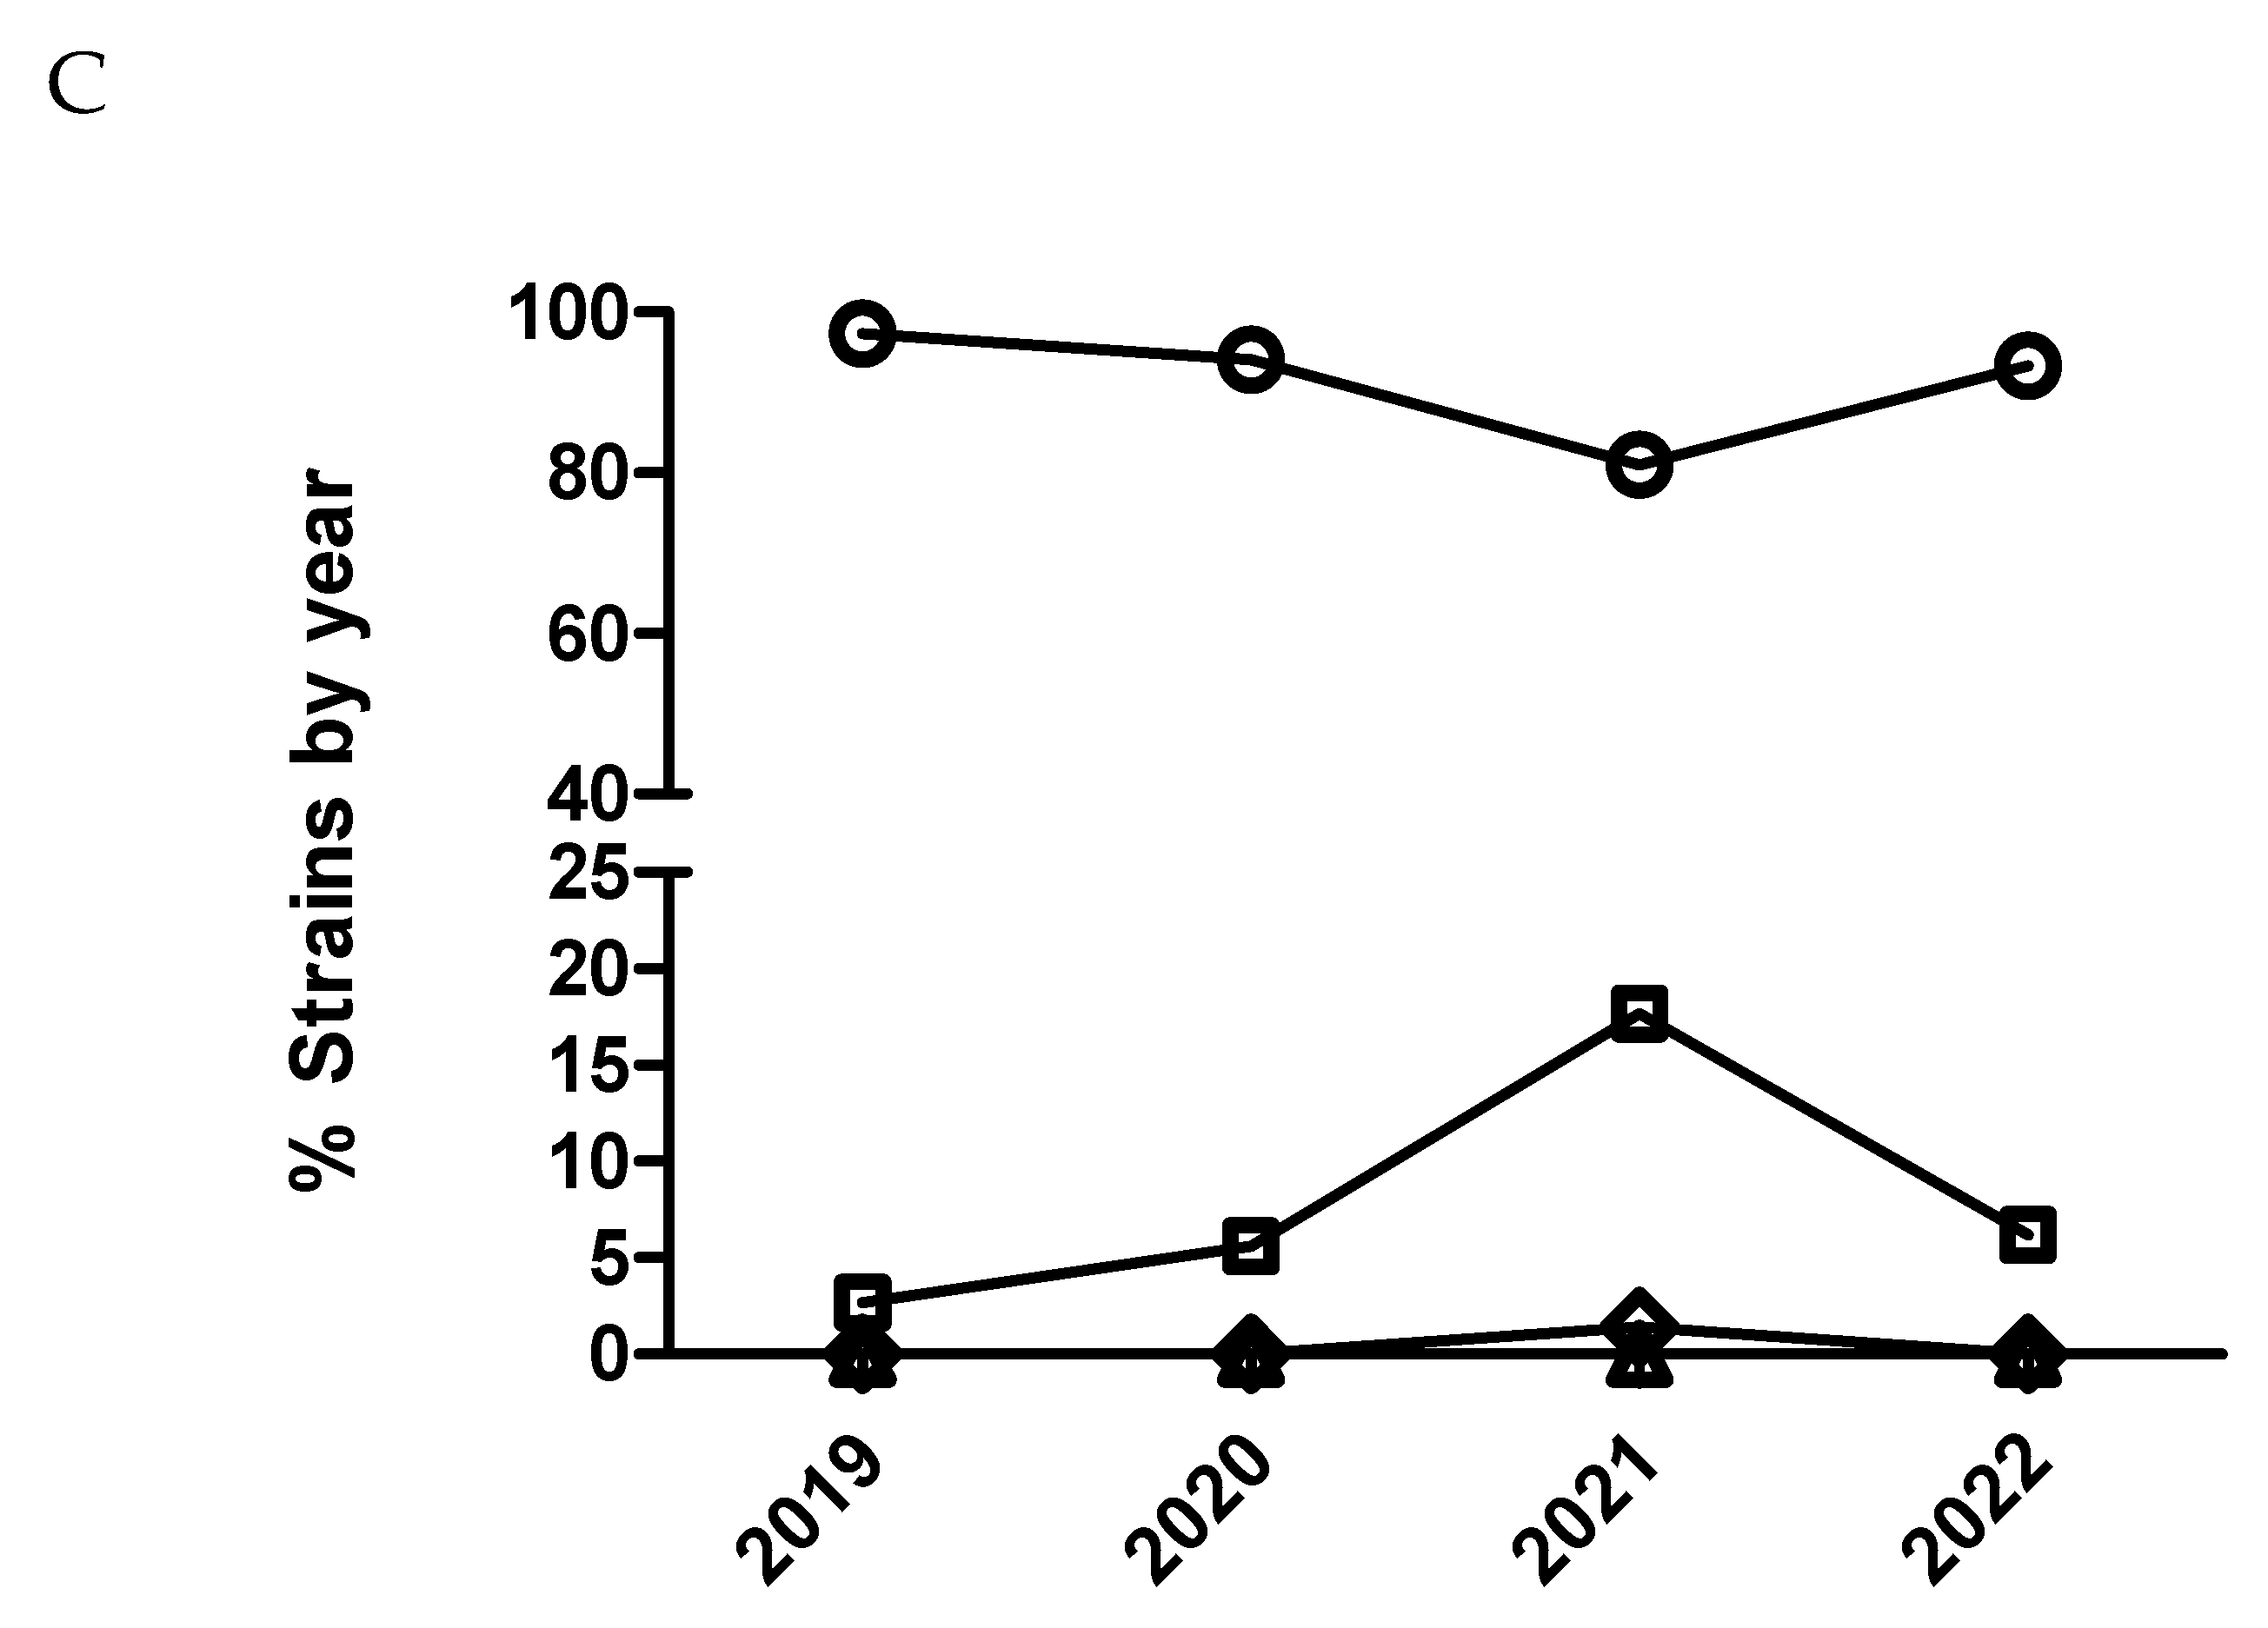
2.5. Logistic and multinominal model for polymyxins
3. Discussion
4. Materials and Methods
4.1. Clinical samples
4.2. Bacterial isolation and identification
4.3. Antimicrobial susceptibility testing
4.5. Statistical methods
Supplementary Materials
Author Contributions
Funding
Institutional Review Board Statement
Informed Consent Statement
Data Availability Statement
Acknowledgments
Conflicts of Interest
References
- Aarestrup, F.M.; Wegener, H.C.; Collignon, P. Resistance in bacteria of the food chain: epidemiology and control strategies. Expert Rev Anti Infect Ther 2008, 6, 733–750. [Google Scholar] [CrossRef] [PubMed]
- World Health Organization. 2015. Global action plan on antimicrobial resistance. World Health Organization. Available online: https://apps.who.int/iris/handle/10665/193736 (accessed on 1 September 2023).
- Guidelines for the Prudent Use of Antimicrobials in Veterinary Medicine. (2015/C299/04). 2015. Available online: https://ec.europa.eu/health/sites/health/files/antimicrobial_resistance/docs/2015_prudent_use_guidelines_en.pdf (accessed on 1 September 2023).
- Magnusson, U.; Sternberg, S.; Eklund, G.; Rozstalnyy, A. Prudent and efficient use of antimicrobials in pigs and poultry. FAO Animal Production and Health Manual. Available online: https://www.fao.org/3/ca6729en/CA6729EN.pdf (accessed on 1 September 2023).
- Holmes, A.H.; Moore, L.S.; Sundsfjord, A.; Steinbakk, M.; Regmi, S.; Karkey, A.; Guerin, P.J.; Piddoc, L.J. Understanding the mechanisms and drivers of antimicrobial resistance. Lancet 2016, 387, 176–187. [Google Scholar] [CrossRef] [PubMed]
- Scott, A.M.; Beller, E.; Glasziou, P.; Clark, J.; Ranakusuma, R.W.; Byambasuren, O.; Bakhit, M.; Page, S.W.; Trott, D.; Mar, C.D. Is antimicrobial administration to food animals a direct threat to human health? A rapid systematic review. Int J Antimicrob Agents 2018, 52, 316–323. [Google Scholar] [CrossRef] [PubMed]
- Lazarus, B.; Paterson, D.L.; Mollinger, J.L.; Rogers, B.A. Do human extraintestinal Escherichia coli infections resistant to expanded-spectrum cephalosporins originate from food-producing animals? A systematic review. Clin Infect Dis 2015, 60, 439–452. [Google Scholar] [CrossRef]
- Mughini-Gras, L.; Dorado-García, A.; van Duijkeren, E.; van den Bunt, G.; Dierikx, C.M.; Bonten, M.J.M.; Bootsma, M.C.J.; Schmitt, H.; Hald, T.; Evers, E.G.; et al. ESBL Attribution Consortium. Attributable sources of community-acquired carriage of Escherichia coli containing β-lactam antibiotic resistance genes: a population-based modelling study. Lancet Planet Health 2019, 3, e357–e369. [Google Scholar] [CrossRef] [PubMed]
- Martak, D.; Guther, J.; Verschuuren, T.D.; Valot, B.; Conzelmann, N.; Bunk, S.; Riccio, M.E.; Salamanca, E.; Meunier, A.; Henriot, C.P.; et al. Populations of extended-spectrum β-lactamase-producing Escherichia coli and Klebsiella pneumoniae are different in human-polluted environment and food items: a multicentre European study. Clin Microbiol Infect 2022, 28, e7–e447. [Google Scholar] [CrossRef]
- Regulation (EU). 2019/6 of the European Parliament and of the Council of 11 December 2018 on Veterinary Medicinal Products and Repealing Directive 2001/82/EC (Text with EEA Relevance). 2019. Available online: https://eur-lex.europa.eu/eli/reg/2019/6/oj (accessed on 1 September 2023).
- Rhouma, M.; Soufi, L.; Cenatus, S.; Archambault, M.; Butaye, P. Current Insights Regarding the Role of Farm Animals in the Spread of Antimicrobial Resistance from a One Health Perspective. Vet Sci 2022, 9, 480. [Google Scholar] [CrossRef]
- Xia, X.; Wang, Z.; Fu, Y.; Du, X.D.; Gao, B.; Zhou, Y.; He, J.; Wang, Y.; Shen, J.; Jiang, H.; et al. Association of colistin residues and manure treatment with the abundance of mcr-1 gene in swine feedlots. Environ Int 2019, 127, 361–370. [Google Scholar] [CrossRef]
- Wang, Y.; Xu, C.; Zhang, R.; Chen, Y.; Shen, Y.; Hu, F.; Liu, D.; Lu, J.; Guo, Y.; Xia, X.; et al. Changes in colistin resistance and mcr-1 abundance in Escherichia coli of animal and human origins following the ban of colistin-positive additives in China: an epidemiological comparative study. Lancet Infect Dis 2020, 20, 1161–1171. [Google Scholar] [CrossRef]
- Allel, K.; Day, L.; Hamilton, A.; Lin, L.; Furuya-Kanamori, L.; Moore, C.E.; Van Boeckel, T.; Laxminarayan, R.; Yakob, L. Global antimicrobial-resistance drivers: an ecological country-level study at the human-animal interface. Lancet Planet Health 2023, 7, e291–e303. [Google Scholar] [CrossRef]
- EMA AMEG 2019. Answer to the request from the European Commission for updating the scientific advice on the impact on public health and animal health of the use of antibiotics in animals—Categorization of antimicrobials. 2019. Available online: https://www.ema.europa.eu/en/documents/other/answer-request-european-commission-updating-scientific-advice-impact-public-health-animal-health-use_en.pdf (accessed on 1 September 2023).
- De Jong, A.; El Garch, F.; Hocquet, D.; Prenger-Berninghoff, E.; Dewulf, J.; Migura-Garcia, L.; Perrin-Guyomard, A.; Veldman, K.T.; Janosi, S.; Skarzynska, M.; et al. European-wide antimicrobial resistance monitoring in commensal Escherichia coli isolated from healthy food animals between 2004 and 2018. J Antimicrob Chemother. 2022, 7, dkac318. [Google Scholar] [CrossRef] [PubMed]
- Dir. Directive 2003/99/EC of The European parliament and of the council of 17 november 2003 on the monitoring of zoonoses and zoonotic agents, amending Council Decision 90/424/EEC and repealing Council Directive 92/117/EEC Official Journal of the European Communities, 325/31, 12.12.2003 (2003/99/EC, 2003).
- Dir. Directive 2020/1729/EC of The European parliament and of the council of 17 November 2020 on the monitoring and reporting of antimicrobial resistance in zoonotic and commensal bacteria and repealing Implementing Decision 2013/652/EU, 387/8, 19.11.2020 (2020/1729/EC). 17 November.
- Lagrange, J.; Amat, J.P.; Ballesteros, C.; Damborg, P.; Grönthal, T.; Haenni, M.; Jouy, E.; Kaspar, H.; Kenny, K.; Klein, B.; et al. Pilot testing the EARS-Vet surveillance network for antibiotic resistance in bacterial pathogens from animals in the EU/EEA. Front Microbiol. 2023, 14, 1188423. [Google Scholar] [CrossRef] [PubMed]
- Mader, R.; Damborg, P.; Amat, J.P.; Bengtsson, B.; Bourély, C.; Broens, E.M.; Busani, L.; Crespo-Robledo, P.; Filippitzi, M.E.; Fitzgerald, W.; et al. EU-JAMRAI. Building the European Antimicrobial Resistance Sur-veillance network in veterinary medicine (EARS-Vet). Euro Surveill. 2021, 26, 2001359. [Google Scholar] [CrossRef]
- Nielsen, S.S.; Bicout, D.J.; Calistri, P.; Canali, E.; Drewe, J.A.; Garin-Bastuji, B.; Gonzales Rojas, J.L.; Gortazar Schmidt, C.; Herskin, M.; et al.; EFSA Panel on Animal Health and Welfare (AHAW) Ad hoc method for the assessment of animal diseases caused by bacteria resistant to antimicrobials. EFSA J. 2021, 19, e06645. [Google Scholar] [PubMed]
- Nielsen, S.S.; Bicout, D.J.; Calistri, P.; Canali, E.; Drewe, J.A.; Garin-Bastuji, B.; Gonzales Rojas, J.L.; Gortazar Schmidt, C.; Herskin, M.; Michel, V.; et al.; EFSA Panel on Animal Health and Welfare (AHAW) Assessment of animal diseases caused by bacteria resistant to antimicrobials: Swine. EFSA J. 2021, 9, e07113. [Google Scholar]
- Holmer, I.; Salomonsen, C.M.; Jorsal, S.E.; Astrup, L.B.; Jensen, V.F.; Høg, B.B.; Pedersen, K. Antibiotic resistance in porcine pathogenic bacteria and relation to antibiotic usage. BMC Vet Res. 2019, 15, 449. [Google Scholar] [CrossRef] [PubMed]
- Gebhardt, J.T.; Tokach, M.D.; Dritz, S.S.; DeRouchey, J.M.; Woodworth, J.C.; Goodband, R.D.; Henry, S.C. Postweaning mortality in commercial swine production II: Review of infectious contributing factors. Transl. Anim. Sci. 2020, 4, txaa052. [Google Scholar] [CrossRef]
- Laird, T.J.; Abraham, S.; Jordan, D.; Pluske, J.R.; Hampson, D.J.; Trott, D.J.; O’Dea, M. Porcine enterotoxigenic Escherichia coli: Antimicrobial resistance and development of microbial-based alternative control strategies. Vet. Microbiol. 2012, 258, 109117. [Google Scholar] [CrossRef]
- Saade, G.; Deblanc, C.; Bougon, J.; Marois-Créhan, C.; Fablet, C.; Auray, G.; Belloc, C.; Leblanc-Maridor, M.; Gagnon, C.A.; et al. Coinfections and their molecular consequences in the porcine respiratory tract. Vet. Res. 2020, 51, 80. [Google Scholar] [CrossRef]
- Fairbrother, J.M.; Nadeau, E.; Gyles, C.L. Escherichia coli in postweaning diarrhea in pigs: an update on bacterial types, pathogenesis, and prevention strategies. Anim Health Res Rev. 2005, 6, 17–39. [Google Scholar] [CrossRef]
- Rhouma, M.; Fairbrother, J.M.; Beaudry, F.; Letellier, A. Post weaning diarrhea in pigs: risk factors and non-colistin-based control strategies. Acta Vet Scand. 2017, 59, 31. [Google Scholar] [CrossRef] [PubMed]
- Luppi, A. Swine enteric colibacillosis: diagnosis, therapy, and antimicrobial resistance. Porcine Health Manag. 2017, 3, 16. [Google Scholar] [CrossRef] [PubMed]
- Vilaró, A.; Novell, E.; Enrique-Tarancón, V.; Baliellas, J.; Vilalta, C.; Martinez, S.; Fraile, L. Antimicrobial Susceptibility Pattern of Porcine Respiratory Bacteria in Spain. Antibiotics 2020, 9, 402. [Google Scholar] [CrossRef] [PubMed]
- Vilaró, A.; Novell, E.; Enrique-Tarancon, V.; Baliellas, J.; Migura-García, L.; Fraile, L. Antimicrobial Susceptibility Testing of Porcine Bacterial Pathogens: Investigating the Prospect of Testing a Representative Drug for Each Antimicrobial Family. Antibiotics 2022, 11, 638. [Google Scholar] [CrossRef] [PubMed]
- Vilaró, A.; Novell, E.; Enrique-Tarancón, V.; Baliellas, J.; Allué, E.; Fraile, L. Antimicrobial Stewardship for Respiratory Pathogens in Swine. Antibiotics 2020, 9, 727. [Google Scholar] [CrossRef]
- European Medicines Agency (EMA). ESVAC Sales of Veterinary Antimicrobial Agents in 31 European Countries in 2021; EMA: Amsterdam, The Netherlands, 2021. [Google Scholar]
- World Health Organization (2021) Comprehensive Review of the WHO Global Action Plan on Antimicrobial Resistance. Available online: https://www.who.int/publications/m/item/comprehensive-review-of-the-who-global-action-plan-on-antimicrobial-resistance (accessed on 1 September 2023).
- Mader, R.; Damborg, P.; Amat, J.P.; Bengtsson, B.; Bourély, C.; Broens, E.M.; Busani, L.; Crespo-Robledo, P.; Filippitzi, M.E.; Fitzgerald, W.; et al. EU-JAMRAI. Building the European Antimicrobial Resistance Sur-veillance network in veterinary medicine (EARS-Vet). Euro Surveill. 2021, 26, 2001359. [Google Scholar] [CrossRef]
- Aerts, M.; Faes, C.; Nysen, R. EFSA Scientific report: development of statistical methods for the evaluation of data on antimicrobial resistance in bacterial isolates from animals and food. EFSA J. 2011, 8, 1–77. [Google Scholar] [CrossRef]
- Otto, S.J.G. Antimicrobial resistance of human Campylobacter jejuni infections from Saskatchewan. Population medicine. Doctoral thesis. University of Guelph. 2011. Pp 1-259.
- Bjork, K.E.; Kopral, C.A.; Wagner, B.A.; Dargatz, D.A. Comparison of mixed effects models of antimicrobial resistance metrics of livestock and poultry Salmonella isolates from a national monitoring system. Prev Vet Med. 2015, 122, 265–272. [Google Scholar] [CrossRef]
- Hanon, J.B.; Jaspers, S.; Butaye, P.; Wattiau, P.; Méroc, E.; Aerts, M.; Imberechts, H.; Vermeersch, K.; Van der Stede, Y. A trend analysis of antimicrobial resistance in commensal Escherichia coli from several livestock species in Belgium (2011-2014). Prev Vet Med. 2015, 122, 443–452. [Google Scholar] [CrossRef]
- Zawack, K.; Li, M.; Booth, J.G.; Love, W.; Lanzas, C.; Gröhn, Y.T. Monitoring Antimicrobial Resistance in the Food Supply Chain and Its Implications for FDA Policy Initiatives. Antimicrob Agents Chemother. 2016, 60, 5302–5311. [Google Scholar] [CrossRef]
- Lagrange, J.; Amat, J.P.; Ballesteros, C.; Damborg, P.; Grönthal, T.; Haenni, M.; Jouy, E.; Kaspar, H.; Kenny, K.; Klein, B.; et al. Pilot testing the EARS-Vet surveillance network for antibiotic resistance in bacterial pathogens from animals in the EU/EEA. Front Microbiol. 2023, 14, 1188423. [Google Scholar] [CrossRef] [PubMed]
- Mader, R.; Muñoz Madero, C.; Aasmäe, B.; Bourély, C.; Broens, E.M.; Busani, L.; Callens, B.; Collineau, L.; Crespo-Robledo, P.; Damborg, P.; et al. Review and Analysis of National Monitoring Systems for Antimicrobial Resistance in Animal Bacterial Pathogens in Europe: A Basis for the Development of the European Antimicrobial Resistance Surveillance Network in Veterinary Medicine (EARS-Vet). Front Microbiol. 2022, 13, 838490. [Google Scholar] [CrossRef] [PubMed]
- CLSI. Performance Standards for Antimicrobial Disk and Dilution Susceptibility Tests for Bacteria Isolated from Animals. 5th ed. CLSI standard VET01. Wayne, PA: Clinical laboratory institute; 2018.
- Clinical and Laboratory Standards Institute (CLSI) Performance Standards for Antimicrobial Disk and Dilution Susceptibility Tests for Bacteria Isolated from Animals. 5th ed. Clinical and Laboratory Standards Institute (CLSI); Wayne, PA, USA: 2021. VET01S.
- EUCAST. Breakpoint tables for interpretation of MICs and zone diameters, version 9.0. 2019.
- Cavaco, L.M.; Frimodt-Møller, N.; Hasman, H.; Guardabassi, L.; Nielsen, L.; Aarestrup, F.M. Prevalence of quinolone resistance mechanisms and associations to minimum inhibitory concentrations in quinolone-resistant Escherichia coli isolated from humans and swine in Denmark. Microb Drug Resist. 2008, 14, 163–169. [Google Scholar] [CrossRef] [PubMed]
- Stegeman, J.A.; Vernooij, J.C.; Khalifa, O.A.; Van den Broek, J.; Mevius, D.J. Establishing the change in antibiotic resistance of Enterococcus faecium strains isolated from Dutch broilers by logistic regression and survival analysis. Prev Vet Med. 2006, 74, 56–66. [Google Scholar] [CrossRef]
- MacKinnon, M.C.; Pearl, D.L.; Carson, C.A.; Parmley, E.J.; McEwen, S.A. A comparison of modelling options to assess annual variation in susceptibility of generic Escherichia coli isolates to ceftiofur, ampicillin and nalidixic acid from retail chicken meat in Canada. Prev Vet Med. 2018, 160, 123–135. [Google Scholar] [CrossRef] [PubMed]
- Teale, C.; Borriello, P. A proposed scheme for the monitoring of antibiotic resistance in veterinary pathogens of food animals in the UK. Vet Rec 2021, 189, e201. [Google Scholar] [CrossRef]
- Aarestrup, F.M.; Hasman, H.; Veldman, K.; Mevius, D. Evaluation of eight different cephalosporins for detection of cephalosporin resistance in Salmonella enterica and Escherichia coli. Microb Drug Resist. 2010, 16, 253–256. [Google Scholar] [CrossRef]
- Durão, P.; Balbontín, R.; Gordo, I. Evolutionary Mechanisms Shaping the Maintenance of Antibiotic Resistance. Trends Microbiol. 2018, 26, 677–691. [Google Scholar] [CrossRef]
- Dohoo, I.; Martin, W.; Stryhn, H. 2014. Veterinary Epidemiology research. VER Inc., Charlottetown, Prince Eduward Island.
| Pathogen | 2019 | 2020 | 2021 | 2022 |
|---|---|---|---|---|
| APP | 123 | 195 | 237 | 228 |
| P. multocida | 111 | 100 | 147 | 178 |
| B. bronchiseptica | 24 | 21 | 44 | 53 |
| E. coli | 563 | 512 | 735 | 1,082 |
| Salmonella spp | 18 | 28 | 34 | 52 |
| Year | MIC range | MIC50 | MIC90 |
|---|---|---|---|
| 2019 | 0.5-32 | 1 | 1 |
| 2020 | 0.5-16 | 0.5 | 1 |
| 2021 | 0.5-16 | 0.5 | 0.5 |
| 2022 | 0.5-16 | 0.5 | 0.5 |
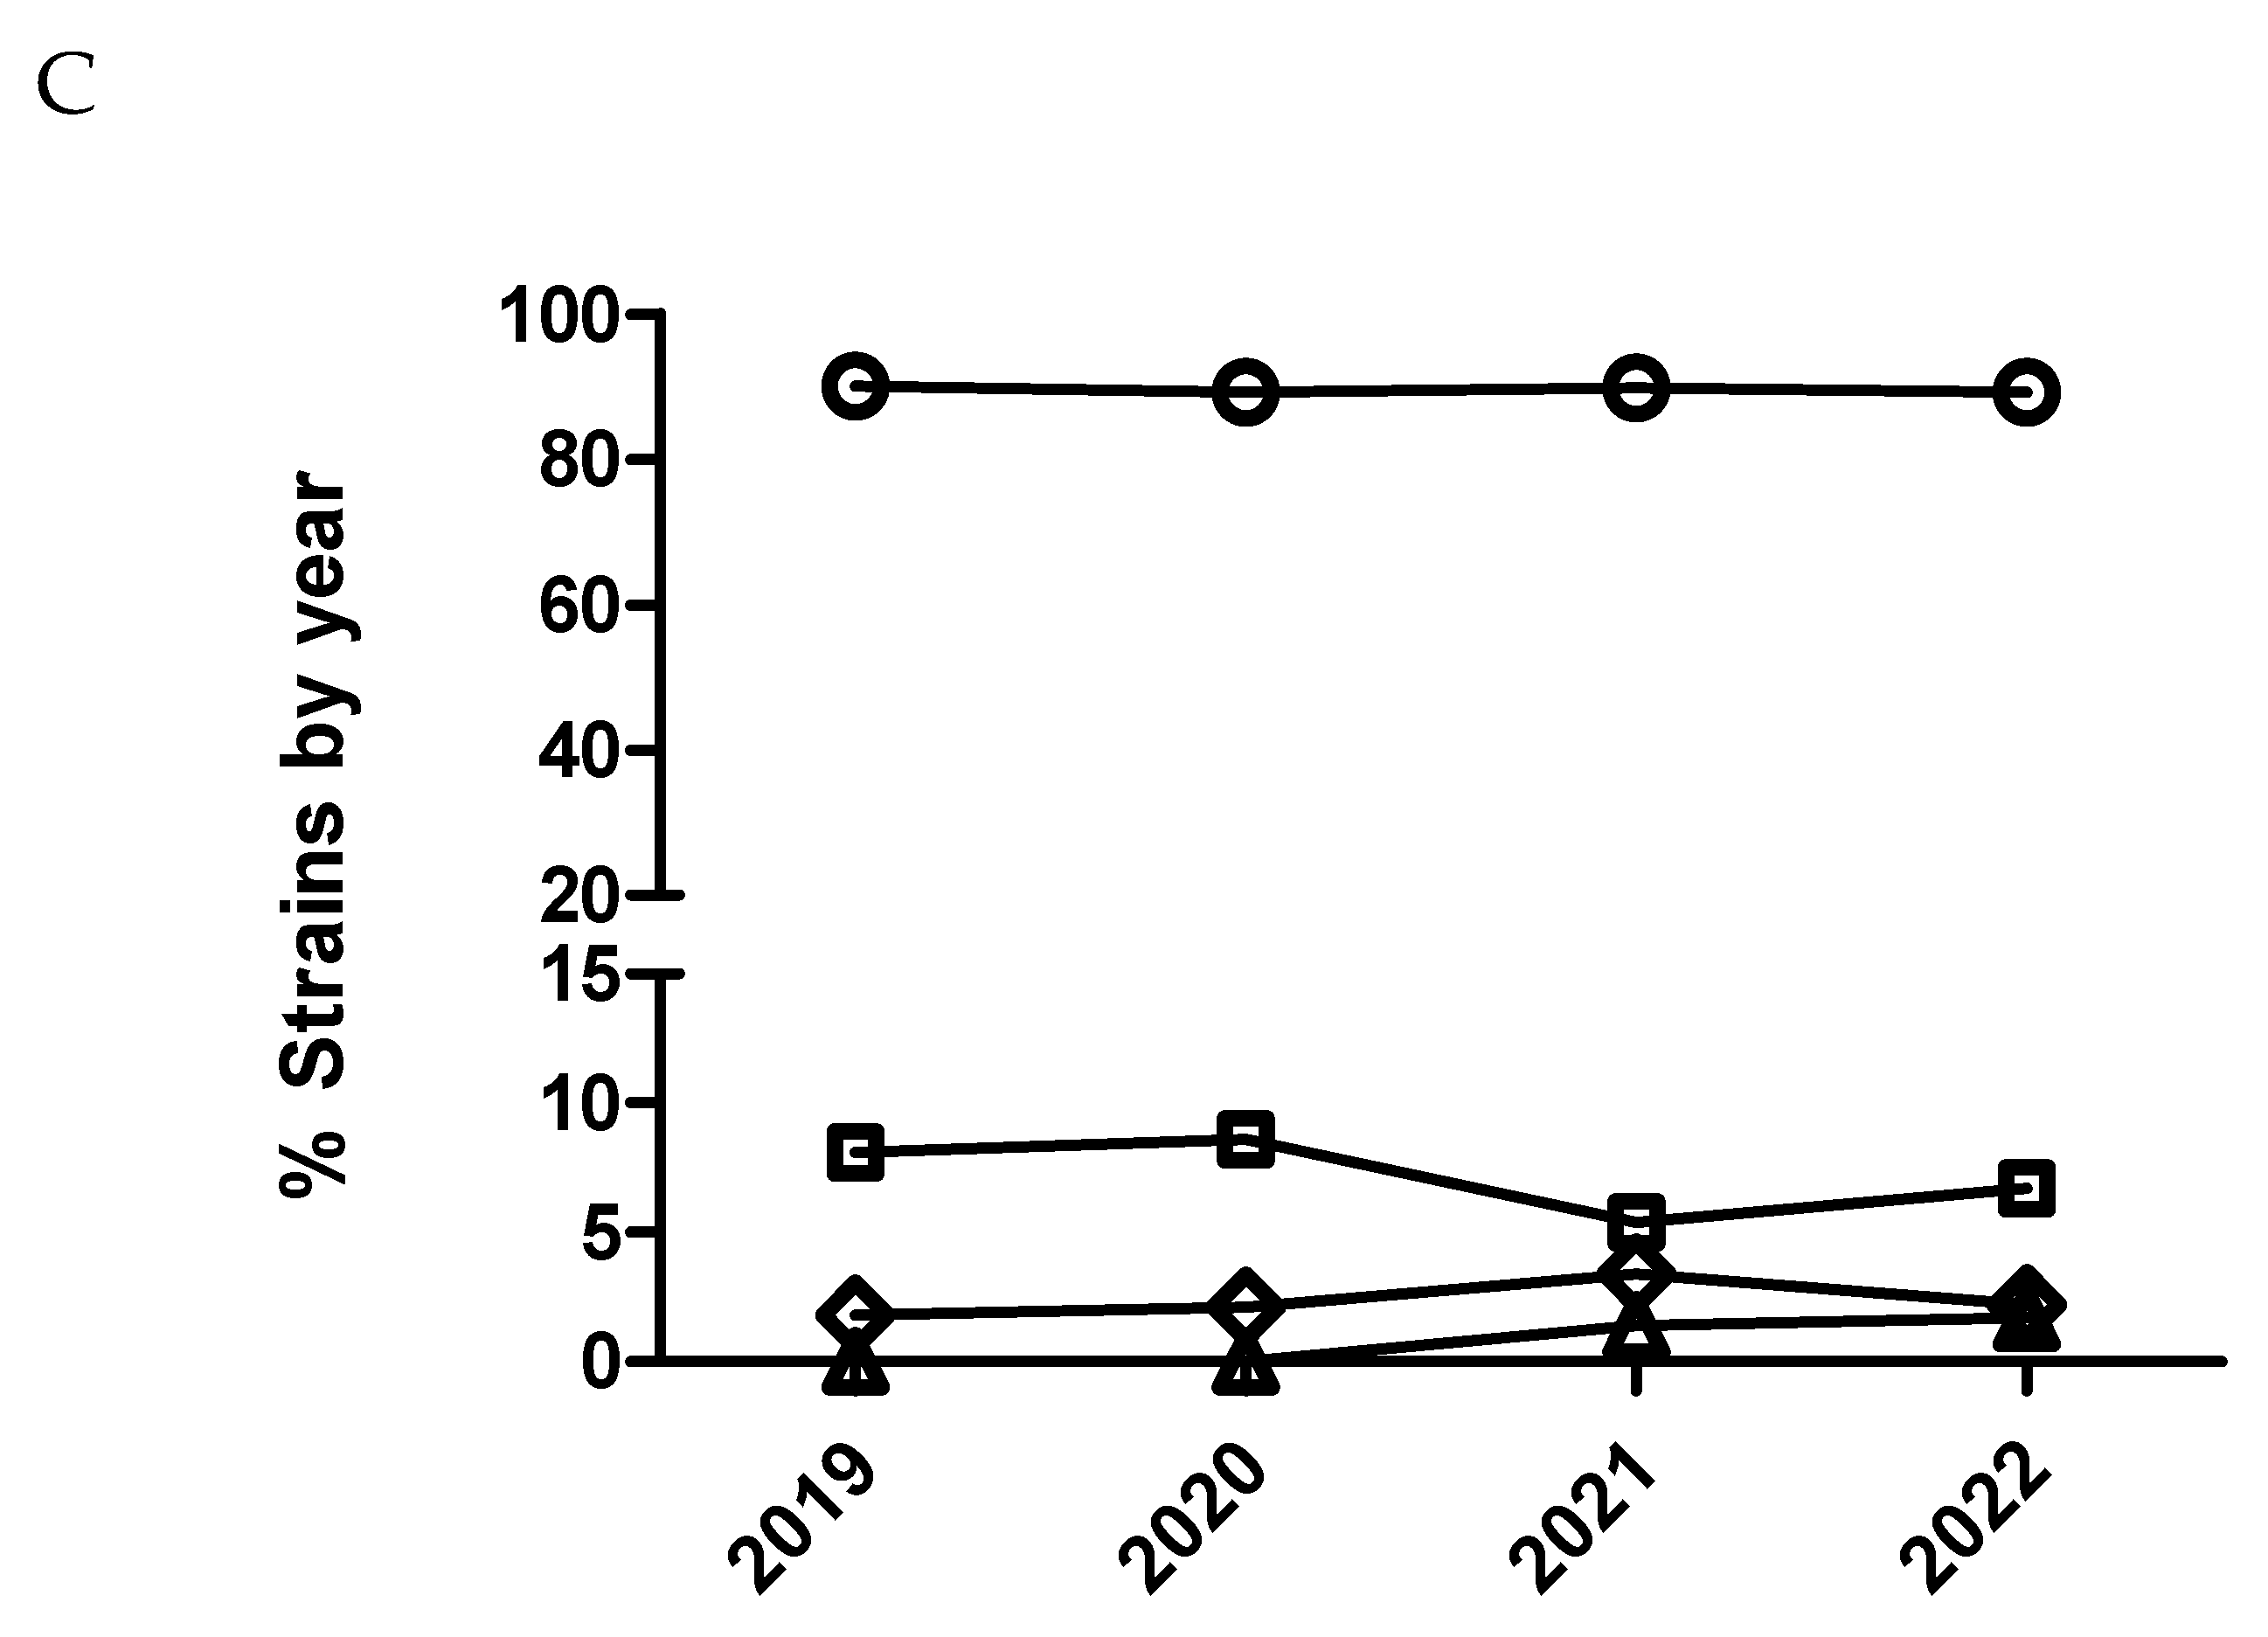
| Logistic analysis (susceptible/resistant) |
Multinominal analysis (MIC outcome categories being compared) | |||
|---|---|---|---|---|
| Predictor variable | NA | 1 vs 2 | 1 vs 3 | 1 vs 4 |
| Year | P=0.0002 | P=0.002 | ||
| 20 vs 19 | 2.7 (1.6-4.8) | NS | 2.1 (1.4-3.1) | 2.3 (1.3-4.1) |
| 21 vs 20 | NS | NS | NS | NS |
| 22 vs 21 | NS | NS | NS | NS |
| Logistic analysis (susceptible/resistant) |
Multinominal analysis (MIC outcome categories being compared) | |||
|---|---|---|---|---|
| Predictor variable | NA | 1 vs 2 | 1 vs 3 | 1 vs 4 |
| Year | P<0.0001 | P<0.0001 | ||
| 20 vs 19 | 1.7 (1.2-2.4) | 5.5 (4.6-6.9) | 3 (2.4-3.8) | NS |
| 21 vs 20 | NS | 2.7 (2.3-3.3) | NS | NS |
| 22 vs 21 | NS | 0.23 (0.17-0.29) | 0.55 (0.44-0.70) | 0.37 (0.12-0.86) |
| Antimicrobial | APP | PM | EC |
| Enrofloxacin | <0.25 | <0.25 | <0.25* |
| Marbofloxacin | <0.25 | <0.25 | <0.25* |
| Ceftiofur | <2 | <2 | <2* |
| Cefquinome | NA | NA | <2* |
| Colistin | NA | NA | <2 |
Disclaimer/Publisher’s Note: The statements, opinions and data contained in all publications are solely those of the individual author(s) and contributor(s) and not of MDPI and/or the editor(s). MDPI and/or the editor(s) disclaim responsibility for any injury to people or property resulting from any ideas, methods, instructions or products referred to in the content. |
© 2023 by the authors. Licensee MDPI, Basel, Switzerland. This article is an open access article distributed under the terms and conditions of the Creative Commons Attribution (CC BY) license (http://creativecommons.org/licenses/by/4.0/).


