Preprint
Article

Effect of Nitrogen Levels on Methanogen and Methanotroph Populations in Rice Paddies

Altmetrics

Downloads

143

Views

94

Comments

0

Submitted:

11 September 2023

Posted:

13 September 2023

You are already at the latest version

Alerts
Abstract
Rice production is a significant contributor to methane emissions, accounting for ap-proximately 11% of global anthropogenic emissions. However, methane emissions in rice fields could effectively be reduced by implementing proper management practices and careful cultivar selection. The impact of nitrogen fertilizers on methane emissions is mul-tifaceted, as these fertilizers enhance crop growth and influence the activity of me-thane-producing (methanogens) and methane-consuming microbes (methanotrophs), leading to complex outcomes in methane emissions. In this study, we used qPCR to quan-tify methanogens and methanotrophs using mcrA (methanogenesis-related gene) and pmoA (methane oxidation-related gene) primer sets under different nitrogen levels (0, 50, and 100%) and rice varieties. The results revealed that higher nitrogen input led to higher methanogen inhabitation in the rhizosphere. Additionally, the abundances of methano-gens and methanotrophs varied among the different rice varieties. Furthermore, it was observed that there may be an additive effect between the rice variety and nitrogen level used. These findings suggest that future breeding efforts should involve screening for me-thane-related microbes in rice cultivars adapted to low-nitrogen conditions. By identifying and selecting rice varieties that promote lower methanogen levels and higher metha-notroph inhabitation, significant steps can be taken to mitigate greenhouse gas emissions from rice cultivation.
Keywords: 
Subject: Biology and Life Sciences  -   Agricultural Science and Agronomy

1. Introduction

Rice, the world's most important food, stands out as an aquatic cereal crop. Currently, approximately 131 million hectares of rice paddies are flooded by irrigation or rainwater during the growing season [1]. Nevertheless, rice paddies are also considered a major source of anthropogenic methane (CH4) emissions, contributing to 12% of the total anthropogenic CH4 budget (IPCC, 2007) [2]. Recent estimates of CH4 emissions from rice fields vary between 39 and 112 Tg per year [3]. Unfortunately, owing to the increasing demand for rice from the world's rapidly growing population, rice cultivation is expected to continue to rise in the coming decades [4], which would lead to a significant increase in CH4 emissions.
CH4 emissions from paddy fields result from the production and subsequent oxidation of CH4 by methanogenic and methanotrophic bacteria, respectively [5]. CH4 fluxes in rice paddy soils are influenced by various factors, including the use of inorganic and organic fertilizers, water management practices, physicochemical and geochemical properties of the soil, air and soil temperatures, composition and activity of soil microorganisms, and the physiological characteristics of rice cultivars [6]. CH4 is produced under the anaerobic conditions typical of flooded rice fields, providing a favorable environment for methanogens that rely on reduced conditions and soil carbon sources produced by rice plants [7]. To quantify methanogens in rice paddy soils and other methanogenic environments, the mcrA gene, which encodes the alpha subunit of methyl coenzyme M reductase (MCR), is commonly used because of its high conservation and specificity for methanogens (paddies). Methanotrophic bacteria are dependent on the CH4 produced by methanogens and can oxidize up to 60–70% of it in paddy soils, significantly reducing the CH4 production potential of rice agriculture [8,9]. The variation in CH4 emissions observed among rice cultivars [10,11,12] indicates the potential for mitigating CH4 production from rice cultivation by breeding low-emission rice varieties. However, the genetic differences affecting rhizosphere microbial communities, which are ultimately reflected in CH4 emissions from rice paddy soils, remain poorly understood. Studies have shown that cultivar differences affect the composition of methanogens and methanotrophs in the rice rhizosphere [13,14,15,16,17,18,19]. Methanogens interact with other members of the microbial community, influencing the observed CH4 emissions from rice fields. Consequently, variation in cultivars may play a major role in regulating CH4 emissions from rice fields. In addition, nitrogen fertilizers play a significant role in stimulating crop growth and providing additional carbon substrates, such as organic root exudates and sloughed-off cells, to methanogens for CH4 production [20,21,22]. However, despite extensive research in this area, no consensus has been reached regarding the net effect nitrogen fertilizers have on methanogen abundance in rice soils. In other words, although it is well-established that nitrogen fertilizers can enhance crop growth and contribute to the production of CH4 by providing more carbon substrates to methanogens, there is no universally agreed-upon conclusion regarding the overall effect nitrogen fertilizers have on the abundance of methanogens in rice soils. Further research is required to fully understand the complex interactions between nitrogen fertilizers and methanogen abundance during rice cultivation. Likewise, with the widespread observation of differences in CH4 emissions among rice cultivars [23,24,25], few studies have attempted to examine CH4 emission control mechanisms, such as the abundance of methanogens and methanotrophs, apparent plant growth properties, and using different cultivars.
This study aimed to evaluate and quantify the methanogens and methanotrophs present in the rice plant rhizosphere under different nitrogen levels and cultivars. To this end, we suggest that there is a potential synergistic or additive effect between cultivar varieties and nitrogen levels that reduces the abundance of methanogens and enhances methanotroph inhabitance.

2. Materials and Methods

2.1. Experimental field management and measurement of agronomic traits

The experimental fields were situated in Miryang, South Korea (35° 29' 32.2872" N, 128° 44' 32.1972" E). Prior to transplantation, conventional tillage was performed and no straw or organic matter applied. The rice varieties used were Hanareum4, Geumgang1, Milyang392, IR72, 93-11, IR64 (Indica), Saeilmi, Sobi, Nampyeong, and Misojinmi (Japonica), which were transplanted 30 days after sowing. Seedlings were simultaneously transplanted into both experimental fields at a spacing of 30 cm × 15 cm. Each field (8 m × 70 m) consisted of three replicate plots. Chemical fertilizer (N-P2O5-K2O: 21-17-17) was applied at concentrations of 0%, 50%, and 100%. A 100% (conventional: N-P2O5-K2O: 9.0-4.5-5.9) fertilization was applied at a total rate of 90 kg N ha−1 during rice cultivation. This fertilizer was split into three applications: 54 kg N ha−1 as basal application before transplanting; 18 kg N ha−1 at 20 days after transplanting (DAT); and 18 kg N ha−1 at 65 DAT, under normal nitrogen (NN) conditions. In the low nitrogen (LN) plots, only half (50%) of the nitrogen used in the normal plots was applied. The NN, LN, and no nitrogen fields were maintained for 20 years. The Miryang field was continuously flooded until 110 DAT as part of the field management practices. Throughout the rice-growing season, continuous flooding was maintained to keep the water level consistent at 5–7 cm above the soil surface. Plant height and tiller number were measured during the tillering, heading, and grain-filling stages, as well as prior to harvesting. Agronomic traits, such as milled rice yield, spikelet number per panicle, and thousand grain weight, were measured before harvesting.
2.2 Chemical characterization of testbed soil
Soil analysis was conducted according to previously described methods [26]. The soil pH was measured using a soil-to-distilled water ratio of 1:5, and the resulting suspension measured using a pH meter (720, ORION, USA) based on the glass electrode method. Organic matter was determined using Tyurin’s method, and available phosphorus extracted and analyzed using the Lancaster method with a spectrophotometer (CINTRA6, GBC, Australia) (NIAST, 2000). Nitrogen within the soil was extracted with 2 M KCl and analyzed using a nitrogen analyzer (K-314, Buchi, Switzerland). For the analysis of exchangeable cations, the soil was extracted with 1 N NH4OAc (pH 7) and quantified using an Inductively Coupled Plasma-Atomic Emission Spectrometer (Intergra XM2, GBC).

2.3. Extraction of total genomic DNA from rice rhizosphere

Rhizospheric soil from rice roots was collected from each experimental plot, with five replicates at the tillering, heading, and grain-filling stages. A gram of rhizospheric soil was dried for 12 h. Extraction of total genomic DNA was performed using the DNeasy PowerSoil Pro Kit (Qiagen, Germany), following the manufacturer’s protocol. Samples were collected in a PowerBead Pro Tube that was briefly spun to ensure that the beads settled at the bottom. Afterward, up to 250 mg soil and 800 µL Solution CD1 were added and briefly mixed via vortexing. Once the sample was loaded into a PowerBead Pro Tube, the next step involved homogenization and lysis. The PowerBead Pro Tube contains a buffer that serves multiple purposes: (a) dispersing soil particles, (b) initiating the dissolution of humic acids, and (c) protecting the nucleic acids from degradation. The components of the PowerBead Pro Tube were mixed by gentle vortexing and the sample dispersed in the buffer. A Vortex Adapter for 1.5–2 mL tubes (cat. no. 13000-V1-24) was used, which the PowerBead Pro Tube was horizontally secured to, and vortexed at maximum speed for 10 min. If more than 12 samples were prepared simultaneously using the Vortex Adapter, the vortexing time was increased by 5–10 min. Tape was avoided during this process as it may become loose, resulting in reduced homogenization efficiency and inconsistent results. The PowerBead Pro Tube was centrifuged at 15,000 × g for 1 min. The supernatant, which may still contain some soil particles, was transferred to a clean 2 mL microcentrifuge tube. A 200 µL volume of Solution CD2 was added to the supernatant and vortexed for 5 s. Solution CD2 contained IRT, a reagent that precipitates non-DNA organic and inorganic materials, including humic substances, cell debris, and proteins. The mixture was then centrifuged at 15,000 × g for 1 min. Up to 700 µL supernatant was carefully transferred to a clean 2 mL microcentrifuge tube. The pellet at this stage contained non-DNA organic and inorganic materials, such as humic acids, cell debris, and proteins. For optimal DNA yield and quality,

2.4. Constriction of standard DNA for generating standard curves

To quantify methanogens and methanotrophs in the rhizosphere, we constructed standard DNA samples. Specific primers were used for amplification. For the key enzyme of methanogenic bacteria, MCR, the MLf (5'-GGTGGTGTMGGATTCACACARTAYGCWACAGC-3') and MLr (5'-TTCATTGCRTAGTTWGGRTAGTT-3') primers were used [27]. For the major enzyme of methanotrophic bacteria, particulate CH4 monooxygenase (pMMO), the A189f (5'-GGNGACTGGGACTTCTGG-3') and mb661r (5'-CCGGMGCAACGTCGTCYTTAC C-3') primers were used [28,29]. PCR amplification was performed using each primer set. For MCR gene amplification, the reaction included an initial denaturation at 94 °C for 5 min, followed by 32 cycles of denaturation at 94 °C for 45 s, annealing at 55 °C for 45 s, extension at 72 °C for 45 s, and a final extension at 72 °C for 10 min. For pMMO gene amplification, the reaction included an initial denaturation at 94 °C for 5 min, followed by 32 cycles of denaturation at 94 °C for 45 s, annealing at 60 °C for 45 s, extension at 72 °C for 45 s, and a final extension at 72 °C for 10 min. After amplification, the MCR and pMMO genes were purified and the TOPO TA cloning kit (Invitrogen, Carlsbad, CA, USA) used for transformation into Escherichia coli. Colonies containing the inserted plasmids were obtained on Luria-Bertani + kanamycin (50 ppm) + X-gal + isopropyl β-d-1-thiogalactopyranoside agar plates. Sequences of the inserted genes in the obtained colonies were analyzed for confirmation, and the plasmids used as standards. Plasmids prepared as standards were extracted using a Plasmid Mini Extraction Kit (Bioneer, Korea) and their concentrations measured using an ELISA reader with a Take3 multivolume plate. A standard curve was generated and gene copy numbers calculated.

2.5. Methanogen and methanotroph quantification

The qPCR reactions were performed using a QuantiFast SYBR Green PCR kit (Qiagen, Germany). The reaction mixture consisted of 0.3 μM primers, 50 nL genomic DNA, and 7.8 μL distilled water, resulting in a total volume of 20 μL. For quantification, the plasmid DNA standards prepared in Section 2.4 were diluted from 102 to 107 for mcrA and from 102 to 108 for pmoA. The prepared mixture was subjected to real-time PCR using a QuantStudio 5 Real-Time PCR System (Applied Biosystems). PCR amplification was performed under the same conditions as those used for standard preparation, with 50 cycles to confirm specific amplification. Additionally, melting curve analysis was performed to determine whether PCR amplification was specific by increasing the temperature from 65 °C to 95 °C with a 0.5 °C increment per cycle. The real-time PCR results were analyzed using QuantStudio Design and Analysis software (Applied Biosystems) to quantify the copy numbers of methanogenic and methanotrophic bacteria present in the genomic DNA.

2.6. Statistical analysis

Statistical analyses, including two-way ANOVA and correlation analysis, were performed using the SAS Enterprise software (version 7.15 HF8). Statistical significance was set at p <X.XX.

3. Results and Discussion

3.1. Methanogen and methanotroph abundance under different nitrogen levels and rice growth stages

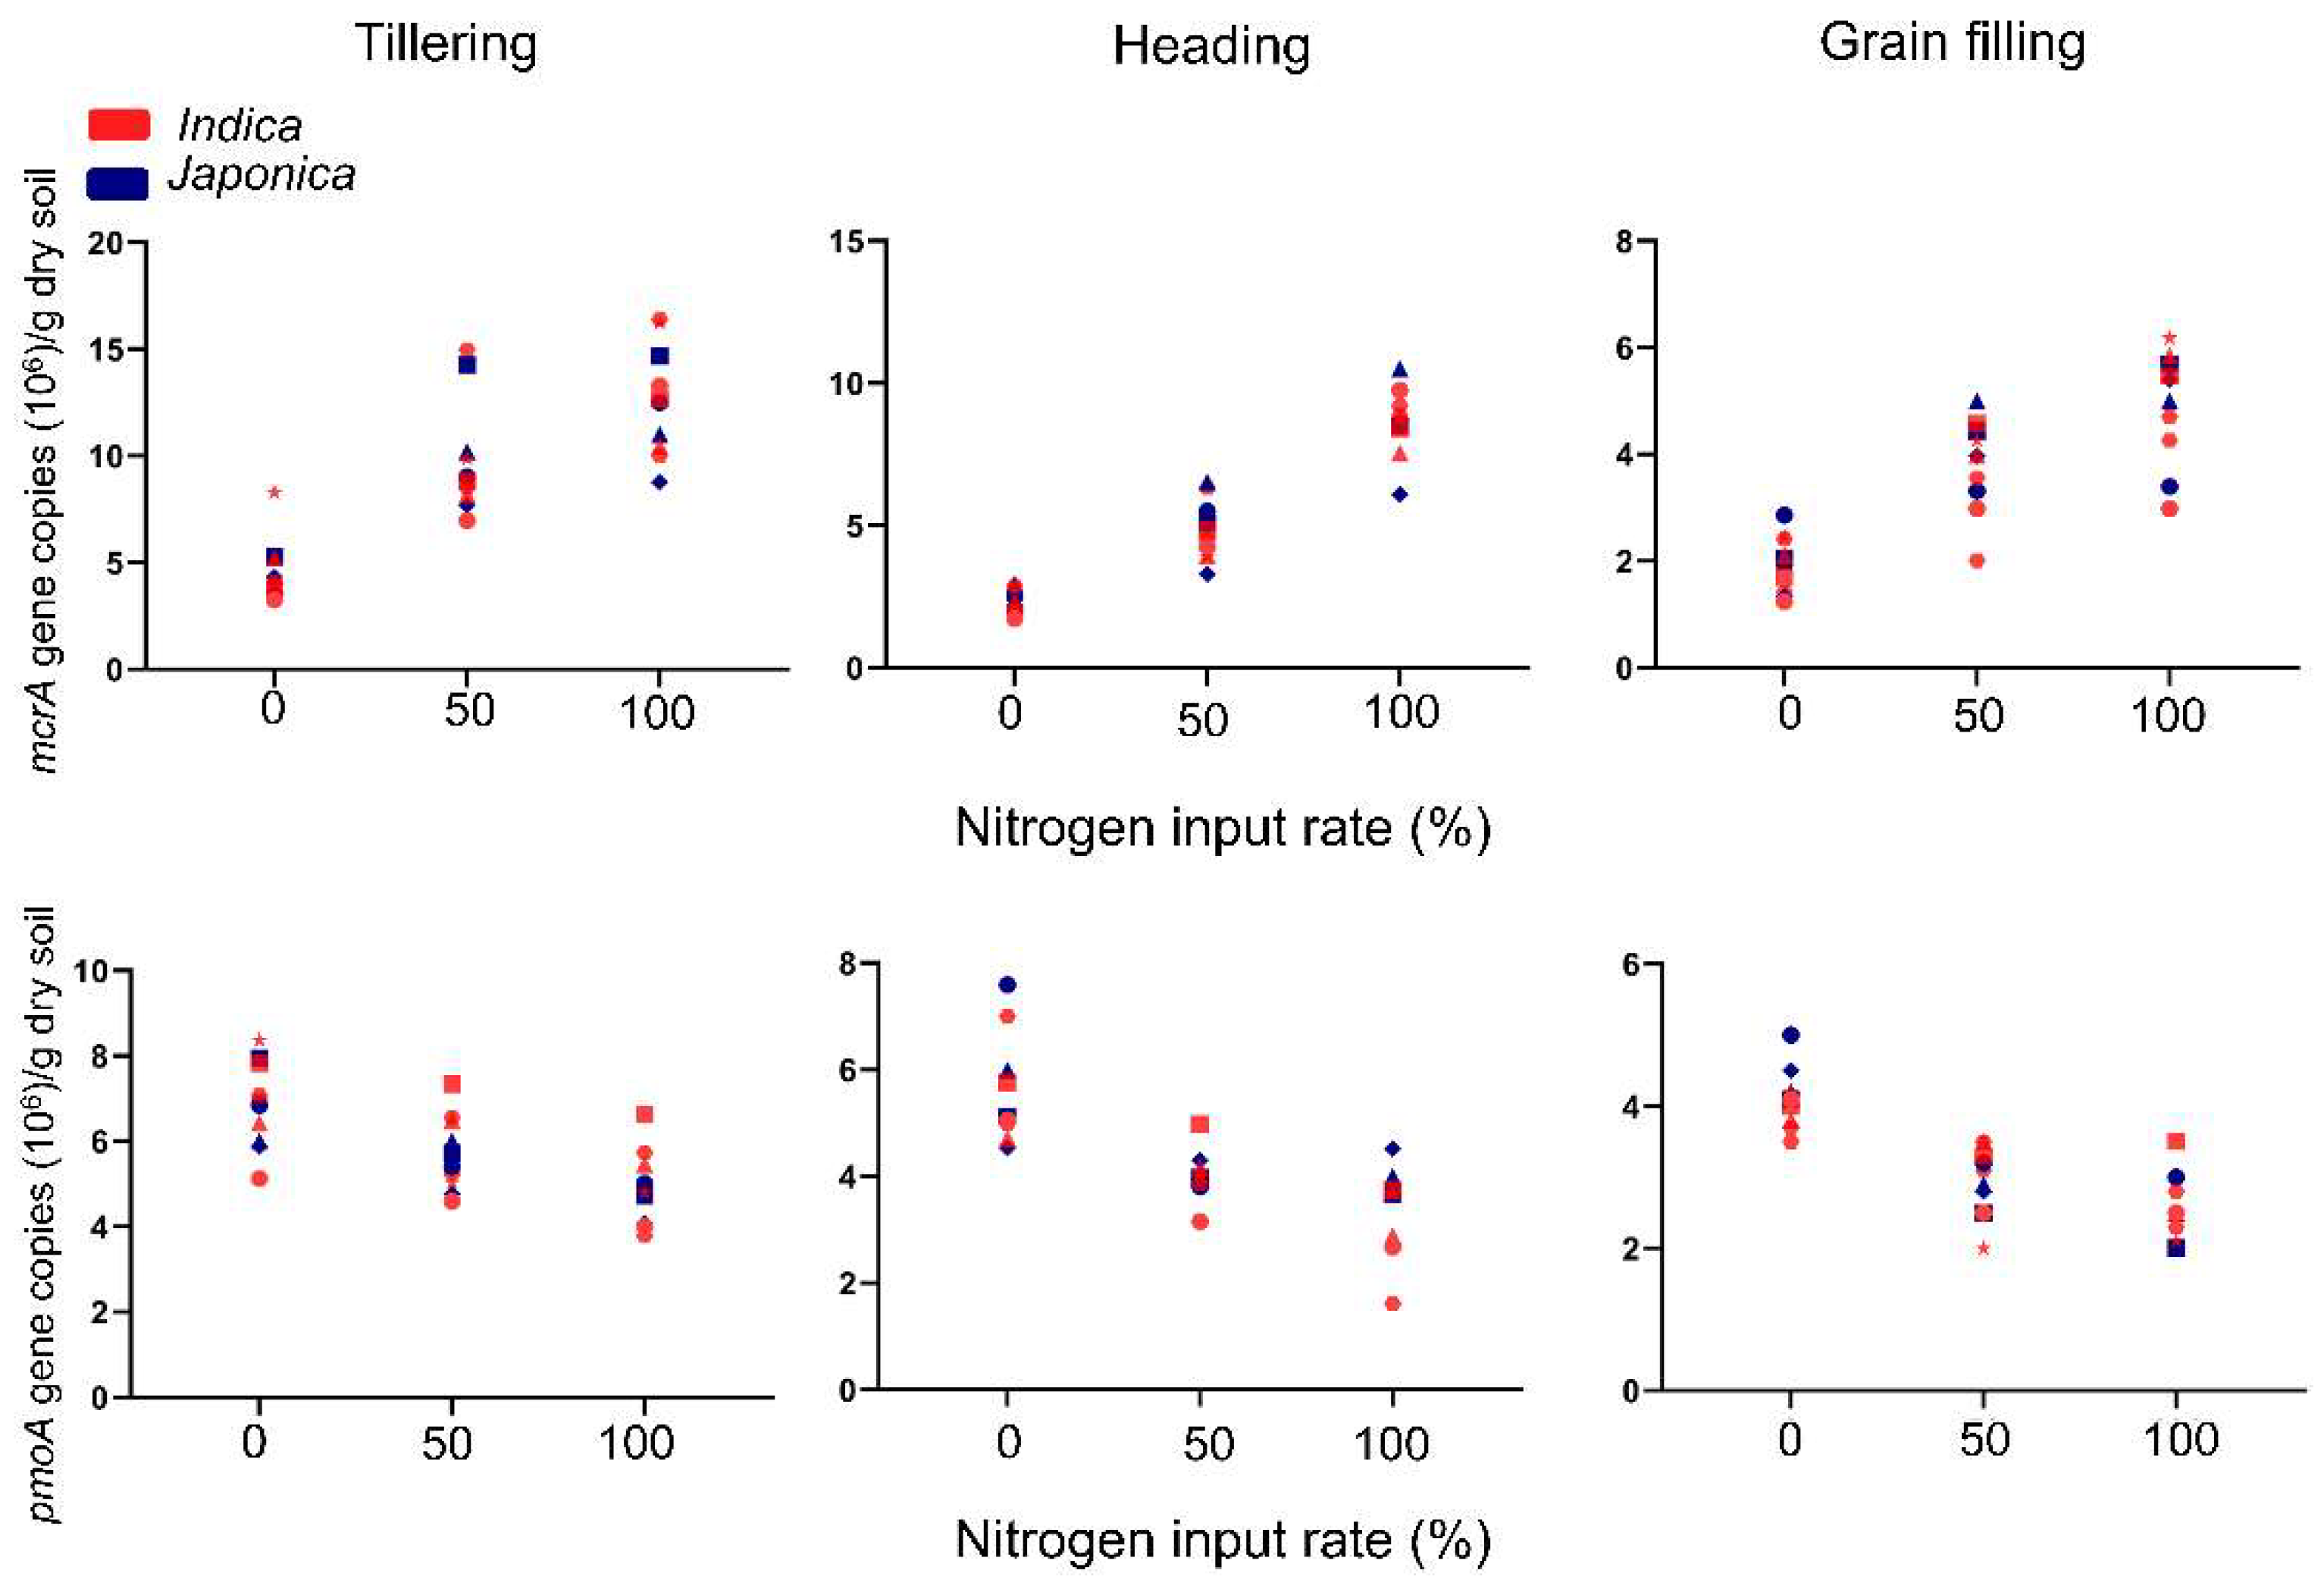
To explore the abundance of rhizospheric methanogens and methanotrophs under different nitrogen levels and growth stages, we conducted qPCR using six Indica and four Japonica subspecies; samples were collected under 0%, 50%, and 100% nitrogen levels (conventional level), and tillering, heading, and grain-filling growth stages. The abundance of methanogens and methanotrophs were highly affected by nitrogen levels during all growth stages. Under LN conditions, the abundances of methanogens were 3.8, 9.8, and 4.7 × 10⁶ mcrA gene copies/g dry soil during the tillering, heading, and grain-filling stages, respectively. Methanotroph abundances in LN were 4.0, 5.7, and 2.9 × 10⁶ pmoA gene copies/g dry soil during the same stages, respectively. In contrast, under NN conditions, the abundances of methanogens were 4.9, 12.6, and 8.6 × 10⁶ mcrA gene copies/g dry soil, whereas methanotroph abundances in NN were 3.3, 4.9, and 2.5 × 10⁶ pmoA gene copies/g dry soil during the corresponding stages. First, the quantitative abundances of methanogens and methanotrophs were observed to be highest at the tillering stage and gradually decreased until the grain-filling stage. Second, nitrogen application levels were strongly affected by the abundance of methanogens and methanotrophs. The more nitrogen applied, the more methanogens and fewer methanotrophs inhabited the rice rhizosphere (Figure 1).
Interestingly, the abundances differed depending on the rice variety. Otherwise, there were no differences observed between Indica and Japonica subspecies. This implies that methanogen and methanotroph inhabitants prefer different cultivar genotypes rather than subspecies.

3.2. Ratio of methanogens/methanotrophs under different nitrogen levels and rice growth stages

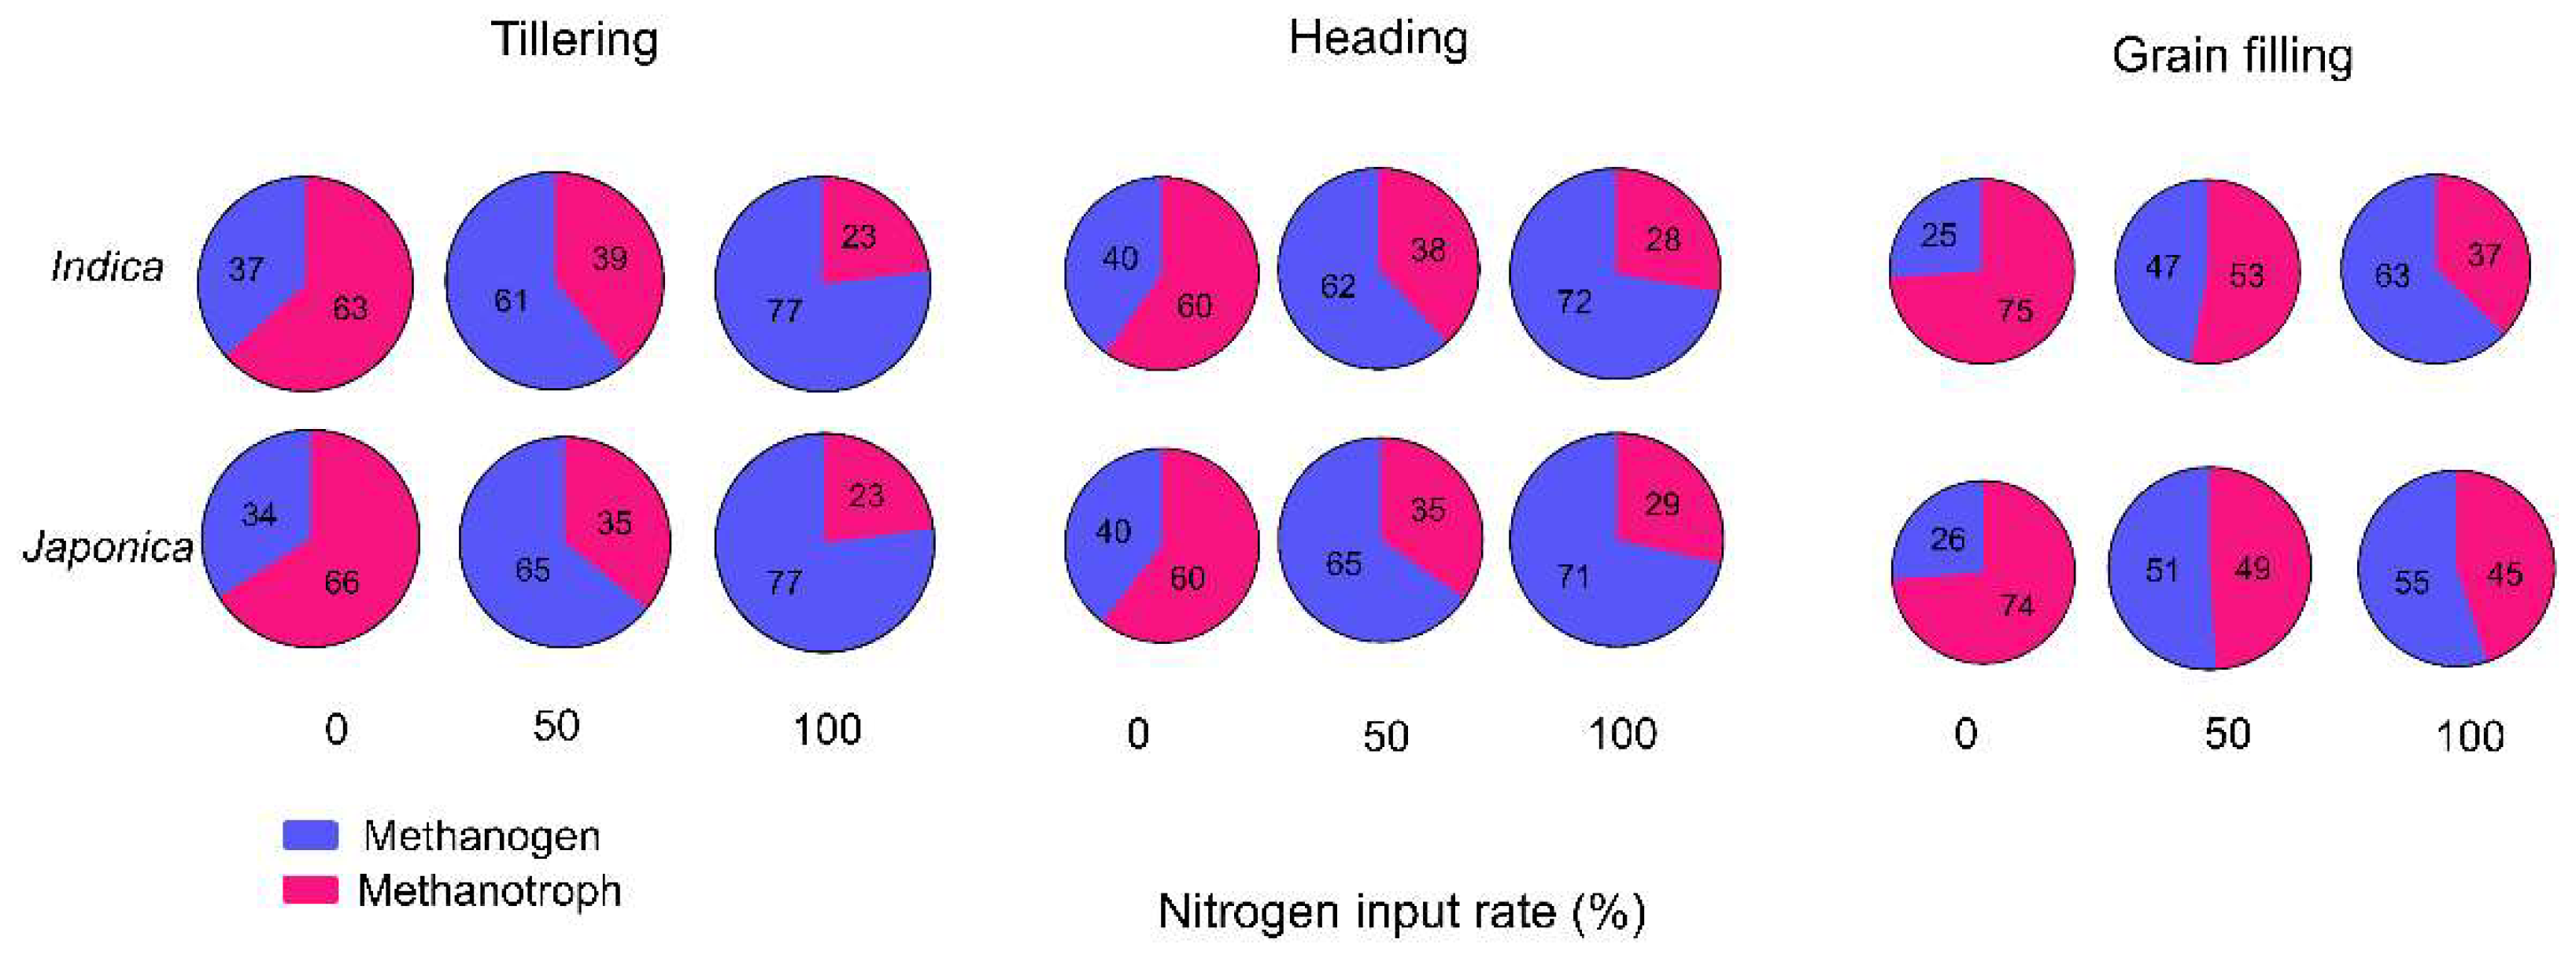
The ratios of methanogens to methanotrophs were highly variable at different nitrogen levels and rice growth stages. At the tillering stage, methanogen/methanotroph ratios were 35%, 62%, and 77% under the 0%, 50%, and 100% nitrogen levels, respectively. The heading and grain-filling stages under these nitrogen conditions had ratios of 40%, 63%, and 71% and 26%, 48%, and 59%, respectively (Figure 2).
The methanogen/methanotroph ratio varied depending on the rice genotype. Geumgang1, which exhibits low panicle numbers but a high rice yield, showed low levels of methanogens. In contrast, IR64, a genotype highly influenced by nitrogen levels and has varying tiller numbers, demonstrated significant changes in methanogen abundance (Table 1 and Table S1). These findings indicate that reducing nitrogen fertilizer application can potentially lead to lower CH4 emissions by maintaining lower levels of methanogens in the soil. This aligns with the global adoption of low-input regimes to mitigate greenhouse gas emissions. Moreover, it is crucial to focus on reducing methanogen abundance during specific stages of rice growth, particularly the tillering and heading stages. Methanogen levels tended to remain high during these stages, significantly contributing to greenhouse gas production. Efforts can be made to implement effective strategies for reducing greenhouse gas emissions by addressing methanogen levels during these critical stages. In summary, this study highlights the importance of understanding the methanogen/methanotroph ratio in different rice genotypes, and emphasizes the potential benefits of reducing nitrogen fertilizer use to lower CH4 emissions. Targeting and managing methanogen levels during key growth stages could be a valuable approach for greenhouse gas reduction.
We conducted a two-way ANOVA using the SAS enterprise program to explore the combined effects of rice variety and nitrogen level on methanogen abundance. The p-values obtained from the one-way ANOVA were significantly different at all rice growth stages. However, the rice subspecies did not have a significant effect. Contrastingly, the two-way ANOVA of S × N (Subspecies × Nitrogen level) and V × N (Variety × Nitrogen level) interactions demonstrated significant differences. These results suggest that both rice genotypes and nitrogen levels can influence and moderate methanogen inhabitance. Furthermore, combining specific rice varieties with LN levels may result in synergistic or additive effects, potentially reducing methanogen abundance. Previous studies focusing on mitigating greenhouse gas emissions have often examined individual factors such as rice varieties and nitrogen levels [30,31]. For instance, Kim et al. [31] reported that a LN input could reduce CH4 emissions without quantifying CH4 emission-related microbes. Lee et al. [17] revealed that the characteristics and behavior of methanogens and methanotrophs in rice paddies can vary depending on the specific rice variety being grown. In other words, different rice varieties have a distinct impact on these microbial groups and their activities in the soil. In conclusion, our study highlights the importance of considering the combined effects of rice variety and nitrogen levels in modulating methanogen abundance. Indeed, this approach provides additional evidence that supports and expands on previous research that has focused on the effects of nitrogen and differentiation among rice varieties. By understanding these interactions, effective strategies could be developed to mitigate greenhouse gas emissions from rice cultivation.

5. Conclusions

In this study, we investigated the abundances of rhizospheric methanogens and methanotrophs in rice paddies at different nitrogen levels and rice growth stages. Using qPCR, we analyzed samples collected from six Indica and four Japonica subspecies at 0%, 50%, and 100% (conventional level) nitrogen levels during the tillering, heading, and grain-filling stages. Our results showed that nitrogen levels significantly affected the abundances of both methanogens and methanotrophs across all growth stages. Methanogen and methanotroph abundances were the highest at the tillering stage and gradually decreased until the grain-filling stage. Nitrogen application had a significant effect on methanogen and methanotroph abundance, with higher nitrogen levels resulting in more methanogens and fewer methanotrophs in the rice rhizosphere. Interestingly, the abundances varied depending on the rice variety, whereas no significant difference between the Indica and Japonica subspecies were observed, suggesting that methanogen and methanotroph inhabitants may prefer specific rice genotypes rather than subspecies. The methanogen/methanotroph ratio varied greatly under different nitrogen levels and growth stages, with higher ratios observed under higher nitrogen levels. Our findings indicate that reducing nitrogen fertilizer application can potentially lower CH4 emissions by maintaining lower levels of methanogens in the soil and aligning them with low-input regimes to mitigate greenhouse gas emissions. In addition, targeting and managing methanogen levels during specific growth stages, particularly tillering and heading, could be instrumental in greenhouse gas reduction strategies. This study emphasizes the importance of understanding the methanogen/methanotroph ratio in different rice genotypes and highlights the potential benefits of reducing nitrogen fertilizer use to lower CH4 emissions from rice cultivation. More effective strategies for mitigating greenhouse gas emissions can be developed by considering the combined effects of rice variety and nitrogen levels.

Supplementary Materials

The following supporting information can be downloaded at the website of this paper posted on Preprints.org, Table S1: Agronomic traits of 10 rice varieties grown under different nitrogen levels.

Author Contributions

Conceptualization, J.-H.L. and Y.K.; methodology, Y.K. and S.-M.L.; software, J.-K.C.; validation, H.P., D.-S.P., and N.R.K.; writing—original draft preparation, Y.K.; writing—review and editing, J.-H.L.; supervision, J.-H.L., Y.-S.K., and K.-W.O.; project administration, K.-W.O.; funding acquisition, Y.K., J.-H.L., and K.-W.O. All authors have read and agreed to the published version of the manuscript.

Funding

This research was funded by the Cooperative Research Program for Agriculture Science and Technology Development (Project No. RS-2022-RD010405), Rural Development Administration, Republic of Korea.

Data Availability Statement

The data presented in this study are available in the Supplementary Materials.

Conflicts of Interest

The authors declare no conflict of interest.

References

  1. Xu, S.; Jaffé, P.R.; Mauzerall, D.L. A process-based model for methane emission from flooded rice paddy systems. Ecol Modell 2007, 205, 475–491. [Google Scholar] [CrossRef]
  2. Change, I.P.O.C. The physical science basis. Agenda. Clim Change 2007, 6, 333. [Google Scholar]
  3. Solomon, S. Contribution of Working Group I to the Fourth Assessment Report of the Intergovernmental Panel on Climate Change 2007. (No Title) 2007. [Google Scholar]
  4. Wang, Z.; Xu, Y.; Li, Z.; Guo, Y.; Wassmann, R.; Neue, H.; Lantin, R.; Buendia, L.; Ding, Y.; Wang, Z. Methane emissions from irrigated rice fields in northern China (Beijing). Nutr Cycl Agroecosyst this issue. 2000. [Google Scholar]
  5. Win, K.T.; Nonaka, R.; Win, A.T.; Sasada, Y.; Toyota, K.; Motobayashi, T.; Hosomi, M. Comparison of methanotrophic bacteria, methane oxidation activity, and methane emission in rice fields fertilized with anaerobically digested slurry between a fodder rice and a normal rice variety. Paddy Water Environ 2012, 10, 281–289. [Google Scholar] [CrossRef]
  6. Bodelier, P.L.; Roslev, P.; Henckel, T.; Frenzel, P. Stimulation by ammonium-based fertilizers of methane oxidation in soil around rice roots. Nature 2000, 403, 421–424. [Google Scholar] [CrossRef] [PubMed]
  7. Liesack, W.; Schnell, S.; Revsbech, N.P. Microbiology of flooded rice paddies. FEMS Microbiol Rev 2000, 24, 625–645. [Google Scholar] [CrossRef] [PubMed]
  8. Neue, H.-U. Methane emission from rice fields. J Bio Sci 1993, 43, 466–474. [Google Scholar] [CrossRef]
  9. Sigren, L.K.; Byrd, G.T.; Fisher, F.M.; Sass, R.L. Comparison of soil acetate concentrations and methane producton, transport, and emission in two rice cultivars. Global Biogeochem Cycles 1997, 11, 1–14. [Google Scholar] [CrossRef]
  10. Gogoi, N.; Baruah, K.K.; Gupta, P.K. Selection of rice genotypes for lower methane emission. Agron Sustain Dev 2008, 28, 181–186. [Google Scholar] [CrossRef]
  11. Linquist, B.A.; Marcos, M.; Adviento-Borbe, M.A.; Anders, M.; Harrell, D.; Linscombe, S.; Reba, M.L.; Runkle, B.R.K.; Tarpley, L.; Thomson, A. Greenhouse gas emissions and management practices that affect emissions in US rice systems. J Environ Qual 2018, 47, 395–409. [Google Scholar] [CrossRef] [PubMed]
  12. Simmonds, M.B.; Anders, M.; Adviento-Borbe, M.A.; van Kessel, C.; McClung, A.; Linquist, B.A. Seasonal methane and nitrous oxide emissions of several rice cultivars in direct-seeded systems. J Environ Qual 2015, 44, 103–114. [Google Scholar] [CrossRef] [PubMed]
  13. Jiang, Y.; van Groenigen, K.J.; Huang, S.; Hungate, B.A.; van Kessel, C.; Hu, S.; Zhang, J.; Wu, L.; Yan, X.; Wang, L.; et al. Higher yields and lower methane emissions with new rice cultivars. Glob Chang Biol 2017, 23, 4728–4738. [Google Scholar] [CrossRef] [PubMed]
  14. Liechty, Z.; Santos-Medellín, C.; Edwards, J.; Nguyen, B.; Mikhail, D.; Eason, S.; Phillips, G.; Sundaresan, V. Comparative analysis of root microbiomes of rice cultivars with high and low methane emissions reveals differences in abundance of methanogenic archaea and putative upstream fermenters. mSystems 2020, 5, 00897–00819. [Google Scholar] [CrossRef]
  15. Ma, K.; Qiu, Q.; Lu, Y. Microbial mechanism for rice variety control on methane emission from rice field soil. Glob Change Biol 2010, 16, no. [Google Scholar] [CrossRef]
  16. Jiang, Y.; Qian, H.; Huang, S.; Zhang, X.; Wang, L.; Zhang, L.; Shen, M.; Xiao, X.; Chen, F.; Zhang, H.; et al. Acclimation of methane emissions from rice paddy fields to straw addition. Sci Adv 2019, 5, eaau9038. [Google Scholar] [CrossRef]
  17. Lee, H.J.; Kim, S.Y.; Kim, P.J.; Madsen, E.L.; Jeon, C.O. Methane emission and dynamics of methanotrophic and methanogenic communities in a flooded rice field ecosystem. FEMS Microbiol Ecol 2014, 88, 195–212. [Google Scholar] [CrossRef]
  18. Lee, H.J.; Jeong, S.E.; Kim, P.J.; Madsen, E.L.; Jeon, C.O. High resolution depth distribution of Bacteria, Archaea, methanotrophs, and methanogens in the bulk and rhizosphere soils of a flooded rice paddy. Front Microbiol 2015, 6, 639. [Google Scholar] [CrossRef]
  19. Ma, K.; Conrad, R.; Lu, Y. Responses of methanogen mcrA genes and their transcripts to an alternate dry/wet cycle of paddy field soil. Appl Environ Microbiol 2012, 78, 445–454. [Google Scholar] [CrossRef]
  20. Aulakh, M.S.; Wassmann, R.; Bueno, C.; Rennenberg, H. Impact of root exudates of different cultivars and plant development stages of rice (Oryza sativa L.) on methane production in a paddy soil. Plant Soil 2001, 230, 77–86. [Google Scholar] [CrossRef]
  21. Denier van Der Gon, H.A.; Kropff, M.J.; Van Breemen, N.; Wassmann, R.; Lantin, R.S.; Aduna, E.; Corton, T.M.; Van Laar, H.H. Optimizing grain yields reduces CH4 emissions from rice paddy fields. Proc Natl Acad Sci U S A 2002, 99, 12021–12024. [Google Scholar] [CrossRef]
  22. Inubushi, K.; Cheng, W.; Aonuma, S.; Hoque, M.M.; Kobayashi, K.; Miura, S.; Kim, H.Y.; Okada, M. Effects of free-air CO2 enrichment (FACE) on CH4 emission from a rice paddy field. Glob Change Biol 2003, 9, 1458–1464. [Google Scholar] [CrossRef]
  23. Butterbach-Bahl, K.; Papen, H.; Rennenberg, H. Impact of gas transport through rice cultivars on methane emission from rice paddy fields. Plant Cell Environ 1997, 20, 1175–1183. [Google Scholar] [CrossRef]
  24. Setyanto, P.; Makarim, A.K.; Fagi, A.M.; Wassmann, R.; Buendia, L.V. Crop management affecting methane emissions from irrigated and rainfed rice in Central Java (Indonesia). Nutr Cycl Agroecosystems 2000, 58, 85–93. [Google Scholar] [CrossRef]
  25. Wassmann, R.; Aulakh, M.S. The role of rice plants in regulating mechanisms of methane missions. Biol Fertil Soils 2000, 31, 20–29. [Google Scholar] [CrossRef]
  26. Alvarenga, P.; Mourinha, C.; Palma, P.; Cruz, N.; Rodrigues, S.M. Assessment of soil physicochemical characteristics and as, Cu, Pb and Zn contamination in non-active mines at the Portuguese sector of the Iberian pyrite belt. Environments 2022, 9, 105. [Google Scholar] [CrossRef]
  27. Luton, P.E.; Wayne, J.M.; Sharp, R.J.; Riley, P.W. The mcrA gene as an alternative to 16S rRNA in the phylogenetic analysis of methanogen populations in landfill. Microbiology (Reading) 2002, 148, 3521–3530. [Google Scholar] [CrossRef] [PubMed]
  28. Holmes, A.J.; Costello, A.; Lidstrom, M.E.; Murrell, J.C. Evidence that particulate methane monooxygenase and ammonia monooxygenase may be evolutionarily related. FEMS Microbiol Lett 1995, 132, 203–208. [Google Scholar] [CrossRef] [PubMed]
  29. Costello, A.M.; Lidstrom, M.E. Molecular characterization of functional and phylogenetic genes from natural populations of methanotrophs in lake sediments. Appl Environ Microbiol 1999, 65, 5066–5074. [Google Scholar] [CrossRef]
  30. Gutierrez, J.; Kim, S.Y.; Kim, P.J. Effect of rice cultivar on CH4 emissions and productivity in Korean paddy soil. Field Crops Res 2013, 146, 16–24. [Google Scholar] [CrossRef]
  31. Kim, G.W.; Gutierrez-Suson, J.; Kim, P.J. Optimum N rate for grain yield coincides with minimum greenhouse gas intensity in flooded rice fields. Field Crops Res 2019, 237, 23–31. [Google Scholar] [CrossRef]
Disclaimer/Publisher’s Note: The statements, opinions, and data contained in all publications are solely those of the individual author(s) and contributor(s) and not of MDPI and/or the editor(s). MDPI and/or the editor(s) disclaim responsibility for any injury to people or property resulting from any ideas, methods, instructions or products referred to in the content.
Figure 1. Quantification of mcrA and pmoA gene copies of 10 rice varieties under different nitrogen levels and rice growth stages. Abundance of methanogens and methanotrophs were measured using mcrA and pmoA genes, respectively. The red symbol indicates Indica subspecies and the blue symbol Japonica subspecies.
Preprints 84775 g001
Figure 2. Methanogen to methanotroph ratios depend on the rice subspecies under different nitrogen levels and rice growth stages. Purple and pink indicate methanogens and methanotrophs, respectively.
Preprints 84775 g002
Table 1. Methanogen/methanotroph ratio under different nitrogen levels and rice growth stages in 10 rice varieties.
Ratio (%) Tillering Heading Grain-filling
0% 50% 100% 0% 50% 100% 0% 50% 100%
Indica Hanareum4 30 63 80 39 60 77 20 49 53
Geumgang1 33 60 71 32 55 66 23 48 59
Milyang392 38 53 75 45 56 66 31 49 67
IR72 45 56 76 36 56 64 33 48 61
93-11 40 66 81 50 66 77 33 51 63
IR64 33 67 80 33 74 81 17 34 74
Japonica Saeilmi 33 63 74 34 63 71 27 47 48
Sobi 32 67 81 40 71 76 29 53 61
Nampyeong 41 69 81 42 63 69 25 56 56
Misojinmi 29 54 71 42 62 68 23 47 54
Average 35 62 77 39 63 71 26 48 60
Table 2. Two-way ANOVA of methanogen abundance and other factors under different rice growth stages.
Two-way ANOVA
p-value
Tillering Heading Grain-filling
Variety (V) 0.0369 0.0428 0.0358
Subspecies (S) 0.5875 0.3642 0.3991
Nitrogen level (N) 0.0087 0.0151 0.0058
S × N 0.0344 0.0403 0.0378
V × N 0.0174 0.0235 0.0155
Disclaimer/Publisher’s Note: The statements, opinions and data contained in all publications are solely those of the individual author(s) and contributor(s) and not of MDPI and/or the editor(s). MDPI and/or the editor(s) disclaim responsibility for any injury to people or property resulting from any ideas, methods, instructions or products referred to in the content.
Copyright: This open access article is published under a Creative Commons CC BY 4.0 license, which permit the free download, distribution, and reuse, provided that the author and preprint are cited in any reuse.
Prerpints.org logo

Preprints.org is a free preprint server supported by MDPI in Basel, Switzerland.

Subscribe

© 2024 MDPI (Basel, Switzerland) unless otherwise stated