1. Introduction
The use of wind turbines has grown significantly due to the ever-increasing need for energy. With the growing consumption of energy, the use of renewable energy sources, including wind energy, has become the focus of attention for researchers. Among wind turbines, which use wind flow to generate mechanical power, horizontal-axis wind turbines are more efficient. Since wind energy is converted into electrical energy, this device is also called a wind generator. According to the Global Wind Energy Report [
1,
2], the total capacity of wind energy generated has increased from 59,091 megawatts in 2005 to 432,419 megawatts at the end of 2015, an increase of more than 700 percent. This statistic is a good indicator of the growing interest in the use of renewable energy, especially wind energy. Wind energy is the cheapest, cleanest, and most suitable form of renewable energy. In Iran, in recent years, there has been increasing interest in the use of this type of energy for electricity generation. In the past decade, numerical simulations of wind turbines have been developed in research institutes and by wind turbine manufacturers using commercial codes [
3,
4]. The new generation of these turbines, which have been tested and operated in recent years, are capable of increasing the ability to extract wind energy by up to three times. In the recent research on wind turbines, reports have indicated the possibility of increasing the use of wind energy by using a conical duct around the rotor.
Li et al. [
5] modeled a horizontal-axis wind turbine with a diameter and height of half a meter in a wind tunnel with a cross-section of 4 meters by 4 meters and a length of 6.2 meters. The tunnel was equipped with a square turbulent network with a minimum blockage ratio of 0.19 and a maximum blockage ratio of 0.73. They were able to generate turbulence intensities of 1.4%, 8%, and 13.5% using three different patterns. The inlet velocity was 7 meters per second. The purpose of this work was to investigate the wakes formed by the wind turbine more accurately by measuring them in the tunnel. However, the numerical calculations were performed in two dimensions. The results of the study include the following: In the near wake, the speed distribution has two maxima, and in the far wake, there is one maximum. In the turbulence intensity of 1.4%, the speed distribution at a location behind the turbine that is five times its diameter still shows two maxima, which is reduced to one maximum in the turbulence intensities of 8% and 13.5%. At a location behind the turbine that is ten times its diameter, the dimensionless speed is 0.9 in the turbulence intensity of 13.5% and 0.82 in 1.4%. This suggests that increasing the turbulence intensity increases the speed at that location. The results of the study show that the wakes formed by a wind turbine are affected by the turbulence intensity of the incoming wind. In the near wake, the turbulence intensity causes the flow to be more disordered, which leads to a decrease in the number of maxima in the speed distribution. In the far wake, the turbulence intensity causes the flow to be more spread out, which leads to a decrease in the overall speed. The results of the study also show that the wake behind a wind turbine can be affected by the size of the turbine. In the study, the turbine had a diameter of half a meter. A larger turbine would likely have a larger wake, with more maxima in the near wake and a lower overall speed in the far wake. The study provides new insights into the wakes formed by wind turbines. The results of the study suggest that the turbulence intensity and the size of the turbine can affect the characteristics of the wake.
In their study, Zhi-Qiang Wang et al. [
6] performed a computational fluid dynamics simulation of a floating offshore wind turbine. The simulation was based on the RNG k-ε turbulence model. In this simulation, the results were obtained with good accuracy, with an error of about 2.15%. Sorensen et al. [
7] simulated the applications of the NREL phase VI wind turbine using CFD. To do this, a structured grid was used for the turbine by placing it in a computational domain.
In a study, Lansgtry et al. [
8] simulated the performance of a two-dimensional airfoil and a three-dimensional wind turbine rotor in an unsteady condition. In fact, they used two turbulence models, the complete turbulence model and the unsteady turbulence model, for the simulation and found that the unsteady results matched better with the experimental results. Silva et al. [
9] investigated the numerical solution of the wake features in a horizontal-axis wind turbine. For this purpose, the NREL phase VI wind turbine was selected. The simulation was performed using the RANS equations and the SST turbulence model. The results were the least error compared to other articles, and they found that the wake is caused by the tip and root of the blade.
In another study, Sang et al. [
10] investigated the wake flow in a wind farm in order to optimize large-eddy simulation (LES) methods. They used the particle image velocimetry (PIV) method to determine the intensity of the wake flow. This method simulates particles in the first step, then obtains the relative density of the virtual particles using statistical methods, and finally converts this relative density to the amount of velocity reduction. Porte-Agel et al. [
11] investigated recent efforts to extend and validate the LES framework [
9]. They implemented models such as the standard rotating disk model without rotation (ADM-NR), the rotating disk model with rotation (ADM-R), and the rotating model (ALM) in a LES code.
Bartl et al. [
12] measured the speed field characteristics between two modeled wind turbines for two different separation distances. Their goal was to collect experimental data on how the power output of the downstream turbine is affected when it is located at a distance of 3 times and 5 times the diameter from the upstream turbine. Jang et al. [
13] used a commercial software and a large-eddy simulation turbulence model to investigate the properties of the wake of a wind turbine in a wind tunnel. Their main goal was to focus on the study of the wake structure and to identify the boundary between the near-wake and far-wake regions. For this purpose, they used the turbulence intensity characteristic. For a wind turbine to extract as much energy as possible from the wind, blade geometry optimization to maximize the aerodynamic performance is important [
14,
15,
16].
In this paper, we investigate the unsteady flow around a coastal wind turbine with two blades and an offshore wind turbine with three blades. We use the SST turbulence model and large-eddy simulation (LES) to simulate the flow around the turbines. We are particularly interested in the effects of the wake flow behind the turbines. The wake flow is a region of reduced wind speed and turbulence intensity that is formed behind a wind turbine. The wake flow can significantly reduce the power output of downstream turbines in a wind farm. It is therefore important to understand the characteristics of the wake flow in order to improve the design and performance of wind farms. The number of blades on a wind turbine has a significant effect on the wake flow. Turbines with more blades tend to produce a wider and weaker wake than turbines with fewer blades. This is because the blades of a turbine with more blades are spaced further apart, which reduces the amount of interference between the blades. The wake flow behind a wind turbine can have a significant impact on the power output of downstream turbines. The power output of a downstream turbine is reduced when it is located in the near-wake of an upstream turbine. The reduction in power output is more pronounced when the distance between the two turbines is smaller. The results of our study show that the wake flow behind a wind turbine is a complex phenomenon that is influenced by a number of factors, including the design of the turbine, the number of blades, and the speed of the wind. Our study provides new insights into the wakes formed by wind turbines and can be used to improve the design and performance of wind farms.
2. History of wind turbines
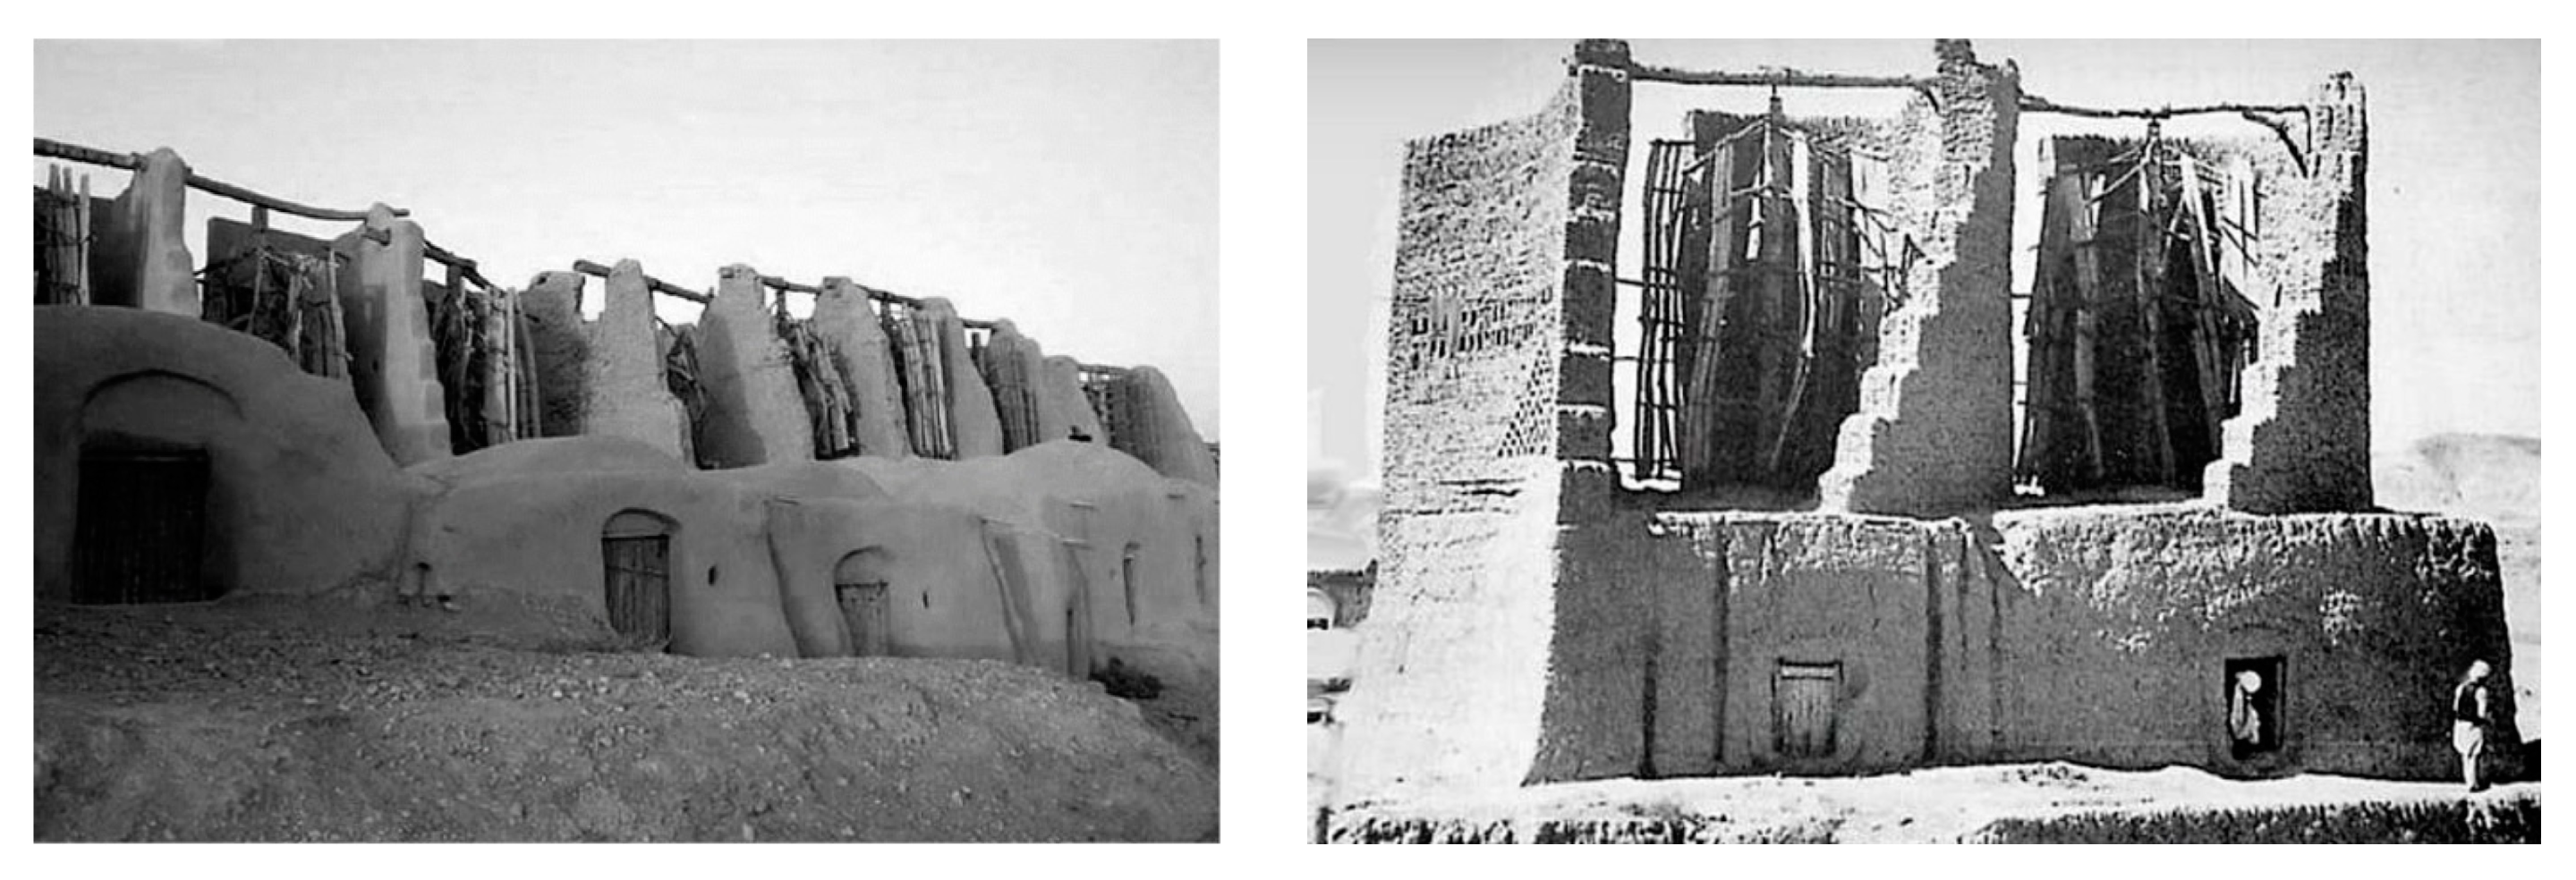
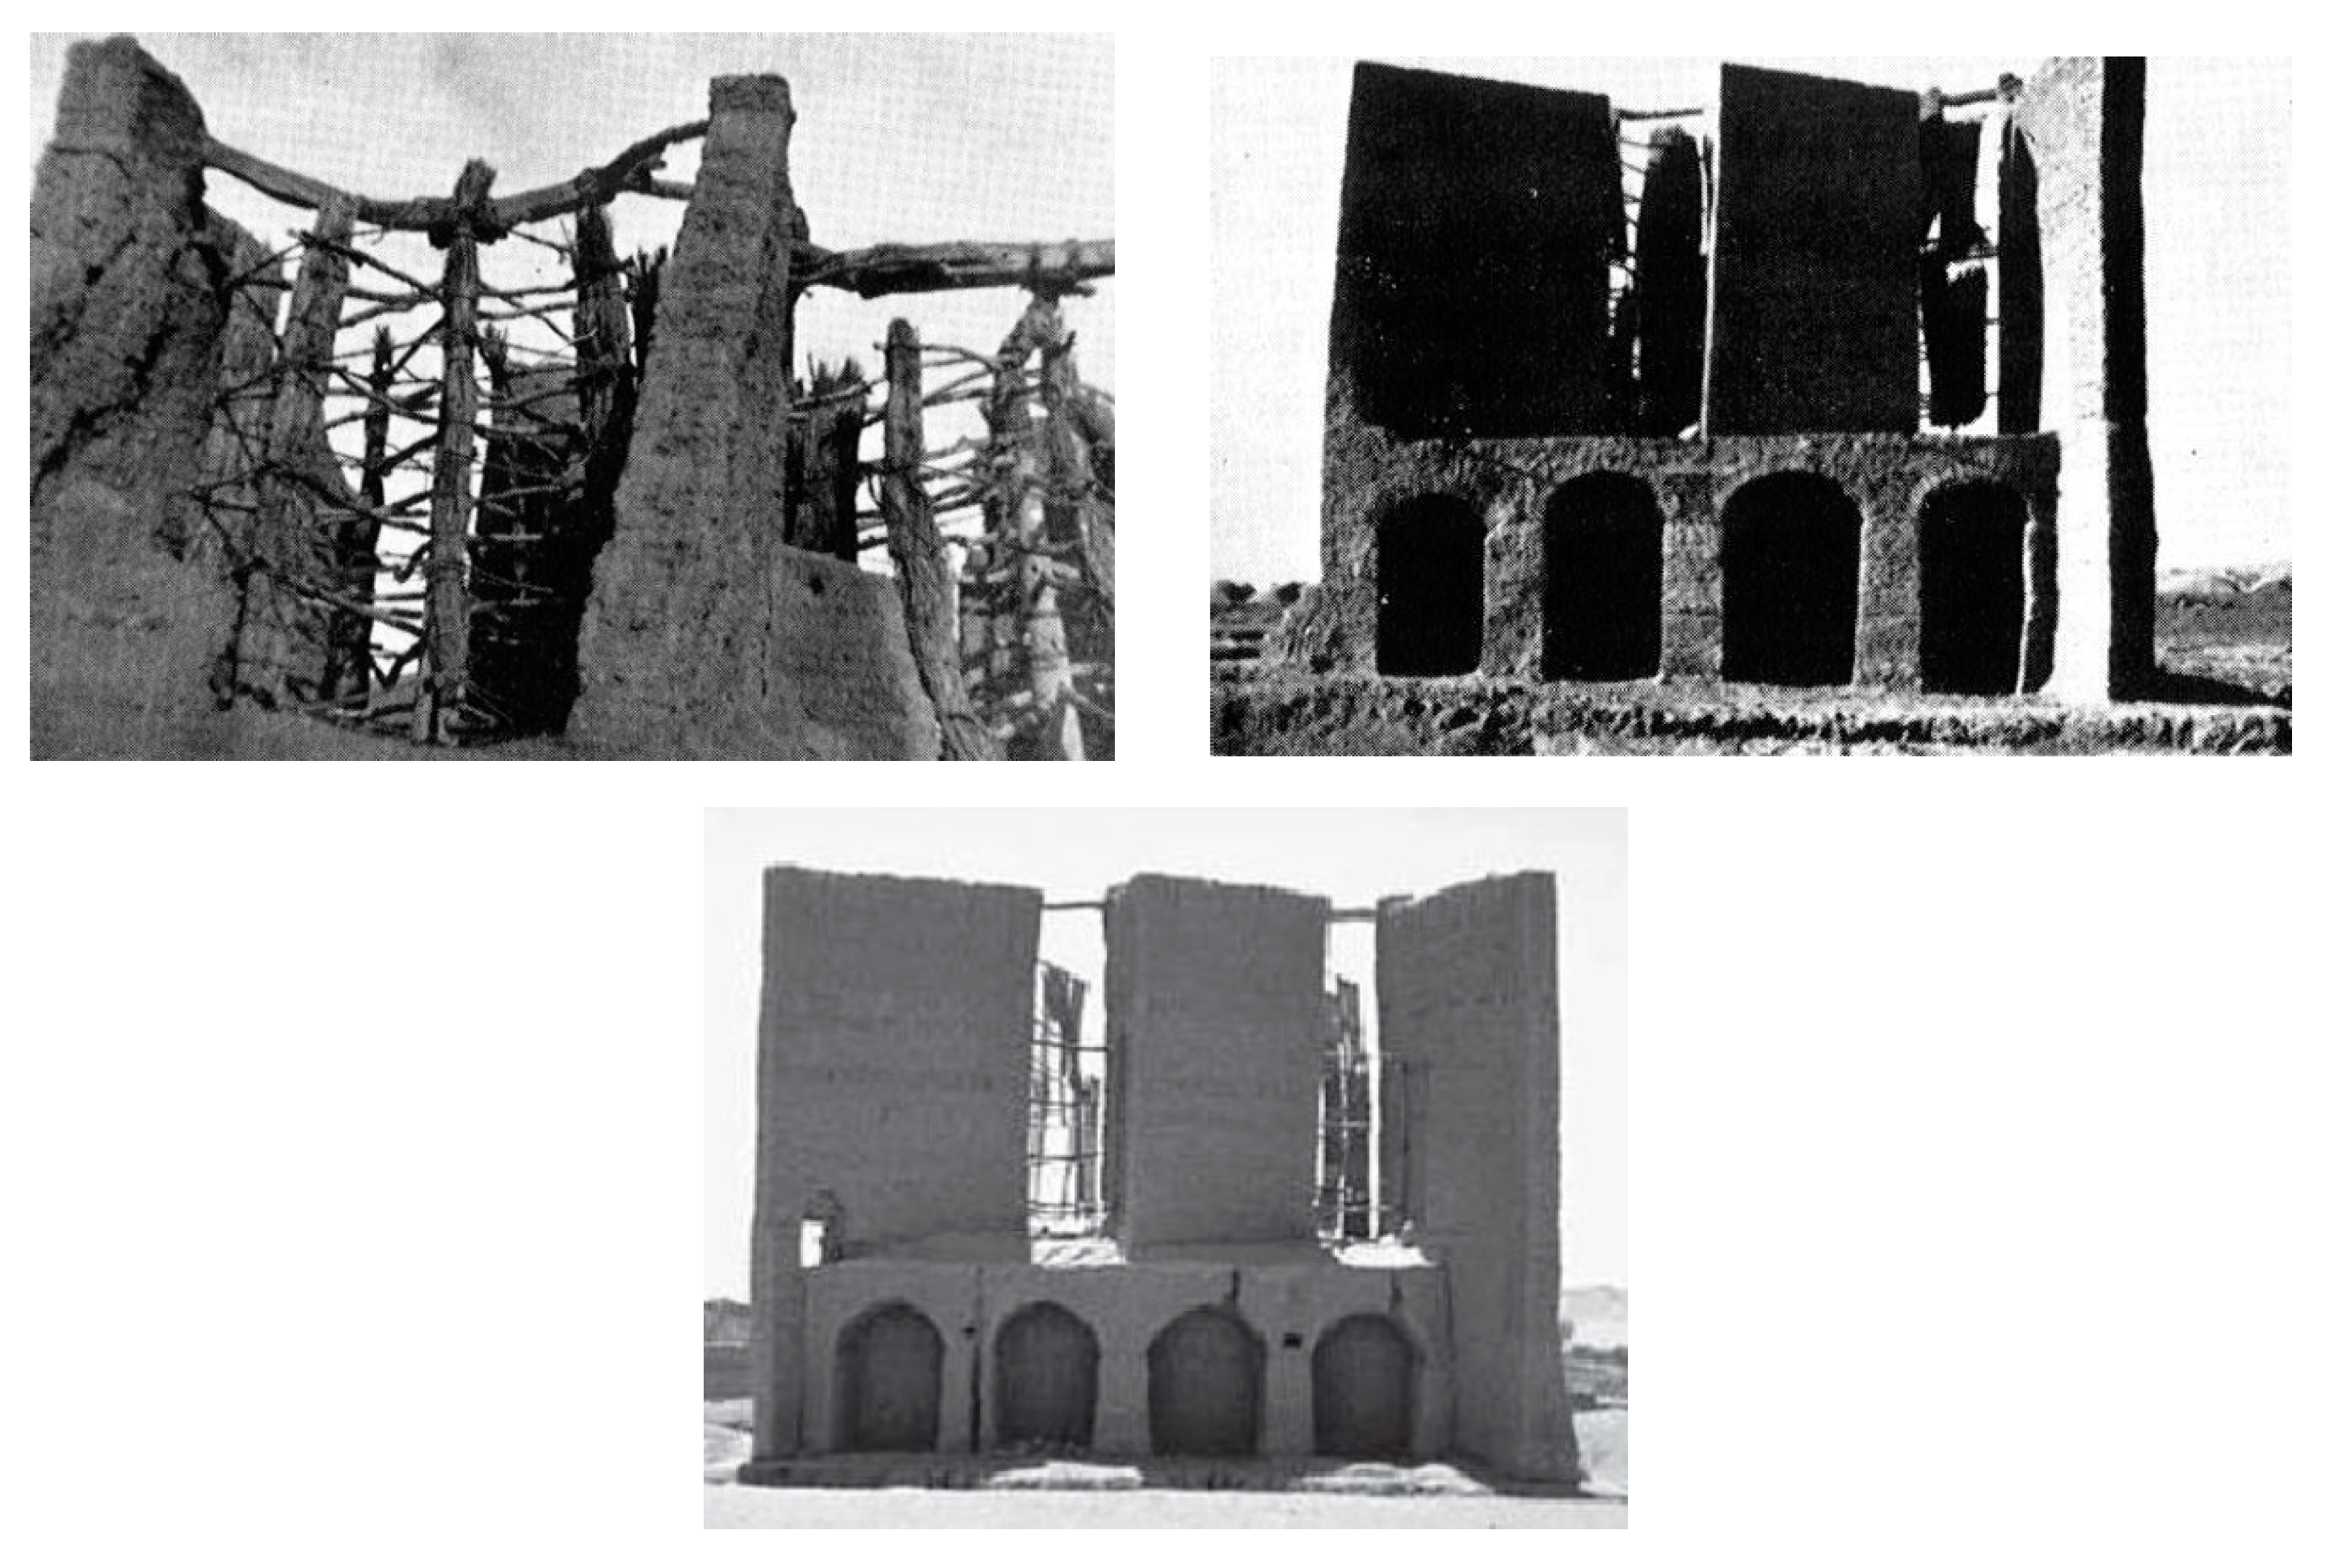
Wind turbines were used as simple devices in about 5,000 BC to meet electrical needs. Iran and Afghanistan are among the first countries to have mastered this industry in a simple way, as shown in
Figure 1, an example of windmills that existed in Sistan and Baluchestan. These windmills are vertical axis. This industry was later formed on a large scale by the United States. Research on wind turbines has continued in two main models, horizontal axis and vertical axis, but recent findings have almost confirmed that these horizontal axis turbines will play a major role in the future of the wind energy industry [
17]. Among the advantages of horizontal-axis wind turbines are lower start-up speed, fewer operational problems, and higher power factor. To extract the maximum possible power from the turbine, the design of the various components must be tested under various operating conditions. To achieve this, software simulation, wind tunnel testing, and field testing are used. Thus, the design of the various components is constantly changing. A new generation of these turbines that have been tested and operated in recent years are capable of increasing the ability to extract wind energy by up to three times.
Recent research in the field of wind turbines suggests that it is possible to increase power extraction by using a conical duct around the rotor. In the early 20th century, Betz [
18] showed using classical physics that the maximum power that can be extracted from the wind in horizontal-axis wind turbines is 50.73%. This limit has since become known as Betz's law. In research by Foreman et al. [
19], it has been shown that using a conical duct around the turbine can achieve high efficiencies, even higher than Betz's coefficients. These results reduce the final cost of wind power and allow for new changes in turbine design.
3. Operation parameters
In general, lift, drag, and torque forces act on an airfoil. Lift is a force that overcomes gravity, and it is defined as the force perpendicular to the direction of airflow. It is caused by the pressure difference across the airfoil surface. Drag is caused by viscous friction on the surface of the airfoil and the imbalance in pressure on the airfoil surface. Torque is the moment resulting from the transfer of the aerodynamic resultant force to a point where the moment is independent of angle of attack. Lift, drag, and torque coefficients can be obtained, respectively, according to below equations:
4. Concepts related to horizontal-axis wind turbines
4.1. Cut-in wind speed
Cut-in wind speed is the minimum wind speed in free stream that can cause the rotor of a wind turbine to start rotating. Cut-in wind speed is one of the fundamental parameters that is shown in the wind turbine power curve and has a significant impact on the amount of energy produced by the turbine.
4.2. Cut-out wind speed
To protect the blades and prevent damage, wind turbines are designed to operate in a specific range of wind speeds. In other words, just as these turbines are not applicable at speeds below cut-in wind speed, they cannot produce energy at cut-out wind speed, and operating at higher speeds will damage them.
4.3. Tip speed ratio
This concept is defined as the ratio of the tip speed of the blade to the wind speed, which is an important parameter in the analysis and design of wind turbine blades. This parameter is reported in Equation 4.
In this equation, ω is the rotational speed of the rotor, R is the radius of the rotor, and V is the wind speed. A high value of this parameter typically indicates a high efficiency of the wind turbine; however, with its increase, the acoustic issue also becomes important. In general, in low-speed wind turbines, this ratio is between 1 and 4, and in high-speed wind turbines, it is between 5 and 9.
4.4. Betz limit
German physicist Albert Betz proved that a wind turbine can extract a maximum of 59% of the wind energy that passes through it. In other words, based on this theory, to obtain the maximum possible energy, the rotor of the wind turbine must be designed in such a way that the flow velocity downstream of the rotor is one third of the upstream flow velocity. Thus, the value of the maximum power coefficient (under ideal conditions) is 0.59.
5. Differences between offshore and onshore wind turbines
Offshore wind turbines are typically three-bladed, while onshore wind turbines are typically two-bladed. In general, three-bladed wind turbines have more mechanical torque than two-bladed wind turbines, but they also have a lower rotational speed. Additionally, the increased drag and lift forces acting on the rotor result in increased resistance to the flow of wind due to the formation of vortices at the blade tips. Onshore wind turbines, which are primarily used to generate electricity, need to operate at higher speeds and therefore do not need as much torque. The main problem with two-bladed wind turbines is the effect of vibration on their performance. This problem is less pronounced in offshore wind turbines with a larger number of blades, and the intensity of vibrations is improved. In fact, it can be said that two-bladed wind turbines have higher noise and wear and tear than three-bladed wind turbines.
6. Geometry of onshore wind turbine
One of the most important applications in the wind turbine industry is its design, which must be done in such a way that it has the most torque and power. After comparing different types of wind turbines, NREL phase vi model wind turbine was selected for modeling. This turbine consists of two blades and has a diameter of 10.058 meters and is designed based on the S809 airfoil. The design of this wind turbine was carried out by Hand et al. [
20], which can be seen in
Table 1, the functional specifications and design of this turbine.
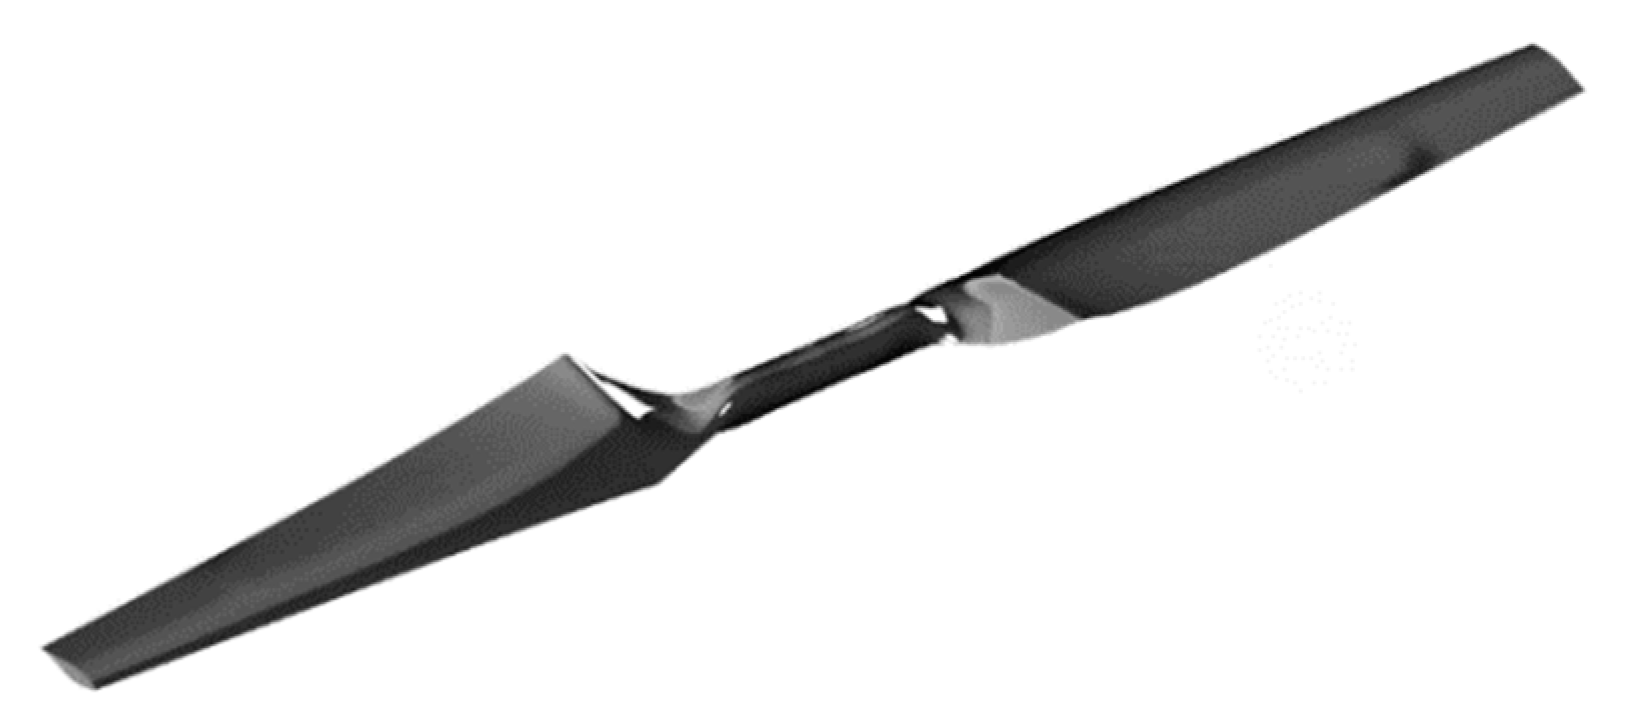
After gradually reducing the chord length, S809 profiles have been used along the length of the blade (from the hub to the tip). The length of the blade is 5.024 meters, which is shown in
Figure 3. This blade consists of 28 different cross-sections, which include two types of circular cross-sections, two types of elliptical cross-sections and 24 cross-sections with S809 airfoil. Airfoils are wrapped in different cross-sections to improve the aerodynamic quality as it rotates. As explained earlier, in this problem, twisting vanes have been used, and their sections and twisting angles change during the span of the vane chord.
7. Geometry of offshore wind turbine
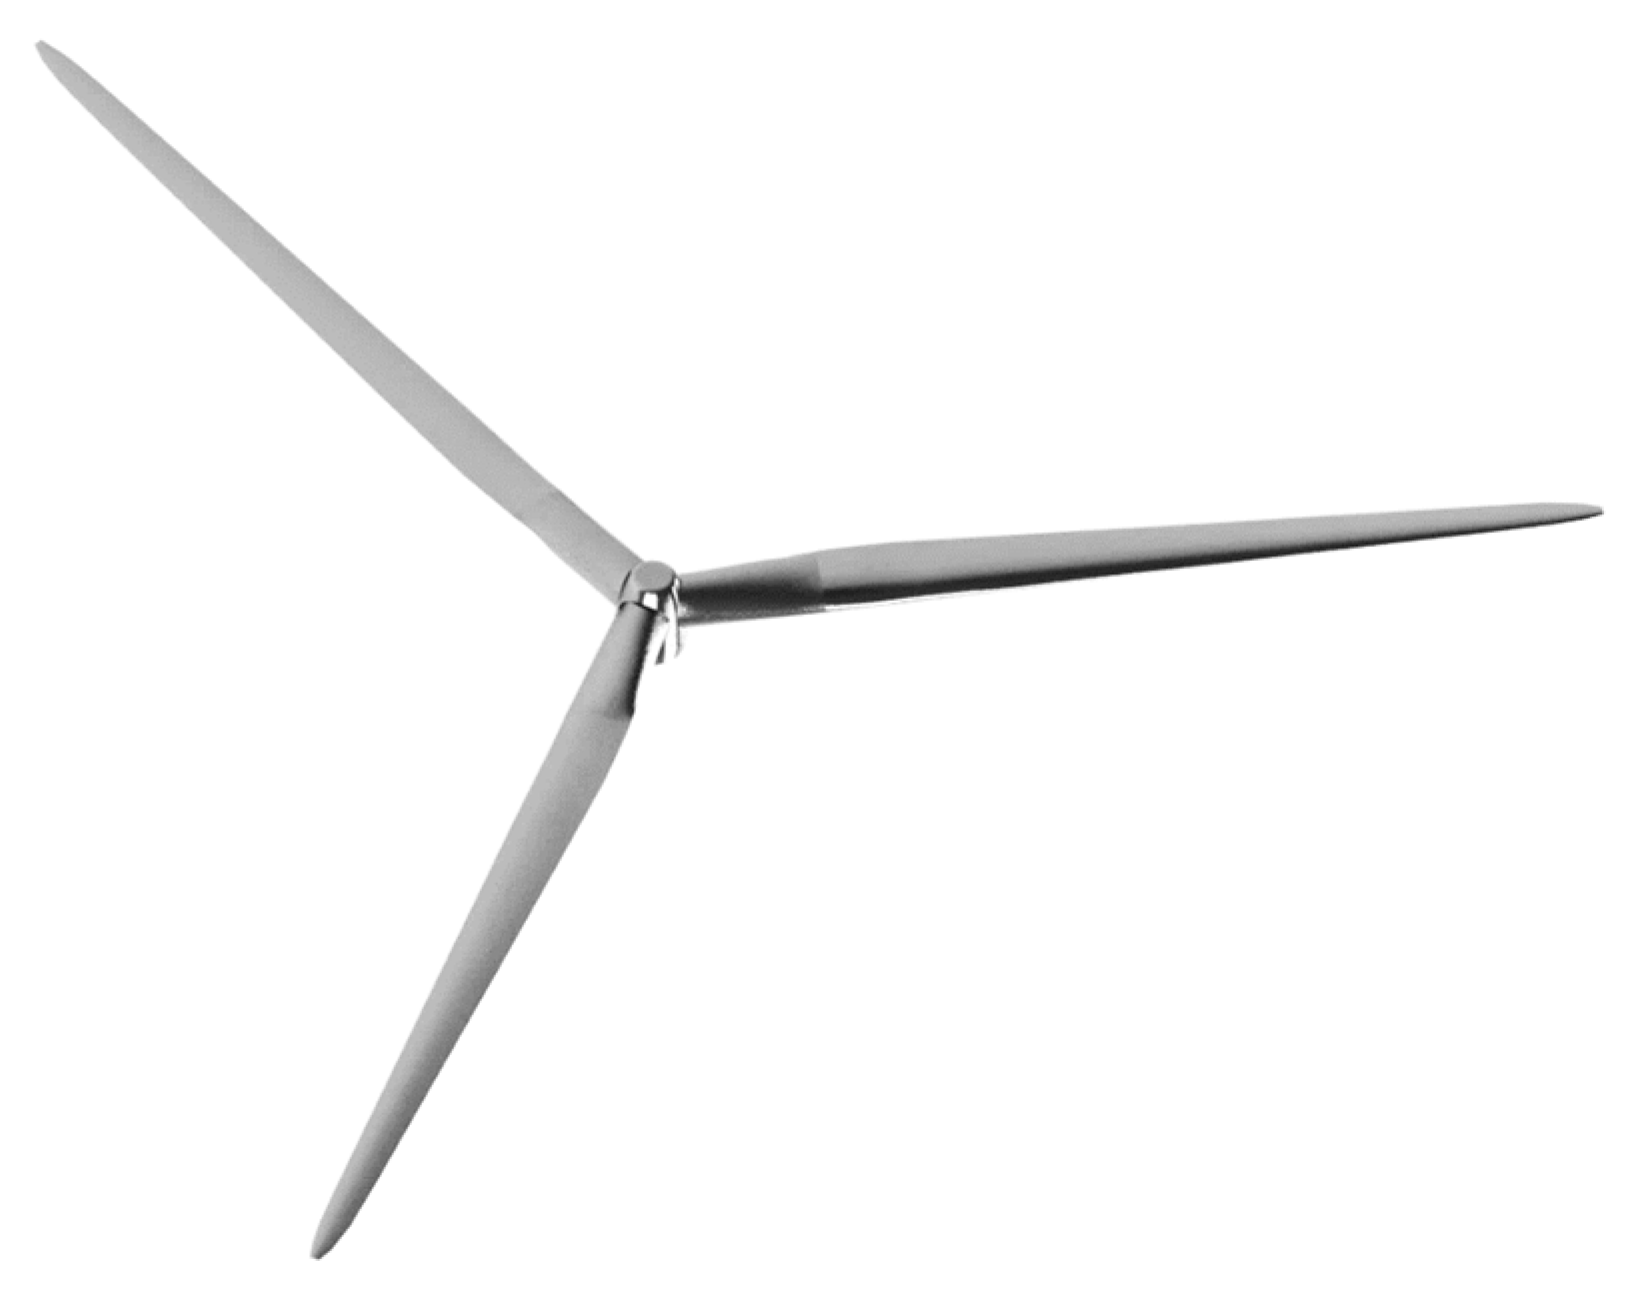
After comparing different types of turbines, NREL's 5 MW offshore wind turbine was selected for simulation according to various articles and reports. This offshore wind turbine has been used in the second and third C-Power projects in northern Belgium. The pre-designed 6 MW DOWEC model has been well modified and with the improvement of the DOWEC project, the 5 MW wind turbine design has reliable results. The blade root section is a complete cylinder. While the hub is the most important part of all three blades, not much information is available regarding the rotor hub. The present work is a new design intended for a ball. Since the hub area is very small compared to the entire rotor area, it will not have much effect in the wind turbine simulation.
Figure 4 shows the wind turbine used for simulation by computational fluid dynamics method.
8. Numerical solution
Computational fluid dynamics has been used for unsteady numerical simulation of both horizontal axis wind turbines. Validation of the results has also been done using experimental data. Three-dimensional averaged Navier-Stokes equations together with SST turbulence model and large eddy simulation turbulence model have been used to calculate and analyze the turbulent flow around the wind turbine for onshore and offshore turbines, respectively. The performance of the offshore wind turbine has been compared with experimental data from the work of Hand et al. [
20]. In fact, to investigate the unstable state of the horizontal axis wind turbine, considering the time step of 0.01 second at the wind speed of 7 m/s, the torque and the vortices formed behind the turbine have been investigated.
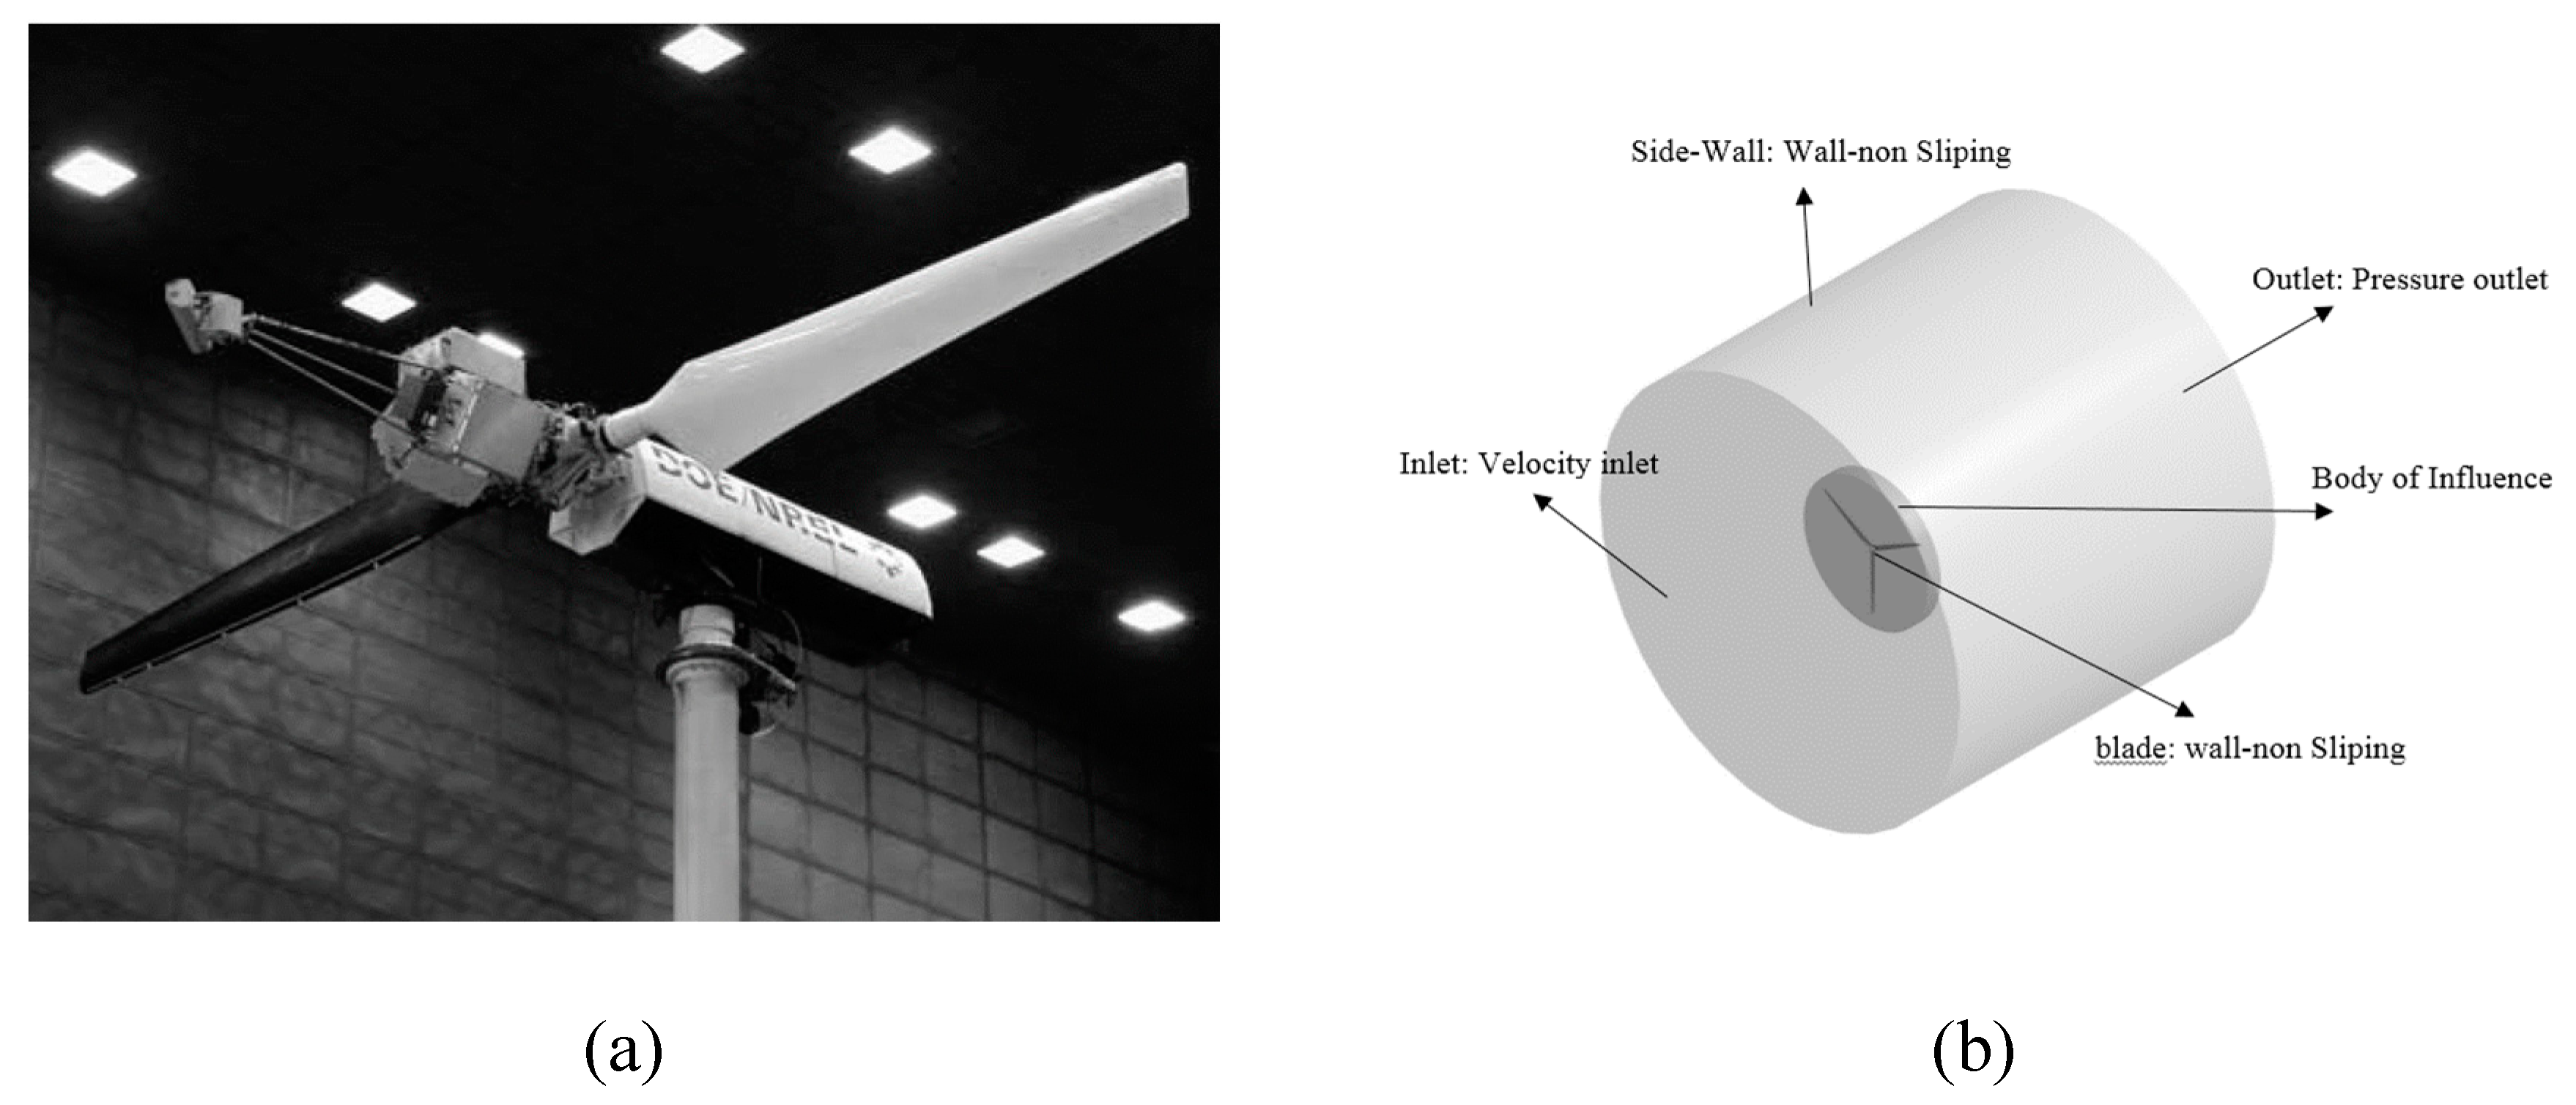
Figure 5 (a) shows the wind turbine tower and blades placed in the wind tunnel for testing. The equations of the simulation model of large eddies describe the evaluation of large eddies and include the stress tensor of the sub-nodal scale that indicates the effects of small scales that are not resolved [
21]. The calculation range for both wind turbines will be the same, so that the input of this range is the uniform speed and the output is the external pressure range. The rotor will be considered as a no-slip wall. Also, the side wall is placed as a wall with a shear stress of 10
-5 Pascal. The effects of the support tower have been omitted in this simulation and only the effects of the rotor have been considered. The computational domain includes a cylinder whose diameter and length are about 6 times the radius of the rotor (
Figure 5 (b)), so that it is 2 times the radius of the rotor in front of the hub and 4 times the radius in the back of the hub. For the occurrence of small vortices behind the rotor, a smaller cylinder with a radius equal to the length of the rotor is used, and the meshing in this area is smaller. In fact, the smaller cylinder will be the penetration part in the meshing, which will increase the meshing density in this area.
8.1. Governing equations
The SST turbulence model is a similar form of the standard k-ω turbulence model, which is defined as equations 5 and 6.
In mentioned equations, Gk
represents the kinetic energy of the turbulence caused by the average velocity gradient. G𝜔 will represent the production of 𝜔. Γk and Γ𝜔 indicate the effective influence of k and ω. Also, Y_k and Y_ω determine the disturbances caused by the term k and ω. D𝜔 is the transverse diffusion term and Sk and S𝜔 are also the source term.
As explained, in the offshore wind turbine, the equations are solved using the turbulence model for simulating large eddies and Navier-Stokes filtering, which will remove the spatial scales. Filter variables are defined as equation 7.
where ϕ is the spatial variable, D is the fluid domain and G is the filter function that solves the scale size of the eddies. Meanwhile, Fluent produces a filtering which, using finite volume discretization, will be equal to:
So that V is the volume of computing cells. The filter function G(x, x’) is defined as equation 9.
For incompressible flow, the averaged Navier-Stokes equations will be equal to:
Where 𝜏ij is the stress tensor caused by molecular viscosity, it is obtained using equation 12.
9. Grid
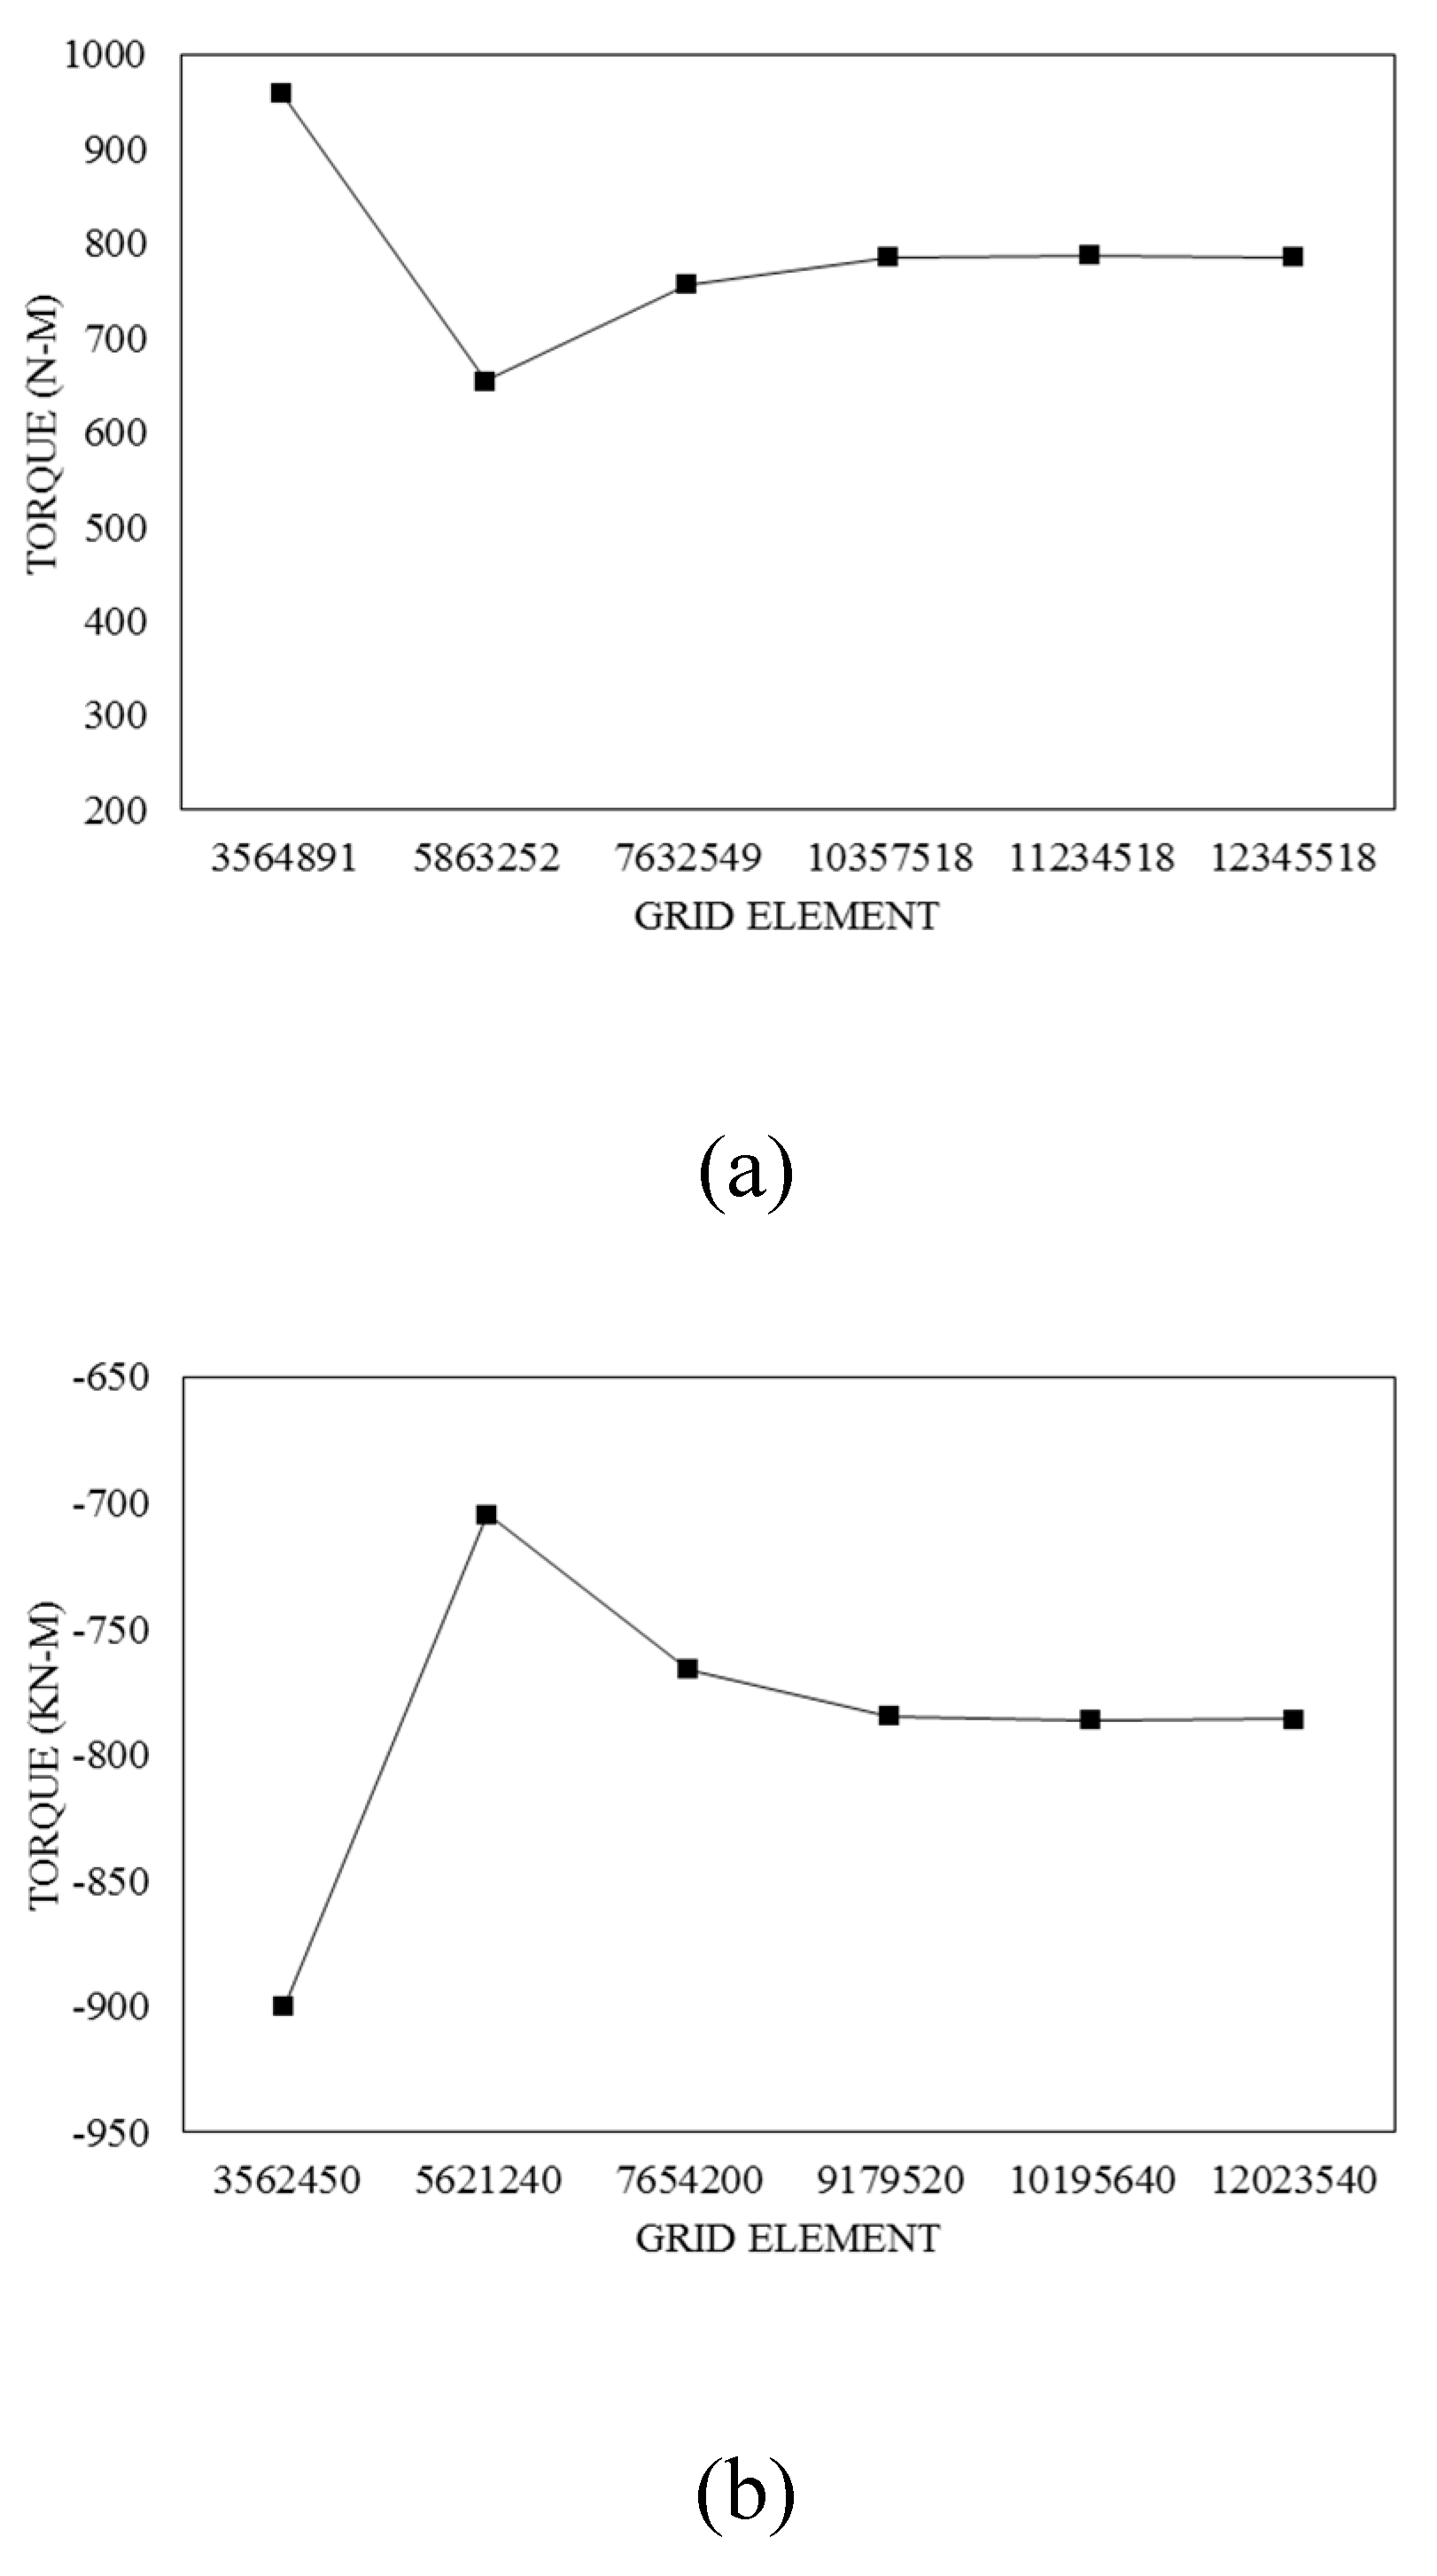
Grid for both wind turbine modes has been done without organization. The cells used in this type of grid will be tetrahedral. In order to check the accuracy of the problems, the grid independence test was used and after checking different grids, finally the best type of grid was selected (
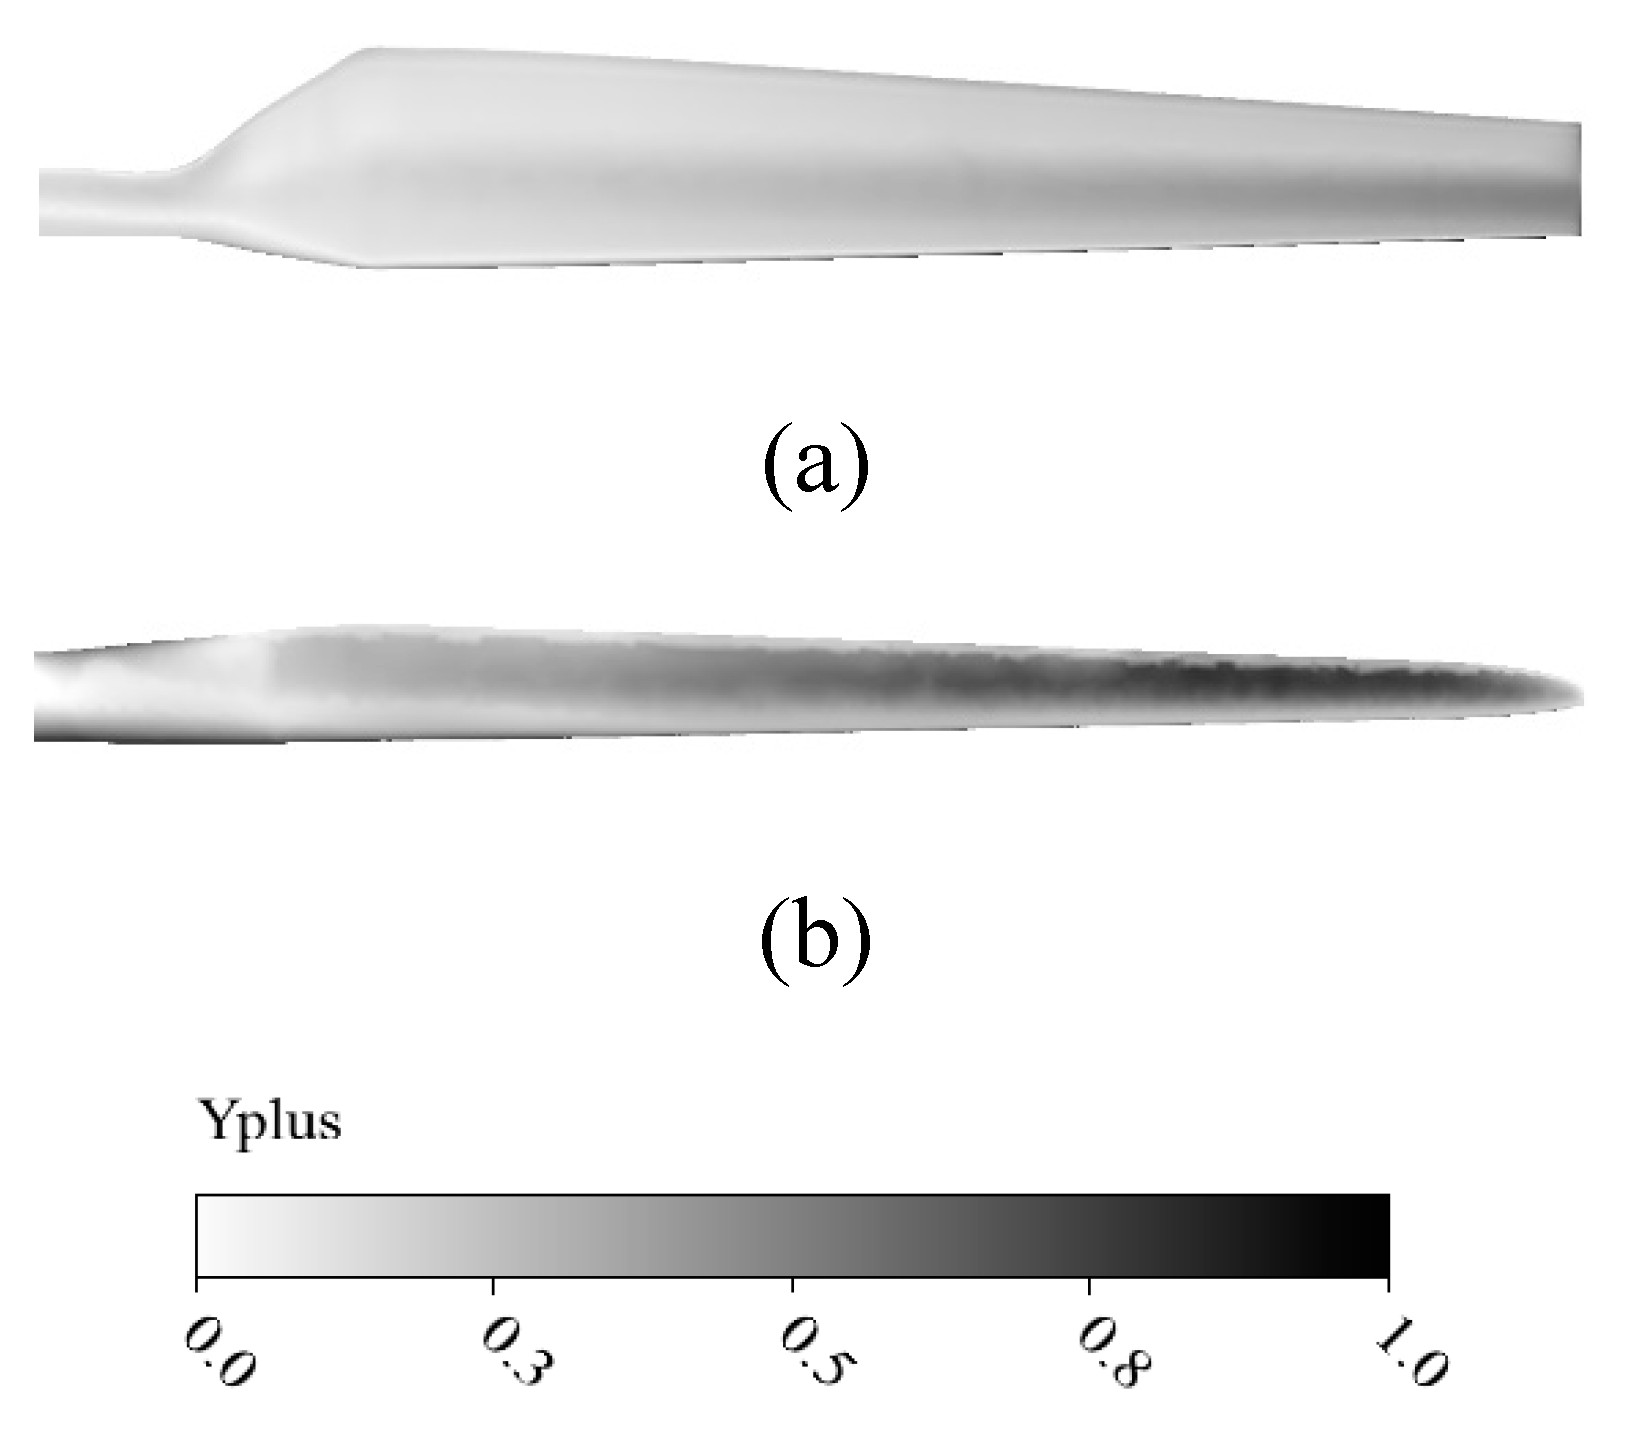
Figure 6). In both cases of wind turbine, the number of boundary layers is considered equal to 20. The value of y
+ in this grid is less than one, which can be seen in
Figure 7, the contour of y
+ along the length of the blade. As it can be seen, the value of y
+ at the tip of the blade will be greater than its root, and the reason for it can be considered to be the increase in speed at the tip of the blade according to the relation y
+.
10. Results
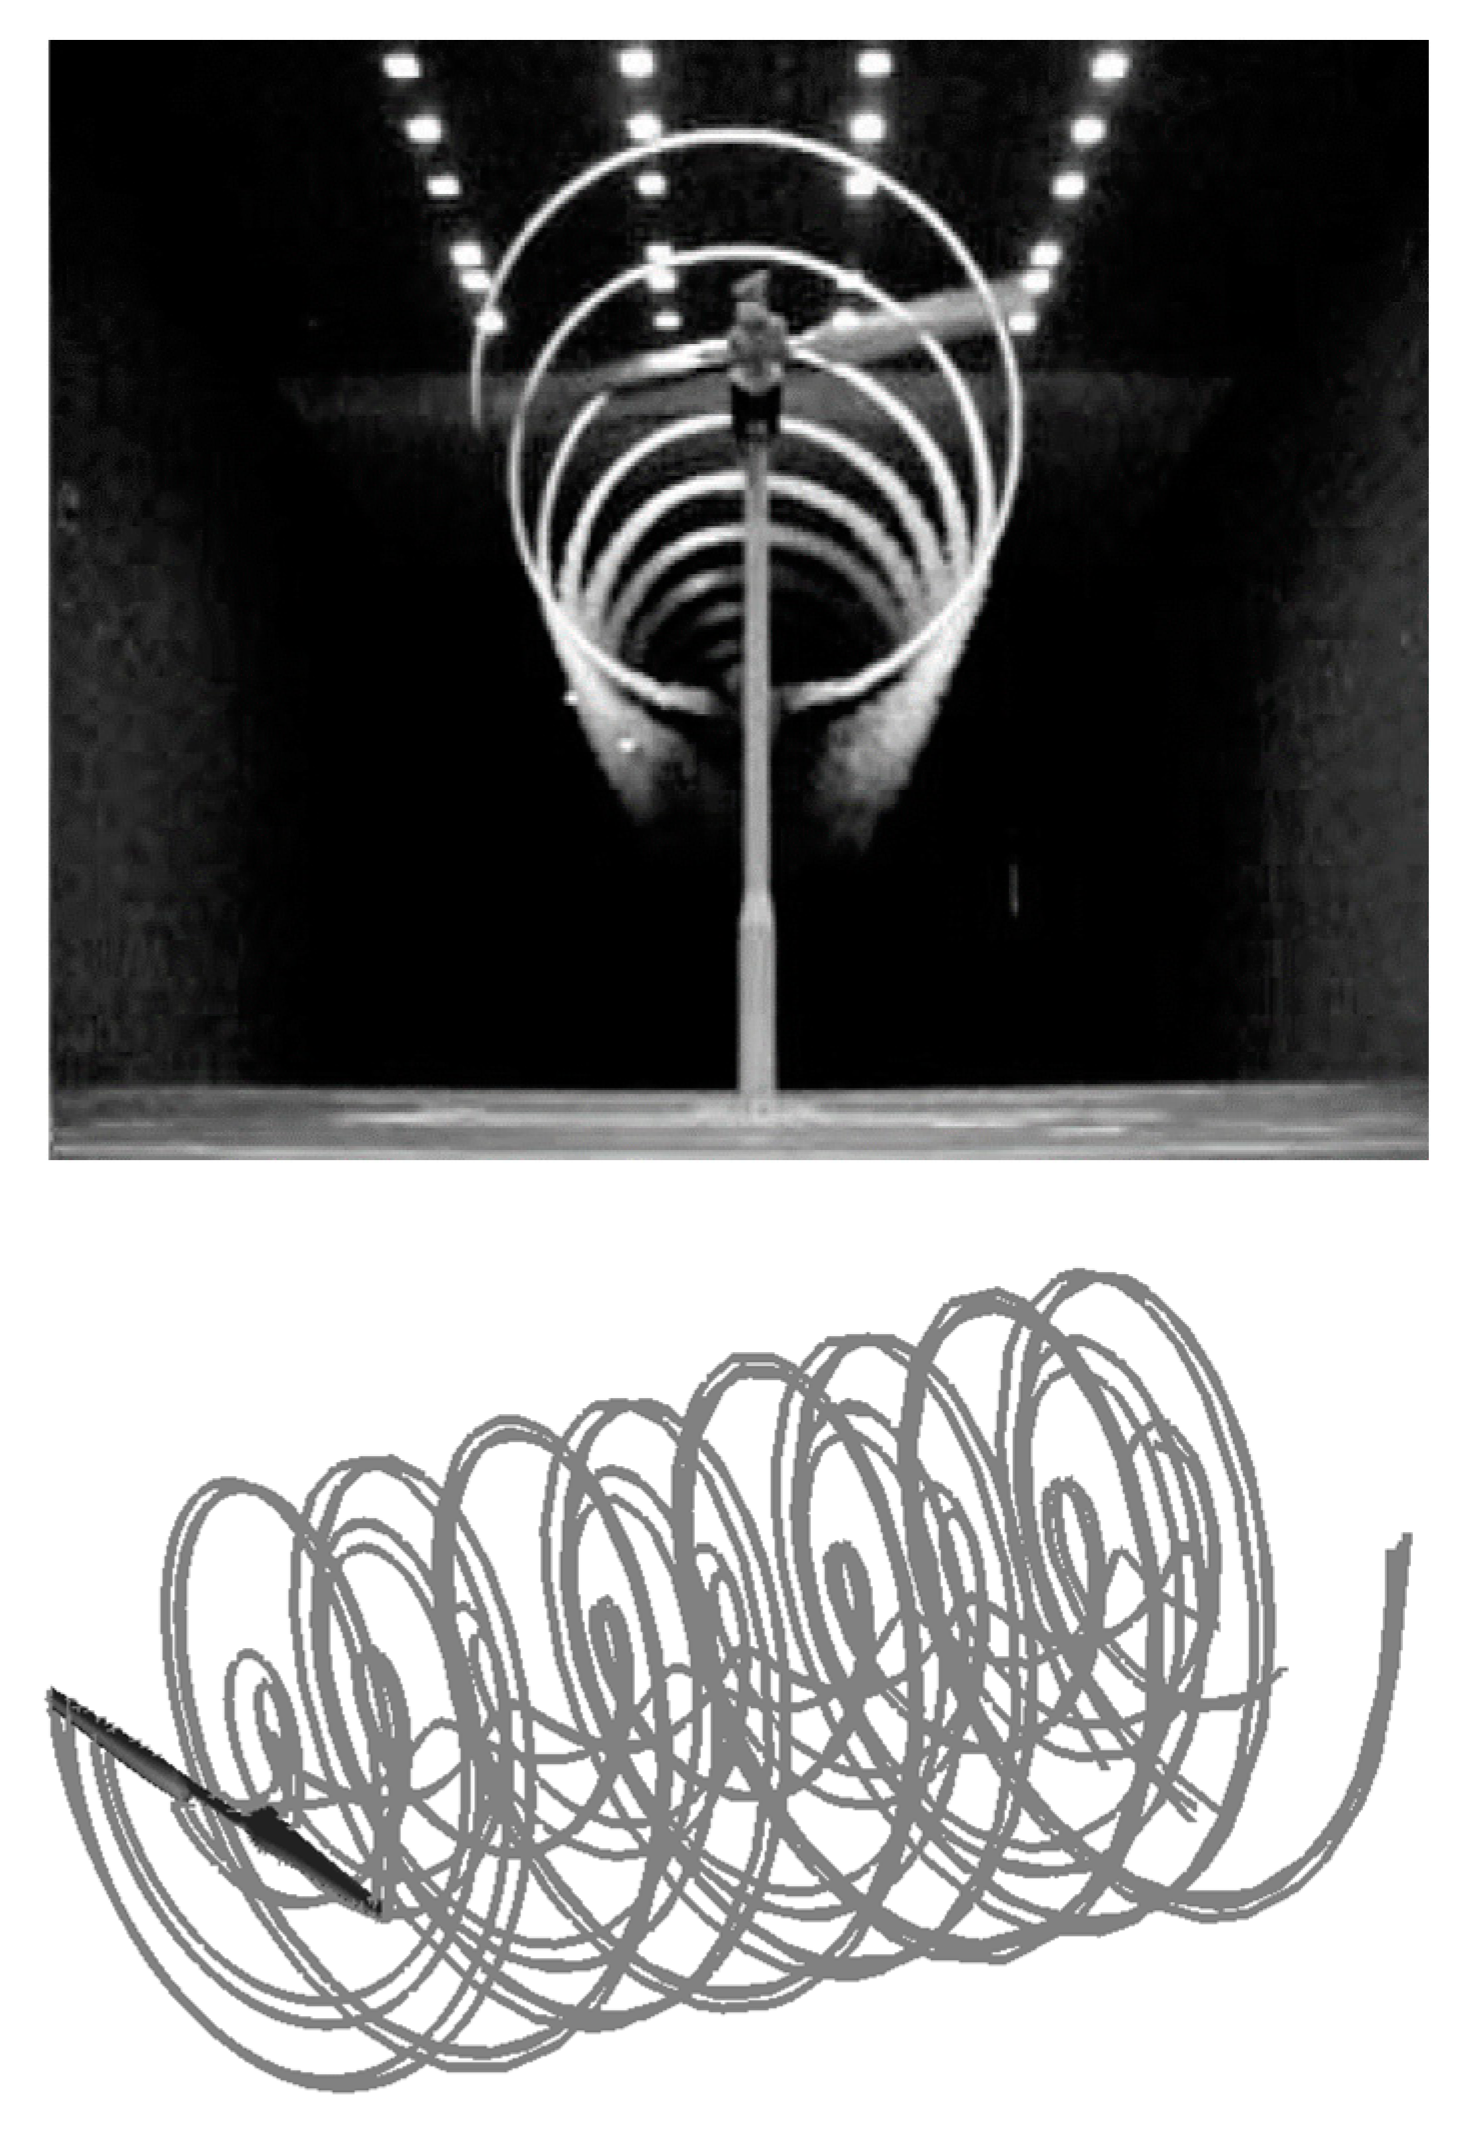
Onshore wind turbine: Aerodynamic tests have been conducted on the turbine blade in a wind tunnel. One of the issues that is also of particular importance is the examination of the vortices formed due to the tip of the blade, the results of which are shown in
Figure 8. In
Figure 8, the lower part of the vortices formed behind the wind turbine due to simulation is shown, and the upper part is the vortices formed using the wind tunnel test.
The results obtained in unsteady state for the turbine are presented below.
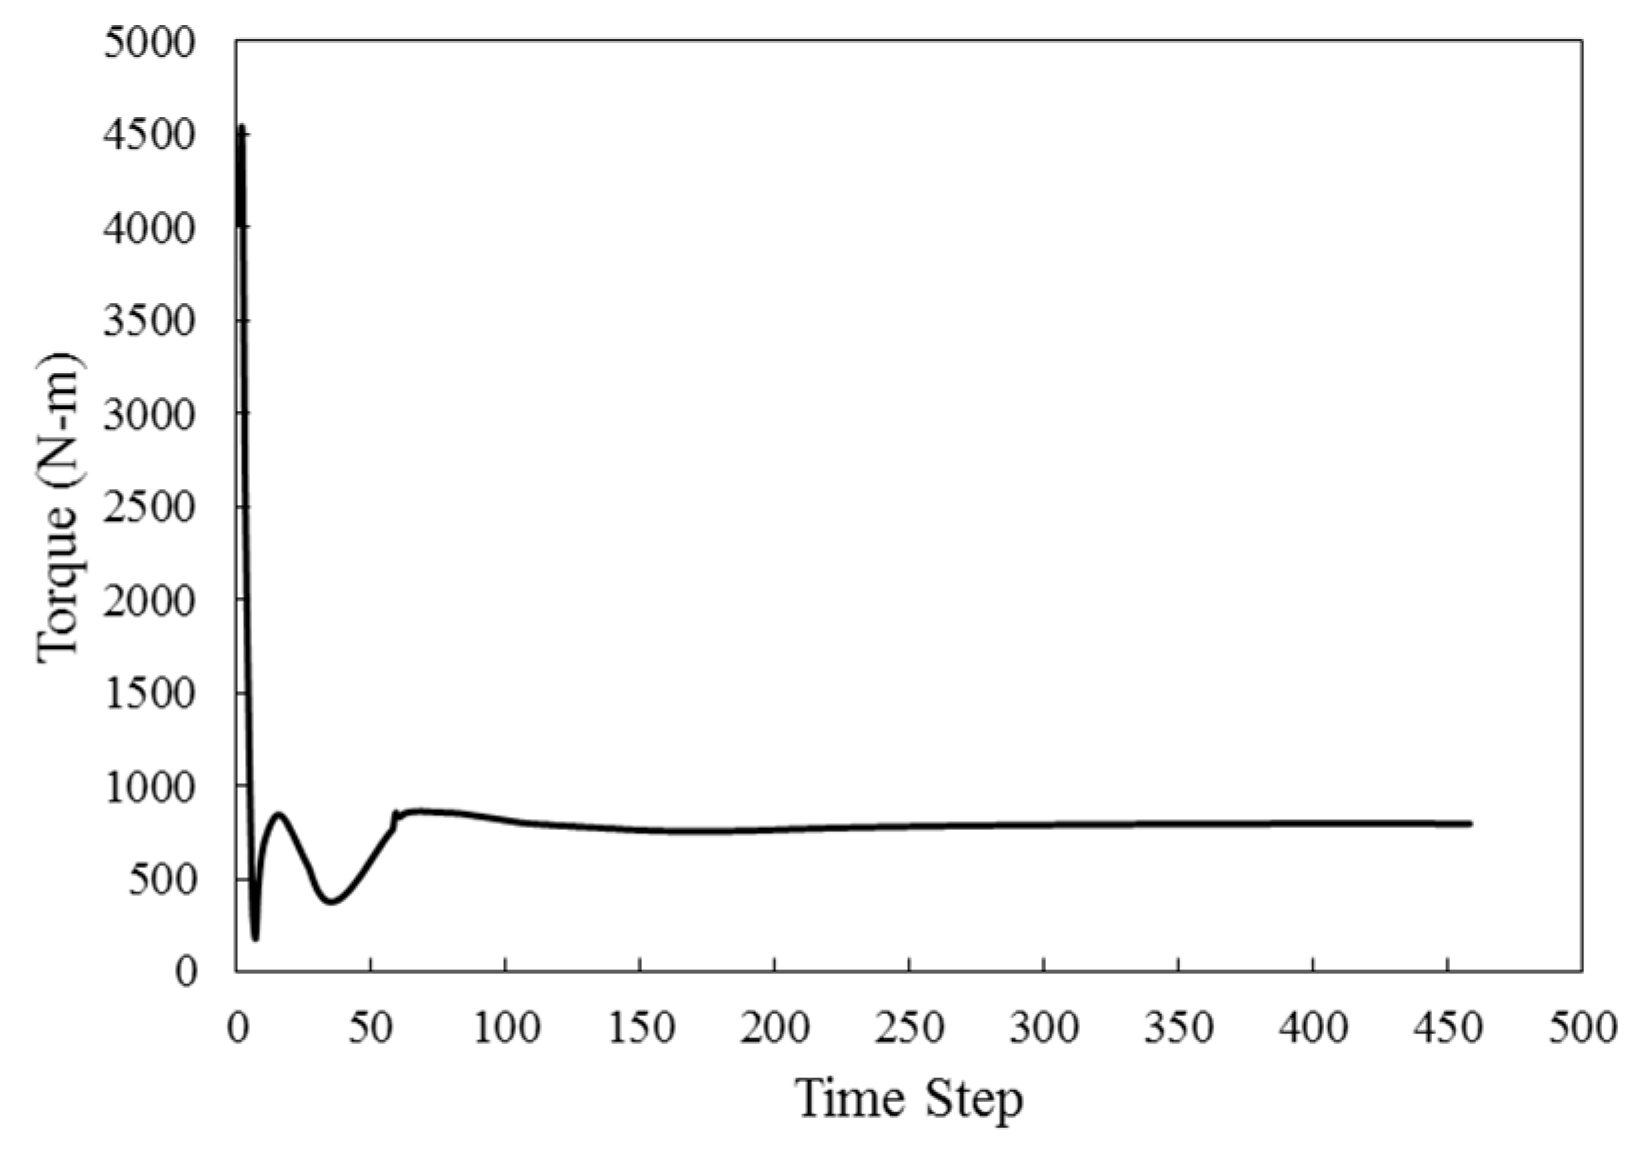
Figure 9 shows the distribution of the torque created on the wind turbine, which changes over time and finally becomes stable and shows a constant value. As it is known, most of the torque occurs in a smaller time step and the solution becomes stable over time.
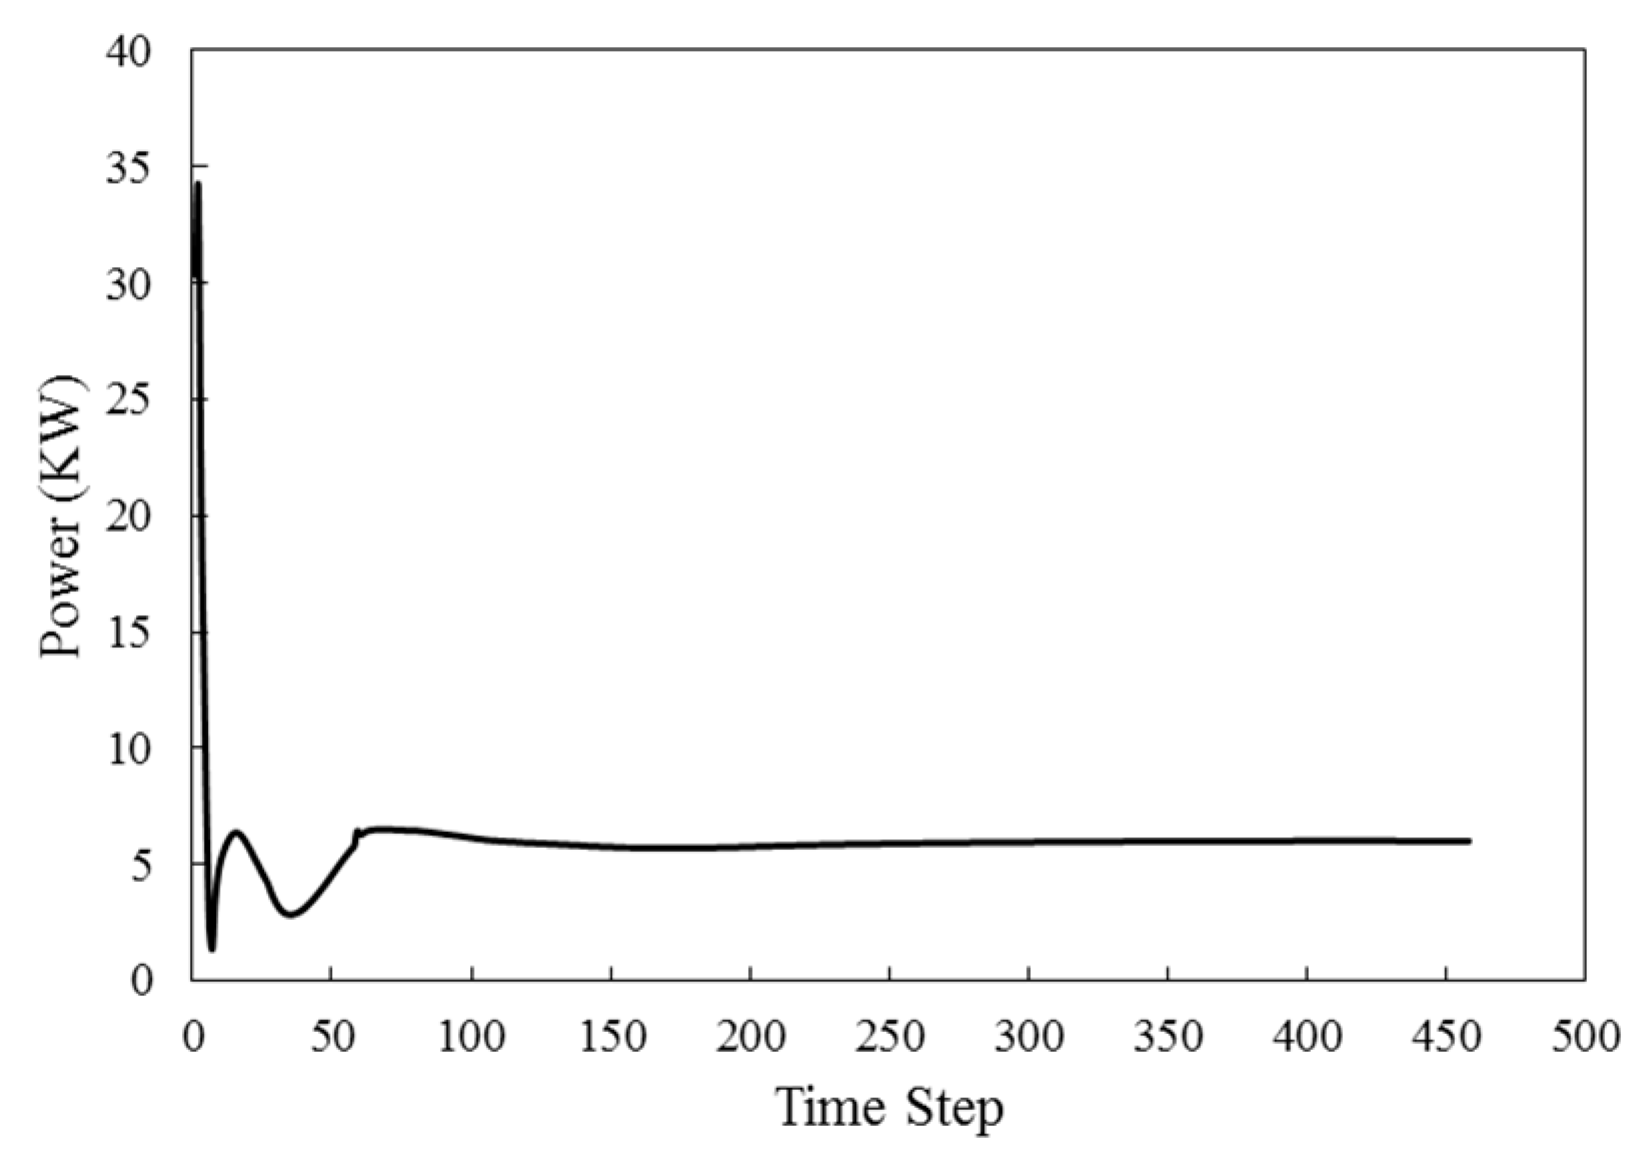
Figure 10 shows the mechanical power generated by the turbine blade. Since the mechanical power is of the type of torque and is related to it, the way of changes is the same as the diagram in
Figure 9.
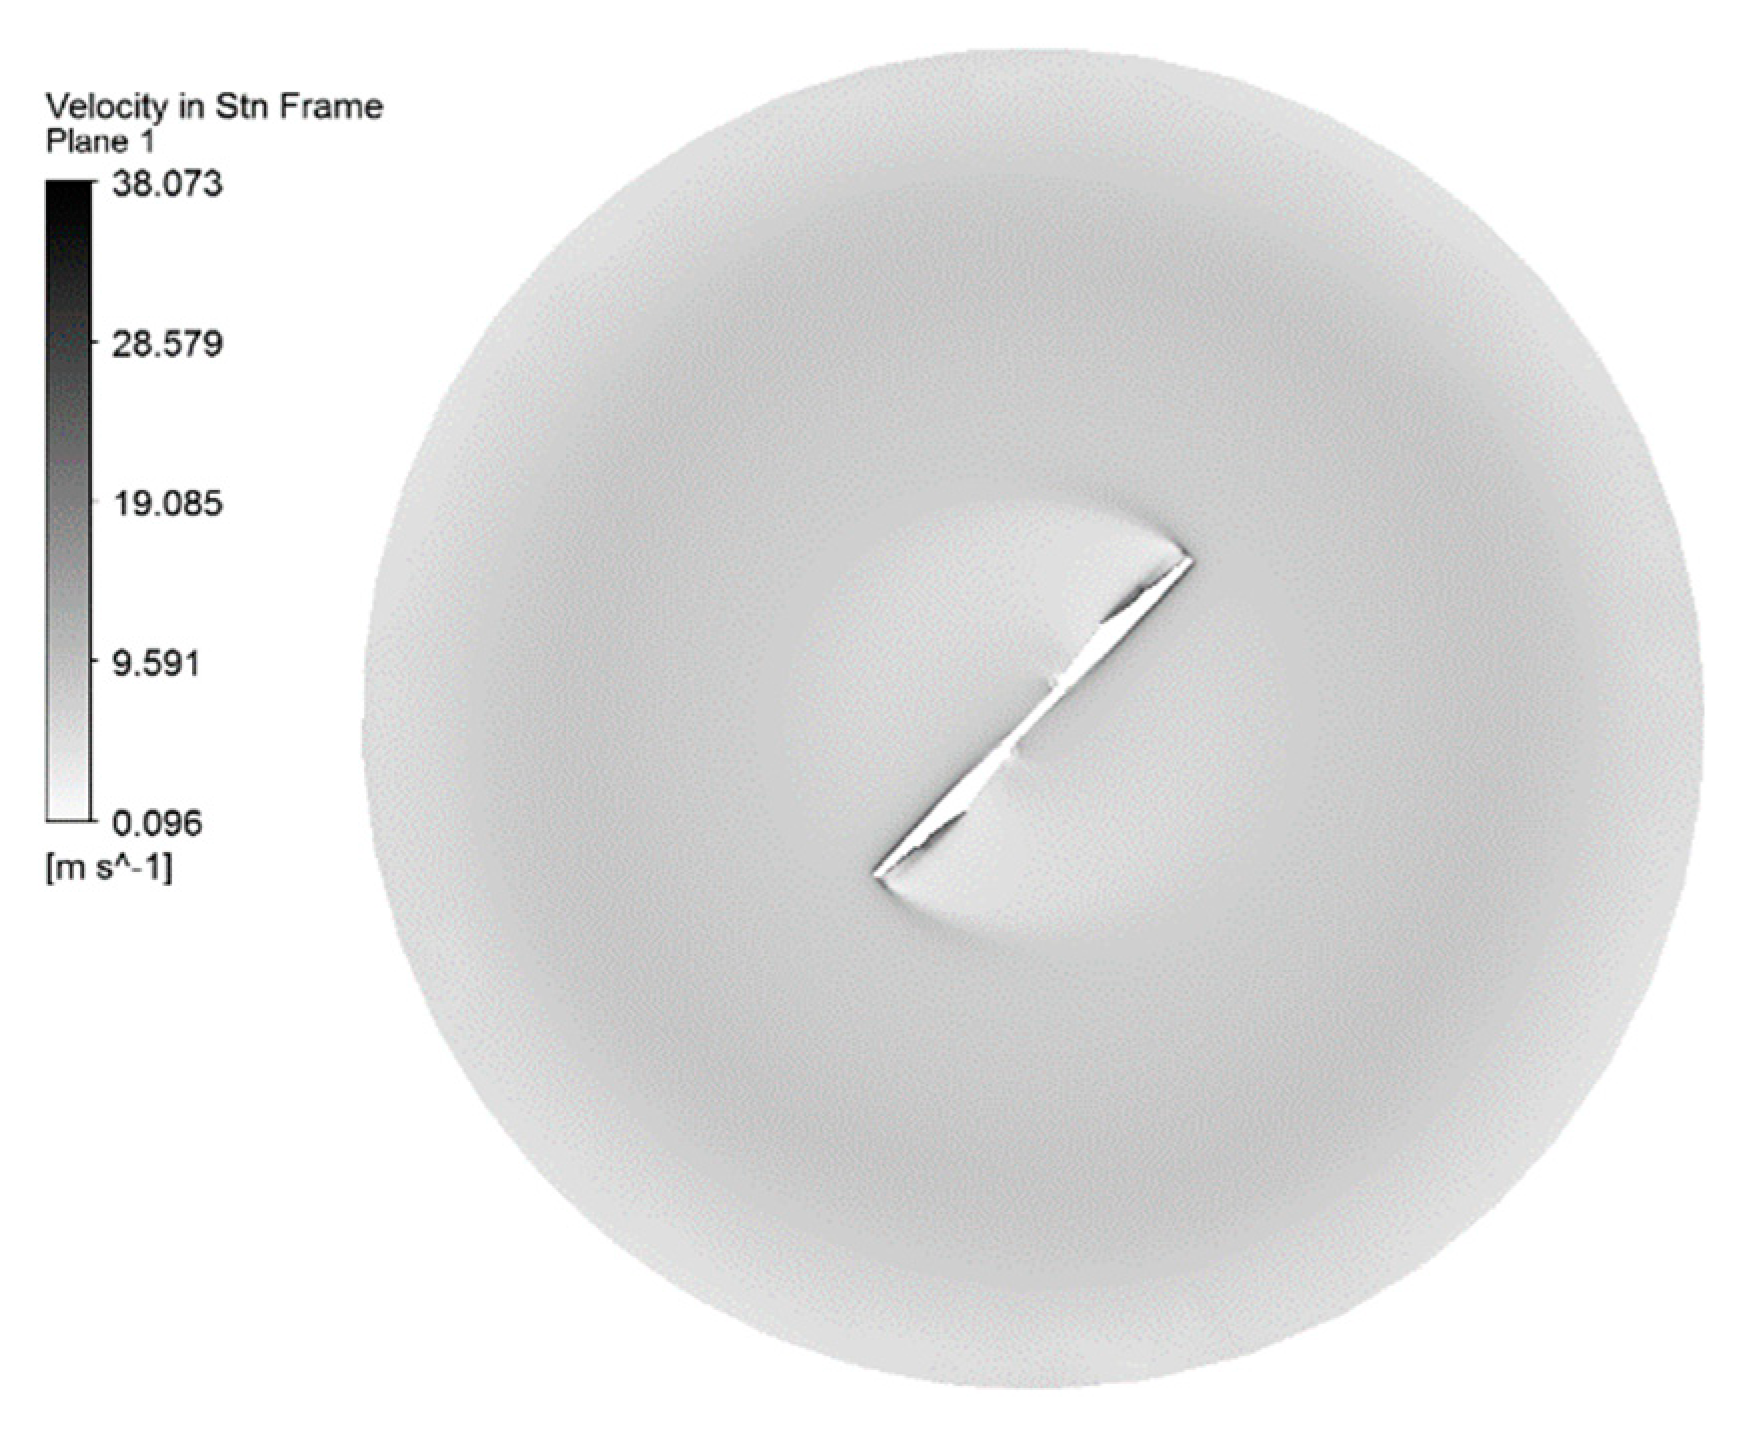
The velocity contour in the plane passing through the blade center (front view) is shown in
Figure 11. These results were obtained at time t=4s and wind speed of 7 m/s. According to
Figure 11, the speed changes can be clearly seen. It is also known that the speed at the tip of the blade has its highest value and it is determined by the clockwise rotation of the vortices formed behind the blade.
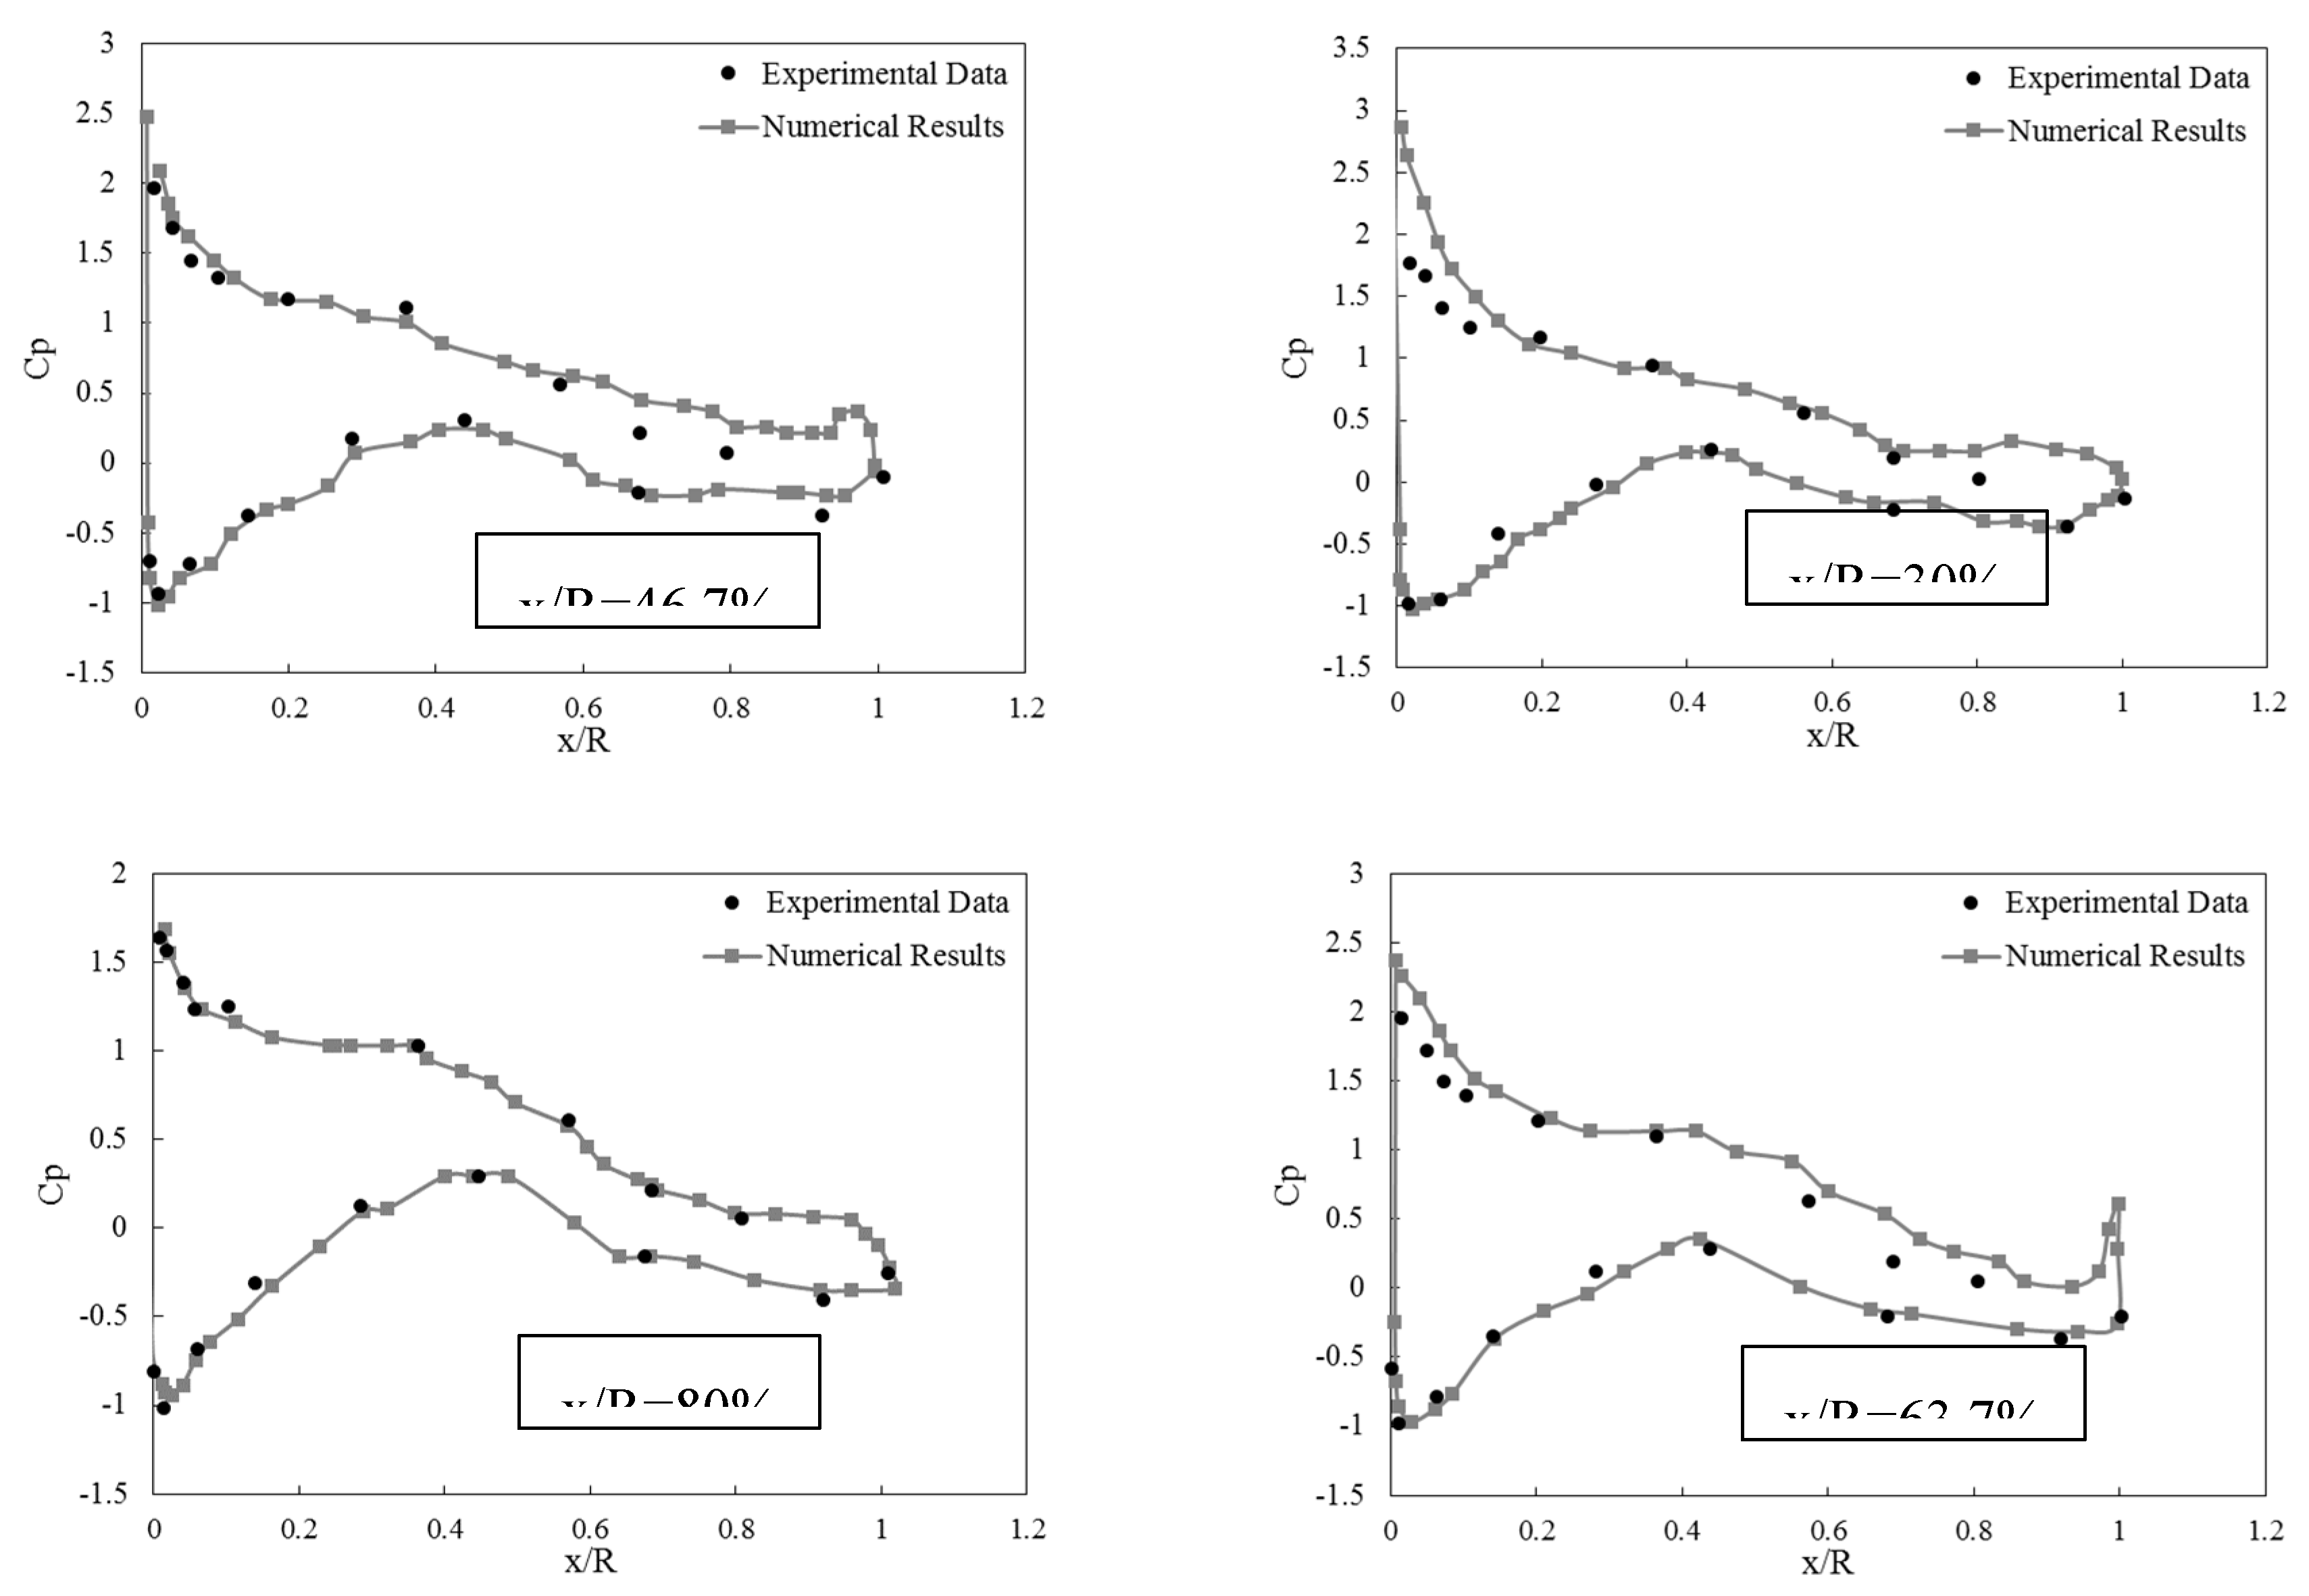
Figure 12 shows the comparison of the pressure distribution resulting from the numerical solution with the experimental data obtained in an unsteady state and a wind speed of 7 m/s. These results are simulated according to the work of Ghadimi and Nejat [
22]. These results were obtained in five sections x⁄ (R=30, 46.7, 63.7, 80, 95%). The numerical solution results are close to the experimental data with very good accuracy. According to the diagram, it can be seen that at some points in the front line and the end line, there is a little difference in the results, which will be caused by the angle of attack, which is present in the experimental results.
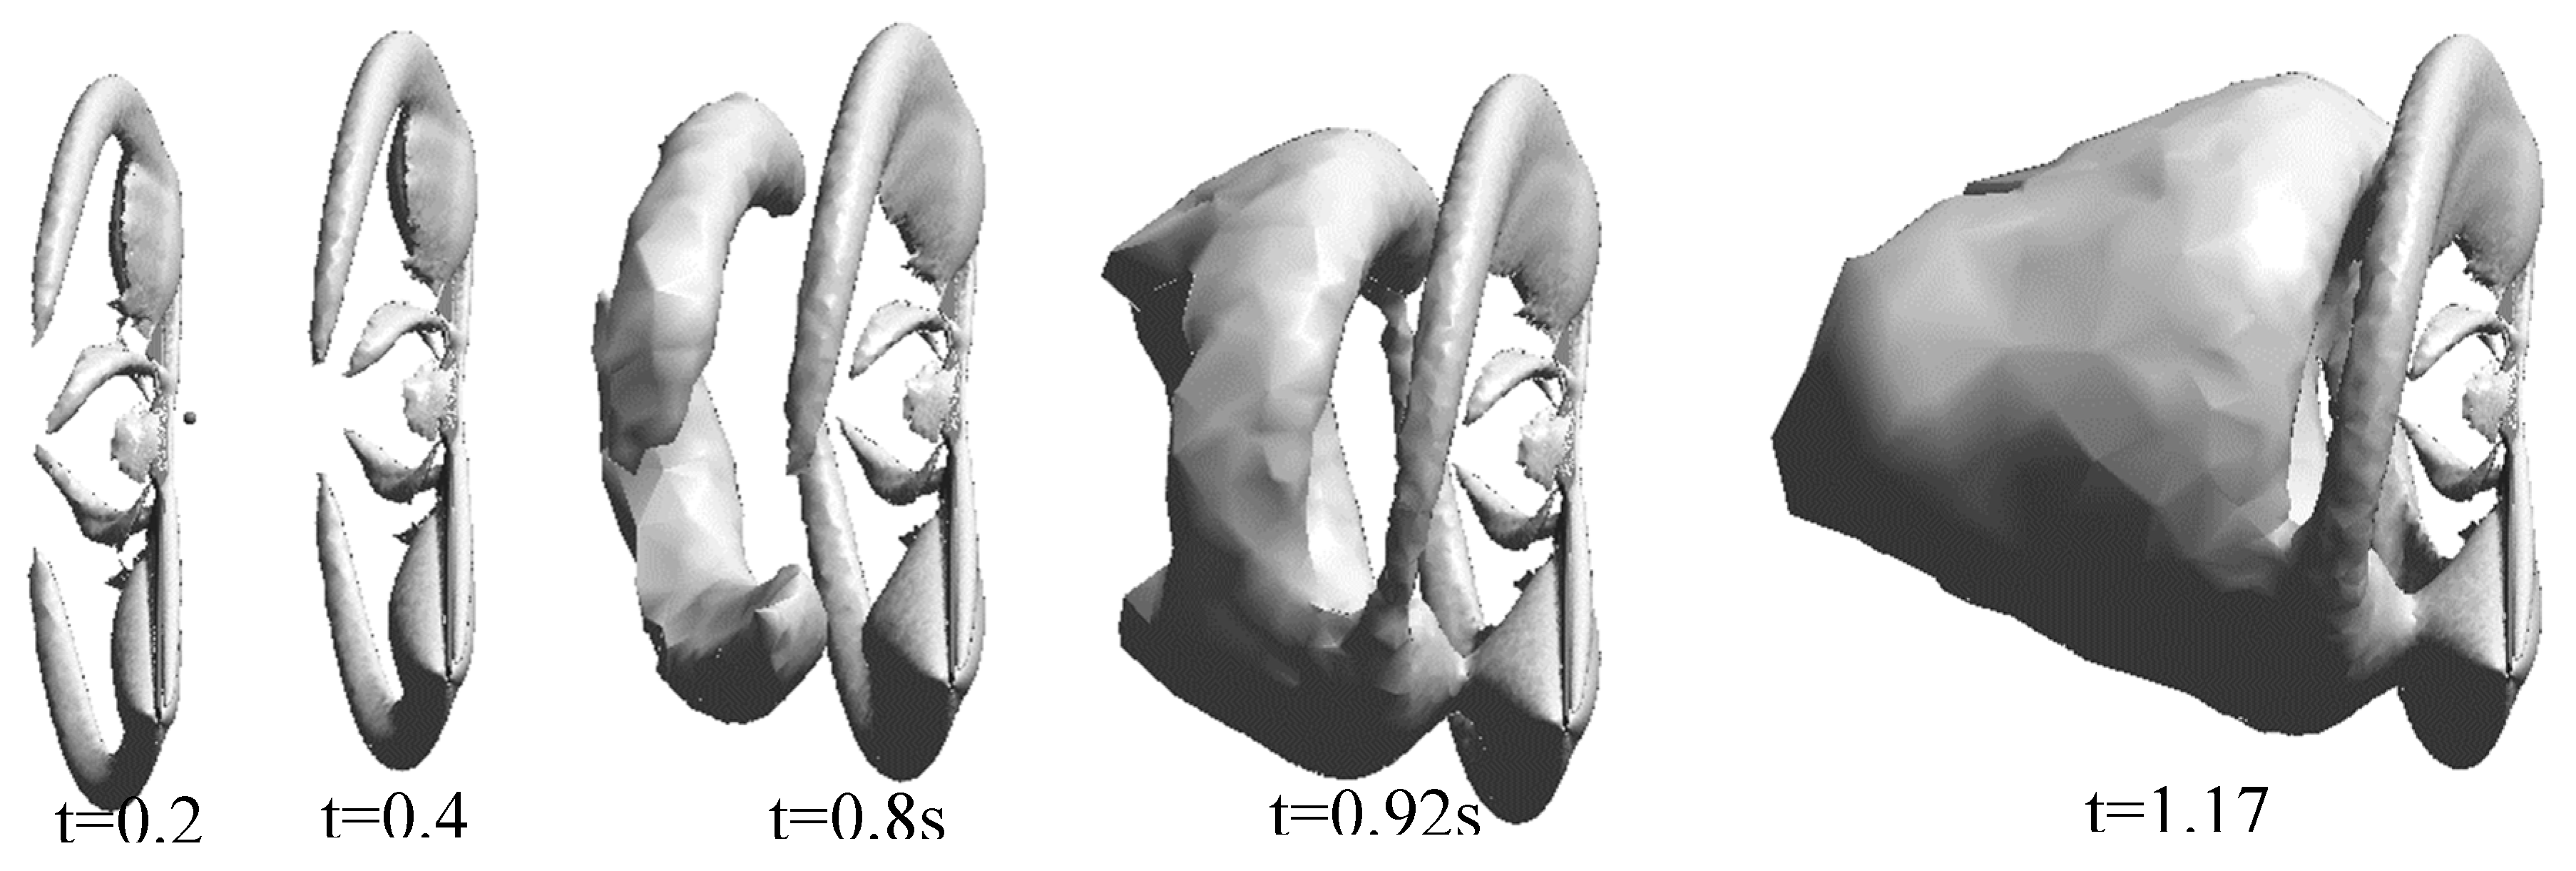
Figure 13 shows the volume of vortices formed on the turbine blade obtained at times 0.27, 0.47, 0.8, 0.92, and 1.17 seconds, respectively. The white volume created on the turbine blade represents the vortices created by the wind turbine. As time increases, the volume of the formed vortices will also increase. In fact, with increasing time, the vortices become like a twisting state or so-called torch. The area behind the hub will be related to the hub vortex, which is less than the tip of the blade. It is also worth mentioning that with the increase of time, the continuity in the vortices will increase.
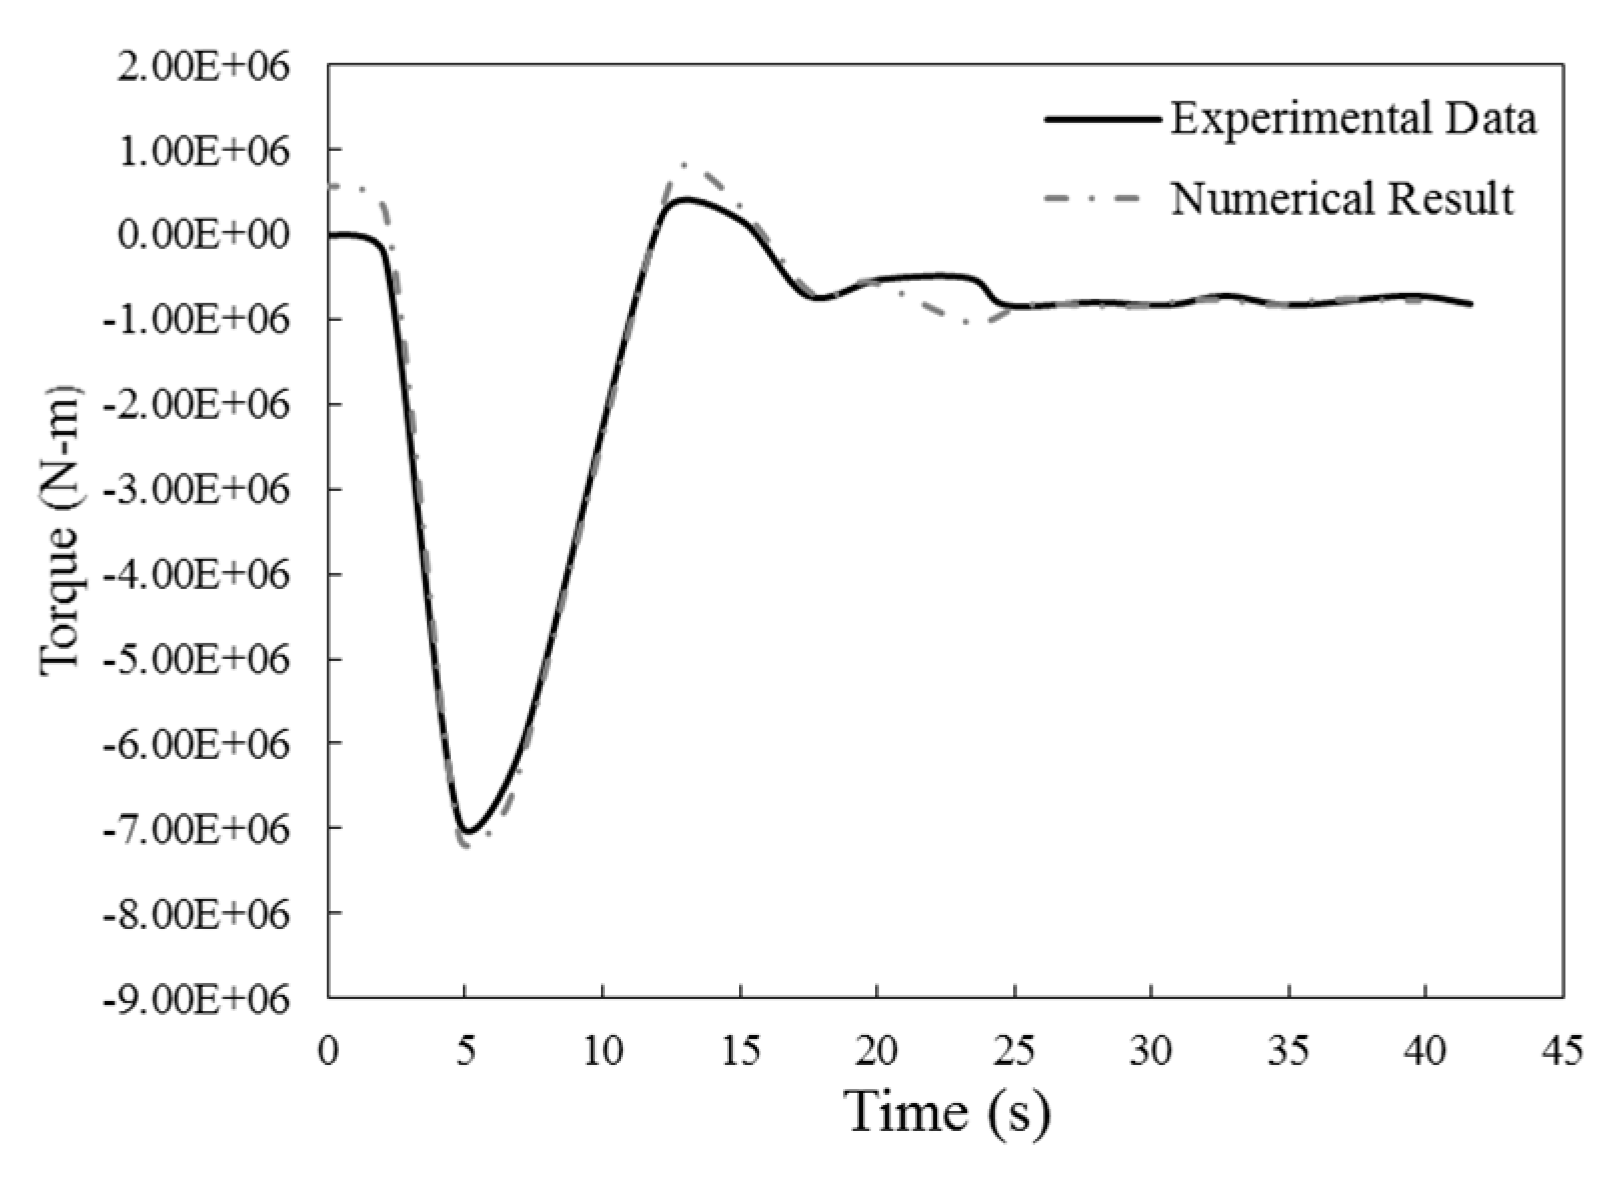
Offshore wind turbine: As explained earlier, the wind speed in this condition was 9 meters per second. The convergence diagram of the wind turbine torque at a time step of 0.01 seconds is shown in
Figure 14, which is compared with the data of Wang [
19]. As it is clear, the results are very accurate. The difference in the graph occurred mostly in the first seconds, which will be due to the difference in the solution methods. Over time, the torque value has stabilized and the difference has reached the minimum possible value. It can also be seen in
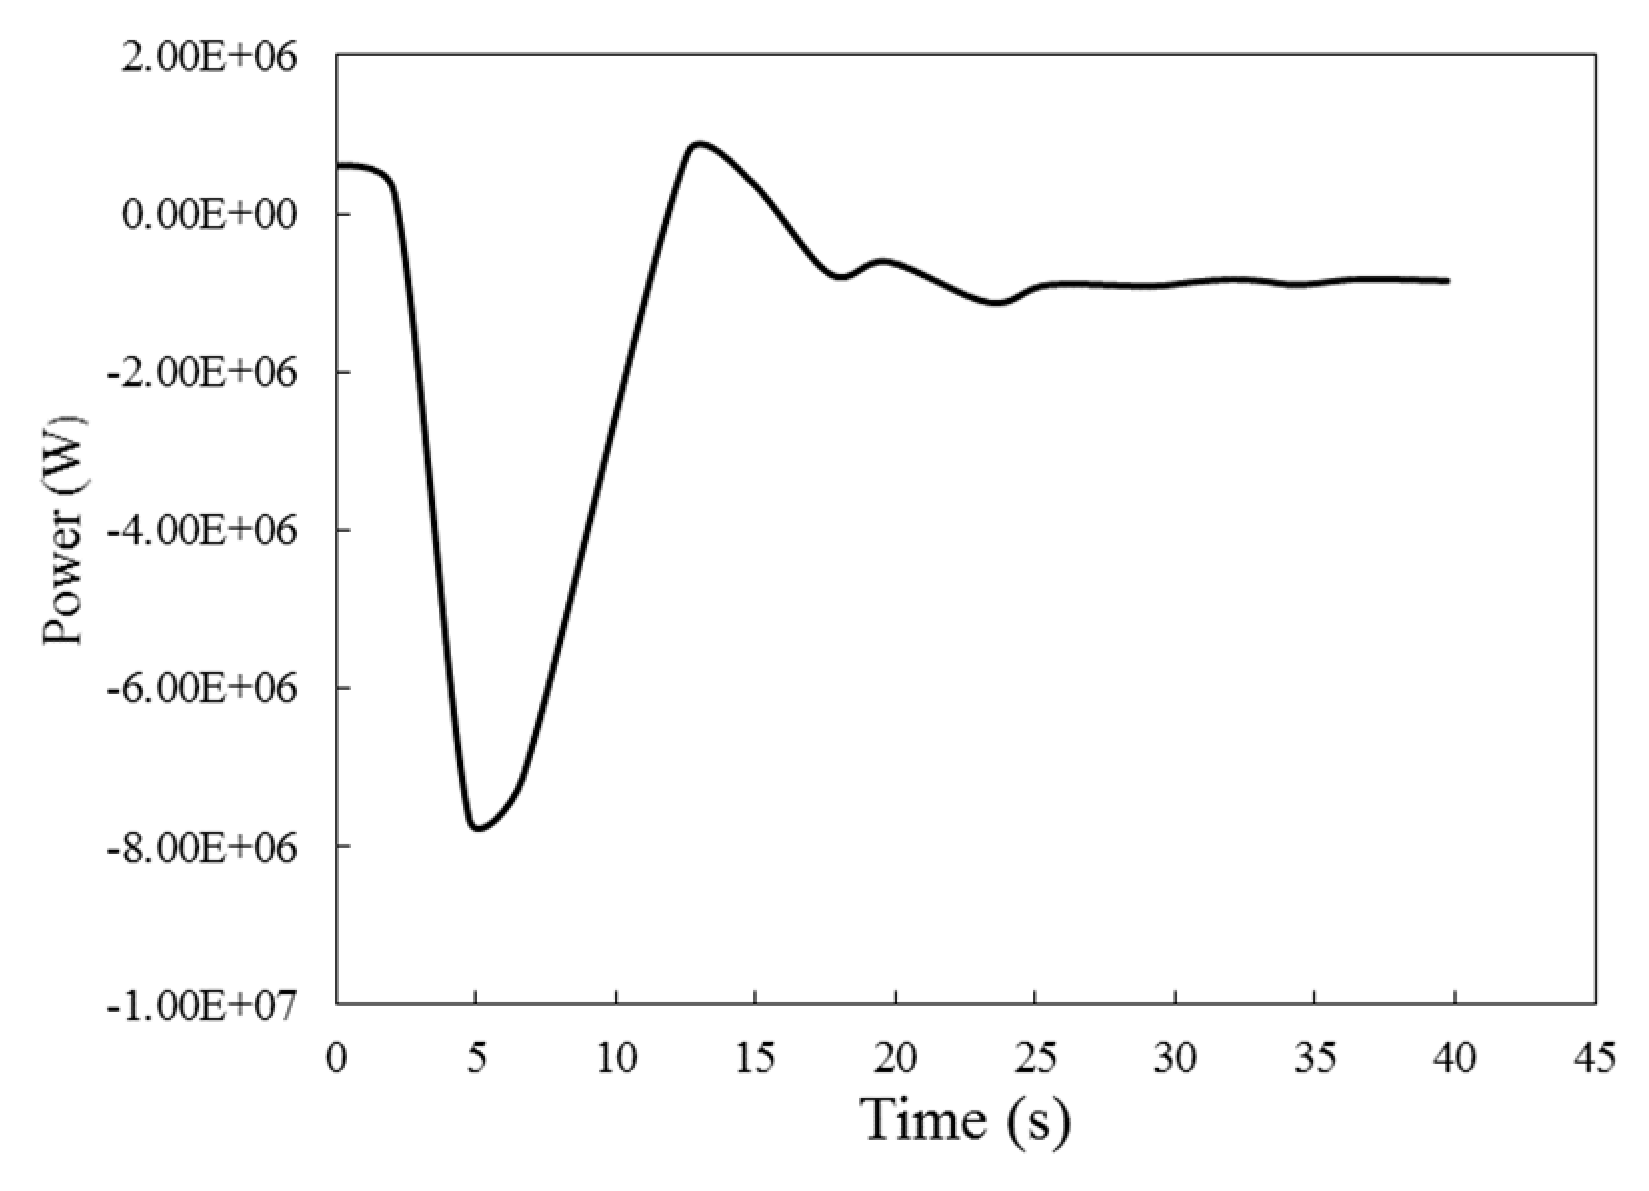
Figure 15 that the mechanical power convergence diagram has reached a constant value with the passage of time.
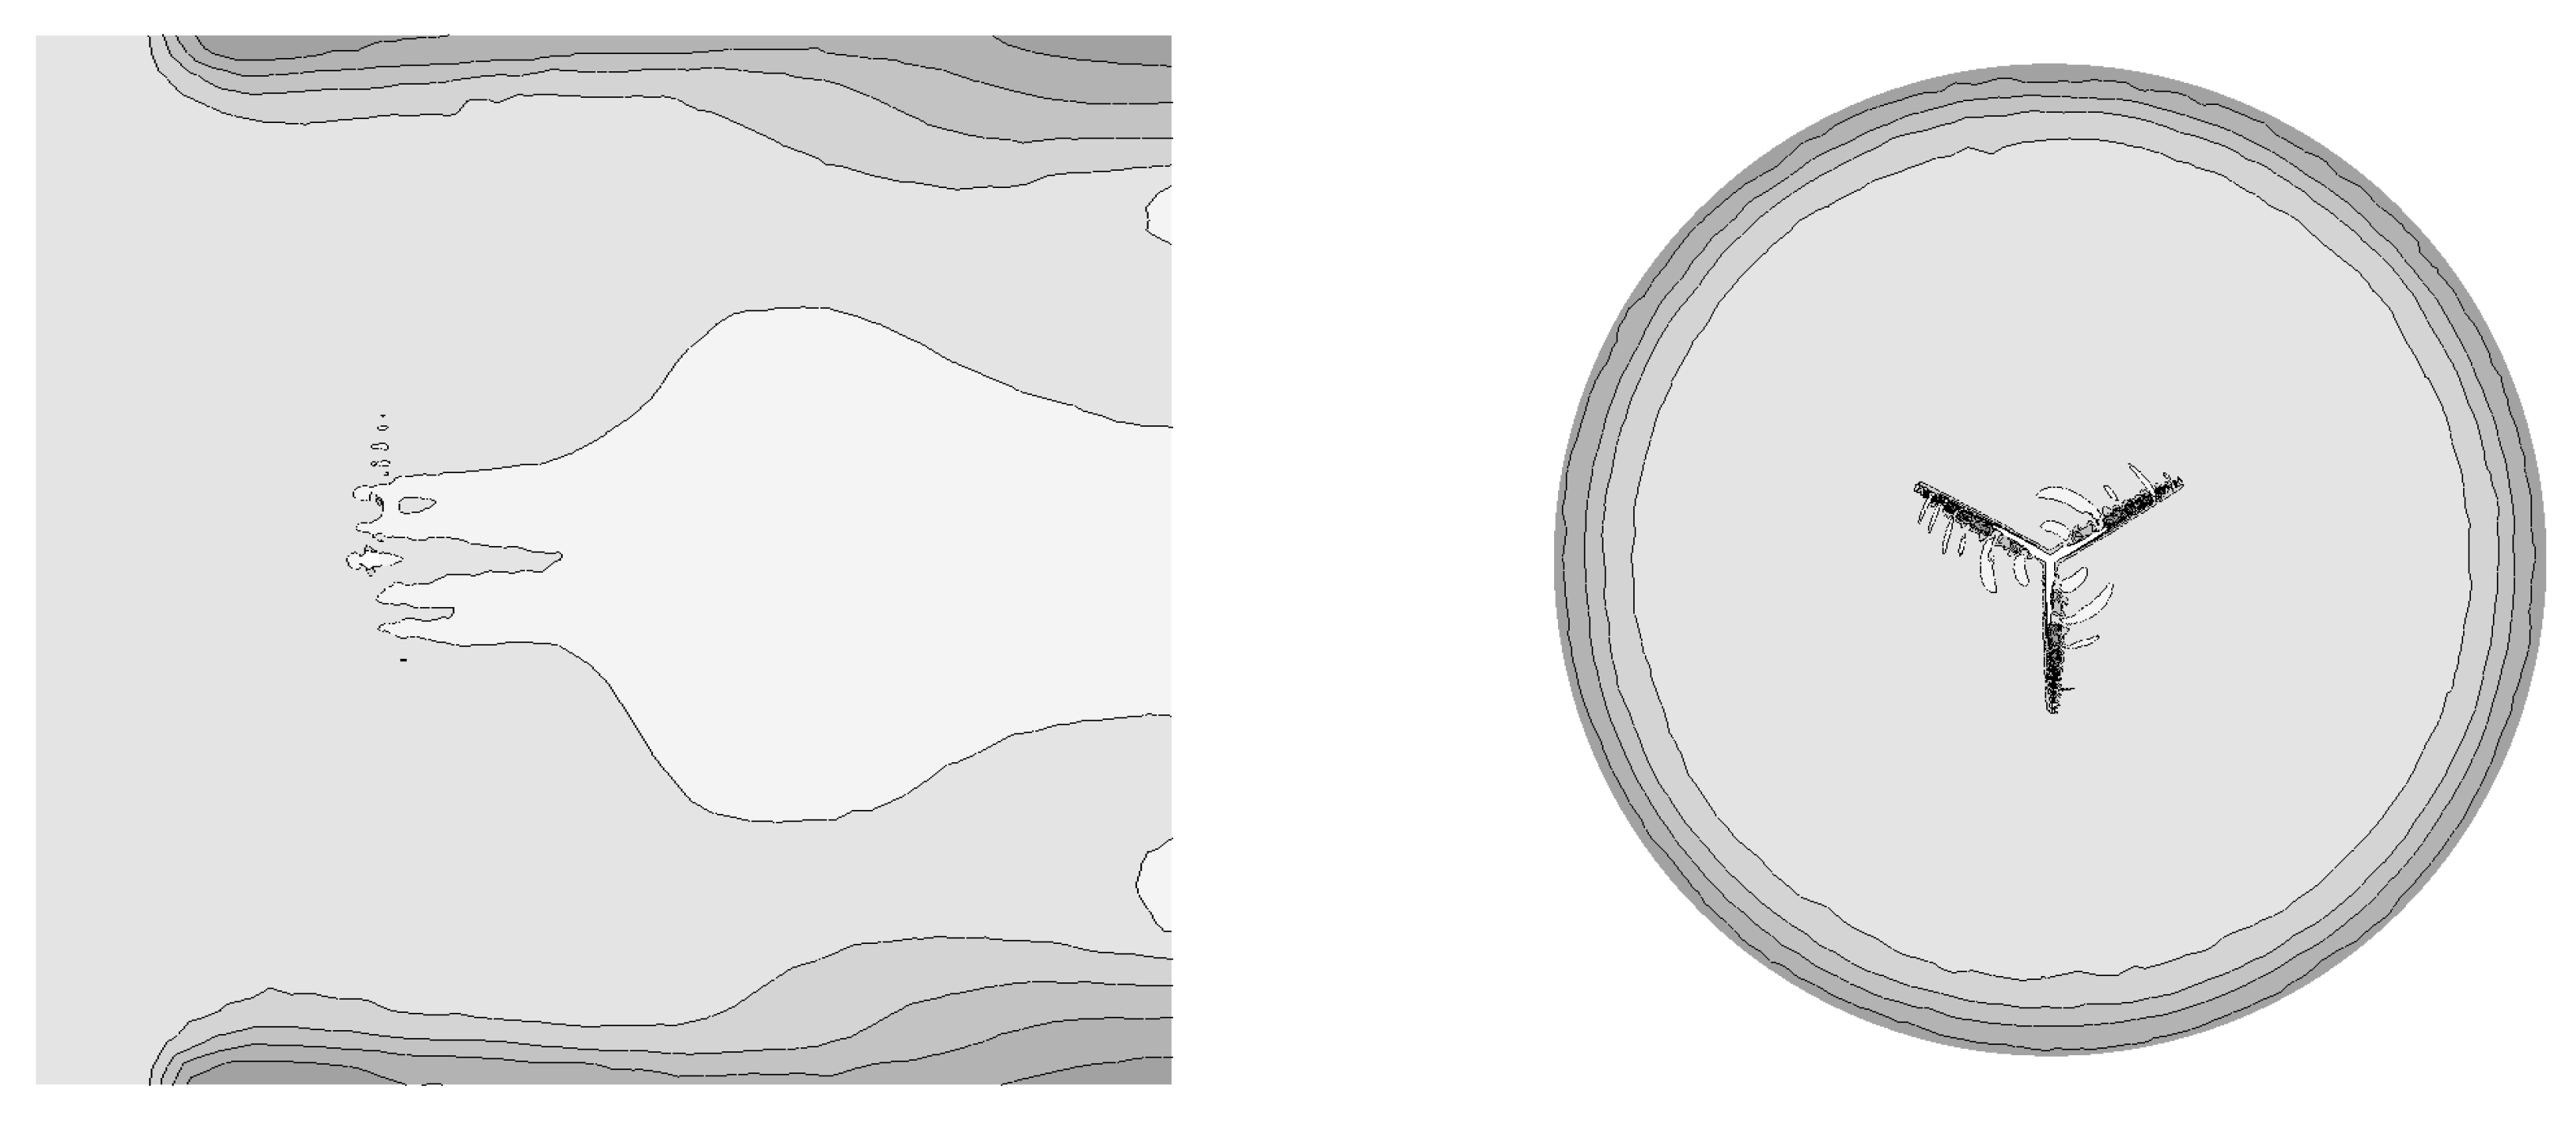
The velocity contour in the side view in the plane passing through the center of the turbine is shown in two front and side views in
Figure 16. The black area indicates high speed while the lighter area indicates low speed. The maximum speed in this case is 103.926 meters per second. The wake region flow caused by the hub is clearly defined. Near the far reaches of the stream, the stream has become fully developed. Also,
Figure 16 shows the lower part of the front view of the turbine in the plane passing through the center of the turbine. Around the tips of the blades, we see an increase in speed, which is rotating in a counter-clockwise direction. The maximum speed will also occur at the tip of the blade. Large vortices will occur in the area around the tip of the blade, which have a three-dimensional and complex structure. The flow near the leading line and the trailing line is in the form of large eddies. The intensity of turbulence decreases slowly from the tip to the root (hub).
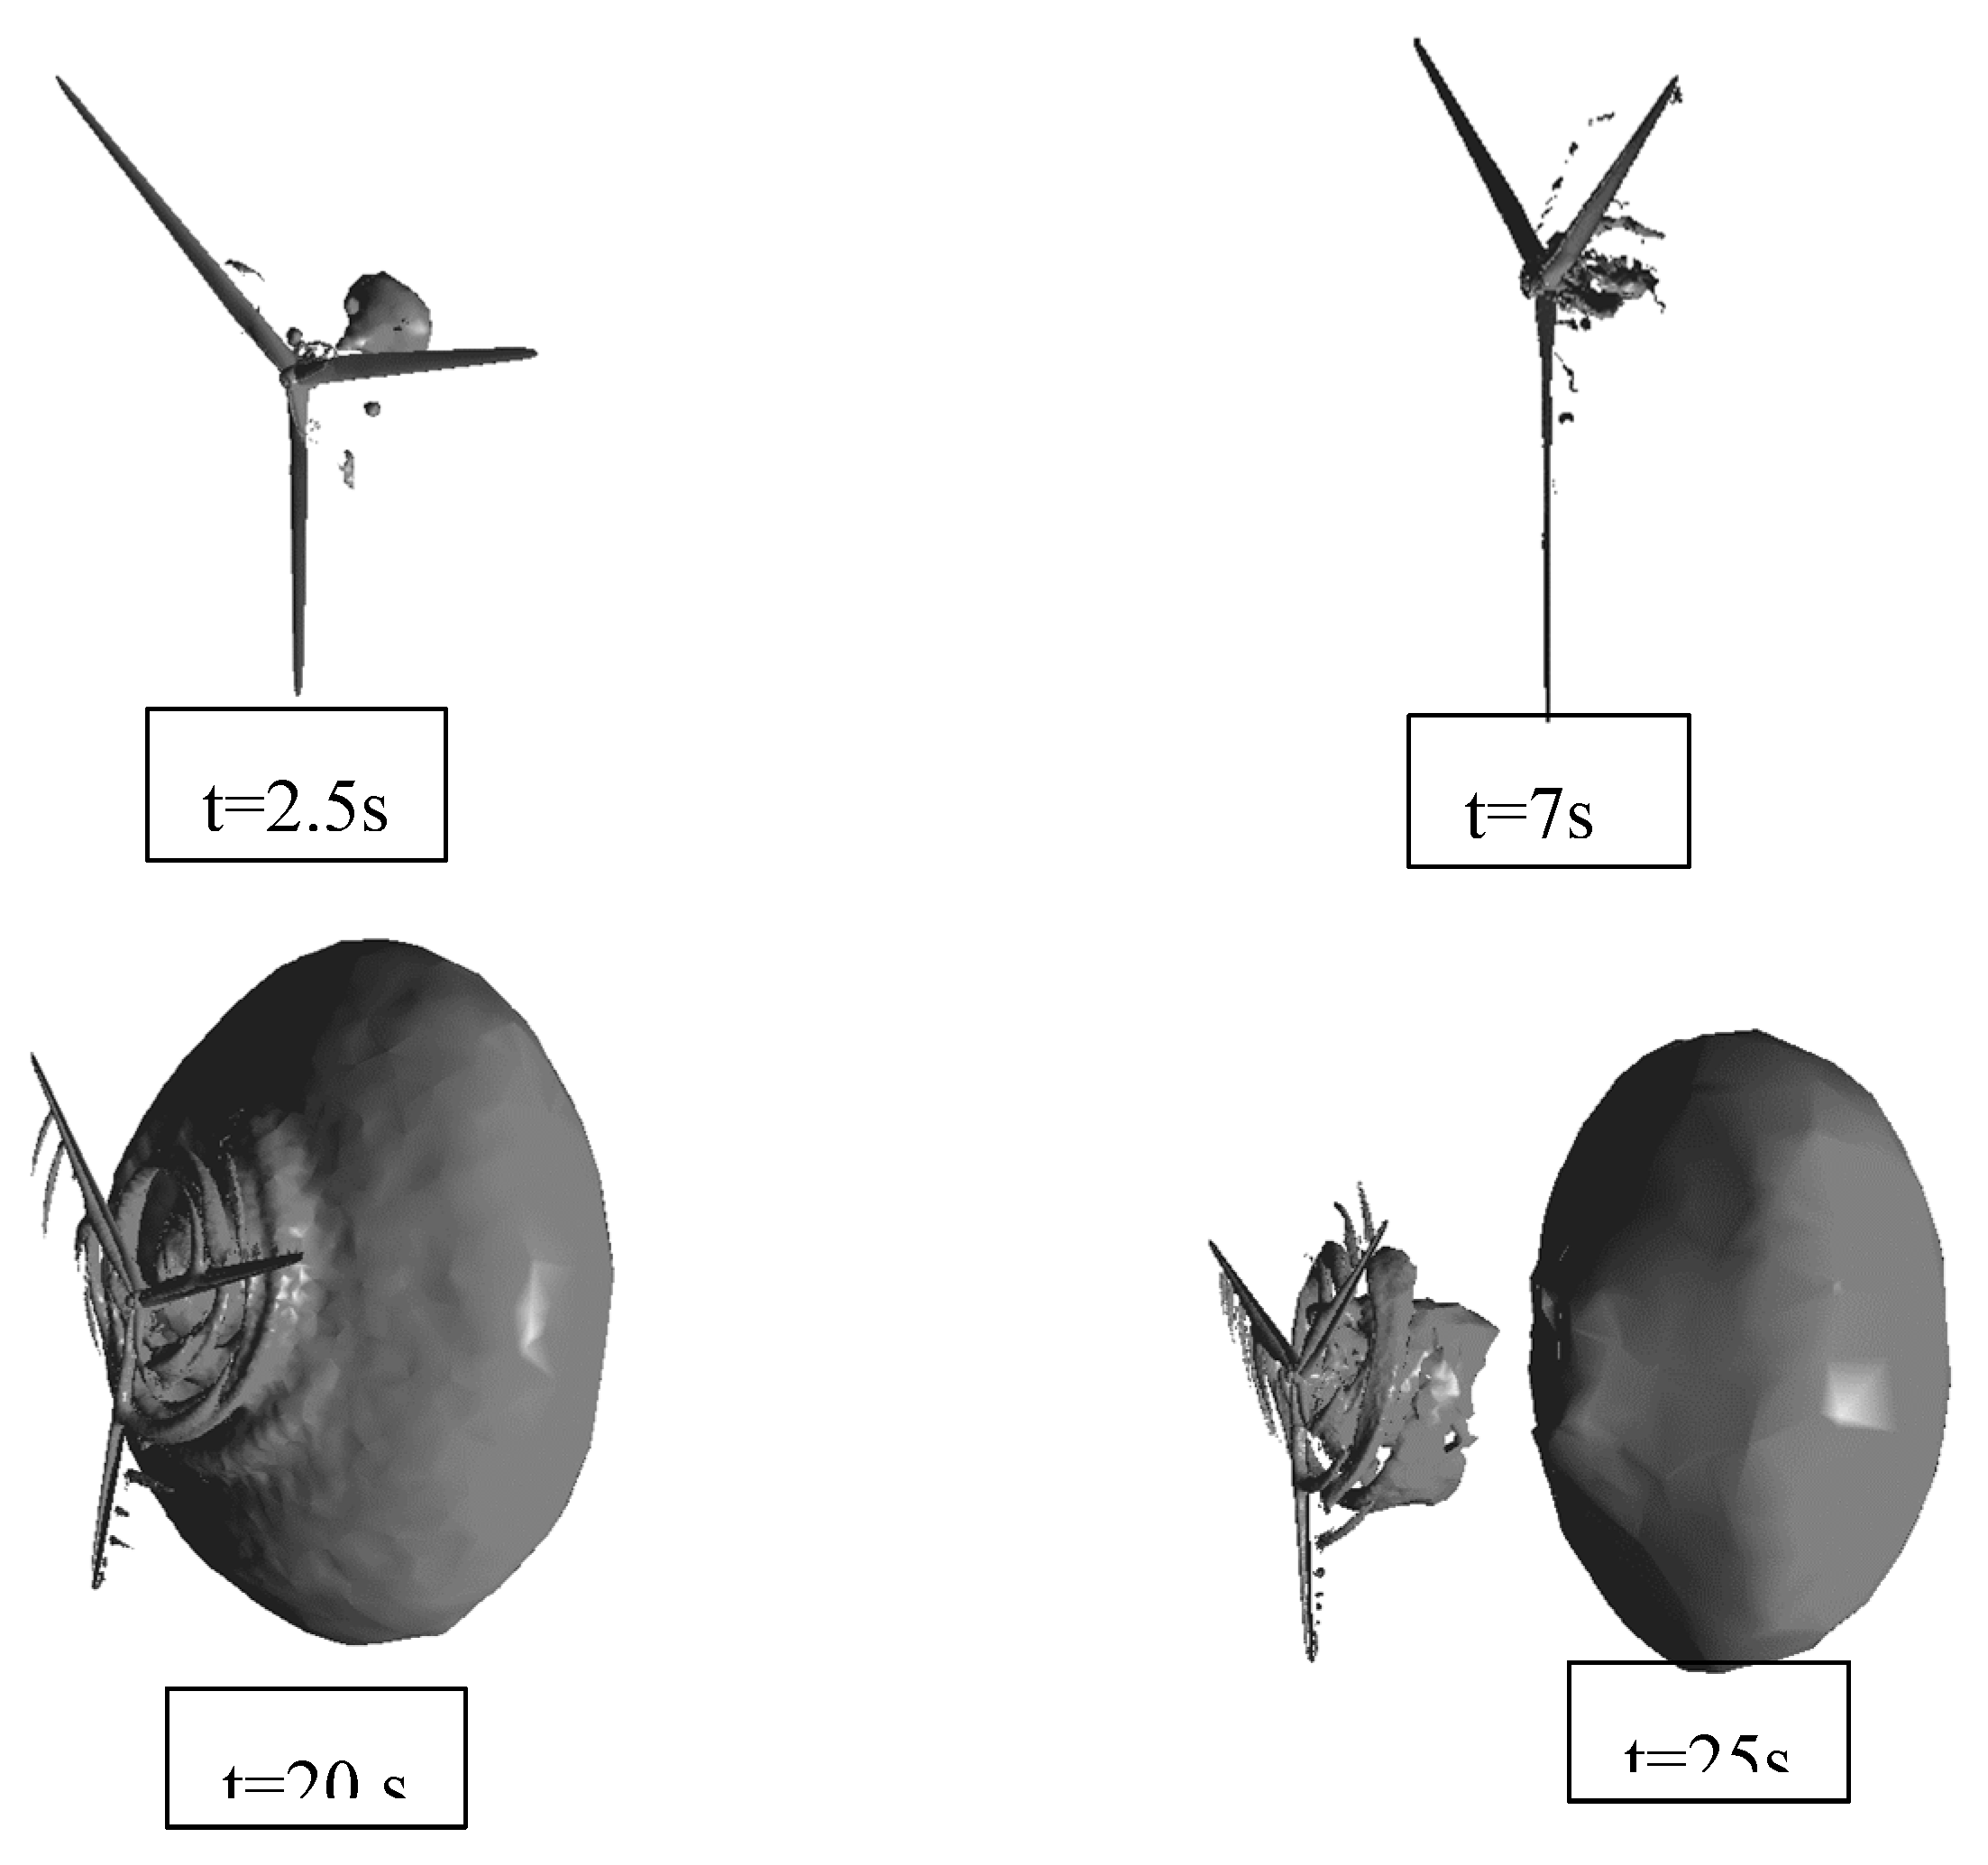
Figure 17 shows the vortex formed due to the rotation of the wind turbine. These results were obtained in 2.5, 7, 20 and 25 seconds. The vortices start from the tip of each blade and move downstream. These vortices will gradually decrease and move away from the rotor. As can be seen in
Figure 17, in the early times, the formed vortices are mostly caused by the hub, but with increasing time, larger vortices will be caused by the tip of the blade.
11. Conclusions
Considering the importance of extracting and obtaining wind energy due to economic and environmental benefits, increasing the efficiency and hydraulic performance of these turbines is very necessary. The importance of modeling and analyzing wind turbines under different aerodynamic conditions in order to improve their design and optimization process is fully accepted. Nevertheless, the presence of vortices effect factors that will be obtained in unsteady state has complicated the analysis of these turbines. The aim of this research is to provide an approach to aerodynamic analysis of two types of horizontal onshore and offshore wind turbines in unsteady state. In fact, two types of turbines with two and three blades have been researched to investigate the formed and trailing vortices. In this research, three-dimensional simulation of coastal and offshore horizontal axis wind turbine in unsteady state was done using computational fluid dynamics. The obtained results were compared with the laboratory data, which corresponded with very good accuracy. The results of the numerical solution showed that with the increase in the wind speed, the mechanical power as well as the thrust force will gradually increase and the pressure distribution on the surfaces will become irregular due to the intensity of the turbulence. Also, the reports presented showed that the vortices formed will mostly be caused by the tip of the blade, although it was visible that the rotor hub will also cause vortices. The trail of vortices will increase with increasing time at the tip of the blade and the effect of hub vortices will decrease. The amount of vortices caused by an offshore wind turbine will be greater than an onshore wind turbine due to the larger number of blades and the larger size of the rotor.
References
- J. Zare, S. E. J. Zare, S. E. Hosseini, and M. R. Rastan, “Airborne dust-induced performance degradation in NREL phase VI wind turbine: a numerical study,” Int. J. Green Energy, pp. 1–20, Aug. 2023. [Google Scholar] [CrossRef]
- J. Zare, S. E. J. Zare, S. E. Hosseini, and M. R. Rastan, “NREL Phase VI wind turbine in the dusty environment,” arXiv Prepr. arXiv2304.06285, Apr. 2023. [Google Scholar] [CrossRef]
- S. E. Hosseini, O. Karimi, and M. A. AsemanBakhsh, “Experimental Investigation and Multi-objective Optimization of Savonius Wind Turbine Based on modified Non-dominated Sorting Genetic Algorithm-II,” Preprints, Aug. 2023. [Google Scholar] [CrossRef]
- S. E. Hosseini, O. Karimi, and M. A. AsemanBakhsh, “Multi-objective Optimization of Savonius Wind Turbine,” arXiv:2308.14648, Aug. 2023. arXiv:2308.14648, Aug. [CrossRef]
- Q. Li, J. Murata, M. Endo, T. Maeda, and Y. Kamada, “Experimental and numerical investigation of the effect of turbulent inflow on a Horizontal Axis Wind Turbine (part II: Wake characteristics),” Energy, vol. 113, pp. 1304–1315, Oct. 2016. [Google Scholar] [CrossRef]
- Z.-K. Wang, G.-C. Tsai, and Y.-B. Chen, “One-Way Fluid-Structure Interaction Simulation of an Offshore Wind Turbine,” Int. J. Eng. Technol. Innov., vol. 4, no. 3, pp. 127–137, 2014.
- N. N. Sørensen, J. A. Michelsen, and S. Schreek, “Navier–Stokes predictions of the NREL phase VI rotor in the NASA Ames 80 ft × 120 ft wind tunnel,” Wind Energy, vol. 5, no. 2–3, pp. 151–169, Apr. 2002. [Google Scholar] [CrossRef]
- R. B. Langtry, J. Gola, and F. R. Menter, “Predicting 2D airfoil and 3D wind turbine rotor performance using a transition model for general CFD codes,” Collect. Tech. Pap. - 44th AIAA Aerosp. Sci. Meet., vol. 7, pp. 4643–4653, 2006. [CrossRef]
- P. A. S. F. Silva, L. D. Shinomiya, T. F. de Oliveira, J. R. P. Vaz, A. L. Amarante Mesquita, and A. C. P. Brasil Junior, “Analysis of cavitation for the optimized design of hydrokinetic turbines using BEM,” Appl. Energy, vol. 185, pp. 1281–1291, Jan. 2017. [Google Scholar] [CrossRef]
- M. X. Song, K. Chen, Z. Y. He, and X. Zhang, “Wake flow model of wind turbine using particle simulation,” Renew. Energy, vol. 41, pp. 185–190, May 2012. 20 May. [CrossRef]
- F. Porté-Agel, Y.-T. Wu, H. Lu, and R. J. Conzemius, “Large-eddy simulation of atmospheric boundary layer flow through wind turbines and wind farms,” J. Wind Eng. Ind. Aerodyn., vol. 99, no. 4, pp. 154–168, Apr. 2011. [Google Scholar] [CrossRef]
- J. Bartl, F. Pierella, and L. Sætrana, “Wake Measurements Behind an Array of Two Model Wind Turbines,” Energy Procedia, vol. 24, pp. 305–312, Jan. 2012. [Google Scholar] [CrossRef]
- J. O. Mo, A. Choudhry, M. Arjomandi, and Y. H. Lee, “Large eddy simulation of the wind turbine wake characteristics in the numerical wind tunnel model,” J. Wind Eng. Ind. Aerodyn., vol. 112, pp. 11–24, Jan. 2013. [Google Scholar] [CrossRef]
- M. H. Shojaeefard, S. E. Hosseini, and J. Zare, “CFD simulation and Pareto-based multi-objective shape optimization of the centrifugal pump inducer applying GMDH neural network, modified NSGA-II, and TOPSIS,” Struct. Multidiscip. Optim., vol. 60, no. 4, pp. 1509–1525, May 2019. 20 May 1509; 19. [Google Scholar] [CrossRef]
- M. H. Shojaeefard, S. E. Hosseini, and J. Zare, “Numerical simulation and multi-objective optimization of the centrifugal pump inducer,” Modares Mech. Eng., vol. 17, no. 7, pp. 205–216, 2018.
- S. E. Hosseini and A. Keshmiri, “Experimental and numerical investigation of different geometrical parameters in a centrifugal blood pump,” Res. Biomed. Eng., vol. 38, no. 5, pp. 423–437, 2022. 2022. [CrossRef]
- Karimi, M. K. Koopaee, A. reza Tavakolpour-Saleh, and S. E. Hosseini, “Investigating Overlap Ratio Effect on Performance of a Modified Savonius Wind Turbine: An Experimental Study,” Preprints, Aug. 2023. [Google Scholar] [CrossRef]
- “Introduction to the Theory of Flow Machines - Albert Betz - Google Books.” https://books.google.com/books?hl=en&lr=&id=9s2jBQAAQBAJ&oi=fnd&pg=PP1&dq=Introduction+to+the+Theory+of+Flow+Machines&ots=WkMlI-1vUr&sig=1gy7VXoLiHkD3u6ycGme3N1NJdQ#v=onepage&q=Introduction to the Theory of Flow Machines&f=false (accessed Sep. 12, 2023).
- K. M. Foreman, B. Gilbert, and R. A. Oman, “Diffuser augmentation of wind turbines,” Sol. Energy, vol. 20, no. 4, pp. 305–311, Jan. 1978. [Google Scholar] [CrossRef]
- M. M. Hand, D. A. Simms, L. J. Fingersh, D. W. Jager, and J. R. Cotrell, “Unsteady Aerodynamics Experiment Phase V: Test Configuration and Available Data Campaigns; TOPICAL.” 2001.
- R. Kumar, T. Stallard, and P. K. Stansby, “Large-scale offshore wind energy installation in northwest India: Assessment of wind resource using Weather Research and Forecasting and levelized cost of energy,” Wind Energy, vol. 24, no. 2, pp. 174–192, Feb. 2021. [Google Scholar] [CrossRef]
- B. Ghadimi, A. Nejat, S. A. Nourbakhsh, and N. Naderi, “Multi-Objective Genetic Algorithm Assisted by an Artificial Neural Network Metamodel for Shape Optimization of a Centrifugal Blood Pump,” Artif. Organs, Nov. 2018. [Google Scholar] [CrossRef]
Figure 1.
Prototypes of windmills in Iran (Sistan and Baluchistan).
Figure 1.
Prototypes of windmills in Iran (Sistan and Baluchistan).
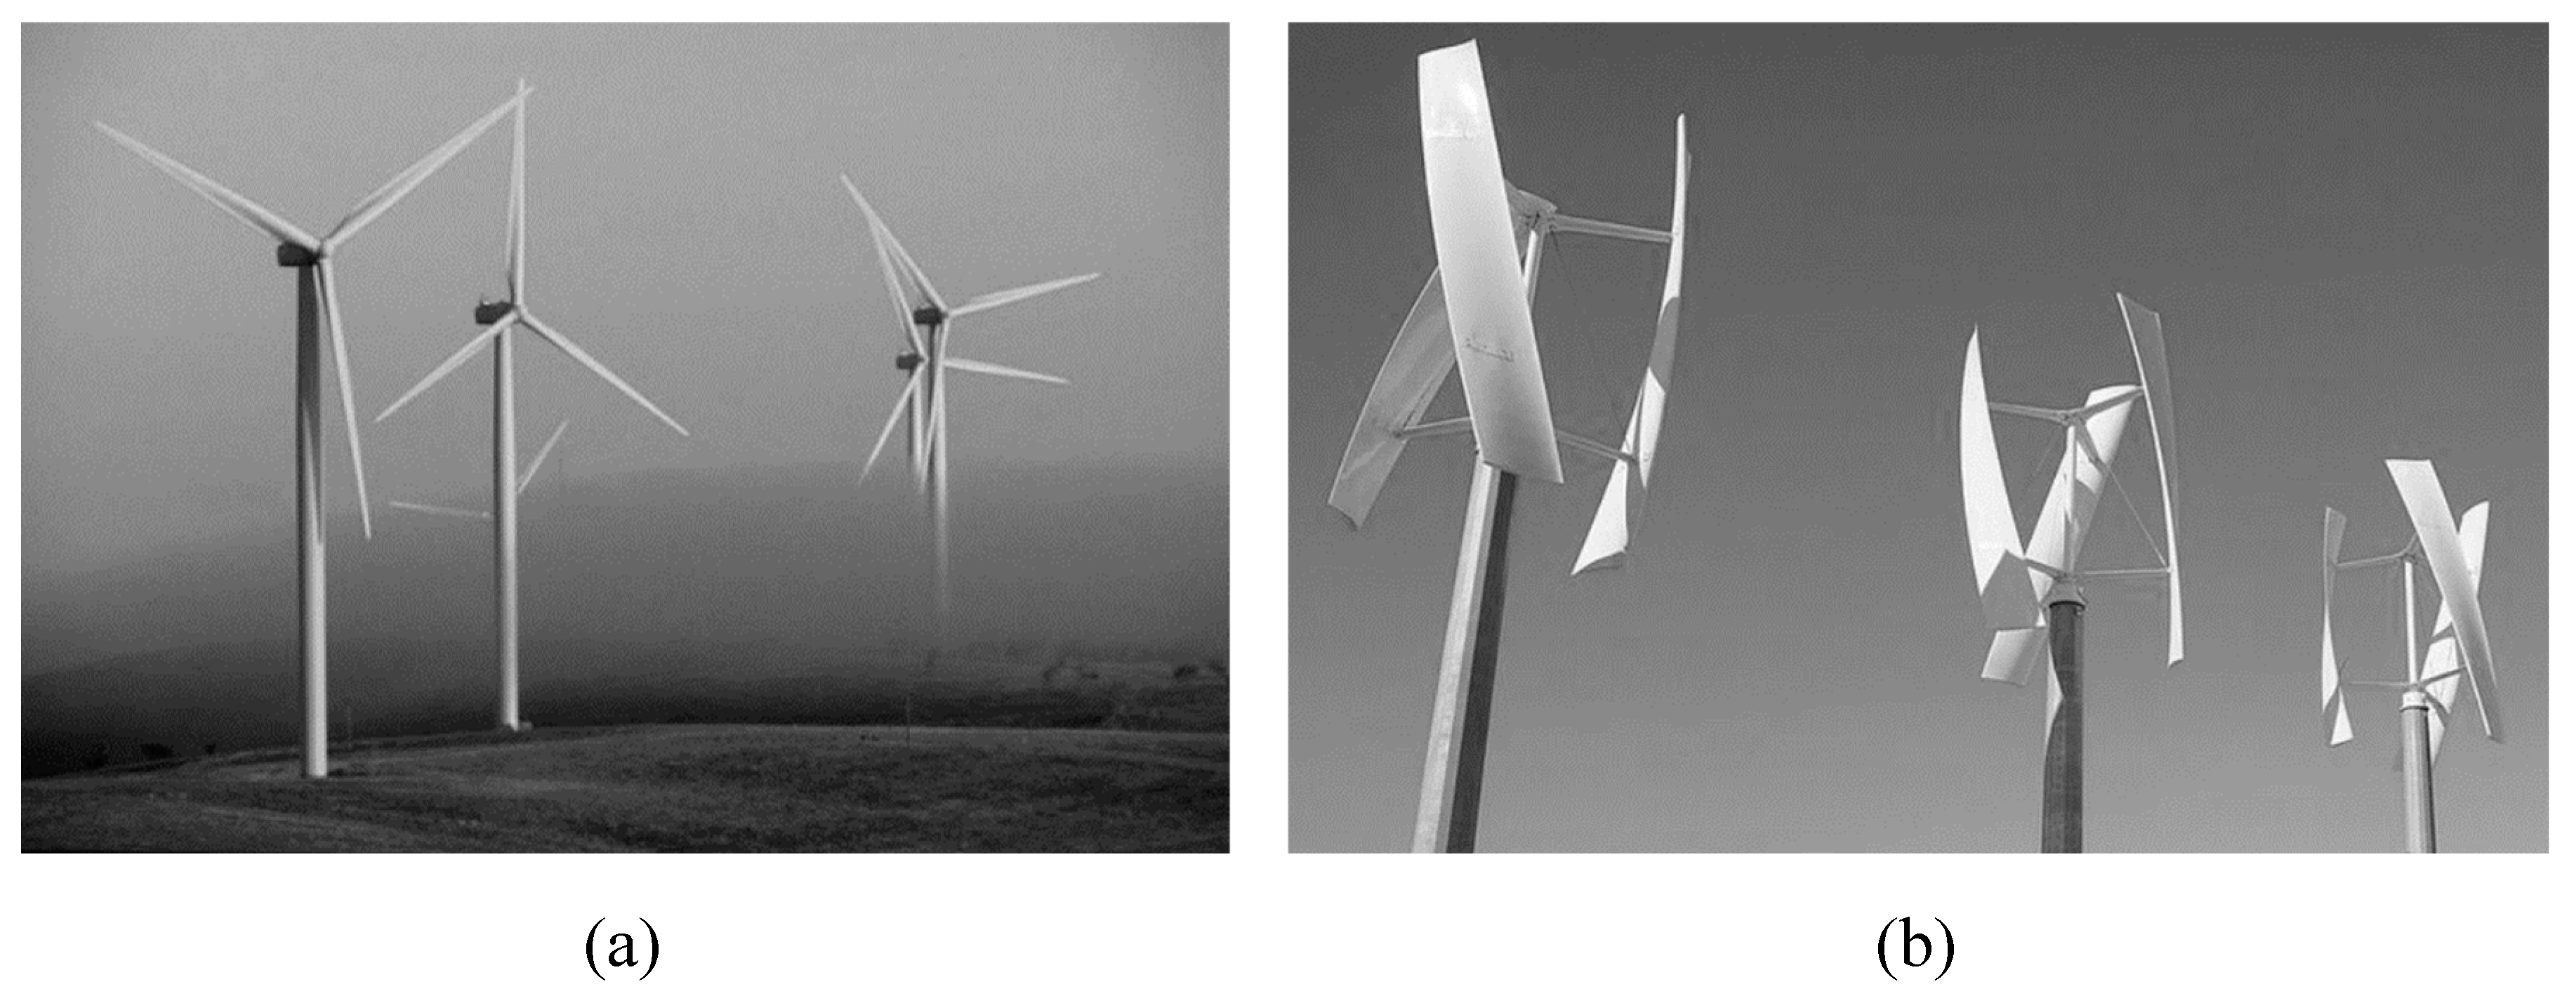
Figure 2.
3D view of Horizontal axis wind turbine (a) and vertical axis wind turbine (b).
Figure 2.
3D view of Horizontal axis wind turbine (a) and vertical axis wind turbine (b).
Figure 3.
Isometric view of the modeled onshore horizontal axis wind turbine.
Figure 3.
Isometric view of the modeled onshore horizontal axis wind turbine.
Figure 4.
Isometric view of the modeled offshore horizontal axis wind turbine.
Figure 4.
Isometric view of the modeled offshore horizontal axis wind turbine.
Figure 5.
(a) The wind turbine tower and blade for testing in the wind tunnel [
14] and (b) the calculation range and boundary conditions of the horizontal axis wind turbine.
Figure 5.
(a) The wind turbine tower and blade for testing in the wind tunnel [
14] and (b) the calculation range and boundary conditions of the horizontal axis wind turbine.
Figure 6.
(a) Grid independence check for onshore horizontal axis wind turbine, and (b) offshore horizontal axis wind turbine.
Figure 6.
(a) Grid independence check for onshore horizontal axis wind turbine, and (b) offshore horizontal axis wind turbine.
Figure 7.
(a) The contour of y+ distribution on the blade of an onshore horizontal axis wind turbine, and (b) an offshore horizontal axis wind turbine.
Figure 7.
(a) The contour of y+ distribution on the blade of an onshore horizontal axis wind turbine, and (b) an offshore horizontal axis wind turbine.
Figure 8.
The vortices formed behind the wind turbine caused by the blade tip using numerical simulation and experimental results.
Figure 8.
The vortices formed behind the wind turbine caused by the blade tip using numerical simulation and experimental results.
Figure 9.
Torque diagram created by the rotor in unstable state.
Figure 9.
Torque diagram created by the rotor in unstable state.
Figure 10.
Diagram of mechanical power generated in unstable state.
Figure 10.
Diagram of mechanical power generated in unstable state.
Figure 11.
Velocity distribution in the plane passing through the center of the turbine at t=4s.
Figure 11.
Velocity distribution in the plane passing through the center of the turbine at t=4s.
Figure 12.
Comparison of pressure distribution of numerical solution results with experimental data at wind speed of 7 m/s in unsteady state.
Figure 12.
Comparison of pressure distribution of numerical solution results with experimental data at wind speed of 7 m/s in unsteady state.
Figure 13.
Origin and spread of vortex trails at different times.
Figure 13.
Origin and spread of vortex trails at different times.
Figure 14.
Comparison of the torque diagram in terms of time obtained from the numerical solution results and experimental data in a time step of 0.01 seconds.
Figure 14.
Comparison of the torque diagram in terms of time obtained from the numerical solution results and experimental data in a time step of 0.01 seconds.
Figure 15.
Comparison of the power diagram in terms of time obtained from the numerical solution results in a time step of 0.01 seconds.
Figure 15.
Comparison of the power diagram in terms of time obtained from the numerical solution results in a time step of 0.01 seconds.
Figure 16.
Velocity distribution in the plane passing through the center of the turbine.
Figure 16.
Velocity distribution in the plane passing through the center of the turbine.
Figure 17.
Development and emergence of vortices behind the wind turbine at different times.
Figure 17.
Development and emergence of vortices behind the wind turbine at different times.
Table 1.
General characteristics and performance parameters of offshore horizontal axis wind turbine.
Table 1.
General characteristics and performance parameters of offshore horizontal axis wind turbine.
|
Disclaimer/Publisher’s Note: The statements, opinions and data contained in all publications are solely those of the individual author(s) and contributor(s) and not of MDPI and/or the editor(s). MDPI and/or the editor(s) disclaim responsibility for any injury to people or property resulting from any ideas, methods, instructions or products referred to in the content. |
© 2023 by the authors. Licensee MDPI, Basel, Switzerland. This article is an open access article distributed under the terms and conditions of the Creative Commons Attribution (CC BY) license (https://creativecommons.org/licenses/by/4.0/).


