Submitted:
13 September 2023
Posted:
14 September 2023
You are already at the latest version
Abstract
Abstract: (1) Background: Surgery is the best curative option for Gastric Cancer (GC). However, morbimortality associated with surgery still a significant problem. Thus, it is essential to determine the preoperative surgical risk, to optimize outcomes in higher risk patients. (2) Methods: Patients who underwent curative gastrectomy between January 2010 and December 2013 were included, obtaining a sample of 131 patients, and the acuity of the scales understudy was evaluated. The predictive power of the scales was evaluated through calibration and discrimination. (3) Results and Conclusions: Regarding mortality, the scales demonstrated good calibration, with POSSUM and P-POSSUM obtaining the best O:E ratio. The scales presented good discrimination, with POSSUM showing the best result. Considering morbidity, the scales showed good calibration and discrimination. POSSUM and P-POSSUM seem to have potential in predicting morbidity and mortality when applied to the studied population, but there is a need for further studies in this area.
Keywords:
gastric cancer
; POSSUM
; P-POSSUM
; O-POSSUM
1. Introduction
Gastric cancer (GC) is currently the fifth most incident neoplasm and the fourth cause of cancer mortality worldwide. It accounted for over one million new cases in 2020, with approximately 769.000 people dying due natural history disease’s [1]. In Portugal, GC incidence is approximately four times higher than the European average. [2,3]
GC staging is based on the American Joint Commitment on Cancer TMN classification. GC prognosis, as well as the type of treatment to be performed, depend on this staging. [4,5] In early stages, endoscopic resection is potentially curative, however the majority of patients with GC do not fit into this profile. Thus, surgical resection remains the best curative option for early-stage tumors. Surgery is also recommended for the palliation of symptoms in cases of advanced disease that, despite having surpassed the possibility of cure, present formal surgical indication due to hemorrhage or obstruction. [3,6]. The surgical treatment with curative intent generally involves a major procedure with total or subtotal gastrectomy, eventual resection of adjacent organs and extensive lymphadenectomy, so postoperative complications inherent to this type of intervention still constitute an important challenge to clinical practice. [3,6]. Postoperative mortality and morbidity are often used for evaluating outcomes and comparing the quality of surgical care. [3] But the absolute results of morbimortality doesn´t reflect que quality of the realized treatment, so models have been used, namely the Physiological and Operative Severity Score for the enumeration of mortality and morbidity (POSSUM), the Portsmouth physiologic and operative severity score for the enumeration of mortality and morbidity (P-POSSUM) and the Oesophagogastric Physiologic and Operative Severity Score for the enumeration of mortality and morbidity (O-POSSUM), which represent an accessible tool that allows determining preoperative surgical risk, in order to optimize patients with a higher risk of developing postoperative morbimortality.
2. Results
2.1. Sample Characterization
The sample consisted of 131 patients who underwent gastrectomy for GC in Hospital de Braga between January 1, 2010 and December 31, 2013. The characterization of the population is described in Table 1.
2.1.1. Morbidity and Mortality
Of the 131 patients under analysis, 31 (23.7%) present postoperative mobility. With regard to local complications, it was observed that 11 patients had anastomotic leak (8.4%), 2 patients had a fistula (1.5%) and 2 patients had surgical wound infection (1.5%). Regarding to systemic complications, 12 patients had pulmonary complications (9.2%), 5 patients had sepsis (3.8%), 5 patients had abdominal complications (3.8%), 1 patient had cardiovascular complications (0. 8%) and 1 patient had hypovolemic shock (0.8%). Table 2 describes observed morbility. The mortality observed in the 30 days following surgery was 6.1%, corresponding this mortality to 8 deaths. Until January 31, 2018, there were 46 deaths (34.8%), and 38 of the deaths were related to GC (28.8%).
2.1.2. Tumor recurrence
Of the 131 patients, 33 had tumor recurrence (25%) during the follow-up, evaluated until January 31, 2018 (5-year follow-up).
2.1.3. Survival time and disease-free survival
2.2. Results of the application of the scales
2.2.1. POSSUM
The predicted mortality risk by POSSUM ranged between 1.43% and 23.51%, with a median value of 4.19 and an interquartile range of 3.76. Regarding the calculated morbidity risk by POSSUM, the values ranged between 7.59% and 77.56%, with a median value of 23.87 and an interquartile range of 20.45.
2.2.2. P-POSSUM
The predicted mortality risk by P-POSSUM ranged between 0.31% and 12.82%, with a median value of 1.18 and an interquartile range of 1.52. Regarding the calculated morbidity risk by P-POSSUM, the values varied between 7.59% and 77.56%, with a median value of 23.87 and an interquartile range of 20.45.
2.2.3. O-POSSUM
The predicted mortality risk by O-POSSUM ranged between 0.94% and 52.30%, with a median value of 10.25 and an interquartile range of 10.88.
2.3. Assessment of surgical risk scales
2.3.1. Comparison of results obtained from the scales regarding postoperative outcome
Mortality
Regarding patients who died within 30 days postoperatively, all scales yielded significantly different results between the group of patients who died and the group of patients who did not die. (Table 3)
Morbidity
Regarding patients who experienced complications within 30 days postoperatively, the POSSUM and P-POSSUM scales showed significantly different results between the group of patients who developed morbidity and the group of patients who did not develop morbidity. (Table 4)
2.3.2. Calibration
As for the calibration of the scales, it is measured by the O:E ratio and the Hosmer-Lemeshow test, which was applied to the POSSUM, P-POSSUM and O-POSSUM scales for both mortality and morbidity.
Mortality
Hosmer-Lemeshow test was applied to all evaluated parameters and, in all cases, non-significant values were obtained, demonstrating that the POSSUM, P-POSSUM and O-POSSUM scales exhibited good calibration. The O:E ratio was simultaneously assessed revealing that the POSSUM and P-POSSUM scales demonstrated the best calibration in assessing the overall patient population. When divided into subgroups, POSSUM and P-POSSUM also exhibited the best calibration. In the subgroups, these scales showed better performance in patients with Stages II and III and when total gastrectomy was performed. (Table 5 and Table 6)
Morbidity
The Hosmer-Lemeshow test was applied to all evaluated parameters and in all cases non-significant values were obtained, demonstrating that the POSSUM and P-POSSUM scales exhibited good calibration. The O:E ratio was simultaneously assessed, both for overall patient population and for the various subgroups. Thus, the POSSUM and P-POSSUM scales showed better performance in patients with Stage III and when total gastrectomy was performed. (Table 7 and Table 8)
2.3.3. Discrimination
The discriminative capacity of the POSSUM, P-POSSUM and O-POSSUM scales, in terms of mortality and morbidity, was tested using the AUC of the measured ROC curves.
Mortality
Morbidity
2.4. Correlation among possum, p-possum and o-possum scales
Table 11 presents the studied correlations among the parameters and demonstrates a very strong correlation between the POSSUM and P-POSSUM scales, along with weak correlations between the POSSUM and O-POSSUM scales, as well as between the P-POSSUM and O-POSSUM scales.
2.5. Survival analysis
To assess the impact of these scales on overall mortality (not just within 30 days postoperatively), patients were divided into 2 groups for each scale using the median value (one group with a value below the median and another group with a value equal to or above the median). Subsequently, Kaplan-Meier curves were constructed for each group, and these were compared using the Log Rank test. Figure 5, Figure 6 and Figure 7 represents Kaplan-Meier curves for POSSUM, P-POSSUM and O-POSSUM, respectively.
Regarding the POSSUM and P-POSSUM scales, patients with values below the median obtained from the scale exhibited significant differences in survival when compared to patients with values equal to or above the median. However, the same was not observed with the O-POSSUM scale, as while survival differed between the two groups of patients, this difference was not considered significant. (Table 12 and Table 13)
3. Discussion
Gastric cancer (GC) continues to be one of the most incident and lethal conditions worldwide, and Portugal remains one of the European countries with the highest incidence of this neoplasia. [1,2] Surgery is the best curative option, however, despite advancements in perioperative care leading to a reduction in morbidity and mortality associated with GC surgery, it still remains a clinically significant issue. [3,6] Additionally, surgical morbidity and mortality are often used to assess performance and enable comparison among individual surgeons and hospitals. [7] Therefore, preoperative surgical risk assessment is essential as it allows for the optimization of patients at higher risk of developing postoperative morbidity and mortality, ensuring the quality control of surgical procedures. [3,6] The observed 30-day postoperative mortality was 6.1%, and the observed 30-day postoperative morbidity was 23.7%, values similar to those studied in the literature, particularly ranging from 5% to 12% for mortality and 30% to 43% for morbidity. [3,8,9,10] Intra-abdominal and pulmonary complications were more frequent, which is also consistent with the literature. [3,11] The study aimed to assess the accuracy of surgical risk prediction scales in GC, specifically the POSSUM, P-POSSUM, and O-POSSUM, among patients undergoing surgical interventions for curative purposes at Hospital de Braga. The ideal model would be one that could predict postoperative morbidity and mortality as accurately as possible, being rapid, easy to apply, and adaptable to all types of surgical procedures. Among these models, the most widely validated for surgical patients was POSSUM, followed by P-POSSUM, and specifically for gastric surgery, O-POSSUM. [10] The POSSUM model, along with its subsequent modifications like P-POSSUM and O-POSSUM, employs a scoring system based on patient physiological variables and the severity of the surgical procedure performed. This is done to evaluate the outcomes of surgical interventions and establish the relationship between predicted and observed mortality and morbidity within each risk category of the study population. [3,7] Regarding the scores obtained from the different scales, they were significantly different between patients who died or experienced morbidity and patients who did not die or did not develop morbidity within 30 days postoperatively, as observed in the literature. [12,13] This implies that patients who experienced morbidity or mortality had distinct scoring patterns compared to those who did not experience such outcomes. In terms of calibration, all scales demonstrated good ability to predict the occurrence of morbidity and mortality. Regarding mortality, both POSSUM and P-POSSUM exhibited good performance in most subgroups, particularly in patients with stages II, III, and when total gastrectomy was performed, with an O:E ratio of 1 for both scales. However, in the overall patient population and among patients with intestinal histological type of GC, both scales underestimated mortality, with O:E ratios of 1.25 and 1.34, respectively. These findings contrast with those described in the literature, where POSSUM and P-POSSUM are reported as good predictors of mortality. However, when evaluating O:E, it varies between 0.08 and 0.17 for POSSUM and between 0.21 and 0.7 for P-POSSUM, indicating an overestimation of mortality. [7,9,14,15,16,17] O-POSSUM underestimated mortality both in the overall patient population and in all subgroups, with O:E ratios ranging from 1.5 to 8.04. In the literature, this scale is described as a poor predictor of mortality, with O:E ratios ranging from 0.29 to 0.9, which means it overestimates mortality. This is the opposite of what was observed in the present study. [7,15] Regarding morbidity, both POSSUM and P-POSSUM underestimated morbidity in the overall patient population and when divided into subgroups, with O:E ratios ranging from 1.21 to 1.75. They showed better performance in patients with stage III and when total gastrectomy was performed, with an O:E ratio of 1.2 in both subgroups. In several studies, these scales are described as good predictors of morbidity. However, when evaluating O:E ratios, they ranged from 0.4 to 0.9, indicating an overestimation of morbidity. [16,17,18] Concerning discrimination, all evaluated scales exhibited a good ability to distinguish between patients who survived and patients who died. The POSSUM scale showed the best discrimination, followed by P-POSSUM, and finally O-POSSUM. All scales had AUC values above 0.8. [7,19] However, these results contradict other studies where O-POSSUM was found to be the best discriminator of patients. [8,9] Concerning morbidity, the POSSUM and P-POSSUM scales also displayed good discrimination, with AUC values exceeding 0.8. In the literature, these scales are described as reasonable predictors of morbidity. [8] Thus, overall, in this case series, POSSUM and P-POSSUM managed to predict the occurrence of morbidity and mortality more accurately, presenting overlapping calibration values and very close discrimination values. To understand the reason behind this similarity, potential correlations between the different evaluated scales were tested. It was concluded that there is a strong correlation between the POSSUM and P-POSSUM scales. In other words, the values obtained from both scales tend to move in the same direction and at a consistent rate, thereby increasing together. Additionally, the correlation between the POSSUM and O-POSSUM scales, as well as between P-POSSUM and O-POSSUM, was evaluated and found to be weak. In the long term, the POSSUM and P-POSSUM scales served as predictors of survival. Patients scoring below the median values of these scales, namely 4.19 for POSSUM and 1.18 for P-POSSUM, exhibited distinct survival rates compared to those with scores equal to or higher than the aforementioned values. The same outcome was not observed with the O-POSSUM scale, as although there was a survival difference between the two patient groups, this difference was not considered significant. The present study has several limitations. Primarily, being a retrospective study, the collection of specific data on physiological status and intraoperative course was constrained. Additionally, the fact that it involves a small sample size may limit the accuracy of the results, particularly in predicting mortality.
4. Materials and Methods
This is an observational, retrospective, descriptive and analytical.
The target population of the study corresponds to patients with a histological diagnosis of gastric adenocarcinoma, who underwent surgical treatment with curative intent at the General Surgery Department at Hospital de Braga, in the period between January 1, 2010 and December 31, 2013. Patients who did not underwent surgical resection or those who received surgical treatment with palliative intent were excluded from the study. Also, patients with a histological diagnosis different from the one mentioned earlier, patients without anatomopathological staging results, or patients with incomplete clinical data necessary for determining the prognosis scale score were excluded. Thus, from an initial population of 180 patients, patients who met all the aforementioned inclusion criteria and who did not have any exclusion criteria were selected, resulting in a final study sample of 131 patients. Data collection and processing: The data were collected by consulting clinical files, using the Glintt® computer system. The information was registered in a hospital database and anonymized. A code was assigned to each clinical file analyzed that was different from the hospital file number. No data that could enable patient identification were ever recorded, thus ensuring confidentiality and anonymity. The clinical and anatomopathological data collected from each patient in the sample were as follows: age, gender, tumor location and histological type, depth of tumor invasion [T), number of lymph nodes involved [N), presence or absence of metastases [M), tumor recurrence, including site and time of recurrence, 30-day postoperative mortality, 30-day postoperative complications, overall mortality, cancer-related survival, and overall survival. By complications, we mean any type of event that lead to a deviation from the normal postoperative course, and in this study the assessment of complications was carried out in accordance with the initial definition by Copeland et al. [20] For statistical purposes, only the presence or absence of operative complications was recorded, regardless of the number or type of complication. To calculate the different scales, the following parameters were collected: age, cardiac signs, respiratory signs, electrocardiogram, systolic blood pressure, heart rate, hemoglobin, leukocytes, urea, sodium, potassium and the Glasgow Coma Scale. Regarding to surgical parameters, the following data were collected: operative severity, number of surgical procedures performed in the last 30 days, amount of blood loss, presence of peritoneal contamination, status of tumor dissemination, surgical approach and type of surgery. In this study, the calculation of physiological and operative scores of the POSSUM, P-POSSUM and O-POSSUM scales were obtained through the arithmetic sum of the scores assigned to each parameter defined according to Copeland et al [20]. The risk of morbidity and mortality in the 30 days after the operation predicted by the POSSUM, P-POSSUM and O-POSSUM scales were calculated using the calculation equations shown in Table 14. [7,9,21]
Statistical analysis: Statistical analysis of the data was performed using the Statistical Package for Social Science® [SPSS®) software, version 27. Initially, an exploratory analysis of the data was conducted, for the quantitative variables to assess whether the assumption of normal distribution was met. This analysis was based on measures of skewness, kurtosis, the Kolmogorov-Smirnov test, and histograms. Subsequently, a descriptive analysis of the studied variables was carried out. For the quantitative variables with normal distribution, means and standard deviations were calculated. For those that did not show normality, means, standard deviations, medians and interquartile range were calculated. As for the qualitative variables, absolute and relative frequencies are shown. The normality assumption was not met for all variables; therefore, in these cases, non-parametric tests were conducted. Next, the Mann Whitney test was performed with the aim of comparing the means of the predicted mortality rate by the assessed scales between the group of patients who died and the group of patients who did not die within the first 30 days after surgery. Additionally, the means of the predicted morbidity rate by the assessed scales were compared between the group of patients who experienced complications and the group of patients who did not experience complications within the first 30 days after surgery. The scales were analyzed for calibration and discrimination, both globally and by subgroups. For all statistical analyses, a p-value less than 0.05 was considered significant. Calibration was defined as the capacity of the scale to correctly predict the probability of an event occurrence in a population [3,19]. This was assessed by comparing the observed number of events with the expected number based on the Observed-to-Expected [O:E) ratio and the Hosmer-Lemeshow test . In this test, p<0.05 indicates poor calibration, meaning there are significant differences between the observed and expected values [11). An O:E ratio <1 indicates that the scale overestimates morbidity and mortality, while, an O:E> 1 indicates that the scale underestimates morbidity and mortality [7]. Discrimination was defined as the ability of the scale to distinguish between patients who will survive and those who will die [3,19], measured by the area under the Receiver Operating Characteristic [ROC) curve. The discrimination levels of the scale depend on the Area Under the Curve [AUC), therefore an AUC below than 0.70 indicates low discrimination, between 0.70-0.80 indicates moderate discrimination and above 0.80 indicates good discrimination [7,19]. To analyze the relationship between the various scales, Spearman's correlation coefficient was also used. Finally, Kaplan-Meier curves were used to analyze survival associated with the Long-Rank test to compare the survival of different groups of patients.
5. Conclusions
GC surgery is associated with considerable morbidity and mortality, making it essential to determine surgical risk preoperatively in order to optimize patients at higher risk of postoperative morbidity and mortality. Several scales have been developed with the aim of predicting the morbidity and mortality associated with this type of surgical intervention, but none have satisfactorily met this need. The present study evaluated the POSSUM, P-POSSUM, and O-POSSUM scales.
In this study, for mortality estimation, both POSSUM and P-POSSUM demonstrated better overall calibration as well as in various subgroups. POSSUM overestimated mortality, while O-POSSUM underestimated it. Regarding discrimination, POSSUM exhibited the best discrimination, followed by P-POSSUM, and finally O-POSSUM. Concerning morbidity, the POSSUM scale underestimated the number of complications but demonstrated good discriminative capacity.
Thus, overall, POSSUM and P-POSSUM more accurately predicted the occurrence of morbidity and mortality. These scales should be applied to different populations to test their accuracy. In the future, conducting a prospective study involving other surgical risk scales would be important.
Author Contributions
Conceptualization, A.F.P., A.A., A.P.P., and S.F.M.; methodology, A.P.P. and S.F.M.; validation, A.A. and S.F.M.; formal analysis, A.F.P. and A.P.P.; investigation, A.P.P. and S.F.M.; resources, A.F.P. and A.A.; writing—original draft preparation, A.F.P., A.A. and S.F.M.; writing—review and editing, A.A. and S.F.M.; supervision, A.P.P and S.F.M. All authors have read and agreed to the published version of the manuscript.
Funding
This research received no external funding.
Institutional Review Board Statement
The study was conducted in accordance with the Declaration of Helsinki and approved by all the necessary institutions: the Ethics Committee for Health of Braga’s Hospital (protocol code: 153_2021; date of approval: 6 october 2021) and the Ethics Committee for Research in Life and Health Sciences (protocol code: CEICVS 092/2021; date of approval: 2 november 2021).
Informed Consent Statement
Informed consent was obtained from all subjects involved in the study.
Data Availability Statement
The data presented in this study are available on request from the corresponding author. The data are not publicly available due to the protection of patient privacy.
Conflicts of Interest
The authors declare no conflict of interest.
References
- Sung H, Ferlay J, Siegel RL, Laversanne M, Soerjomataram I, Jemal A, et al. Global Cancer Statistics 2020: GLOBOCAN Estimates of Incidence and Mortality Worldwide for 36 Cancers in 185 Countries. CA Cancer J Clin. 2021;71(3):209–49. [CrossRef]
- DGS. PORTUGAL Doenças Oncologicas em Números - 2014. 2014;86. Available from: http://www.dgs.pt/estatisticas-de-saude/estatisticas-de-saude/publicacoes/portugal-doencas-oncologicas-em-numeros-2014.asp.
- Aavv. Avaliação da performance cirúrgica pelo P-POSSUM em doentes com cancro gástrico - revisão de 5 anos. Rev Port Cardiol. 2006;7:104 ST-Revista Portuguesa de Psicanálise.
- Okines A, Verheij M, Allum W, Cunningham D, Cervantes A. Gastric cancer: ESMO clinical practice guidelines for diagnosis, treatment and follow-up. Ann Oncol [Internet]. 2010;21(SUPPL. 5):v50–4. [CrossRef]
- Pan QX, Su ZJ, Zhang JH, Wang CR, Ke SY. A comparison of the prognostic value of preoperative inflammation-based scores and TNM stage in patients with gastric cancer. Onco Targets Ther. 2015;8:1375–85.
- Kanda M. Preoperative predictors of postoperative complications after gastric cancer resection. Surg Today [Internet]. 2020;50(1):3–11. [CrossRef]
- Nagabhushan JS, Srinath S, Weir F, Angerson WJ, Sugden BA, Morran CG. Comparison of P-POSSUM and O-POSSUM in predicting mortality after oesophagogastric resections. Postgrad Med J. 2007;83(979):355–8. [CrossRef]
- Hong S, Wang S, Xu G, Liu JL. Evaluation of the POSSUM, p-POSSUM, o-POSSUM, and APACHE II scoring systems in predicting postoperative mortality and morbidity in gastric cancer patients. Asian J Surg [Internet]. 2017;40(2):89–94. [CrossRef]
- Tekkis PP, McCulloch P, Poloniecki JD, Prytherch DR, Kessaris N, Steger AC. Risk-adjusted prediction of operative mortality in oesophagogastric surgery with O-POSSUM. Br J Surg. 2004;91(3):288–95. [CrossRef]
- Luna A, Rebasa P, Navarro S, Montmany S, Coroleu D, Cabrol J, et al. An evaluation of morbidity and mortality in oncologic gastric surgery with the application of POSSUM, P-POSSUM, and O-POSSUM. World J Surg. 2009;33(9):1889–94. [CrossRef]
- Powell C, Trickey R, Morgan C. Audit of Patients Receiving Palliative Chemotherapy for Oesophago-gastric Cancer at Velindre Cancer Centre in 2012. Clin Oncol [Internet]. 2014;26:S2. Available from: http://dx.doi.org/10.1016/j.clon.2014.04.00. [CrossRef]
- Scott S, Lund JN, Gold S, Elliott R, Vater M, Chakrabarty MP, et al. An evaluation of POSSUM and P-POSSUM scoring in predicting post-operative mortality in a level 1 critical care setting. BMC Anesthesiol. 2014;14(1):1–7. [CrossRef]
- KISA NG, KISA E, Cevik BE. Prediction of Mortality in Patients After Oncologic Gastrointestinal Surgery: Comparison of the ASA, APACHE II, and POSSUM Scoring Systems. Cureus. 2021;13(3). [CrossRef]
- Vather R, Zargar-Shoshtari K, Adegbola S, Hill AG. Comparison of the possum, P-POSSUM and Cr-POSSUM scoring systems as predictors of postoperative mortality in patients undergoing major colorectal surgery. ANZ J Surg. 2006;76(9):812–6. [CrossRef]
- Tez M, Yoldaş Ö, Gocmen E, Külah B, Koc M. Evaluation of P-POSSUM and CR-POSSUM scores in patients with colorectal cancer undergoing resection. World J Surg. 2006;30(12):2266–9. [CrossRef]
- Bollschweiler E, Lubke T, Monig SP, Holscher AH. Evaluation of POSSUM scoring system in patients with gastric cancer undergoing D2-gastrectomy. BMC Surg. 2005;5:1–7. [CrossRef]
- Lamb P, Sivashanmugam T, White M, Irving M, Wayman J, Raimes S. Gastric cancer surgery - A balance of risk and radically. Ann R Coll Surg Engl. 2008;90(3):235–42. [CrossRef]
- Sah BK, Min CM, Yan WX, Meng YQ, Chen L, Ming X, et al. Risk adjusted auditing of postop complications in gastric cancer patients by POSSUM. Int J Surg. 2008;6(4):311–6. [CrossRef]
- Goulart A, Martins S. Avaliação do risco cirúrgico nos doentes com cancro colo-rectal: POSSUM ou ACPGBI? Rev Port Cir [Internet]. 2013;2(24):1–12. Available from: https://repositorium.sdum.uminho.pt/bitstream/1822/33553/1/goulart a_revista portuguesa de cirurgia 2013.pd.
- Copeland GP, Jones D, Walters M. POSSUM: A scoring system for surgical audit. Br J Surg. 1991;78(3):355–60. [CrossRef]
- Blay-Domínguez E, Lajara-Marco F, Bernáldez-Silvetti PF, Veracruz-Gálvez EM, Muela-Pérez B, Palazón-Banegas MÁ, et al. O-POSSUM score predicts morbidity and mortality in patients undergoing hip fracture surgery. Rev Española Cirugía Ortopédica y Traumatol (English Ed [Internet]. 2018;62(3):207–15. [CrossRef]
Figure 1.
Kaplan-Meier survival curve for overall patient survival (in months).
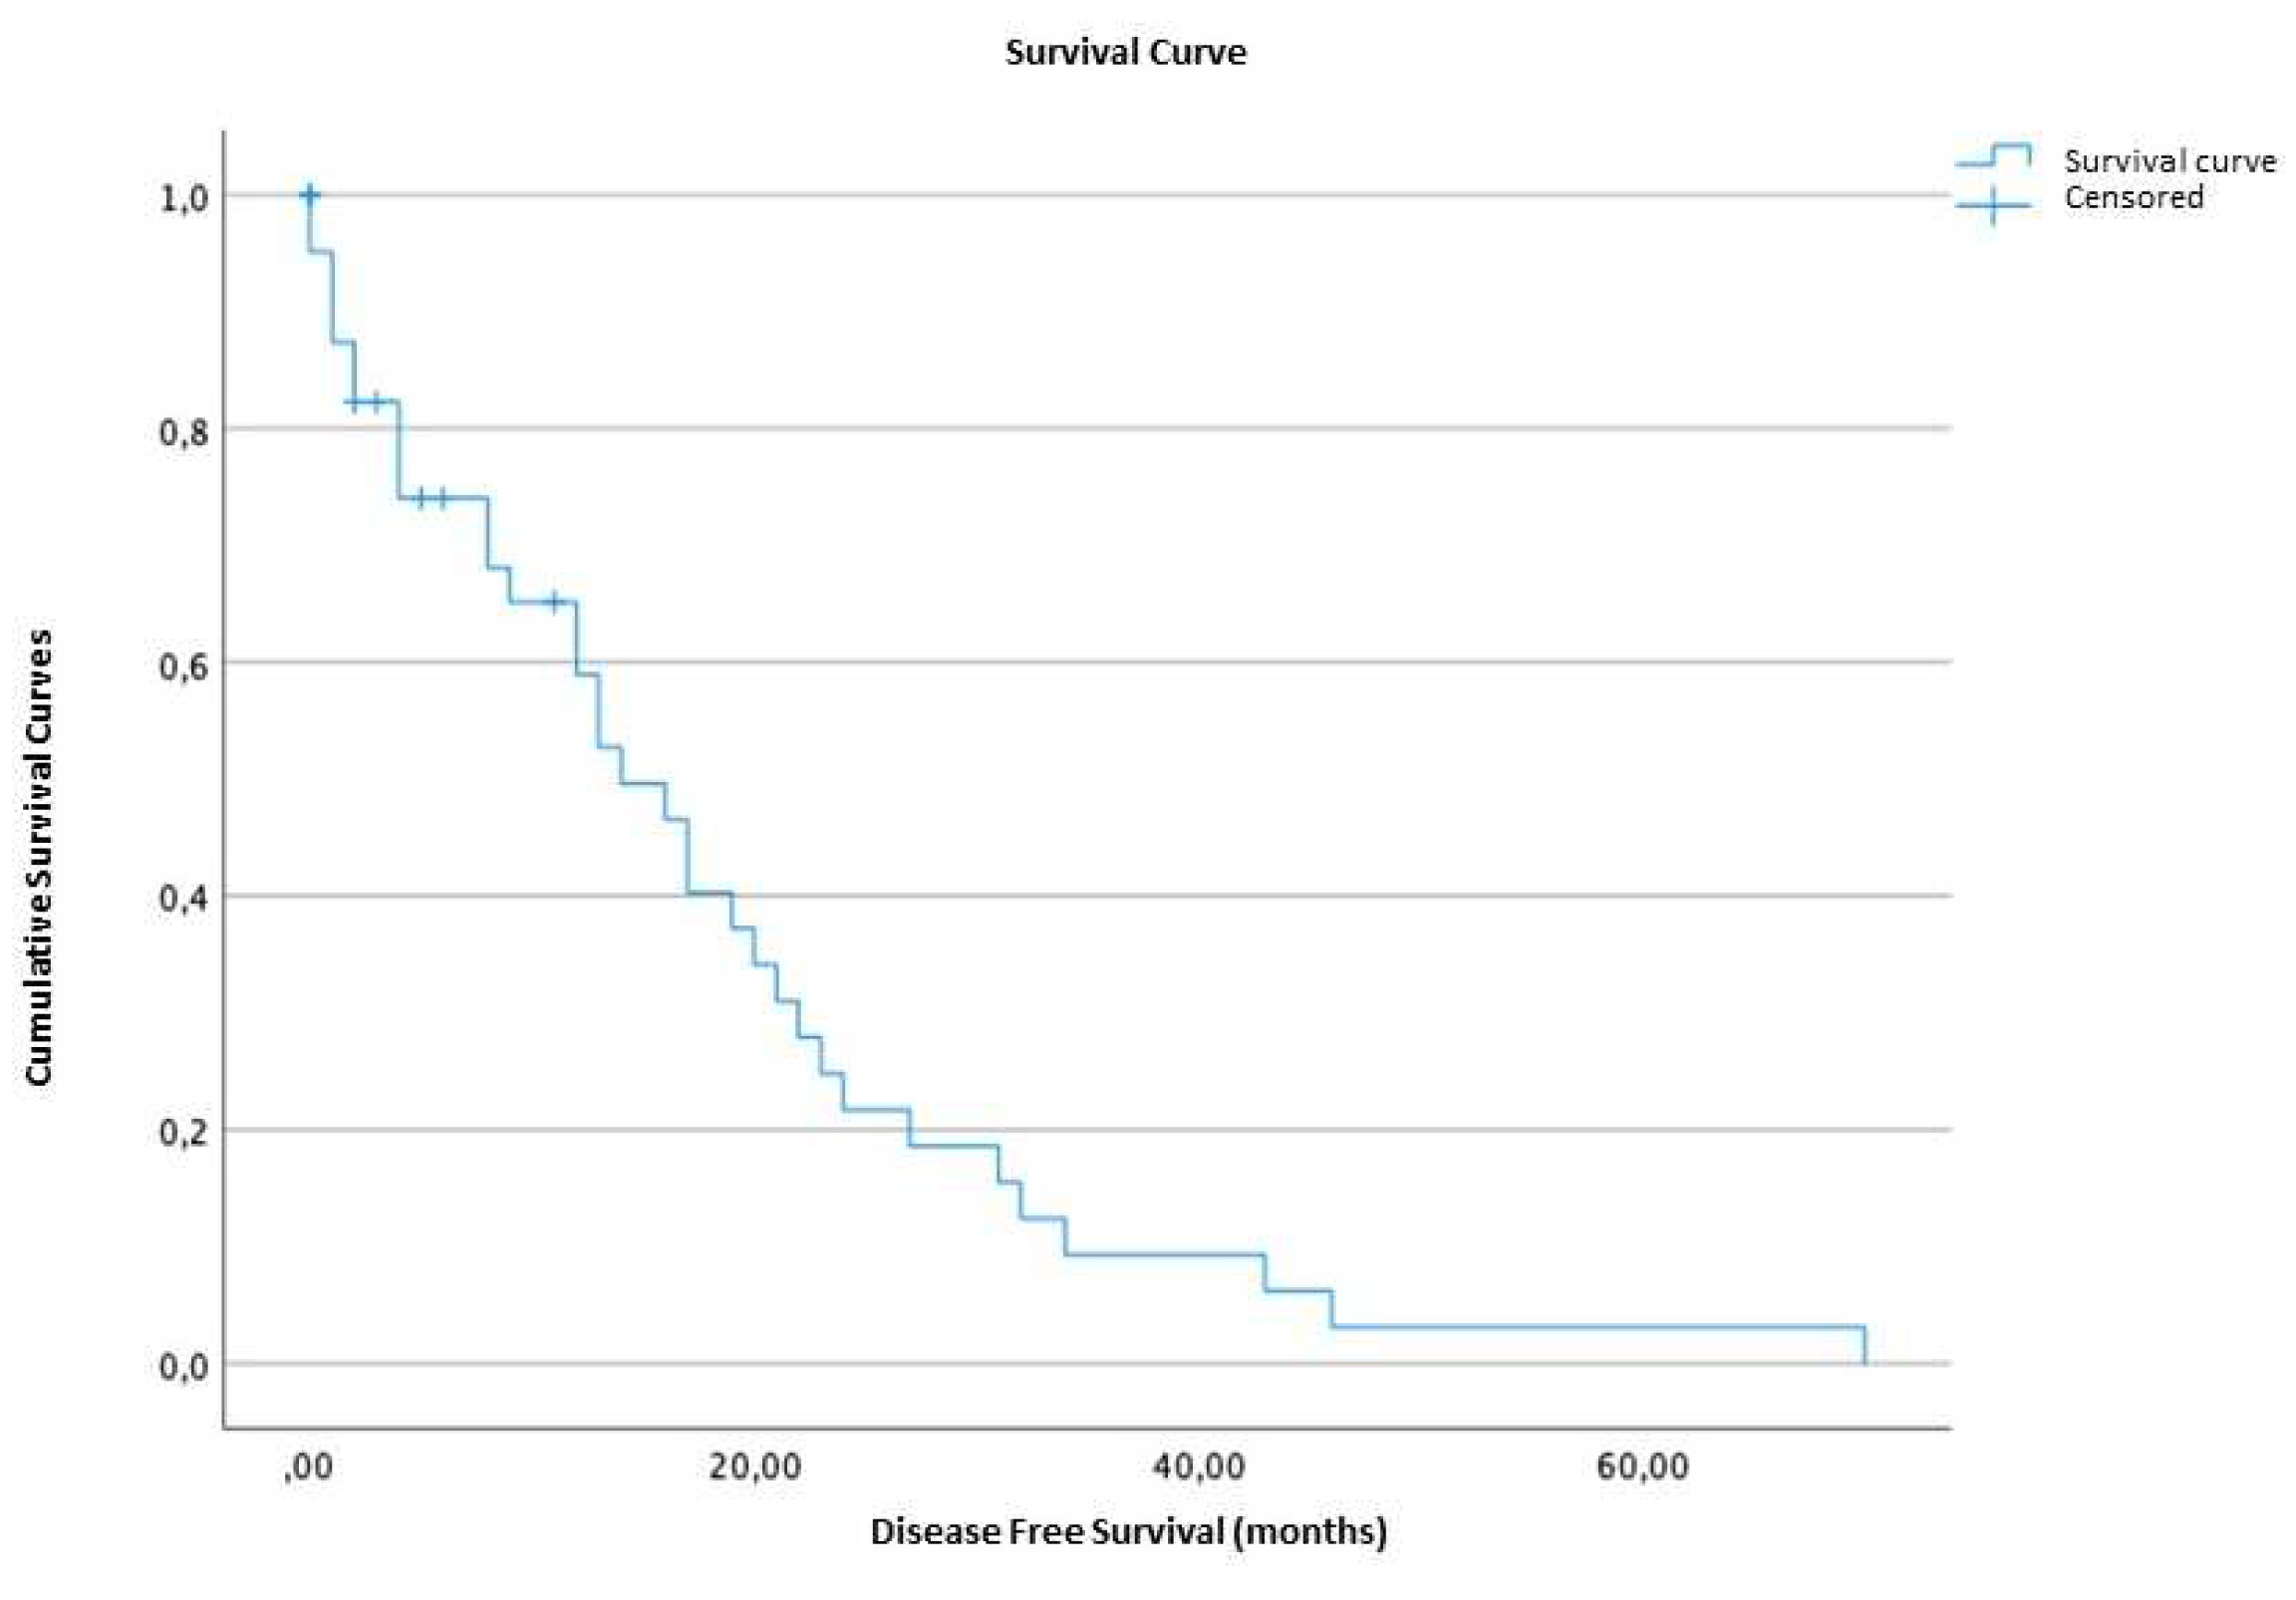
Figure 2.
Kaplan-Meier survival curve for disease-free survival of patients (in months).
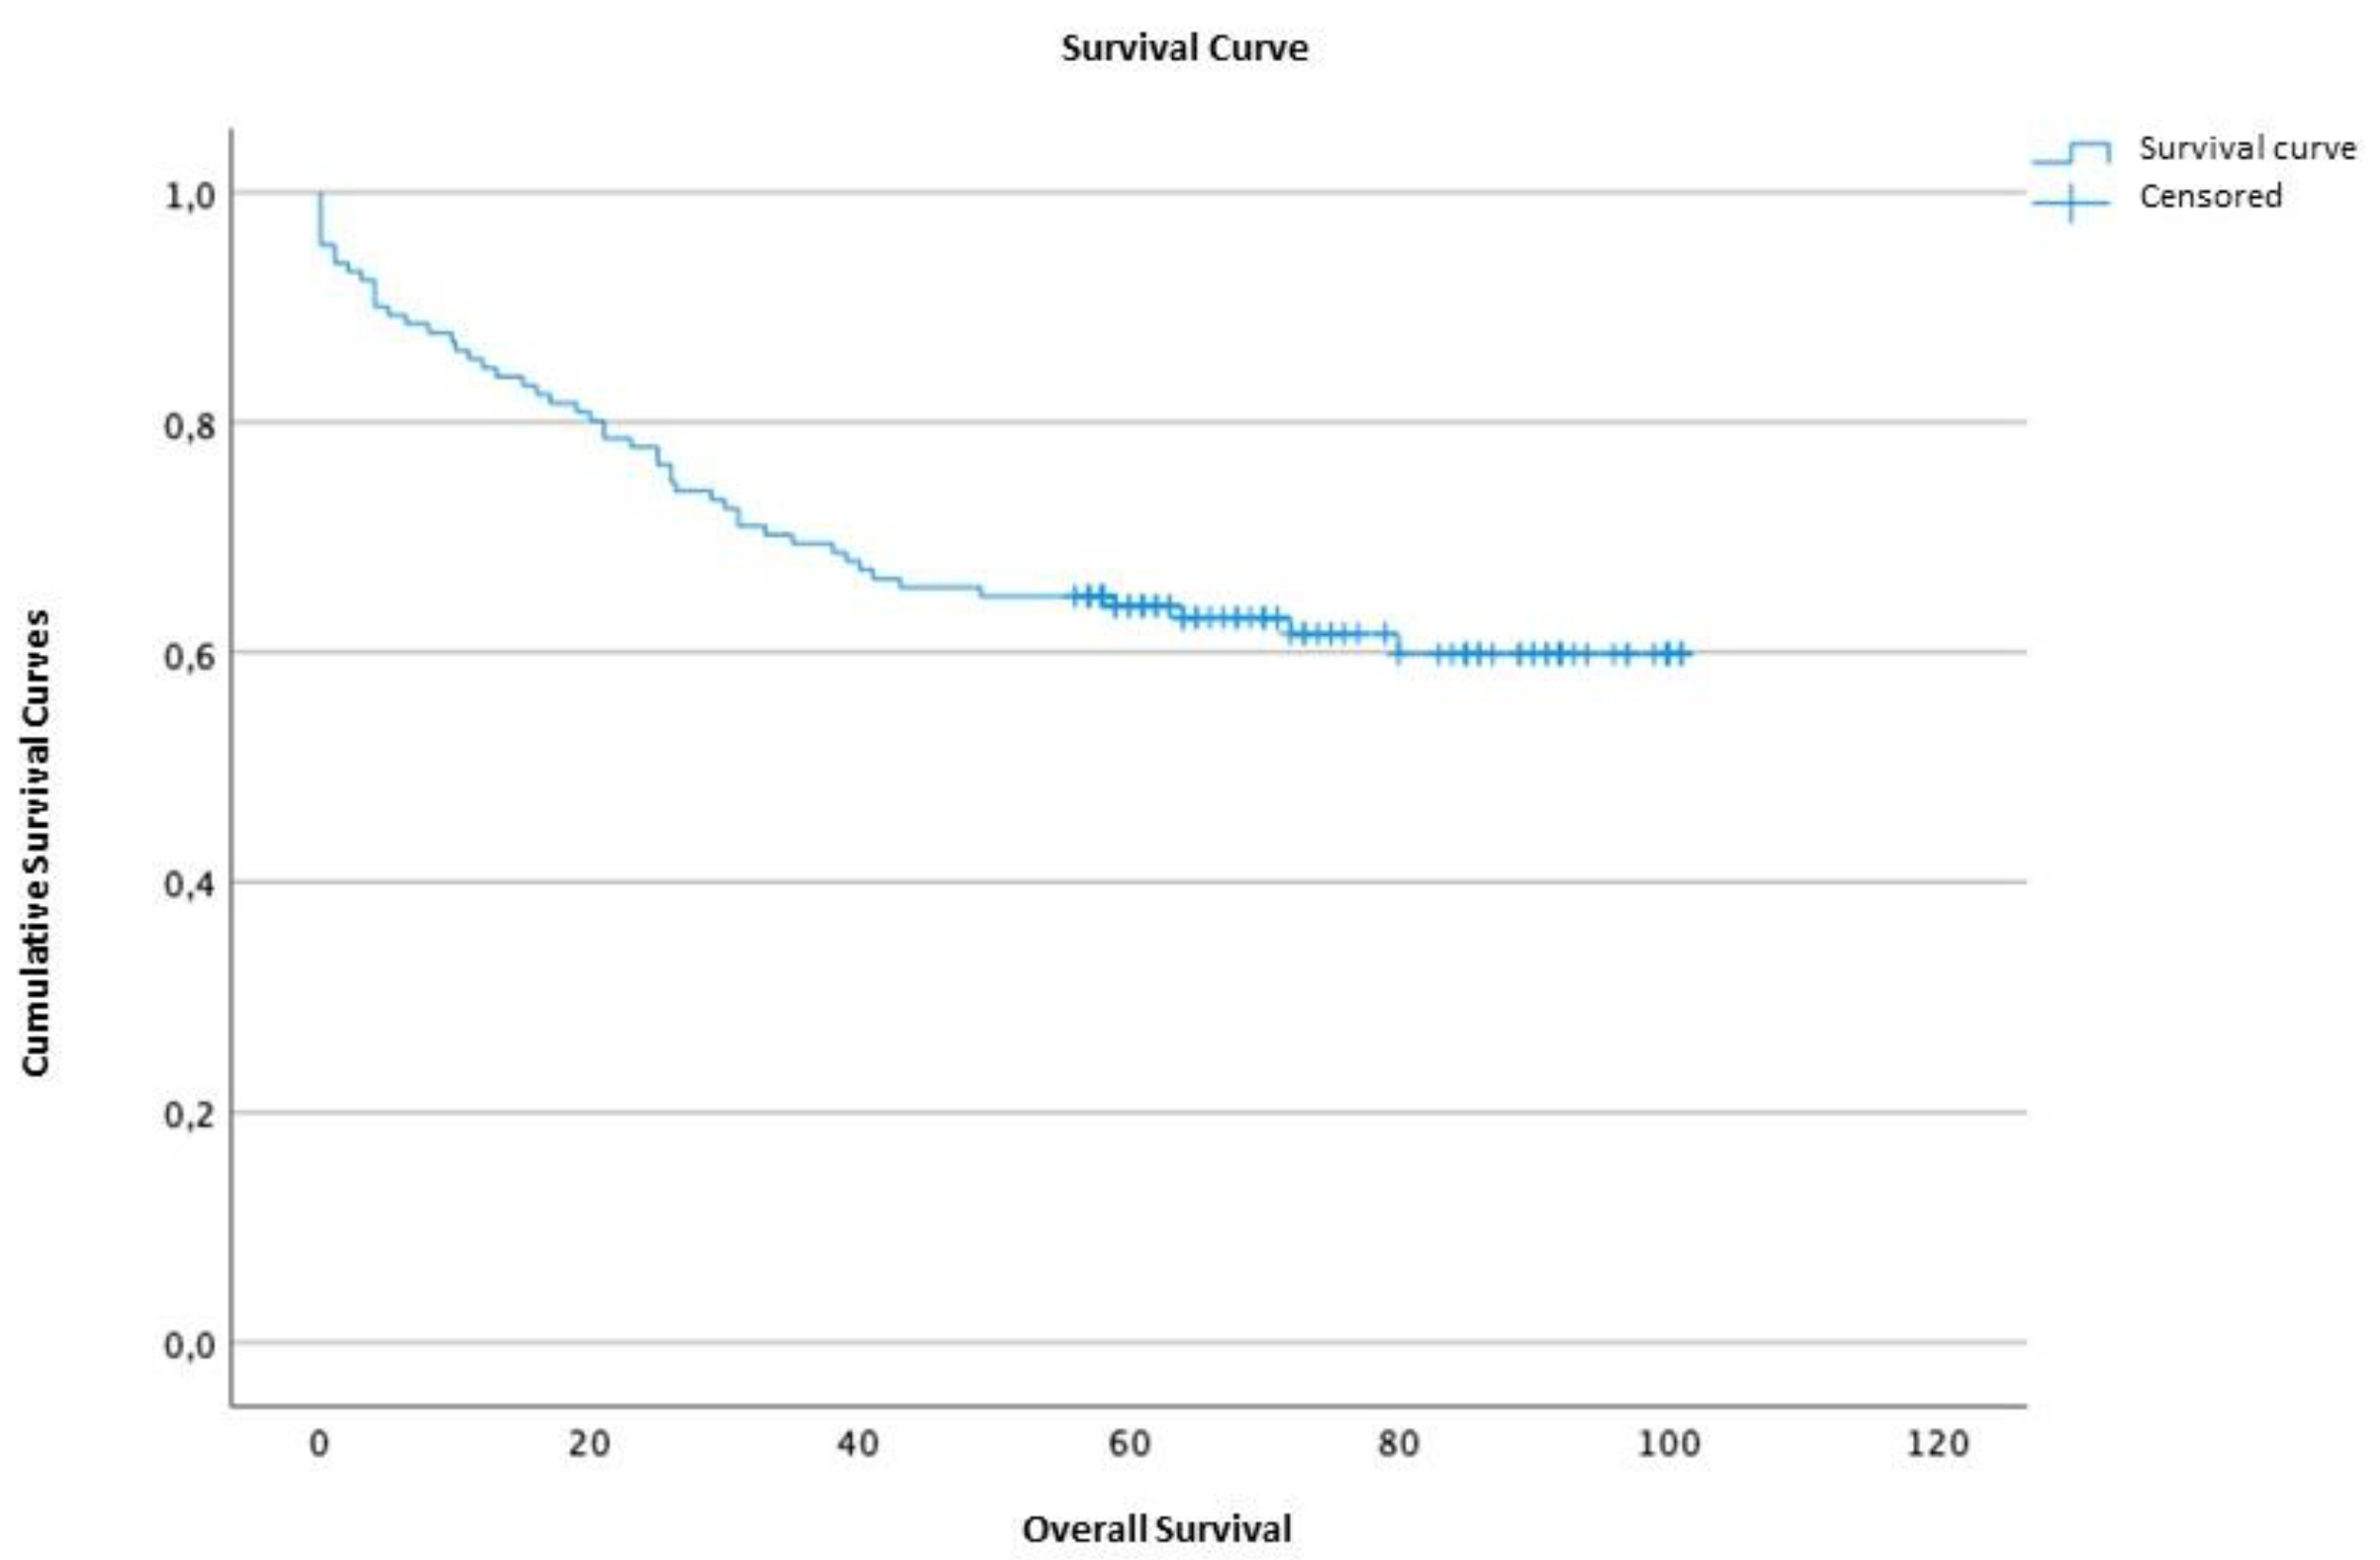
Figure 3.
ROC curve for mortality. Representation of the POSSUM scale (in blue), P-POSSUM (in green), O-POSSUM (in magenta), and reference line (in red).
Figure 3.
ROC curve for mortality. Representation of the POSSUM scale (in blue), P-POSSUM (in green), O-POSSUM (in magenta), and reference line (in red).
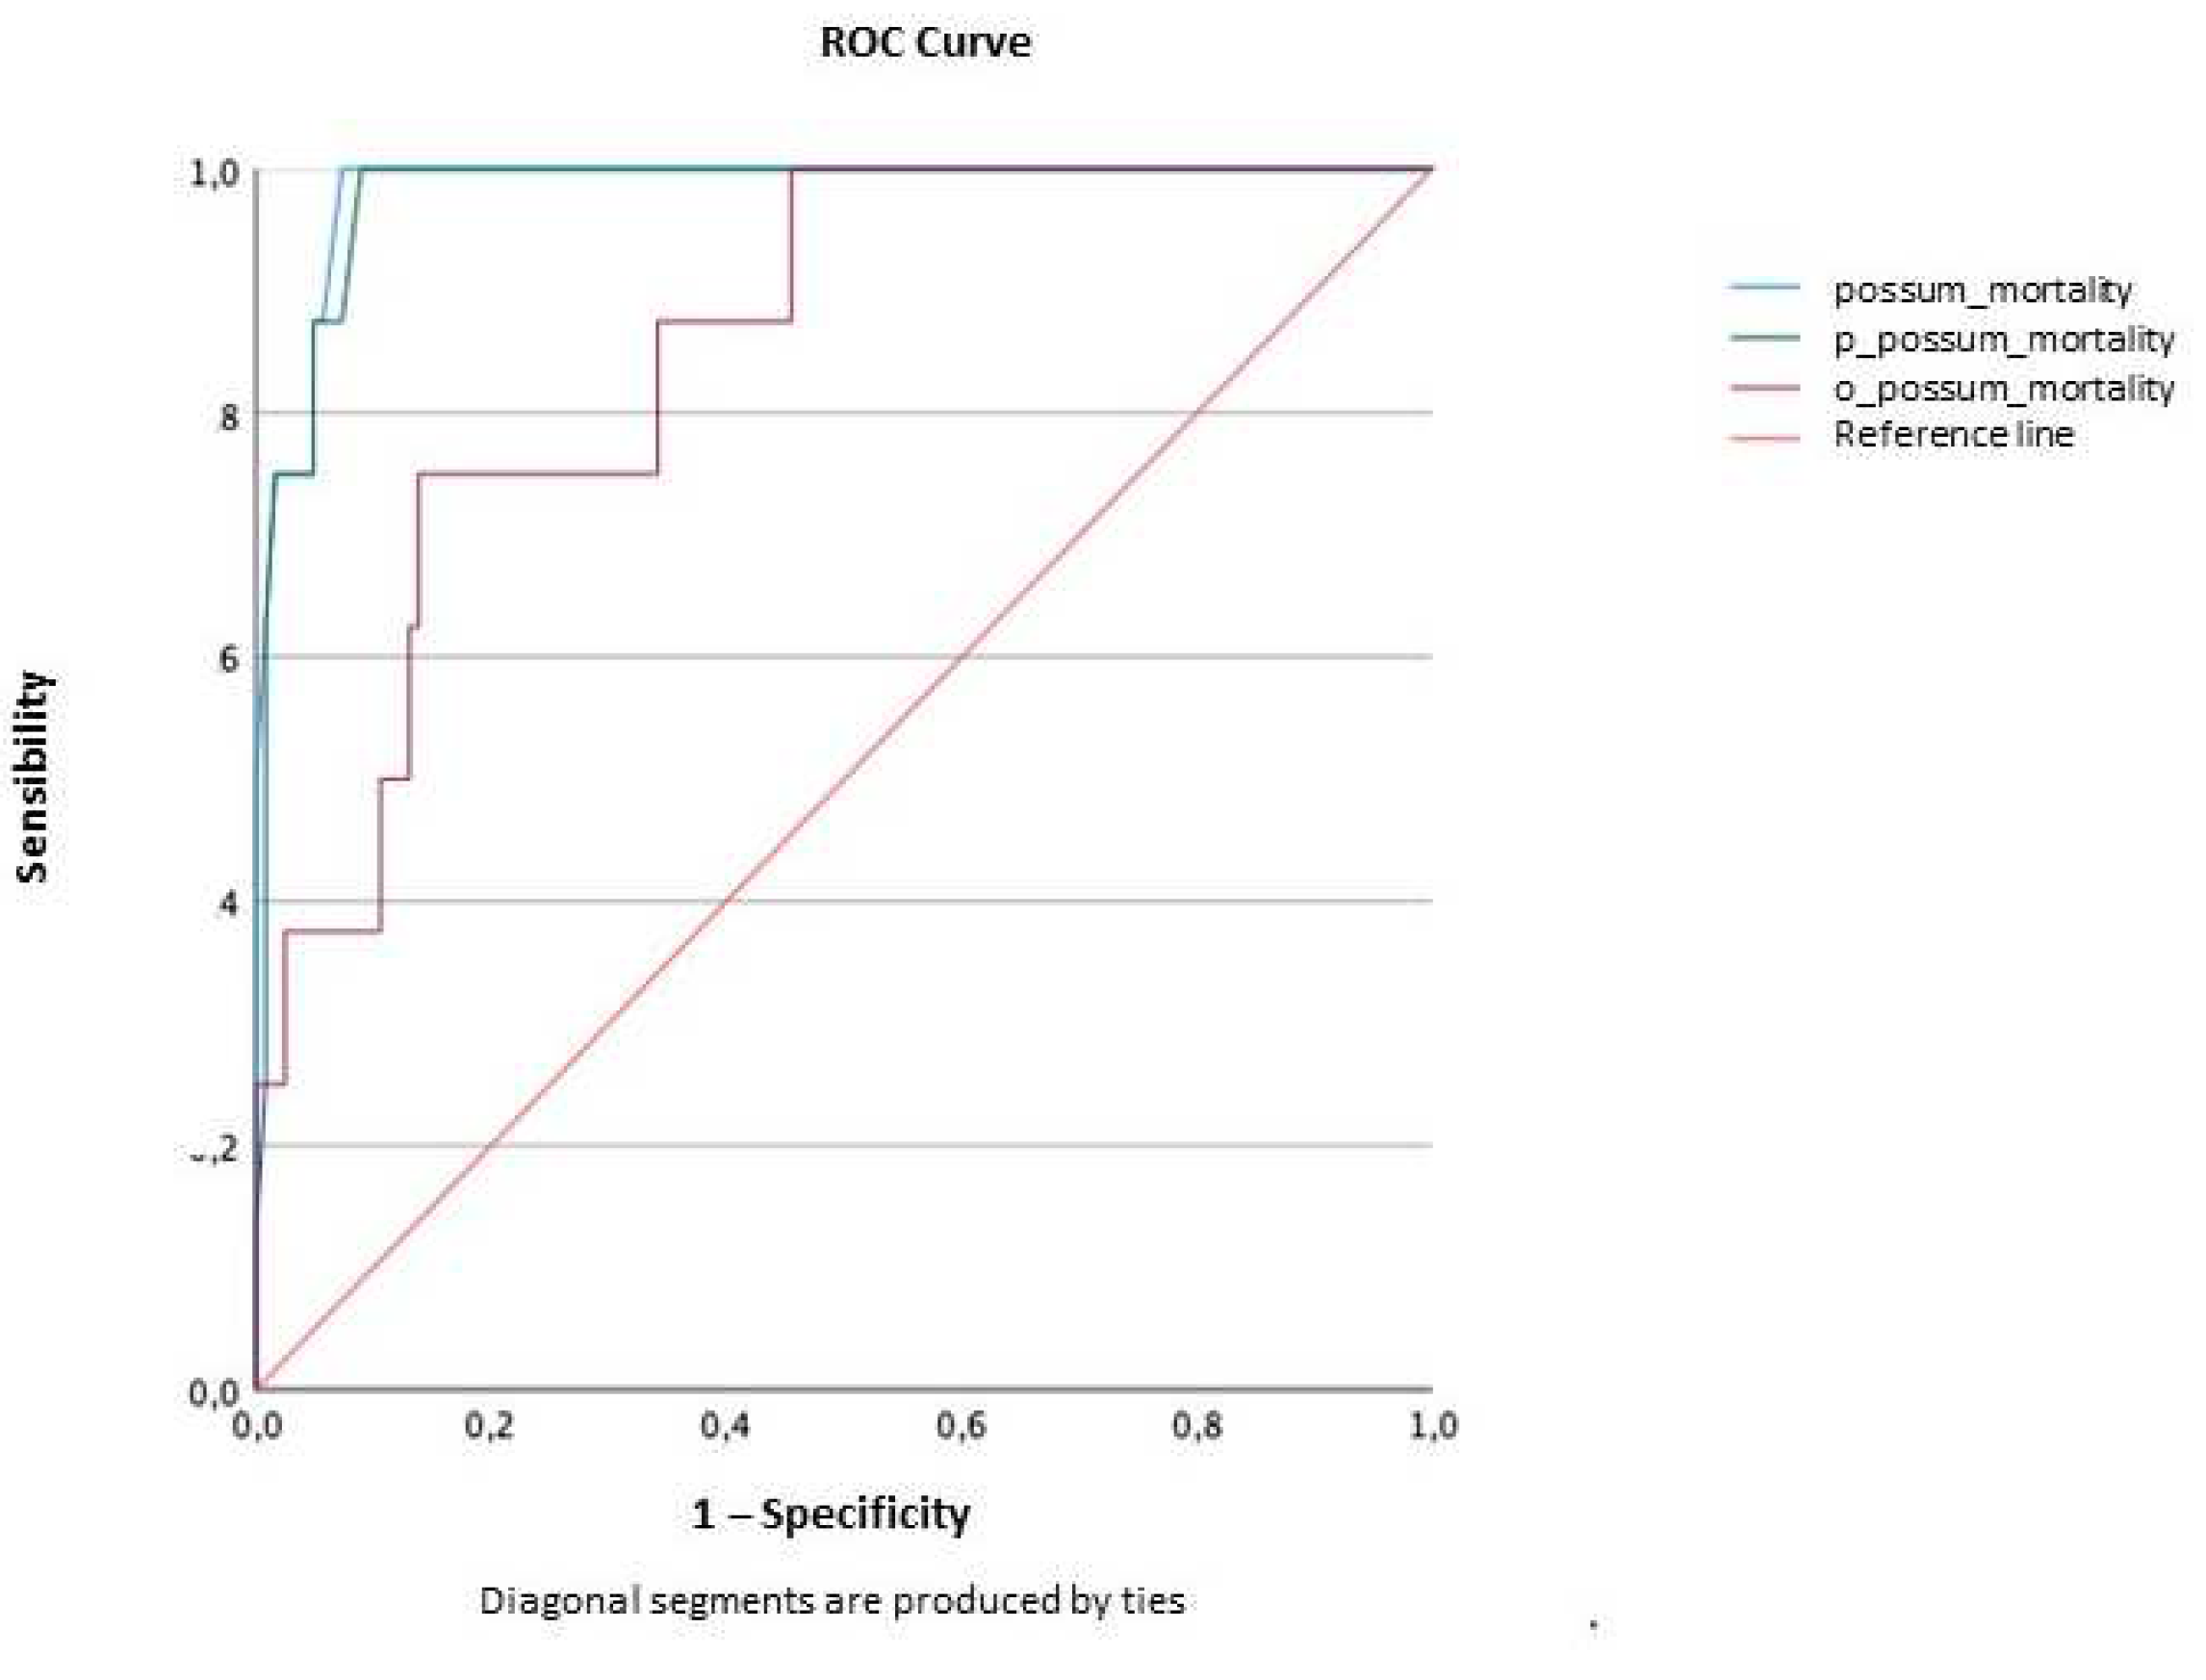
Figure 4.
ROC curve for morbidity. Representation of the POSSUM scale (in blue), P-POSSUM (in green), and reference line (in magenta).
Figure 4.
ROC curve for morbidity. Representation of the POSSUM scale (in blue), P-POSSUM (in green), and reference line (in magenta).
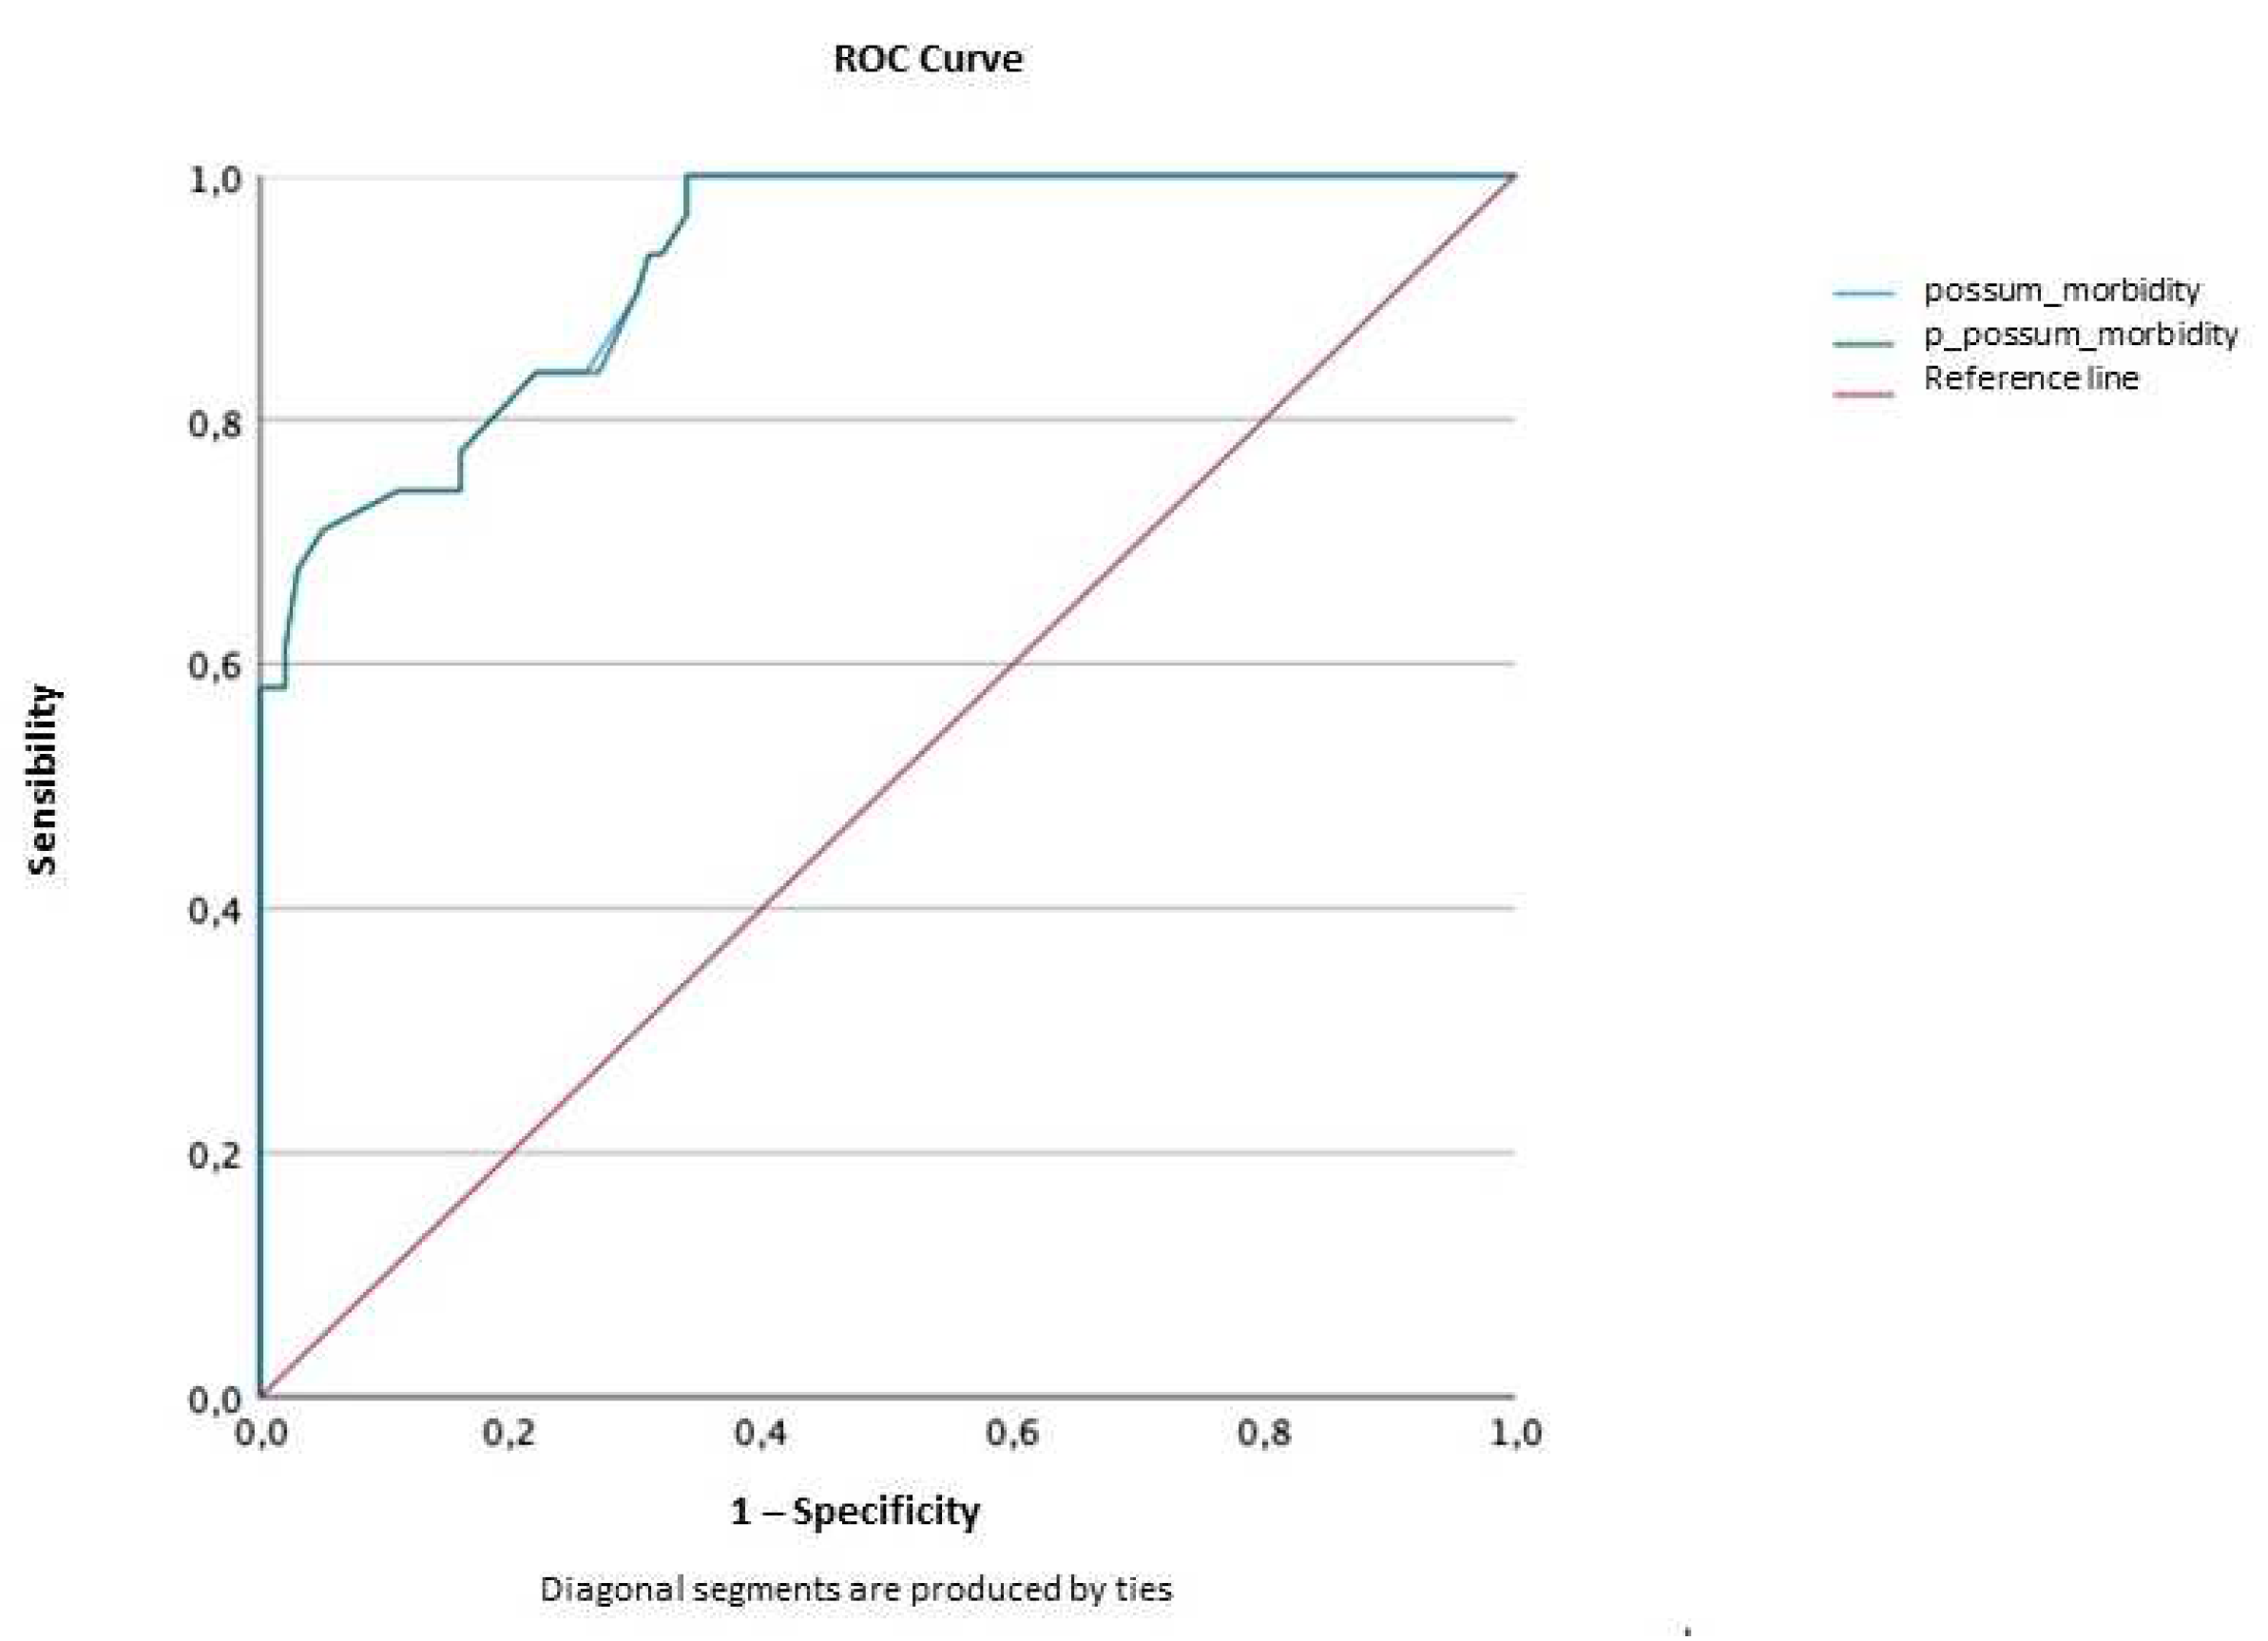
Figure 5.
Cumulative survival curve comparing patients with POSSUM score less than 4.19 (in blue) and patients with POSSUM score greater than or equal to 4.19 (in green), in months.
Figure 5.
Cumulative survival curve comparing patients with POSSUM score less than 4.19 (in blue) and patients with POSSUM score greater than or equal to 4.19 (in green), in months.
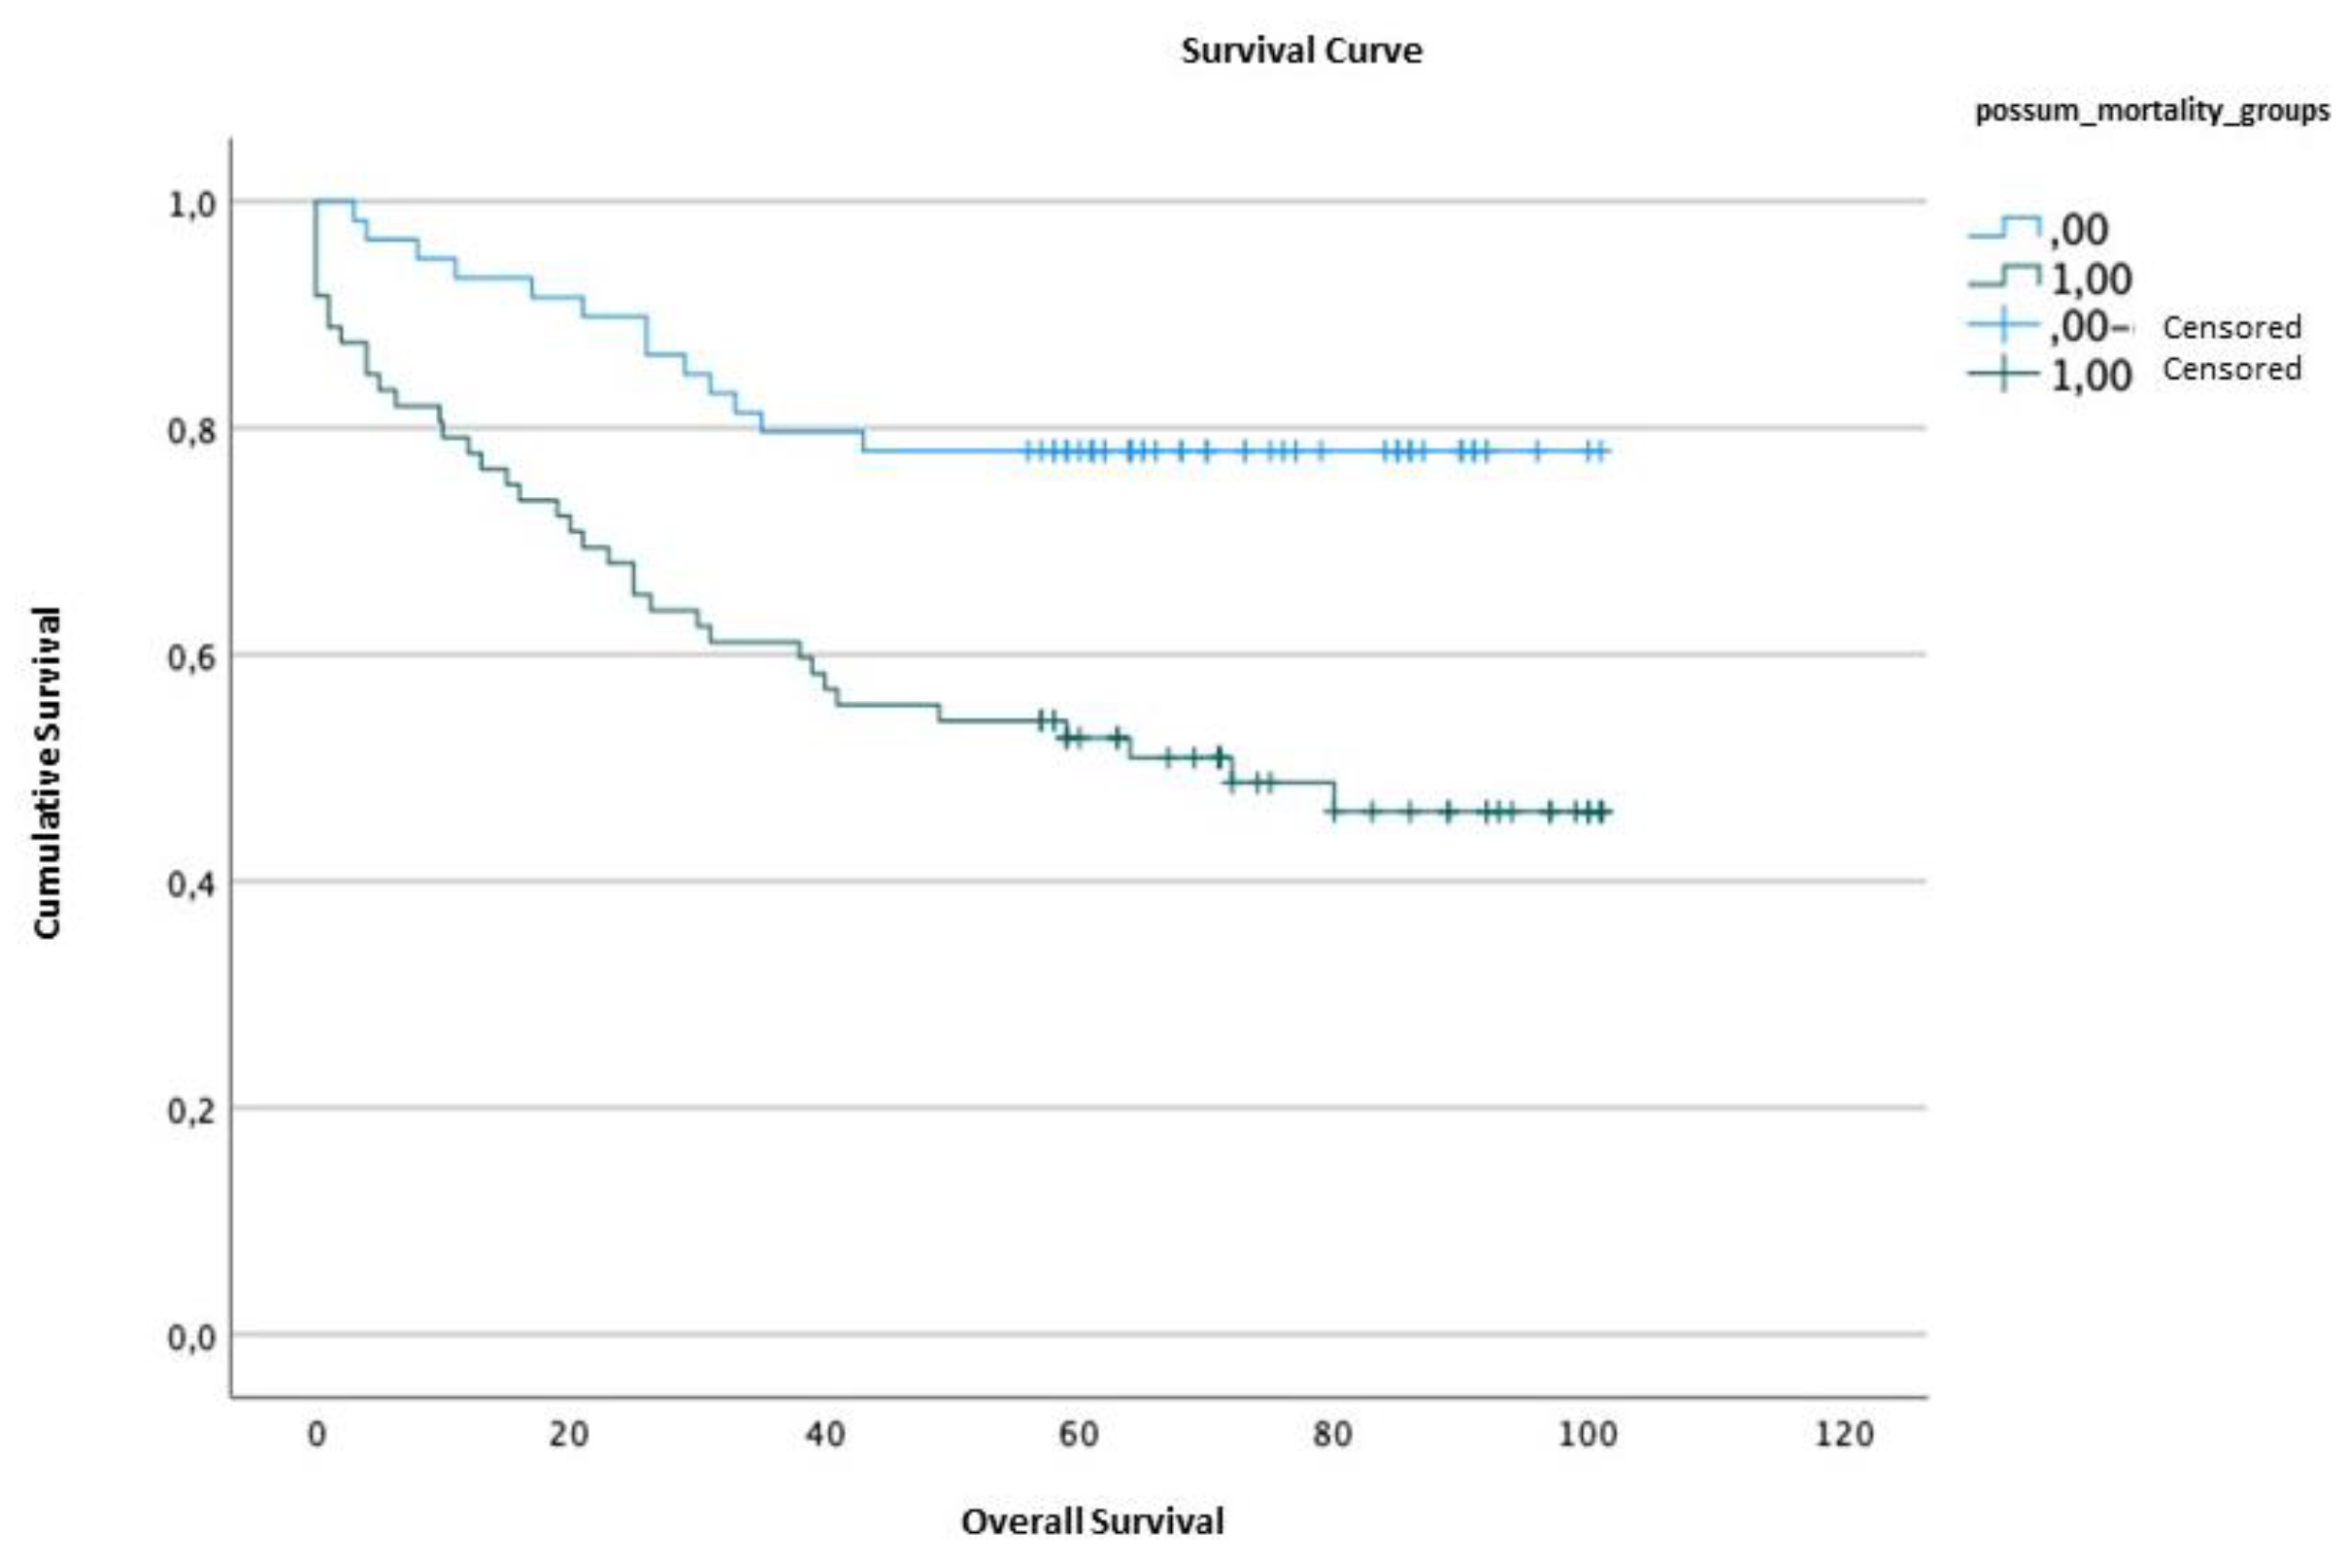
Figure 6.
Cumulative survival curve comparing patients with P-POSSUM score less than 1.18 (in blue) and patients with P-POSSUM score greater than or equal to 1.18 (in green), in months.
Figure 6.
Cumulative survival curve comparing patients with P-POSSUM score less than 1.18 (in blue) and patients with P-POSSUM score greater than or equal to 1.18 (in green), in months.
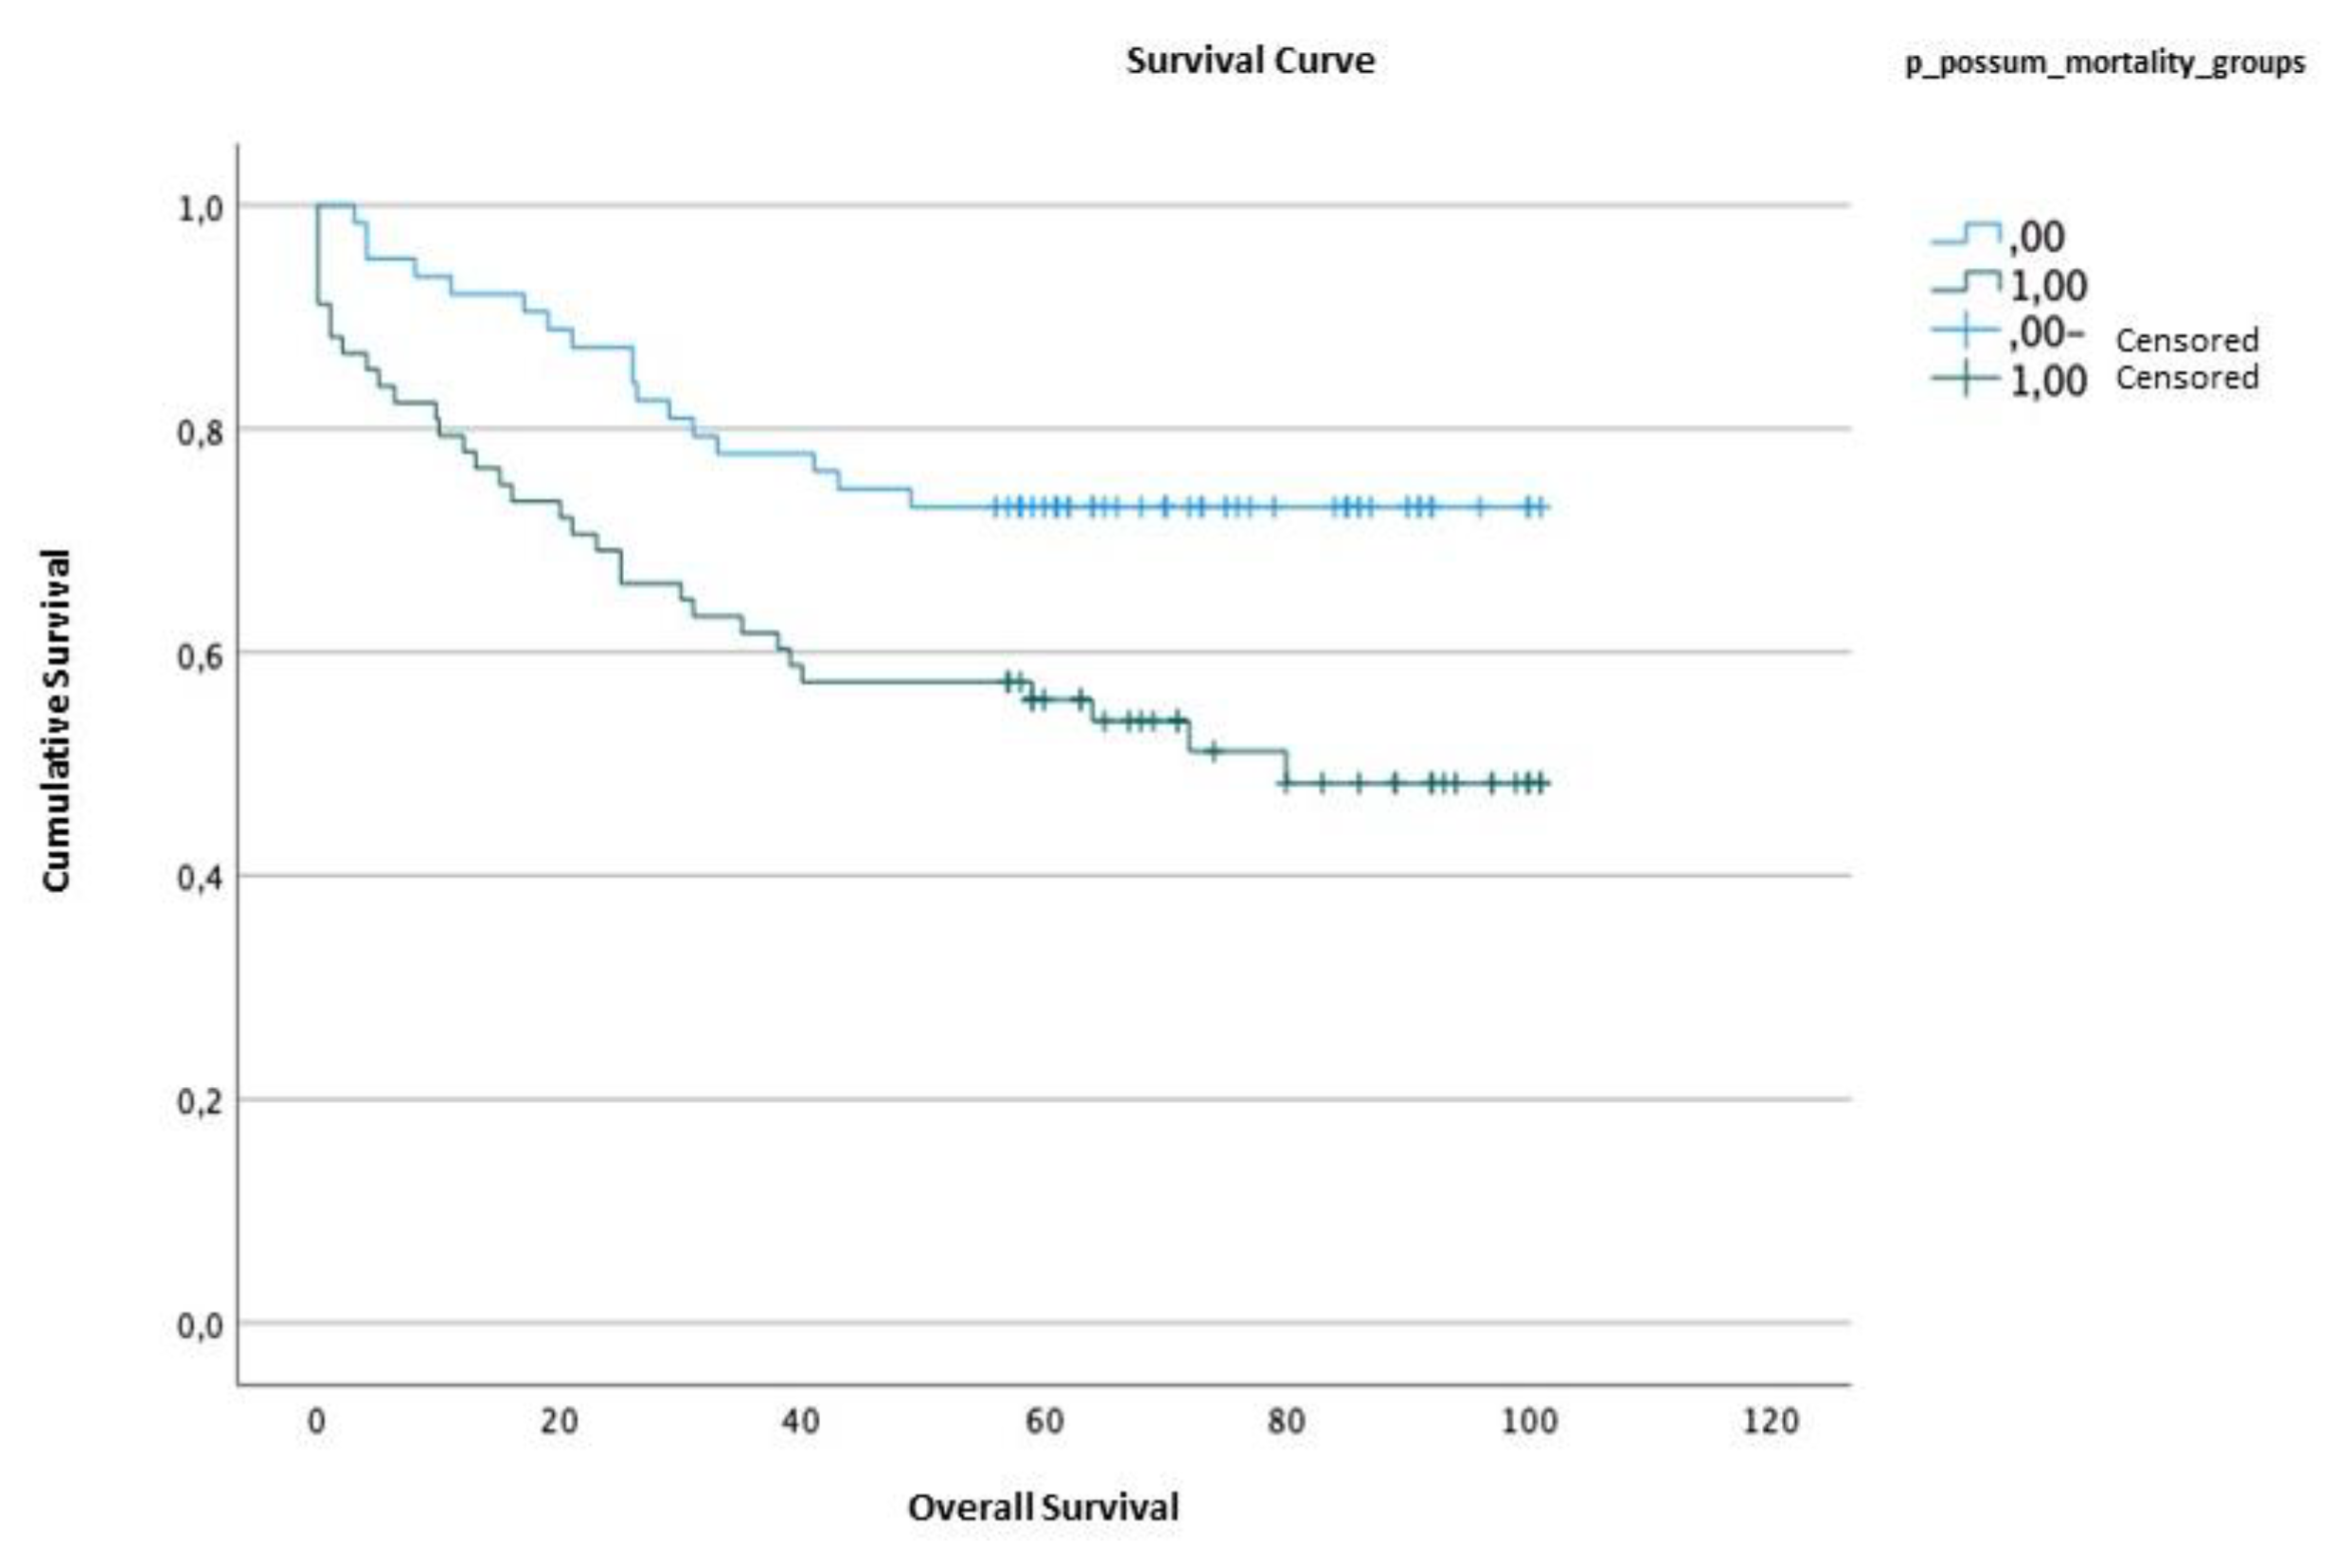
Figure 7.
Cumulative survival curve comparing patients with O-POSSUM score less than 10.25 (in blue) and patients with O-POSSUM score greater than or equal to 10.25 (in green), in months.
Figure 7.
Cumulative survival curve comparing patients with O-POSSUM score less than 10.25 (in blue) and patients with O-POSSUM score greater than or equal to 10.25 (in green), in months.
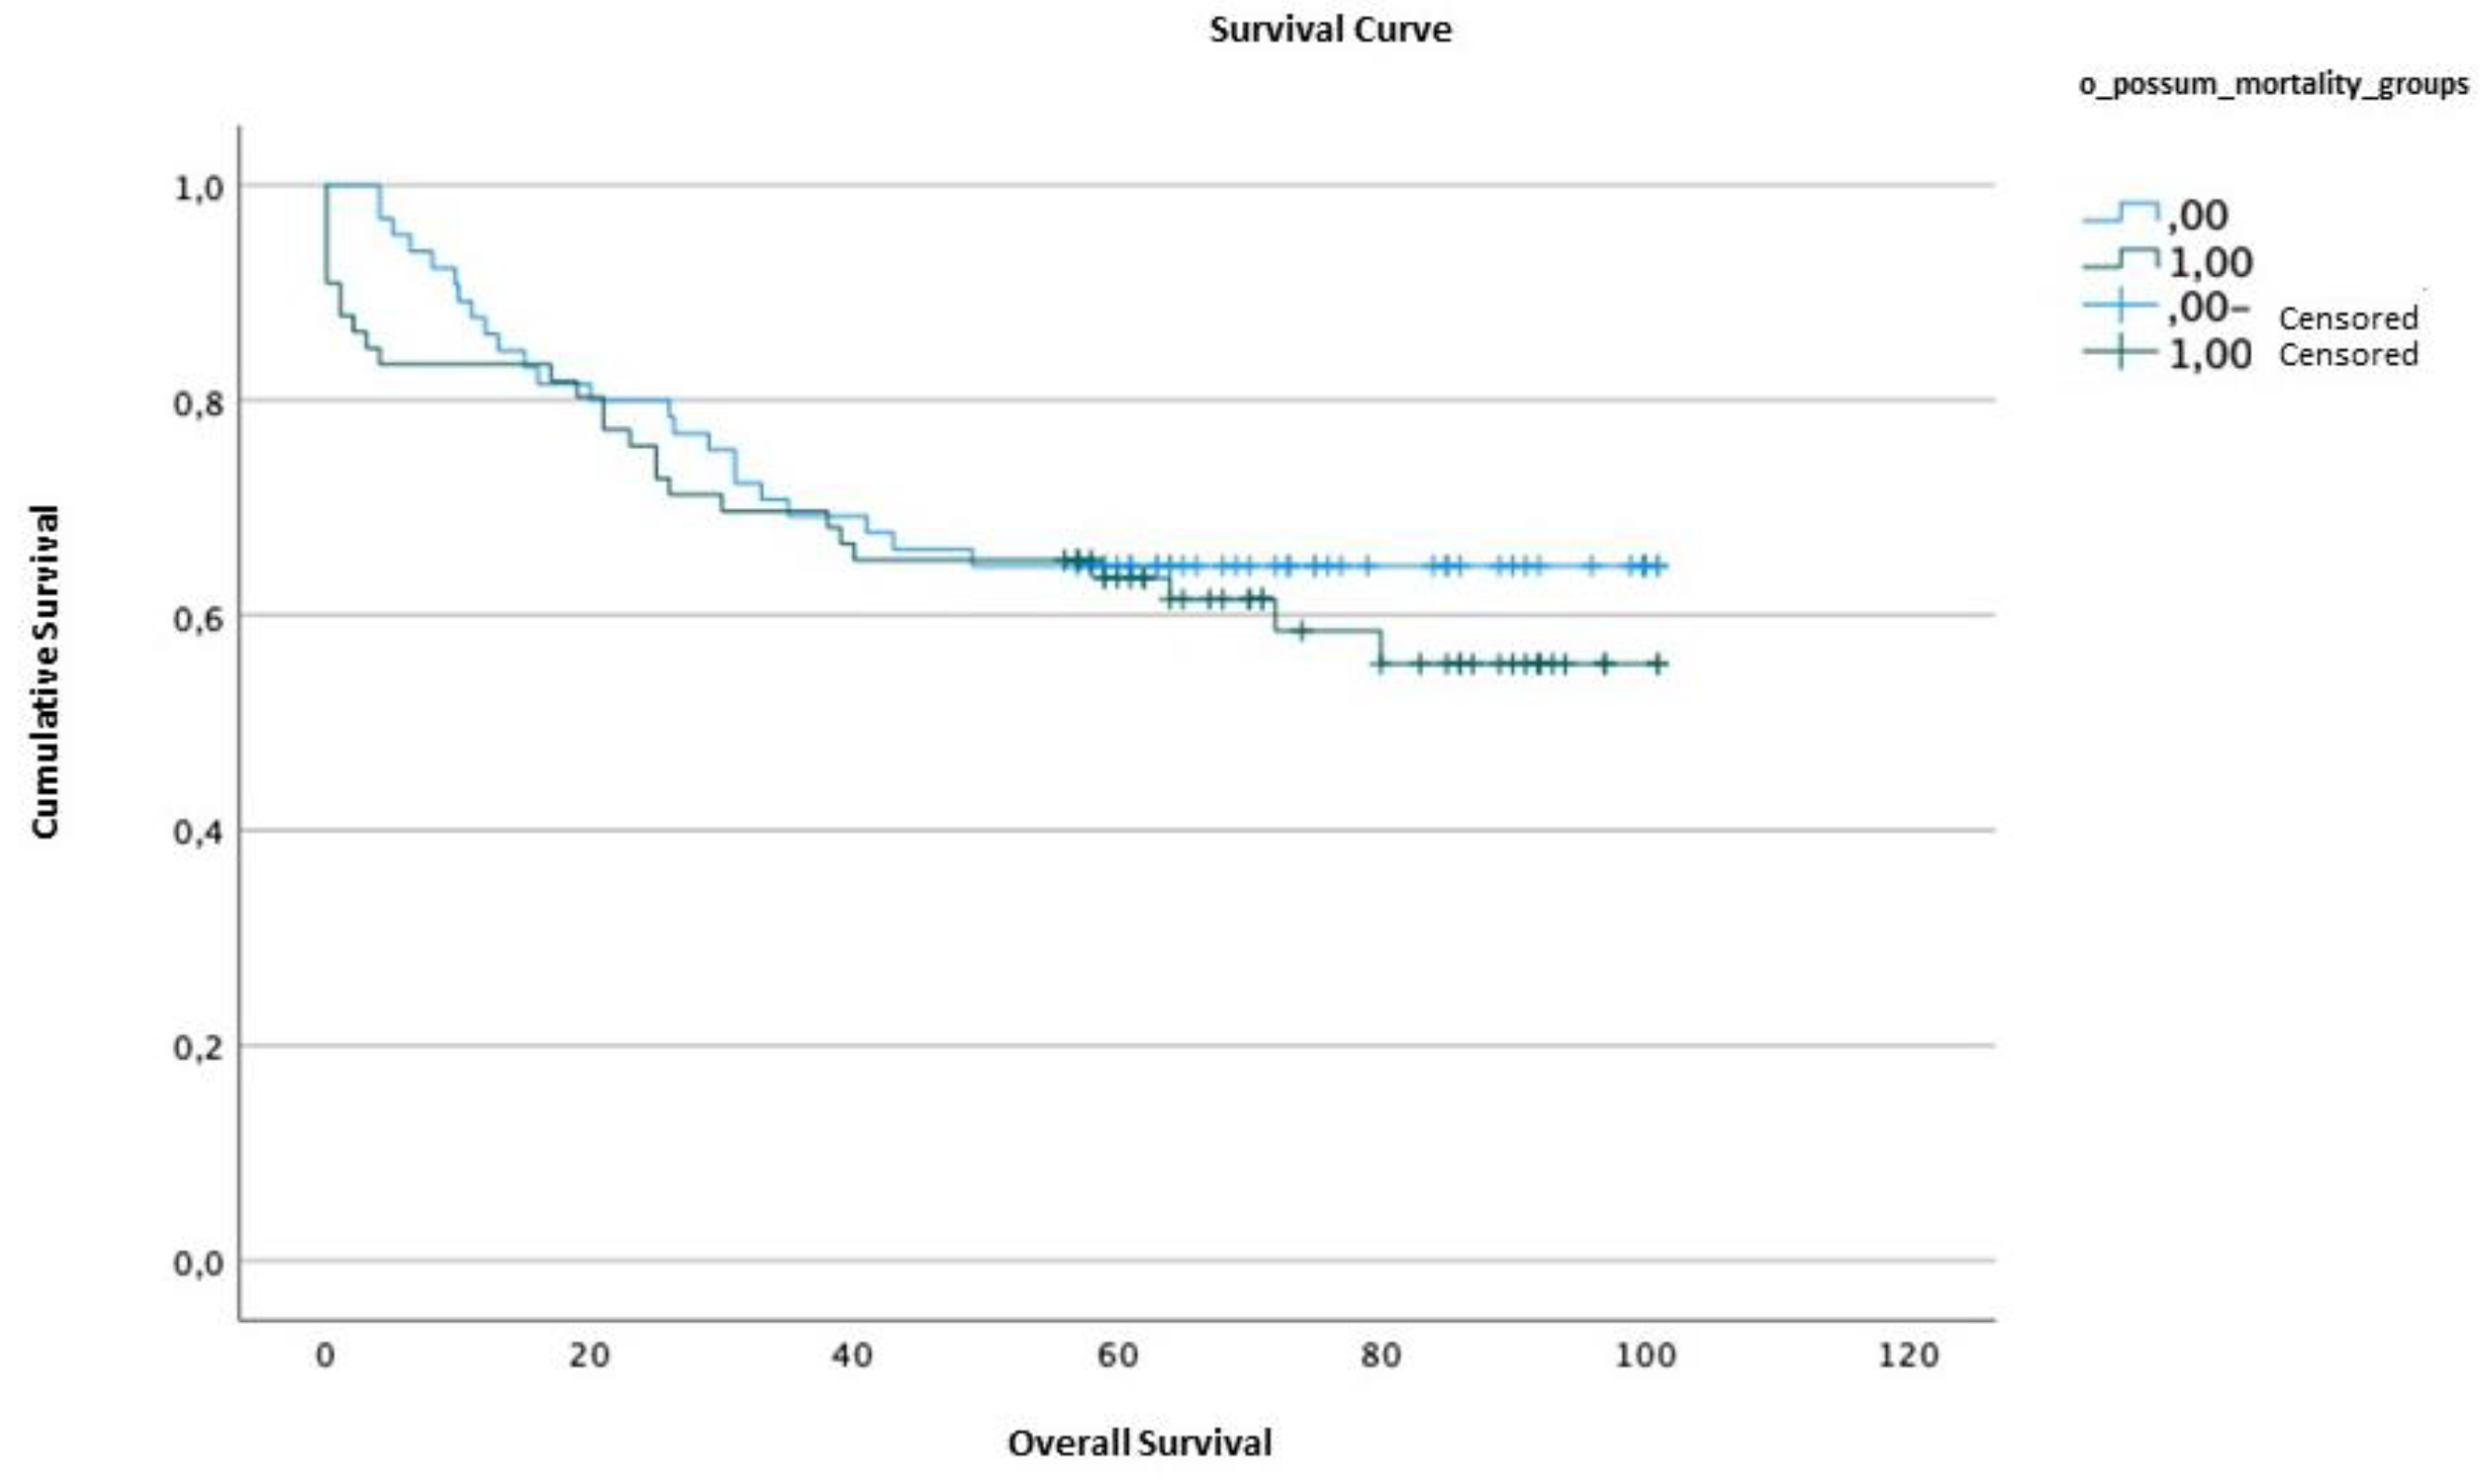

Table 1.
Characterization of patients under analysis.
| DATA | n (%) | |
| AGE(years) | <40 | 2 (1.5) |
| 40-49 | 12 (9.2) | |
| 50-59 | 34 (26) | |
| 60-69 | 20 (15.3) | |
| 70-79 | 44 (33.6) | |
| >80 | 19 (14.5) | |
| GENDER | Male | 74 (56.5) |
| Female | 57 (43.5) | |
| TUMOR LOCATION | Antrum | 57 (43.5) |
| Body | 39 (29.8) | |
| Body and Antrum | 3 (2.3) | |
| Cardia | 2 (1.5) | |
| Fundus | 1 (0.8) | |
| HISTOLOGICAL TYPE | Intestinal Type | 80 (61.1) |
| Diffuse Type | 27 (20.6) | |
| Mixed Type | 21 (16) | |
| Unclassified | 3 (2.3) | |
| STAGING | In situ | 3 (2.3) |
| I | 60 (45.8) | |
| II | 33 (25.2) | |
| III | 35 (26.7) | |
| SURGICAL TYPE | TG | 65 (49.6) |
| STG | 66 (50.4) |
TG – Total Gastrectomy; STG – subtotal Gastrectomy.
Table 2.
Observed Morbimortality.
| LOCAL COMPLICATIONS | n | |||
| Anastomotic leak | 11 | |||
| Fistula | 2 | |||
| Surgical wound infection | 2 | |||
| SYSTEMIC COMPLICATIONS | ||||
| PULMONARY | Respiratory infection | 7 | ||
| Pleural effusion | 2 | |||
| Atelectasis | 1 | |||
| Pneumotorax | 1 | |||
| Pulmonary embolism | 1 | |||
| CARDIAC | Atrial fibrillation | 1 | ||
| SEPTIC | Sepsis | 5 | ||
| HEMORRHAGIC | Hypovolemic shock | 1 | ||
| ABDOMINAL | Intestinal obstruction | 2 | ||
| Paralytic ileus | 2 | |||
| Peritonitis | 1 | |||
* The total number of complications is higher than the number of patients presenting them, due to the occurrence of more than one complication in the same individual. n: absolute number of patients affected.
Table 3.
Comparison of results obtained from different scales between patients in whom death occurred (mortality column) and those who did not pass away within 30 days post-operation (no mortality column).
Table 3.
Comparison of results obtained from different scales between patients in whom death occurred (mortality column) and those who did not pass away within 30 days post-operation (no mortality column).
| Mortality (%) | No mortality (%) | p value | U | r | |
| POSSUM | 14.81±4.73 | 4.19±3.35 | <0.001 | 968.00 | 0.398 |
| P-POSSUM | 6.33±3.14 | 1.15±1.23 | <0.001 | 963.00 | 0.396 |
| O-POSSUM | 21.32±19.46 | 9.62±9.42 | 0.001 | 837.00 | 0.290 |
*For the different scales and scores, the obtained median and interquartile range are presented.
Table 4.
Comparison of results obtained from scales among patients who experienced postoperative complications (column: morbidity) and those who did not develop complications within 30 days post-operation (column: no morbidity).
Table 4.
Comparison of results obtained from scales among patients who experienced postoperative complications (column: morbidity) and those who did not develop complications within 30 days post-operation (column: no morbidity).
| Morbidity(%) | No morbidity (%) | p value | U | r | |
| POSSUM | 45.02±24.73 | 21.08±15.97 | <0.001 | 2873.50 | 0.626 |
| P-POSSUM | 45.02±24.73 | 21.08±15.97 | <0.001 | 2873.50 | 0.626 |
* For the different scales and scores, the obtained median and interquartile range are presented.
Table 5.
Calibration of the POSSUM, P-POSSUM, and O-POSSUM scales in relation to mortality (Hosmer-Lemeshow test).
Table 5.
Calibration of the POSSUM, P-POSSUM, and O-POSSUM scales in relation to mortality (Hosmer-Lemeshow test).
| Qui-Squared | df | p value | |
| POSSUM | 1.02 | 8 | 0.998 |
| P-POSSUM | 1.04 | 7 | 0.994 |
| O-POSSUM | 6.692 | 8 | 0.570 |
Table 6.
The O:E ratio of observed mortality within 30 days post-operation, both overall and within subgroups, and the expected morbidity for each of the scales.
Table 6.
The O:E ratio of observed mortality within 30 days post-operation, both overall and within subgroups, and the expected morbidity for each of the scales.
| n | n with complications* | % Observed and expected morbidity at 30 days | |||
| Observed | POSSUM | P-POSSUM | |||
| Global | 131 | 31 | 23.66% | 18.32% (O:E 1.29) |
18.32% (O:E 1.29) |
| Stage I | 60 | 7 | 11.67% | 6.67% (O:E 1.75) |
6.67% (O:E 1.75) |
| Stage II | 33 | 12 | 36.36% | 30.30% (O:E 1.21) |
30.30% (O:E 1.21) |
| Stage III | 35 | 12 | 34.29% |
28.57% (O:E 1.2) |
28.57% (O:E 1.2) |
| Intestinal Type | 80 | 24 | 30.00% | 23.75% (O:E 1.26) |
23.75% (O:E 1.26) |
| Diffuse type | 27 | 5 | 18.51% | 14.80% (O:E 1.25) |
14.80% (O:E 1.25) |
| TG | 65 | 13 | 20.00% | 13.80% (O:E 1.45%) |
13.80% (O:E 1.45%) |
| STG | 66 | 18 | 27.27% |
22.72% (O:E 1.2) |
22.72% (O:E 1.2) |
*n with complications – number of patients with mobility at 30 days of surgery. The underlined values represent the subgroups that exhibited better calibration. TG – Total Gastrectomy. STG –Subtotal gastrectomy.
Table 7.
- Calibration of the POSSUM and P-POSSUM scales in relation to morbidity (Hosmer-Lemeshow test).
Table 7.
- Calibration of the POSSUM and P-POSSUM scales in relation to morbidity (Hosmer-Lemeshow test).
| Qui-Squared | df | P value | |
| POSSUM | 11.484 | 8 | 0.176 |
| P-POSSUM | 11.484 | 8 | 0.176 |
Table 8.
– The O:E ratio of observed morbidity within 30 days post-operation, both overall and within subgroups, and the expected morbidity for each of the scales.
Table 8.
– The O:E ratio of observed morbidity within 30 days post-operation, both overall and within subgroups, and the expected morbidity for each of the scales.
| n | n with complications* | % Observed and expected morbidity at 30 days | |||
| Observed | POSSUM | P-POSSUM | |||
| Global | 131 | 31 | 23.66% | 18.32% (O:E 1.29) |
18.32% (O:E 1.29) |
| Stage I | 60 | 7 | 11.67% | 6.67% (O:E 1.75) |
6.67% (O:E 1.75) |
| Stage II | 33 | 12 | 36.36% | 30.30% (O:E 1.21) |
30.30% (O:E 1.21) |
| Stage III | 35 | 12 | 34.29% |
28.57% (O:E 1.2) |
28.57% (O:E 1.2) |
| Intestinal Type | 80 | 24 | 30.00% | 23.75% (O:E 1.26) |
23.75% (O:E 1.26) |
| Diffuse type | 27 | 5 | 18.51% | 14.80% (O:E 1.25) |
14.80% (O:E 1.25) |
| TG | 65 | 13 | 20.00% | 13.80% (O:E 1.45%) |
13.80% (O:E 1.45%) |
| STG | 66 | 18 | 27.27% |
22.72% (O:E 1.2) |
22.72% (O:E 1.2) |
*n with complications – number of patients with mobility at 30 days of surgery. The underlined values represent the subgroups that exhibited better calibration. TG – Total Gastrectomy. STG –Subtotal gastrectomy.
Table 9.
- Discriminative capacity of the scales and scores for 30-day postoperative mortality.
| AUC | Confidence interval (95%) | p value | ||
| Lower limit | Upper limit | |||
| POSSUM | 0.984 | 0.962 | 1.000 | <0.001 |
| P-POSSUM | 0.979 | 0.953 | 1.000 | <0.001 |
| O-POSSUM | 0.851 | 0.736 | 0.966 | 0.001 |
Table 10.
Discriminative capacity of scales and scores for 30-day postoperative morbidity.
| AUC | Confidence interval (95%) | p value | ||
| Lower limit | Upper limit | |||
| POSSUM | 0.927 | 0.880 | 0.974 | <0.001 |
| P-POSSUM | 0.927 | 0.879 | 0.974 | <0.001 |
Table 11.
- Correlations found among the studied scales.
| CORRELATIONAL VARIABLES | n | rs | p value | |
| POSSUM | P-POSSUM | 131 | 0.991 | <0.001 |
| POSSUM | O-POSSUM | 131 | 0.363 | <0.001 |
| P-POSSUM | O-POSSUM | 131 | 0.378 | <0.001 |
Table 12.
Average survival time according to the POSSUM. P-POSSUM and O-POSSUM scales.
| Survival time | Standard error | Confidence interval (95%) | ||||
| Lower limit | Upper limit | |||||
| POSSUM | <4.19 | 83.61 | 4.23 | 75.14 | 92.08 | |
| ≥4.19 | 59.56 | 5.00 | 49.76 | 69.36 | ||
| P-POSSUM | <1.18 | 79.95 | 4.45 | 71.23 | 88.68 | |
| ≥1.18 | 61.38 | 5.17 | 51.24 | 71.51 | ||
| O-POSSUM | <10.25 | 72.62 | 4.86 | 63.10 | 82.14 | |
| ≥10.25 | 67.95 | 5.10 | 57.24 | 71.51 | ||
Table 13.
- Survival comparison according to the POSSUM. P-POSSUM. and O-POSSUM scales (Log-Rank Test).
Table 13.
- Survival comparison according to the POSSUM. P-POSSUM. and O-POSSUM scales (Log-Rank Test).
| Qui-Squared | df | p value | |
| POSSUM | 11.61 | 1 | 0.001 |
| P-POSSUM | 6.823 | 1 | 0.009 |
| O-POSSUM | 0.488 | 1 | 0.485 |
Table 14.
Calculation equations for the POSSUM, P-POSSUM, O-POSSUM scales for calculating mortality and morbidity risk.
Table 14.
Calculation equations for the POSSUM, P-POSSUM, O-POSSUM scales for calculating mortality and morbidity risk.
| SCALE | EQUATION | |
| Mortality | POSSUM | Ln R/1-R= -7,04 + (0,13x physiological score) + (0,16x operative score) |
| P-POSSUM | Ln R/1-R= -9,065 + (0,1692x physiological score) + (0,155x operative score) | |
| O-POSSUM | Ln R/1-R= -7,566 + (0,055 x age) + (0,080 x physiological score + B1 coefficient (tumoral staging) + B2 coefficient (surgery urgency) + B3 coefficient (type of surgery) * | |
| Morbidity | POSSUM /P-POSSUM** | Ln R/1-R= -5,91+ (0,16x physiological score) + (0,19x operative score). |
R - represents the risk of morbidity. * B1 coefficient: 0 (no malignancy); 0.168 (local tumor); 0.365 (nodal involvement); 1,042 (metastatic disease). B2 coefficient: 0 (elective surgery); 0.678 (emergent/urgent surgery). Coefficient B3: 0 (esophagectomy); 0.283 (total gastrectomy); -0.767 (partial gastrectomy); -0.366 (palliative gastrojejunostomy). ** The equations for calculating mortality are variable depending on the scale used, while for morbidity there is only one itemized equation.
Disclaimer/Publisher’s Note: The statements, opinions and data contained in all publications are solely those of the individual author(s) and contributor(s) and not of MDPI and/or the editor(s). MDPI and/or the editor(s) disclaim responsibility for any injury to people or property resulting from any ideas, methods, instructions or products referred to in the content. |
© 2023 by the authors. Licensee MDPI, Basel, Switzerland. This article is an open access article distributed under the terms and conditions of the Creative Commons Attribution (CC BY) license (http://creativecommons.org/licenses/by/4.0/).
Copyright: This open access article is published under a Creative Commons CC BY 4.0 license, which permit the free download, distribution, and reuse, provided that the author and preprint are cited in any reuse.


