1. Introduction
With the growth of market competition in the consumer products category, design has become one of the most important features. Thus, Companies are now, more than ever, required to offer products of high design quality at a competitive cost. The optimization of production cost, product durability or functionalities are relatively straightforward problems with known parameters. However, the overall perception of the product design cannot be known until it has been evaluated by real consumers. To avoid any design perception issues, modern product design includes the human element in the optimization process. This is done by conducting focus group evaluations of different design versions through a lengthy procedure.
Researchers have suggested interactive design evaluation strategies to enhance the efficiency of the design optimization process. These strategies involve using an algorithm to propose new designs to a real human. The human feedback is then used to refine the design parameters. One approach includes a tournament evaluation where various designs compete, and the preferred design features are chosen based on evaluator feedback by eliminating other options[
1]. Also evaluation by group voting on design features [
2]. Such systems have the advantage of considering real human feedback and are quicker than the traditional design process. However, a design study can be costly and is only limited to consumer preference, thus it cannot provide deeper consumer Kansei information [
3].
The assessment of human perception concerning product design eludes direct quantification and necessitates acquisition via analytical methodologies. Conversely, accommodating the preferences of a diverse customer base through alterations in product design presents notable challenges. Employing sophisticated models facilitates the exploration of elevated consumer response variations and the examination of design attributes that foster convergence in consumer perception. Kobayashi [
4,
5]developed a novel approach employing multi-objective optimization techniques to amalgamate design elements. This approach aims to attain an optimal and unified customer perception, aligning with the original intentions of the designer. The adopted methodology utilized the Genetic Algorithm, proficient in handling dual fitness functions. In particular, there were two distinct functions in focus: one aimed at minimizing customer perception variance, and the other intended to maximize a designated perception parameter. The utilization of such models paves the way for the development of design recommendation systems [
6].
The correlation between personality traits and aesthetic experience has been the subject of extensive investigation [
7,
8,
9]. De Young conducted a comprehensive examination of the evidence connecting Openness with aesthetic appreciation in a broad sense [
10]. Furthermore, Antinori et al. [
11] reported findings suggesting that individuals high in Openness exhibit heightened involvement with aesthetic stimuli. In another review. Benaissa et al. [
12] systematically assessed the primary determinants influencing design evaluation, considering both perspectives: that of the design creators and that of the consumers.
Myszkowski and Storme [
13] conducted a correlation study to explore the relationship between the Big Five personality traits, including Conscientiousness, Agreeableness, Neuroticism, Openness, and Extraversion [
8]. They investigated how these traits relate to the quality of product aesthetics. To measure product aesthetics, they employed the Centrality of Visual Product Aesthetics scale [
14] with the participants. The results of the research unveiled a noteworthy observation: individuals with lower levels of Openness tended to prefer products with higher-quality designs. Additionally, previous studies [
15,
16] have also provided empirical evidence supporting the link between Openness to Experience and design perception.
In recent years, significant progress has been made in the field of modelling the relationship between product design and consumer response evaluation [
17,
18]. Artificial intelligence (AI) has played a crucial role in advancing this area of research [
19,
20]. Notably, the application of fuzzy theory has allowed for the representation of consumer choices' uncertainty and vagueness in a mathematical framework. This makes it suitable for addressing product design response problems.
Wu [
21] conducted a study wherein they developed a continuous fuzzy Kano quality model to examine the connection between product perceptual images and consumer satisfaction. Jiang et al . [
22] studied a novel deep-learning-assisted fuzzy attribute-evaluation (DLFAE) method in emotion-oriented products, aiming to generate quantitative evaluation results for attribute evaluation. Nishimura et al. [
23] studied the effectiveness of fuzzy rule optimization in a Kansei retrieval agent (KaRA) model based on fuzzy reasoning. The KaRA model aims to learn user preferences through sensory evaluation and retrieve desired information from a large dataset. While previous studies demonstrated the model's effectiveness in learning user evaluation criteria by optimizing membership functions [
24].
Hotta and Hagiwara [
25] introduced an approach involving the modeling of individual responses by adapting group Kansei model rules to match specific design response data, utilizing a set of fuzzy rules. Shen and Wang [
17], on the other hand, proposed a process for product design incorporating fuzzy theorem and Artificial Neural Networks (ANN). To optimize fuzzy membership in various problems, global optimization algorithms have been employed [
26,
27]. Providing an advantage when dealing with highly nonlinear objective functions. These algorithms also show agnosticism towards the specific problem at hand.
In this paper, we introduce a new approach for modeling affective design perception, which incorporates the YUKI algorithm to iteratively optimize the Fuzzy Inference System (FIS). The goal is to create a personalized model for individual consumer design perception by considering the openness aspect of their personality. Through experimental evaluations, we evaluate the effectiveness of the YUKI-trained FIS in capturing design perception, contributing to a better understanding of consumers' individual tendencies in design response.
2. Fuzzy C-means Algorithm
Developed by J.C. Dunn [
28] and refined by James Bezdek [
29], Fuzzy C-means algorithm (FCM) partitions data points into distinct clusters based on their similarities and dissimilarities. Unlike traditional clustering methods that assign a data point to a single cluster, FCM allows for soft assignments, where each point has a membership value indicating its degree of belongingness to each cluster. It offer several advantages over classical cultering methods, including robustness to noise, the ability to handle imprecise data, and adaptability to various problem domains.
During the process of membership assignment, every data point receives a specific membership value corresponding to each cluster, which represents the extent to which it is associated with that particular cluster. The membership values are continuous and range from 0 to 1, representing the strength of the data point's association with a particular cluster. This allows FCM to effectively handle overlapping clusters, where data points exhibit characteristics shared by multiple clusters. The membership values quantify the degree of overlap, providing valuable insights into the structure of complex datasets.
The FCM algorithm involves the following steps:
Initialize cluster centroids: Randomly initialize the cluster centroids for each cluster .
Membership Update: Update the membership grades using the current cluster centroids and the objective function.
Centroid Update: Update the cluster centroids based on the updated membership grades.
Evaluate new clusters: Calculate the objective function value
Repeat Steps 2 and 4 until convergence or a predefined number of iterations.
The membership value
of the data point
to cluster
is calculated using the following formula:
where
is the membership of data point i to cluster j,
is the data point
,
is the center of cluster j,
is the number of clusters,
is the loop variable that iterates over all the cluster centers,
is the fuzziness exponent. The membership value
is a value between 0 and 1, where 0 means the data point does not belong to the cluster at all, and 1 means the data point fully belongs to the cluster.
In this equation, the fuzziness exponent
controls the degree of fuzziness in the memberships; higher values make the memberships more fuzzy. The exponent m should be set as a hyperparameter, usually greater than 1, to control the level of fuzziness. The following equation is used to calculate the new cluster based on the updated membership values, where
is the total number of data points:
The equation sums up the contributions of all data points weighted by their respective membership values to calculate the new position of cluster center . The numerator calculates the weighted sum of data points xi, where each data point is multiplied by its membership weight. This means data points with higher memberships contribute more to the new cluster center's position. The denominator calculates the sum of the membership weights for all data points. This normalization ensures that the new cluster center is properly weighted based on the memberships of all data points.
The FCM algorithm iteratively updates the cluster centers and the membership values to minimize this objective function, defined as the Euclidean distance between the data point and the cluster centroid, given by:
Raising the membership value to the power of increases the influence of data points with higher membership values and reduces the influence of data points with lower membership values. A resulting high membership value for a specific data point and a particular cluster indicates a strong affiliation, suggesting that the data point is more representative of that cluster. And a low membership value signifies a weaker relationship, indicating that the data point might have characteristics that are shared with other clusters as well.
This FCM algorithm has disadvantages that need careful consideration. Firstly, FCM is highly sensitive to the initial cluster center placement, which means that different initializations can lead to varying clustering results. This sensitivity makes the algorithm less robust and introduces uncertainty in the quality of the obtained clusters. Secondly, due to its iterative nature, FCM may converge to local optima instead of finding the global optimum. This limitation can result in suboptimal clustering solutions, as the algorithm may not always identify the best possible cluster configuration. To overcome the limitations of FCM, researchers have explored the use of global-based optimization algorithms [
44]–[
46].
3. YUKI Algorithm for optimization
Global optimization algorithms possess a notable feature where the best solutions obtained during a specific iteration
are used as initial points to explore improved solutions in the subsequent iteration
To determine these initial reference points. In YUKI, the collection of solutions corresponding to the highest fitness value attained by each solution is denoted as Best Points [
33,
34]. Among these, a singular point, referred to as the MeanBest, is computed to represent the central tendency of the cluster of best points, effectively denoting their average value.
The boundaries of the local search region are defined by the distance between the MeanBest point and the point that currently represents the most optimal solution. The latter also serves as the center of the local search area, allowing it to progressively contract as the two points converge. Consequently, the search process becomes increasingly focused on smaller regions. However, if superior solutions are found in more distant regions, the local search area expands dramatically in the subsequent iteration to encompass the new information.
The observed behavior is characterized by its independence across individual search dimensions, thereby leading to scenarios wherein the local search space exhibits significant disparities in size across different dimensions. The constant adaptation of the fundamental points on the MeanBest trajectory and the absolute Best solution during the entirety of the search procedure bestows considerable adaptability to the search space dimensions and preserves its dynamism. The computation of local boundaries,
and
is determined through the utilization of the subsequent mathematical expression [
35,
36]:
The variable denoted as signifies the value corresponding to the highest fitness value discovered up to the current point in time. On the other hand, represents the arithmetic mean of the Best Points vector. The Local top () and bottom () boundaries act as demarcations for the local search region from the upper and lower limits, respectively.
The search behavior within the YUKI algorithm involves partitioning the population into two distinct segments. One segment is dedicated to exploration beyond the local search area, while the other focuses on searching within it. The size of each segment is determined by the value. For each solution, the allocation process is conducted by evaluating a randomly generated value within the range of 0 to 1 against the value, using the condition: .
In the first stage of this process, a random distribution of points is created within a designated region for local search. These selected points serve as a foundation for generating additional points that expand beyond the confines of the local search area. The extent of this expansion is referred to as 'Exploration,' representing the direction of the search beyond the local search region. The aforementioned concept can be expressed in the following manner:
The position of a selected point for exploration is denoted as
, whereas
represents the historically optimal position of this specific solution. The parameter
is employed to establish the extent of exploration, determining the range within which the new positions are to be calculated. These new positions are derived from randomly generated coordinates.
In accordance with the prescribed equation, the individuals not chosen for the exploration will be directed to conduct searches within the proximity of the local search area. Based on the following equation.
In the present context, the stochastic variable denoted as conforms to a uniform distribution over the interval [0, 1]. Uniformly distributed random values between 0 and 1 are applied uniformly across all design variables. The quantity denotes the Euclidean distance separating the designated local point from the globally optimal solution .
4. Proposed YUKI-trained Fuzzy inference system
The YUKI algorithm is selected due to its distinctive capacity to allocate a portion of the search population for exploiting the optimal solution, particularly focusing on the best FIS parameters. This approach encourages search behavior similar to gradient descent techniques. Simultaneously, the algorithm efficiently explores the search space for other potential solutions, aligning with the characteristics of global optimization algorithms.The suggested approach focuses on identifying the most suitable fuzzy system model using an iterative search method. This involves generating several Sugeno-type FIS models by optimizing parameters within the clustering algorithm.
Sugeno-type rules take the form of "IF-THEN" rules, where the "IF" part corresponds to the input fuzzy sets and the "THEN" part corresponds to the output values. Using the linear weighted average functions for the output values. In the present study, the weights are considered membership values, in other words, the degree to which a data point belongs to each fuzzy set.
To assess the effectiveness of each solution, its fitness will be evaluated using an error known as the Root Mean Squared Error (RMSE). It measures the disparity between the model's predicted output, denoted as
, and the actual output, represented by
, for a specific sample
[
37,
38,
39].
The RMSE is computed as follows, taking into account the total number of samples.
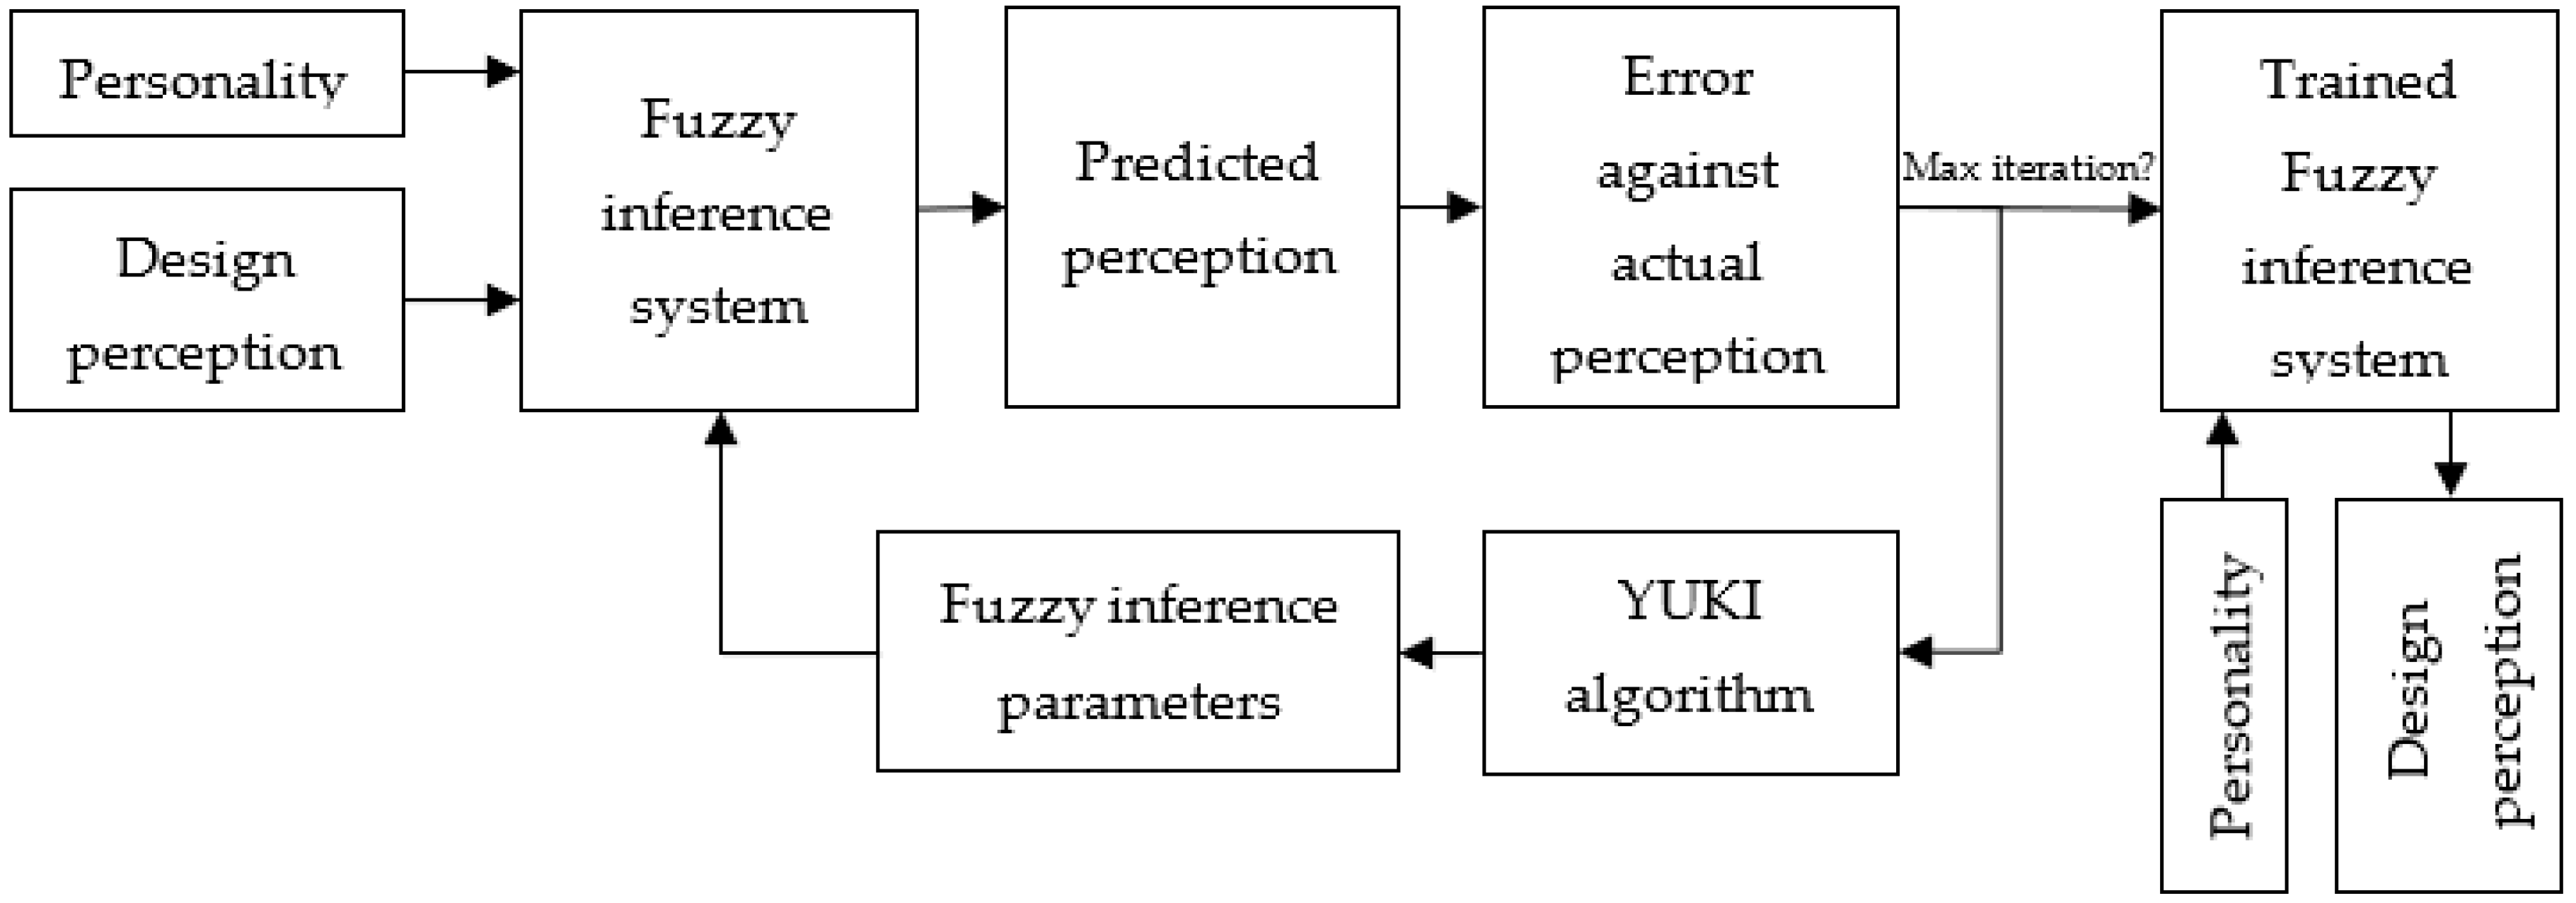
To optimization of the fuzzy parameters, each YUKI algorithm solution represents a fuzzy model, and the goal is to find the best FIS model according to input-output vectors. Figure Describe the suggested algorithm, for training the Fuzzy inference system.
Figure 1.
The flow chart of the proposed YUKI-trained Fuzzy inference system for model optimization.
Figure 1.
The flow chart of the proposed YUKI-trained Fuzzy inference system for model optimization.
After the algorithm reaches its final state, we obtain the last fuzzy sets and their respective membership functions. Each input variable will have a collection of fuzzy membership functions that show the extent to which a data point belongs to that specific fuzzy set. By using the genfis3 function, we can create a Sugeno-type FIS. This FIS is formed by combining the fuzzy sets of input variables and their corresponding membership functions to generate rules.
5. Individual design perception
Researchers have devised various strategies to encompass diverse design priorities in experiments. For instance, evaluators choose from a limited list of "adjectives," also referred to as "semantic attributes" or "Kansei words." This aims to establish the connection between design attributes and basic affect. These design attributes are predefined in an existing list. Often, evaluators are prompted to indicate a position on the Likert Scale between contrasting attributes [
4,
40,
41,
42]. In this work, the participants were asked to rate the response of various vase designs by selecting five degrees of affect (strongly disagree, disagree, neutral, agree, and strongly agree) in 12 affective adjectives, namely: Feminine, Emotional, Delicate, Elegant, Technological, Strong, Gentle, Traditional, Loud, Stable, Practical, and Luxurious. These adjectives were chosen based on research that studied vase design affective response and justified the relevance of these adjectives [
43,
44,
45].
The vase is chosen as the focus of our study for several reasons. Firstly, vases are commonly known and owned by a wide audience. Their unique and appealing aesthetics offer various design options that can evoke different emotions. Additionally, the mathematical potential of vase designs allows for automatic generation and optimization, catering to consumers' emotional preferences.
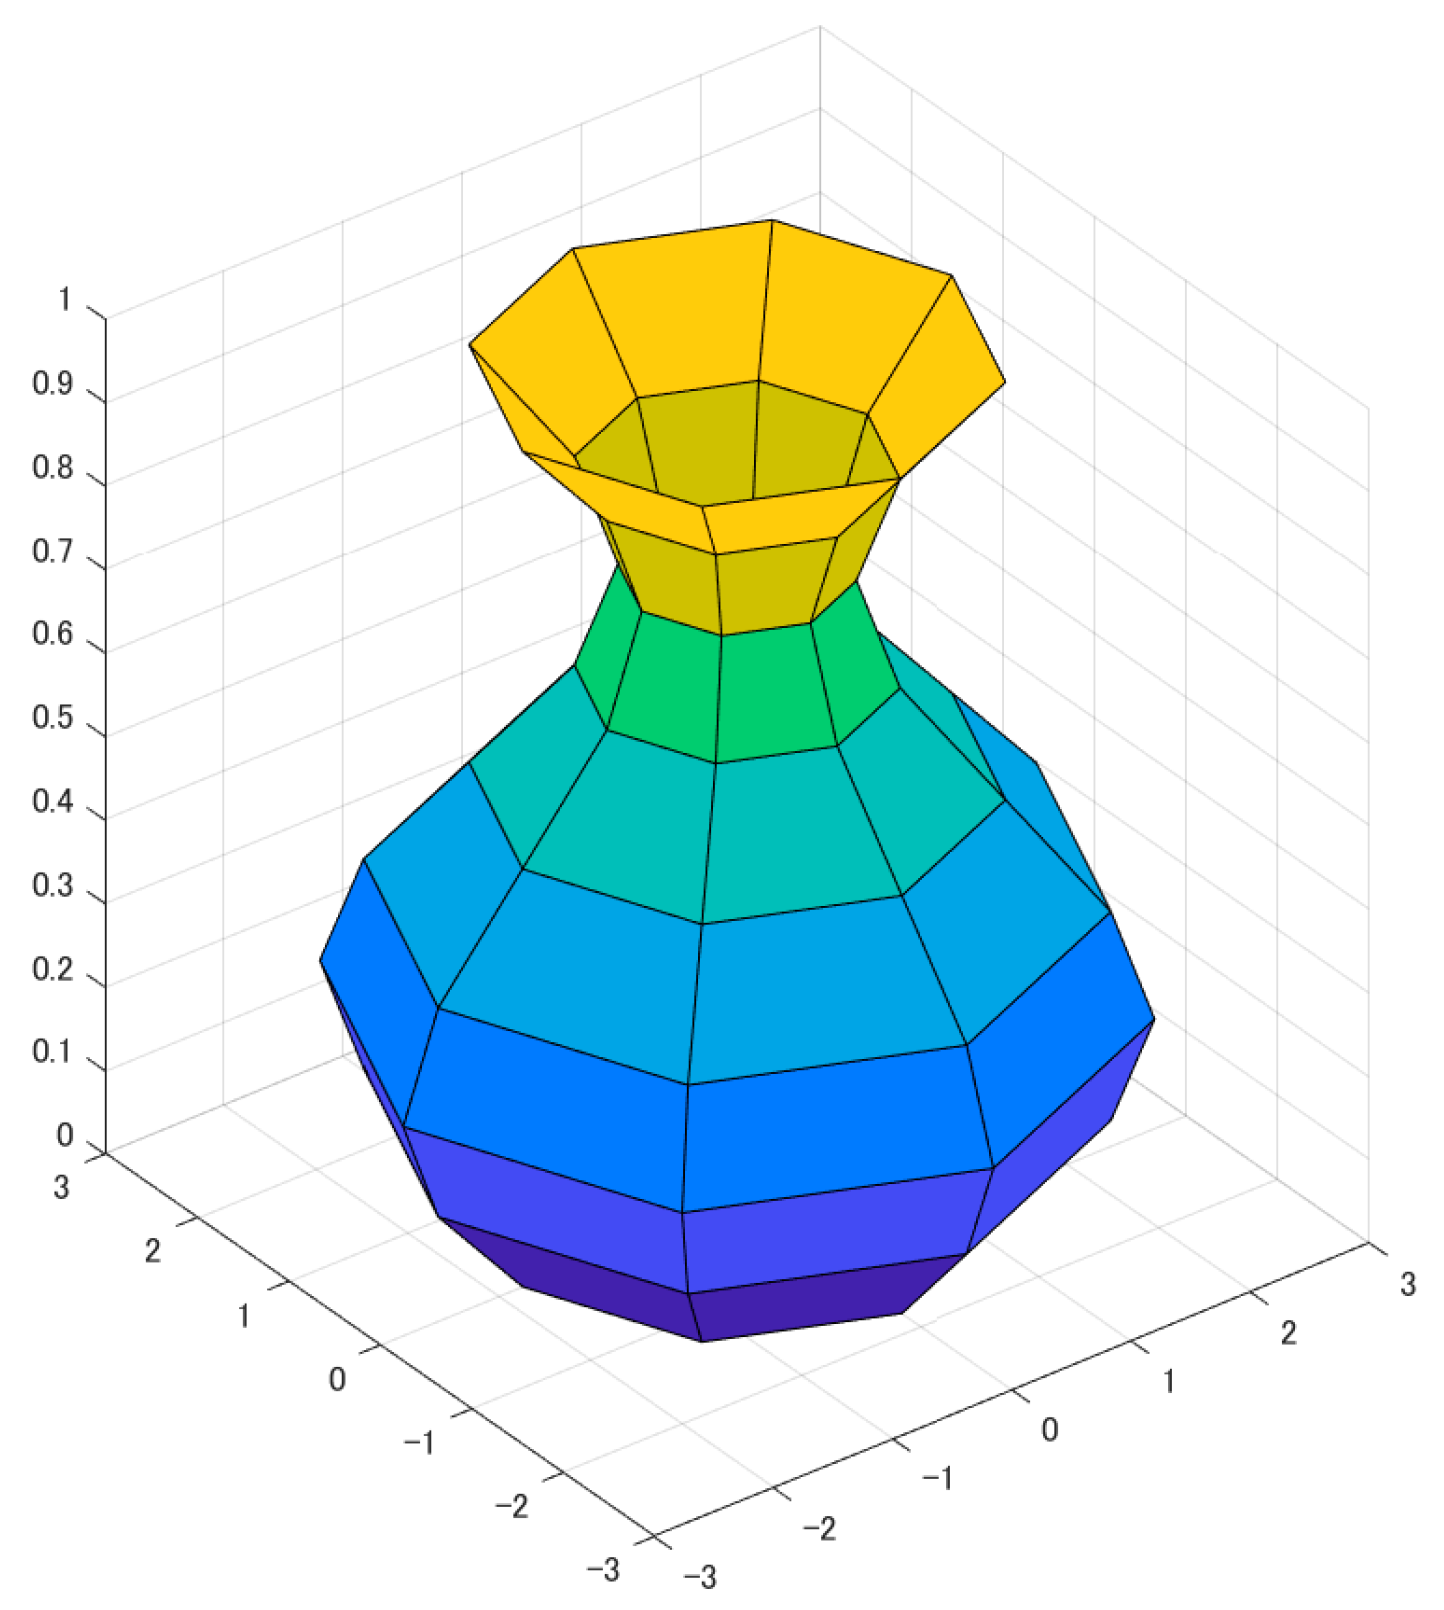
In this study, we focused on two important design factors for vases: the size of the opening and the curvature. Additionally, we examined two texture factors: the quantity of vertical lines and the quantity of horizontal lines. To create the intended vase design, we utilized the Sine formula to calculate the coordinates of points on the contour C, where the parameter O represents the vase opening.
Figure 2.
Illustration of Vase design parameters.
Figure 2.
Illustration of Vase design parameters.
Then create a surface by making a revolution around the vertical axis of the vase. This will create the shape shown in the figure below, in the interval of and , with The horizontal texture of the vase is dependent on the number of points in the contour , we control it through the step size that creates the values between and . The vertical texture is controlled in the contour option of Matlab using the "cylinder" function. For instance, when using 7 vertical lines and 20 horizontal lines, the result is displayed in Figure Adjusting these parameters can lead to various design features.
We acquired affective response data through an online survey. Participants evaluated images of vase designs by choosing radio buttons associated with their emotional reactions. To examined the openness personality trait through a set of five questions is considered, each offering five response options: 'Not at all,' 'Not much,' 'A little,' and 'Very much.' We congregated affective response data via an internet-based survey. Individuals partaking in the survey assessed images the vase design by indicating their emotional reactions through radio buttons. Each participant provided evaluations using a comprehensive array of 12 affective adjectives. The participant pool comprises 87 individuals from different backgrounds, age groups, genders, and cultural backgrounds. Among the participants, 42 took the survey in Japanese, while 45 took the survey in English.
To explore the potential of utilizing consumer personality traits to forecast their design perception. To achieve this, we employ the C-Mean algorithm to form three distinct clusters based on their responses to the openness questionnaire. The resulting clusters are as follows:
Cluster 1: This group comprises 42 members and consists of consumers exhibiting innovative and cerebral tendencies.
Figure 3.
Average design perception.
Figure 3.
Average design perception.
Cluster 2: Comprising 33 members, this cluster consists of consumers demonstrating innovative and physical tendencies.
Cluster 3: With 12 members, consumers displaying conservative tendencies characterize this group.
The findings from the design perception analysis demonstrate that the design sense within each cluster exhibits notable similarity, and there are no significant distinctions observed between the clusters, as shown in Figure However, upon examining the standard deviation, shown in
Figure 4, we observe a noteworthy difference among the clusters consistent with research findings [
12]. This suggests that individuals within the same cluster tend to have different degrees of disagreement on a particular design perception.
Specifically, clusters 1 and 2, which exhibit high openness to experience and innovative individual characteristics, display relatively large standard deviations. This suggests that opinions within these clusters tend to diverge, indicating a diversity of viewpoints. Conversely, cluster 3, characterized by low openness to experience and conservative individual traits, exhibits a relatively low standard deviation. This implies that opinions within this cluster tend to converge, signifying a greater consensus among its members. This suggests that individuals within the same cluster tend to have different degrees of disagreement on a particular design perception.
6. YUKI-trained Fuzzy inference system for individual design perception modelling
The goal is to develop a model that can predict how individuals perceive different designs. To achieve this, the model takes as input the responses to five personality questions.
Figure 5 illustrates the process of training the FIS in this particular context. To ensure randomness in the training and testing data sets, both the input and target data are shuffled randomly. The data is then split into two sets: a training set and a testing set. The proportion used for this split is 75% for training and 25% for testing. The objective function is evaluated for the testing set.
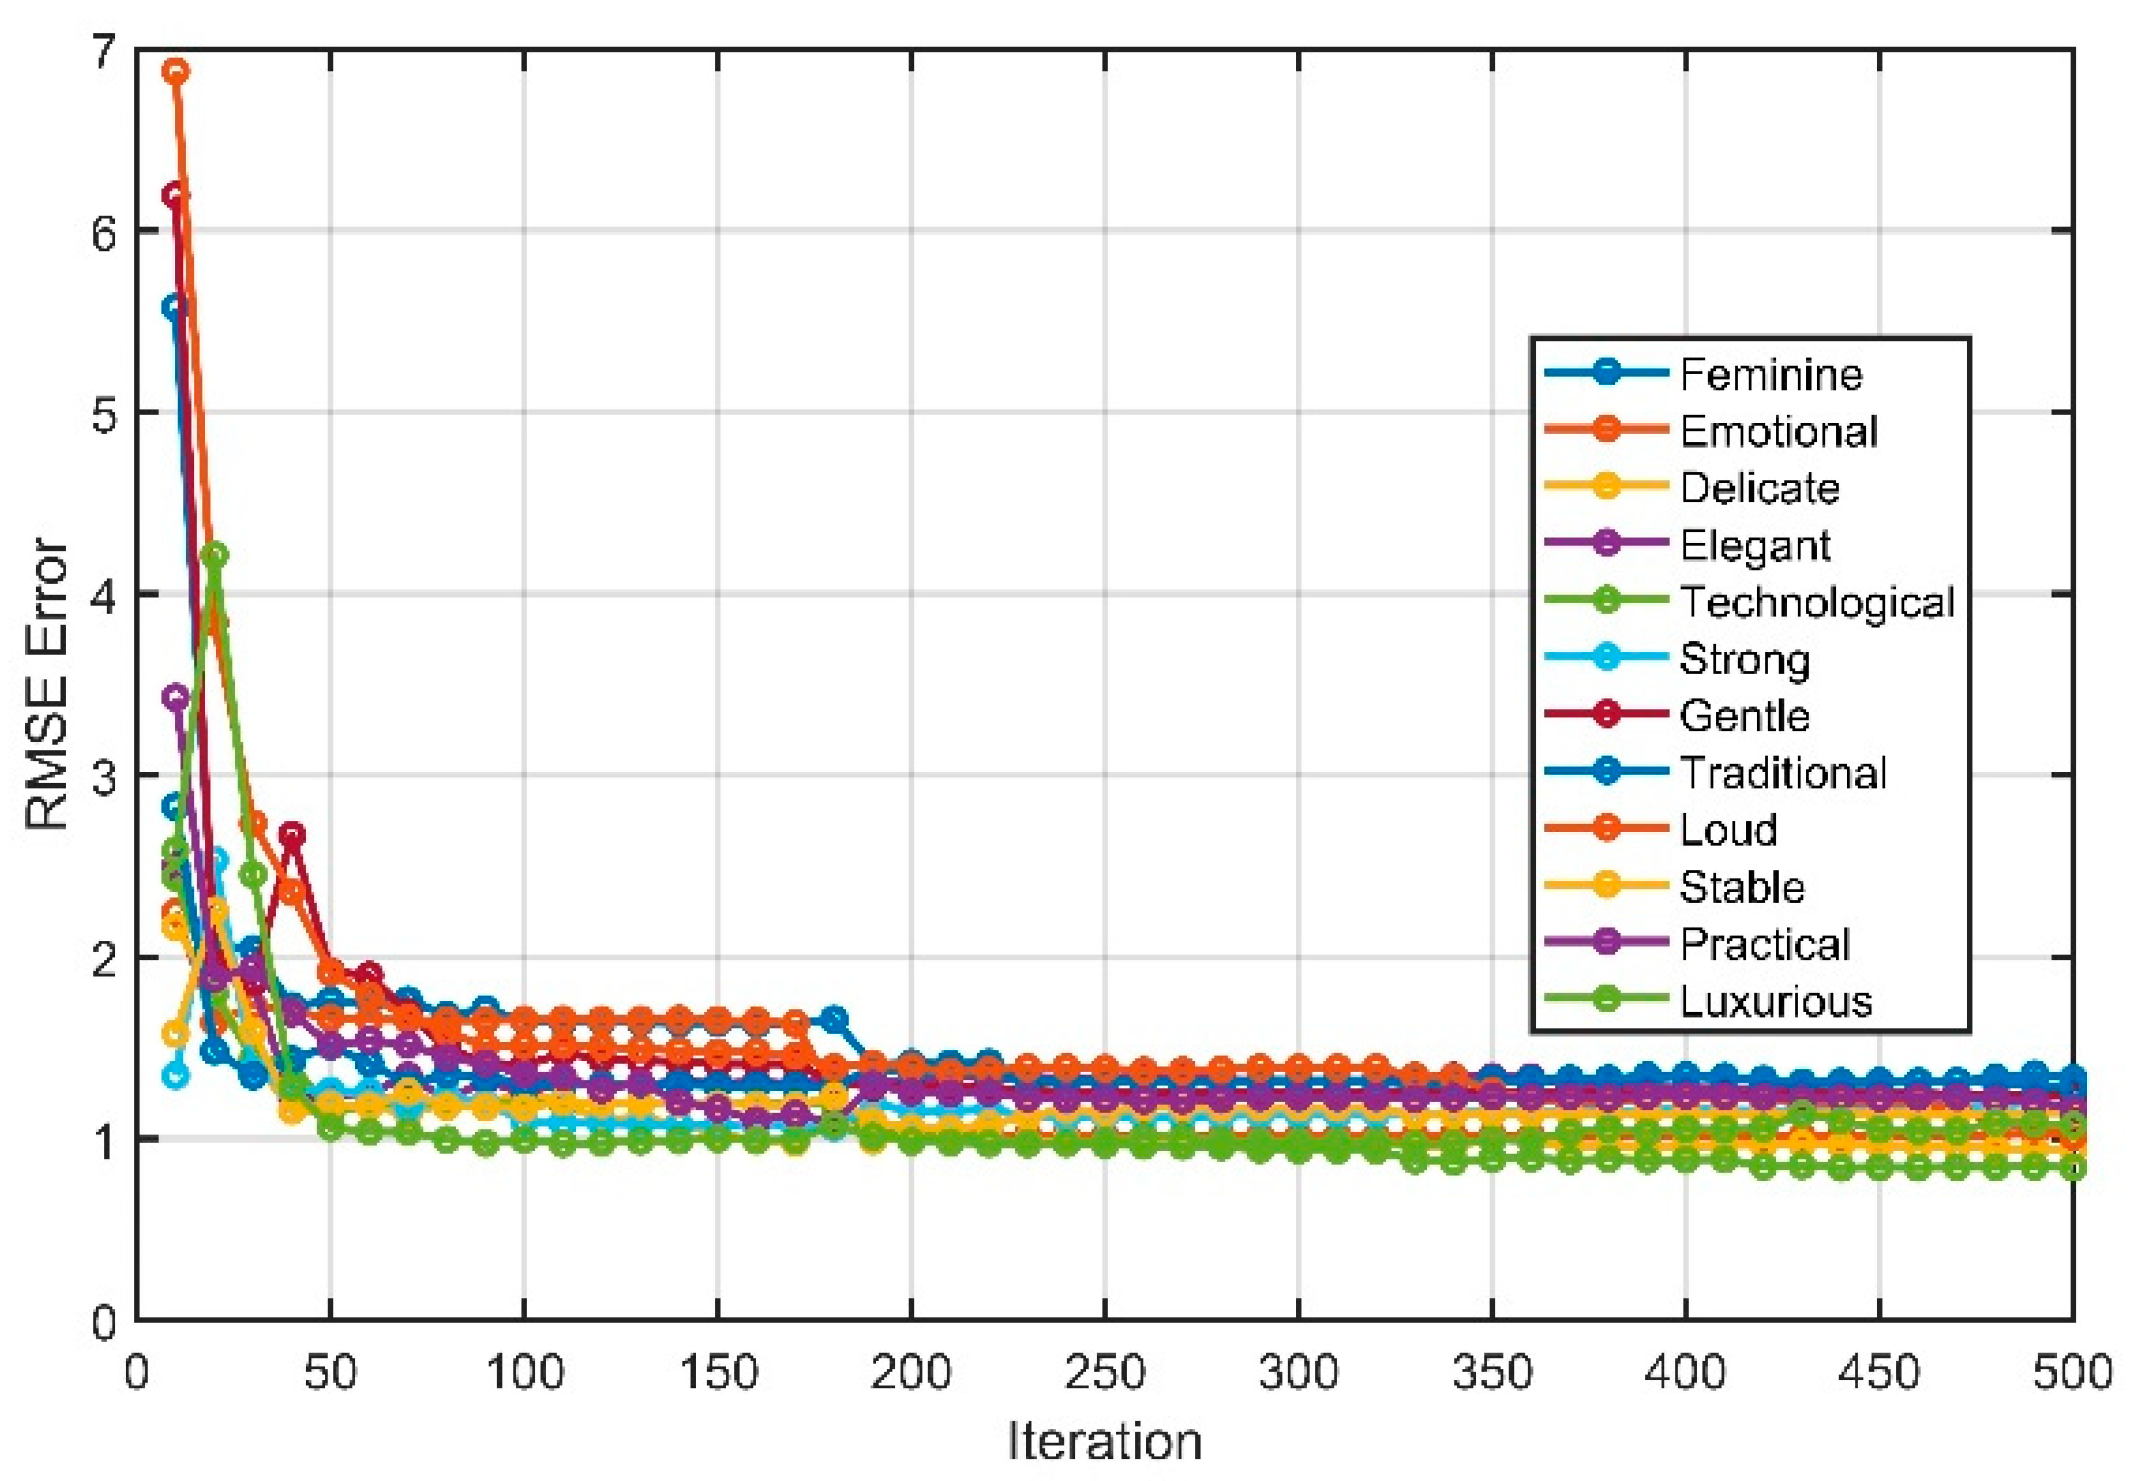
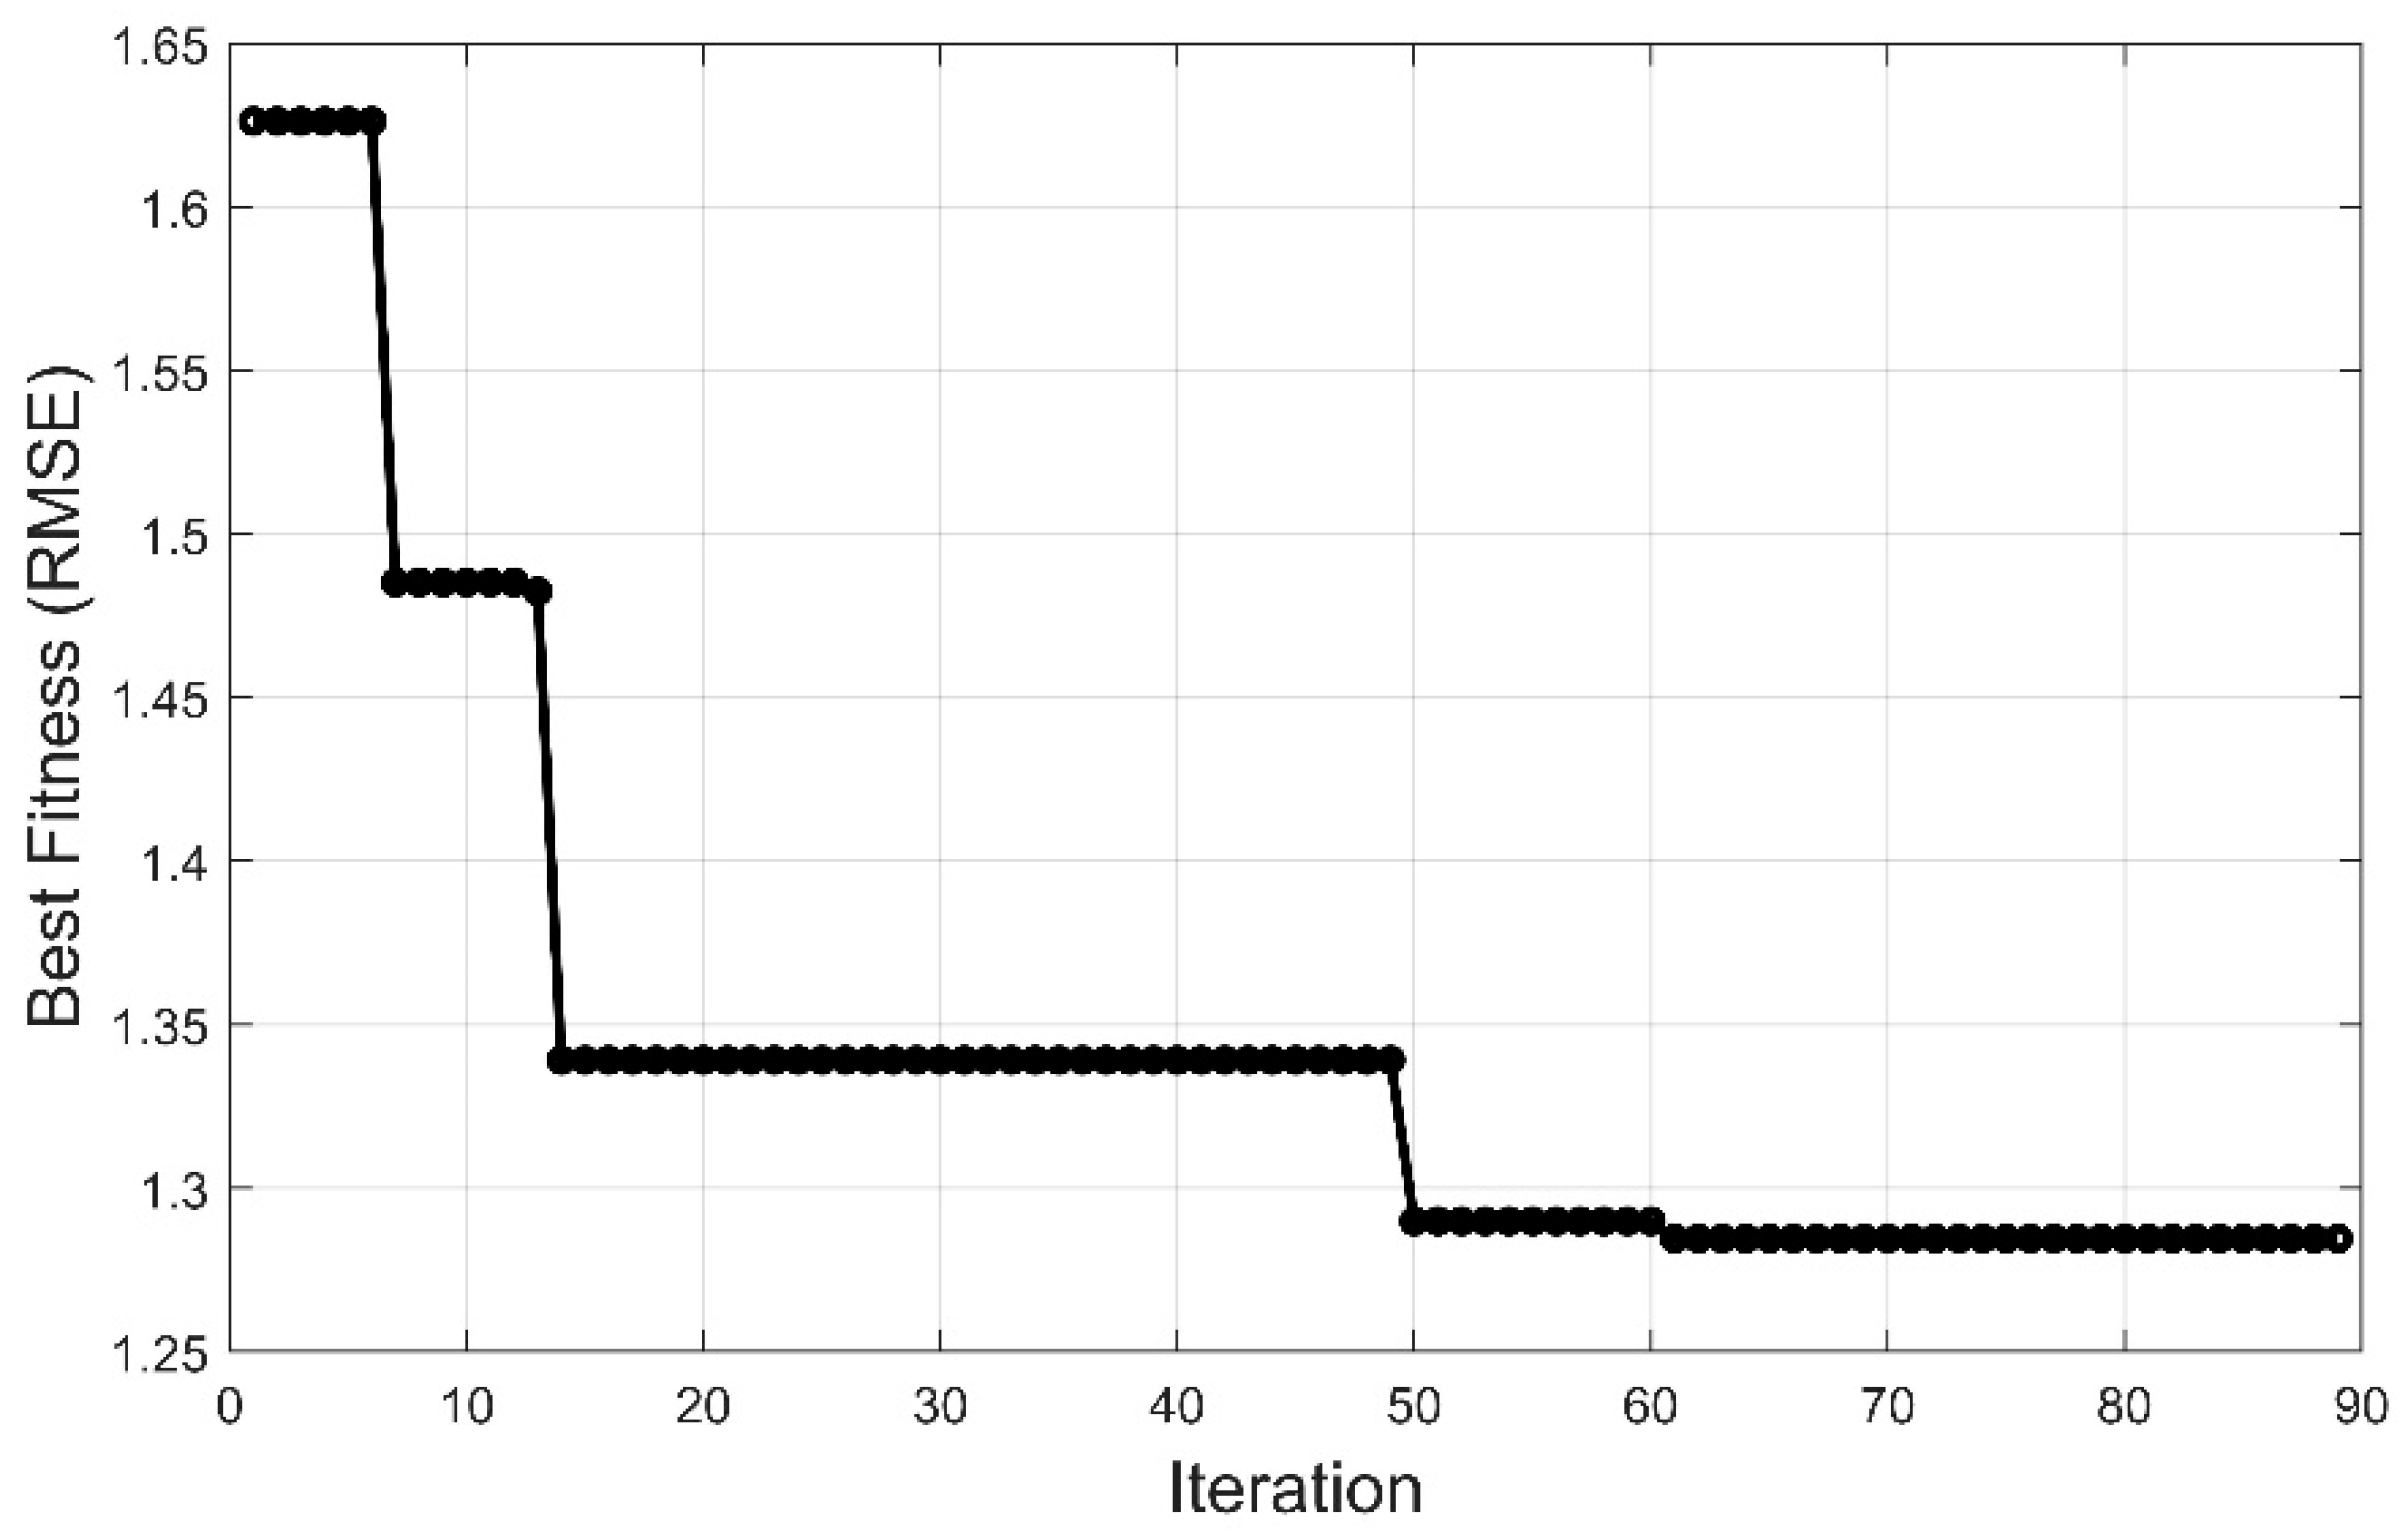
YUKI algorithm is executed to train the fuzzy system. The training parameters include the number of 3 clusters, the fuzziness value of , the maximum number of iterations equal to 500, the exploration probability EXP value of 0.9, and the population size of 10 solutions. The cost function is defined to calculate the root mean square error (RMSE) of the fuzzy system using its outputs and the testing values. comparing the fuzzy system outputs to the actual outputs in testing sets.
Figure 6.
YUKI-trained FIS objective function convergence (RMSE Error).
Figure 6.
YUKI-trained FIS objective function convergence (RMSE Error).
We further explore the concept of personality openness by considering three distinct levels. This approach allows us to interpret design perceptions based on non-polarized underlying personality traits. Instead of viewing personality traits in a binary manner (e.g., open or closed), we recognize that individuals possess varying degrees of openness, leading to more nuanced and realistic insights into their design preferences.
The suggested YUKI-trained Fuzzy inference system is employed to cluster the individuals based on the best-performing FIS model, by comparing the predicted design perception to the actual design perception of the testing set. The FIS model undergoes iterative refinement during the training. The training convergence curve is shown in Figure It illustrates how the RMSE decreases over successive iterations, indicating the model's improving performance and its ability to capture the complexities of individual design preferences. We noticed that the average error steadily converged towards an RMSE value of 1.12 before ceasing to reduce further. This observation points to a limitation that can be inherent in the model, likely stemming from the complexity of the underlying data.
Figure 7 presents the Root Mean Squared Error (RMSE) for various design perceptions. The graph depicts a consistent decrease in error, demonstrating improvement in the model's performance across different perceptions. During the evaluation process, the predictions vary on a scale ranging from -2 to 2, allowing for a theoretical maximum error value of However, in the initial models, certain perceptions yielded predictions that exceeded this range. Nevertheless, after a few iterations of the training process, the error is effectively reduced within the theoretical range for each specific design perception.
The RMSE errors obtained for individual design perceptions fall within the range of 0.84 to 1.This observation suggests a satisfactory level of accuracy in predicting how individuals perceive distinct designs. While acknowledging that the model may not achieve perfection, it demonstrates its capacity to offer reasonably reliable predictions for the majority of cases within this particular range of error.
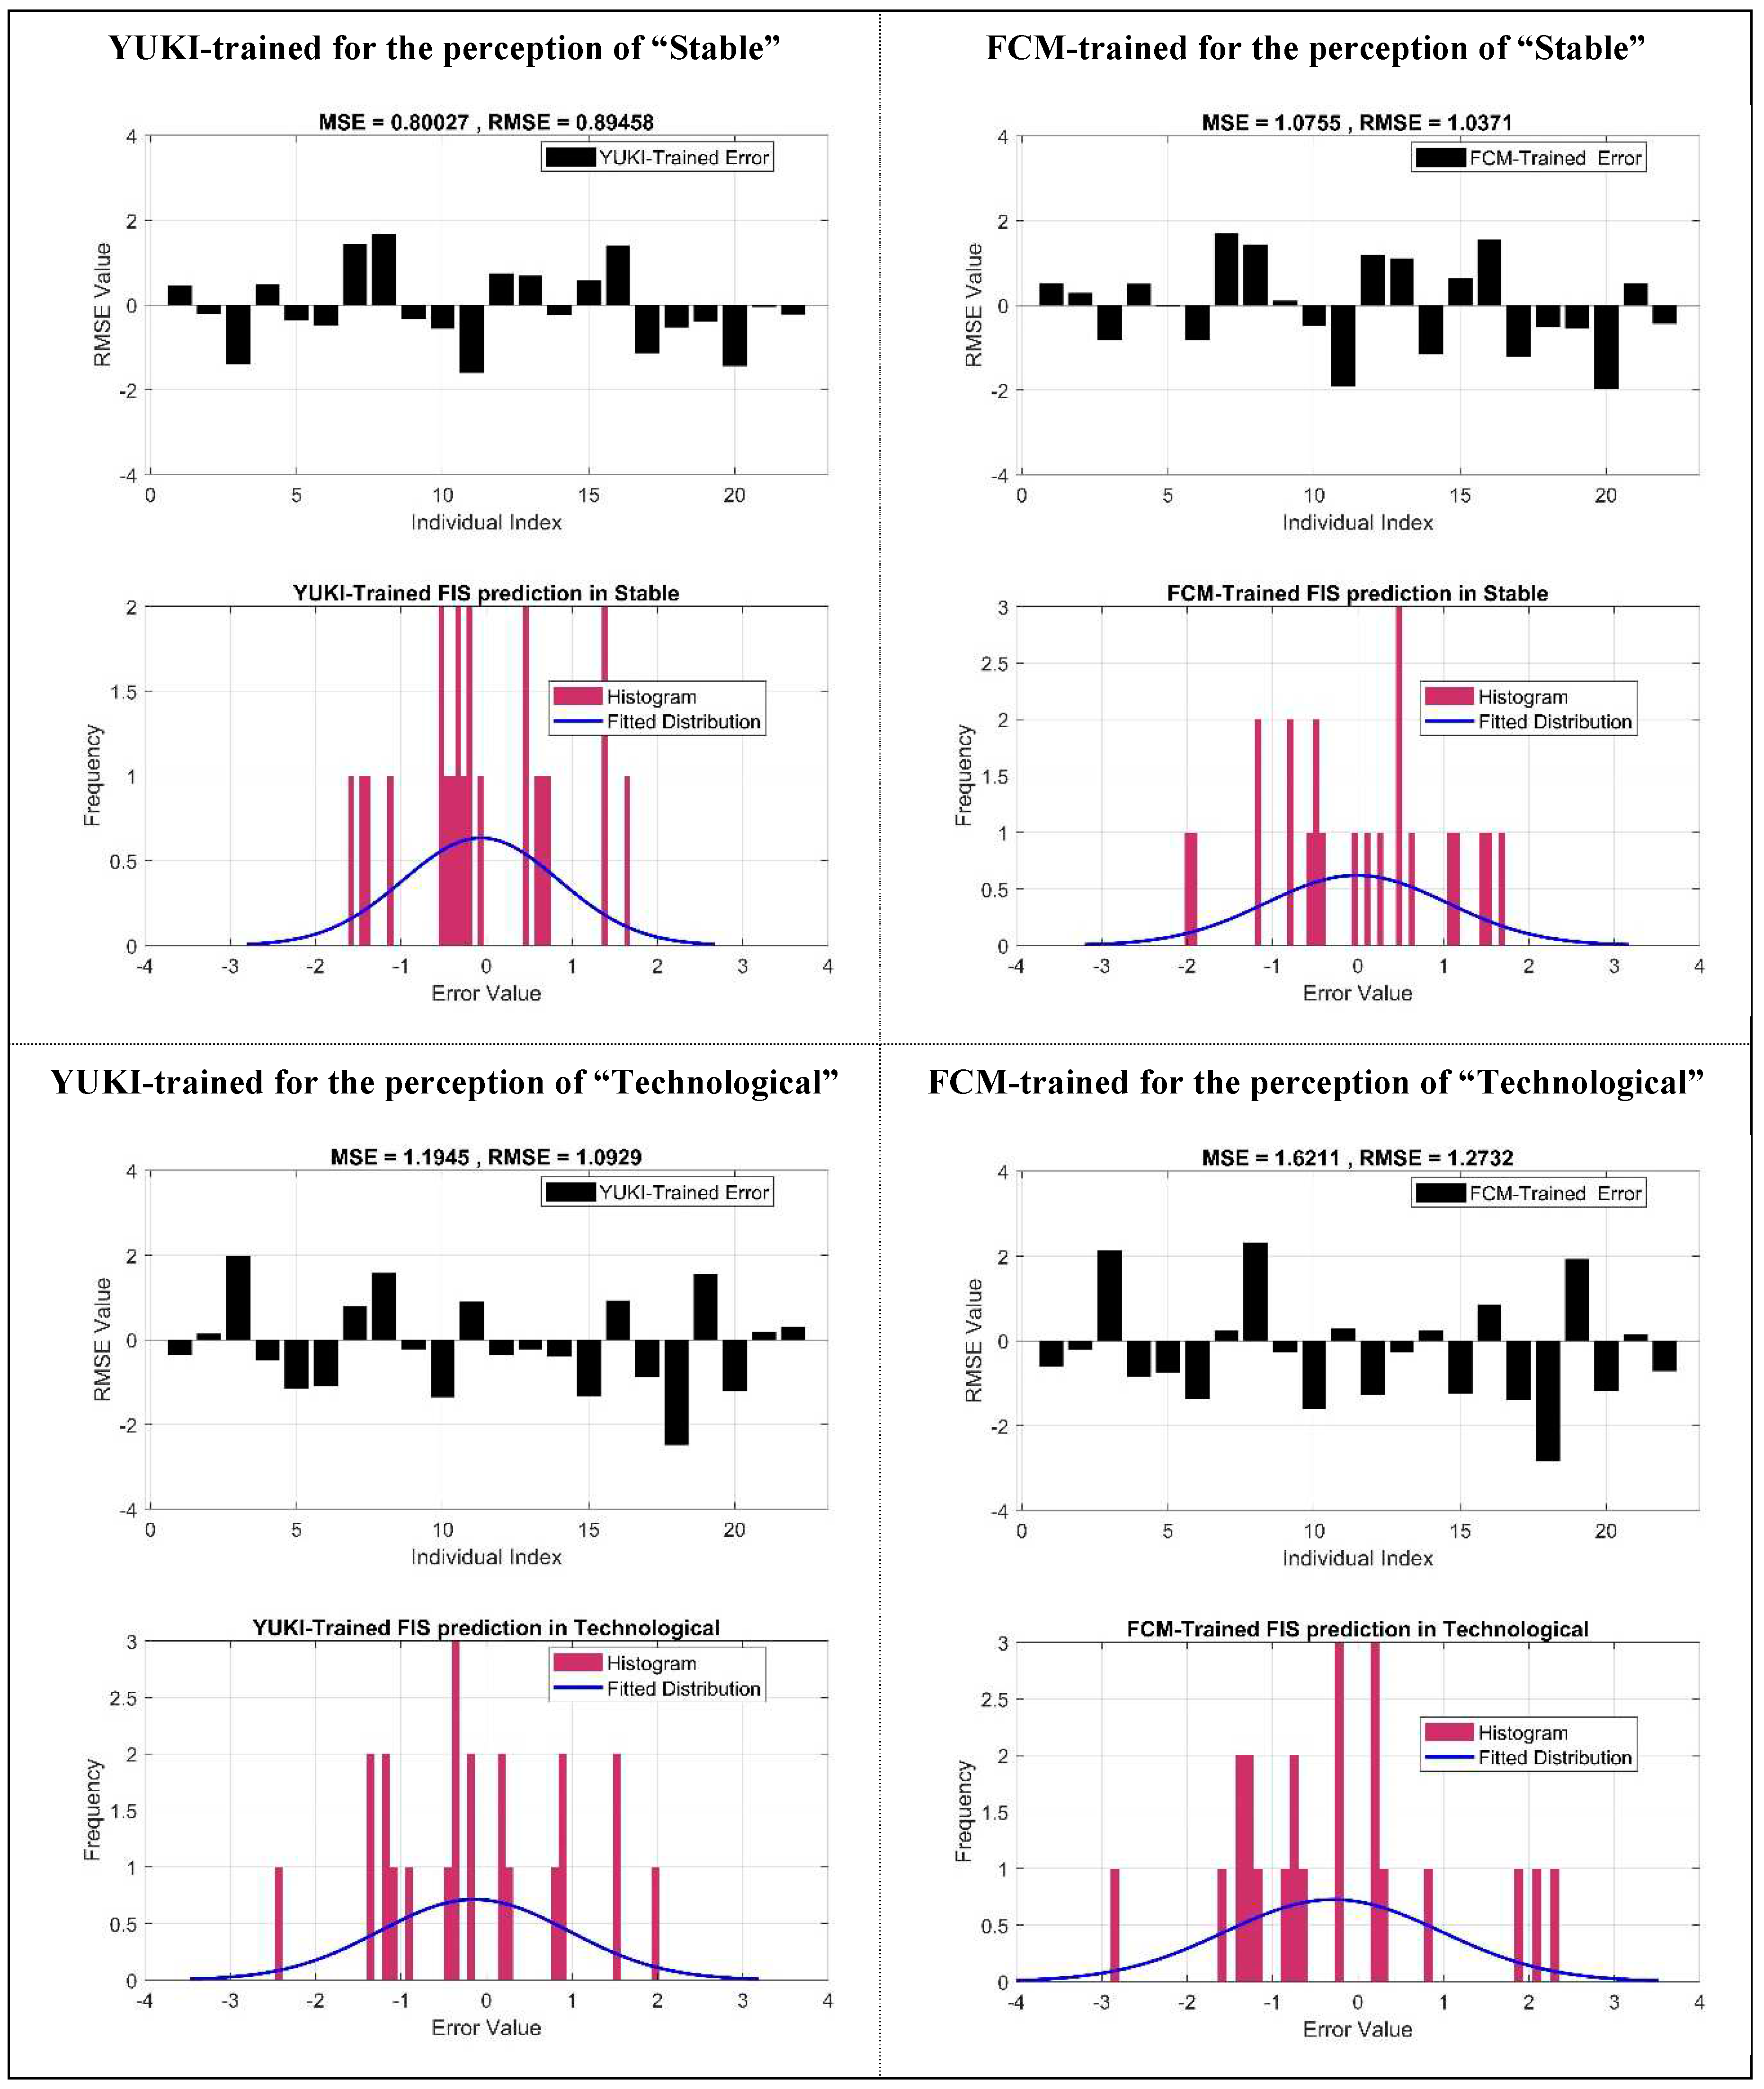
Figure 8 presents an exemplification of prediction error specifics for YUKI-trained FIS and FCM-trained FIS for the example perception attributes of "stable" and "technological." The figure illustrates the prediction simple difference between the predicted design perception and the actual design perception, observed for each individual in the testing dataset. The outcomes demonstrate lower maximum errors for the YUKI-trained FIS across all individuals. Furthermore, an overall improvement in prediction accuracy is observed, as evidenced by a reduction in the RMSE value, suggesting enhanced model precision and efficacy.
In order to examine the suggested method against established methods, we considered comparing the YUKI-trained FIS with Deep Artificial Neural Network (ANNs). Deep ANNs have been used in design response modelling [
46,
47,
48], they are characterized by having multiple hidden layers. The number of neurons in each layer of a Deep ANN is a crucial step in building an effective neural network model. To evaluate the proposed approach against Deep Artificial Neural Networks (ANNs), we employed the YUKI algorithm to identify optimal layer combinations and the number of neurons within each layer. We set a constraint of a maximum of 100 neurons per layer and a maximum of 100 iterations. For each layer configuration, we created 20 distinct models.
Figure 9 illustrates the root mean square error (RMSE) for the predictions of the different Deep ANN architectures. The optimal model was attained after 60 iterations, featuring five hidden layers with neuron counts of 13, 16, 17, 17, and 10, respectively.
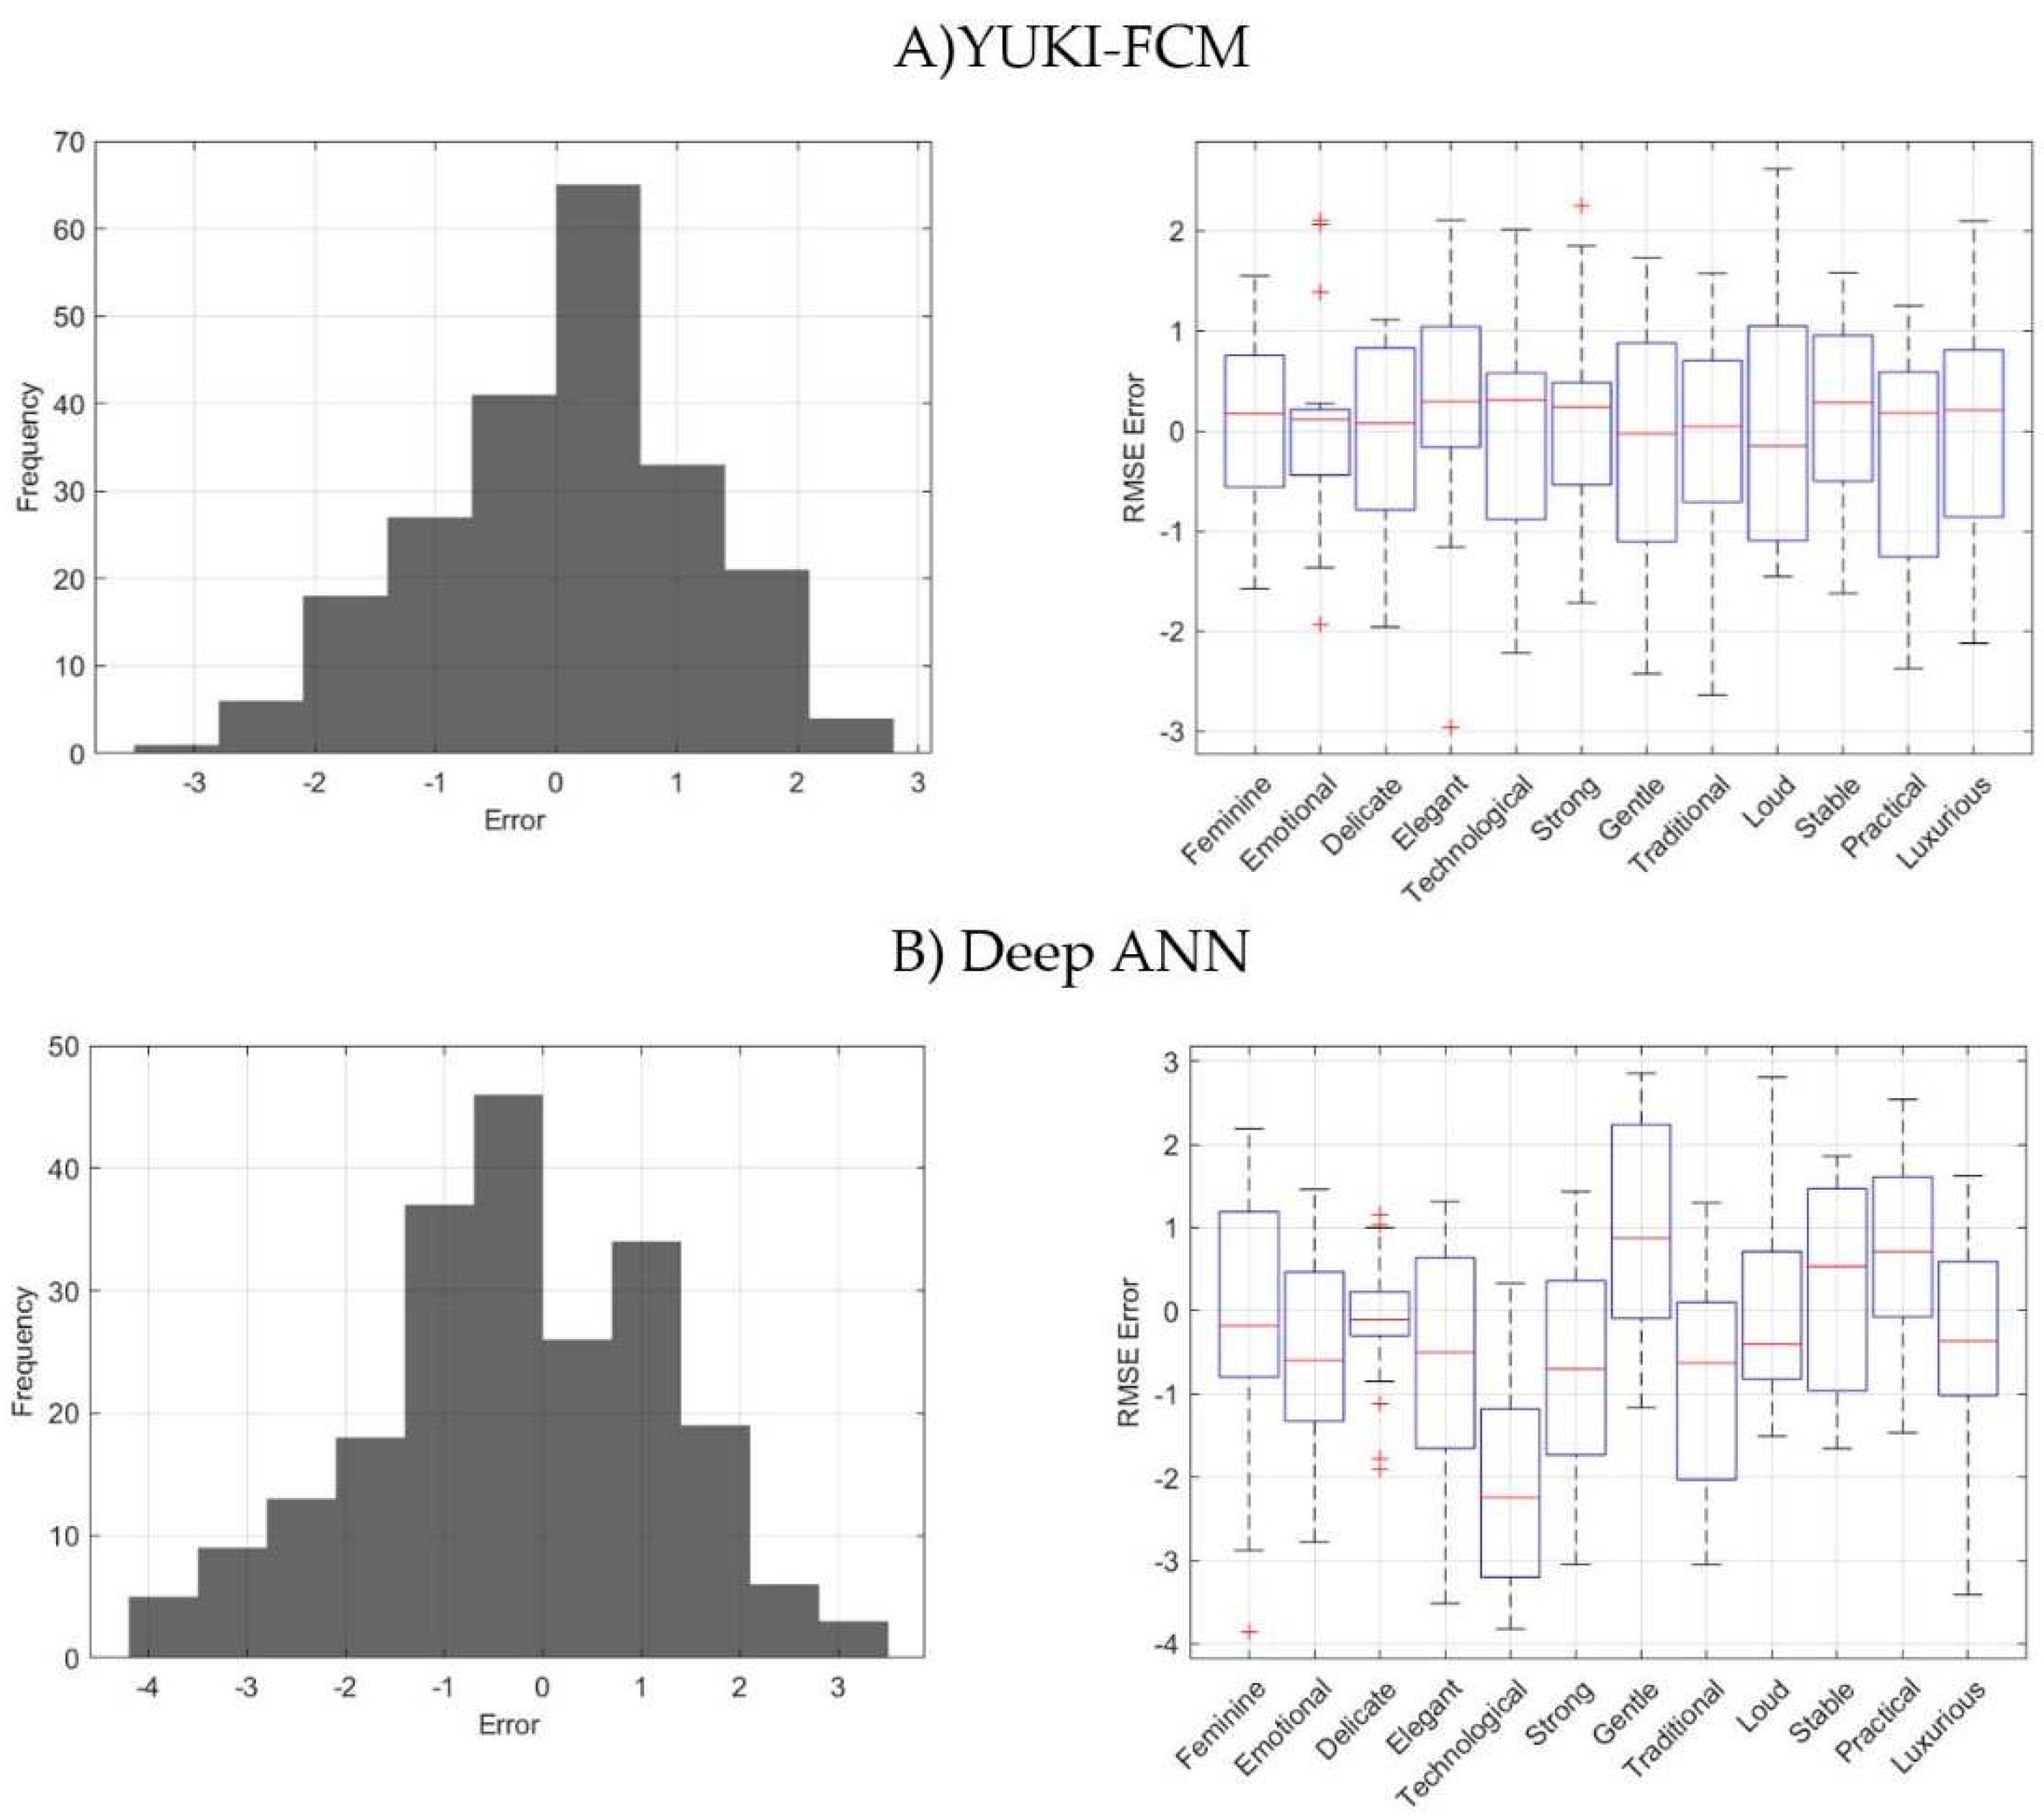
The statistical analysis of prediction errors for two different models, YUKI-FCM and Deep ANN, provides insights into the performance of each model in predicting the individual consumer perception across the 12 adjectives. When comparing their mean errors, the YUKI-FCM model generally exhibits smaller mean errors, indicating a more accurate prediction for most adjectives compared to the Deep ANN model. Specifically, YUKI-FCM demonstrates superior performance for 'Elegant,' 'Technological,' 'Strong,' 'Traditional,' 'Stable,' and 'Practical,' with mean errors closer to zero. Conversely, Deep ANN performs better for 'Emotional,' 'Delicate,' 'Gentle,' 'Loud,' and 'Luxurious.' However, both models exhibit higher mean errors for 'Feminine,' suggesting room for improvement in predicting this adjective. When considering standard deviations of errors, YUKI-FCM shows more consistent predictions across all adjectives, whereas Deep ANN displays higher variability in its error estimates, indicating less stability in its predictions. These findings highlight the trade-offs between the models in terms of accuracy and consistency when predicting these adjectives.
YUKI-FCM has a lower standard deviation, ranging from 0.72 to 1.21, indicating relatively consistent error distribution, whereas Deep ANN has higher standard deviations, ranging from 0.87 to 1.72, implying a wider spread of errors. These differences suggest that YUKI-FCM tends to produce predictions closer to the true perception on average with less variability, while Deep ANN may have more pronounced errors and greater variability in its predictions.
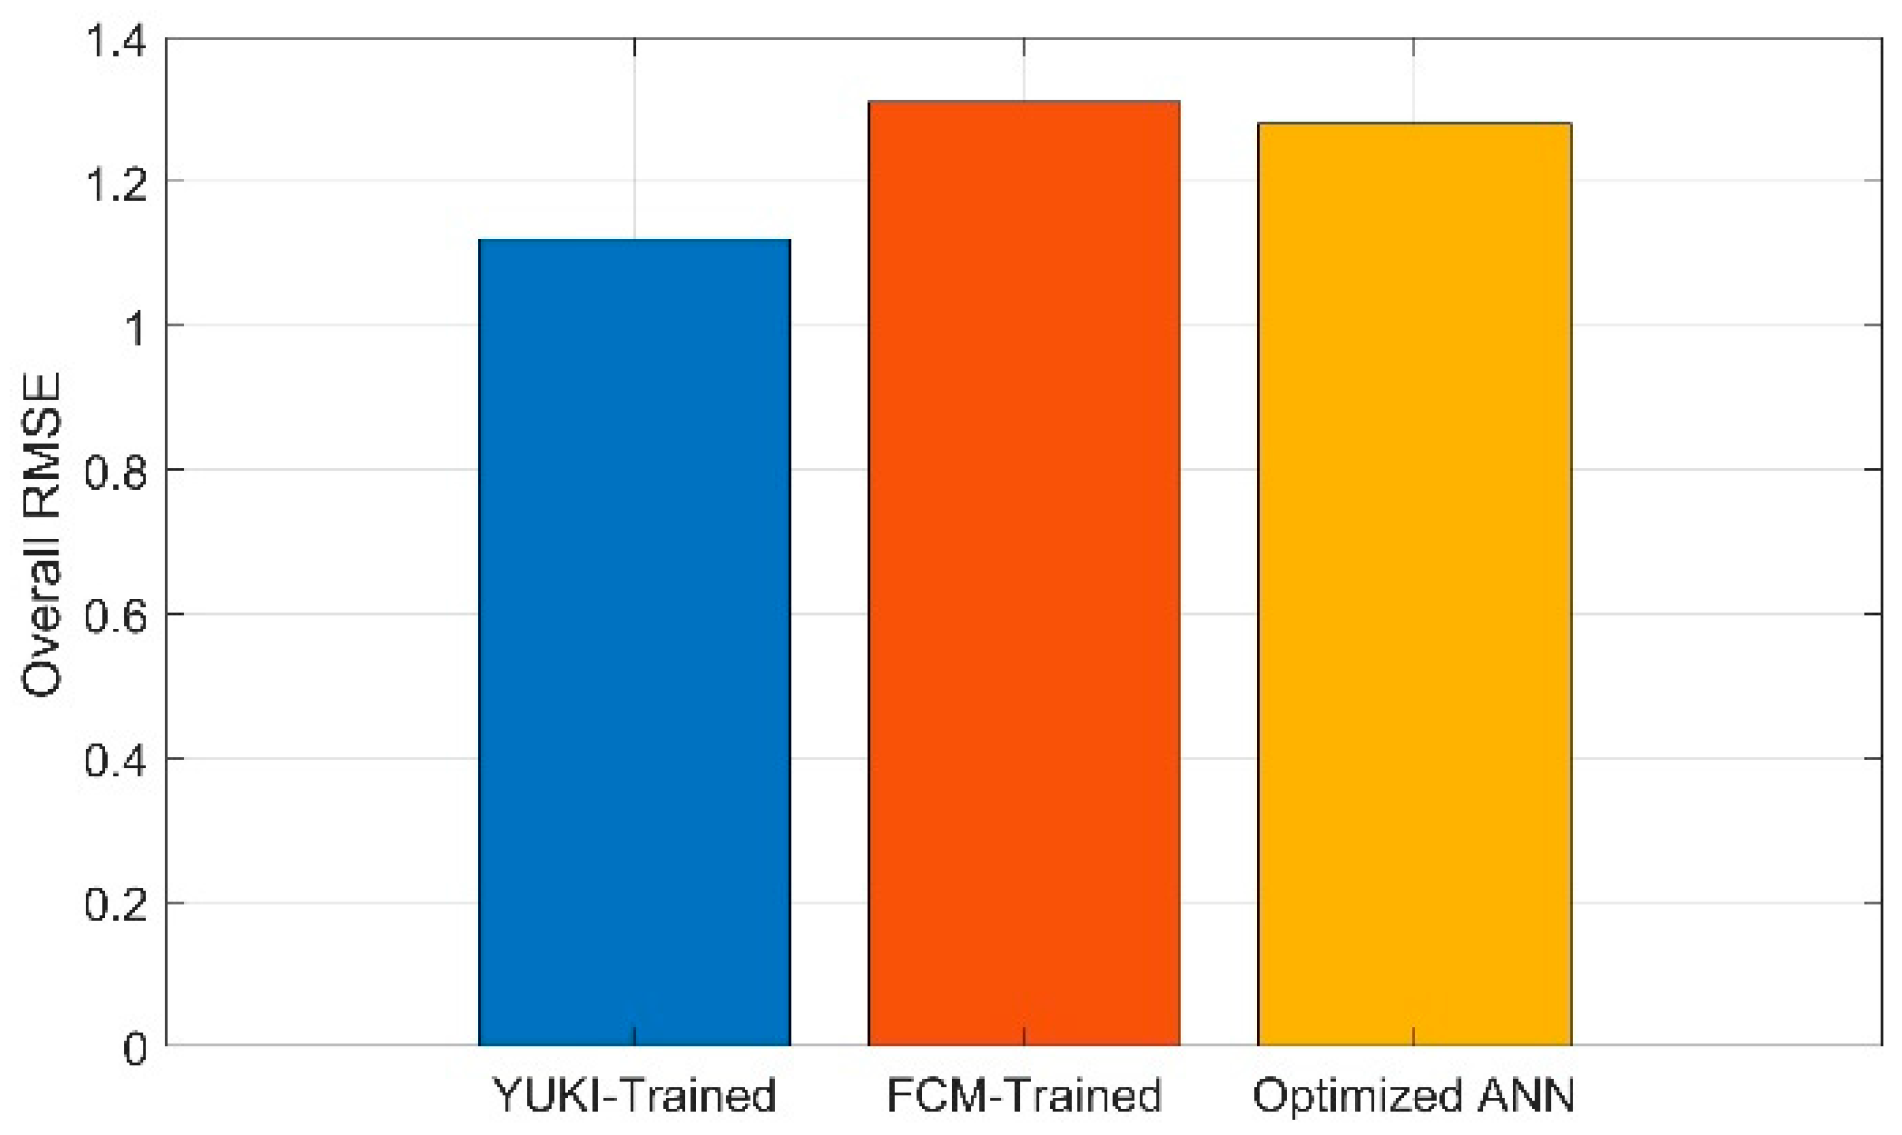
Figure 10 illustrates the prediction errors for two different models: A)YUKI-FCM and B) Deep ANN. And Figure compares the overall RMSE values produced by the YUKI-trained FIS vs. FCM-trained FIS and the optimal Deep ANN architecture model.
7. Conclusions
In this research paper, we focused on enhancing the modeling of affective design perception by optimizing Fuzzy Inference Systems (FIS) through the application of the Fuzzy C-means and the YUKI algorithm. Our study investigates the connection between personality traits, particularly openness, and individual design perception, with vases as the chosen subject of investigation.
By employing the YUKI algorithm, we iteratively trained the FIS model, resulting in improved performance that effectively captured the intricate nuances of individual design preferences. Our findings revealed that the YUKI-trained FIS achieved a satisfactory level of accuracy in predicting individual design perceptions, surpassing the performance of the FCM-trained FIS. Notably, the YUKI-trained FIS demonstrated heightened precision and efficacy. Furthermore, when comparing the YUKI-trained FIS with Deep Artificial Neural Network (ANN) models, the YUKI-trained FIS exhibited superior consistency while maintaining competitive accuracy, positioning it as a promising avenue for future research and practical applications within the realm of product design.
Through the exploration of personality traits, our research offered more nuanced insights into affective design responses. We identified three distinct clusters based on openness-related responses, shedding light on varying degrees of openness among participants. Clusters characterized by high levels of openness showcased a wider array of viewpoints, whereas those with low levels of openness demonstrated greater consensus regarding specific design perceptions. To enhance accuracy, future research should aim to investigate a larger and more diverse dataset of participants, ultimately contributing to a more comprehensive comprehension of the intricate relationship between personality traits and design perception.
Author Contributions
Conceptualization, M.K. and H.T; methodology, B.B. and H.T; software, B.B.; validation, B.B. and K.K.; formal analysis, B.B. and K.K.; investigation, B.B.; resources, M.K.; data curation, K.K.; writing—original draft preparation, B.B.; writing—review and editing, B.B., M.K. and H.T ; visualization, B.B.; supervision, M.K.; project administration, M.K.; funding acquisition, M.K. All authors have read and agreed to the published version of the manuscript.
Conflicts of Interest
The authors declare no conflict of interest.
References
- Achiche, S.; Appio, F. P.; McAloone, T. C.; Di Minin, A. Fuzzy decision support for tools selection in the core front end activities of new product development. Res. Eng. Des. 2013, 24, 1–18. [CrossRef]
- Sakai, M.; Takenouchi, H.; Tokumaru, M. Design support system with votes from multiple people using digital signage. In 2014 IEEE International Symposium on Independent Computing (ISIC); IEEE, 2014; pp. 1–6.
- Abu-Salih, B.; Wongthongtham, P.; Zhu, D.; Chan, K. Y.; Rudra, A. Affective Design Using Social Big Data. In Social Big Data Analytics; Springer, 2021; pp. 145–176.
- Kobayashi, M.; Niwa, K. Method for grouping of customers and aesthetic design based on rough set theory. Comput. Aided. Des. Appl. 2018, 15, 565–574.
- Kobayashi, M. Multi-objective Aesthetic Design Optimization for Minimizing the Effect of Variation in Customer Kansei. Comput. Aided. Des. Appl. 2019, 17, 690–698.
- Benaissa, B.; Kobayashi, M.; Kinoshita, K. Design aesthetics recommender system based on customer profile and wanted affect. arXiv Prepr. arXiv2301.10984 2023.
- Christensen, A. P.; Cotter, K. N.; Silvia, P. J. Reopening openness to experience: A network analysis of four openness to experience inventories. J. Pers. Assess. 2019, 101, 574–588. [CrossRef]
- Afhami, R.; Mohammadi-Zarghan, S. The big five, aesthetic judgment styles, and art interest. Eur. J. Psychol. 2018, 14, 764. [CrossRef]
- Mohammadi-Zarghan, S.; Afhami, R. Memento Mori: the influence of personality and individual differences on aesthetic appreciation of death-related artworks by Damien Hirst. Mortality 2019, 24, 467–485. [CrossRef]
- DeYoung, C. G. Openness/intellect: A dimension of personality reflecting cognitive exploration. 2015.
- Antinori, A.; Carter, O. L.; Smillie, L. D. Seeing it both ways: Openness to experience and binocular rivalry suppression. J. Res. Pers. 2017, 68, 15–22. [CrossRef]
- Benaissa, B.; Kobayashi, M. The consumers’ response to product design: a narrative review. Ergonomics 2023, 66, 791–820. [CrossRef]
- Myszkowski, N.; Storme, M. How personality traits predict design-driven consumer choices. Eur. J. Psychol. 2012, 8, 641–650. [CrossRef]
- Bloch, P. H.; Brunel, F. F.; Arnold, T. J. Individual differences in the centrality of visual product aesthetics: Concept and measurement. J. Consum. Res. 2003, 29, 551–565. [CrossRef]
- Fujiwara, K.; Nagasawa, S. Analysis of psychological factors that influence preference for luxury food and car brands targeting Japanese people. Am. J. Ind. Bus. Manag. 2015, 5, 590. [CrossRef]
- Fujiwara, K.; Nagasawa, S. Relationships among purchase intentions for luxury brands and personality traits based on the Big Five. Am. J. Ind. Bus. Manag. 2015, 5, 631. [CrossRef]
- Shen, H.-C.; Wang, K.-C. Affective product form design using fuzzy Kansei engineering and creativity. J. Ambient Intell. Humaniz. Comput. 2016, 7, 875–888. [CrossRef]
- Yeh, Y.-E. Prediction of optimized color design for sports shoes using an artificial neural network and genetic algorithm. Appl. Sci. 2020, 10, 1560. [CrossRef]
- Ruder, S. An overview of gradient descent optimization algorithms. arXiv Prepr. arXiv1609.04747 2016.
- Abdel-Basset, M.; Abdel-Fatah, L.; Sangaiah, A. K. Metaheuristic algorithms: A comprehensive review. Comput. Intell. Multimed. big data cloud with Eng. Appl. 2018, 185–231. [CrossRef]
- Wu, Y. Product Appearance Design Based on Consumers’ Kansei Image and Fuzzy Kano Model Satisfaction Evaluation-Case Study of Air Purifier. Comput. Aided. Des. Appl. 2021, 18, 1186–1209.
- Jiang, W.; Zhang, K.; Zhao, W.; Guo, X. Fuzzy evaluation of kansei attributes using convolutional neural networks. In International Design Engineering Technical Conferences and Computers and Information in Engineering Conference; American Society of Mechanical Engineers, 2021; Vol. 85376, p. V002T02A051.
- NISHIMURA, Y.; TAKENOUCHI, H.; TOKUMARU, M. Extracting Preference Rules Using Kansei Retrieval Agents with Fuzzy Inference. Int. J. Affect. Eng. 2022, 21, 181–190. [CrossRef]
- Takenouchi, H.; Tokumaru, M. Kansei retrieval agent model with fuzzy reasoning. Int. J. Fuzzy Syst. 2017, 19, 1803–1811. [CrossRef]
- Hotta, H.; Hagiwara, M. A fuzzy rule based personal Kansei modeling system. In 2006 IEEE International Conference on Fuzzy Systems; IEEE, 2006; pp. 1031–1037.
- Tang, K.-S.; Man, K.-F.; Liu, Z.-F.; Kwong, S. Minimal fuzzy memberships and rules using hierarchical genetic algorithms. IEEE Trans. Ind. Electron. 1998, 45, 162–169. [CrossRef]
- Chen, M.-S.; Wang, S.-W. Fuzzy clustering analysis for optimizing fuzzy membership functions. Fuzzy sets Syst. 1999, 103, 239–254. [CrossRef]
- Dunn, J. C. A fuzzy relative of the ISODATA process and its use in detecting compact well-separated clusters. 1973. [CrossRef]
- Bezdek, J. C.; Ehrlich, R.; Full, W. FCM: The fuzzy c-means clustering algorithm. Comput. Geosci. 1984, 10, 191–203. [CrossRef]
- Brikh, L.; Guenounou, O.; Bakir, T. Selection of minimum rules from a fuzzy TSK model using a PSO–FCM combination. J. Control. Autom. Electr. Syst. 2023, 34, 384–393. [CrossRef]
- Yang, L.; Yu, K.; Wang, F. PSO-FCM Intelligent Algorithm in Computer Network Data Detection. In International Conference on Cognitive based Information Processing and Applications; Springer, 2022; pp. 33–41.
- Ding, W.; Feng, Z.; Andreu-Perez, J.; Pedrycz, W. Derived multi-population genetic algorithm for adaptive fuzzy c-means clustering. Neural Process. Lett. 2022, 1–25. [CrossRef]
- Benaissa, B.; Hocine, N. A.; Khatir, S.; Riahi, M. K.; Mirjalili, S. YUKI Algorithm and POD-RBF for Elastostatic and dynamic crack identification. J. Comput. Sci. 2021, 55, 101451. [CrossRef]
- Khatir, A.; Capozucca, R.; Khatir, S.; Magagnini, E.; Benaissa, B.; Le Thanh, C.; Wahab, M. A. A new hybrid PSO-YUKI for double crack identification in CFRP cantilever beam. Compos. Struct. 2023, 116803. [CrossRef]
- Amoura, N.; Benaissa, B.; Al Ali, M.; Khatir, S. Deep Neural Network and YUKI Algorithm for Inner Damage Characterization Based on Elastic Boundary Displacement BT - Proceedings of the International Conference of Steel and Composite for Engineering Structures. In; Capozucca, R.; Khatir, S.; Milani, G., Eds.; Springer International Publishing: Cham, 2023; pp. 220–233.
- Al Ali, M.; Shimoda, M.; Benaissa, B.; Kobayashi, M. Non-parametric optimization for lightweight and high heat conductive structures under convection using metaheuristic structure binary-distribution method. Appl. Therm. Eng. 2023, 121124. [CrossRef]
- Bui, D. T.; Bui, Q.-T.; Nguyen, Q.-P.; Pradhan, B.; Nampak, H.; Trinh, P. T. A hybrid artificial intelligence approach using GIS-based neural-fuzzy inference system and particle swarm optimization for forest fire susceptibility modeling at a tropical area. Agric. For. Meteorol. 2017, 233, 32–44. [CrossRef]
- Mousavi, S. M. H.; MiriNezhad, S. Y.; Mosleh, M. S.; Dezfoulian, M. H. A PSO fuzzy-expert system: As an assistant for specifying the acceptance by NOET measures, at PH. D level. In 2017 Artificial Intelligence and Signal Processing Conference (AISP); IEEE, 2017; pp. 11–18.
- Mousavi, S. M. H.; MiriNezhad, S. Y.; Lyashenko, V. An evolutionary-based adaptive Neuro-fuzzy expert system as a family counselor before marriage with the aim of divorce rate reduction. 2017.
- Kobayashi, M.; Kinumura, T. A method of gathering, selecting and hierarchizing kansei words for a hierarchized kansei model. Comput. Aided. Des. Appl. 2017, 14, 464–471.
- Akay, D.; Duran, B. U.; Duran, E.; Henson, B.; Boran, F. E. Developing a Labeled Affective Magnitude scale and Fuzzy Linguistic scale for tactile feeling. Hum. Factors Ergon. Manuf. Serv. Ind. 2021, 31, 13–26. [CrossRef]
- Sutono, S. B. Selection of representative Kansei adjectives using cluster analysis: a case study on car design. Int. J. Adv. Eng. Manag. Sci. 2016, 2, 239691.
- Perez Mata, M.; Ahmed-Kristensen, S.; Brockhoff, P. B.; Yanagisawa, H. Investigating the influence of product perception and geometric features. Res. Eng. Des. 2017, 28, 357–379. [CrossRef]
- Mata, M. P.; Ahmed-Kristensen, S.; Shea, K. Implementation of design rules for perception into a tool for three-dimensional shape generation using a shape grammar and a parametric model. J. Mech. Des. 2019, 141. [CrossRef]
- Shieh, M.-D.; Li, Y.; Yang, C.-C. Comparison of multi-objective evolutionary algorithms in hybrid Kansei engineering system for product form design. Adv. Eng. Informatics 2018, 36, 31–42.
- Quan, H.; Li, S.; Hu, J. Product innovation design based on deep learning and Kansei engineering. Appl. Sci. 2018, 8, 2397. [CrossRef]
- Su, Z.; Yu, S.; Chu, J.; Zhai, Q.; Gong, J.; Fan, H. A novel architecture: Using convolutional neural networks for Kansei attributes automatic evaluation and labeling. Adv. Eng. Informatics 2020, 44, 101055. [CrossRef]
- Kobayashi, M.; Fujita, S.; Wada, T. Aesthetic Design Based on the Analysis of Questionnaire Results Using Deep Learning Techniques. 2022.
|
Disclaimer/Publisher’s Note: The statements, opinions and data contained in all publications are solely those of the individual author(s) and contributor(s) and not of MDPI and/or the editor(s). MDPI and/or the editor(s) disclaim responsibility for any injury to people or property resulting from any ideas, methods, instructions or products referred to in the content. |
© 2023 by the authors. Licensee MDPI, Basel, Switzerland. This article is an open access article distributed under the terms and conditions of the Creative Commons Attribution (CC BY) license (http://creativecommons.org/licenses/by/4.0/).

