Preprint
Article

Quantitative Characteristics and Environmental Interpretation of Vegetation Restoration in Burned Areas of the Dry Valleys of Southwest China

Altmetrics

Downloads

84

Views

19

Comments

0

A peer-reviewed article of this preprint also exists.

Submitted:

14 September 2023

Posted:

15 September 2023

You are already at the latest version

Alerts
Abstract
Fire is a common natural disturbance in forest ecosystems and plays an important role in subsequent vegetation patterns. Based on the spatial sequence method instead of the time successional sequence method, this study selected burned areas in different locations in the Anning River Basin, which contains typical dry valleys. Quadrat surveys and quantitative classification were used to identify the vegetation classification, distribution pattern, and environmental interpretation during the natural restoration process after forest fire. The results showed that: (1) the vegetation community in the early stage of natural recovery after forest fire disturbance could be divided into seven community types, and Quercus guyavaefolia H. Leveille (Qg) was the dominant species in the community; (2) vegetation samples could be divided into five ecological types, and the classification and distribution pattern of community types in this region changed most obviously with altitude; and (3) detrended correspondence analysis could clearly classify vegetation community types, and detrended canonical correspondence analysis could well reveal the relationships between species and environmental factors. This study provides a scientific basis guiding the restoration of ecosystem structural stability and biodiversity in burned areas.
Keywords: 
Subject: Environmental and Earth Sciences  -   Ecology

1. Introduction

As an important part of the global terrestrial ecosystem, forests have important ecological functions such as preventing soil erosion, preventing wind and sand, and regulating climate (Lourens et al. 2017). There are many factors affecting forest ecosystems, among which fire is the most direct (Di et al. 2007). Fire can promote the secondary succession of vegetation communities while destroying the forest (Di et al. 2007), and the renewal and restoration of vegetation after forest fire disturbance is an important problem faced by environmental researchers and human society (Calvo et al. 2005).
After vegetation communities are disturbed by forest fire, the greatest contribution to community changes is made by the growth of herbs and shrubs (Lasaponara et al., 2009). Shrub-grass vegetation can efficiently absorb soil nutrients and grow rapidly to cover the surface (Lasaponara et al. 2009). Shrub-grass vegetation communities develop rapidly in burned areas, and then slowly succeed to woody plant communities. This causes the recovery rate of the normalized difference vegetation index (NDVI) in fire areas to be relatively slow (Lasaponara et al. 2009, Schoennagel et al. 2004, Ted 1971, Dalel et al. 1979). The effects of fire on different vegetation communities vary, and there are significant differences in their degree of recovery. The similarity of the vegetation community shrub layer is higher than that of the herb layer in burned areas (Xofis et al. 2021). When the forest fire disturbance years are closely separated, the similarity of the vegetation community shrub layer in the burned areas is much higher than that when the forest fire disturbance years are far apart (Xofis et al. 2021, Wang et al. 2004). The forest aboveground biomass is significantly affected by forest fire, which not only has profound impact on the biomass of different tree species communities but also has different effects on communities in different succession periods (Virginia et al. 2018). In previous research, after forest fire disturbance, the vegetation community in the burned areas was single in the early recovery stage relatively, and the vegetation community types differed little among plots (Jin and Wu 2021, Cai et al. 2012). The intensity level of forest fire disturbance is related to the characteristics of the understory plant community composition (Jens et al. 2019). The fine-scale heterogeneity of the forest structure after fire is an important driving factor of vegetation species diversity (Jens et al. 2019). Forest fires promote the development of different dominant vegetation through their positive effect on soil seed bank dynamics, which has great significance in maintaining vegetation species richness (Hideo et al. 2011).
Since the 1980s, the quantitative classification and ordination of vegetation has been a hot topic in ecological research, and has become an indispensable means of vegetation community ecology research (Zhang et al. 2000, Yu et al. 2005). In China, the research on vegetation quantitative classification and ordination can be summarized as the process from introduction, learning to trial, application and development (Zhang et al. 2000, Yu et al. 2005). Quantitative classification refers to the transformation of classification concepts from qualitative description to quantitative analysis using mathematical methods, which has great significance for promoting the development of biological taxonomy (Michal et al. 2016). Compared with the quantitative classification method (determining the disjunctive distribution of the community), the quantitative ordination method can reveal the continuous relationship of the community distribution (Wang et al. 2006). Two-way indicator species analysis (TWINSPAN), detrended correspondence analysis (DCA), and detrended canonical correspondence analysis (DCCA) are the main methods used in vegetation quantitative classification and ordination. These methods can objectively and quantitatively reveal the distribution pattern of vegetation communities and the relationship between vegetation communities and environmental factors (Chian et al. 2016, Rahman et al. 2017, Wang et al. 2006, Jiang et al. 2015).
Due to its unique dry valley climate conditions and human factors, the Anning River Basin has become an areas with concentrated fire occurrence (Bai et al. 2020). To date, research on the burned areas in the dry valleys of the Anning River Basin has focused on revealing the law of vegetation community restoration (Liu et al., 2022, Bai et al., 2020) and vegetation evaluation (Jiang et al. 2022), while the quantitative classification and ordination of vegetation communities in burned areas remain unclear. The purpose of this study was to explore the classification and distribution pattern of vegetation communities and their influencing factors in the early stage of natural recovery after forest fire disturbance in dry valleys. The results of this study have important guiding significance for the prevention of soil erosion and ecological civilization construction in dry valleys.

2. Materials and Methods

2.1. Study Area

The Anning River (27°05′–29°02N, 101°38′–102°43′E) is a tributary of the Yalong River, which is a tributary of the Jinsha River (Figure 1). The main stream of Anning River flows through Mianning, Xichang, and Dechang in Liangshan Prefecture and Miyi County in Pan Zhihua City, with a total length of 320 km and a drainage area of 11150 km2 (Xu 2004). The north–south climate change and vertical difference in the basin are large, the precipitation is concentrated from May to October, and the annual precipitation is more than 1000 mm (Xu 2004). The forests in this area are dominated by Pinus yunnanensis Franch. (Py)–Pinus massoniana Lamb. (Pm) mixed forests. Under the forest, the vegetation community mainly consists of shrubs and herbs such as Quercus guyavaefolia H. Leveille (Qg), Machilus pingii Cheng ex Yang (Mp), Duhaldea cappa (Buchanan-Hamilton ex D. Don) Pruski & Anderberg (Dc), Cymbopogon goeringii (Steud.) A. Camus Cymbopogon (Cg), and Paspalum paspaloides (Michx.) Scribn. (Pp). The results of on-site investigation showed that after the forest fire disturbed the study sample area (Table 1), all the aboveground parts of shrubs and grasses died and only trees trunk remained with burned branches, while the soil structure and underground parts of vegetation suffered less damage.

2.2. Methods

2.2.1. Quadrat Setting

In this study, the investigation quadrats were set up in the burned areas during the early natural recovery period after forest fire disturbance in the Anning River Basin (Figure 1 and Table 1) from 2020–2021. Ten plots (10 m × 10 m) were set for each burned area, then quadrats (5 m × 5 m) were placed in the center and four corners of each plot. A total of six burned areas and 360 quadrats, 60 shrub plots, and 300 grass quadrats were set. The type, quantity, plant height, and coverage of understory vegetation in the quadrats were recorded, and the four environmental factors of elevation, slope, slope aspect, and slope position were measured in each quadrat (Qiu et al. 2000).

2.2.2. Importance Value Calculation

The importance value of a vegetation species refers to a comprehensive index of the relative importance of certain vegetation in the community to which it belongs. The importance value calculation method selected in this study is as follows (Sun and Hu 2010):
Trees and Shrub IV = (RD + RH + RC) / 3, (1)
Herbs IV = (RH + RC) / 2. (2)
In formulas (1) and (2), IV is the importance value; RD is the relative density; RH is the relative height; and RC is the relative coverage.

2.2.3. TWINSPAN Quantitative Classification

TWINSPAN quantitative classification is a typical hierarchical classification method that has been widely used in vegetation community studies (Cho et al. 2015). In the present study, WinTWINS 2.3 software was used to perform TWINSPAN quantitative classification based on the importance value matrix and environmental factor matrix of vegetation species in typical quadrats (Zhao et al., 2019, Gholamhosein et al. 2018).

2.2.4. DCA and DCCA

DCA and DCCA are multivariate analysis techniques used to study the relationship between vegetation and the environment (Zhao et al. 2019, Jan et al. 2009). In the present study, DCA and DCCA of the quadrats and environment were performed using CANOCO 4.5 software, and then the sorting diagram was drawn using CanoDraw for Windows 4.5 (Zhao et al. 2019).
For the slope position, 1, 2, 3, 4, and 5 represented the bottom of the slope, downhill slope, middle slope, uphill slope, and top of the slope respectively. The larger the number, the higher the slope position. The original value of the slope direction could not directly represent the degree of sunshine exposure. Therefore, each slope direction was assigned a numerical value, where 1 refers to the north slope (317.15°–22.15°), 2 refers to the northeast slope (22.15°–67.15°) and northwest slope (292.15°–317.15°), 3 refers to the east slope (67.15°–112.15°) and west slope (247.15°–292.15°), 4 refers to the southeast slope (112.15°–157.15°) and southwest slope (202.15°–247.15°), and 5 refers to the south slope (157.15°–202.15°). The higher number of slope direction, the hotter it is (Qiu and Zhang 2000).

3. Results

3.1. Classification of the Vegetation Community

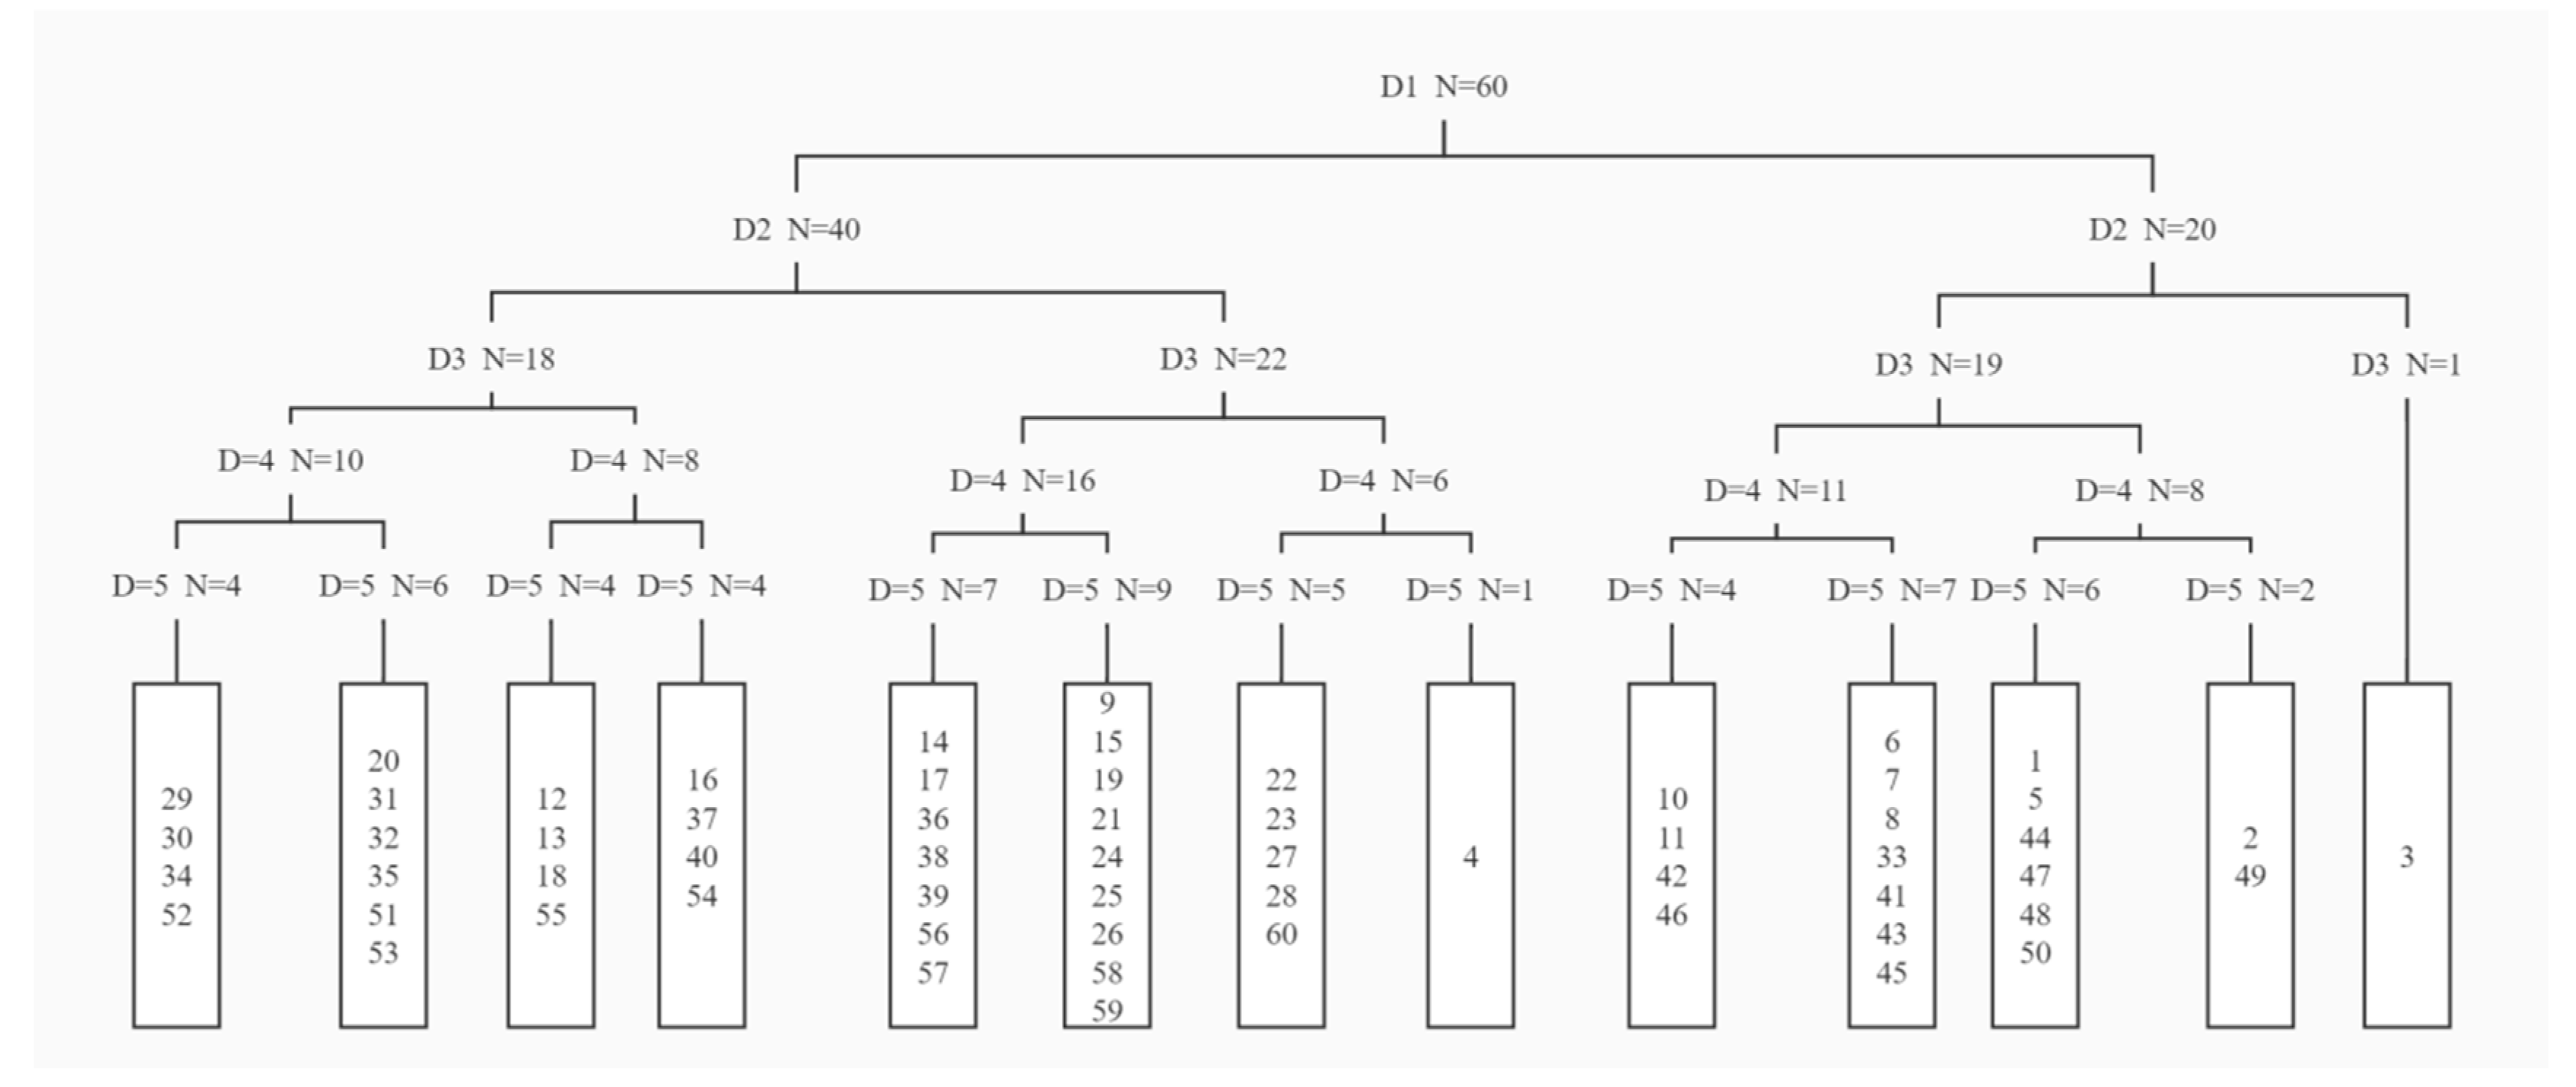
Based on the vegetation community classification methods and principles in China, the community types were named according to the survey results of dominant species. Forty typical vegetation quadrats and 86 vegetation species were quantitatively classified using TWINSPAN. The fourth classification level was used as the classification result, which could be divided into the following seven community types (Figure 2 and Table 2).
Community I: The Vaccinium fragile Franch. (Vf)–Imperata cylindrica (Linn.) Beauv. (Ic) community included quadrats 20, 29, 30–32, 34–35, and 51–53. The community was mainly distributed on gentle, semi-sunny slopes. Except for community indicator species, the shrub layer also included Qg, Rhododendron simsii Planch. (Rs), Mp, and Cotoneaster hissaricus Pojark. (Ch). The herb layer also included Pp, Cg, Uraria lagopodoides (L.) Desv. ex DC. (Ul), Leontopodium leontopodioides (Willd.) Beauv. (Ll), Ageratina adenophora (Sprengel) R. M. King & H. Robinson (Aad), and Tripogon chinensis (Franch.) Hack. (Tc).
Community II: The Dc–Leptochloa chinensis (L.) Nees (Lc) community included quadrats 12–13, 16, 18, 37, 54, and 55. The community was mainly distributed on steep semi-shady slopes or shady slopes. Major species included Qg, Hypericum patulum Thunb. ex Murray (Hp), Mp, Elsholtzia rugulosa Hemsl. (Er), Pp, Cg, Ll, Artemisia argyi Levl. et Van (Aar), and Hedyotis herbacea L. (Hh).
Community III: The Mp–Monogramma trichoidea J. Sm. (Mt) community included quadrats 9, 14, 15, 17, 19, 21, 24–26, 36, 38, and 56–59. The community was distributed on steep, sunny slopes with large elevation drops. The main dominant species in the shrub layer was Mp, but the Qg and Vf were relatively few. In addition to the main dominant species of Mt, the herbaceous layer was mainly composed of Er, Pp, Cg, Polygonatum verticillatum (L.) All. (Pv), Aa, and Cyperus cyperoides (L.) Kuntze (Cc).
Community IV: The Qg–Potentilla leuconota var. brachyphyllaria (Pl) community included quadrats 4, 22–23, 27–28, and 60. The community was distributed on steep, semi-shady slopes or semi-sunny slopes. In addition to community indicator species or dominant species, the shrub layer also mainly included Vf, Hp, and Mp, while the herb layer also included Er, Mt, Commelina diffusa N. L. Burm. (Cd), Desmodium microphyllum (Thunb.) DC. (Dm), Ll, and Aa.
Community V: The Qg–Pp community included quadrats 6–8, 10–11, 33, 41, 42, and 45–47. The community was mainly distributed on steep, shady slopes at high elevations. The major species included Mp, Leptodermis potanini Batalin (Lp), Campylotropis hirtella (Franch.) Schindl. (Ch), Cc, Er, Saussurea hieracioides Hook. f. (Sh), Lc, Ll, and Cg.
Community VI: The Qg–Monochasma savatieri Franch. ex Maxim. (Ms) community included quadrats 1, 2, 5, 43, 44, and 48–50. The community was mainly distributed on gentle, semi-shady slopes or semi-sunny slopes at high elevations. The main species in the shrub layer included Vf, Ch, Mp, and Lespedeza davidii (Ld). The herb layer included the major species Scutellaria baicalensis Georgi (Sb), Polygonum paleaceum Wall. ex HK. f. (Ppa), Pv, Er, Mt, and Sh.
Community VII: The Qg–Ll community included only quadrat 3. The vegetation coverage of this community reached 90%, and it was distributed on a gentle sunny slope at a high elevation. The major species included Vf, Ld, Mp, Lp, Cc, Ms, Rabdosia adenantha (Diels) Hara (Ra), Erigeron speciosus (Lindl.) DC. (Es), Anaphalis sinica Hance (As), and Iris tectorum Maxim. (It).

3.2. DCA Ordination of Vegetation Community Quadrats and Environmental Factors

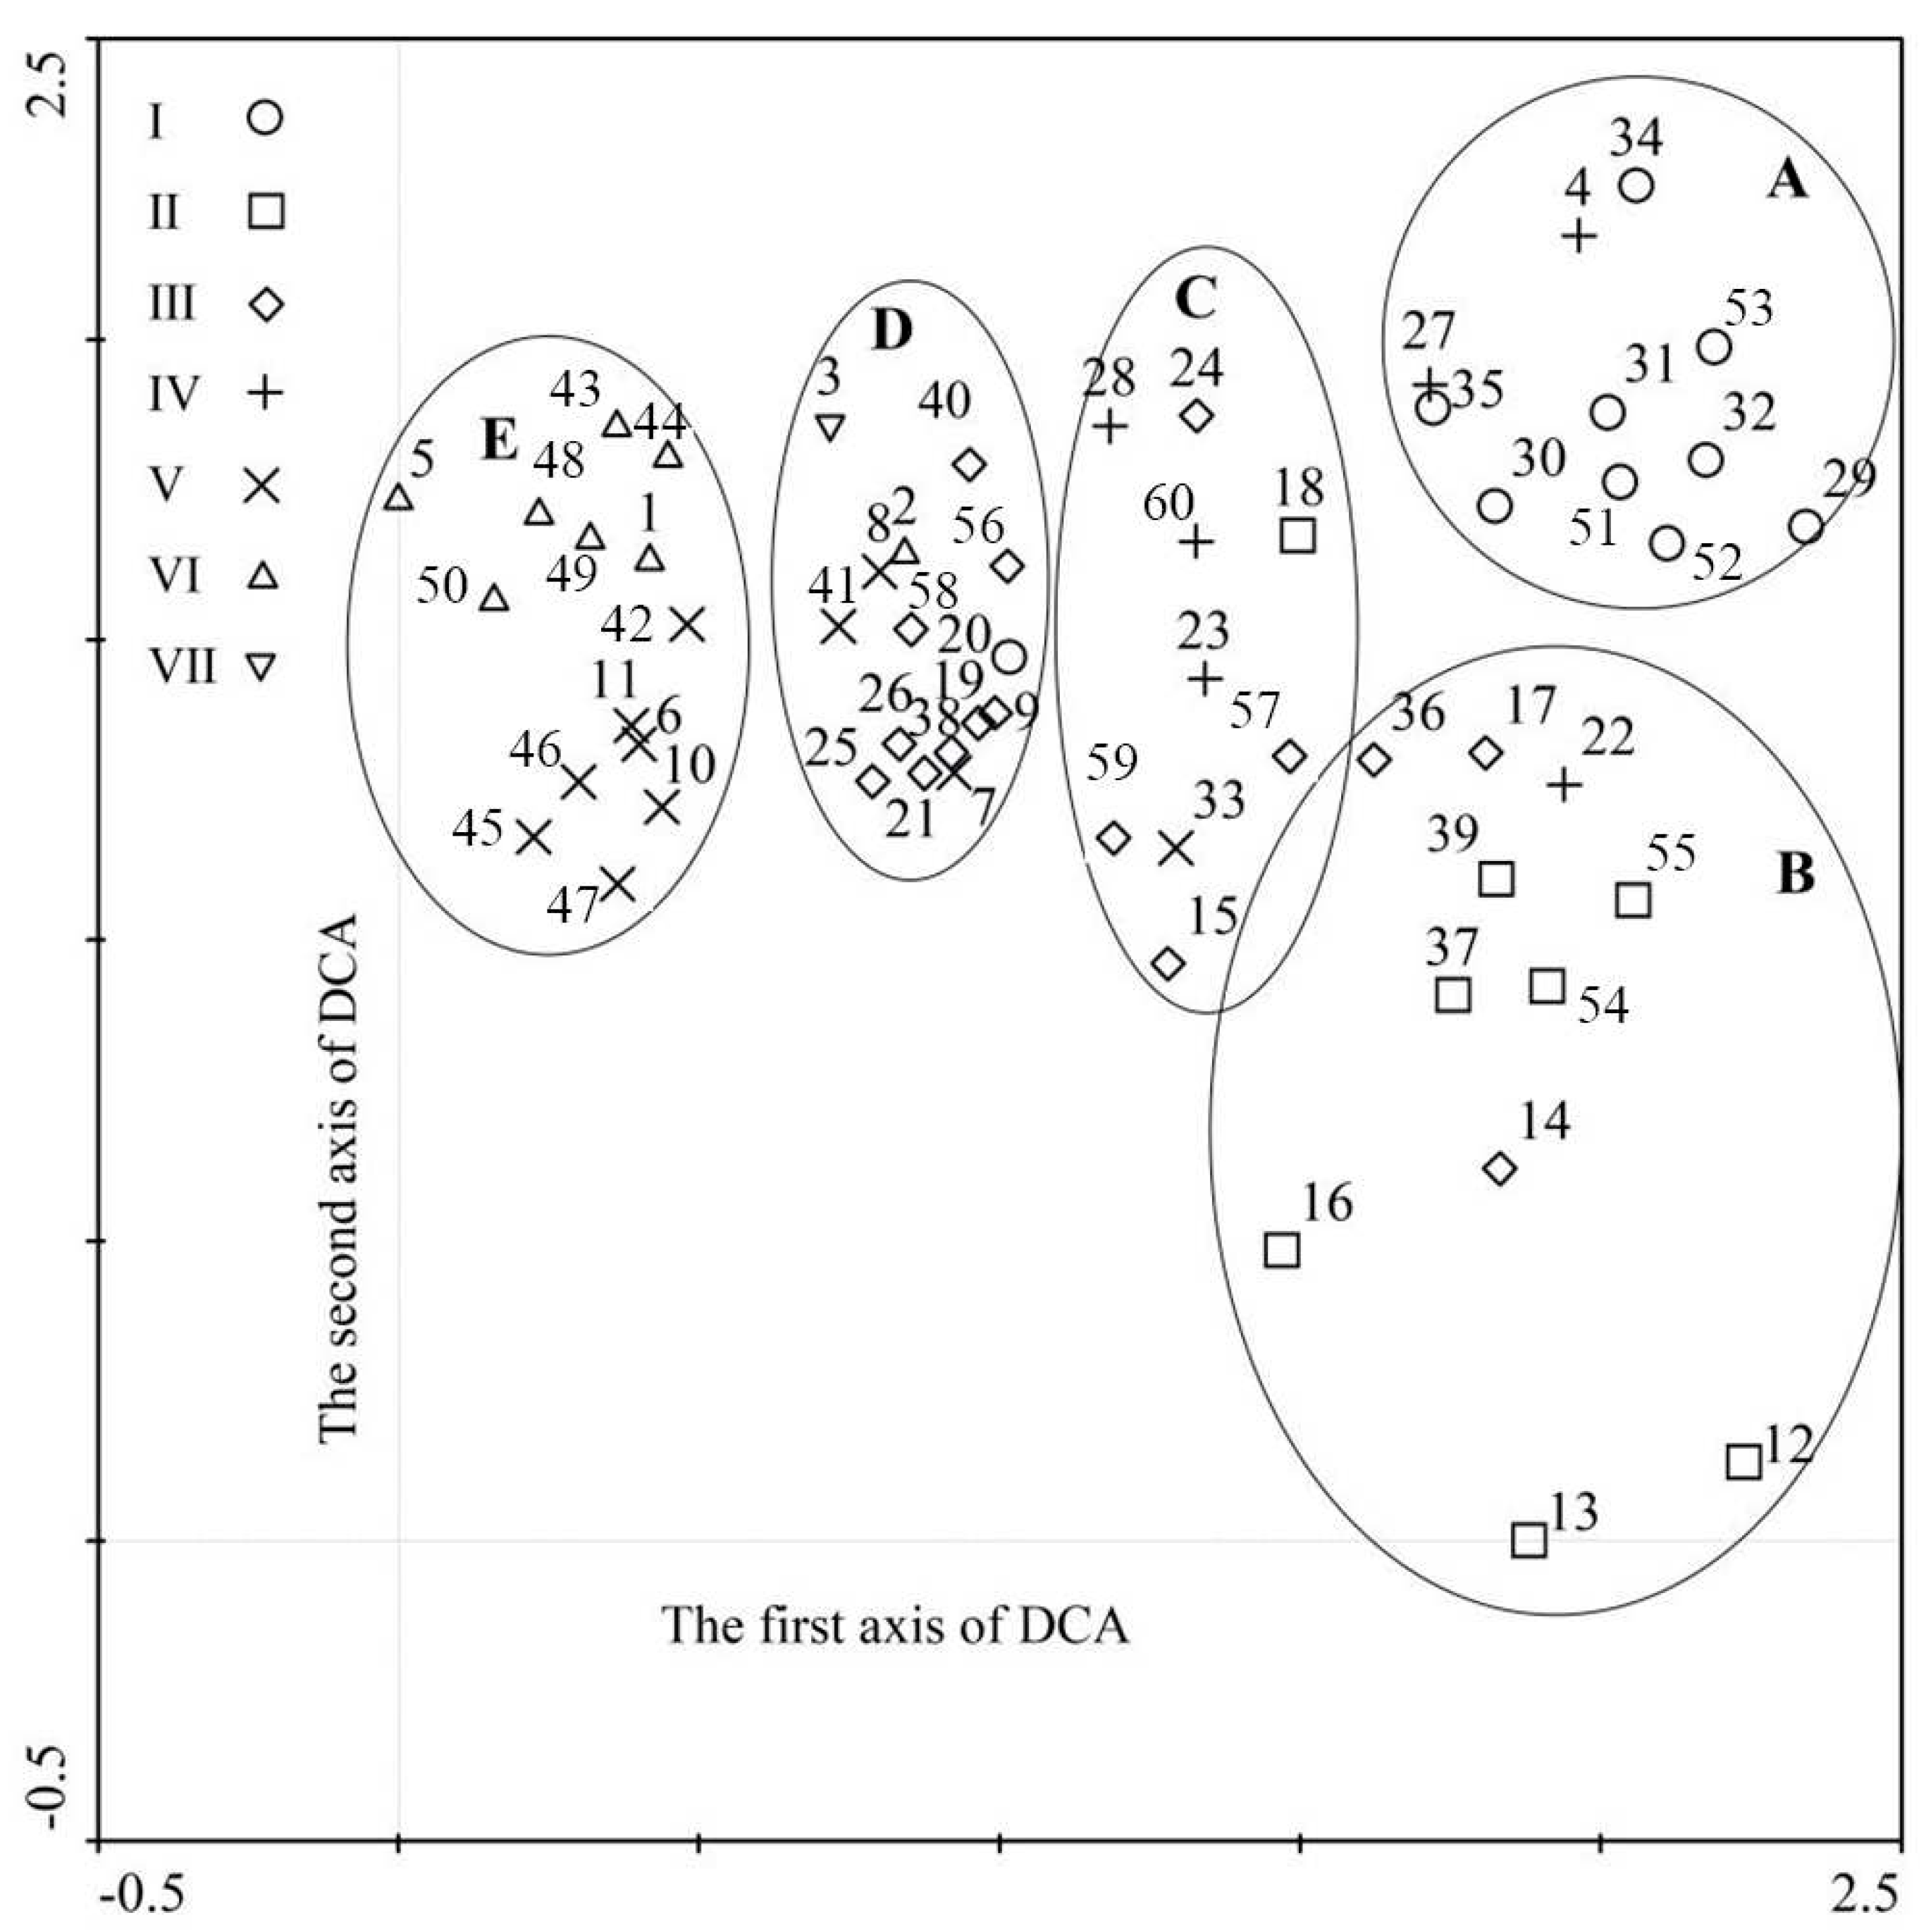
In this study, the results of TWINSPAN classification and DCA ordination revealed the distribution patterns of various vegetation communities in the DCA ordination map (Figure 3). According to the correlation coefficient (r) of the environmental factor matrix of DCA ordination, the first axis of DCA reflected the change of altitude gradient (r=-0.49). The altitude decreased gradually along the direction of the first axis. The direction of the first axis was mainly associated with the temperature condition of the quadrats. The second axis of DCA reflected gradient changes of the slope (r=-0.23) and slope direction (r=0.13). The slope gradually decreased and the degree of sunshine gradually increased along the direction of the second axis. The second axis direction was mainly associated with changes in the hydrological conditions of the quadrats. According to the clustering conditions of 40 typical vegetation quadrats on the DCA ordination diagram, it could be divided into the following five ecotopes:
Ecotope A: This ecotope was dominated by community I, with a large elevation drop (1825–2115 m), a gentle slope (10–25°), and high vegetation coverage (40–85%). Py was the main tree species in this ecotope, and there were many kinds of shrub and grass vegetation. This ecotope was a savanna community.
Ecotope B: This ecotope mainly included community II and community III, with an elevation of 2090–2140 m, a slope of 30–50°, and vegetation coverage of 20–60%. In this ecotope, the trees included Py and Pm, and the shrubs mainly included Dc and Mp. This ecotope was a savanna community.
Ecotope C: This ecotope included communities II, III, IV, and V. It was mainly distributed between an elevation of 2100–2180 m, with a steep slope (30–40°) and 35–70% vegetation coverage. There were various kinds of shrubs and grasses, mainly including Qg and Pp. This ecotope was a savanna community.
Ecotope D: Community III was dominant in this ecotope, and communities I, V, VI, and VII were also included. The ecotope was mainly located between an elevation of 2090–2245 m, with a steep slope of 25–45° and high vegetation coverage that reached 90%. In addition to indicator species or dominant species, this ecotype contained other vegetation species, such as Er, Pp, and Cg. This ecotope was a shrub-grass community.
Ecotope E: This ecotope included community V and community VI. The quadrats were located at a high elevation (2240–2390 m), with a slope of 10–45° and vegetation coverage of 50–80%. The main vegetation of this area was Qg. This ecotope was a shrub-grass community.

3.3. DCCA Ordination of Vegetation Community and Environmental Factors

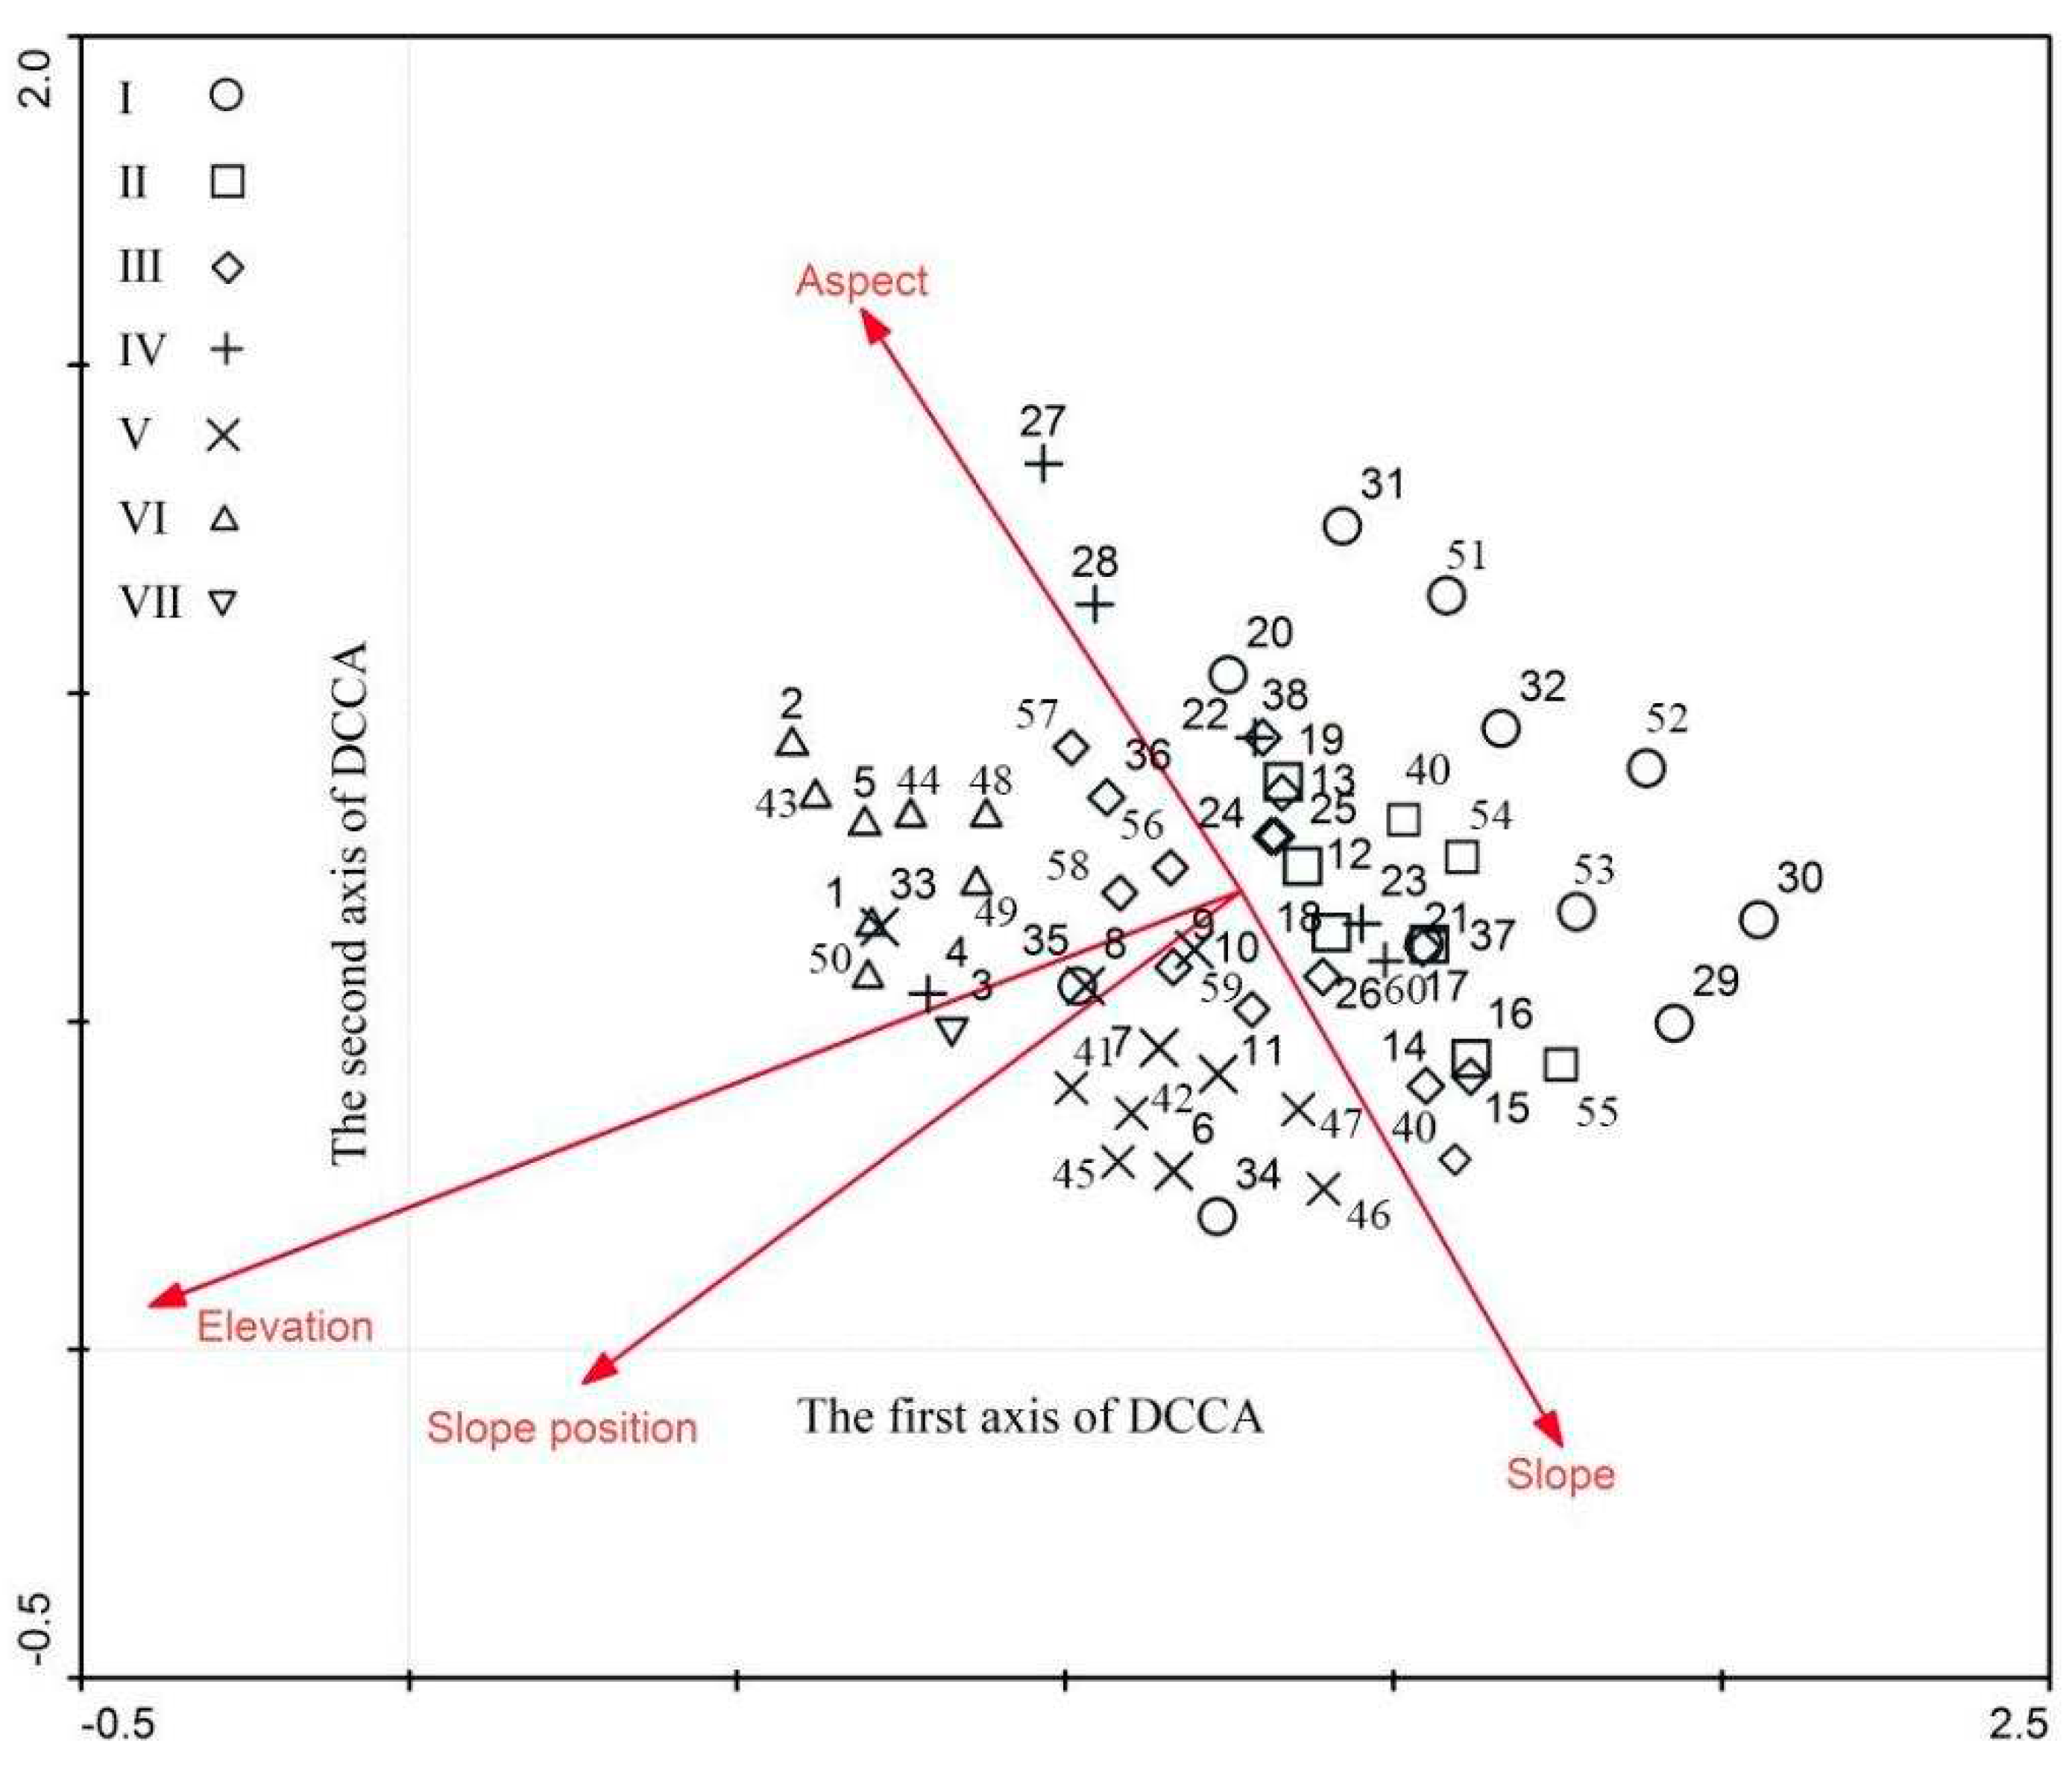
In this study, DCCA ordination was used to analyze the relationship between the vegetation community and environmental factors in the burned areas of the Anning River Basin (Figure 4). The arrow line in the figure represents each environmental factor, while the quadrant of the arrow represents the positive and negative relationships between the environmental factor and the DCCA ordination axis. The slope between the arrow line and the ordination axis represents the correlation between the environmental factor and the ordination axis. The vertical distance from the quadrat to the arrow line represents the impact of the environmental factor on the quadrat. The first ordination axis mainly reflects the change of elevation (r= −0.65) and slope position (r= −0.38). The elevation and slope position gradually decrease along the ordination axis. The second ordination axis mainly reflects the changes of slope (r= −0.46) and aspect (r= 0.48). The slope decreases with the ordination axis direction, and the aspect transitions from shady slope to sunny slope.
The comparison between the DCA ordination diagram (Figure 3) and the DCCA ordination diagram (Figure 4) showed that the quadrat distribution of the DCCA ordination diagram was more concentrated than that of the DCA ordination diagram, but the demarcations between quadrats were not clear. Therefore, DCCA ordination was not as intuitive as DCA ordination when classifying vegetation communities. The eigenvalues of the DCA ordination axis were significantly greater than those of the DCCA ordination axis (Table 3). The correlation coefficients of species–environmental factors of the DCCA ordination axis were significantly larger than those of the DCA ordination axis (Table 3). The conclusion indicated that DCCA ordination focused on the relationship between vegetation species and environmental factors.

4. Discussion

4.1. Vegetation Restoration Features of Burned Areas in the Dry Valleys

Based on the climax pattern hypothesis, seven vegetation communities in the study area have not reached the climax level, and the stability of the community structure and spatial distribution pattern is poor. The vegetation community competes fiercely for nutrient resources in the early stage of vegetation regeneration after forest fire disturbance. The unique arid valley climate and topographical features of the Anning River Basin led to the serious deterioration of environmental conditions (such as a dry climate and poor soil) in the early stage after forest fire disturbance. The secondary succession process of vegetation communities was slow, and only vegetation species with strong tolerance (such as Qg, Mt, and Pp) could grow and cover the surface rapidly. Therefore, many community types with Qg as an indicator species were formed in the Anning River Basin. The community distribution range is large, but the species diversity is relatively single and the stability is low (Chian et al. 2016, Michel and Claire 2013), resulting in a fragile ecosystem structure that is vulnerable to natural disasters such as debris flows. When conducting the artificial restoration of vegetation in burned areas, it is necessary to consider soil and water conservation and vegetation diversity to accelerate the process of vegetation restoration (Jin and Wu 2021). Species that are more tolerant and are suitable to grow in the area, such as Dc and Vf, should be sown to break the dominance of Qg. In addition, it is necessary to consider the influence of environmental factors such as altitude and slope to design a reasonable vegetation configuration so as to improve the species diversity and stability of the ecosystem, and achieve the best restoration effect.

4.2. TWINSPAN Quantity Classification and DCA Ordination Features

TWINSPAN quantitative classification is based on indicator species. Generally, five main dominant species are selected as important indicator species to objectively classify vegetation communities using TWINSPAN (Cho et al. 2015, Jan et al. 2009). DCA ordination was proposed by Hill and Gauch after further research on the basis of correspondence analysis. This method effectively eliminates the bow effect of correspondence analysis, and is widely used in vegetation community analysis as a result (Zhang 1994, Li 2002). For different research sites, scales, and objects, the ecological interpretation of the DCA ordination axis will yield different research results (Zhang 1994). In this study, TWINSPAN quantitative classification was combined with the DCA ordination method, and the DCA ordination diagram was reclassified on the basis of TWINSPAN quantitative classification. The discontinuous and continuous relationships between vegetation classification and distribution were checked out each other(Zhao et al. 2019). These method clearly and accurately revealed the quantitative classification and distribution pattern of vegetation communities in the study area, which has great guiding significance for the efficient implementation of artificial restoration projects in the burned areas. Due to the low amount of quadrat data, only the classification results of fourth-level TWINSPAN quantitative classification were used in this study, so the classification of vegetation community types was not sufficiently detailed. In subsequent studies, the amount of quadrat data should be increased to achieve a more detailed classification of the vegetation community in the study area.

4.3. DCA Ordination and DCCA Ordination Features

The applicable objects of DCA ordination and DCCA ordination are different (Zhang 1994, Jennifer et al. 2006). Due to the clear boundaries between communities, DCA ordination is suitable for classifying vegetation communities and exploring the relationships between communities. The DCCA ordination is based on the DCA ordination, and then performs a multiple linear regression (environmental constraint) between the quadrat environment matrix value and the quadrat ordination value, which not only reflects the similarity of species composition among quadrats but also reflects the similarity of the environmental factors influencing each quadrat (Bai et al. 2020). DCCA ordination can display the three parameters of quadrat, species, and environmental factors on the coordinate plane of the sorting axis simultaneously. The interaction of the three parameters leads to the blurring of the boundaries between communities in the ordination diagram (Zhang 2004). Therefore, DCCA ordination is mainly suitable for revealing the relationships between vegetation species and environmental factors (Zhang 2004). Only a small number of environmental factors were investigated in this study, the results of the vegetation community boundary research had a certain amount of chance, and the environmental factors had a low interpretation rate for community distribution variation. Additional environmental factors, such as soil physicochemical properties and climate factors, should be further explored and comprehensively analyzed in subsequent research.

5. Conclusions

In this study, the spatial sequence method instead of the time successional sequence method was used to classify and analyze vegetation in the early natural recovery period after forest fire disturbance in the dry valleys of the Anning River Basin. The following conclusions were drawn.
(1)
After forest fire disturbance in the Anning River Basin, the TWINSPAN classification method was used to classify the vegetation community in the early stage of vegetation regeneration and succession into seven community types. The community types were dominated by savanna communities. The Qg community was widely distributed in the region.
(2)
In the DCA ordination diagram, the burned areas were divided into five ecotopes based on the distribution of quadrats. Elevation was significantly correlated with the classification and distribution pattern of community types in this area. With the decrease of elevation, the dominance of the main dominant species of Qg decreased continuously, and the community type changed from a shrub-grass community to a savanna community.
(3)
In the DCCA ordination diagram, the first ordination axis mainly reflected the changes in elevation and slope position. The elevation and slope position gradually decreased along the first ordination axis. The second ordination axis mainly reflected the changes of slope and aspect. The slope direction decreased along the second ordination axis direction, and the aspect transitioned from shady slopes to sunny slopes.

Acknowledgments

This work was supported by the National Natural Science Foundation of China (41930647). We are grateful to the anonymous reviewers and the associate editor for their comments and suggestions, which have helped to improve the manuscript.We thank LetPub (www.letpub.com) for its linguistic assistance during the preparation of this manuscript.

Disclosure statemen

No potential conflict of interest was reported by the author(s).

Abbreviations

TWINSPAN: two-way indicator species analysis; DCA: detrended correspondence analysis; DCCA: detrended canonical correspondence analysis; Qg: Quercus guyavaefolia H. Leveille; Py: Pinus yunnanensis Franch.; Pm: Pinus massoniana Lamb.; Mp: Machilus pingii Cheng ex Yang; Dc: Duhaldea cappa (Buchanan-Hamilton ex D. Don) Pruski & Anderberg; Cg: Cymbopogon goeringii (Steud.) A. Camus Cymbopogon; Pp: Paspalum paspaloides (Michx.) Scribn.; Vf: Vaccinium fragile Franch.; Ic: Imperata cylindrica (Linn.) Beauv.; Rs: Rhododendron simsii Planch.; Ch: Cotoneaster hissaricus Pojark.; Ul: Uraria lagopodoides (L.) Desv. ex DC.; Ll: Leontopodium leontopodioides (Willd.) Beauv.; Aad: Ageratina adenophora (Sprengel) R. M. King & H. Robinson; Tc: Tripogon chinensis (Franch.) Hack.; Lc: Leptochloa chinensis (L.) Nees; Hp: Hypericum patulum Thunb. ex Murray; Er: Elsholtzia rugulosa Hemsl.; Aa: Artemisia argyi Levl. et Van; Hh: Hedyotis herbacea L.; Mt: Monogramma trichoidea J. Sm.; Pv: Polygonatum verticillatum (L.) All.; Cc: Cyperus cyperoides (L.) Kuntze; Pl: Potentilla leuconota var. brachyphyllaria; Cd: Commelina diffusa N. L. Burm.; Dm: Desmodium microphyllum (Thunb.) DC.; Lp: Leptodermis potanini Batalin; Ch: Campylotropis hirtella (Franch.) Schindl.; Sh: Saussurea hieracioides Hook. f.; Ms: Monochasma savatieri Franch. ex Maxim.; Ld: Lespedeza davidii; Sb: Scutellaria baicalensis Georgi; Ppa: Polygonum paleaceum Wall. ex HK. f.; Ra: Rabdosia adenantha (Diels) Hara; Es: Erigeron speciosus (Lindl.) DC.; As: Anaphalis sinica Hance; It: Iris tectorum Maxim.

References

  1. Bai, Y.; Wang, B. ; Y.D. Wu, Liu, B.; 2020. Fire Environment of Forest Fire Formation in Liangshan Prefecture. Forest Resources Management. (5), 116-122+130.
  2. Cai, W.H.; Yang, J.; Liu, Z.H.; Hu, Y.M.; Liu, S.J.; Jing, G.Z.; Zhao, Z.F. ; 2012. Controls of post-fire tree recruitment in Great Xing'an Mountains in Heilongjiang Province. Acta Ecologica Sinica. 32, 3303-3312.
  3. Calvo, L.; Tárrega, R.; Luis, E.; Valbuena, L.; Marcos, E. ; 2005. Recovery after experimental cutting and burning in three shrub communities with different dominant species. Plant Ecology. 180, 175-185.
  4. Chian, Y.S.; Yeh, C.L.; Wang, C.C. ; 2016. Variation in Mountain Vegetation Composition between the East and the West Sides of Southern Taiwan. Forests. 7, 179.
  5. Cho, K.T.; Jang, R.H.; You, Y.H. ; 2015. Analysis for the relationship of environmental factors and vegetation structure at natural streamside valley and riparian forest in South Korea. Journal of Ecology and Environment. 38, 405-413.
  6. Di, L.Y.; Sun, R.Y. ; 2007. Summarization of Research on Forest Fire in China. Journal Of Catastrophology. 22, 118-123.
  7. Dalel, T.; Bruce, M. K. ; 1979. Fire history of a sequoia-mixed conifer forest. Ecology. 60, 129-142.
  8. Gholamhosein, M.; Harald, V. ; 2018. Relationship between vegetation types, soil and topography in southern forests of Iran. Journal of Forestry Research. 29, 1635-1644.
  9. Guo, X.L.; Shangguan, T.L.; Zhang, J. ; 2010. Quantitative classification and ordination of wetland vegetation from the mouth of Fen River to the Yellow River. Journal of Wuhan Botanical Research. 28, 431-436.
  10. Hideo, K.; Shiro, T. ; 2011. Fire severity affects vegetation and seed bank in a wetland. Applied Vegetation Science. 14, 350-357.
  11. Jan, R.; Lubomír, T.; David, Z.; Milan, C. ; 2009. Modified TWINSPAN Classification in Which the Hierarchy Respects Cluster Heterogeneity. Journal of Vegetation Science. 20, 596-602.
  12. Jens, T.S.; Jesse, E.D.M.; Paula, J. F. ; 2019. Fire severity and changing composition of forest understory plant communities. Journal of Vegetation Science. 30, 1099-1109.
  13. Jennifer, S.L.; Heather, A.V.; Neil, C.; Catherine, C. ; 2006. The influence of multi-scale environmental variables on the distribution of terricolous lichens in a fog desert. Journal of Vegetation Science. 17, 831-838.
  14. Jiang, Y.B.; Liu, X.H.; Song, S.S.; Yu, Z.; Shao, X.M. ; 2015. Diversity and distribution of ground bryophytes in broadleaved forests in Mabian Dafengding National Nature Reserve, Sichuan, China. Acta Ecologica Sinica. 35, 13-19.
  15. Jiang, R.F.; Yang, B.; Song, L.; Pan, T.Y.; Deng, X.H. ; 2022. Forest Fire Monitoring and Vegetation Evaluation Based on Sentinel-2 Satellite in Muli County, Liangshan Prefecture. GEOSPATIAL INFORMATION. 20, 38-44.
  16. Jin, S.; Wu, S.K. ; 2021. The plant community structure of burned Pinus tabuliformis forest in Taiyue mountain in the early ecological restoration stage. Acta Ecologica Sinica. 41, 4182-4193.
  17. Li, Y.Y. ; 2002. The multivariate analysis methods applying in the domain of ecology. Journal of Guizhou University (Agricultural and Biological Science). 21, 215-218+223.
  18. Liu, L.G.; Zhu, Z.Q.; Chen, X.; Liu, S.J. ; 2022. Ecological Niche and Interspecific Association of Dominant Species in the Initial Stage of Vegetation restoration in Zhongba Village of Xide County. Journal of West China Forestry Science. 51, 110-117.
  19. Lourens, P.; Masha, T.V.D.S.; Eric, J.M.M.A.; Nataly, A. ; 2017. Biodiversity and climate determine the functioning of Neotropical forests. Global Ecology and Biogeography. 26, 1423-1434.
  20. Lasaponara, R.; Lanorte, A.; Telesca, L. ; 2009. On the evaluation of vegetation resilience after two successive fires in southern Italy by using SPOT-VGT NDVI time series. IOS Press. 10, 511-516.
  21. Michal, S.; Richard, H.; Karol, U.; Mariana, U.; František, M.; Anna, P. ; 2016. Syntaxonomy and ecology of acidophilous beech forest vegetation in Slovakia. Phytocoenologia. 46, 69-87.
  22. Michel, L.; Claire, d.M. ; 2013. Biodiversity and ecosystem stability: a synthesis of underlying mechanisms. Ecology Letters. 16, 106-115.
  23. Qiu, Y.; Zhang, J.T. ; 2000. The ordination axes clustering based on detrended canonical correspondence analysis ordination and its application to the analysis of the ecological gradients of plant communities. Acta Ecologica Sinica 20, 199-206.
  24. Rahman, I.U.; Khan, N.; Ali, K. ; 2017. Classification and ordination of understory vegetation using multivariate techniques in the Pinus wallichiana forests of Swat Valley, northern Pakistan. Die Naturwissenschaften. 104(3-4), 24.
  25. Schoennagel, T.; Waller, D.M.; Turner, M.G.; Romme, W.H. ; 2004. The effect of fire interval on post-fire understorey communities in Yellowstone National Park. Journal of Vegetation Science. 15, 797-806.
  26. Sun, J.B.; Hu, H.Q. ; 2010. Community successional of burned forestland of larix gmelinii in greatxing′ an Mountains. JOURNAL OF NORTHEAST FORESTRY UNIVERSITY. 38, 30-33.
  27. Ted, L.H. ; 1971. Succession after fire in the Chaparral of southern California. Ecological Monographs. 41, 389-389.
  28. Virginia, F.T.; Diane, L.M.; Justin, K.R.; Clifford, N.D. ; 2018. The effects of a catastrophic forest fire on the biomass of submerged stream macrophytes. Aquatic Botany. 152, 36-42.
  29. Wang, X.G.; Li, X.Z.; He, H.S.; Leng, W.F.; Wen, Q.C. ; 2004. Postfire succession of larch forest in the northern slope of Daxinganling. Chinese Journal of Ecology. 23, 35-41.
  30. Wang, Y.J.; Tao, J.P.; Zhang, W.Y.; Zang, R.G.; Ding, Y.; Li, Y.; Wang, W. ; 2006. Vegetation restoration patterns and their relationships with disturbance on the Giant Panda Corridor of Tudiling, Southwest China. Acta Ecologica Sinica. 26, 3525-3532.
  31. Xu, X.N. ; 2004. Eco-environmental Geological Issues and Effects in Anning River‚Upper Yangtze. JOURNAL OF MOUNTAIN SCIENCE. 22, 572-577.
  32. Xofis, P.; Buckley, P.G.; Takos, I.; Mitchley, J. ; 2021. Long Term Post-Fire Vegetation Dynamics in North-East Mediterranean Ecosystems. The Case of Mount Athos Greece. Fire. 4, 92-92.
  33. Yu, X.H.; Li, X.W.; ‚Bai, J.L. ; 2005. Research progress and development trend on numerical analysis of vegetation in China. Chinese Journal of Ecology. 24, 448-451.
  34. Zhang, F.; Zhang, J.T. ; 2000. Research Progress of Numerical Classification and Ordination of Vegetation in China. Journal of Shanxi University (Nat. Sci. Ed.). 23, 278-282.
  35. Zhang, J.T. ; 1994. Ordination Axis Paritioning and Its Application. Chinese Journal of Ecology. 13, 73-75.
  36. Zhang, J.T. ; 2004. Quantitative ecology. Beijing, Chnia: Science Press.
  37. Zhao, P.; Qu, J.J.; Xu, X.Y.; Yu, Q.S.; Jiang, S.X.; Zhao, H.R. ; 2019. Desert vegetation distribution and species-environment relationships in an oasis-desert ecotone of northwestern China. Journal of Arid Land. 11, 461-476.
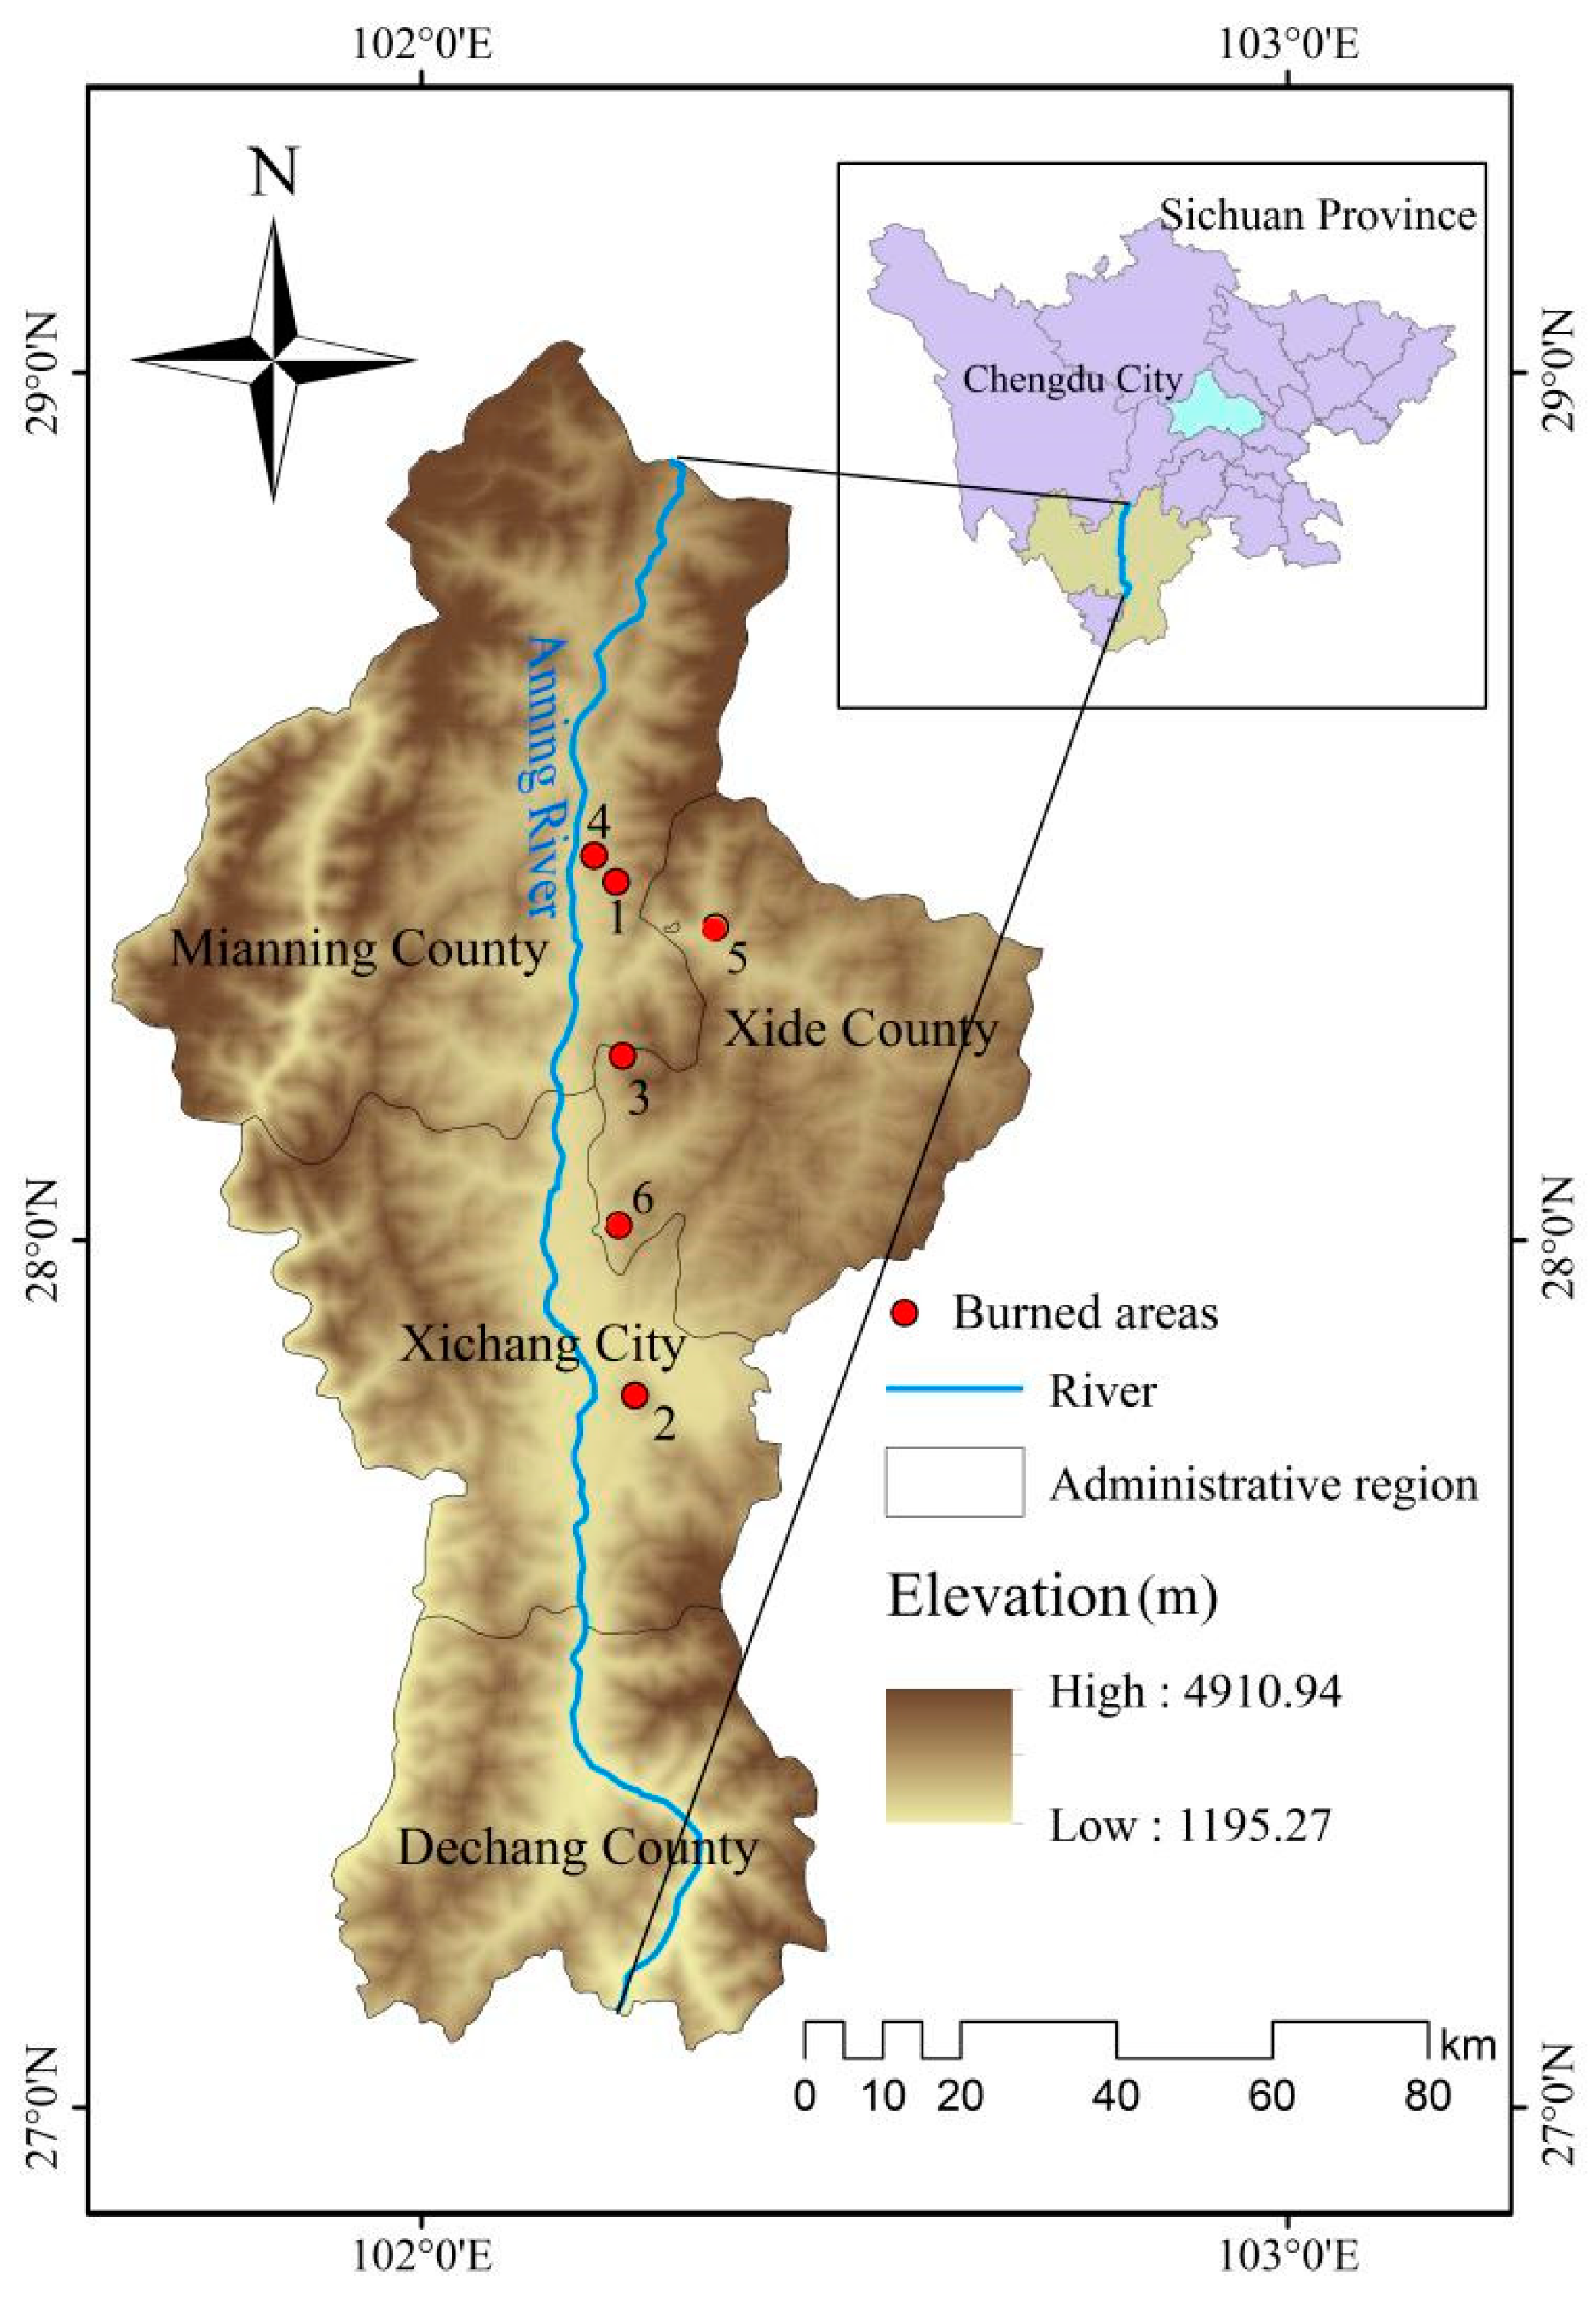
Figure 1. Study sites along the Anning River.
Preprints 85096 g001
Figure 2. Two-way indicator species analysis (TWINSPAN) quantitative classification of vegetation samples after fire in the Anning River Basin (D: classification level; N: the total number of quadrats; the numbers in the rectangular boxes are the serial numbers of the samples).
Preprints 85096 g002
Figure 3. Detrended correspondence analysis (DCA) ordination of vegetation quadrats and the environment in burned areas along the Anning River (1–60: the serial number of vegetation quadrats; I–VII: vegetation community(table2); A–E: ecotope).
Preprints 85096 g003
Figure 4. Detrended canonical correspondence analysis (DCCA) ordination of vegetation quadrats and environmental factors in burned areas along the Anning River (1–60: the serial number of vegetation quadrats; I–VII: vegetation community(table2)).
Preprints 85096 g004
Table 1. Information on the selected areas.
Plot name Fire time / year Fire area / hm2 Elevation / m Slope / °
1 Maan Village, Mianning County 2021 100 1991–2110 12–20
2 Lushan, Xichang City 2020 1000 1825–1984 10–30
3 Zhongba Village, Xide County 2020 200 2063–2390 20–60
4 Shanzha Village, Mianning County 2019 100 2064–2127 25–50
5 Gantuo Village, Xide County 2019 80 2070–2212 20–42
6 Lizi Village, Mianning County 2020 30 1985–2105 10–25
Table 2. Different community types and environmental characteristics of burned areas in the Anning River Basin.
Serial number Community name Eigenvalue Elevation/ m Slope/ ° Aspect Vegetation coverage/ %
I Vf-Ic 0.524 1825–2115 10–25 2–5 40–85
II Dc-Lc 0.652 2110–2140 30–50 1–3 20–60
III Mp-Mt 0.522 2090–2245 25–45 3–5 20–85
IV Qg-Pl 0.322 2120–2380 25–35 2–4 35–40
V Qg-Pp 0.552 2240–2385 30–45 1–4 40–65
VI Qg-Ms 0.454 2360–2390 10–20 2–4 55–80
VII Qg-Ll 0.492 2380 5 4 90
Note:Aspect 2(slope position)-5(slope direction).
Table 3. Characteristic values and correlation coefficients between species–environmental factors of the DCA ordination and DCCA ordination axes.
Correlation coefficient Eigenvalue Correlation coefficient between species and environmental factors
DCCA DCA DCCA DCA
First axis 0.244 0.618 0.712 0.505
Second axis 0.146 0.406 0.776 0.325
Third axis 0.038 0.304 0.581 0.402
Fourth axis 0.016 0.186 0.514 0.275
Note:DCCA is Detrended canonical correspondence analysis, DCA is Detrended correspondence analysis.
Disclaimer/Publisher’s Note: The statements, opinions and data contained in all publications are solely those of the individual author(s) and contributor(s) and not of MDPI and/or the editor(s). MDPI and/or the editor(s) disclaim responsibility for any injury to people or property resulting from any ideas, methods, instructions or products referred to in the content.
Copyright: This open access article is published under a Creative Commons CC BY 4.0 license, which permit the free download, distribution, and reuse, provided that the author and preprint are cited in any reuse.
Prerpints.org logo

Preprints.org is a free preprint server supported by MDPI in Basel, Switzerland.

Subscribe

© 2024 MDPI (Basel, Switzerland) unless otherwise stated