Preprint
Article

Flux Growth and Characterization of Bulk InVO4 Crystals

Altmetrics

Downloads

98

Views

43

Comments

0

A peer-reviewed article of this preprint also exists.

Submitted:

13 September 2023

Posted:

14 September 2023

You are already at the latest version

Alerts
Abstract
The flux growth of InVO4 bulk single crystals has been explored for the first time. The reported eutectic composition at a ratio of V2O5:InVO4 = 1:1 could not be used as a self-flux, since no sign of melting was observed up to 1100 °C. Crystals of InVO4 of typical size 0.5×1×7 mm3 were obtained using copper pyrovanadate (Cu2V2O7) as a flux, using Pt crucibles. XRD confirmed the orthorhombic Cmcm structure. Rests of flux material were observed on the sample surface, with occasional traces of Pt indicating some level of reaction with the crucible. X-ray absorption spectroscopy showed that oxidation states of indium and vanadium ions are +3 and +5, respectively. The size and high quality of the obtained InVO4 crystals makes them excellent candidates for the further study of their physical properties.
Keywords: 
Subject: Chemistry and Materials Science  -   Materials Science and Technology

1. Introduction

Among orthovanadates with formula M3+VO4 (M3+ = In, Fe, Cr, Ti), the InVO4 compound possesses promising electrochemical and photocatalytic properties for a wide range of commercial applications, e.g.,: as material for photovoltaic cells for solar energy utilization due to the vanadium 3d band, lying below the analogous d band of other transition metals in the energy spectrum, thus decreasing the band gap; as a photocatalyst, inducing decomposition of water molecules under visible light irradiation; or as an electrode material for lithium-ion batteries.
Several different crystal structures have been reported for InVO4, depending on the synthesis method, heat treatment conditions and external pressure. At ambient pressure, following phases can be obtained: a monoclinic phase InVO4-I with a α-MnMoO4-type structure (space group C12/m1) [1], an orthorhombic phase InVO4-III with a CrVO4-type structure (space group Cmcm) [2] and the phase InVO4-II with undetermined structure [3]. At high pressure, two other phases of InVO4 have been reported recently: InVO4-V with a characteristic wolframite-type structure (space group P12/c) and InVO4-IV with an unknown structure, coexisting with phases InVO4-III and InVO4-V in the narrow range of pressure between 6.2 GPa and 7.2 GPa [4]. The phase transformation InVO4-III → InVO4-V from the orthorhombic CrVO4-type to the monoclinic wolframite-type structure occurs at a pressure of around 8 GPa and is accompanied by a large volume decrease of 16.6 % and a change in coordination number for vanadium atoms from 4 for InVO4-III to 6 for InVO4-V [5,6]. These structural transformations trigger a color change of the material and a sudden decrease of the electrical resistivity, related to a bandgap collapse of nearly 1.5 eV [6,7]. Besides, according to [8], compounds like InVO4 with six-coordinated vanadium ion may show maximum efficiency for the splitting of water molecules under the visible light. A high-pressure study of the indium vanadate material can provide insights into some physical properties, e.g., dielectric function, refractive index, and absorption spectra, and their practical applications, but so far, such studies have only been done on polycrystalline samples [4,7]. It is commonly recognized that single crystals provide the best performances compared to polycrystalline samples and one can expect improved characteristics in single crystals of InVO4 compared to previously published for polycrystalline samples. The search for the publication, dealing with the single crystal growth of InVO4 compound, appeared very surprising for authors. The only one paper, where single crystals with dimensions 0.1×0.1×0.3 mm3 were obtained, was found [2]. Thus, the obtaining of InVO4 bulk single crystal is rather complicated due to the incongruent melting of the indium vanadate [3]. On the other hand, the availability of InVO4 single crystals should help avoid extrinsic effects due to grain boundaries and reach better hydrostatic conditions for the high-pressure study. Authors were encouraged to find a suitable growth technique for obtaining of bulk single crystals of indium vanadate. In presented work, authors report the successful growth of single crystals of orthorhombic InVO4 with size 0.5×1×7 mm3 and the characterization of their ambient pressure properties, preparative to a further high-pressure study.

2. Materials and Methods

2.1. Determination of flux composition

The InVO4 compound melts incongruently at 1134 °C according to the phase diagram of the system In2O3–V2O5 [3]. Thus, single crystals of this material cannot be obtained by direct crystallization from a melt of the stoichiometric composition, where the molar ratio of precursor oxides (In2O3 and V2O5) is 1:1. In [2] tiny single crystals of InVO4 (0.1×0.1×0.3 mm3) were obtained from mixture of initial oxides In2O3 and V2O5 by slow cooling of the mixture from temperature 1300 °C to the room temperature. An additional challenge is the sublimation of In2O3 in air above 1100 °C [9,10]. Flux growth is a promising approach, but requires finding a suitable flux material, i.e., a material with a melting point lower than that of InVO4 (1134 °C), that does not lead to incorporation of flux ions into the InVO4 structure, does not react with or dissolve the crucible material: a melting point of flux well below 1000 °C should help avoid the loss of In2O3 during growth.
In order to avoid chemical contamination with other ions, the use of a self-flux containing In2O3 and V2O5 was first explored. Since a low-temperature eutectic with a melting point of 678 °C was reported at a ratio of V2O5:InVO4 = 1:1 in the In2O3–V2O5 binary system [3], this composition appeared as a natural flux candidate. However, preliminary experiments for V2O5:InVO4 in a 1:1 molar ratio, realized in the optical high-temperature microscope [11], failed to show any melting even up to temperatures around 1100 °C. Therefore, the phase diagram for the In2O3–V2O5 binary system in [3] requires revision and additional investigations.
Copper pyrovanadate Cu2V2O7 with vanadium ions in a +5 oxidation state was next tested as flux material. This compound melts congruently at around 785 °C, well below 1000 °C, and around 350 °C lower than the melting point of InVO4. Although the close values for the ionic radii of In3+ and Cu2+ for octahedral oxygen coordination (0.76 Å and 0.71 Å, respectively) suggest the possibility of Cu substitution for In in InVO4, the different oxidation state of the ions can help prevent it. Besides, according to the ternary phase diagram CuO-In2O3-V2O5 [12] in the subsolidus region for the compositions with the content of CuO lower than 50 mol.% only 4 compounds were detected: copper vanadates (Cu2V2O7 and CuV2O6), indium vanadate (InVO4) and vanadium oxide (V2O5).

2.2. Single crystal growth

In2O3 (Sigma Aldrich Corp., USA), V2O5 and CuO (Alfa Aesar by Thermo Fisher Scientific GmbH, Germany) with purity not less than 4N were used as starting materials. A mixture was made according to the weight ratio of components InVO4:Cu2V2O7 (flux)=1:4. Mixing of oxides was carried out in an agate mortar with ethanol. After mixing, the mixture was dried and placed in a crucible. The flux growth was realized according to the following procedure. The mixture was heated up to 950 °C with a rate of 150 °C/h with further dwelling at this temperature for 12 hours. After homogenization at 950 °C, the melt was slowly cooled down to 800 °C at a rate of 2.5 °C/h and dwelled at this temperature for 12 hours to promote crystallization. After the second dwelling, the molten flux was decanted. The temperature for the homogenization of melt was chosen such that it was above the melting point of the flux (785 °C) and below the point (1100 °C) at which significant intensification of the sublimation of In2O3 was detected [9,10].
The first experiment was carried out in an Al2O3-crucible. After finishing the experiment, authors noticed that melt not only reacted with the crucible (Figure 1a), but also attacked the plates placed below it (Figure 1b) in the furnace.
Thus, the Al2O3-crucible is not suitable for the flux growth of InVO4 single crystals with Cu2V2O7 as a flux. Crucibles made from stabilized zirconia oxide cannot be used for the flux growth as well due to high probability of their destroying after rapid cooling. Thus, a Pt-crucible was chosen for carrying out the flux growth of InVO4 crystals.
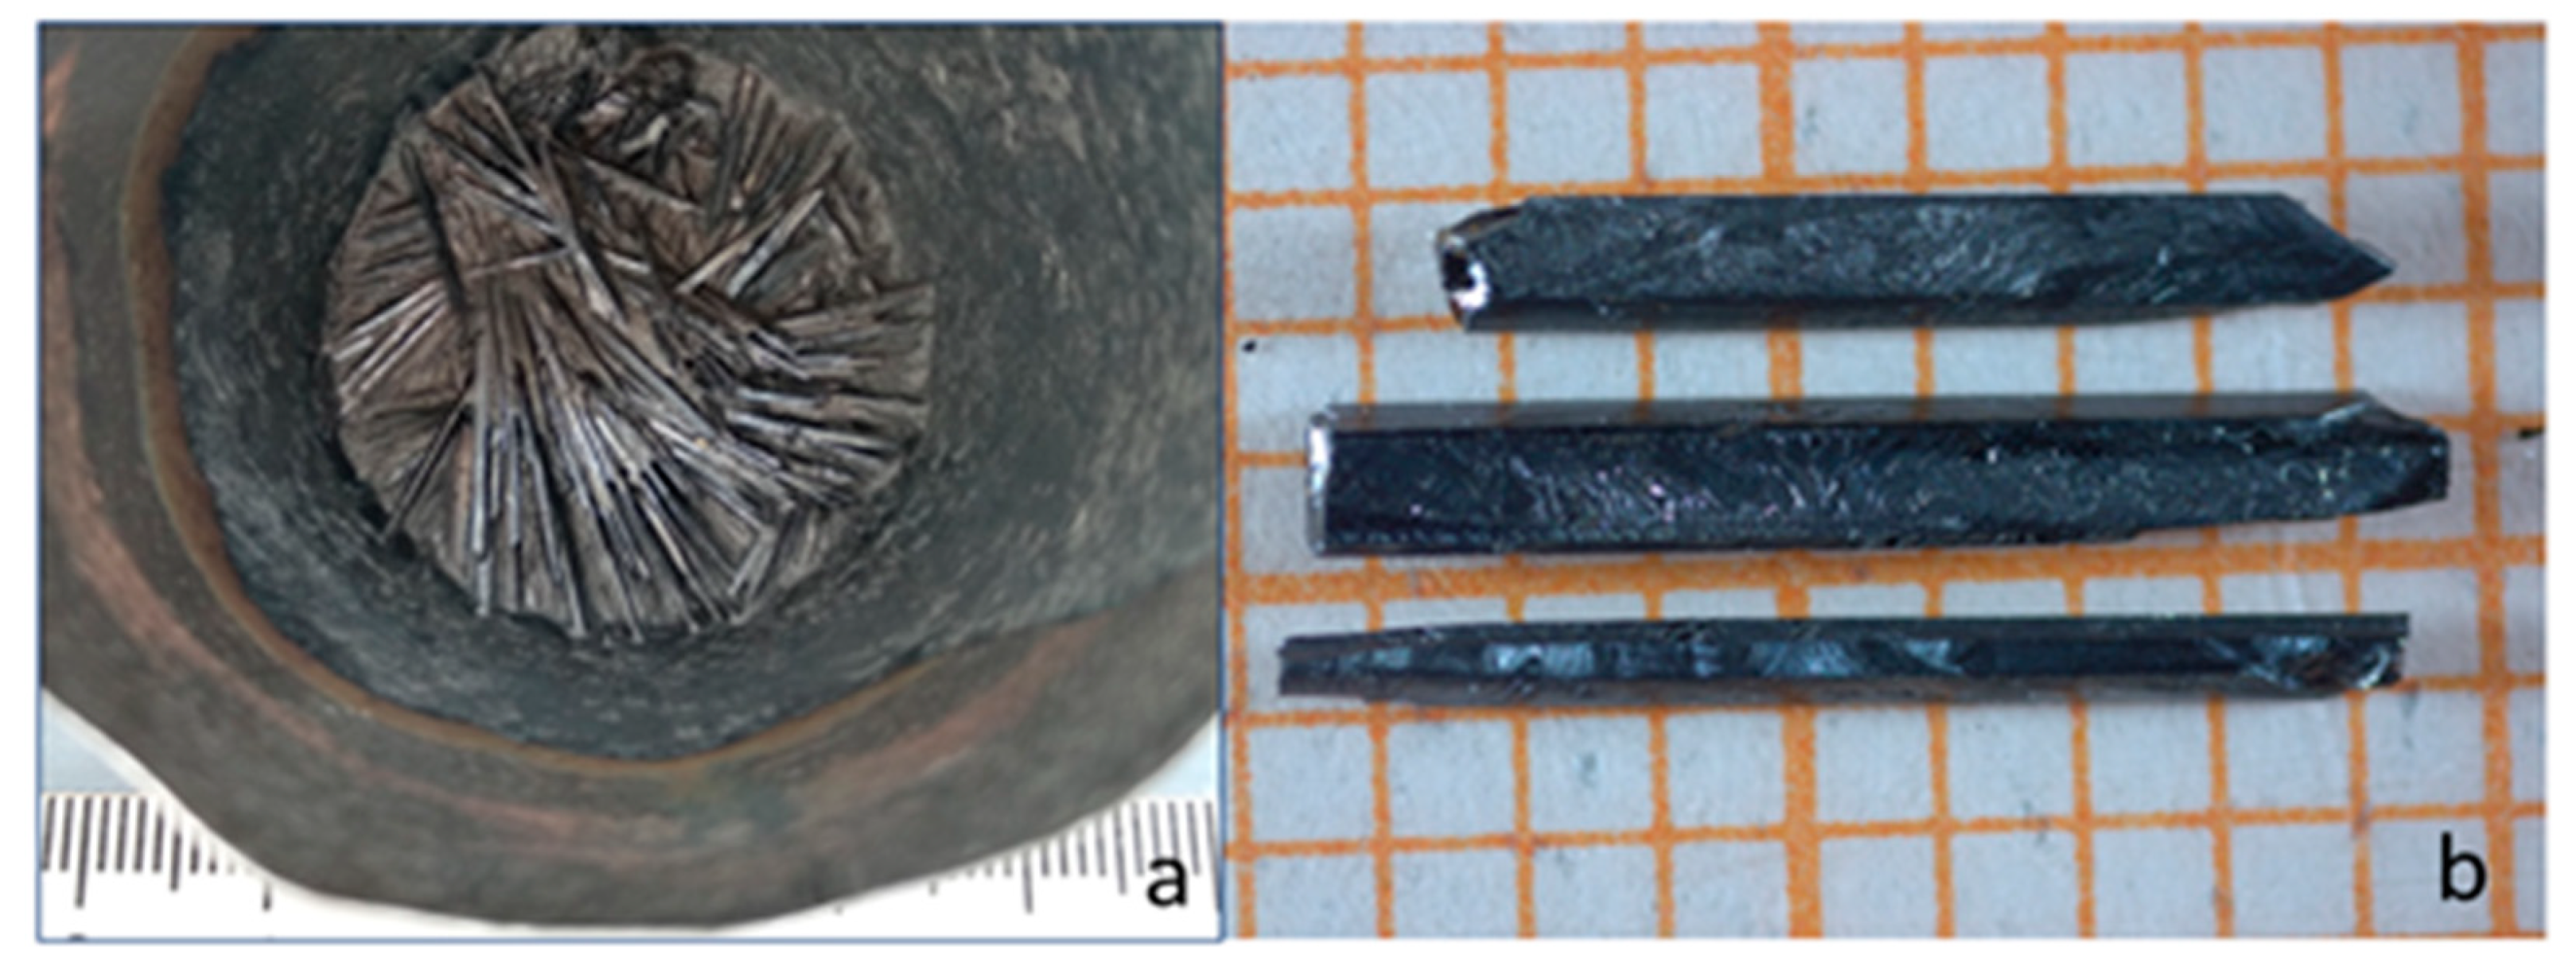
As a result, faceted and needle-like crystals have been obtained on the bottom of the crucible after decanting the flux, see Figure 2.
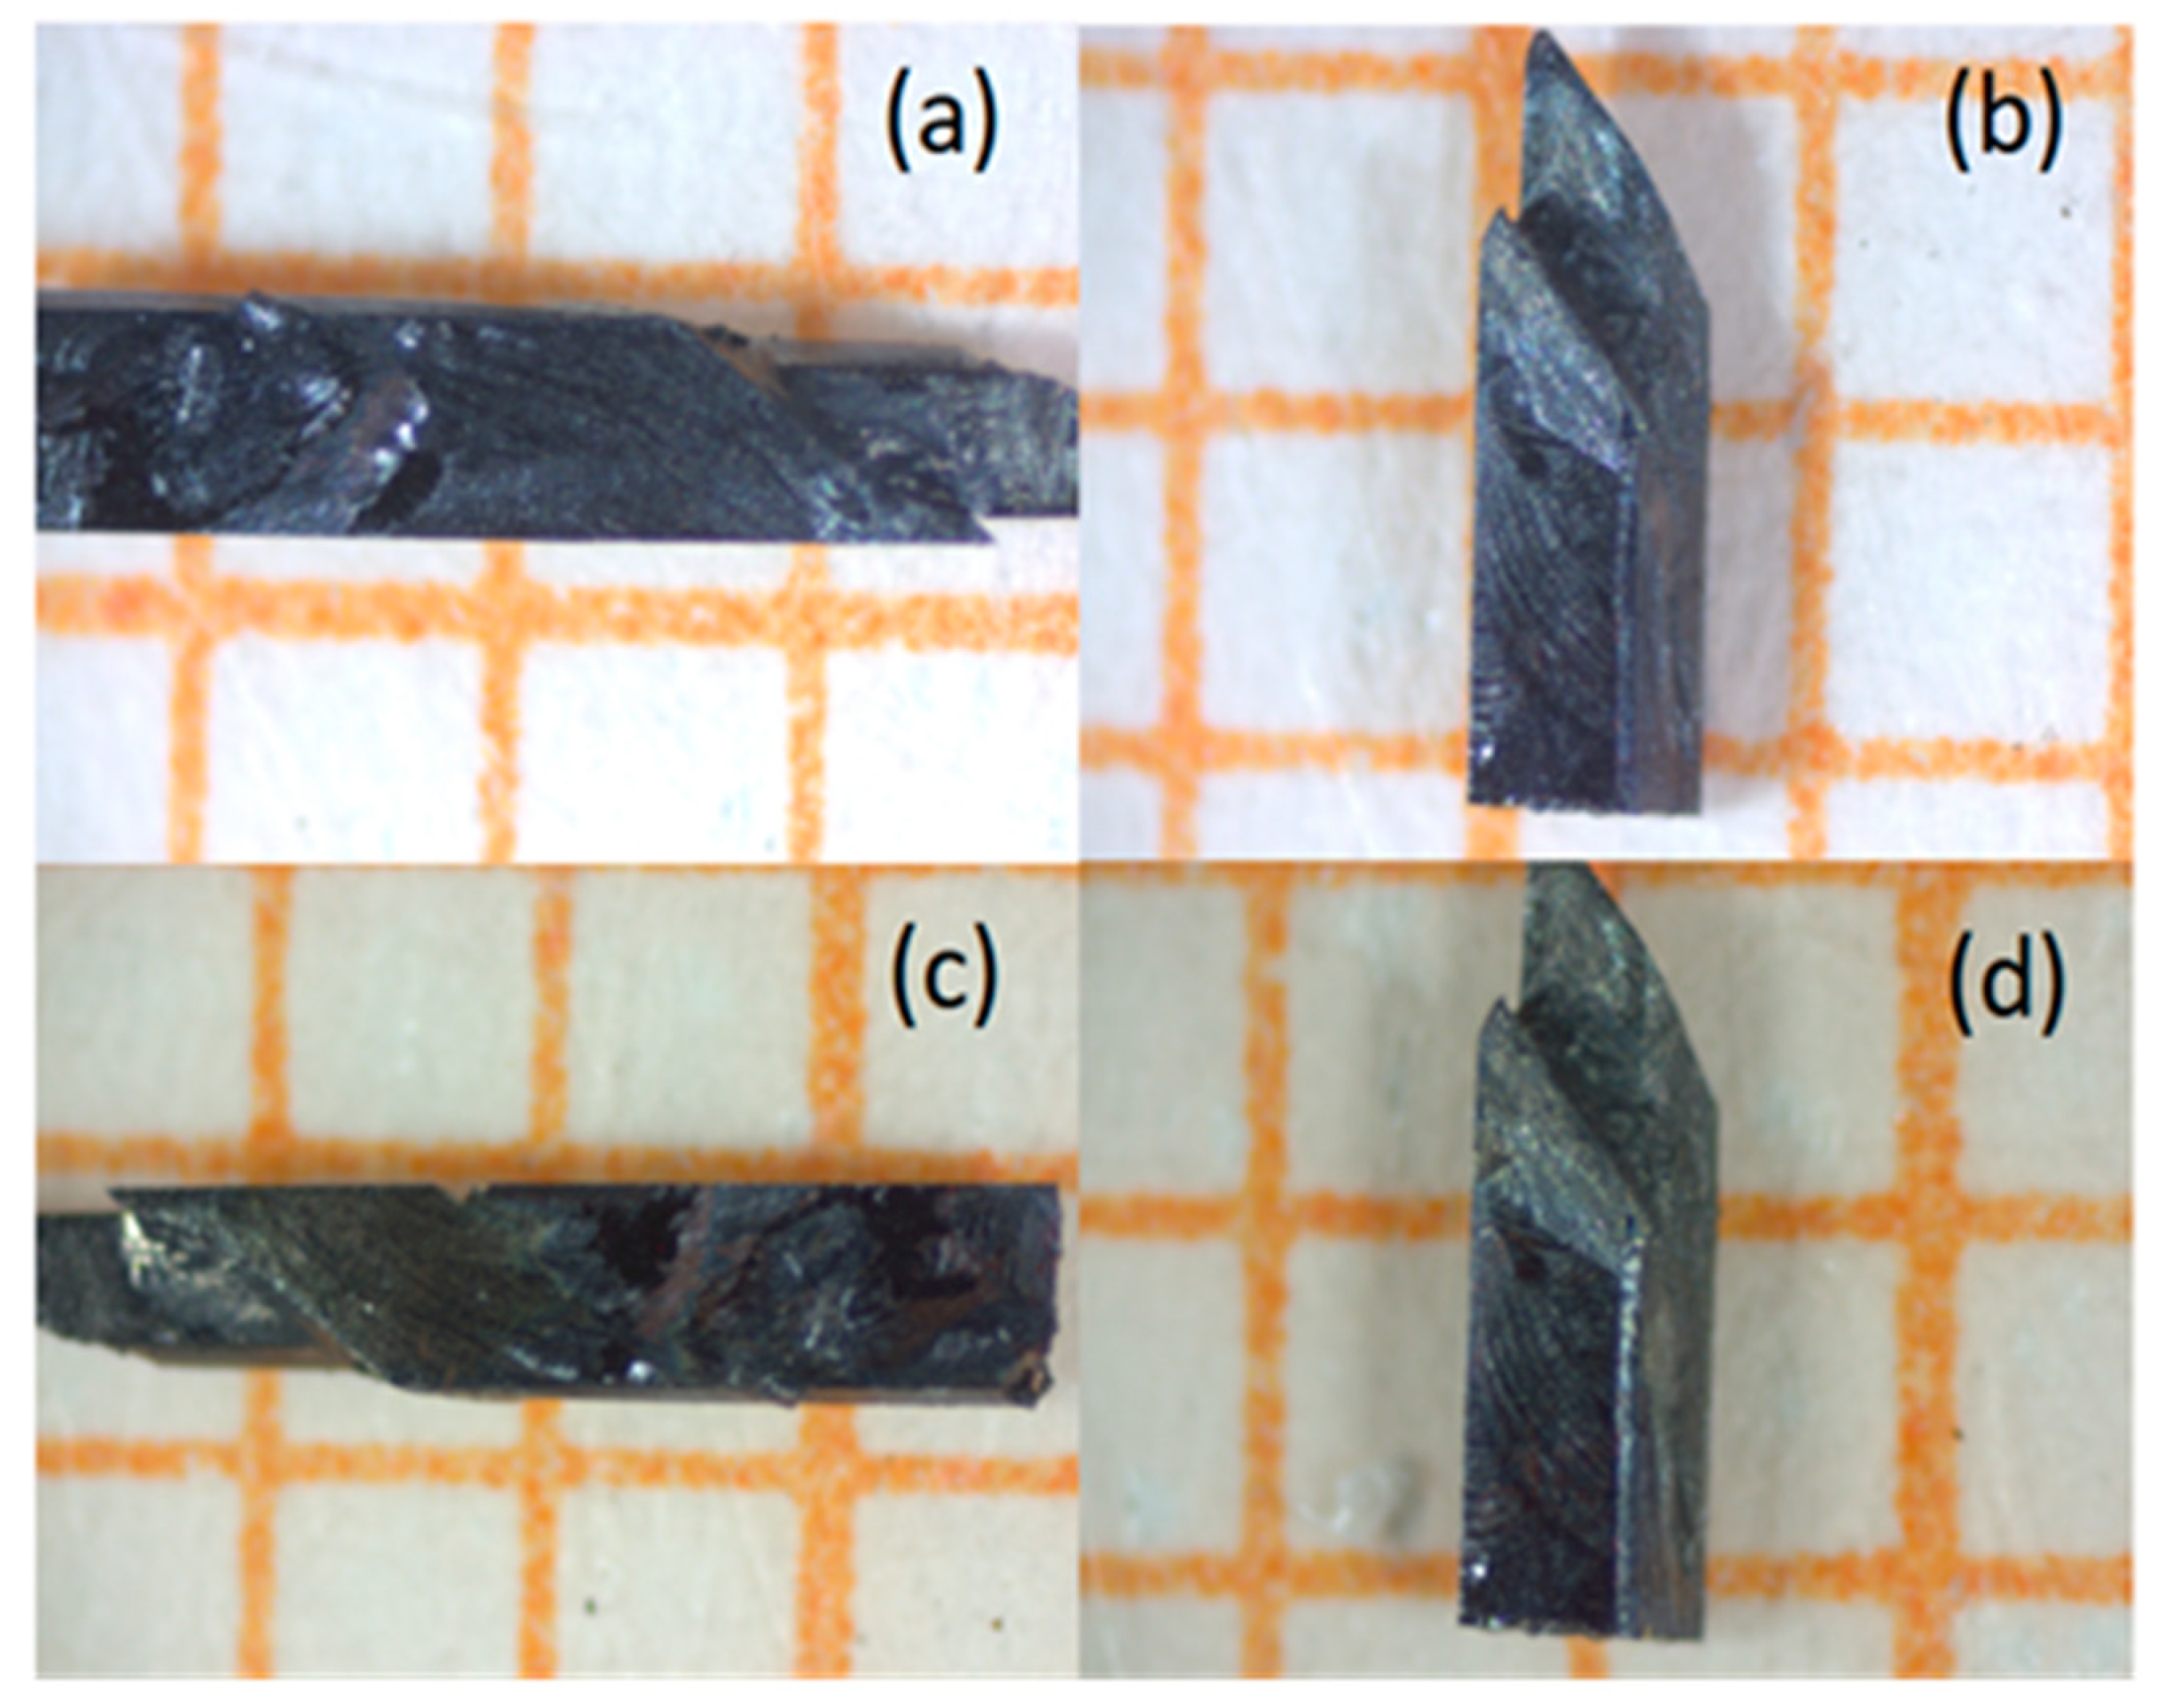
For the rare earth orthovanadates, grown by Cz-technique in the inert (Ar) atmosphere, the color of the crystals from yellowish to light brown was linked with forming of coloration centers due to a change of the vanadium oxidation state from +5 to +4 and +3 [13,14]. Heat treatment of crystal samples in the air or in the oxygen atmosphere at the 1300 °C for 24 hours led to elimination of these coloration centers. Thus, similarly to the rare earth orthovanadates, the heat-treatment of obtained InVO4 crystals was realized in oxygen atmosphere at 300 °C for 240 hours to eliminate possible color centers in crystals. As it can be seen from the Figure 3, the annealing didn’t lead to a change of the color. Thus, authors assume that black color is the characteristic color of InVO4 single crystal.

2.3. Sample characterization

X-ray diffraction (XRD) studies on crushed crystals were carried out using an automated powder HUBER diffractometer with Cu Kα1 radiation (Bragg–Brentano geometry, 2θ range from 4° to 100°, step-scanning mode, Δ2θ=0.005 °, counting time of 10 s). The Rietveld analysis [15] of the XRD data was performed with a FullProf program package [16]. For the cell parameter refinement, the atomic positions and cell parameters from [3,17] were used.
Microphotographs of crystals were obtained on a Zeiss Axiocam 105 color microscope camera. Energy-dispersive X-ray analysis (EDX) was performed using an analytical scanning electron microscope Zeiss EVOMA15. The operating voltage was 30 kV. The Cu and V contents were determined using K- and L-lines, for the In-content L-lines were used. Element analysis of single crystal samples of InVO4 was realized on iCAP6500 DUO (Thermo Fisher Scientific GmbH) by method of inductively coupled plasma with optical emission spectrometry (ICP-OES). Before the measurements, samples were dissolved in the mixture of the hydrochloric and hydrofluoric acids with volume ratio HCl:HF=8:1.
X-ray absorption near-edge spectroscopy was applied to determine the oxidation states of indium and vanadium in the InVO4 single crystals, and to characterize the coordination environment of indium. The experiment was performed using the facilities of P64 beamline of DESY, Hamburg [18]. The monochromator was Si 311 for the In K-edge, and Si 111 for the V K-edge. The In K-edge region was scanned in both transmission and fluorescence yield modes, whereas the vanadium K-edge region was recorded in fluorescence mode only. Corresponding metallic foils were used for the monochromator energy calibration, and various vanadium oxides served as standards for the corresponding oxidation states. All data processing was conducted in the Demeter software package [19].
Diffuse reflectance spectrum has been measured in the range 200–2000 nm with Shimadzu MPC-3100 UV-vis-NIR spectrophotometer using an integrating sphere of 60-mm diameter. A BaSO4 compound was used as a reference. The InVO4 sample was pestled and mixed with BaSO4 powder.

3. Results and Discussion

3.1. Characterization with XRD and EDX

The analysis of powder XRD data (Figure 4) shows that the crystals are composed of orthorhombic InVO4. Although the presence of a small amount of flux material was observed, no other phases were detected. In particular, no signature of the monoclinic phase of InVO4 was detected, confirming previously published reports, in which the monoclinic phase was found to progressively converted into the orthorhombic by annealing above 600 °C [3,20], and only the orthorhombic phase without traces of additional phases was obtained at temperatures about 800-1000 °C [2].
Thus, authors obtained crystals of orthorhombic InVO4 at lower temperatures than was stated in [2]. Such significant decrease of temperature (350 °C lower than reported in [2]) might lead to obtaining of crystals without admixture phases. For instance, in [3] it was stated that for crystal obtained at temperatures higher than 1200 °C, alongside with the main phase of InVO4, admixture phases of V2O5 and In2O3 have been detected on the X-ray diffraction curves. The cell parameters for InVO4 determined from our data are presented in Table 1.
Scanning electron microscopy images of the crystals in the BSE mode revealed the presence of some areas of different chemical composition, see Figure 5. EDX analysis showed that the darker areas in the images correspond to a small amount of the flux phase (Cu2V2O7) on the surface of the crystals, consistent with results from powder XRD. The composition of the main phase was consistent with InVO4. Occasionally, tiny bright spots were observed, where the presence of Pt was detected (less than 0.1 wt.%) (Figure 5c).
According to the ICP-OES results content of Pt in the single crystals is lower than 0.01 wt.% and Cu content is 5.13 wt.%. Such high Cu content can be explained by the high relative surface of the needle-like crystals, used for the analysis. Worth to note that Cu atom content determined highly inhomogeneous in the crystal, proving its presence on the surface of the InVO4 crystals only.

3.2. Characterization with XANES

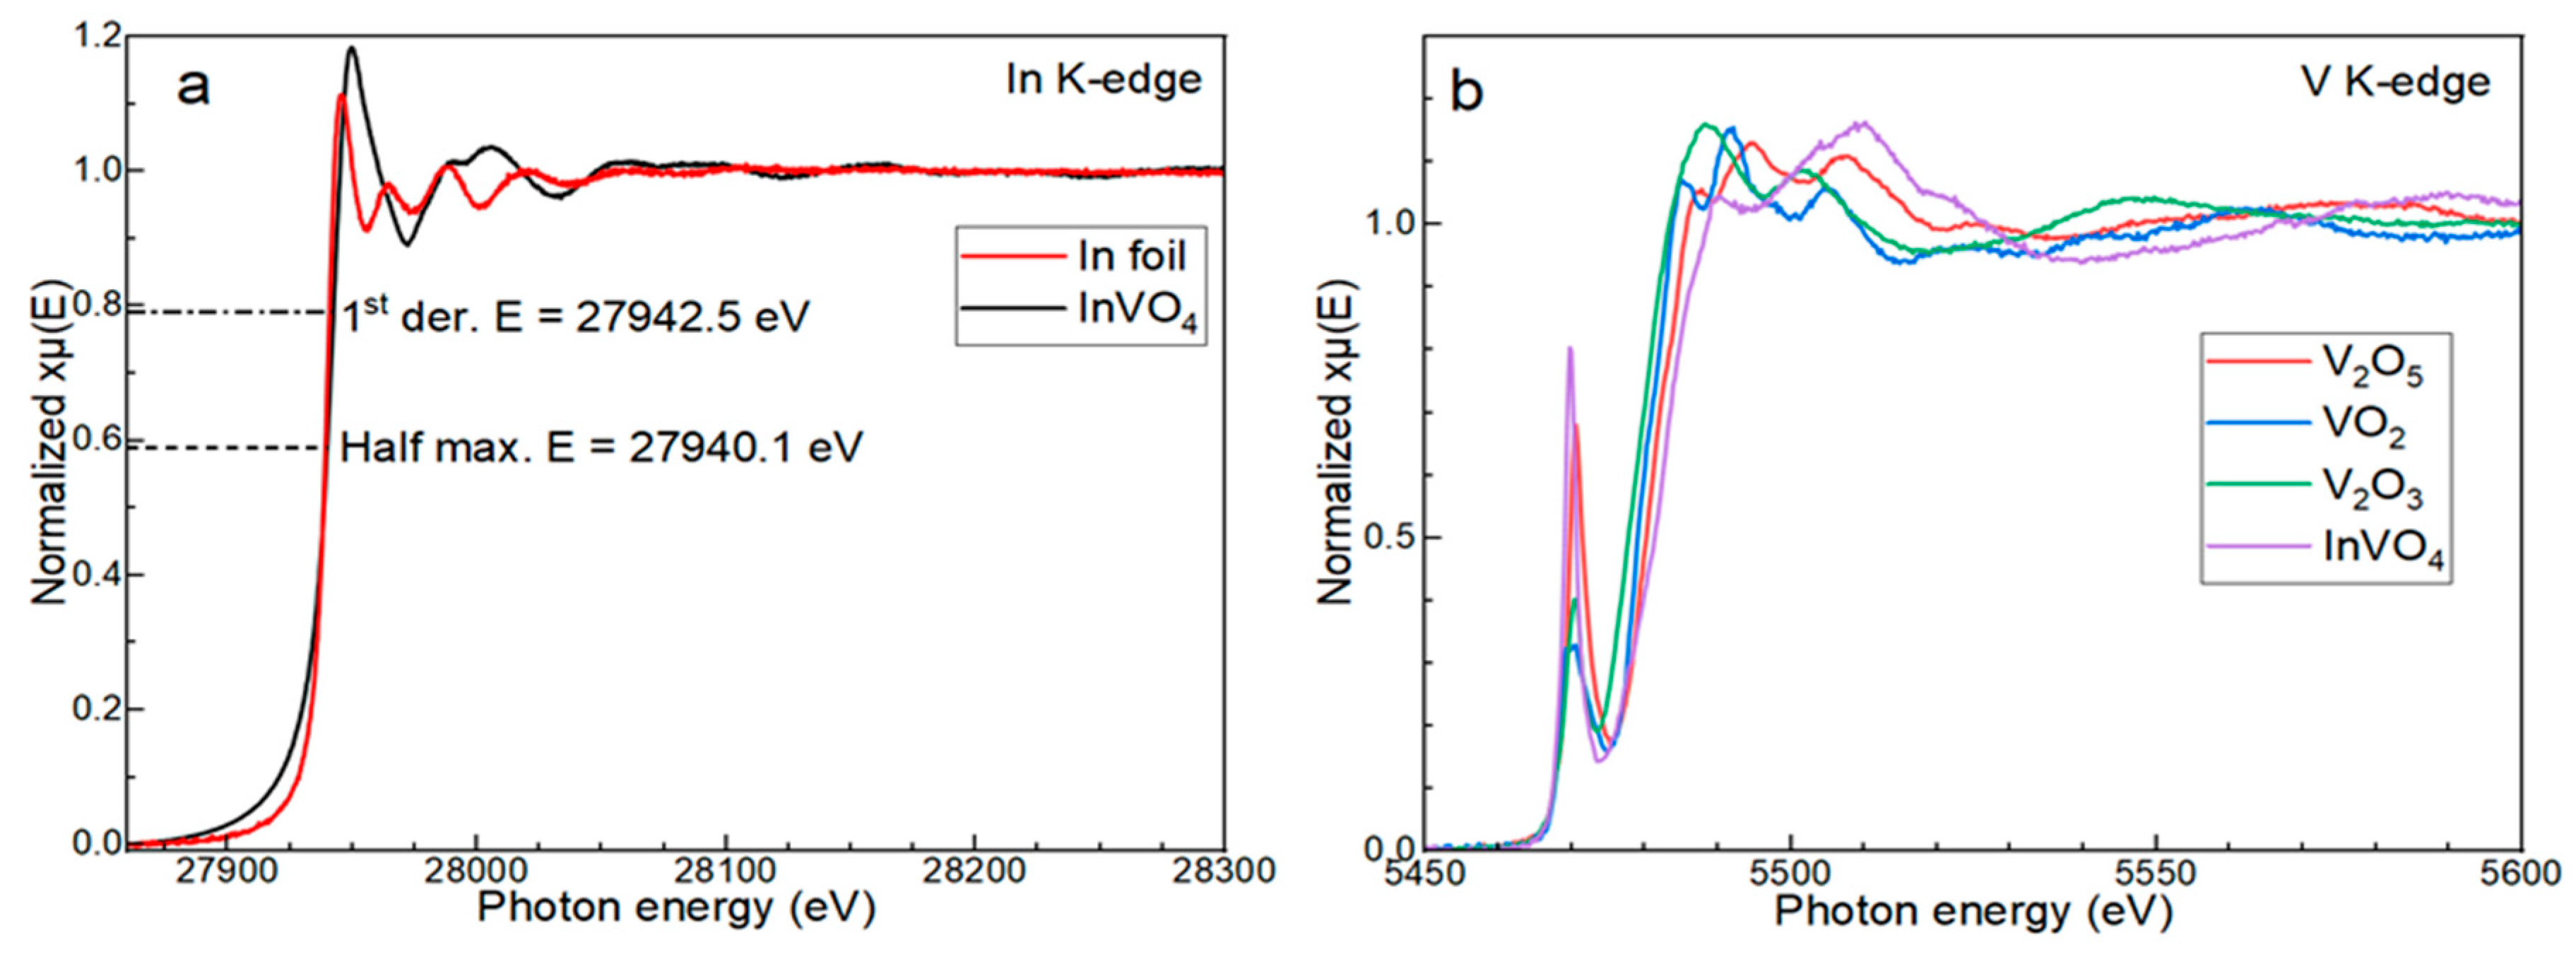
The X-ray absorption spectra of the InVO4 single crystal at the In and V K-edge regions are shown in Figure 6.
The In K-edge energy position was defined by applying the first derivative method [21]. No pre-edge features are observed, as In3+ has a completely occupied 4d-shell, and the main edge corresponds to the 1s→5p electronic transition. The edge energy E0 of 27939.9 eV for the In-foil was used for calibration [22]. The In K-edge energy position for InVO4 at 27942.5 eV is 2.6 eV higher than for metallic indium, since the effective core charge increases in In3+ compared to In0 with simultaneous rise of the binding energy of the core electrons (see Figure 7).
Note that various possibilities of estimating the element K-edge position are known in the literature, for example the value at the half of the normalized xµ(E) step. For InVO4, it corresponds to about 27940.1 eV as demonstrated in Figure 6a, which agrees with the energy position reported in [23] for In2O3. This confirms a +3 oxidation state in our InVO4 single crystals.
In the case of vanadium, the pre-edge feature, which corresponds to the 1s→3d electron transition, is observed. Its shape is known to be sharp and its intensity is comparable with the intensity of the main edge 1s→4p transition for V5+ containing compounds [24]. Thus, the observed pre-edge feature for InVO4 can be considered as a confirmation for the V5+ presence in InVO4 single crystals, similarly to that observed previously in BiVO4 [25]. It is considered that the position of the main edge depends linearly on the oxidation state of the ion, assuming a similar coordination number. Vanadium oxides perfectly follow this trend, however, the vanadium K-edge lays at a higher energy for InVO4 compared to that for V2O5. The possible explanation for such an effect is the different coordination for vanadium ions: octahedral in V2O5, while in InVO4 the coordination is tetrahedral. Therefore, summarizing obtained XANES results authors can unequivocally conclude that vanadium is present in the oxidation state as V (+5) in InVO4 single crystals.

3.3. EXAFS (extended X-ray absorption fine structure)

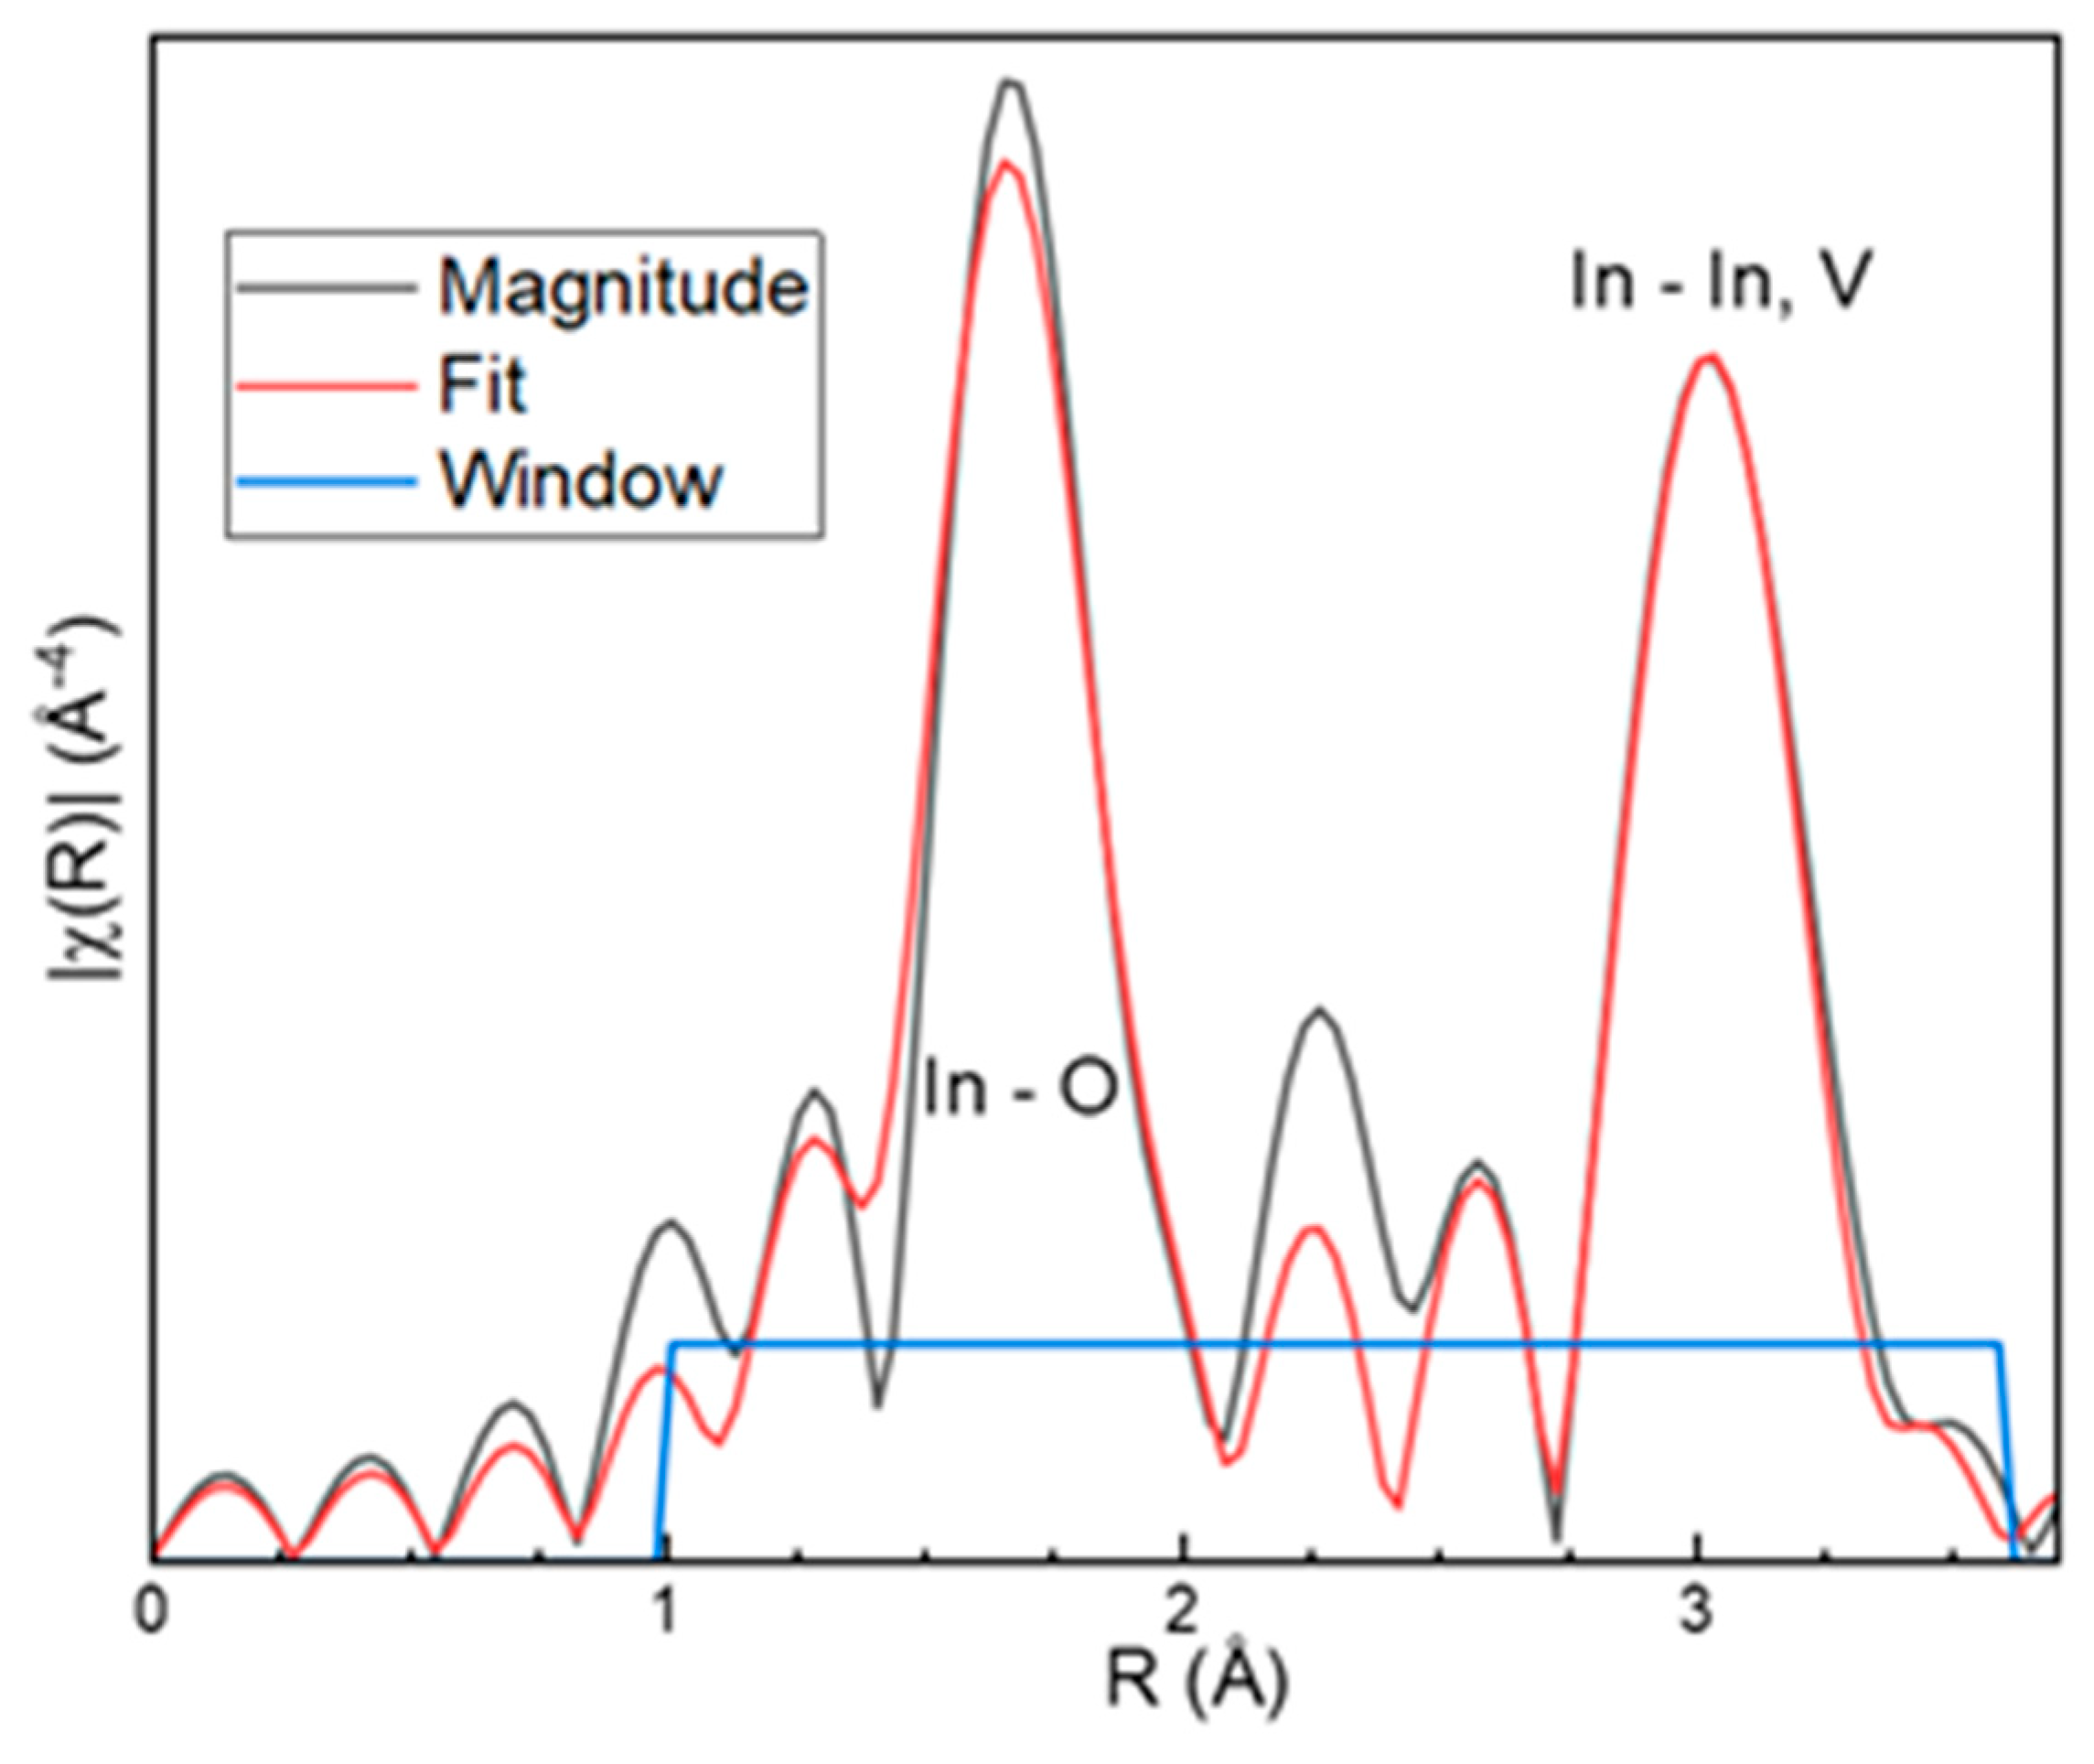
Based on the structural model of InVO4 and high-quality XAS data obtained for the indium K-edge, we have determined the local structural surrounding for In-cations, based on photoelectron scattering on the nodes of the crystal lattice. For this, the absorption data were normalized, converted into a reciprocal k-space (k is a wavenumber per length unit, zero is set at the defined position of the absorption edge) followed by the Fourier-transformation into R-space as a k3-weighted data. Multiplying the EXAFS function χ(k) by kn allows to amplify the oscillations, especially at higher k, since their intensity decays very fast with its increase [26]. The theoretical EXAFS function was calculated using the structural model of the InVO4, and least square fitting is done, allowing estimation the interatomic distances within the first few coordination spheres of the absorbing atom. The procedure of fitting is automated and known as FEFF code [27], and implied in Demeter software [19] The results of these calculations are shown in Figure 8.
The intense local maxima in the oscillations reflect the scattering of photoelectrons on the atoms belonging to the closest coordination spheres of indium. Since indium-oxygen tetrahedrons are distorted, two bonds of different lengths provide the first big, slightly asymmetric peak. The second peak is formed by the In–In scattering path, while the small shoulder at 3.4 Å can be attributed to the In–V distance. It is difficult to distinguish visually between the In–O3 and In–V oscillations, however adding them both to the calculation model allows to realize a proper fit. Table 2 shows the results of the calculations.
As one may see, the values obtained from the EXAFS fitting match well the values from the structural model, proving high quality of obtained InVO4 single crystals. The quality of obtained InVO4 crystals is sufficient for further X-ray diffraction study under high-pressure, that are realized at pressure values up to 20 GPa with application of diamonds with a 600um culet and at temperature from RT to 15 K.

3.4. UV-vis-NIR spectroscopy absorption

On the Figure 9a diffuse reflectance spectrum of the InVO4 single crystal is shown.
As it can be seen from the spectrum, InVO4 single crystal possesses an intense absorption in the region from 200 to 600 nm, confirming previously published results for polycrystalline samples [28,29]. InVO4 single crystal shows an absorption in the visible light region, supporting the promising photocatalytic activity, determined previously for the polycrystalline samples in [28,29].
Results for the transformation of the of reflectance spectroscopic data by the Kubelka-Munk model are presented in the Figure 9b. The transformation has been realized for the direct band-gap [(F(R)*hν)2], where F(R) is the Kubelka-Munk equation, cm−1; and hν is an energy, eV. Linear extrapolation of the data in the range from 3 eV to 4.5 eV gives the value of the direct band-gap 2.3 eV. There is another linear area in the range from 2 eV to 3 eV on the Kubelka-Munk transformation curve (Figure 9b). Since this absorption is rather weak, it can be caused by the absorption of defect levels below the conduction band. Note, that for the indirect band-gap transformation [(F(R)*hν)1/2] no linear areas have been observed on the curve.
Worth to note, that for InVO4 polycrystalline samples, obtained by solid-state synthesis, the band-gap was detected approx. 2 eV [28] and for the thin-films around 3 eV [30,31]. The value of approx. 3 eV was determined by theoretical calculations for InVO4 [5,32]. These deviations in the values of determined band-gaps might be caused by the different methods of the band-gap determination. For instanse, in [31] the band-gap for InVO4 has been determined by the Kubelka-Munk transformation of the optical absoption data for indirect band-gap (3.2 eV), contrary to our data of direct band-gap (2.3 eV). According to [6,7] drop of the band-gap in InVO4 under the high pressure is around 1.5 eV. Thus, this phenomenon can lead to a pressure-driven metallization at pressures beyond those of the structure transformation.

4. Conclusions

Single crystals of InVO4 of several mm length have been grown by a flux-method technique using copper pyrovanadate as a flux (Cu2V2O7). The crystals present the orthorhombic Cmcm phase and are pure, except for rests of the flux observed in both XRD (<3 wt.%), EDX and ICP-OES. The oxidation states of the indium and vanadium ions are found to be +3 and +5, respectively. EXAFS data are consistent with the used structural model. Determined direct band-gap of InVO4 single crystals is 2.3 eV.
The quality of obtained InVO4 crystals is sufficient for further studies under high-pressure, that are already in progress at the group of Prof. Dr. J. Geck in TU Dresden, Germany.

Author Contributions

Methodology, O.V., A.M.; software, M.V.G., D.M.; formal analysis, M.V.G., D.M.; investigation, O.V.; resources, O.V., A.M.; data curation, O.V., D.M.; writing—original draft preparation, O.V., M.V.G.; writing—review and editing, A.M., D.M., S.S.; supervision, A.M., D.M.; project administration, S.S., B.B.; funding acquisition, S.S., B.B. All authors have read and agreed to the published version of the manuscript.

Funding

This research was partly supported by the UKRATOP project funded by the Federal Ministry of Education and Research (BMBF) under reference 01DK18002 and by the Philipp Schwartz Initiative of the Alexander von Humboldt Foundation.

Data Availability Statement

The data presented in this study are available on request from the corresponding author.

Acknowledgments

Authors appreciate the help of Dr.habil. V.V.Romaka (IFW, Dresden) with Rietveld refinement for obtained XRD measurements, of Robert Kluge (IFW, Dresden) with EDX measurements and of Andrea Voß (IFW, Dresden) with ICP-OES measurements. Authors would like to thank Sandra Schiemenz and Dr. Evgenia Dmitrieva (IFW, Dresden) for the UV-vis-NIR measurements.

Conflicts of Interest

The authors declare no conflict of interest.

References

  1. Touboul, M.; Melghit, K.; Bénard, P.; Louër, D. Crystal Structure of a Metastable Form of Indium Orthovanadate, InVO4-I. J. Solid State Chem. 1995, 118, 93-98. [CrossRef]
  2. Touboul, M.; Tolédano, P. Structure du vanadate d’indium: InVO4. Acta Cryst. B 1980, 36, 240-245. [CrossRef]
  3. Touboul, M.; Ingrain, D. Synthèses et propriétés thermiques de InVO4 et TlVO4. Journal of the Less Common Metals 1980, 71, 55-62. [CrossRef]
  4. Errandonea, D.; Gomis, O.; Garcia-Domene, B.; Pellicer-Porres, J.; Katari, V.; Achary, S.N.; Tyagi, A.K.; Popescu, C. New polymorph of InVO4: a high-pressure structure with six-coordinated vanadium. Inorg. Chem. 2013, 52, 12790-12798. [CrossRef]
  5. Mondal, S.; Appalakondaiah, S.; Vaitheeswaran, G. High pressure structural, electronic, and optical properties of polymorphic InVO4 phases. J. Appl. Phys. 2016, 119, 085702 (8). [CrossRef]
  6. Errandonea, D. High pressure crystal structures of orthovanadates and their properties. J. Appl. Phys. 2020, 128, 040903 (17). [CrossRef]
  7. Botella, P.; Errandonea, D.; Garg, A.B.; Rodriguez-Hernandez, P.; Muñoz, A.; Achary, S.N.; Vomiero, A. High-pressure characterization of the optical and electronic properties of InVO4, InNbO4, and InTaO4. SN Appl. Sci. 2019, 1, 389. [CrossRef]
  8. Zou, Z.; Ye, J.; Sayama, K.; Arakawa, H. Direct splitting of water under visible light irradiation with an oxide semiconductor photocatalyst. Nature 2001, 414, 625. [CrossRef]
  9. Liu, Y.; Ren, W.; Shi, P.; Liu, D.; Liu, M.; Jing, W.; Tian, B.; Ye, Z.; Jiang, Z. Preparation and thermal volatility characteristics of In2O3/ITO thin film thermocouple by RF magnetron sputtering. AIP Advances 2017, 7, 115025-8. [CrossRef]
  10. Lamoreaux, R.H.; Hildenbrand, D.L.; Brewer, L. High-Temperature Vaporization Behavior of Oxides II. Oxides of Be, Mg, Ca, Sr, Ba, B, AI, Ga, In, TI, Si, Ge, Sn, Pb, Zn, Cd and Hg. Journal of Physical and Chemical Reference Data 1987, 16, 419-443. [CrossRef]
  11. Nakamura, S.; Maljuk, A.; Maruyama, Y.; Nagao, M.; Watauchi, S.; Hayashi, T.; Anzai, Y.; Furukawa, Y.; Ling, C.D.; Deng, G.; Avdeev, M.; Büchner, B.; Tanaka, I. Growth of LiCoO2 single crystals by the TSFZ method. Crystal Growth and Design 2019, 19, 415-420. [CrossRef]
  12. Bosacka, M.; Filipek, E.; Paczesna, A. Unknown phase equilibria in the ternary oxide V2O5-CuO-In2O3 system in subsolidus area. J. Therm. Anal. Calorim. 2016, 125, 1161-1170. [CrossRef]
  13. Nobe, Y.; Takashima, H.; Katsumata, T. Decoloration of yttrium orthovanadate laser host crystals by annealing. Optics Letters 1994, 19, 1216-1218. [CrossRef]
  14. Voloshyna, O.V.; Baumer, V.N.; Bondar, V.G.; Kurtsev, D.A.; Gorbacheva, T.E.; Zenya, I.M.; Zhukov, A.V.; Sidletskiy, O.Ts. Growth and scintillation properties of gadolinium and yttrium orthovanadate crystals. Nuclear Instruments and Methods in Physics Research A 2012, 664, 299–303. [CrossRef]
  15. Rietveld, H.M. A profile refinement method for nuclear and magnetic structures. J. Appl. Cryst. 1969, 2, 65-71. [CrossRef]
  16. Rodriguez-Carvajal, J.; Roisnel, T. FullProf.98 and WinPLOTR: New Windows95/NT Applications for Diffraction. Commission for Powder Diffraction, International Union of Crystallography, (May–August) Summer 1998, Newsletter N20.
  17. Calvo, C.; Faggiani, R. α-Cupric vanadate. Acta crystallogr. Section B 1975, 31, 603-605. [CrossRef]
  18. Caliebe, W.A.; Murzin, V.; Kalinko, A.; Görlitz, M. High-flux XAFS-beamline P64 at PETRA III. AIP Conf. Proc. 2019, 2054, 060031. [CrossRef]
  19. Ravel, B.; Newville, M. ATHENA, ARTEMIS, HEPHAESTUS: data analysis for X-ray absorption spectroscopy using IFEFFIT. J. Synchr. Rad. 2005, 12, 537–541. [CrossRef]
  20. Denis, S.; Baudrin, E.; Touboul, M.; Tarascon, J.-M. Synthesis and electrochemical properties vs Li of amorphous vanadates of general formula RVO4 (R = In, Cr, Al, Fe, Y). J. Electrochem. Soc. 1997, 144, 4099-4109. https://dx.doi.org/10.1149/1.1838150.
  21. Vitova, T.; Mangold, S.; Paulmann, C.; Gospodinov, M.; Marinova, V.; Mihailova, B. X-ray absorption spectroscopy of Ru-doped relaxor ferroelectrics with a perovskite-type structure. Phys. Rev. B: Condens. Matter Mater. Phys. 2014, 89, 144112. [CrossRef]
  22. Bearden, J.A.; Burr, A.F. Reevaluation of X-Ray Atomic Energy Levels. Rev. Mod. Phys. 1967, 39, 125. [CrossRef]
  23. Tsoukalou, A.; Abdala, P.M.; Armutlulu, A.; Willinger, E.; Fedorov, A.; Müller, C.R. Operando X-ray Absorption Spectroscopy Identifies a Monoclinic ZrO2:In Solid Solution as the Active Phase for the Hydrogenation of CO2 to Methanol. ACS Catal. 2020, 10, 10060–10067. [CrossRef]
  24. Chaurand, P.; Rose, J.; Briois, V.; Salome, M.; Proux, O.; Nassif, V.; Olivi, L.; Susini, J.; Hazemann, J.-L.; Bottero, J.-Y. New Methodological Approach for the Vanadium K-Edge X-ray Absorption Near-Edge Structure Interpretation:  Application to the Speciation of Vanadium in Oxide Phases from Steel Slag. J. Phys. Chem. B 2007, 111, 5101-5110. [CrossRef]
  25. Nga, T.T.T.; Huang, Y.-C.; Chen, J.-L.; Chen, C.-L.; Lin, B.-H.; Yeh, P.-H.; Du, C.-H.; Chiou, J.-W.; Pong, W.-F.; Arul, K.T.; Dong, C.-L.; Chou, W.-C. Effect of Ag-Decorated BiVO4 on Photoelectrochemical Water Splitting: An X-ray Absorption Spectroscopic Investigation. Nanomaterials 2022, 12, 3659. [CrossRef]
  26. Newville, M. Fundamentals of XAFS, Revision 1.7; University of Chicago: Chicago, IL, USA, 2004.
  27. Rehr, J.J.; de Leon, J.M.; Zabinsky, S.I.; Albers, R.C. Theoretical X-ray Absorption Fine Structure Standards. J. Am. Chem. Soc. 1991, 113, 5135–5140. [CrossRef]
  28. Ye, J.; Zou, Z.; Arakawa, H.; Oshikiri, M.; Shimoda, M.; Matsushita, A.; Shishido, T. Correlation of crystal and electronic structures with photophysical properties of water splitting photocatalysts InMO4 (M=V5+, Nb5+, Ta5+). J. Photochem. Photobiol. A 2002, 148, 79-83. [CrossRef]
  29. Ye, J.; Zou, Z.; Oshikiri, M.; Matsushita, A.; Shimoda, M.; Imai, M.; Shishido, T. A novel hydrogen-evolving photocatalyst InVO4 active under visible light irradiation. Chem. Phys. Lett. 2002, 356, 221-226. [CrossRef]
  30. Oshikiri, M.; Boero, M.; Ye, J.; Zou, Z.; Kido, G. Electronic structures of promising photocatalysts InMO4 (M=V, Nb, Ta) and BiVO4 for water decomposition in the visible wavelength region. J. Chem. Phys. 2002, 117, 7313. [CrossRef]
  31. Enache, C.S.; Lloyd, D.; Damen, M.R.; Schoonman, J.; van de Krol, R. Photo-electrochemical Properties of Thin-Film InVO4 Photoanodes: the Role of Deep Donor States. J. Phys. Chem. C 2009, 113, 19351–19360. [CrossRef]
  32. Oshikiri, M.; Boero, M.; Ye, J.; Aryasetiwan, F.; Kido, G. The electronic structure of the thin films of InVO4 and TiO2 by first principles calculations. Thin Solid Films 2003, 445, 168-174. [CrossRef]
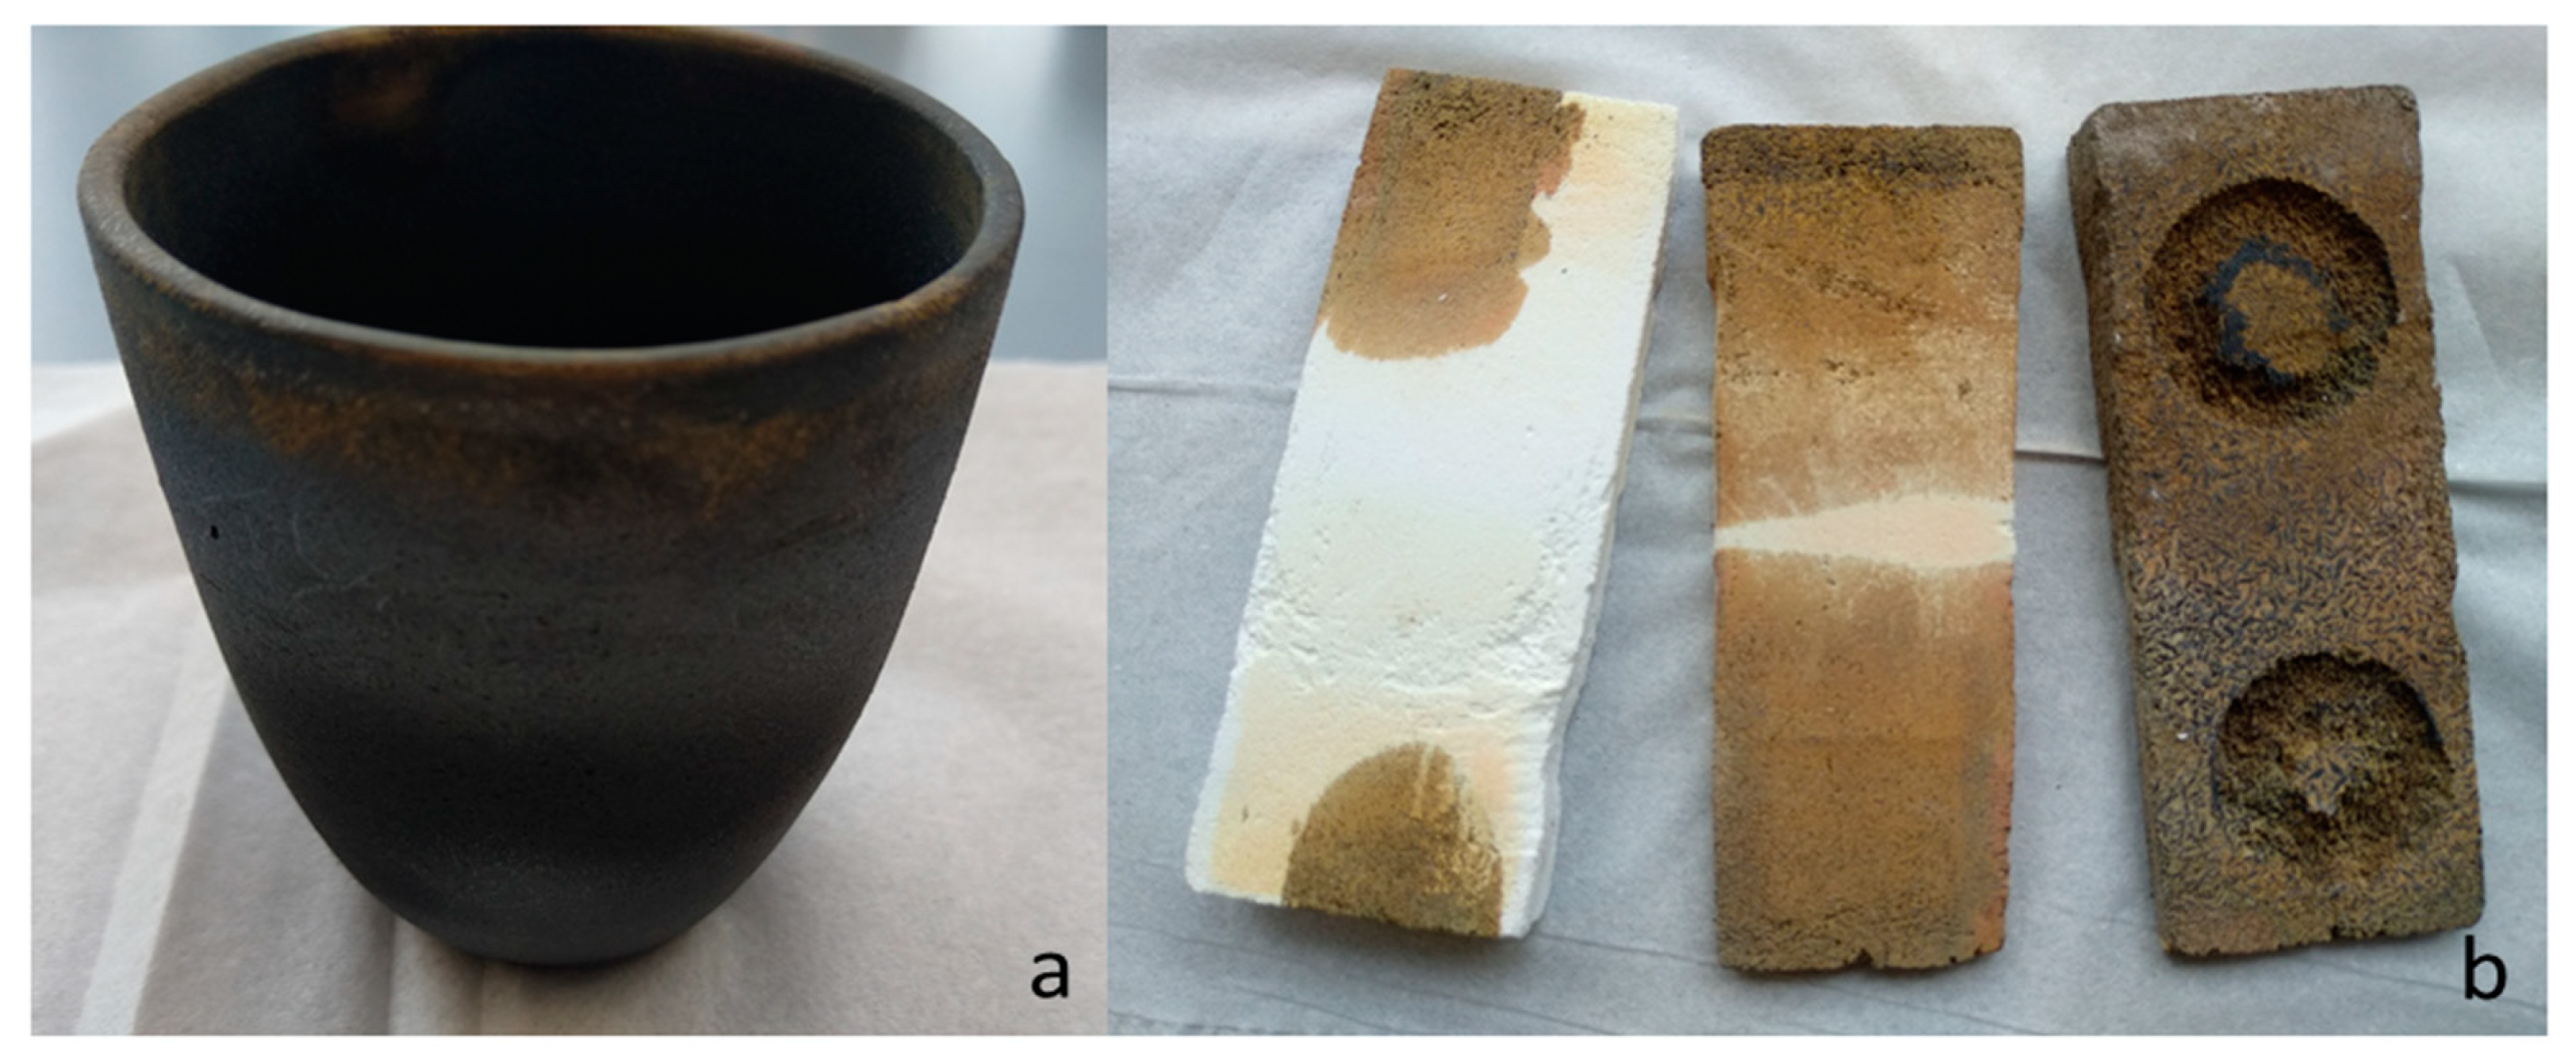
Figure 1. (a) Al2O3-crucible showing chemical reaction with the In2O3-V2O5-CuO melt. The plates under the crucible (b) were also soaked with melt .
Preprints 85040 g001
Figure 2. (a) InVO4 crystals on the bottom of a Pt crucible exposed after decanting the flux. (b) Typical InVO4 crystals extracted from (a).
Preprints 85040 g002
Figure 3. View of InVO4 crystals before the annealing (a) and (b) and after annealing (c) and (d) at 300 °C for 240 hours.
Preprints 85040 g003
Figure 4. Powder XRD pattern for crushed InVO4 crystals. The position of Bragg peaks for InVO4, for Cu2V2O7 are indicated in green, the difference between calculated (black line) and experimental (red dots) intensities is represented in blue.
Preprints 85040 g004
Figure 5. BSEM image of a typical InVO4 crystal (a) and of crystal surface (b). Here 1–InVO4 and 2–Cu2V2O7. (c) SEM image of the crystal surface. Tiny inclusions of Pt are highlighted by yellow circles.
Preprints 85040 g005
Figure 6. Normalized absorption of InVO4 single crystal in (a) In and (b) V K-edge regions.
Preprints 85040 g006
Figure 7. First derivative of In K-edge region of X-ray absorption spectra for InVO4 and In foil.
Preprints 85040 g007
Figure 8. Part of the Fourier-transformed In K-edge EXAFS function of InVO4 single crystal together with the same function based on the crystallographic model.
Preprints 85040 g008
Figure 9. Diffuse reflectance spectrum of the InVO4 single crystal (a) and Kubelka-Munk transformation for the direct band-gap [(F(R)*hν)2] (b).
Preprints 85040 g009
Table 1. Refinement data for InVO4 and Cu2V2O7.
Parameter InVO4 Cu2V2O7
Space group,
Prototype
Cmcm (#64)
CrVO4-type
Fdd2 (#43)
Cu2V2O7-type
a, Å 5.7329(8) 8.3631(0)
b, Å 8.5010(8) 20.6495(6)
c, Å 6.5590(3) 6.4497(6)
V, Å3 319.664(0.014) 1113.837(0.000)
Reflections measured 73 114
Weighted profile
R-factor (Rwp)
4.64 16.1
Expected R factor (Rexp) 1.94 6.76
Goodness of fit (χ2) 5.69 5.69
Content in the sample, wt.% 97.13 2.87
Table 2. Comparison of data for InVO4 single crystal obtained based on Rietveld refinement and EXAFS calculations.
Distance (in Å) Str. model EXAFS calc. Rf = 0.036
In–O1(×4) 2.1184 2.11(4)
In–O2 (×2) 2.2219 2.22(6)
In–In 3.2795 3.29(2)
In–V 3.4985 3.53(9)
Disclaimer/Publisher’s Note: The statements, opinions and data contained in all publications are solely those of the individual author(s) and contributor(s) and not of MDPI and/or the editor(s). MDPI and/or the editor(s) disclaim responsibility for any injury to people or property resulting from any ideas, methods, instructions or products referred to in the content.
Copyright: This open access article is published under a Creative Commons CC BY 4.0 license, which permit the free download, distribution, and reuse, provided that the author and preprint are cited in any reuse.
Prerpints.org logo

Preprints.org is a free preprint server supported by MDPI in Basel, Switzerland.

Subscribe

© 2024 MDPI (Basel, Switzerland) unless otherwise stated