4.1. Continuous mode treatment results
Investigation of the effects of continuous electron beam treatment on the properties of ferrites was conducted on samples that were heated through electron beam irradiation to different temperatures, ranging from 900 to 1300 °C in increments of 100 °C.
Table 3 shows the irradiation conditions.
Samples were heated for 15–25 minutes to the desired temperature, then held at that constant temperature for 5 minutes, and cooled by gradually reducing the electron beam current over 10–15 minutes. The overall heating, holding, and cooling process took 30 to 45 minutes.
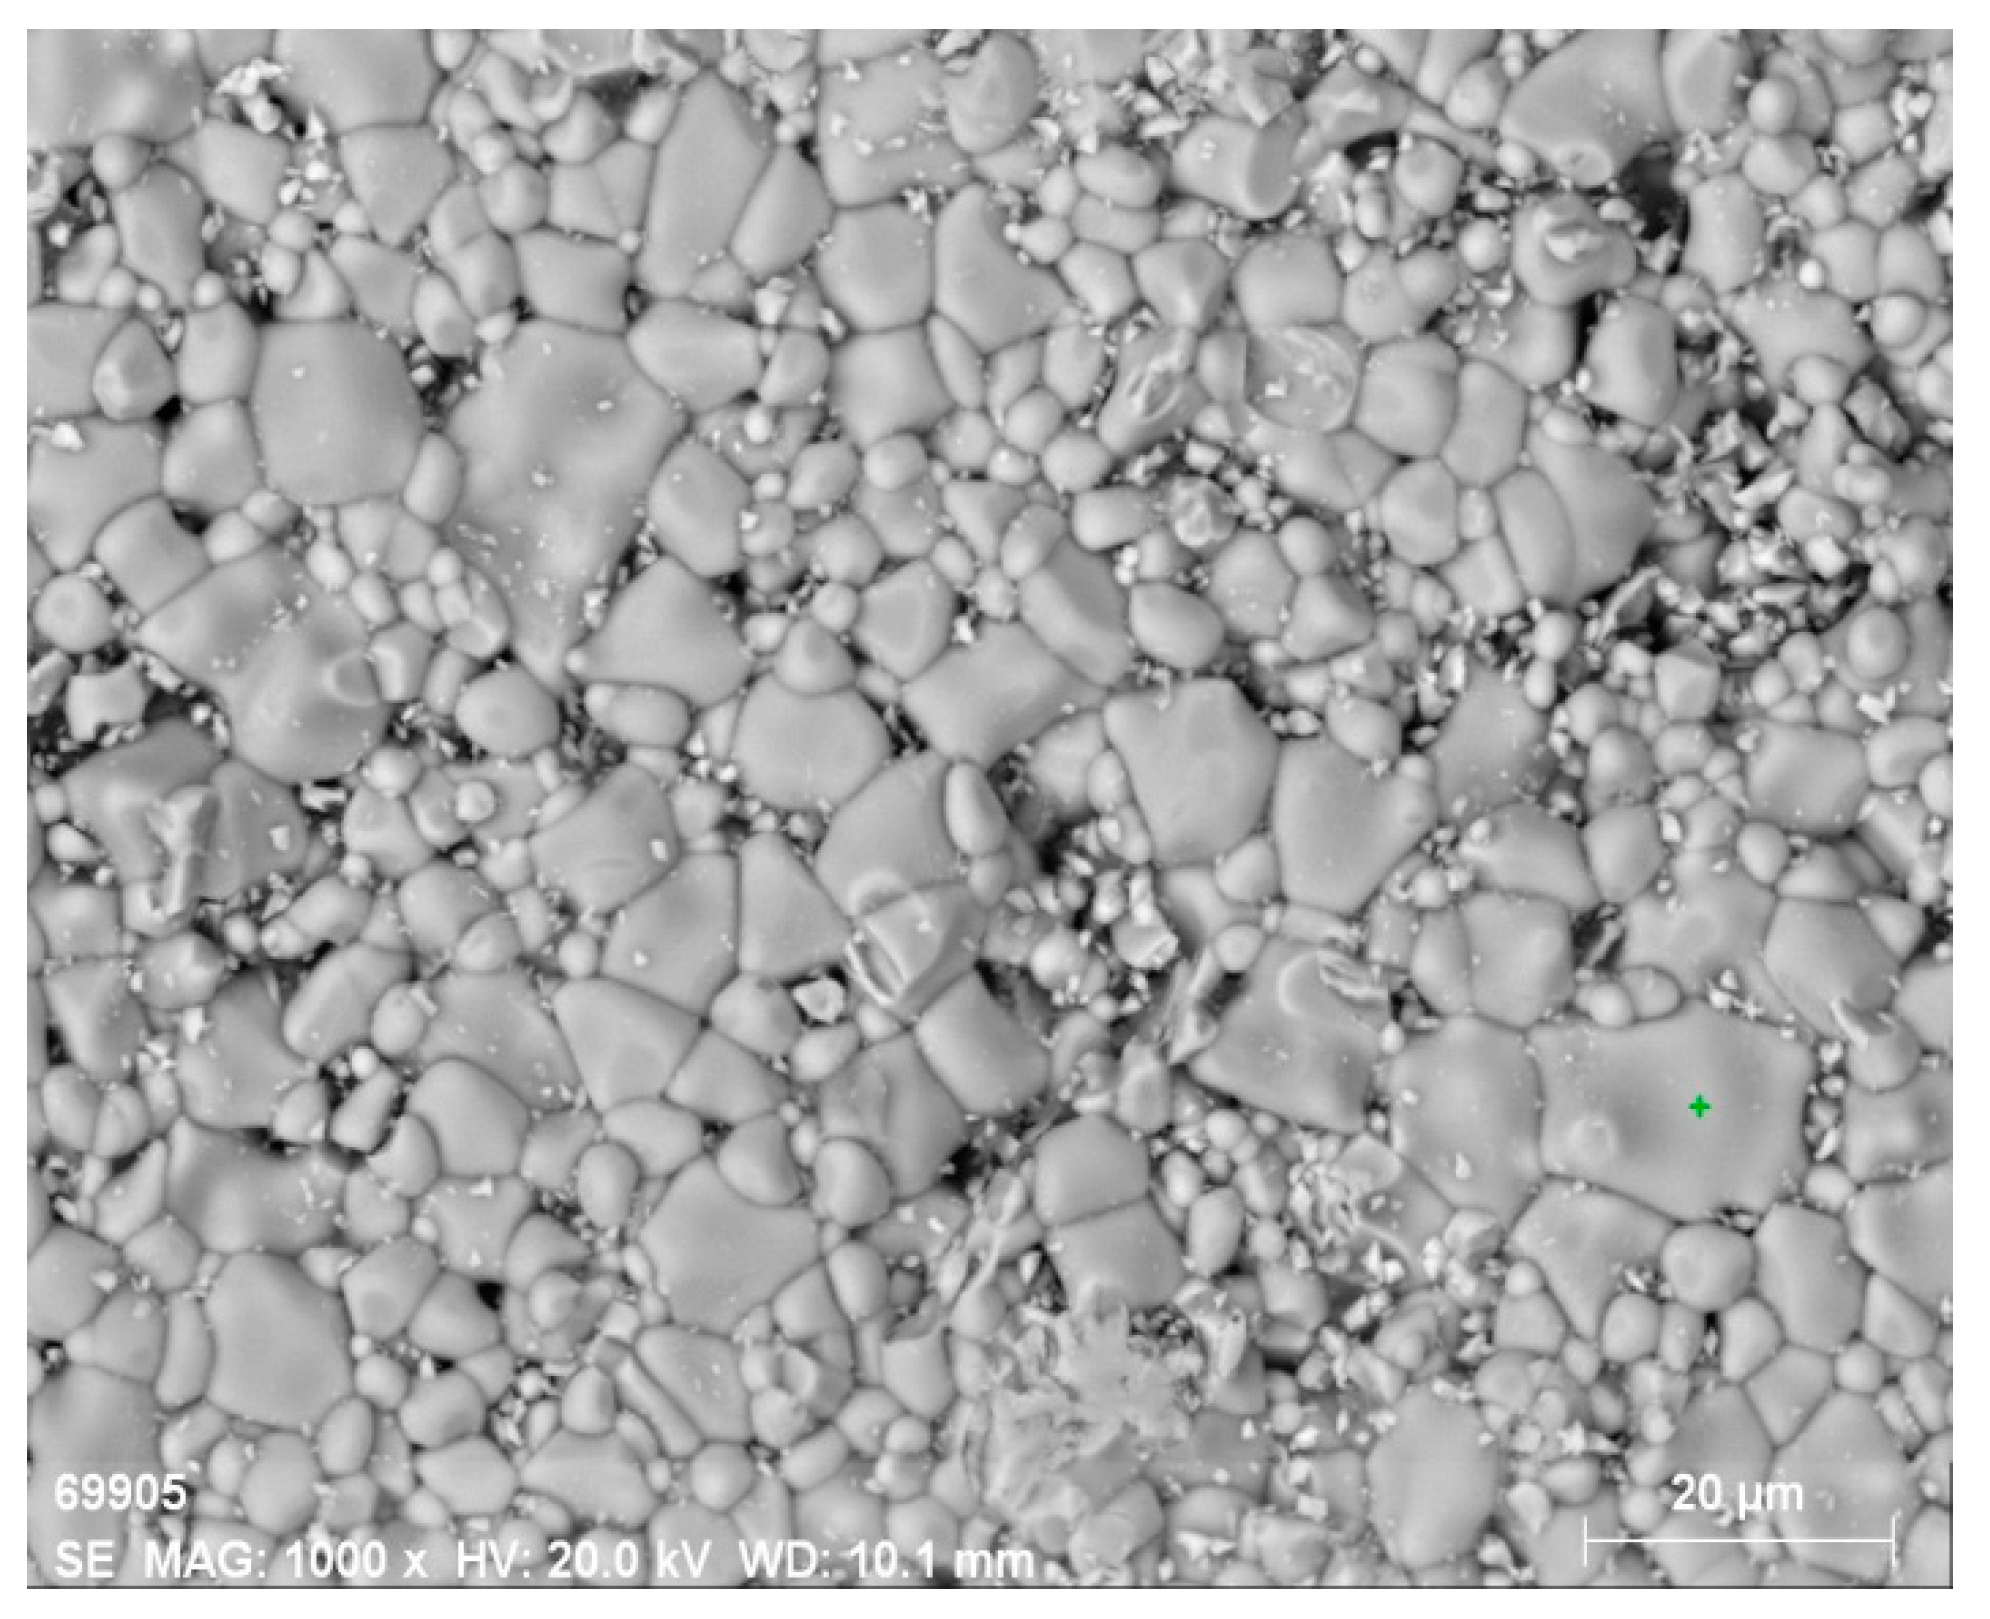
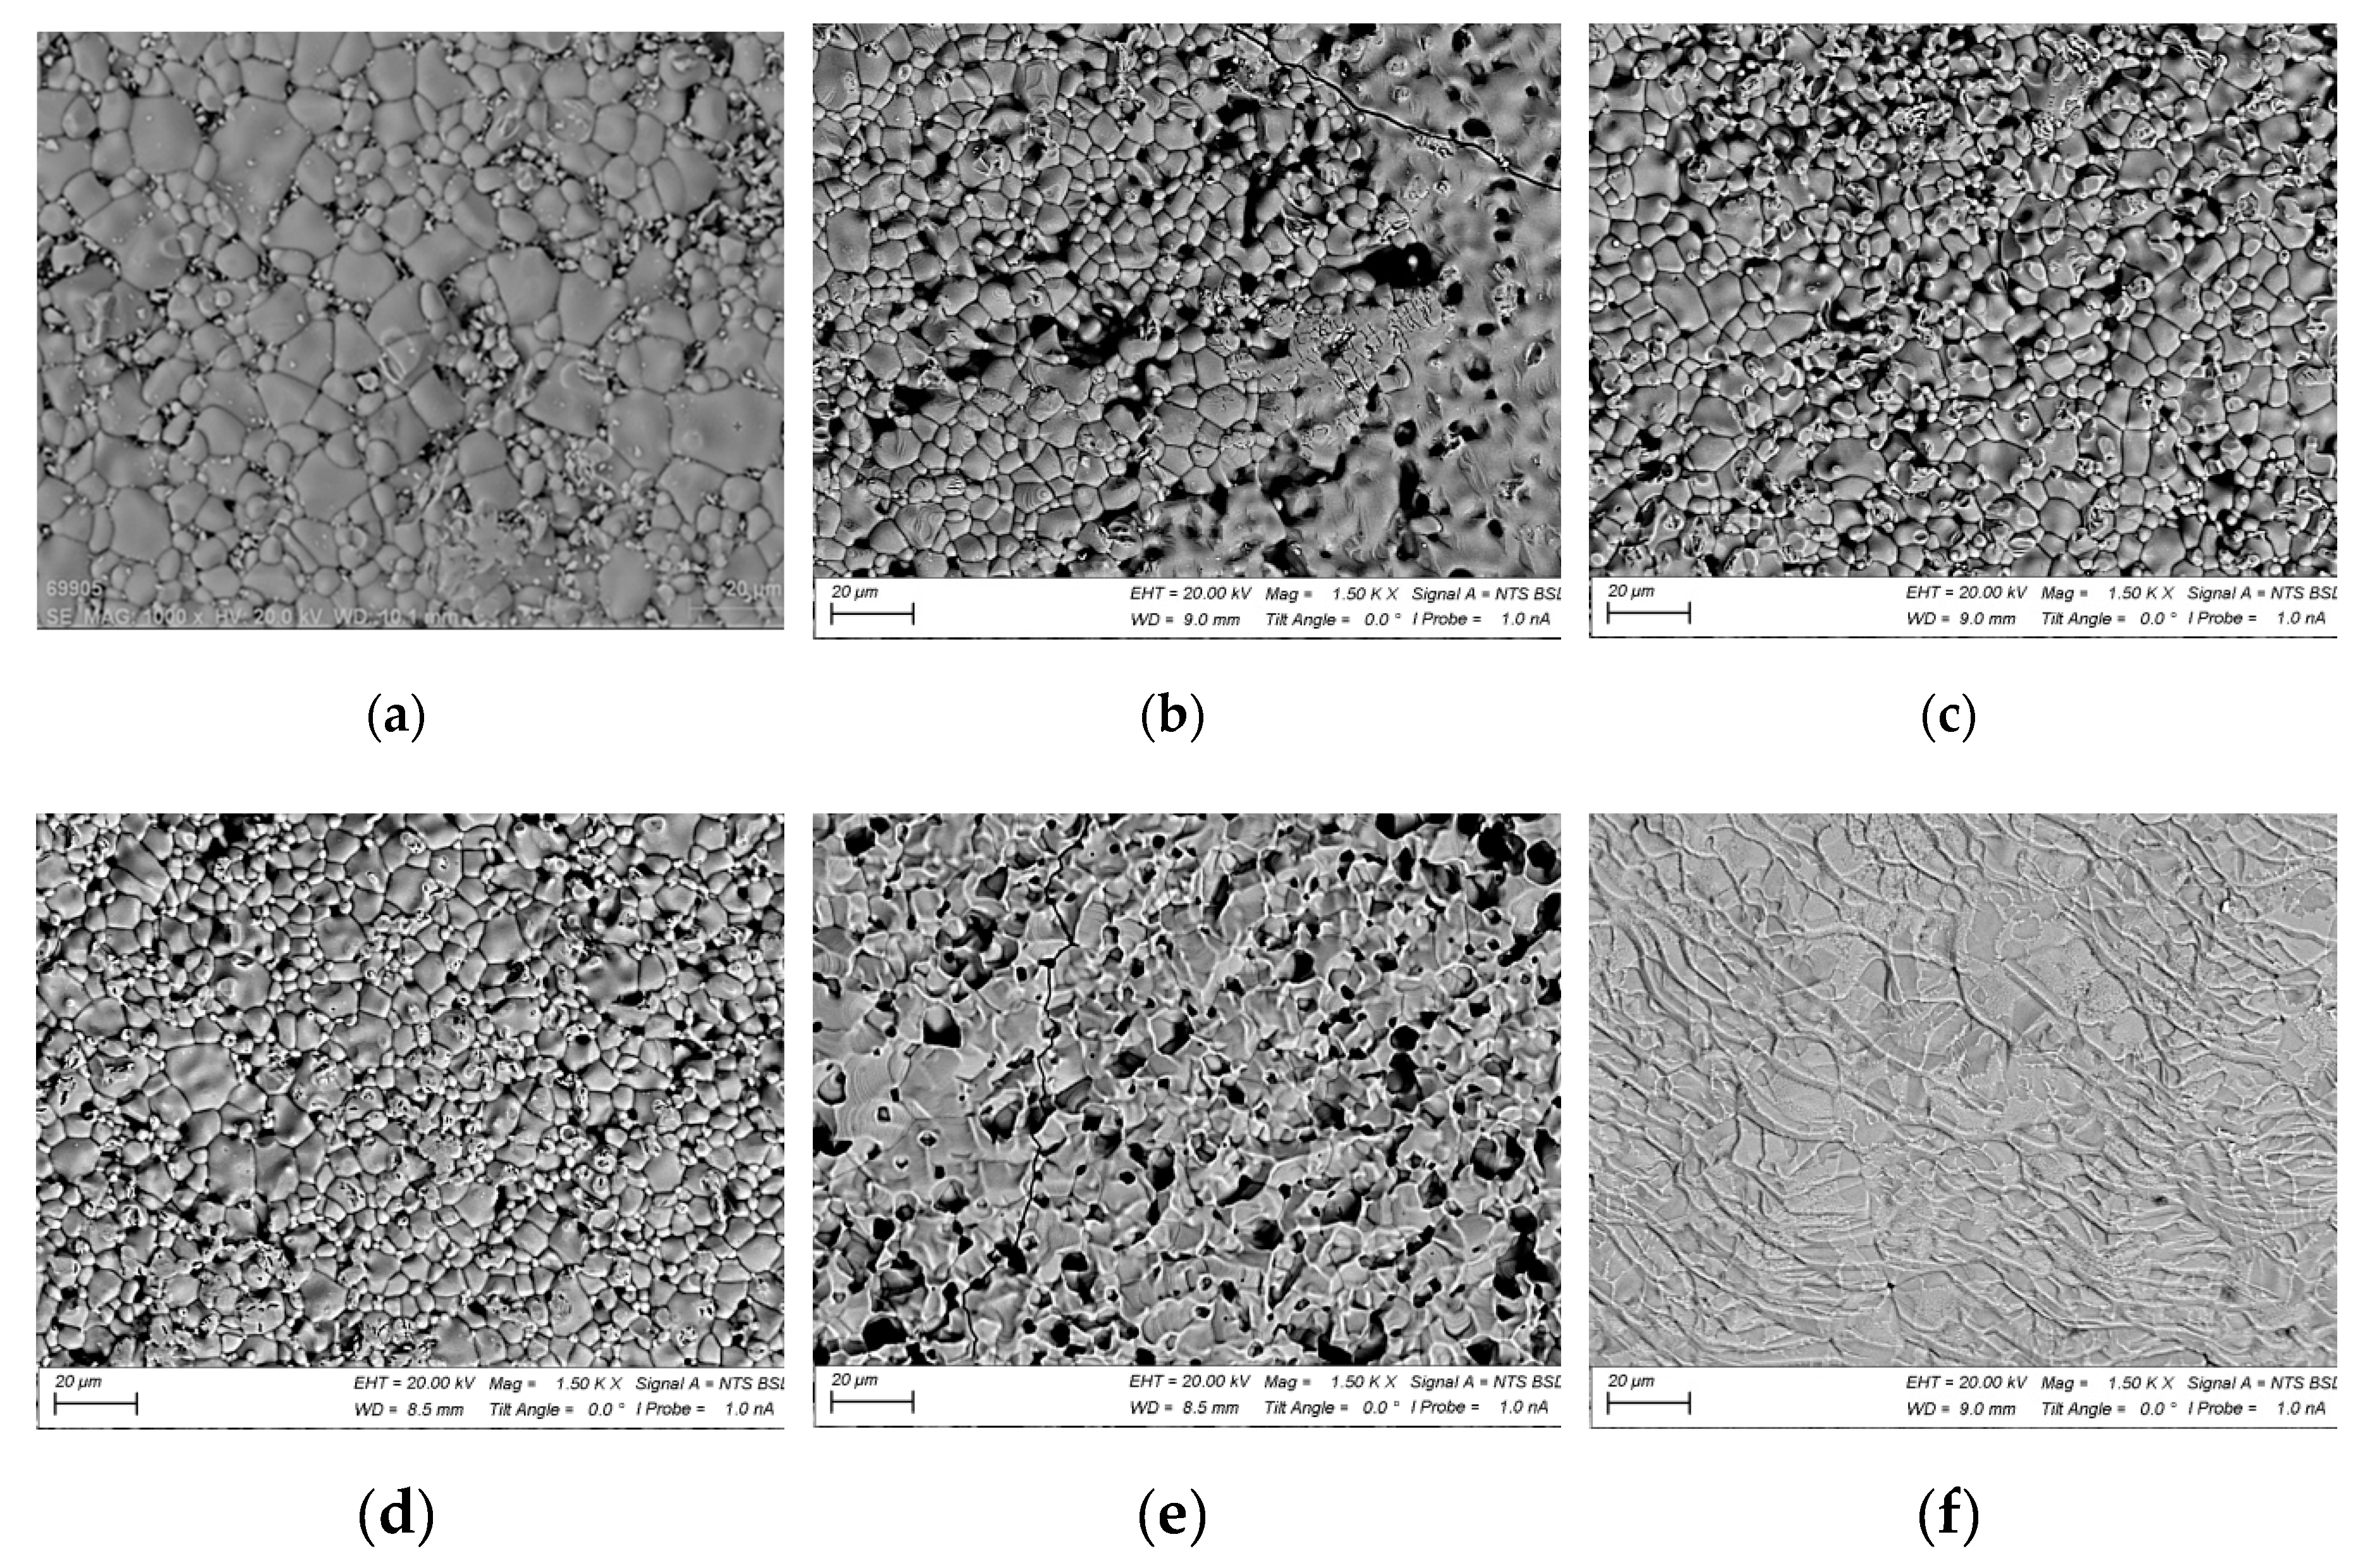
Figure 5 shows SEM images of the surface of the original ferrite and ferrite irradiated at different temperatures. The most significant change in surface structure occurs starting from a temperature of 1200 °C. A crystalline structure forms on the surface. Pores become more pronounced, and their quantity notably increases compared to other samples treated at lower temperatures. When the temperature reaches 1300 °C (
Figure 5 f), a noticeable change in surface structure is observed.
In SEM images of the surface taken at other magnifications, as shown in
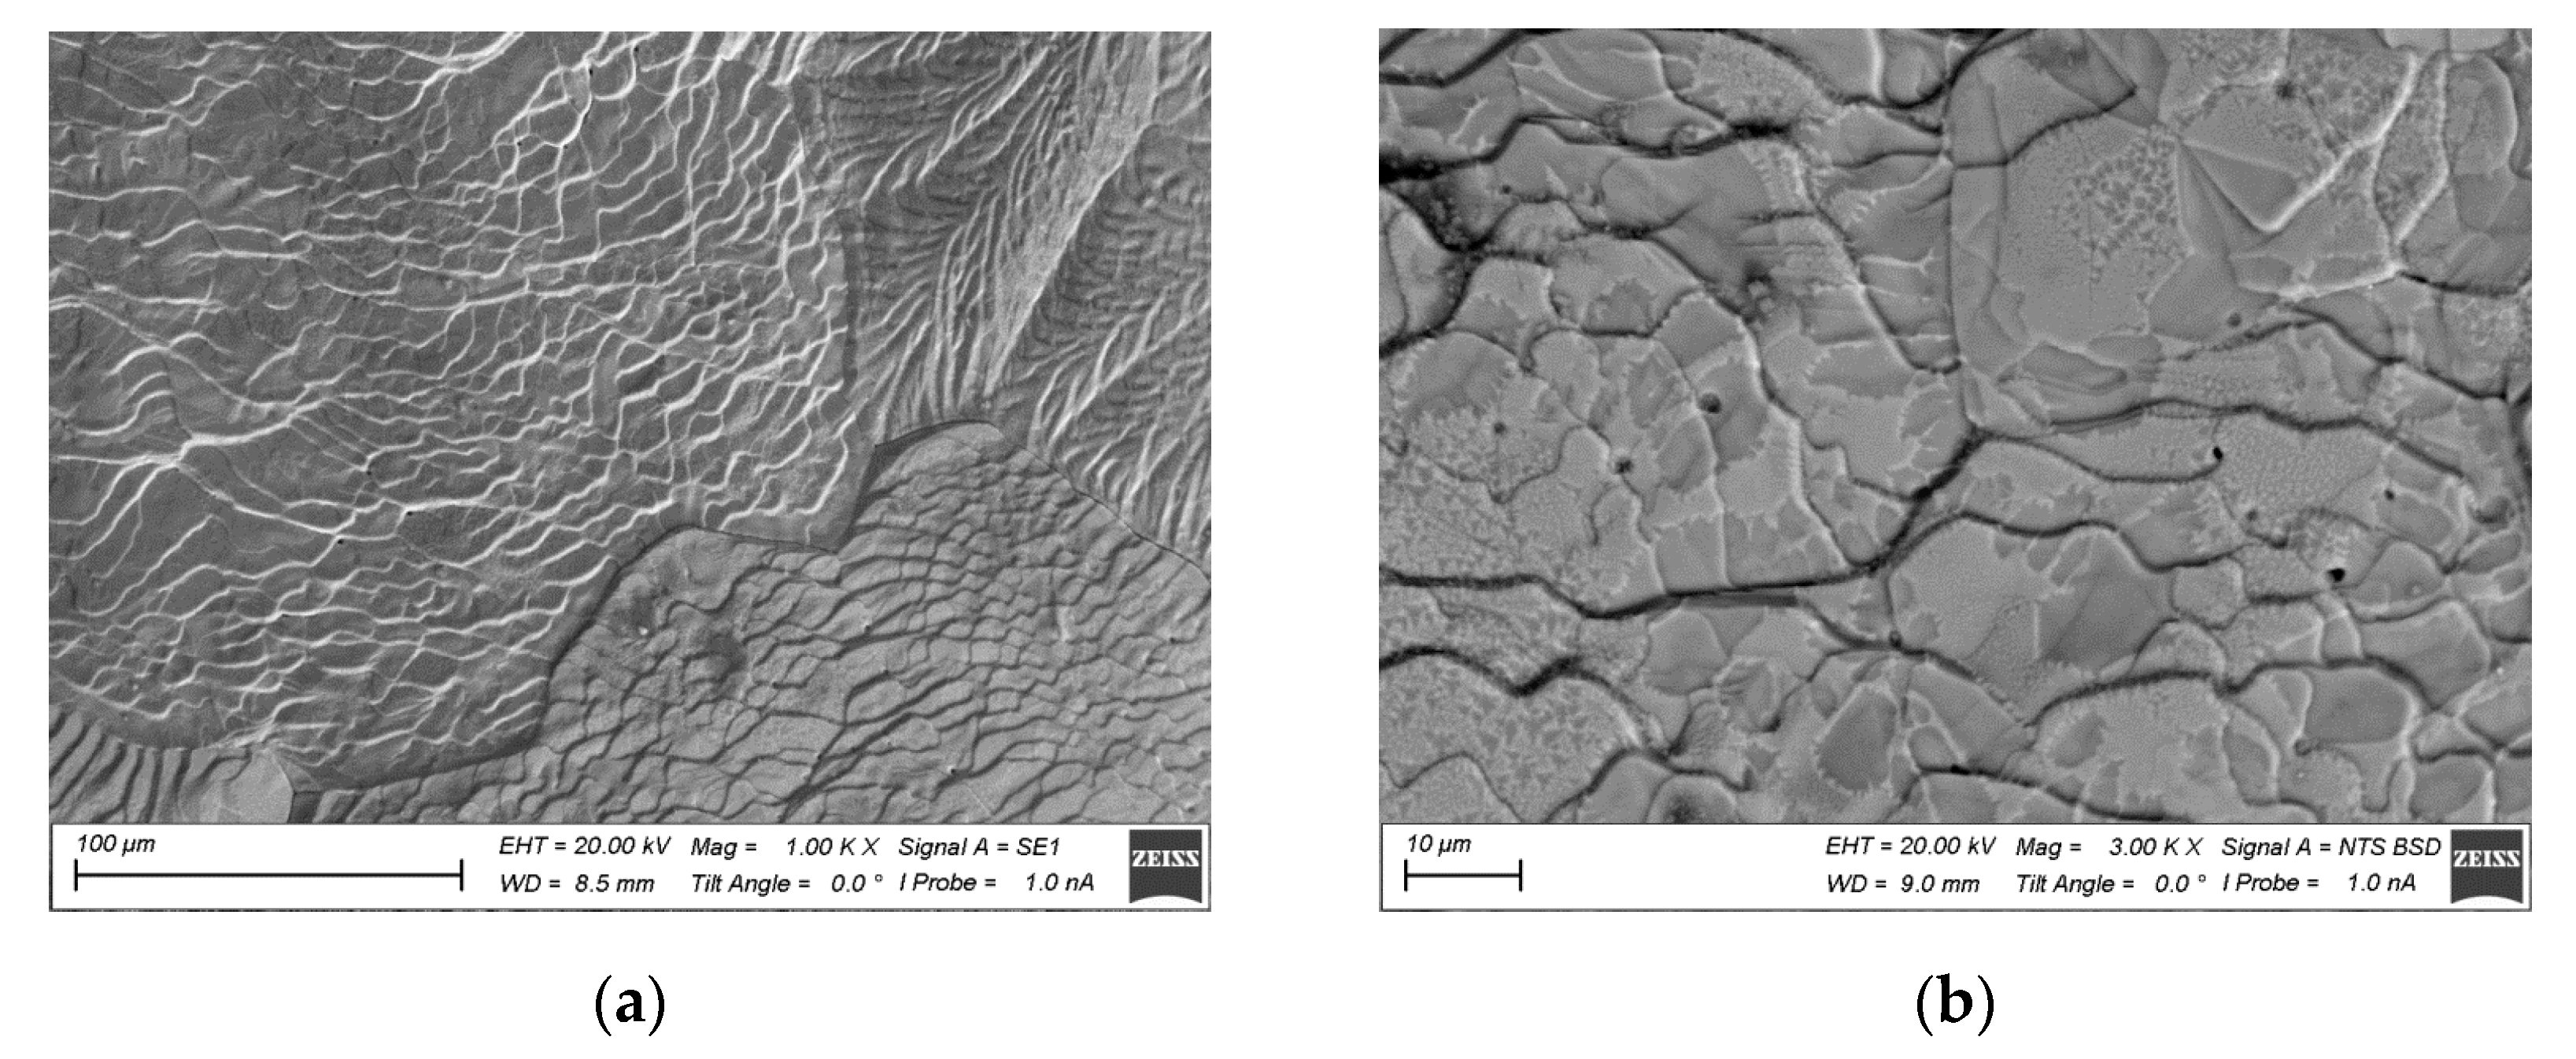
Figure 6, for this sample, secondary recrystallization and the formation of a periodic microstructure with a characteristic period of about 10 µm are visible. Simultaneously, the surface becomes smoother, and pores are filled with a melt that upon further crystallization forms a flat surface. Such surface changes have been observed before during electron beam treatment of NiZn ferrites [
51]. However, the required temperatures for the material presented in this article are 200 °C higher.
The change in surface structure is accompanied by a change in phase composition. The results of measurement of elemental composition in the ferrite near-surface layer shown in
Table 4.
As a result of the treatment, the concentration of zinc decreases significantly in the near-surface layer. At the same time, the concentrations of iron and manganese decrease, while the concentration of oxygen increases. The loss of zinc leads to a significant increase in electrical conductivity of the ferrite.
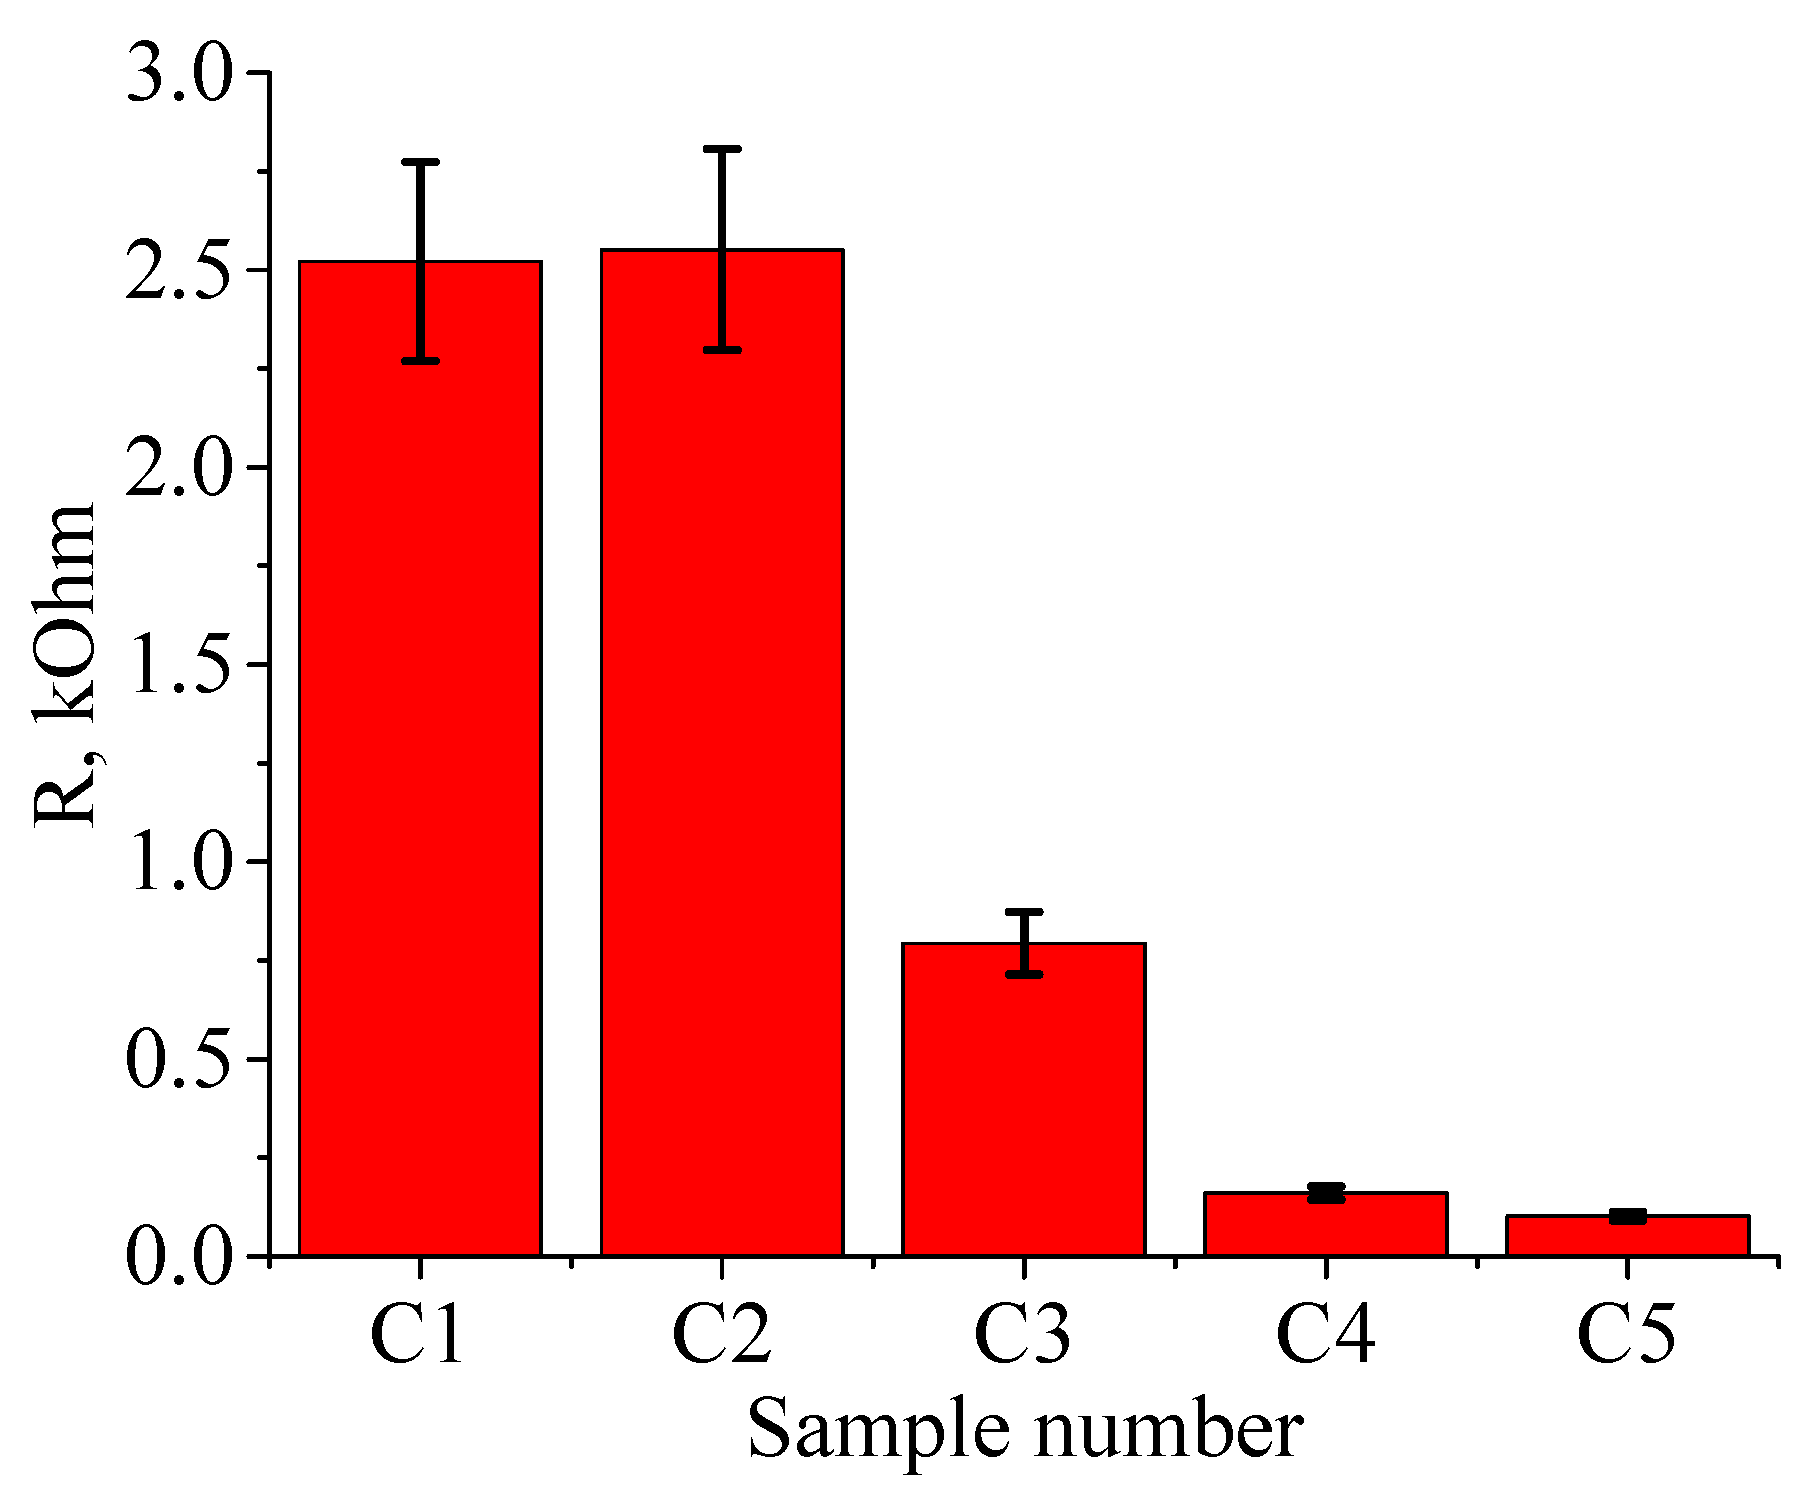
Figure 4.3 shows the resistance of ferrite treated at various temperatures. Even for the lowest treatment temperature, the resistance is significantly lower than in the original (untreated) state. For the original ferrite, the resistance was 30 kΩ, whereas at 900 °C, the resistance decreases by more than an order of magnitude to 2.5 kΩ (see
Figure 7). Note that the decrease in resistance, unlike the structural changes, begins for samples treated at a temperature as low as 1100 °C. This dependence is presumably linked to the change in zinc content, which starts to leave the sample already at the minimum treatment temperature. The resistance on the untreated side of the ferrite has also decreased, ranging from 3 to 3.5 kΩ.
Other electrical parameters, measured at the standard frequency of 1000 Hz, do not change as much.
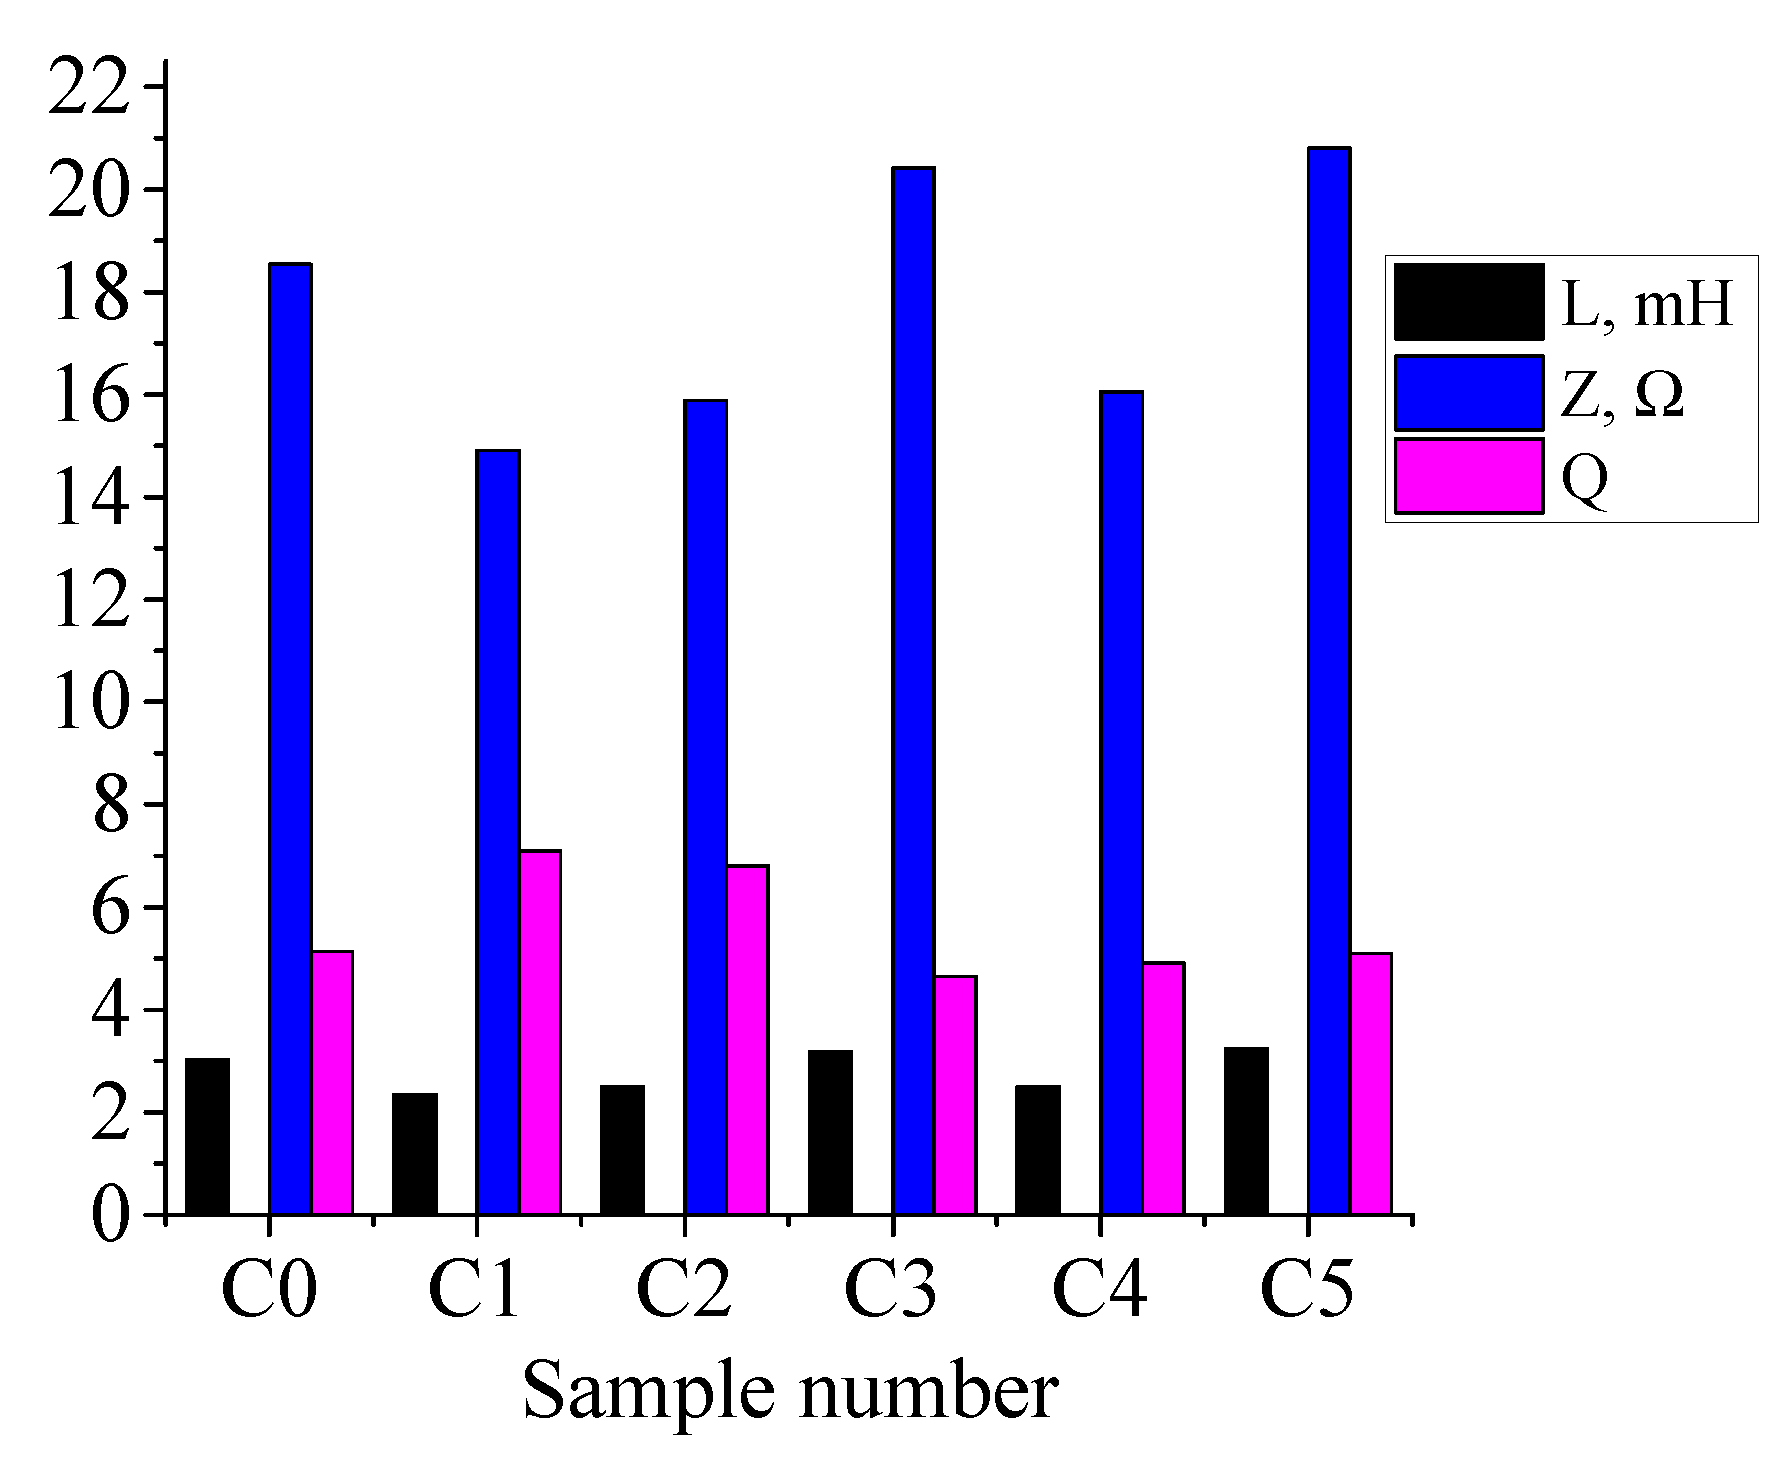
Figure 8 shows the dependence of inductance L, impedance Z, and quality factor Q of ferrite rings on the treatment mode. Sample C0 is the untreated ferrite.
The inductance of the original sample is 3 mH, and is changed by processing to 2.3–3.1 mH; however no clear dependence on temperature is observed. The quality factor increases slightly from 5 for the original sample to 7 for the sample processed at 900 °C; the low value of quality factor indicates a significant attenuation of oscillations in the coil wound for measurements on this ferrite. The impedance varies over the range 15 to 20 ohms, and reaches its maximum value at a processing temperature of 1100 °C.
4.2. Pulse mode treatment results
Pulse treatment regimes for the 5 samples are shown in
Table 5. For all samples, the emission current I
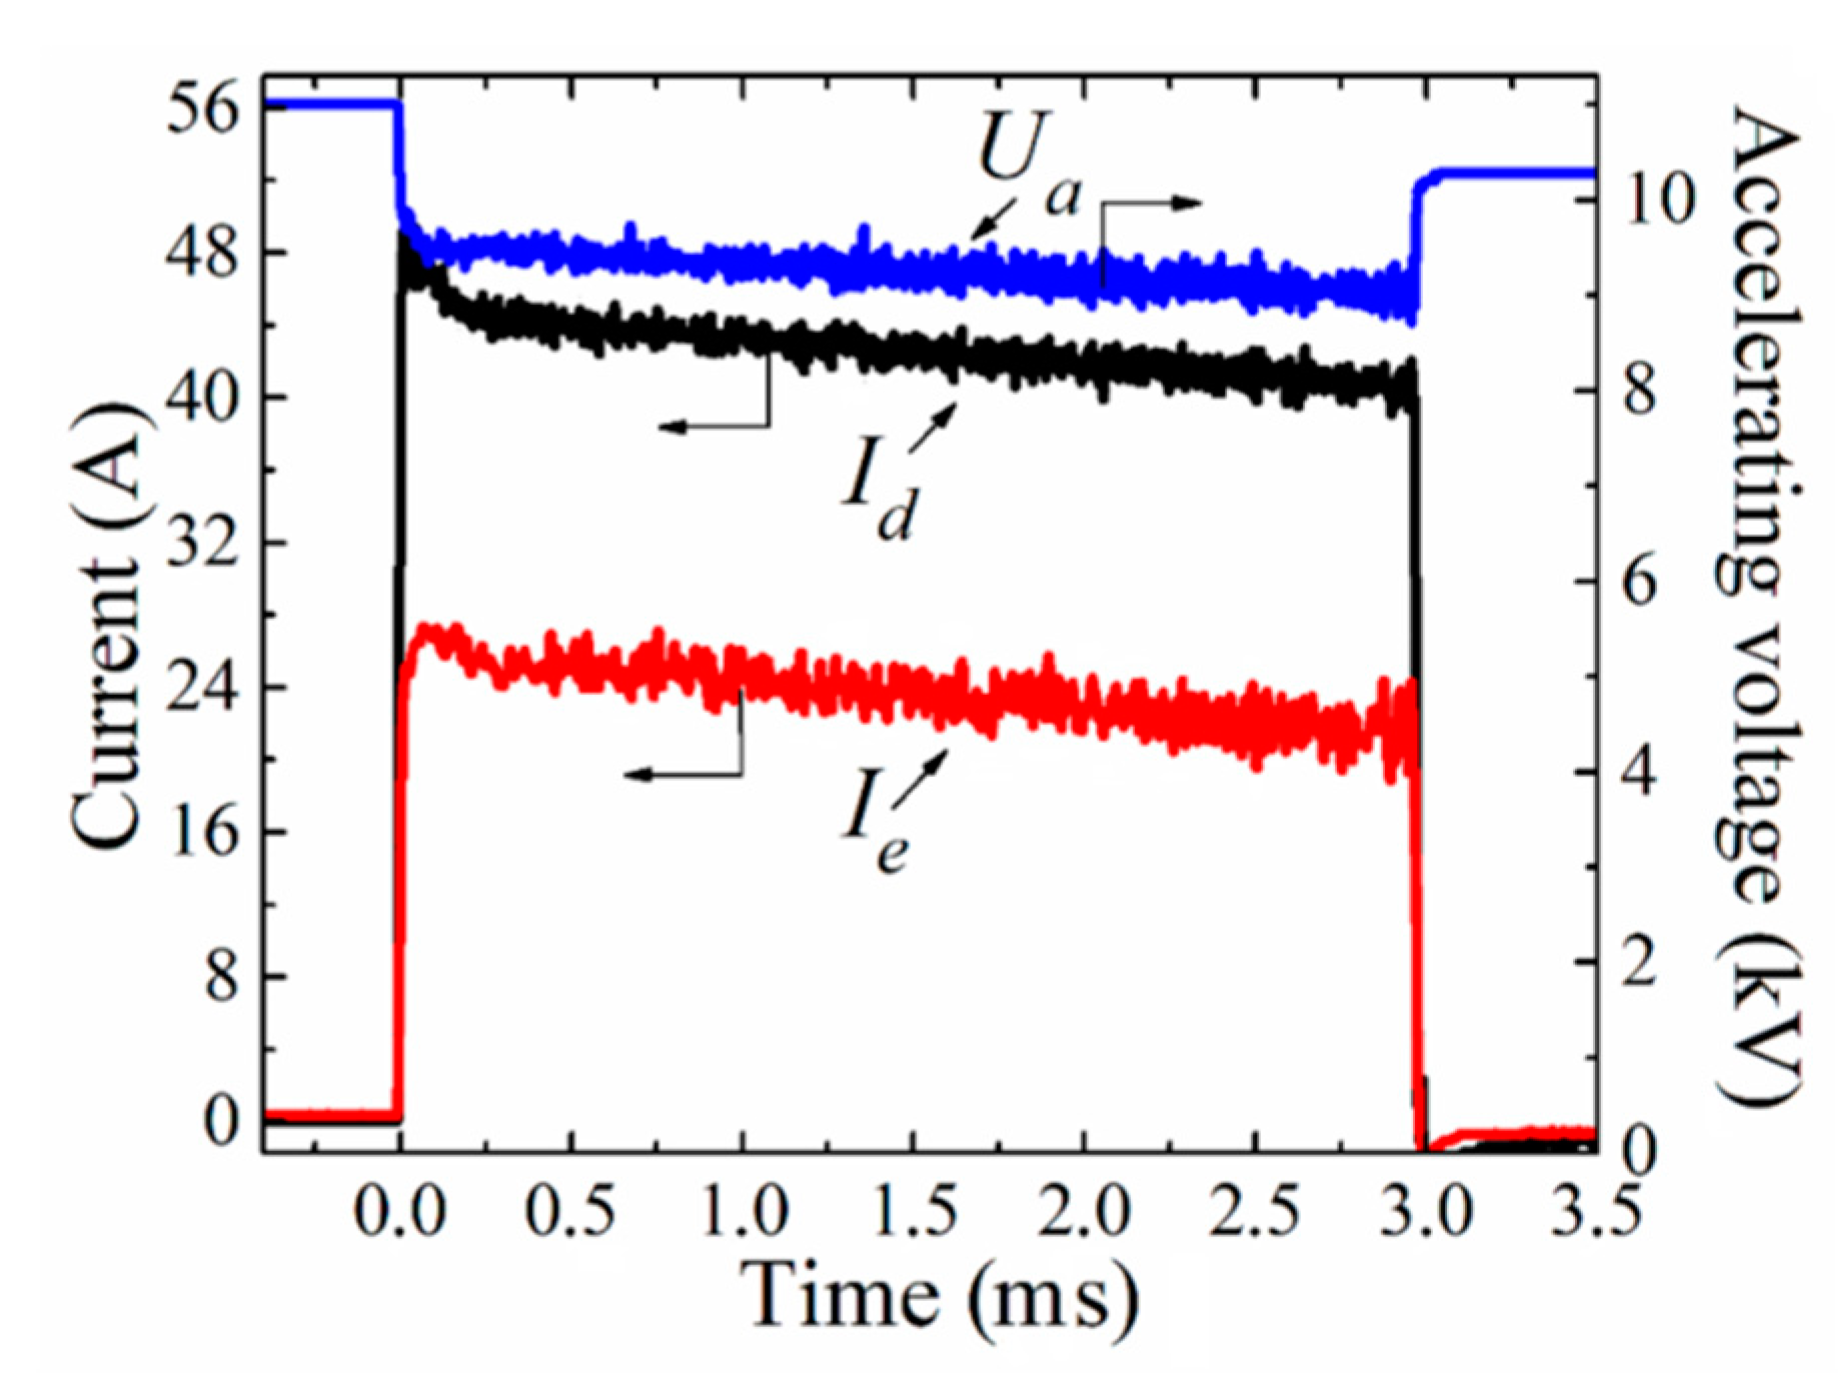
e was 20 A (14 A electron beam current), the electron beam energy was 9 keV, and the pulse repetition frequency was 0.5 Hz. With increase in pulse duration, the energy density J increased, which should affect the surface structure.
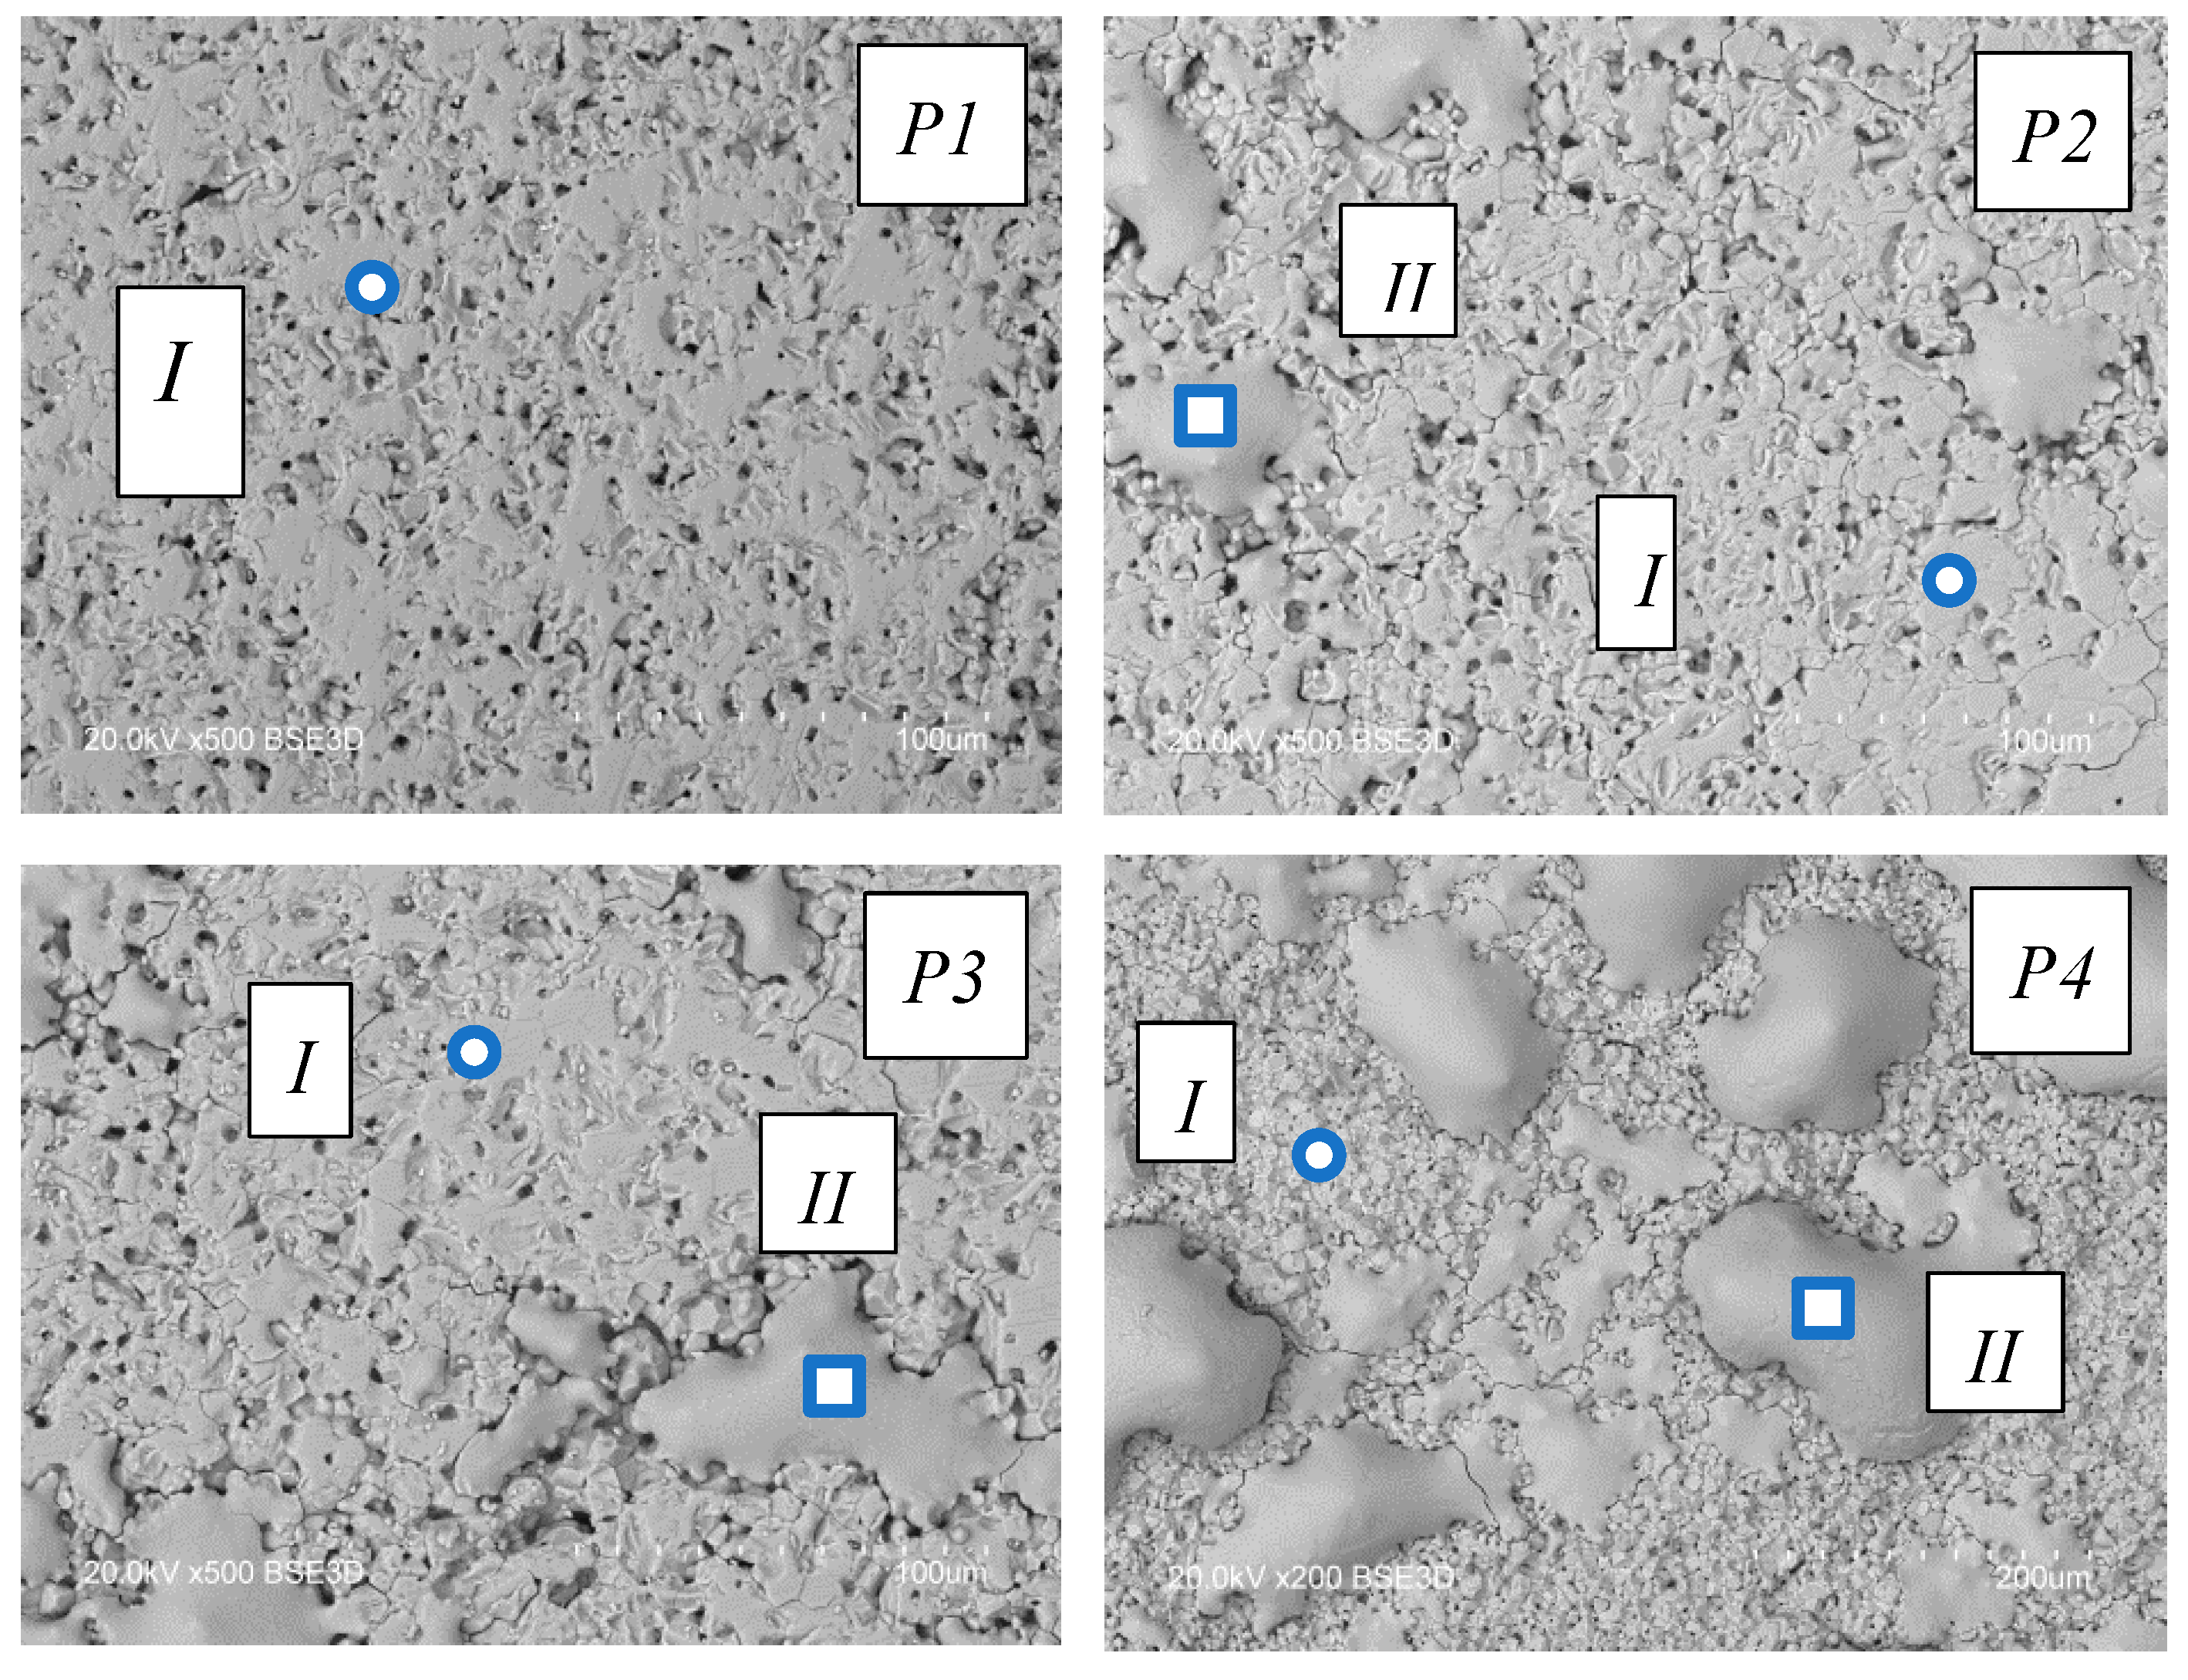
The surface structure of the ferrite after pulse treatment differs from that treated in continuous mode, as shown in
Figure 9. For sample P1, no significant changes in surface structure are observed. With increase in pulse duration, the formation of spread-out areas resembling small droplets can be observed, with the droplet sizes growing as the pulse duration increases. For pulse duration 1.5 ms (J = 15 J/cm²), the droplet sizes do not exceed 20–30 μm. For pulse duration 3 ms (J = 30 J/cm²), the surface exhibits larger droplets with characteristic size up to 200 μm, as well as smaller formations with sizes 50–100 μm. Further increasing the pulse duration while maintaining the current and accelerating voltage at the same level leads to destruction of the ferrite. Therefore, samples treated with τ
d> 3 ms (J > 30 J/cm²) were not investigated.
It is evident that during pulsed electron beam irradiation, the ferrite surface is heated to its melting temperature and possibly higher. Due to capillary forces, the molten layer accumulates into droplets, which subsequently serve as regions of concentrated molten material. To confirm the possibility of heating the surface to melting temperatures, temperature calculations were performed, which will be presented in the following section.
Changes in surface structure are also reflected in its elemental composition.
Table 6 shows the variation in elemental composition of the near-surface layer of Mn-Zn ferrite after pulse electron beam treatment at different surface temperatures. Measurement points for composition are marked with circles in
Figure 9. As seen from
Table 5, with increase in pulse duration the oxygen content increases slightly in Zone I and the zinc concentration decreases. The most significant change in zinc content is observed in droplets solidified on the surface. Data were obtained from areas marked with squares in
Figure 9. The zinc content decreases by more than an order of magnitude, indicating high temperature in these regions.
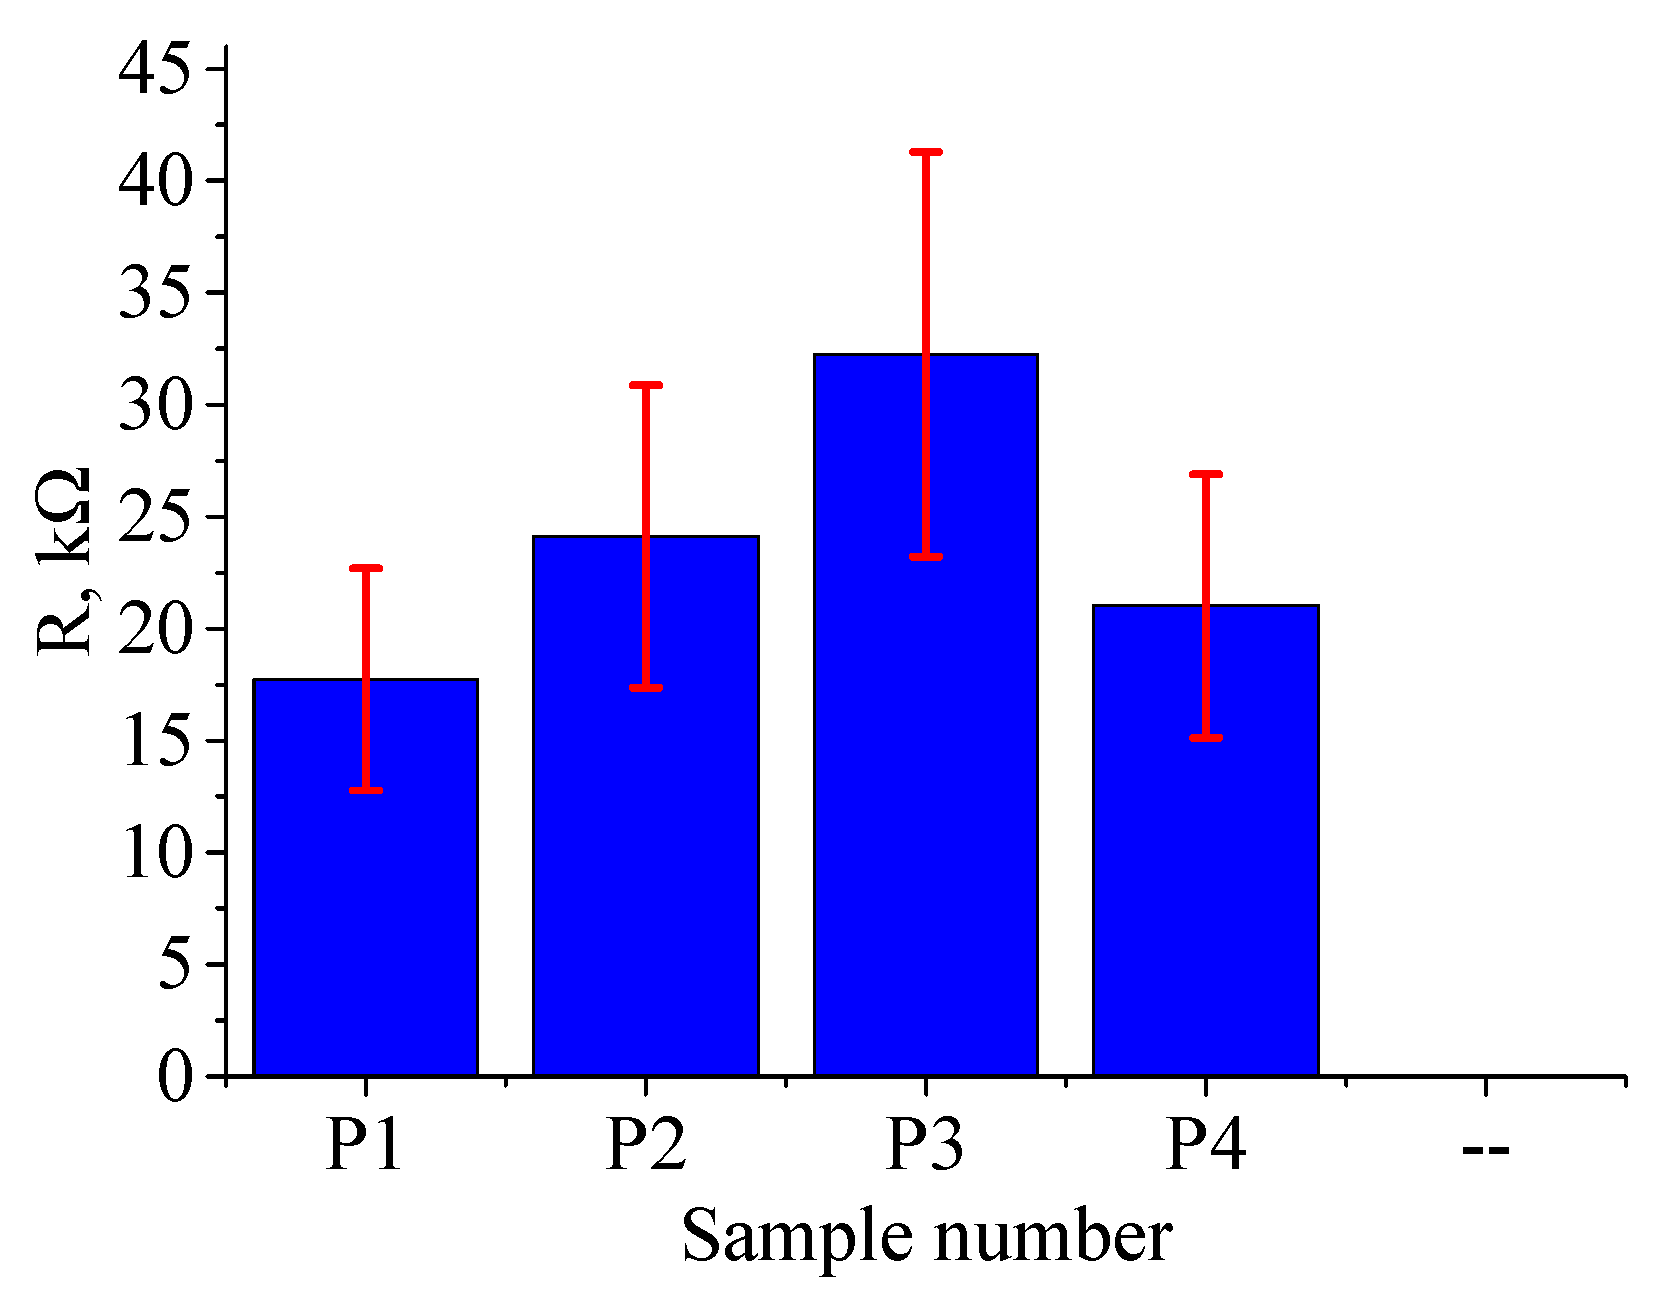
Unlike continuous mode treatment, the resistance of the surface after pulse treatment was found to be dependent on the points of probe application.
Figure 10 shows the dependence of ferrite resistance on treatment mode. The resistance on the untreated side ranged from 25 to 30 kΩ.
The variation in resistance values in this case exceeds 30%, which could be attributed to the fact that zinc-depleted regions are discretely distributed on the surface and don't form a continuous layer as in the case for continuous treatment.
4.3. Thermal field modeling
Modeling allows calculating the temperature on the ferrite surface and within the material. The calculations used tabulated thermophysical data for Mn-Zn ferrite 2000HM as shown in
Table 7.
Unsteady heat conduction is generally described by the Fourier-Kirchhoff equation. For a complete description of the heat conduction process in a specific case, it is necessary to specify the boundary conditions. Geometric conditions define the shape and dimensions of the object, while physical conditions are determined by the thermophysical properties of the material, including density, specific heat, and thermal conductivity. Due to the symmetry of the sample with respect to its axis, the Fourier-Kirchhoff equation in cylindrical coordinates was used for calculations. Since sample irradiation in this study occurs in a vacuum, heat transfer through convection was not considered. The unsteady heat exchange process in a vacuum is described by the two-dimensional heat conduction equation:
where
T is temperature,
t is time,
ρ is the material density,
c is the specific heat of the material,
λ is the thermal conductivity of the material, and
r and
z are coordinates.
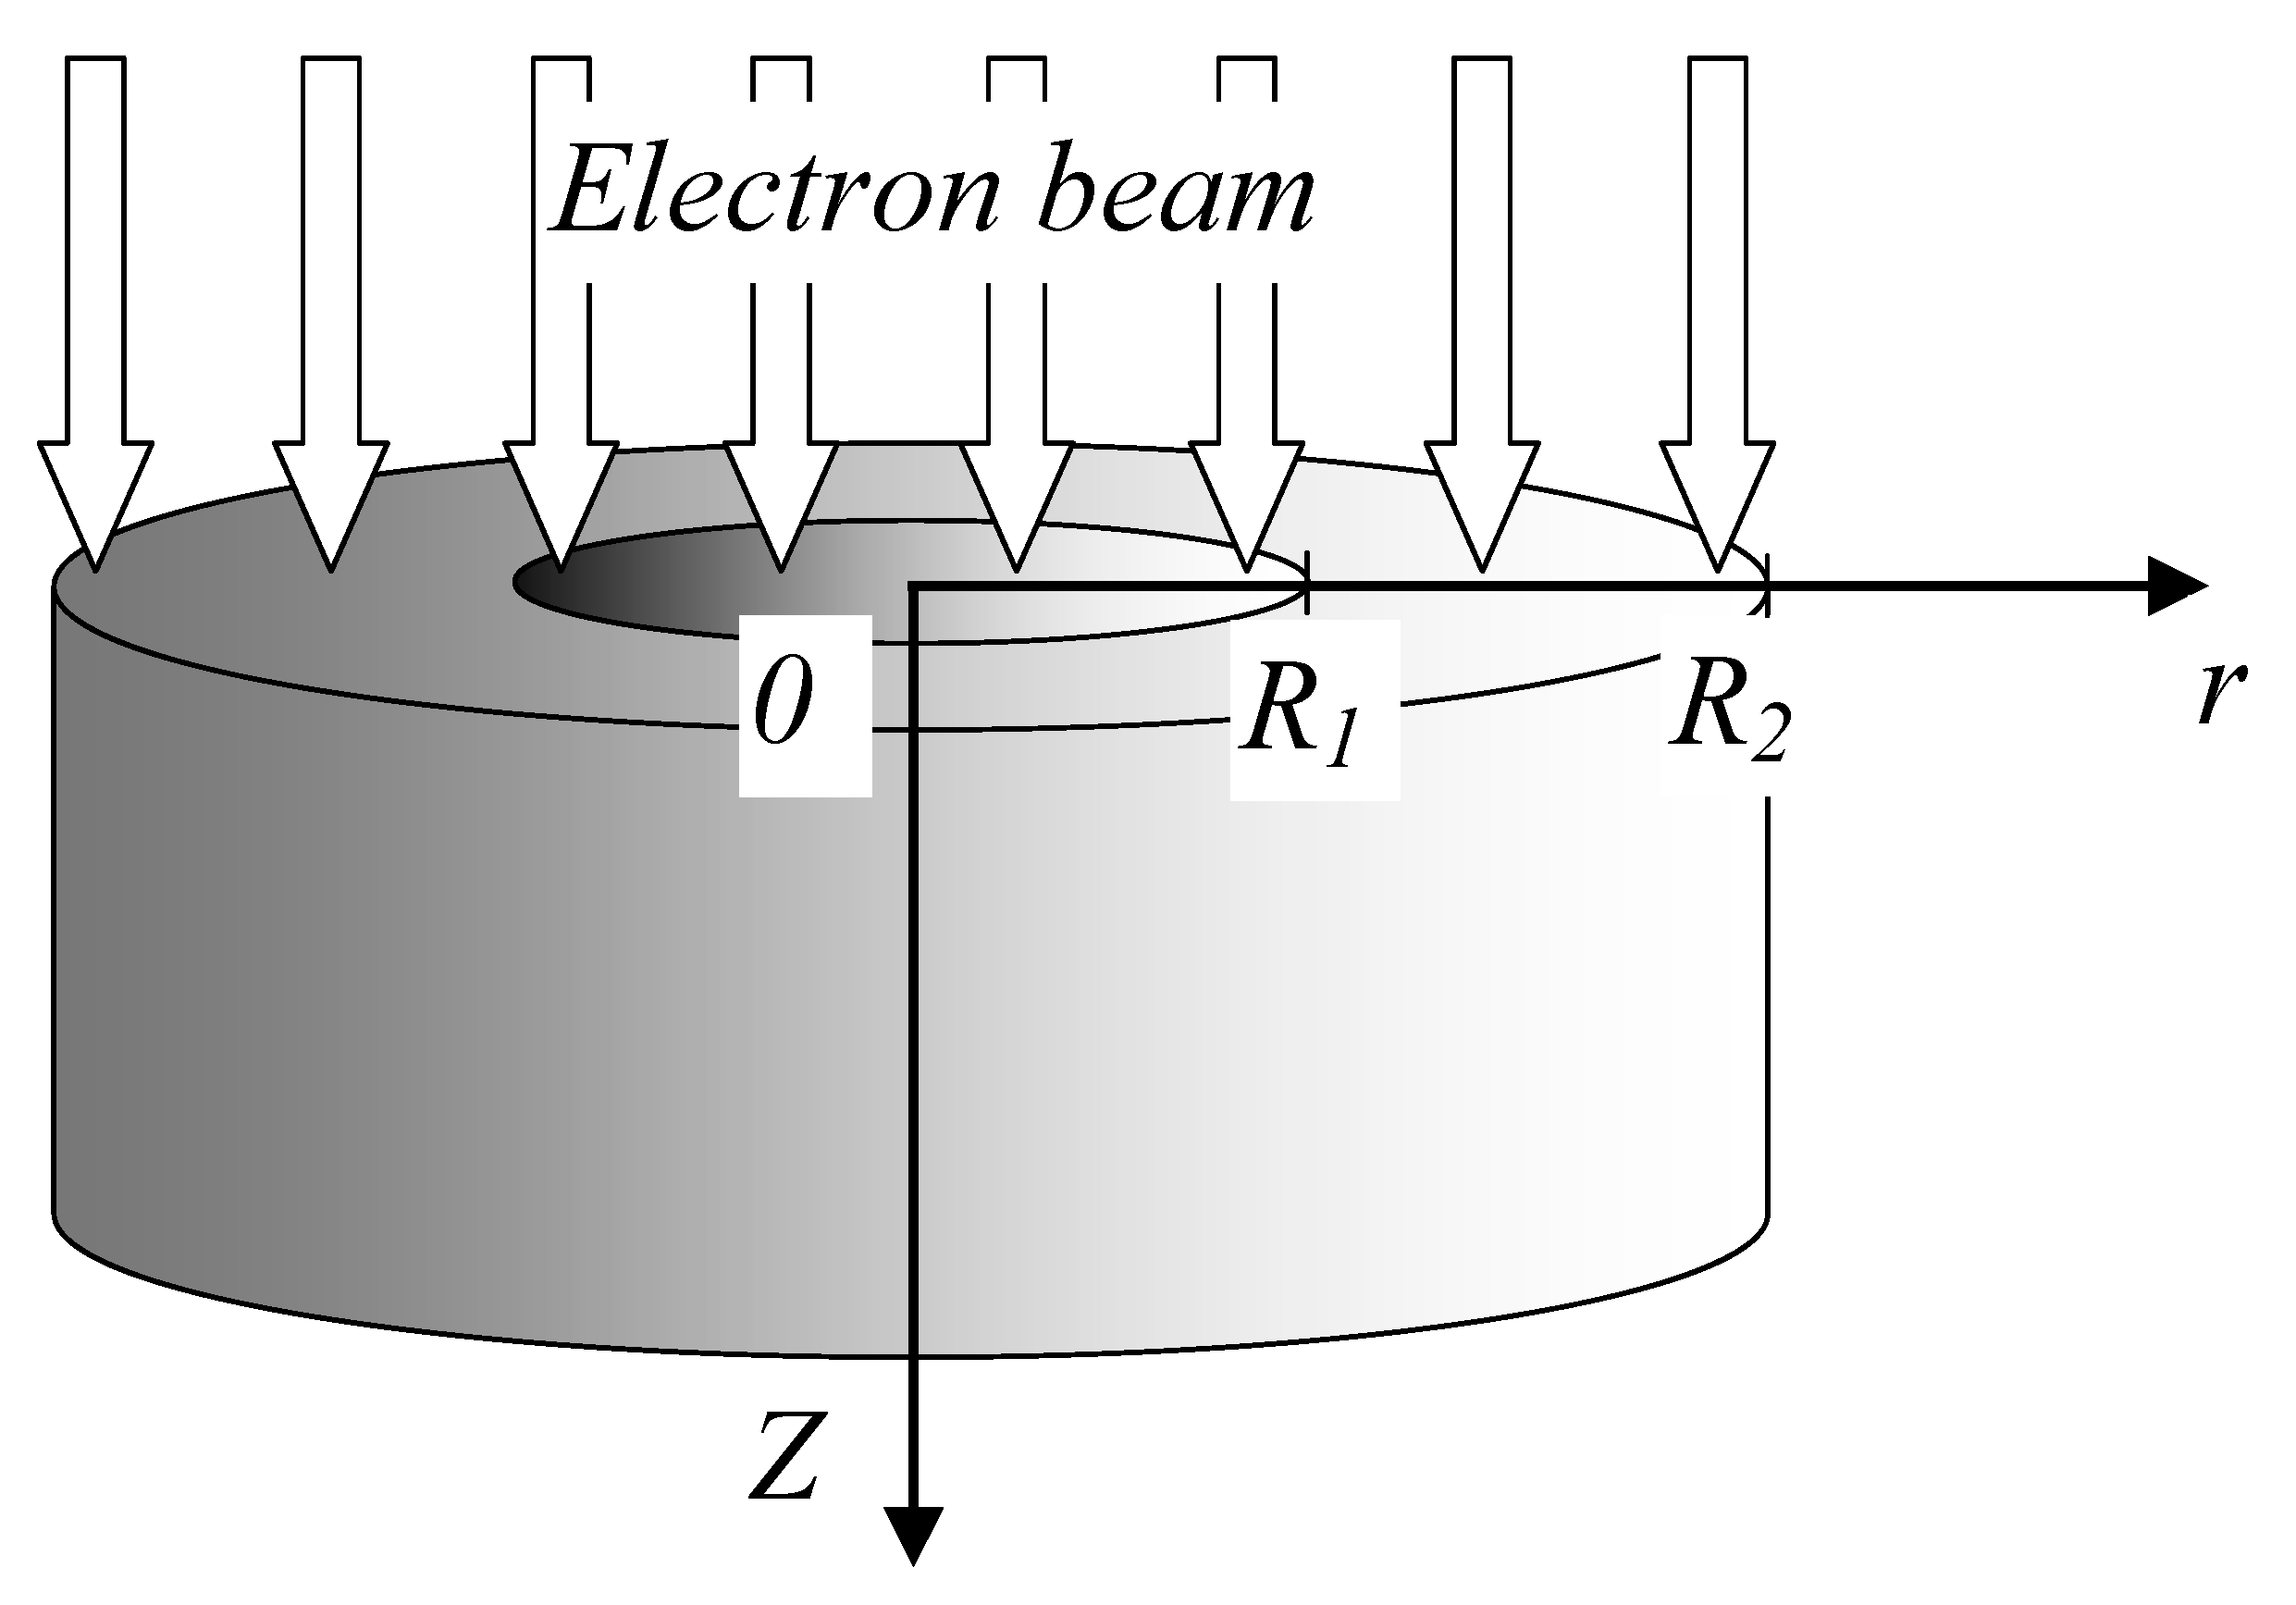
For a complete description of the process, geometric, physical, initial, and boundary conditions were defined. To determine the boundary conditions, radiation from all surfaces of the sample was considered. A uniform electron beam irradiated one of the cylinder's faces, while the other face was placed on a massive crucible. At the initial moment in time, the temperature of the entire sample was at room temperature, which is 30°C.
The irradiation scheme is depicted in
Figure 11. Points R1 and R2 in
Figure 11 represent the inner and outer radii of the ring, respectively. The origin of the coordinate system was placed at the center of the irradiated face.
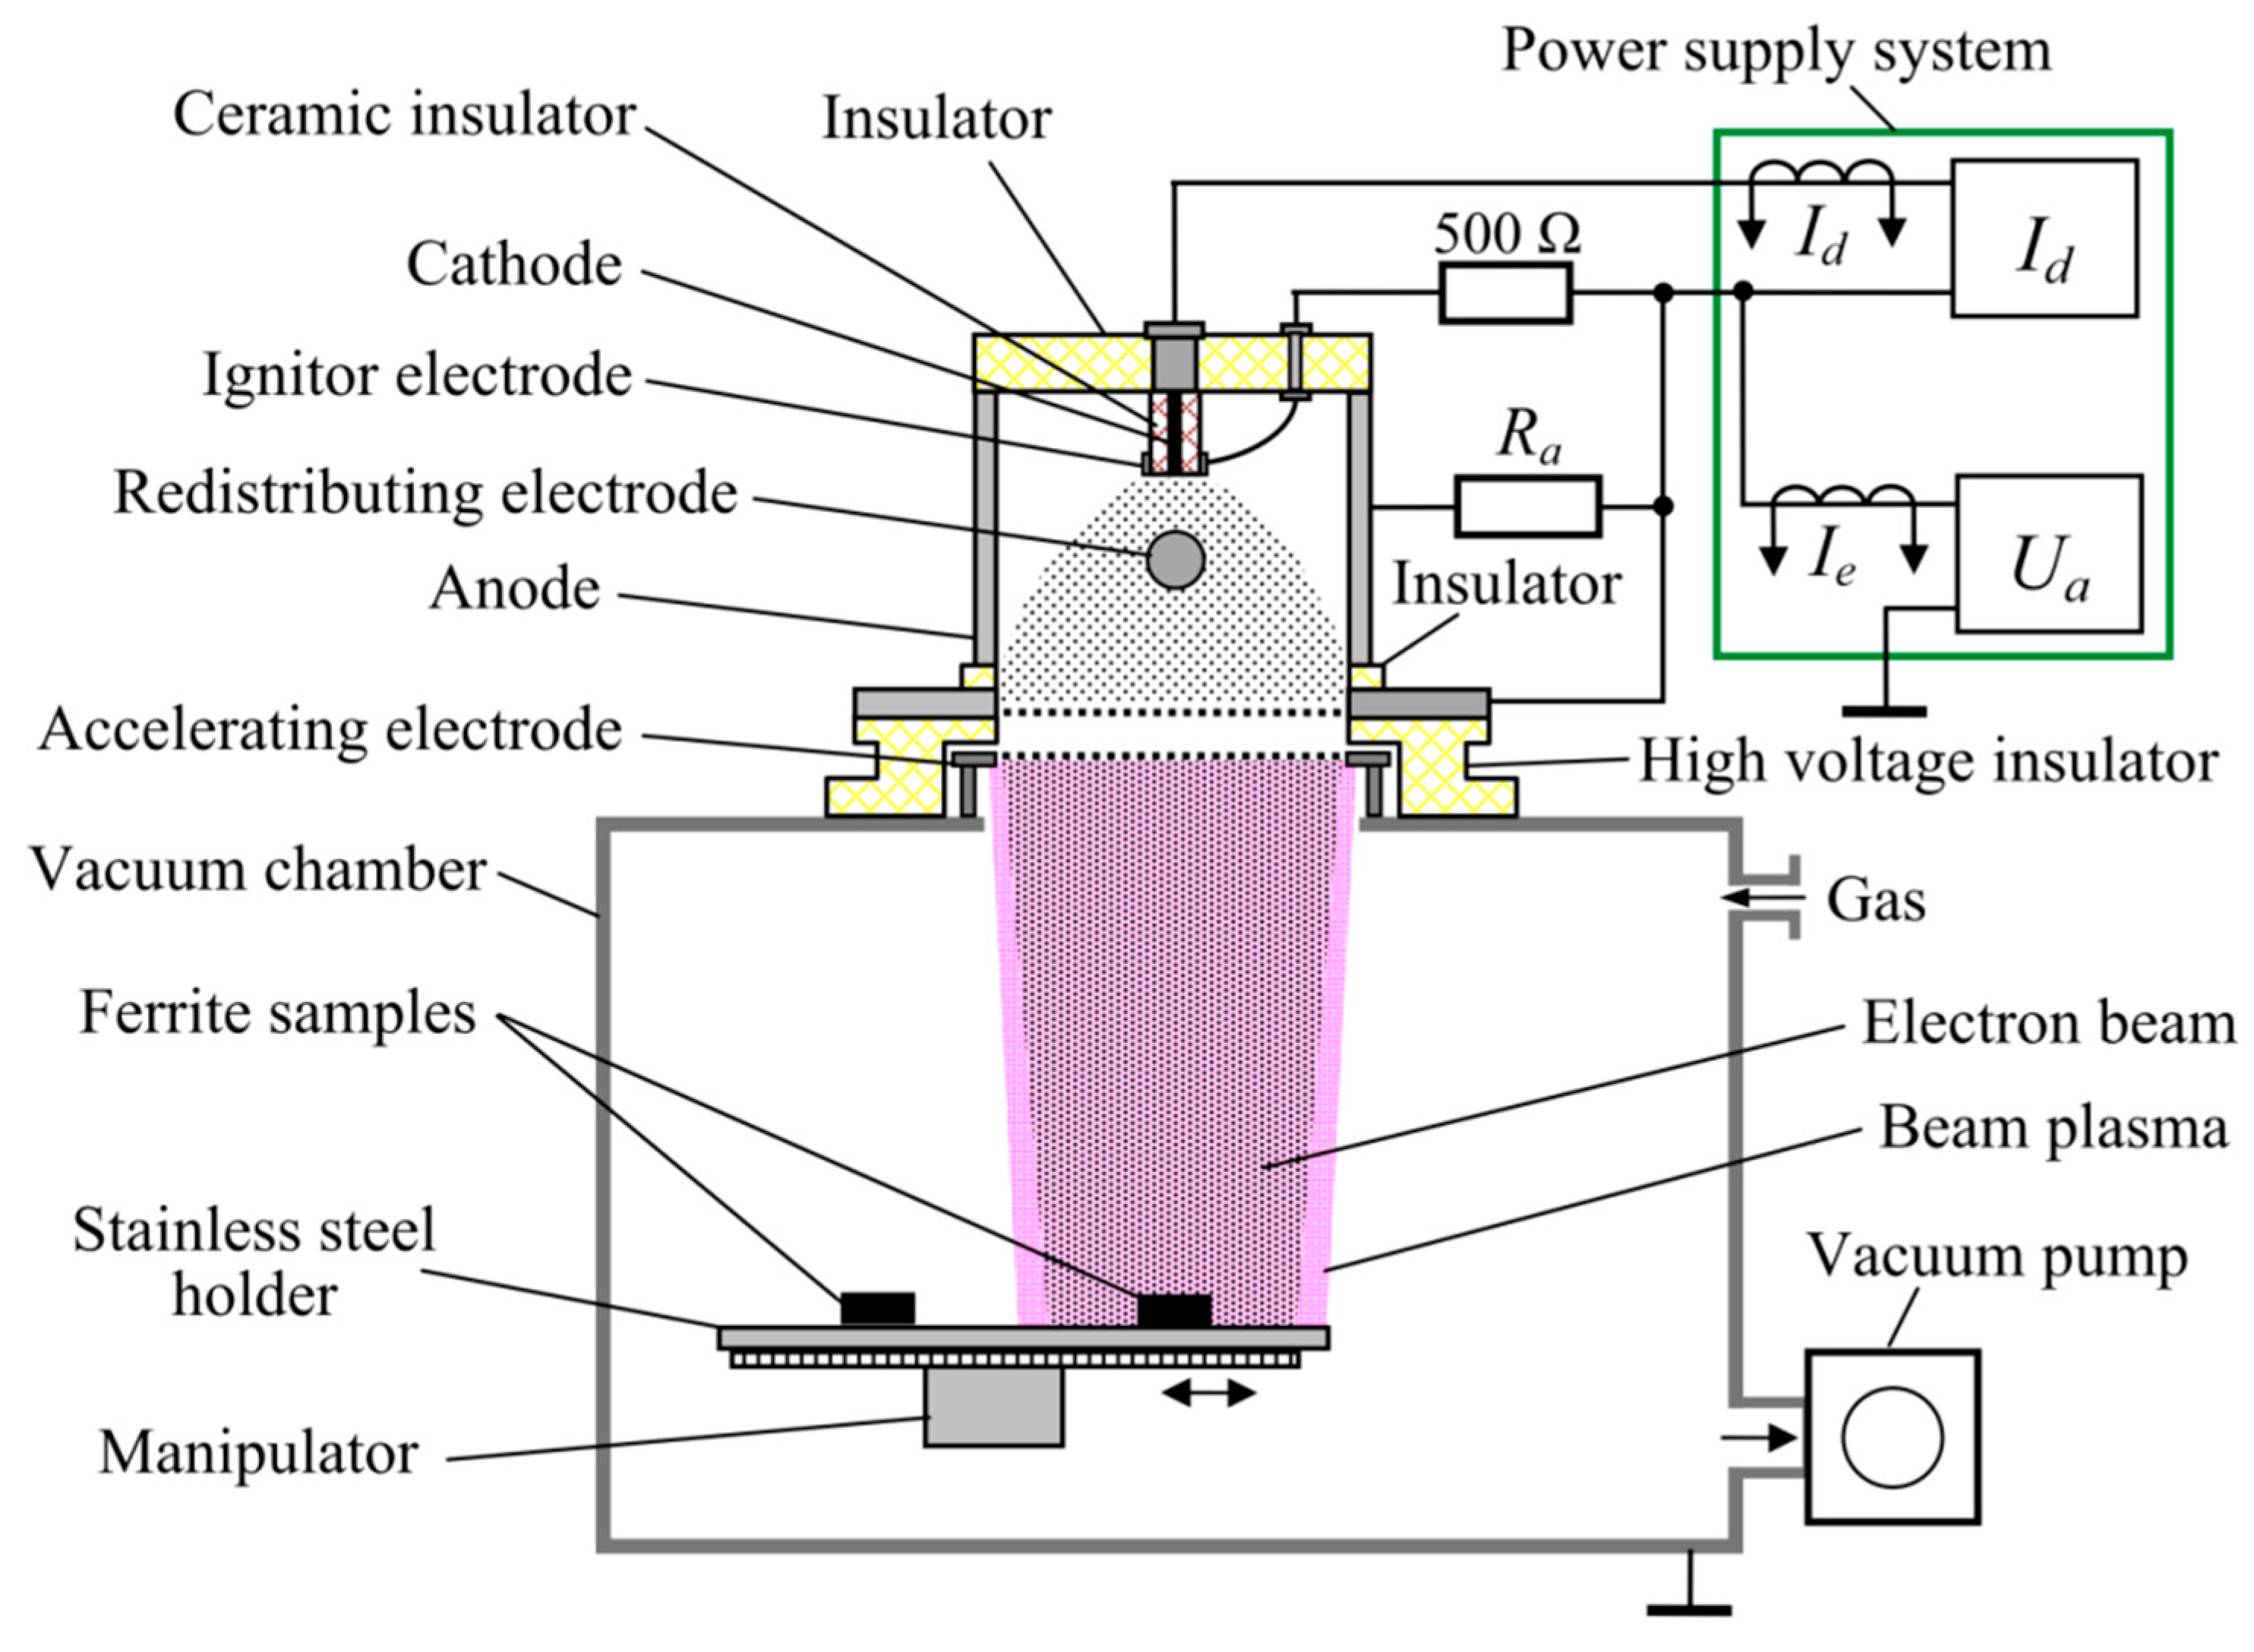
Electron-beam treatment of the ferrite ring in pulsed mode was carried out at a frequency of 0.5 Hz. The emission current of the electron source was Ie = 24 A, the accelerating voltage was Ua = 9 kV, and the diameter of the electron beam was 10 mm. The pulse duration and number of pulses were as in . The parameters of the electron beam during continuous mode treatment were accelerating voltage 8 kV, beam current 20 mA, and beam diameter 10 mm. The heat conduction equation was solved using the finite difference method.
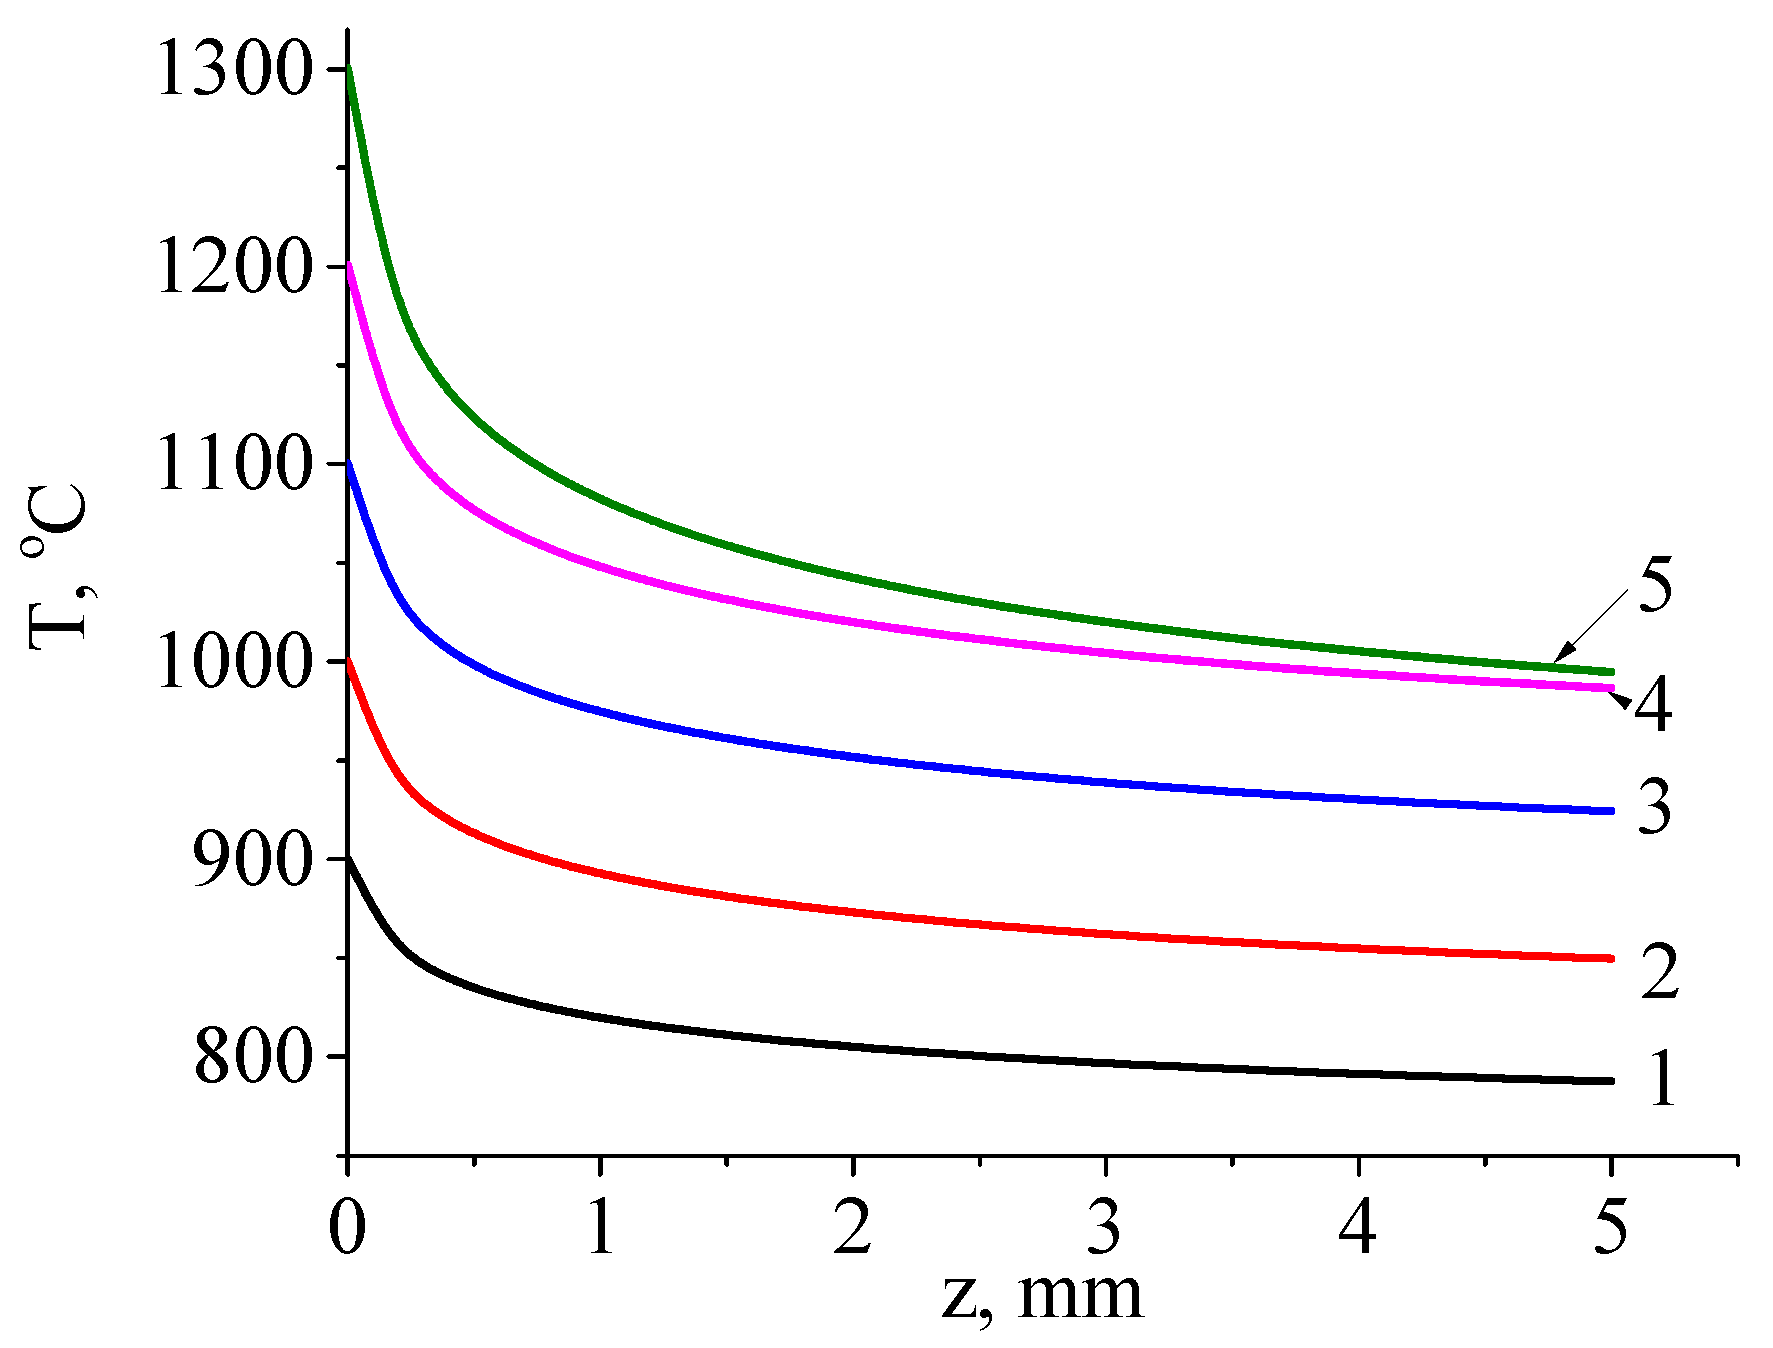
Figure 12 shows the calculated temperature distribution profiles through the thickness of the sample during irradiation with a continuous electron beam under different conditions. The modes were selected to achieve surface temperature ranging from 900 °C to 1300 °C in 100 °C increments.
In
Figure 12, it is evident that as the beam power density increases, the sample temperature rises, and the sample temperature rises, and the temperature drop across its thickness increases from 110 °C (at a surface temperature of 900 °C) to 300 °C (at a surface temperature of 900 °C) to 300 °C (at a surface temperature of 1300 °C). The temperature gradually decreases from the side irradiated by the electron beam to the non-irradiated side. In the case of pulsed mode treatment, the temperature distribution pattern remains similar to the continuous case, but a greater temperature drop is observed from the irradiated to the non-irradiated side.
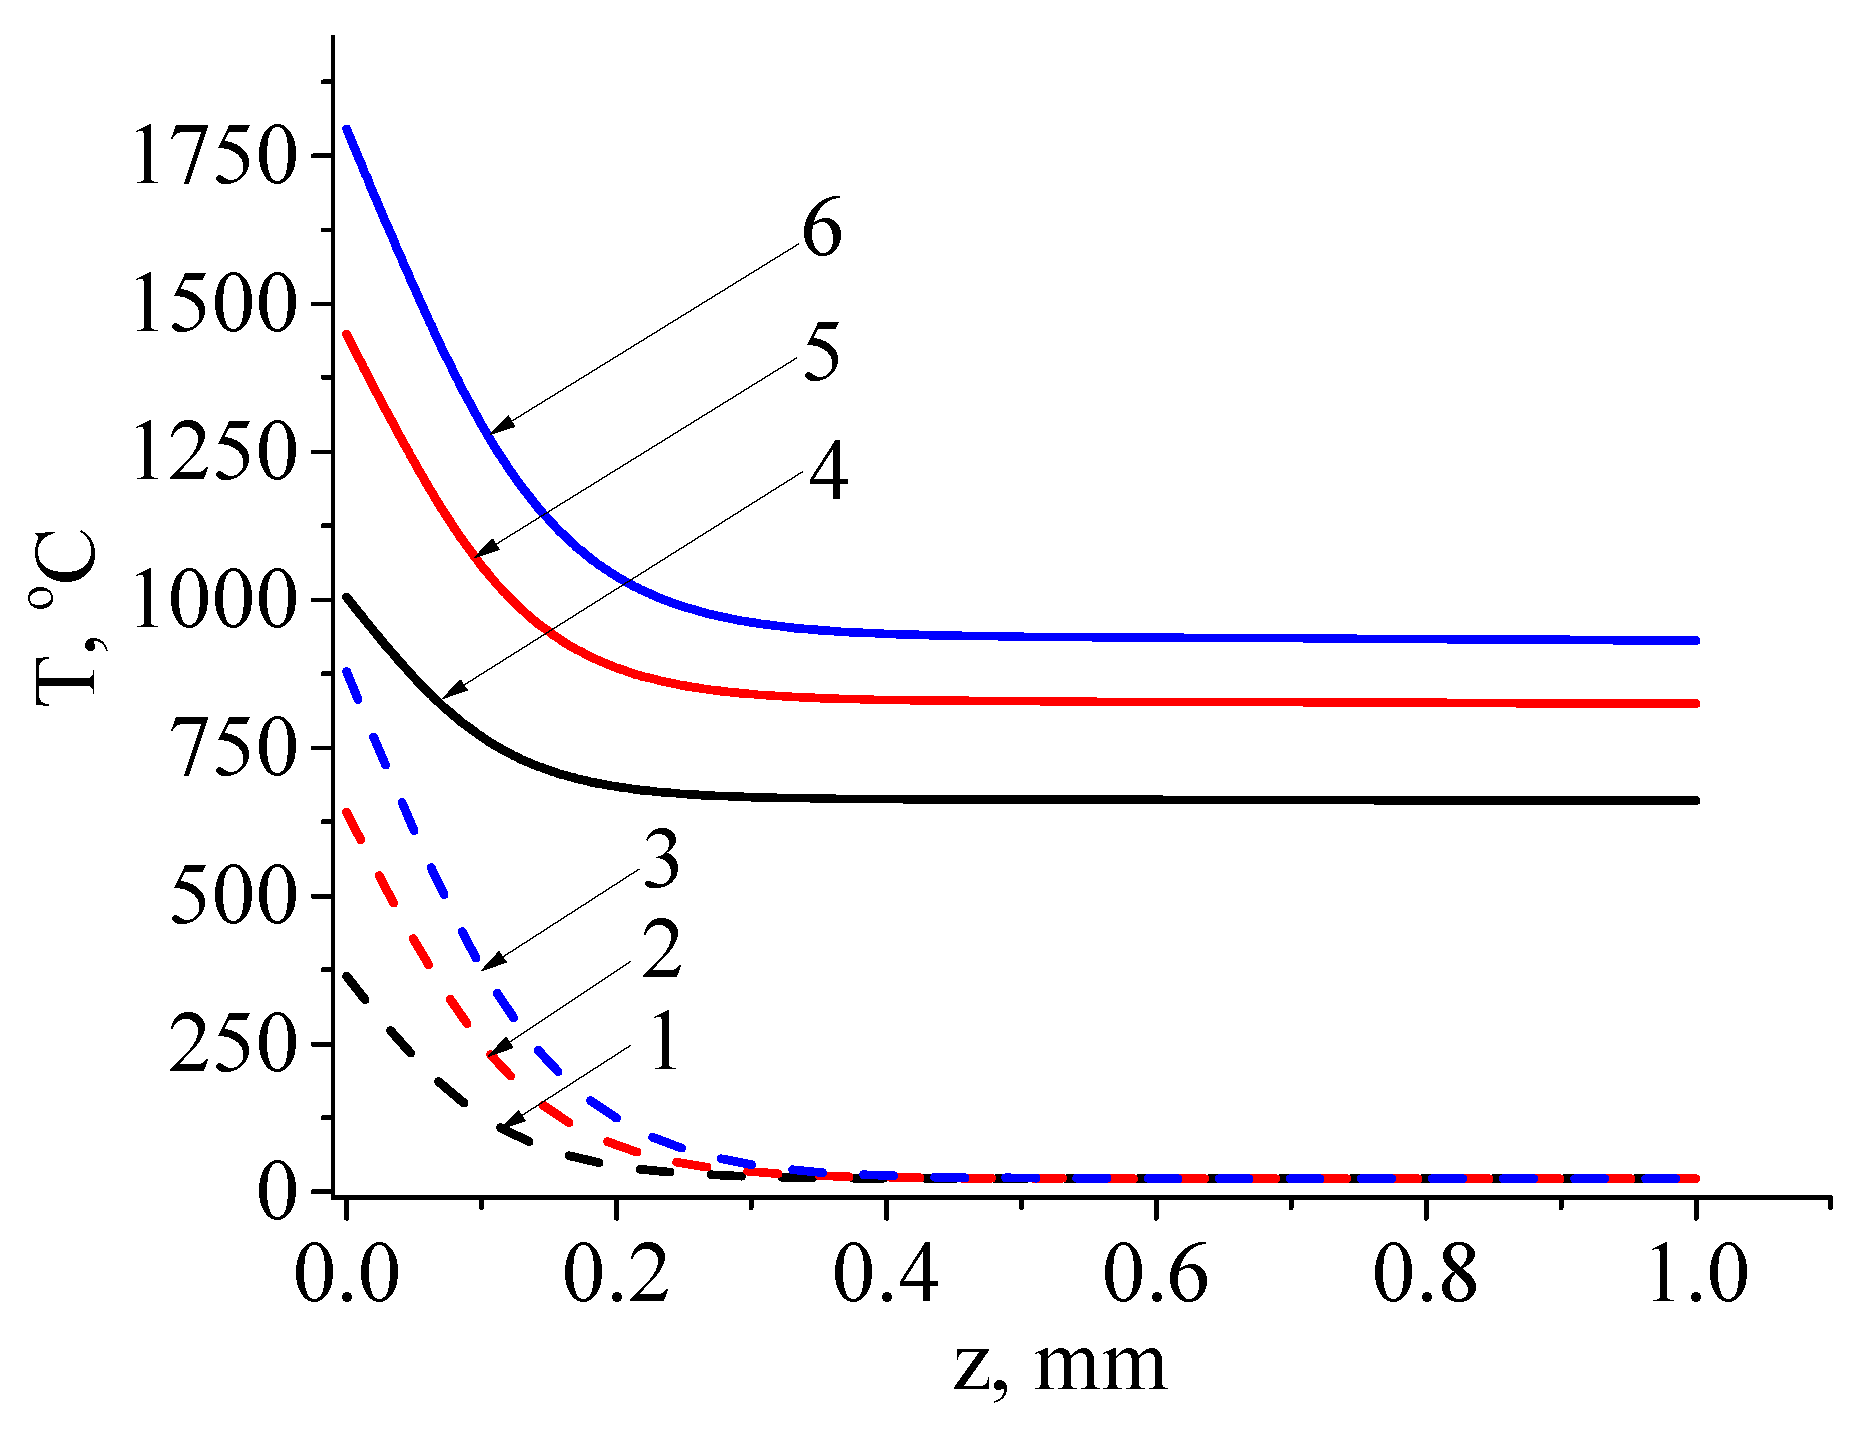
Figure 13 shows the temperature distribution on the inner surface of the ferrite after irradiation with a single electron beam pulse and a series of 500 pulses at pulse durations of 1, 2, and 3 ms. For the single pulse case, the temperature is indicated at the end of the pulse, while for the case of a series of pulses, it is indicated at the end of the 500th pulse.
We see from
Figure 13 that with increasing pulse duration, both surface and bulk temperature of the sample rise. Additionally, the temperature drop between the surface and a layer within the sample, 0.3 mm in thickness, can reach as high as 900 °C for a single pulse and 750 °C after a series of 500 pulses. These values exceed those observed during continuous treatment. Moreover, the temperature values on the surface of the ferrite already approach or exceed the melting temperature (1567 °C) with pulse durations as short as 2 ms, as shown by curve 5 in
Figure 13. This indicates the potential for surface layer melting in the pulse-on time and recrystallization during the pulse-off time, as observed in the form of solidified islands after melting (
Figure 9 b-d). Note also that the temperature distribution after continuous electron beam treatment is more homogeneous, with temperature reductions observed throughout the sample depth. Following pulsed electron beam treatment, the main temperature drop is concentrated within a layer less than 0.3 mm thick.
The differences in surface layer structure and changes in ferrite parameters after continuous and pulse treatments are attributed to variations in the nature of surface heating. Faster heating in pulse mode leads to the formation of solidified and crystallized material islands with lower zinc content. In contrast, in continuous electron beam treatment, the reduction in zinc content is observed across the entire ferrite surface, as confirmed by the decrease in resistance. Within the sample volume, it is apparent that zinc content also undergoes changes, as evidenced by the significant difference in resistance between the irradiated and non-irradiated surfaces.
Figure 14 illustrates the distribution of zinc concentration within ferrite samples after continuous electron beam treatment under different conditions.
The formation of a region with low zinc content indirectly indicates a decrease in resistance in that area and the formation of a more electrically conducting layer. As known [56, 57], the introduction of electrically conducting additives into the composition of ferrite, such as polymers with relatively high conductivity like polyaniline, promotes more pronounced losses and RF-absorbing properties. However, the most effective shielding efficiency is characteristic of materials with low resistance compared to ferrites. By completely reflecting electromagnetic waves, it is possible to reduce the intensity of electromagnetic radiation to zero. The presence of an electrically conducting layer in the treated material can contribute to effective electromagnetic wave shielding and expand the scope of electron beam irradiation in the creation of RF-absorbing and RF-reflecting materials.
