1. Introduction
1.1. Instrument Overview
Air pollution has always been an interesting topic worldwide [
1,
2,
3], especially in China. A haze covers most parts of the country, which has raised attention to a new stage since 2012. Most of the air pollutants are absorptive aerosols [
4], mainly including dust storms, ash clouds, brown clouds, and haze. The primary purpose of absorbed aerosol sensors (AAS) [
5,
6] is to obtain the optical thickness of the aerosols and the absorbing aerosol index by detecting solar backscattering radiance in the ultraviolet and visible range.
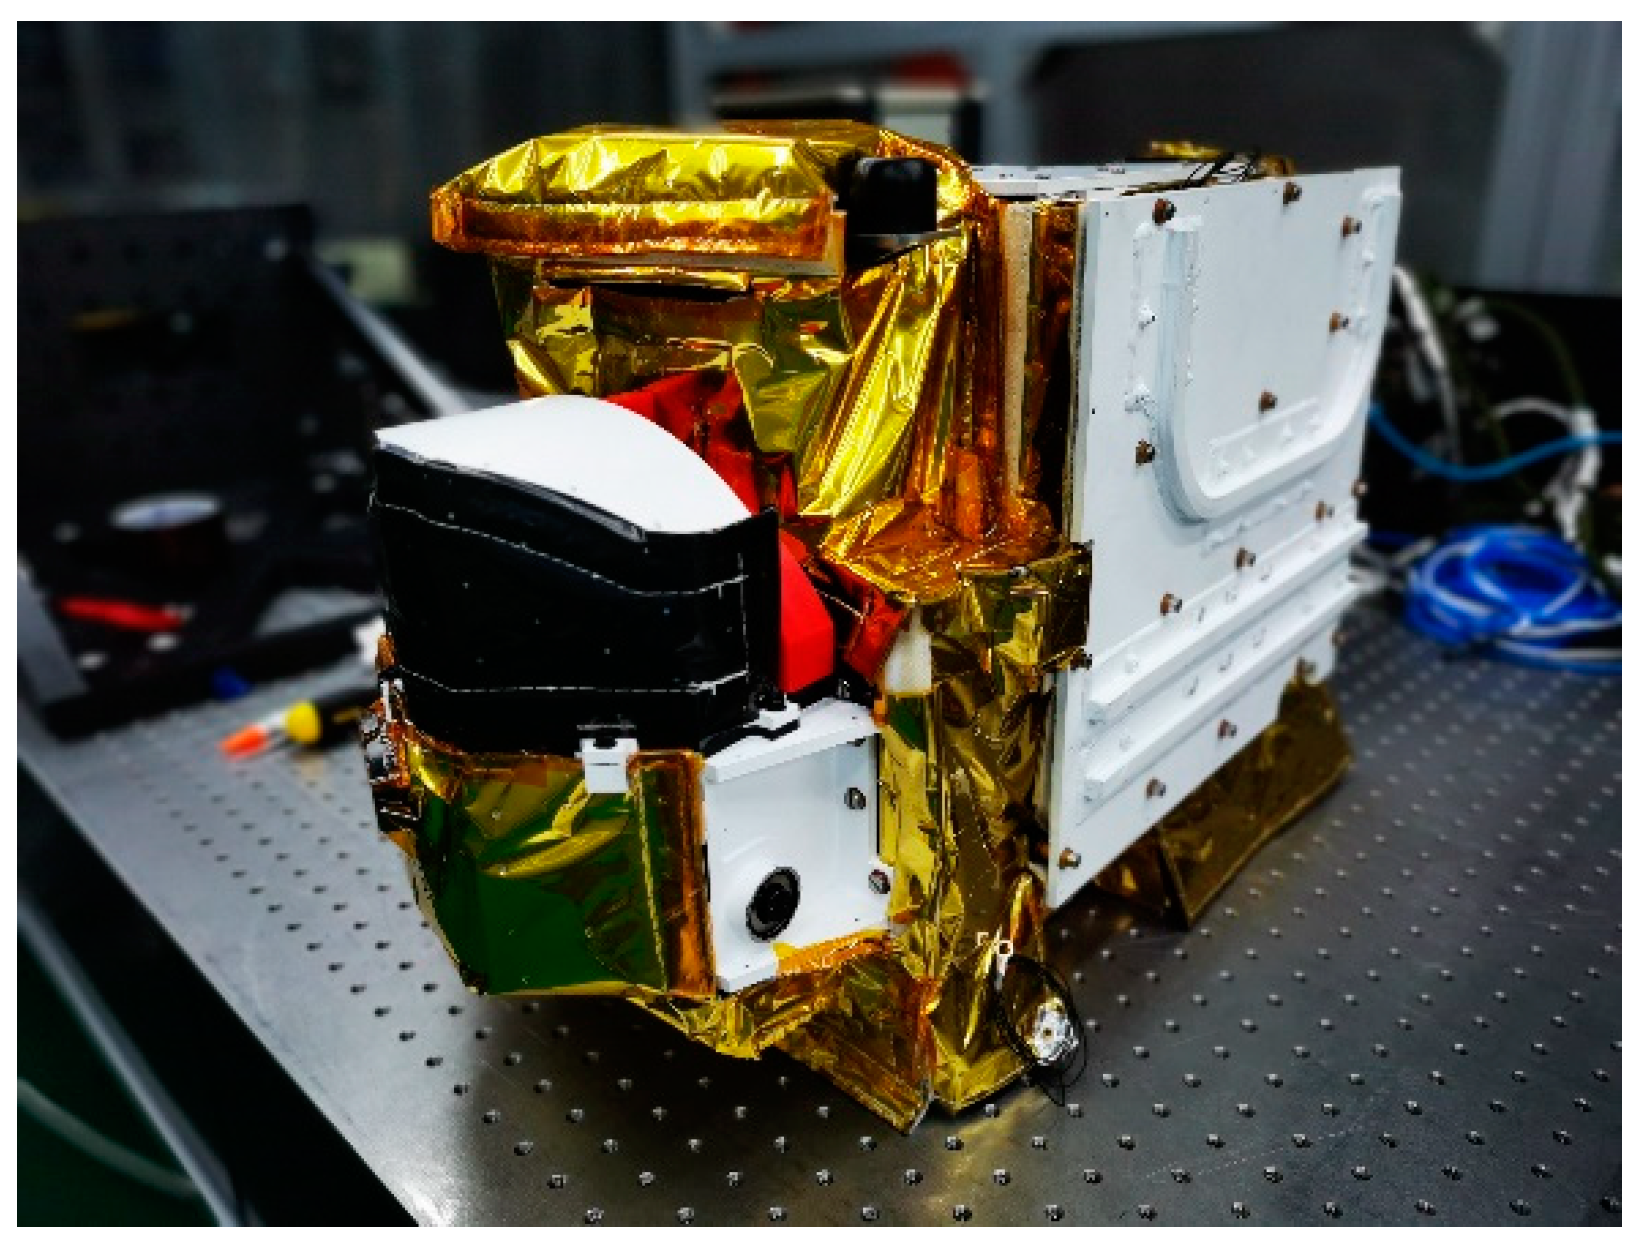
The spectral range of the AAS changes from 340 to 550 nm. The spectral resolution differs from 1.7 to 2 nm. The pixel size of the CCD is 22.5 μm × 22.5 μm. The field of view (FOV) crossing the orbit direction is 114°. Thus, daily global coverage is thus made feasible. In the flight direction, the FOV is 0.17°. As a result, the footprint relating to the nadir direction on Earth is about 4 km × 4 km (0.325° × 0.17°). Except for the nadir mode, the AAS contains a Sun port for in-orbit calibration employing two diffusers. The diffuser enables the illumination of the spectrometer’s entrance slit whether irradiated by the Sun or an internal white light source. Calibration is carried out at all wavelengths and a total FOV of 114°. A photograph of the AAS is given in
Figure 1.
AAS main specifications are summarized in
Table 1.
This paper includes four sections. Following the introduction and the instrument description in
Section 1, the calibration equipment and procedure are introduced in
Section 2,
Section 3 present the results of spectral calibration, which have good characterisation of the instrument. The conclusions are presented in
Section 4.
1.2. The Spectral Calibration
The wavelength calibration [
7,
8] and confirmation of the SRF [
9,
10,
11] are the components of spectral calibration. To establish a characteristic wavelength for each detector pixel, the objective of the wavelength calibration is to also yield a wavelength map
λ(
xij) (where
xij is a detector pixel). The characteristic wavelength of a pixel is defined as the wavelength for which the response of the central peak of the instrument resides at the center of the specified pixel.
The monochromatic image at the entrance slit of the spectrometer, located upon the detector, is represented by the slit function [
12]. The latter describes the spectral response of each pixel for varying wavelengths. The SRF is modeled concerning a function
y(d
λ), in which
y denotes a detector pixel and d
λ represents the difference between the pixel characteristic wavelength and reference wavelength in nanometers (nm). The former wavelength is known as the source wavelength, for which the central peak of the instrument response is located at a specified pixel. Concerning all the wavelengths and accurate knowledge of the SRF, the FOV is crucial for the products and spectral calibration.
Different from conventional slits, the AAS is employed as a slit homogenizer [
13,
14,
15,
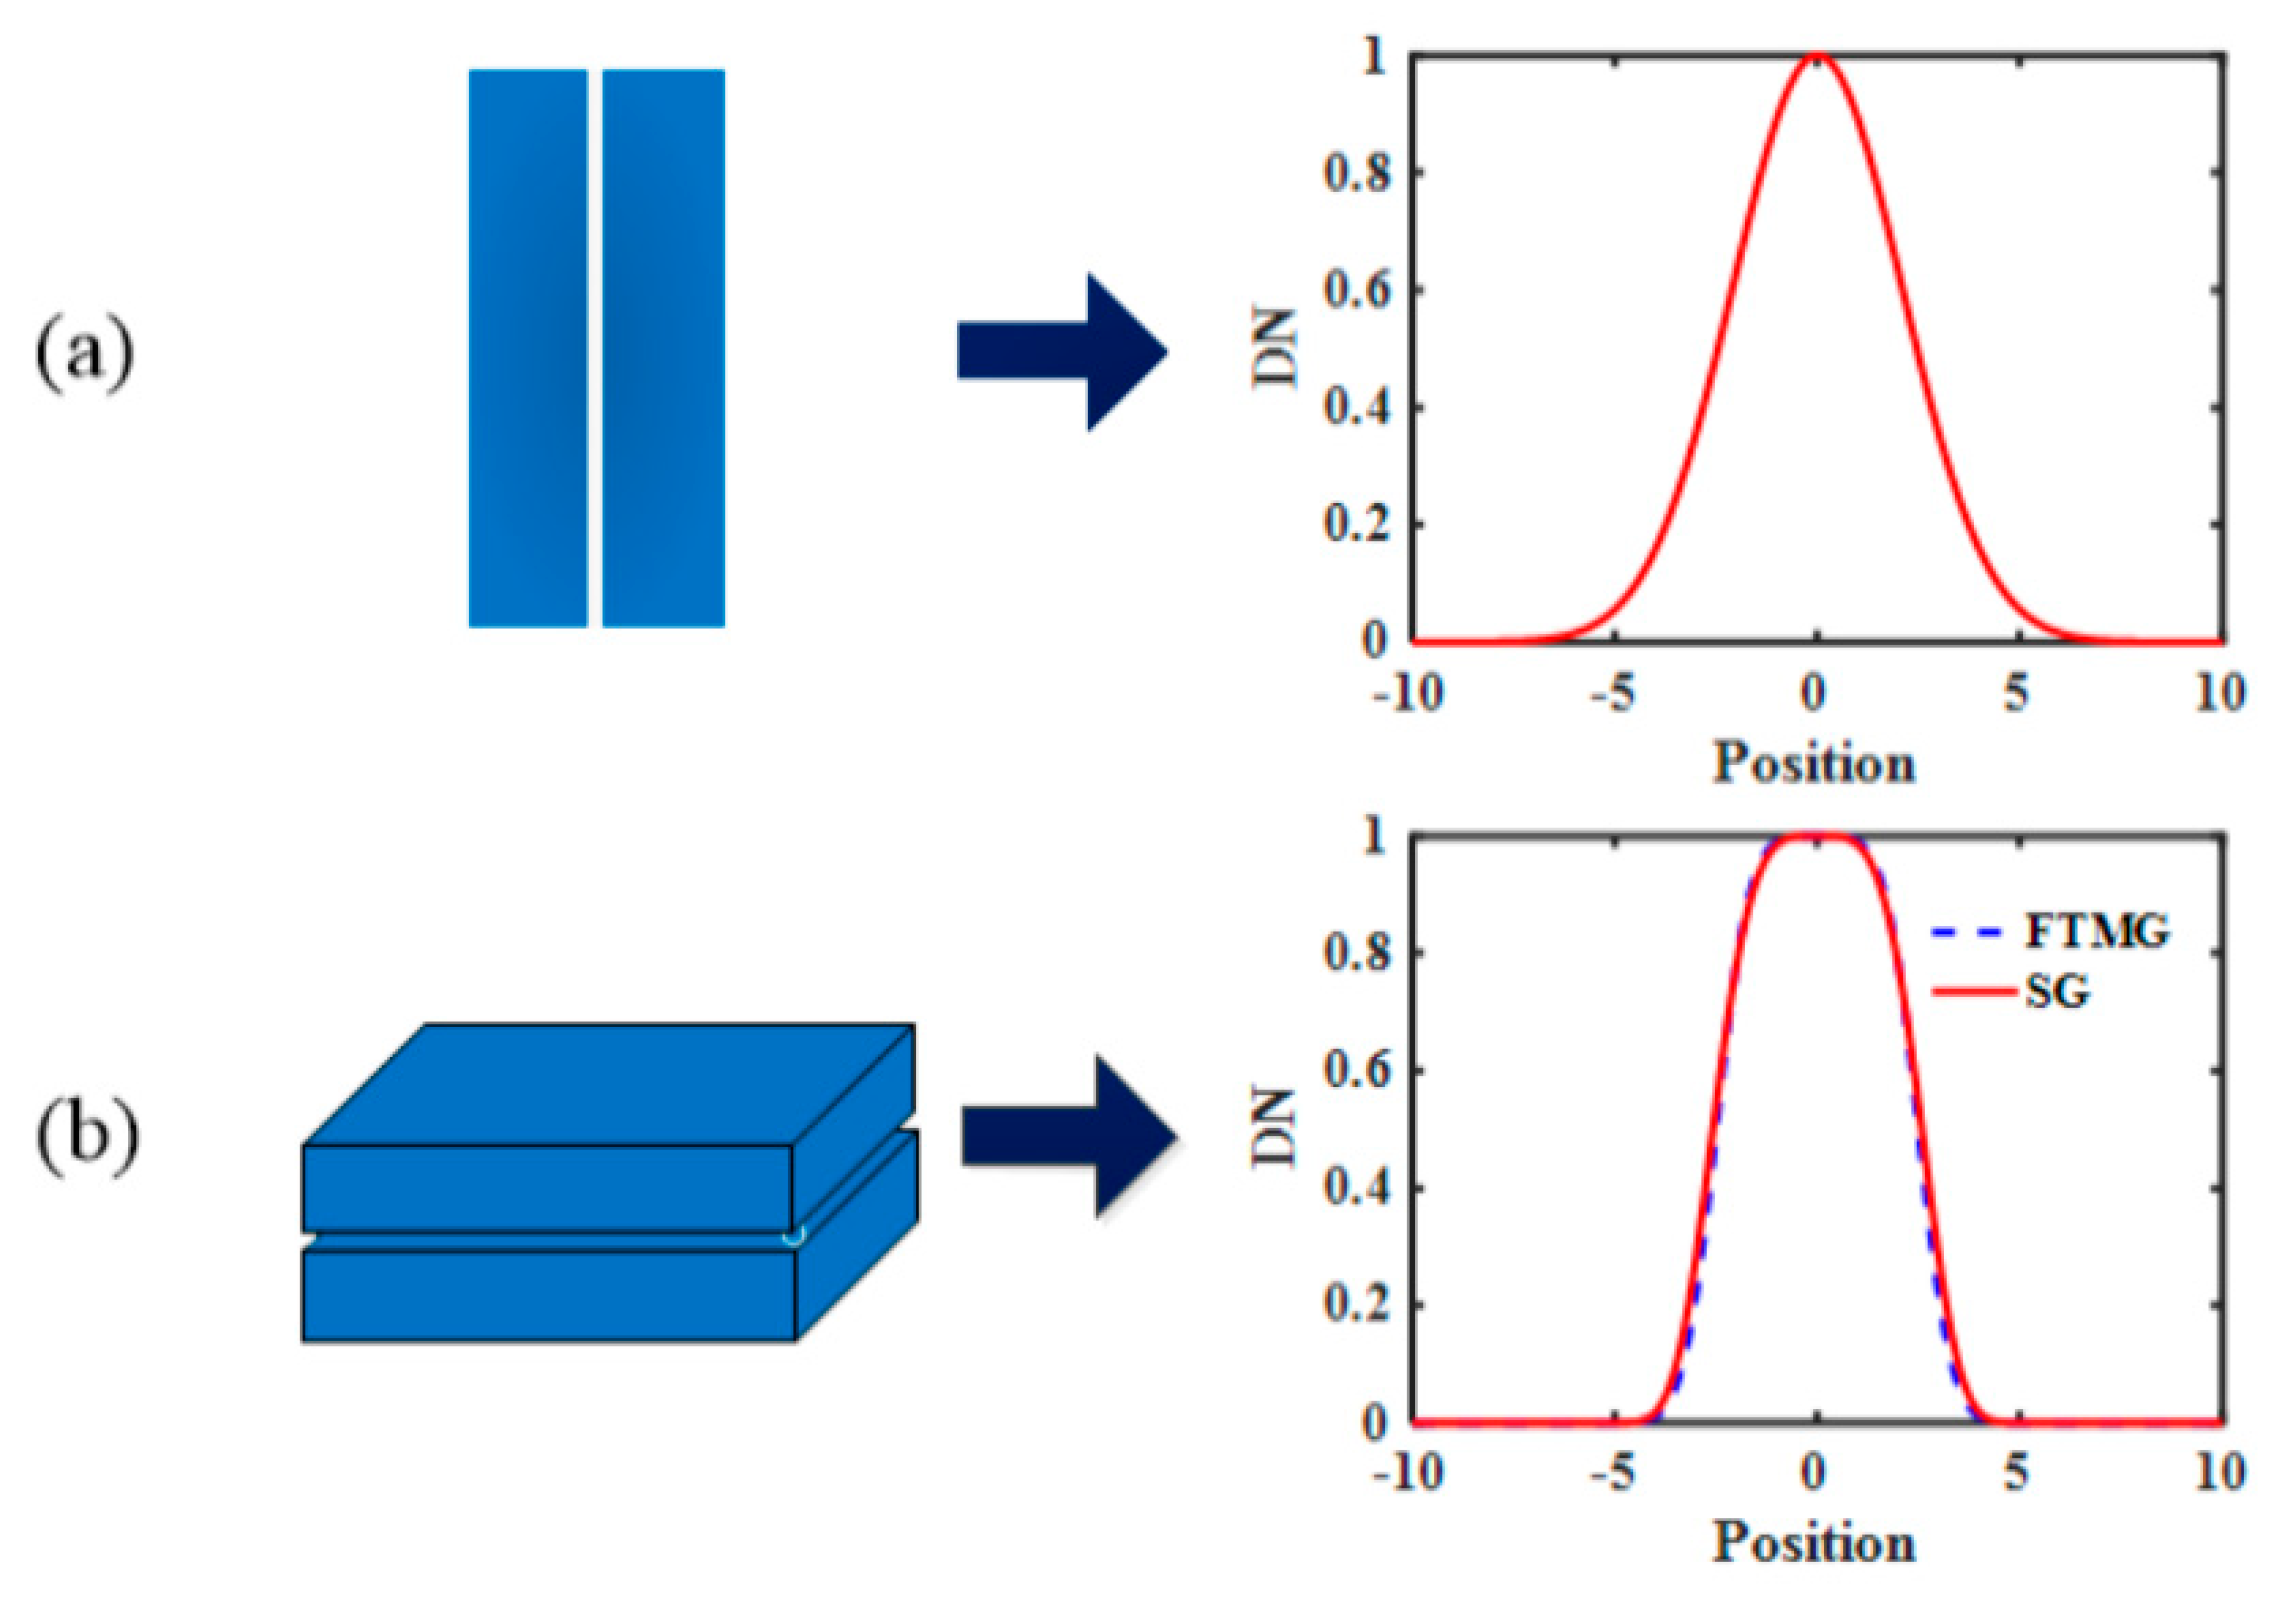
16], which has an SRF that is not a conventional Gaussian curve [
12,
13], as shown in
Figure 2. The SRF of the slit homogenizer is a flat-topped multi-Gaussian function. Considering the convenience of fitting, a super-Gaussian function, which looks like a similar distribution to the flat-topped multi-Gaussian function, is utilized to fit the measured data in a spectral calibration.
Figure 2 depicts that the SRFs are different when distinct slits are used. The application of the slit homogenizer could make the spectral direction imaging (along the orbit direction) more uniform, which means that different wavelengths approach the same shape and full width at half maximum (FWHM). To accurately acquire the slit function of different wavelengths, a dedicated slit function instrument (SFI) has been developed [
12]. The SFI comprises an echelle grating monochromator, which can simultaneously produce several spectral lines at small intervals. Using a 300 W xenon arc lamp (Hamamatsu super quiet) as a light source, the slit function measuring instrument adopts an echelle grating light splitting mode. Through the secondary scattering by the spectrometer, the emergent light forms a multiline on the image surface. It can advantageously obtain the SRF of multiple spectral lines in the working band of the instrument simultaneously and is distributed evenly, improving the testing accuracy and reducing the operational complexity.
In this paper, the spectral calibrations of the AAS are carried out before being launched. The measurements are taken over the 340–550 nm spectral range with a FOV of 114°. The calibration is performed in a thermal vacuum environment, while the wavelength shift and the SRF dependent on temperature are analyzed.
2. Methods
2.1. Equipment for Calibration
The spectral calibration includes carrying out two main factors: the slit function measuring instrument (SFI) and the wavelength registration. The wavelength registration is performed in the Sun port, while the SRF is measured in the Earth port. To ensure the validity of the calibration data, the AAS on a rotating platform is placed in the vacuum chamber during the calibration. The vacuum level of the system is 6 × 10⁻⁴ Pa, and the temperature of each part of the AAS is controlled by the operating temperature of the satellite.
A spectral line source prompts a limited quantity of spectral characteristics with well-known wavelengths and low spectral bandwidths. Thus, measurements taken using this source produce extremely precise information on the pixel wavelengths close to the wavelengths of the spectral lines that are employed. However, for detector pixels involving wavelengths in-between spectral lines, the characteristic wavelength of the detector pixels must be estimated by interpolation. Since spectral line sources generate extra spectral lines for a wavelength close to a spectral line wavelength, an estimation of the central position of the spectral line response may be distorted. It is imperative to choose the appropriate spectral line source. So, four forms of spectral line sources are employed: a mercury (Hg) [
17] type lamp, an argon (Ar) [
18] type lamp, a krypton (Kr) [
19] lamp, and a Neon (Ne) [
20] lamp.
To enable an accurate measure of the SRF, an optical source was designed that employs an echelle grating to generate an output beam that contains around 30 spectral peaks within the wavelength ranging in 340–550 nm, which relates to a substantial amount of diffraction orders for the echelle grating. Such peaks are spectrally well displaced and have a spectral width that is around a hundred times narrower when compared to the spectral resolution of the AAS. The absolute wavelength for the SFI lines is determined by the use of a wavelength calibration of the AAS. On the rotation of the echelle grating, the wavelengths of the lines that are produced may be stepwise shifted by 0.05 nm. The detector pixel’s response to an echelle peak produces the spectral slit function for the relevant pixel. The rotation of the echelle grating provides the shape of the spectral slit function. This is measured with a greater sampling and higher accuracy when compared to those determined using a spectral line source, for which the accuracy is limited by the pixel sampling of the detector’s spectral resolution. Because of the extensive FOV of the AAS, the calibration is performed on a rotating platform, and the results can also be calculated for the spectral smile of the AAS. The stimulus properties for the test are given in
Table 2.
2.2. Calibration Setup
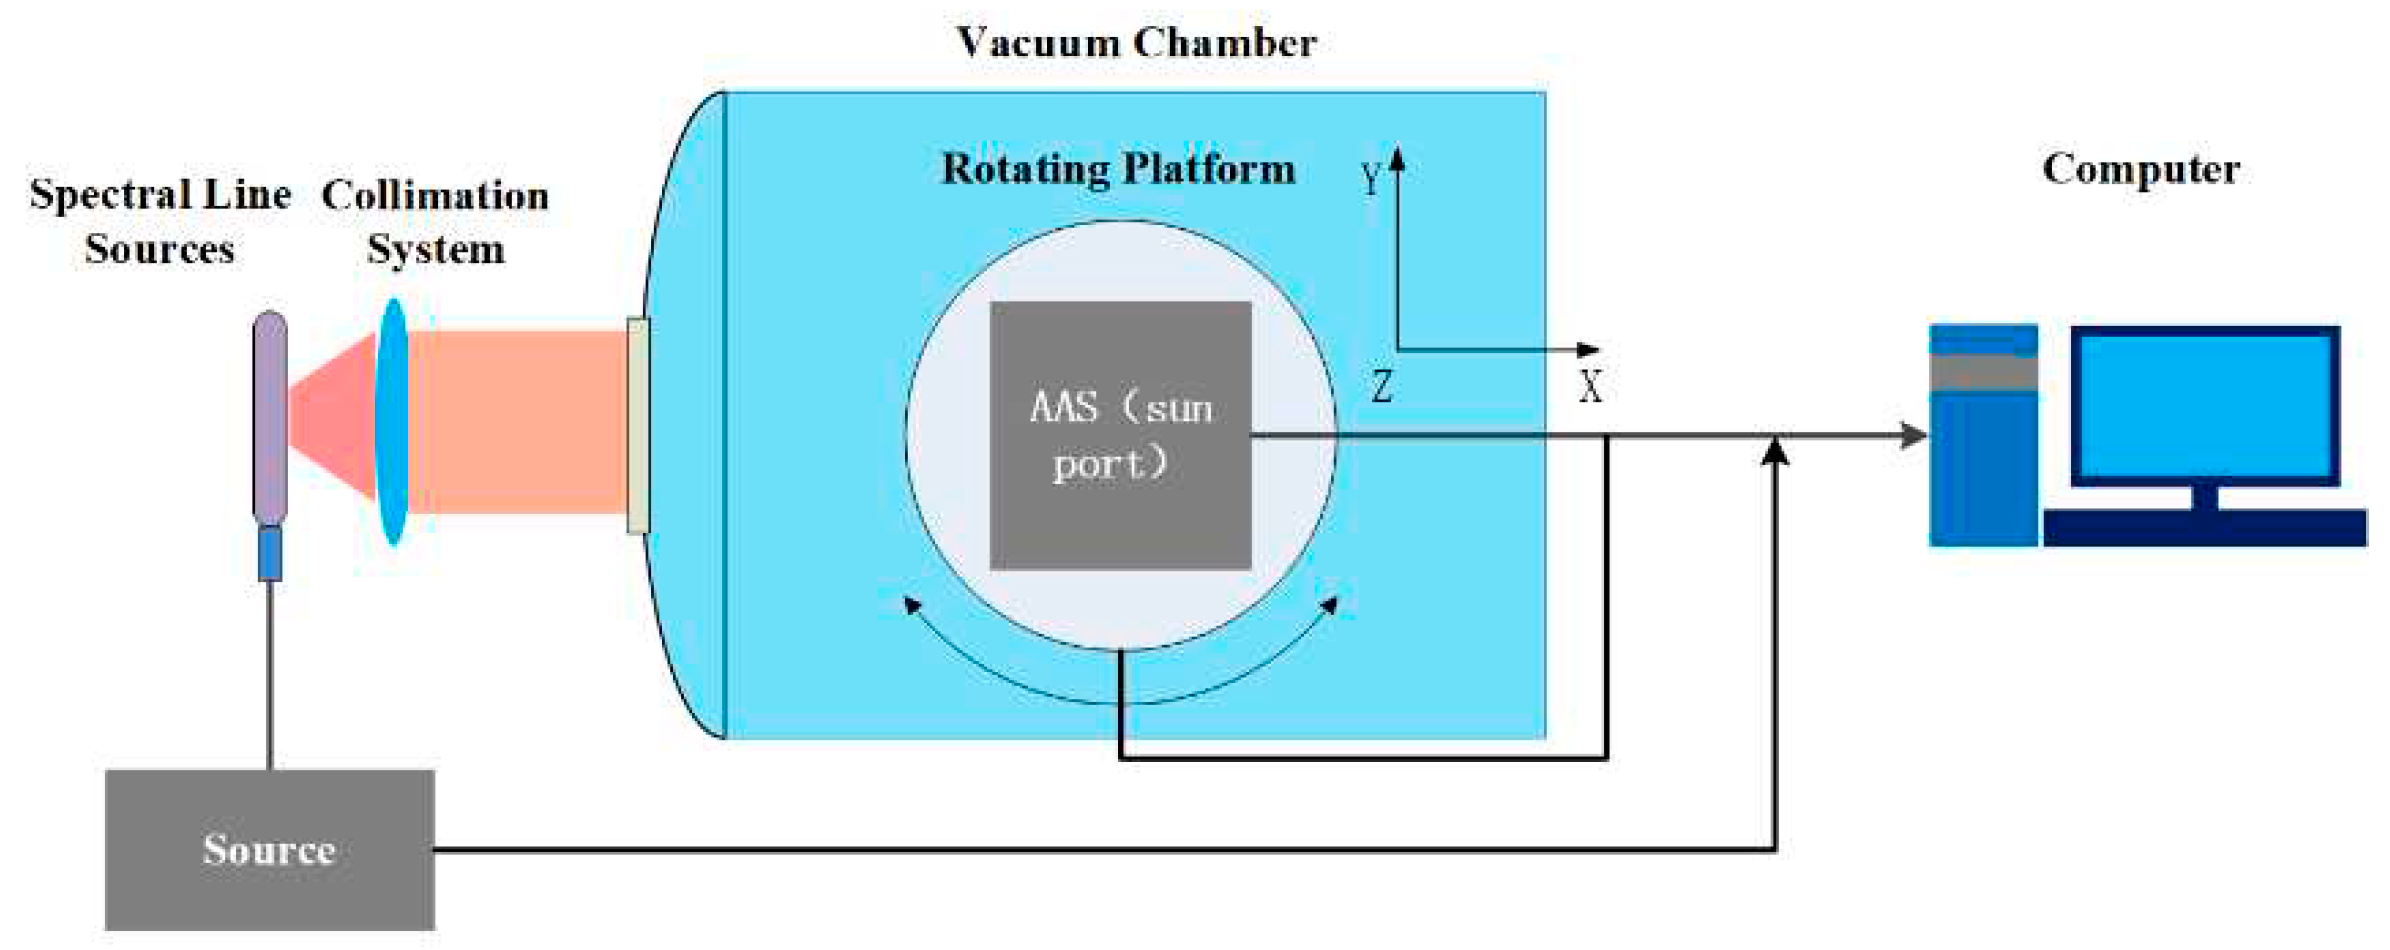
Due to the spectral smile not differing with wavelength, it is necessary to calibrate all pixels of the AAS in FOV to obtain the wavelength map. However, the wavelength calibration measurements of the Sun port have a relatively low SNR; thus, the wavelength calibration is unworkable when offsetting for the deficiency. Therefore, a special collimating system has been designed for the spectral line source that improves the luminous flux. The experiment setup is shown in
Figure 3. Multiple spectral lines of the spectral sources are detected by the AAS, as shown in
Figure 4. According to the known spectrum, the wavelength of the other pixels can be obtained by interpolation or the least squares fitting method.
The SRF calibration is performed from the Earth port. To obtain the SRF in FOV, a rotatable turntable is required. A depiction of the SRF calibration is shown in
Figure 5. The SRF is obtained by two different methods: while one is the AAS response to a single narrow wavelength that relates to a single echelle angle measurement, the other is via rotation of the echelle grating, in which the wavelengths of the lines that are produced can be stepwise shifted by 0.1 nm. The designed spectrum sampling frequency is a spectral resolution corresponding to 4 pixels of the AAS, and the pixel size of the CCD is 22.5 μm × 22.5 μm. Therefore, the SRF with low sampling points could be obtained using the first method. The rotation of the echelle grating provides the shape of the spectral slit function. The latter is measured by employing more sampling and higher accuracy when compared to utilizing a single echelle angle, where the accuracy is limited due to the pixel sampling of the spectral resolution via the detector. Given a field, the SRF for each pixel can be obtained by fitting these sampling points with a super-Gaussian, and the FWHM of the SRF represents the spectral resolution of the AAS. Furthermore, the spectral smile of a specific wavelength could be obtained by utilizing a rotating platform.
3. Results and Discussion
3.1. Wavelength Calibration
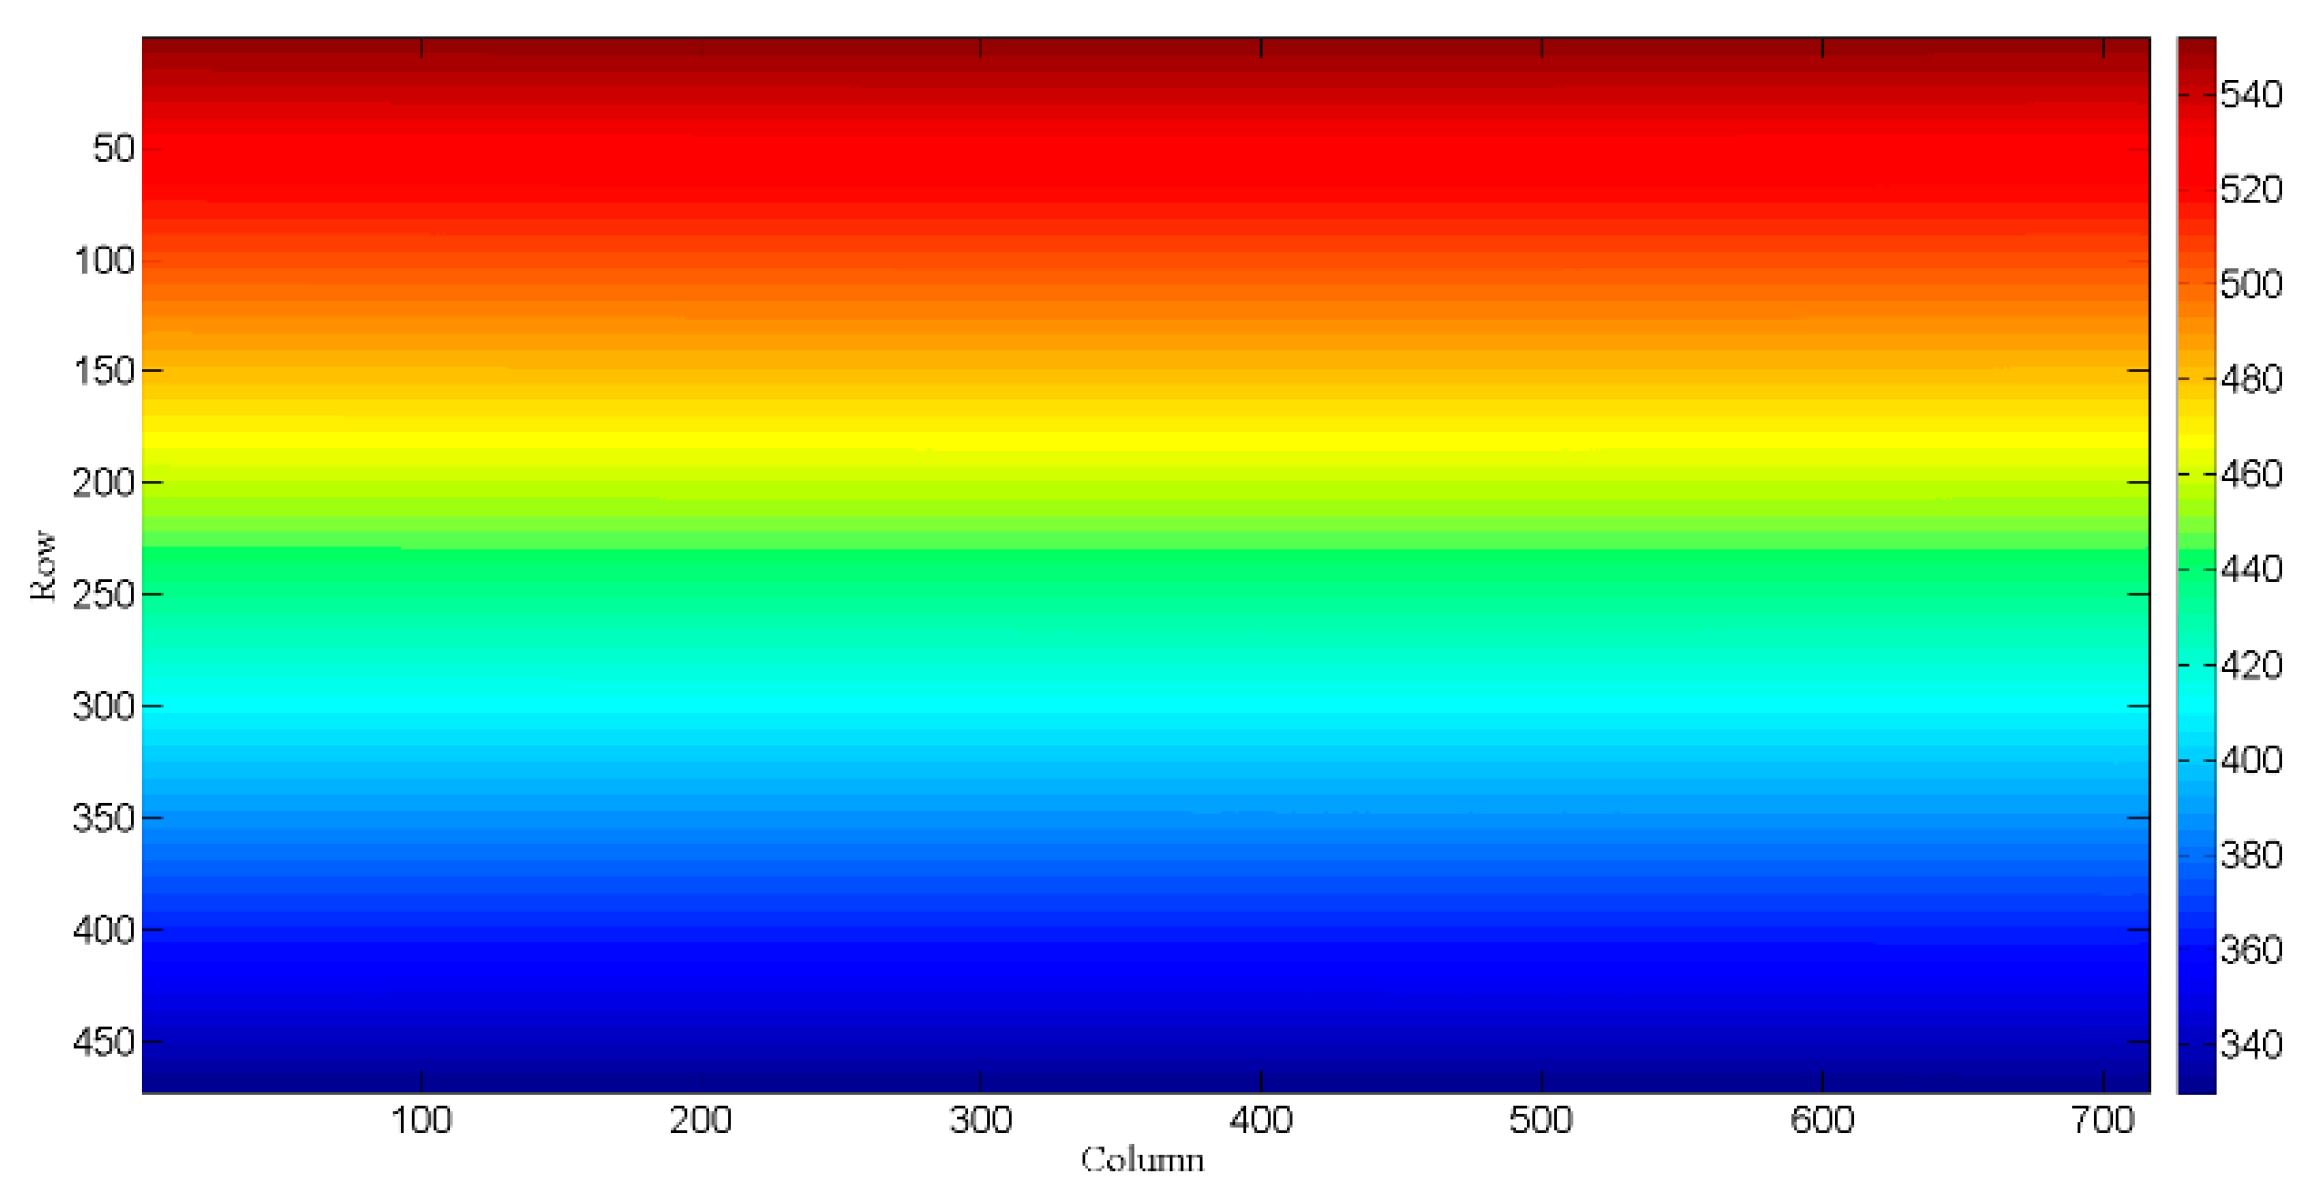
Measurements employing three spectral line sources that deliver precise information on wavelengths, the relationship between wavelengths, and pixels can be established by cubic spline interpolation. The results are shown in
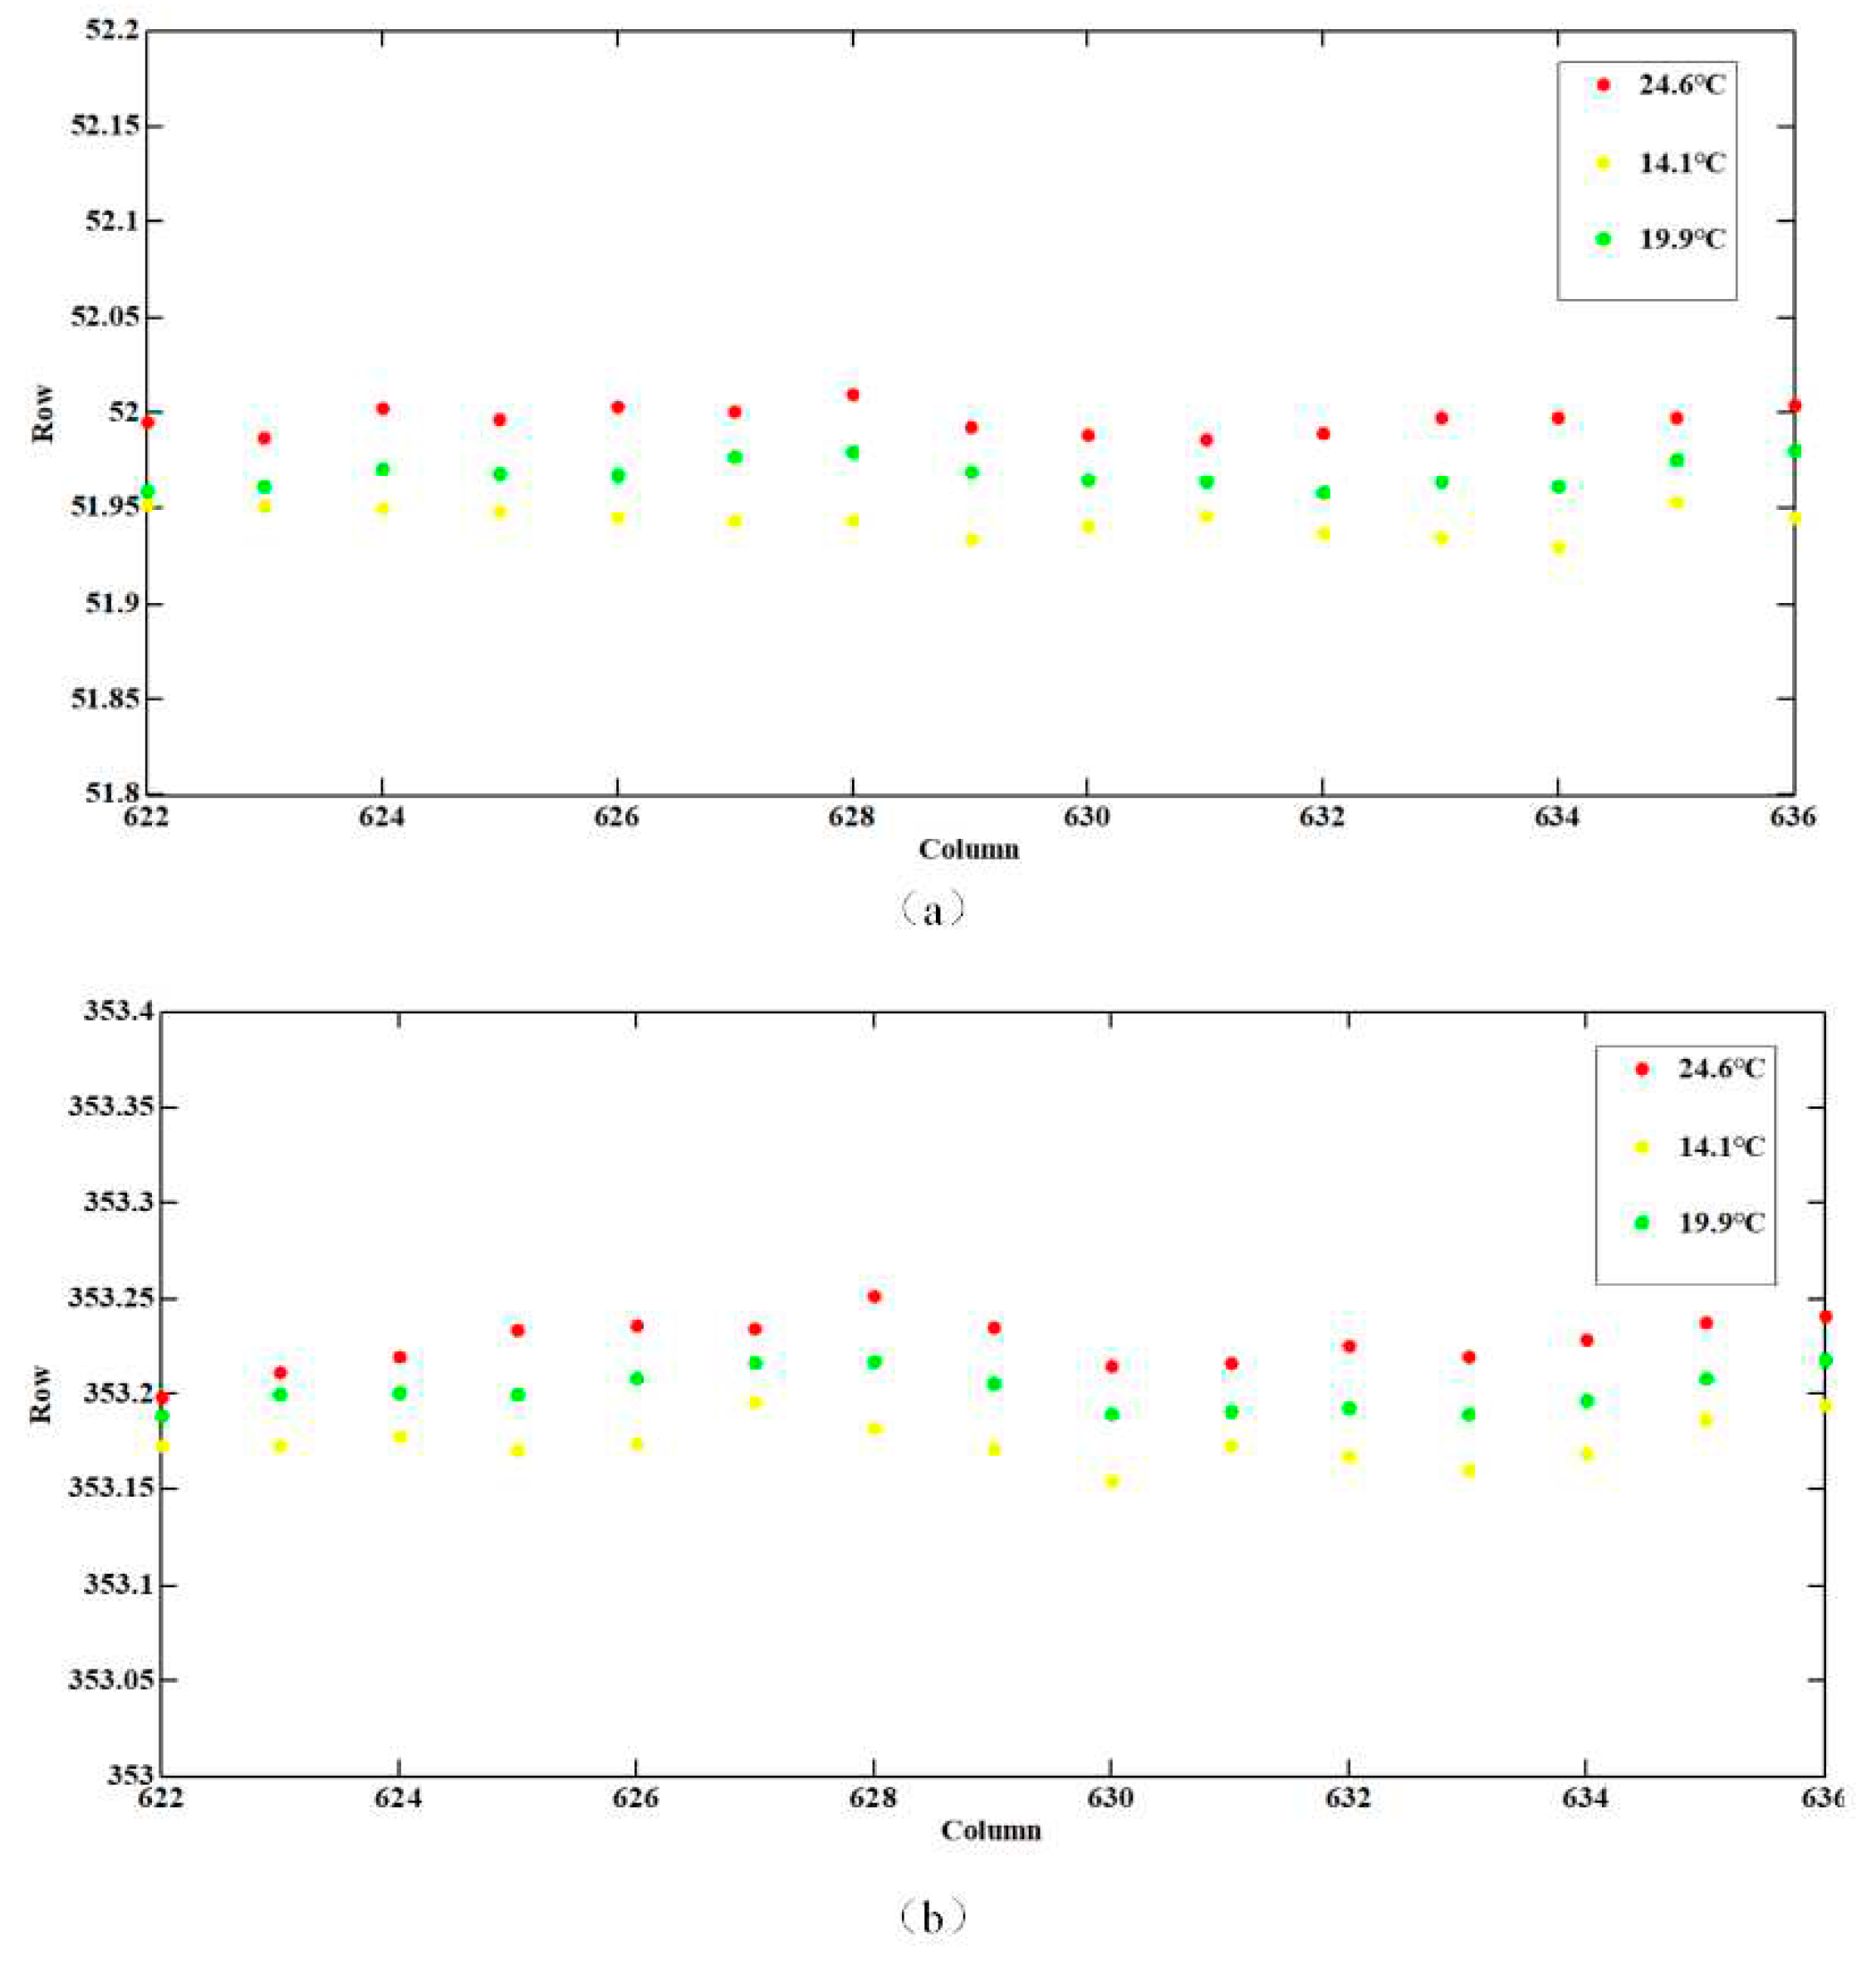
Figure 5. The spectral range determined from wavelength calibration changes from 338 to 551 nm for the AAS detector, and the dispersions are 0.47 nm/pixel. The wavelength calibration accuracy is 0.03 nm. To better understand the optical properties of the AAS, the temperature dependency of the wavelength shift has been examined during the on-ground calibration operation. The position change of the characteristic wavelength can be obtained at three different temperatures, including an extremely high temperature (i.e., 24.6 ℃), an extremely low temperature (14.1 ℃), and a working temperature (19.9 ℃). The results are shown in
Figure 6. Found that the maximum wavelength shift of the two extreme temperature conditions is less than 0.06 pixels, which could be corrected in orbit by using Fraunhofer structures within the solar spectrum.
Figure 5.
Sun port wavelength maps for the AAS detectors via interpolation.
Figure 5.
Sun port wavelength maps for the AAS detectors via interpolation.
3.2. SRF Calibration
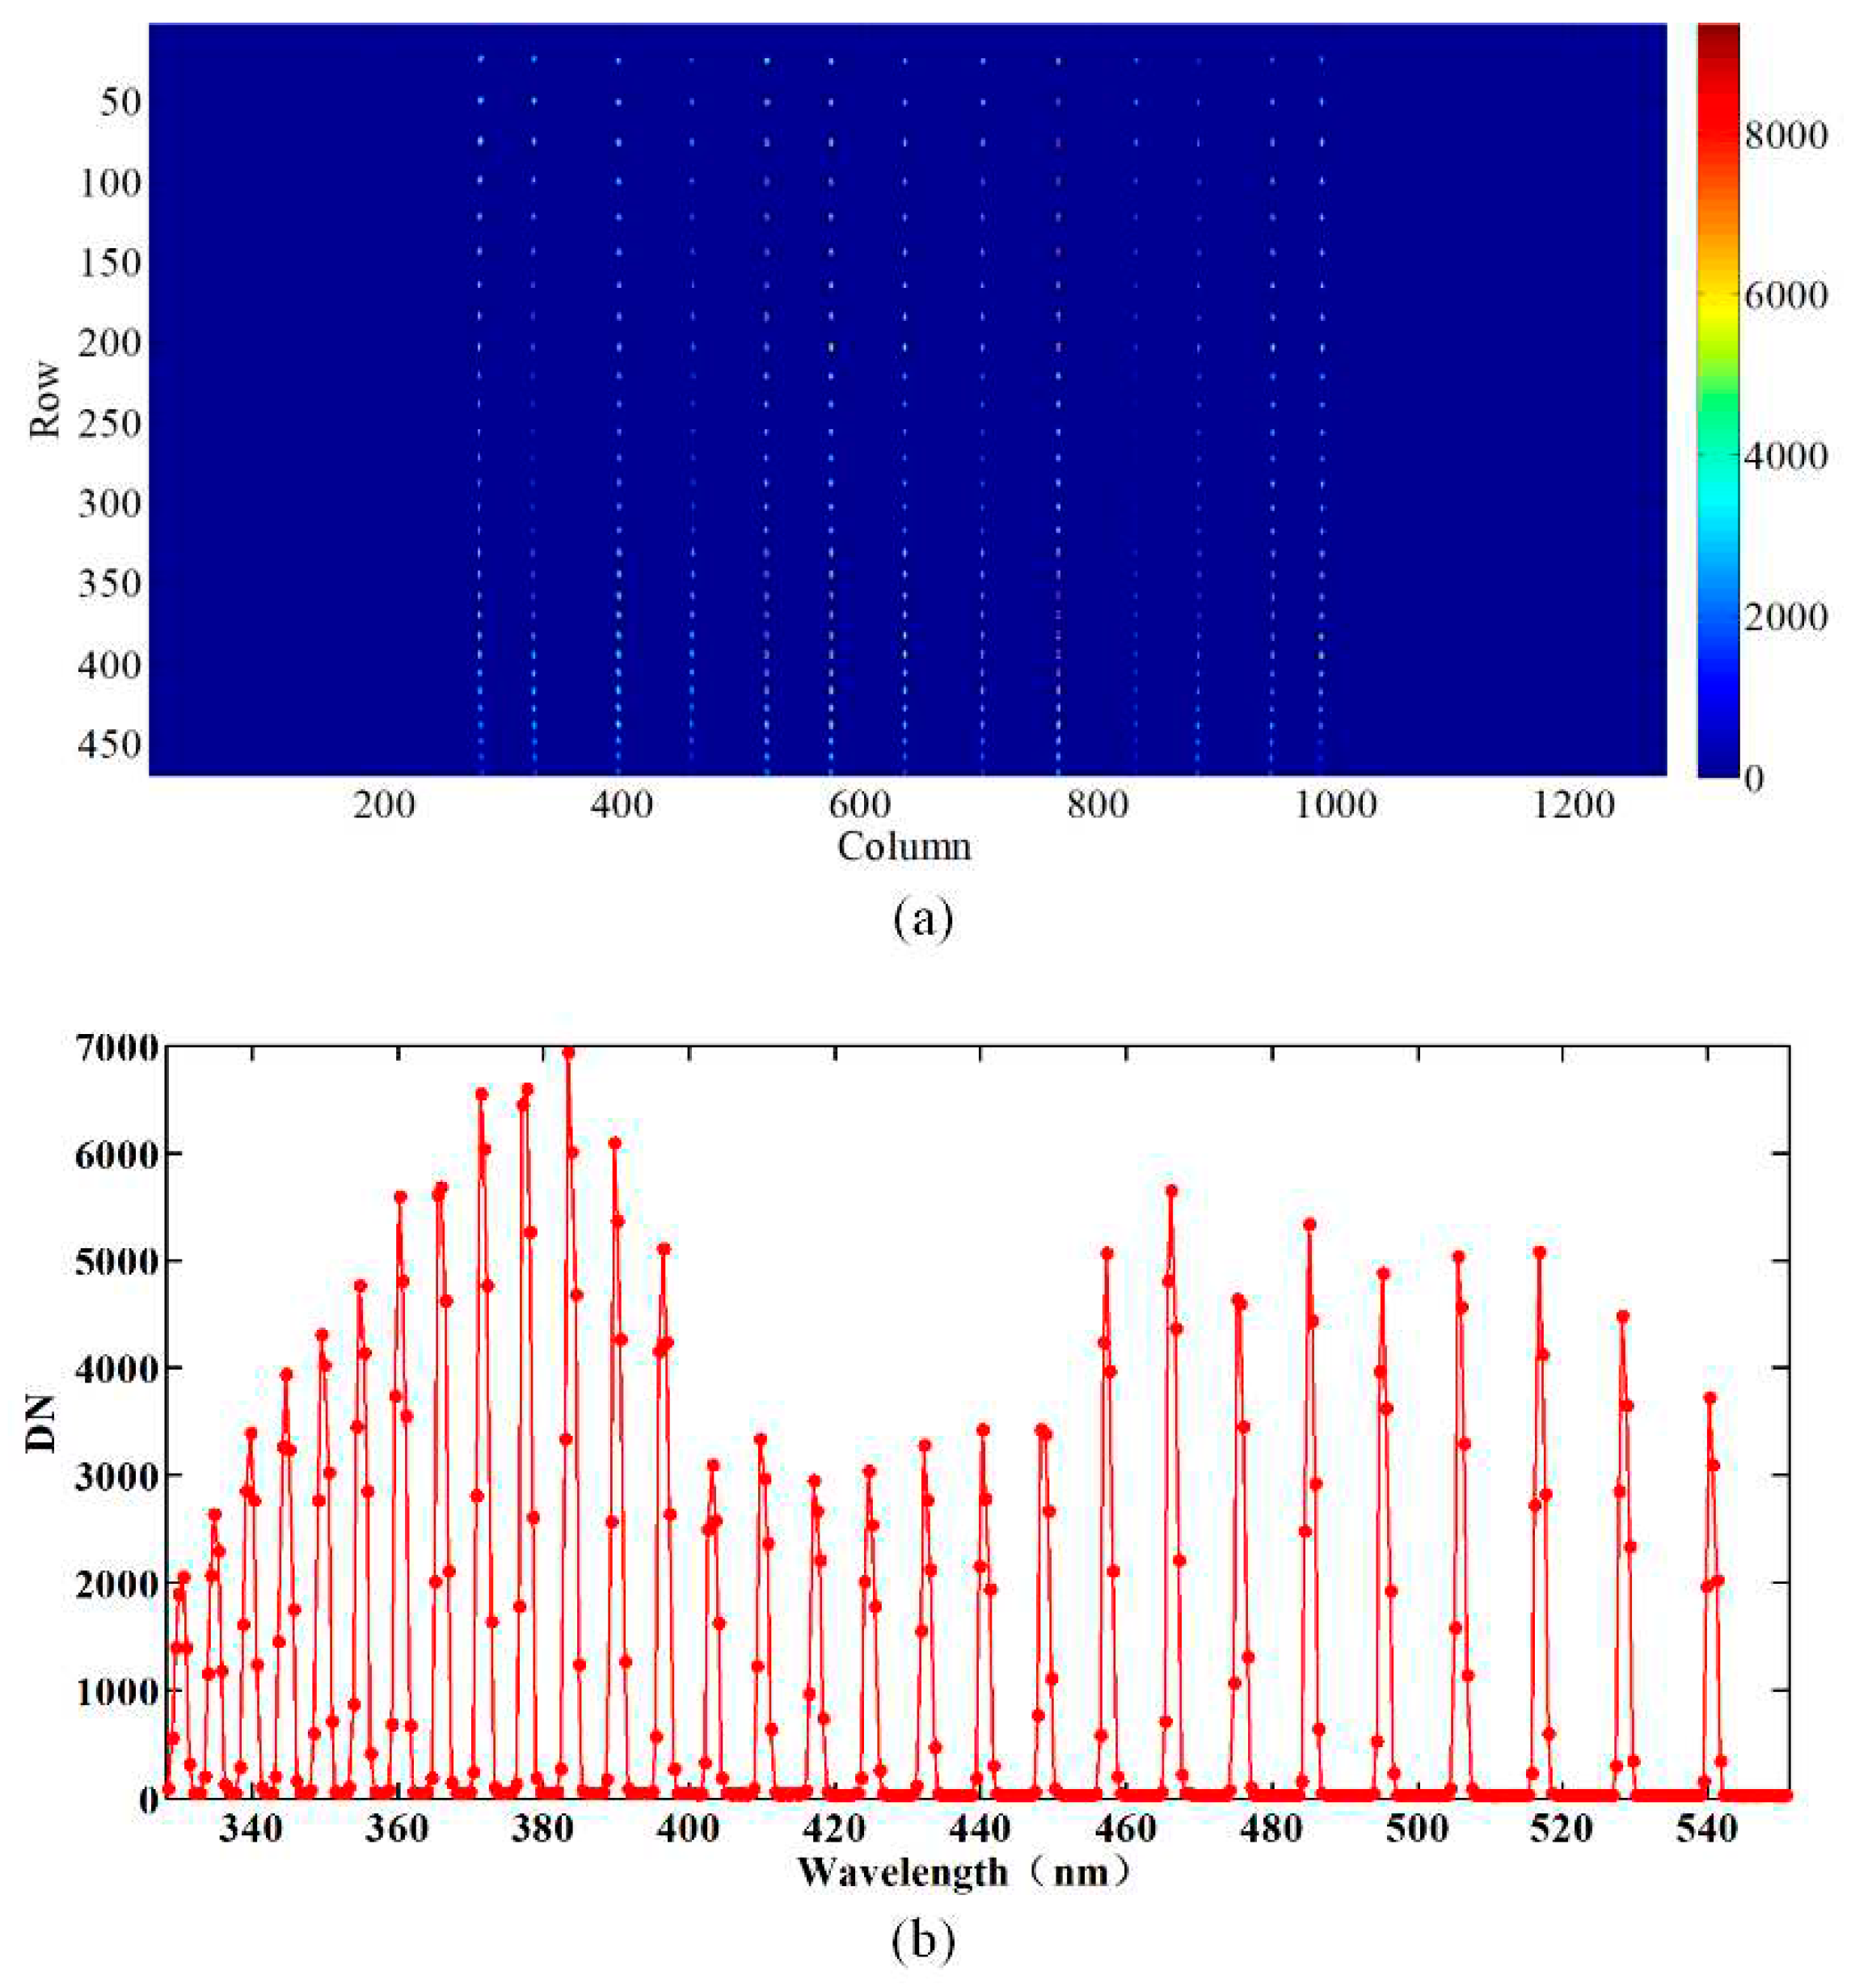
Optical equipment has been designed to accurately measure the SRF. The equipment employs an echelle grating to produce a 30 mm beam, which contains a tunable, uniform separation, and narrow spectral peaks in the range of 340–550 nm. Here, a slit function of 114° has been tested by the rotating platform with steps of 10°, while a spectrum of nadir observation could be obtained by an extract in the middle of the map, as shown in
Figure 7.
The SRF for AAS can be obtained by the extracted profile from
Figure 7(b), and the SFI grating is at a fixed angle. To improve the sampling frequency, the positions of the peaks in the equipment traverse in a wavelength dimension by turning the echelle grating. The fixed pixel’s response to an echelle peak signifies the SRF of the relevant pixel. By implementing this procedure, the shape of the SRF is assessed with more sampling than is obtained by employing a spectral line. For the AAS, a super-Gaussian profile is utilized, which is the characteristic of the slit homogenizer. Eq. (1) presents the super-Gaussian profile.
where
A1,
A2,
λ0,
c0 being the fitting parameters.
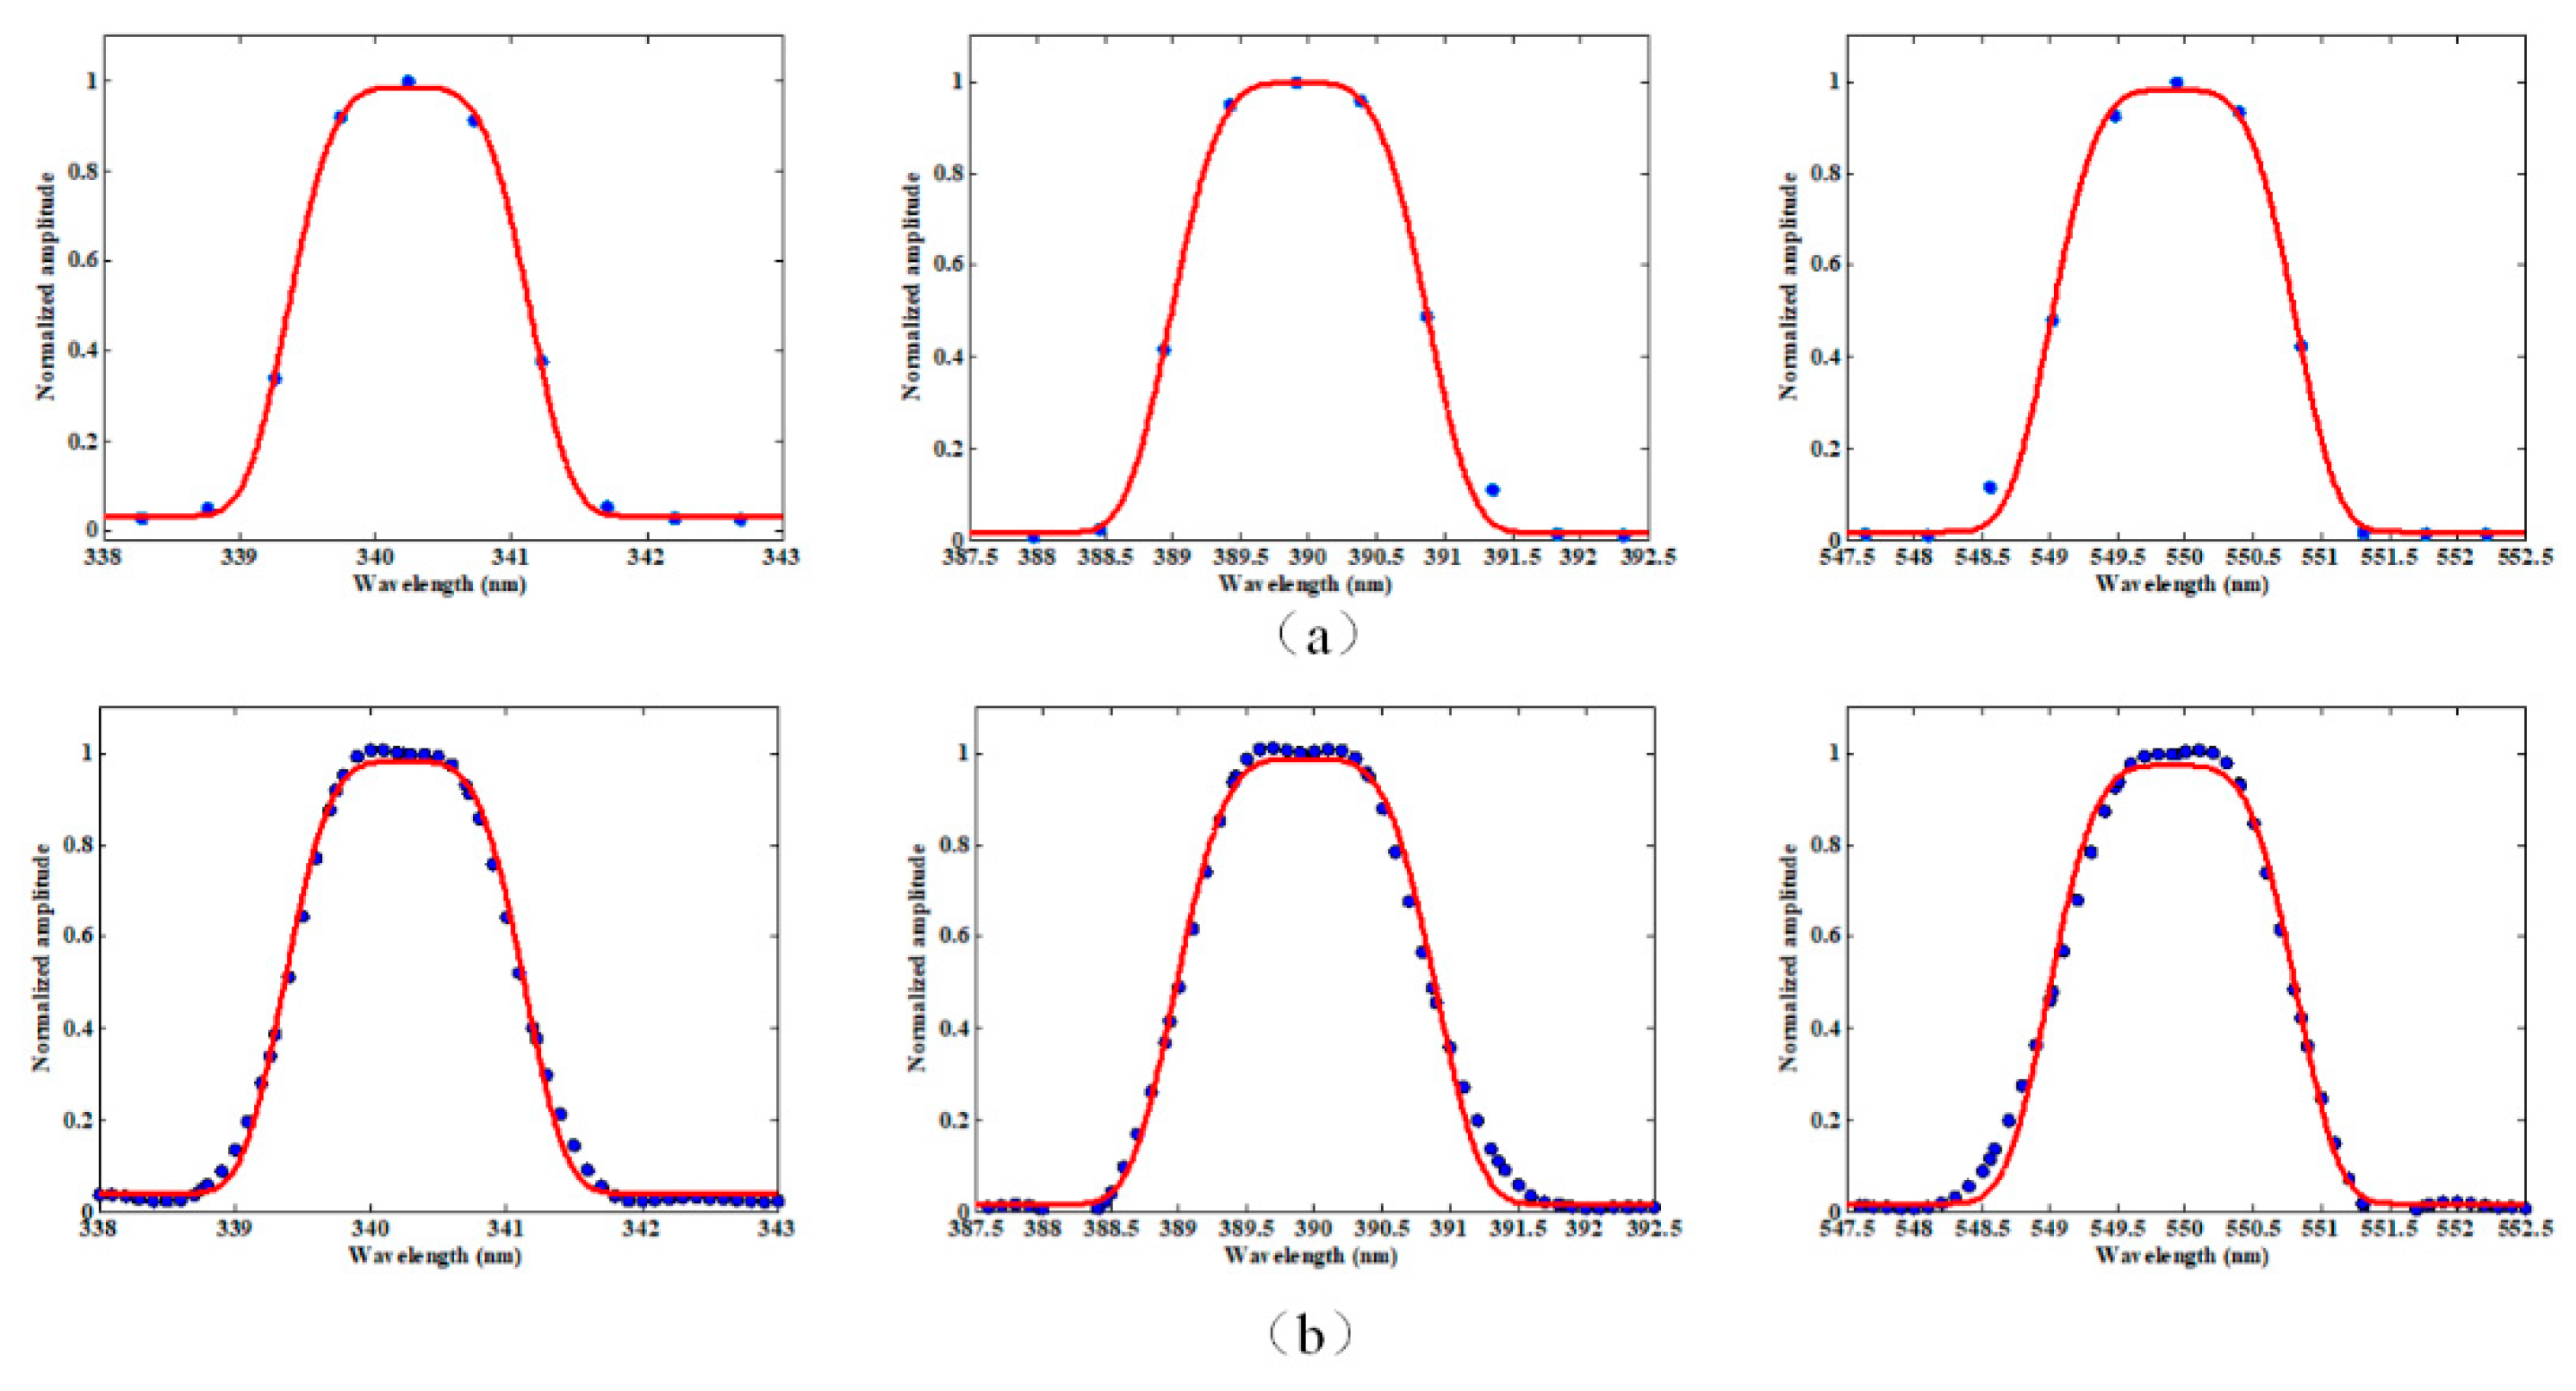
Figure 8(a) is a plot of the SRF sampling when recording the spectral line response with a fixed angle, while
Figure 8(b) displays the enhanced sampling of the SRF with many angles. A functional fit relative to the plot’s data points is provided within the figure. As shown in
Figure 9, the ratio spectral resolution/sampling of the AAS is typically a value of 4. Whereas for the dedicated slit function measurements, an improved sampling of the spectral resolution is achieved at least ten times. The SRF’s shapes from the Earth port are similar to a Gaussian curve with a flatted top are concluded, with an FWHM of 1.728–1.82 nm for the AAS. The results show that the correlation coefficients are about 0.99, which proves that the fitting function could describe the SRF of the instrument.
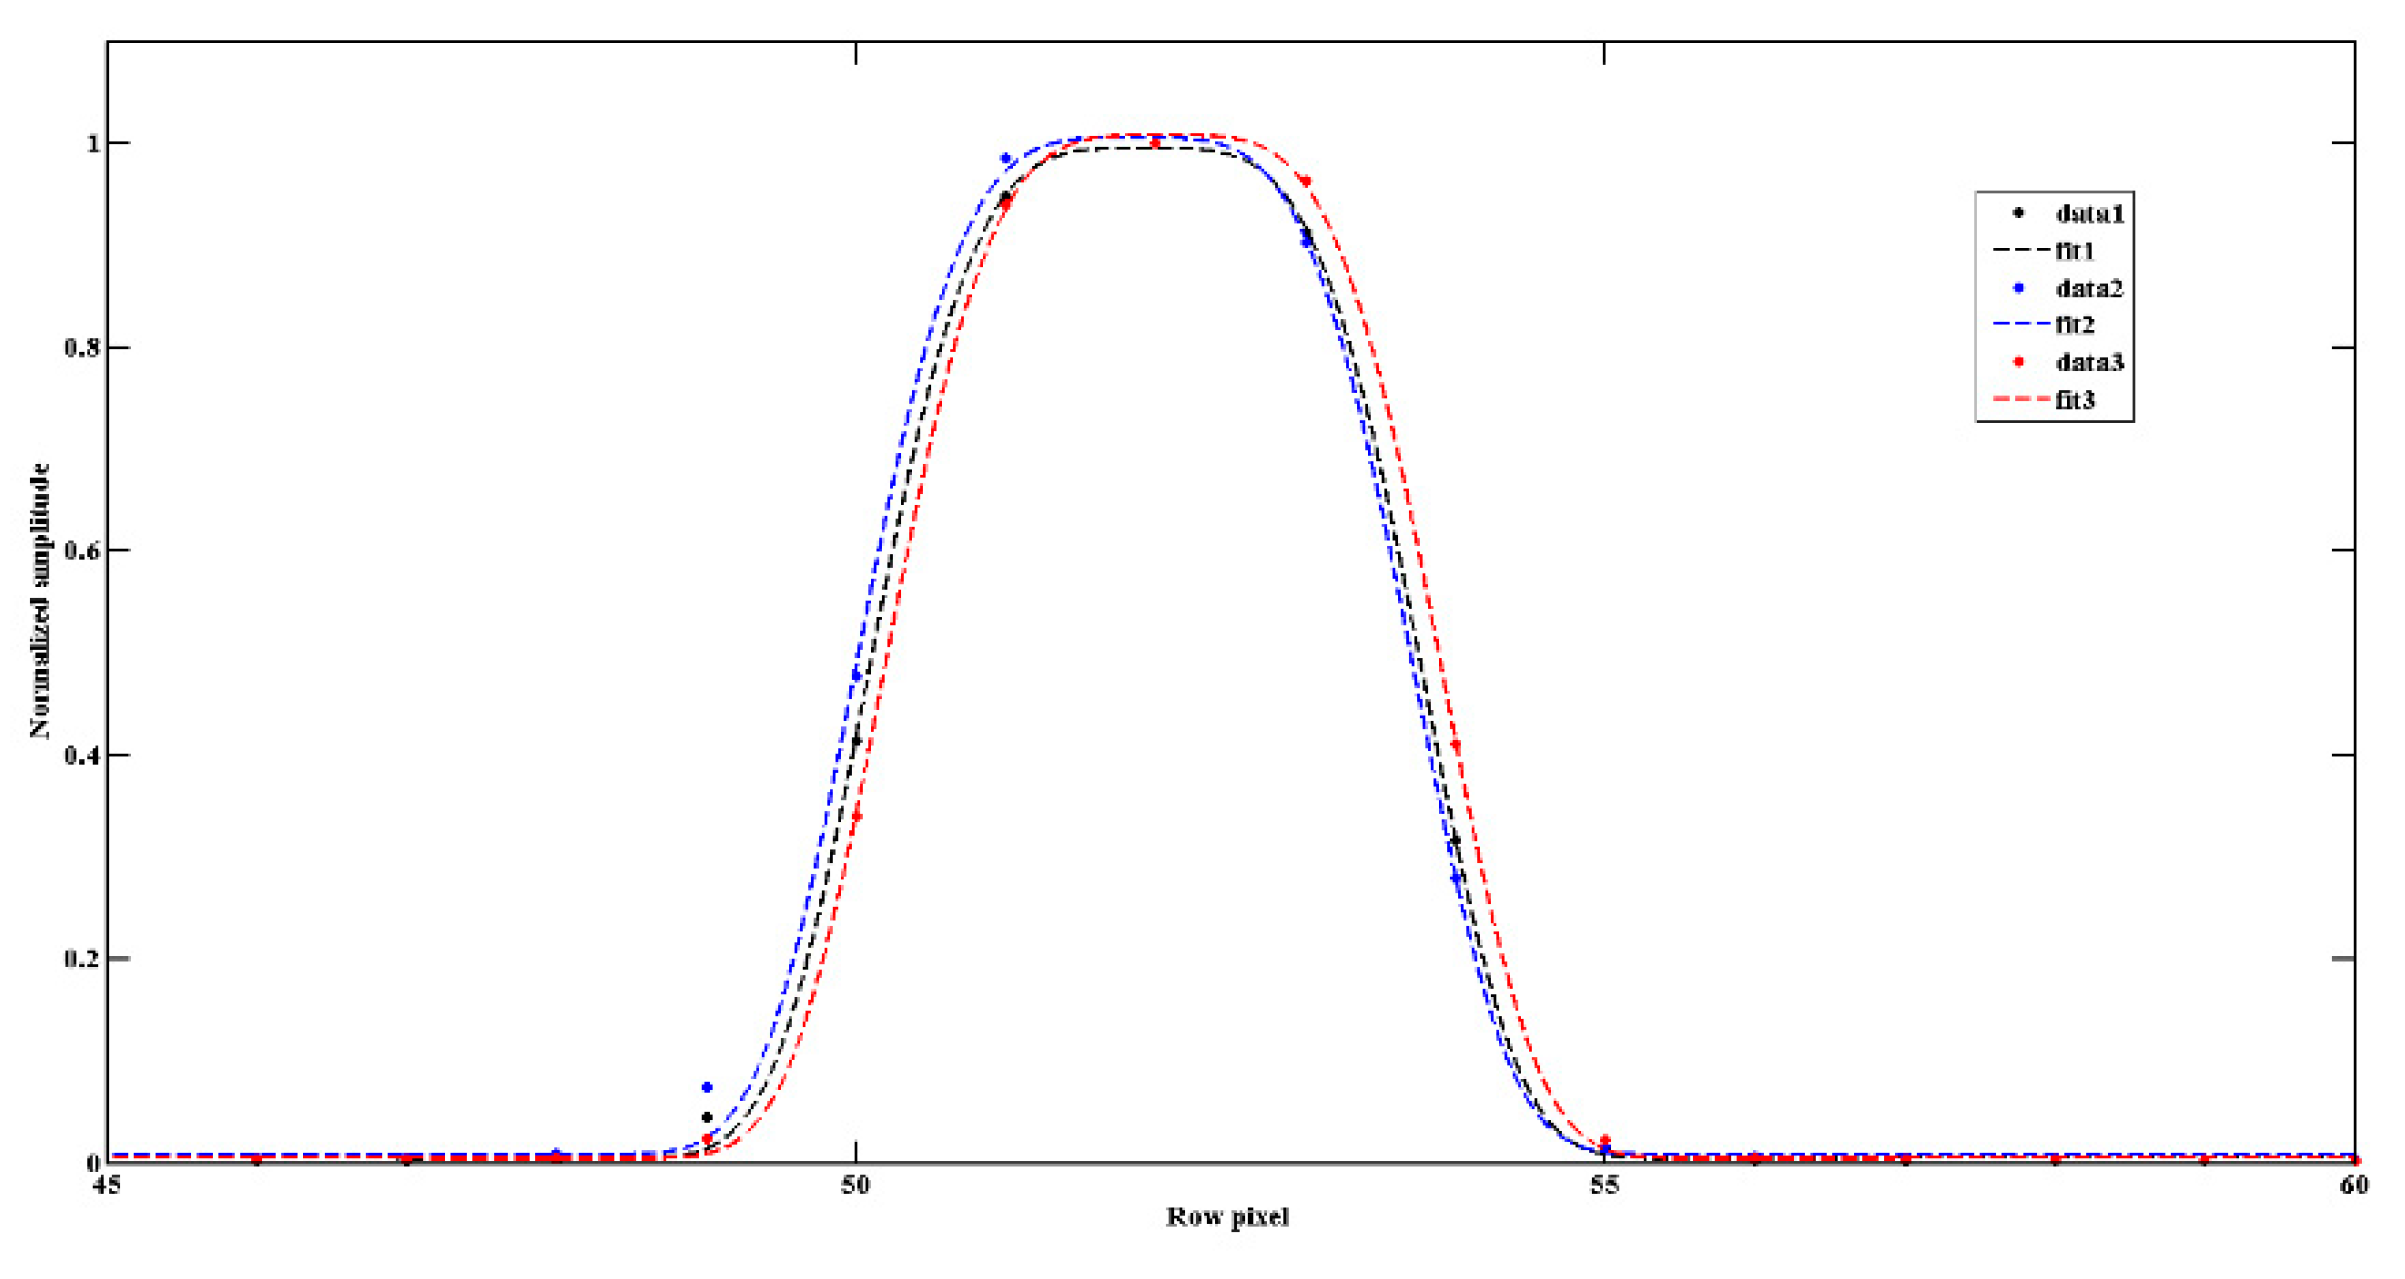
The SRF’s shapes dependent on temperature have been measured, as shown in
Figure 10. The dots represent the measured data, the dotted line is a fitted curve, and distinct colors represent different temperatures (data1, data2, and data3 corresponding to 19.9 ℃, 14.1 ℃, and 24.6 ℃, respectively). The center of the curve varying slightly with the temperature is shown, which is consistent with
Figure 6. In addition, when compared with the results at 19.9 ℃, the FWHM under other temperatures provides a slight broadening, with 0.06–0.1 pixels.
3.3. Spectral Smile
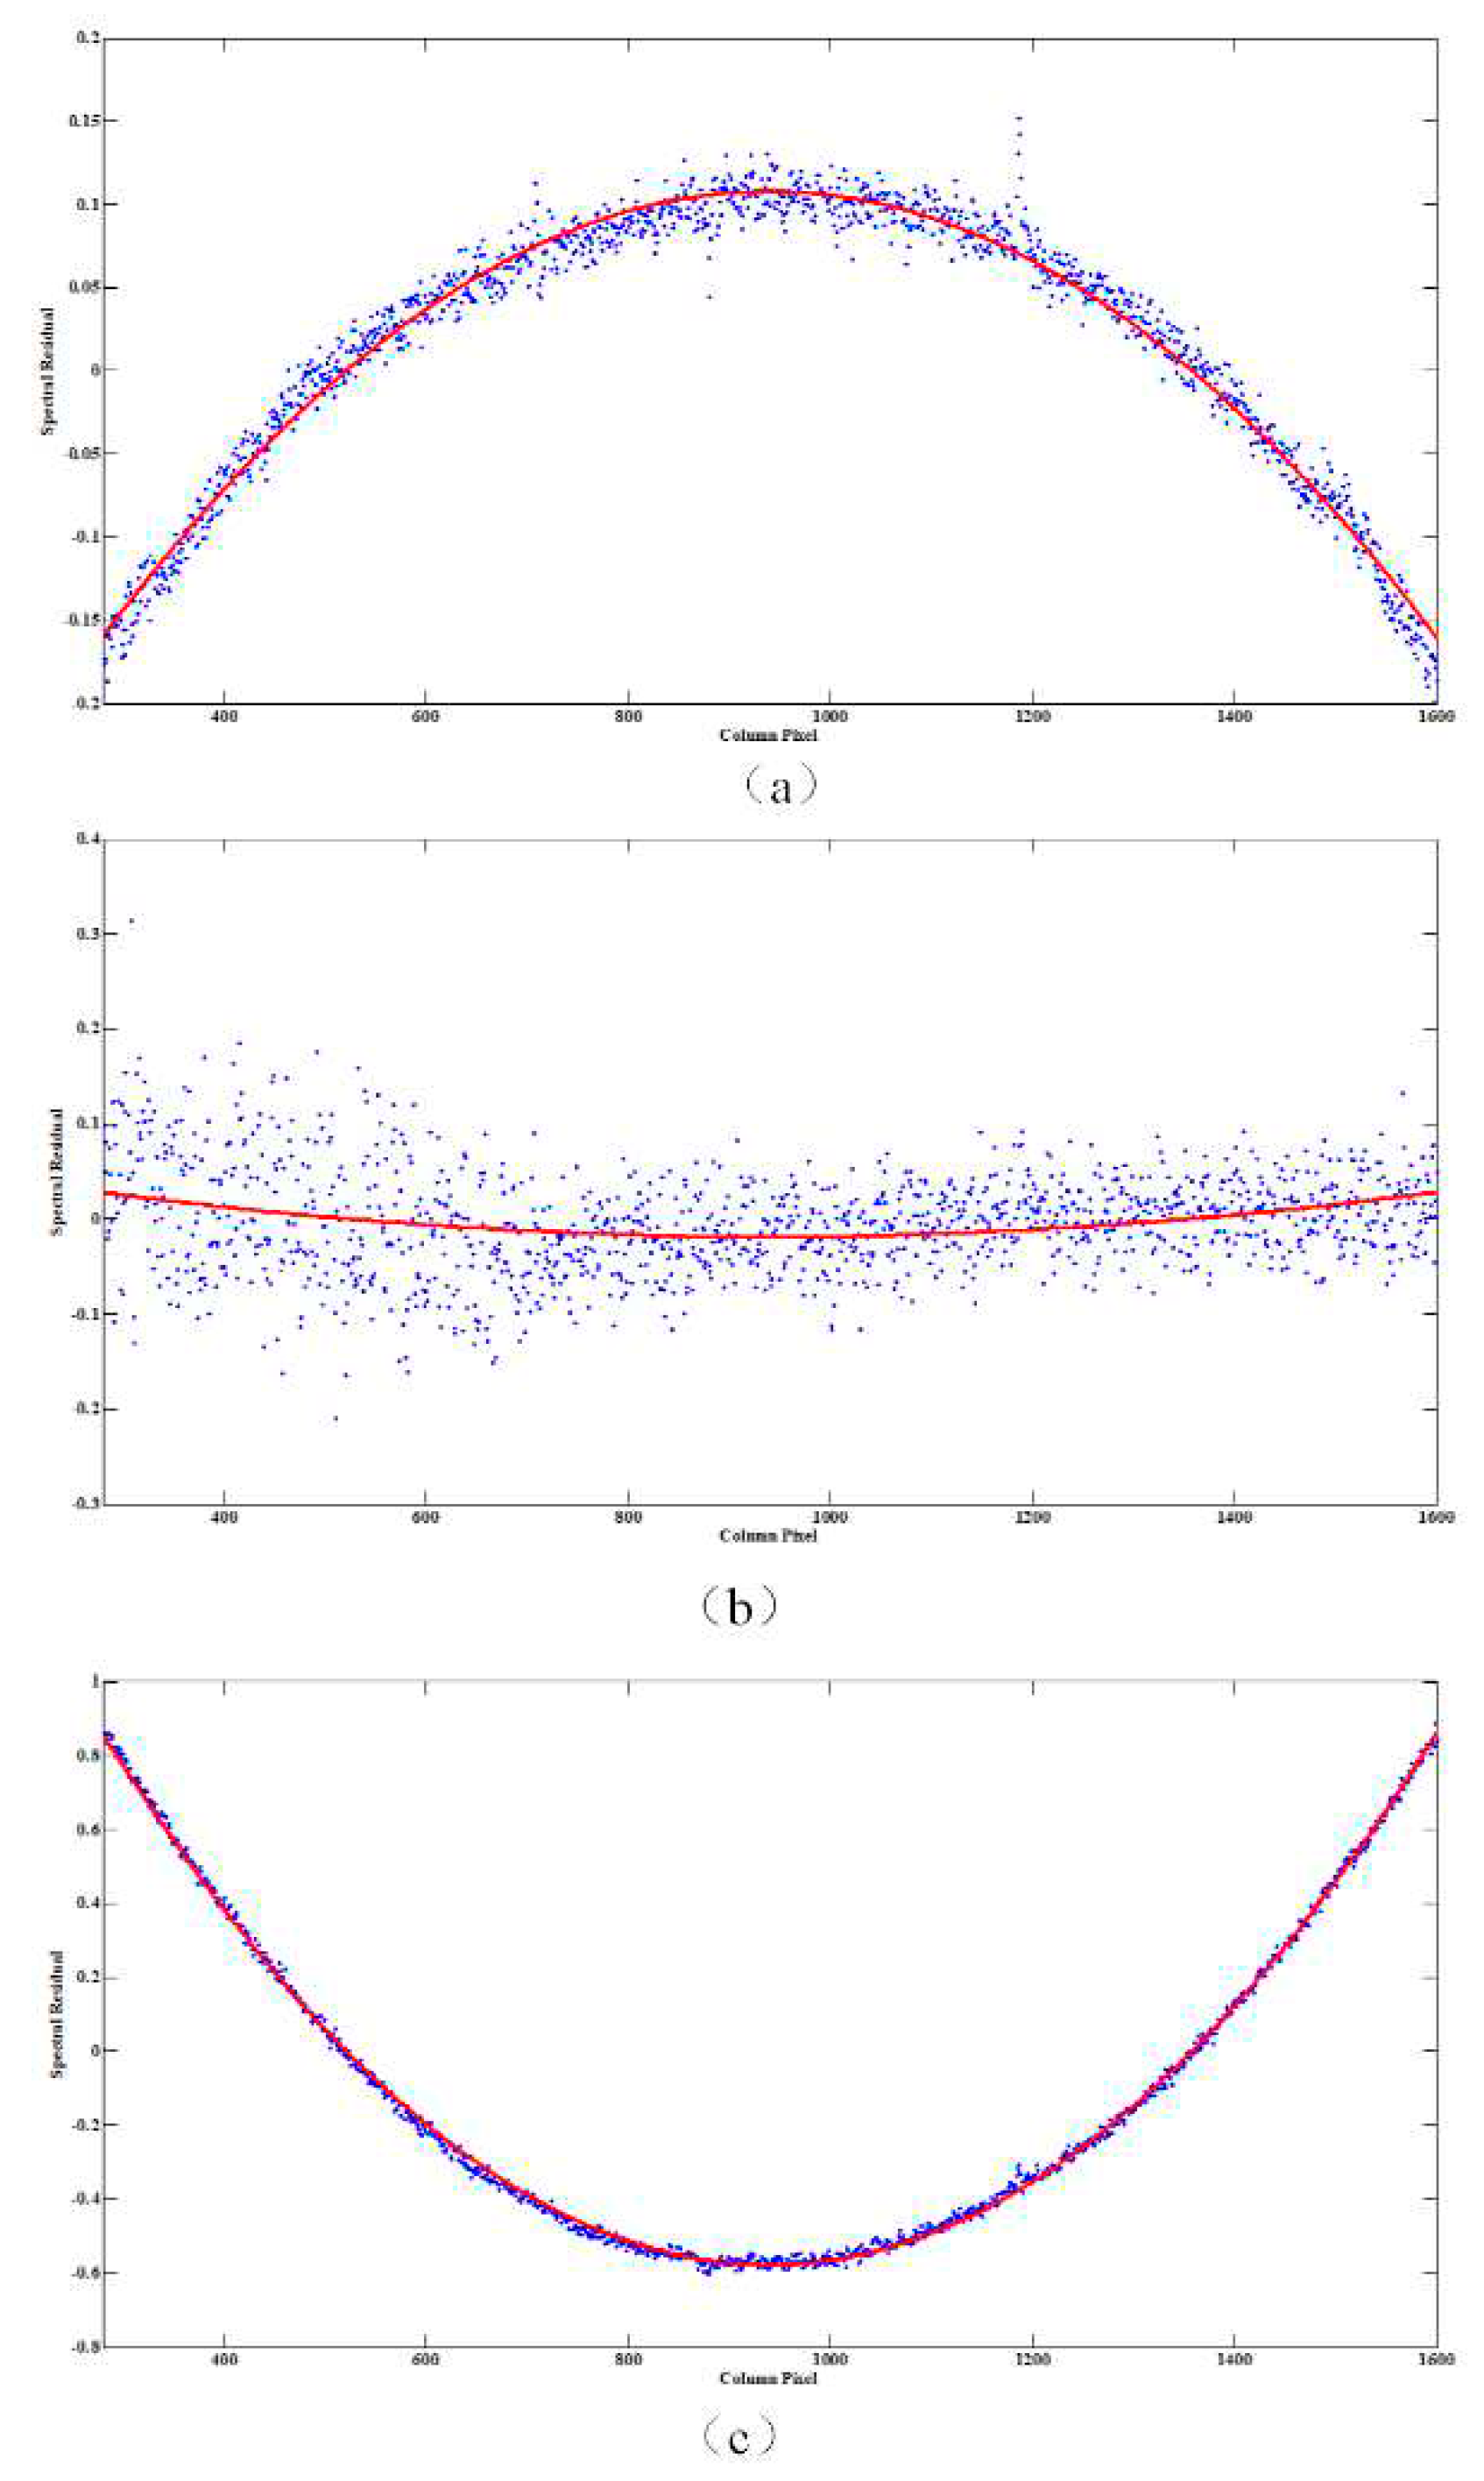
Setting the SFI at an angle, the spectrum can be scanned on the spatial array of the detector by using a rotating platform, and the coordinate of all the spectra in the FOV of the AAS can be obtained. By fitting the spectral row number, which is dependent on the spatial column number, a straight line can be obtained. This straight line may tilt on the image surface. To correct the image tilt, the residual value of the fitting straight line is used, and then the residual and spatial column is employed to fit the curve. By obtaining the highest and lowest points of the curve, the maximum space curvature can be obtained.
Figure 9 shows the smile effect of differing spectra. In
Figure 9, the points denote the measurement data and the solid line designates the fitted curve. The maximum smile is 1.4 pixels at wavelength 550 nm, for the 340 nm smile it is 0.27 pixels, and the minimum is 0.2 pixels for 400 nm.
4. Conclusion
The research described the instrument characteristics and performance, alongside the pre-launch on-ground spectral calibration, of an AAS. The data relating to the calibration process was obtained by illumination of the entrance port of the AAS via a vacuum chamber with dedicated on-ground testing equipment. For the pre-launch spectral calibration, all the spectral pixels were tested and determined from the tunable SFI fine-step scans. After spectral calibration, by controlling the different temperatures, the spectrum drift was measured. During the process of temperature change from 14.1 to 24.6 ℃, the center of the spectrum line has almost no change, but the FWHM varies by 0.1 pixels. The spectral smile was measured using the SFI, with a maximum of 1.4 pixels.
Author Contributions
Writing—original draft preparation J.M.; on-ground spectral calibration,J. M., Y. W.; slit function instrument design,E.S.; calibration data-processing programme,J.M. and J.W.;writing—review and editing, Y.W., J.M. All authors have read and agreed to the published version of the manuscript.
Funding
This work was funded by the Strategic Priority Program on Space Science (XDA1535010204).
Data Availability Statement
The data presented in this study are available on request from the author.
Acknowledgments
The authors wish to thank GF-5B Project team and Guojun Du from Beijing Institute of Space Mechanics & Electricity (BSME), professor Weihe Wang from National Satellite Meteorological Center (CMA), Yuerong Cai and Hao Qiao fromm National Spcae Science Center (NSSC).
Conflicts of Interest
The authors declare no conflict of interest.
References
- Veefkind, J.P.; Aben, I.; McMullan, K.; Forster, H.; de Vries, J.; Otter, G.; Claas, J.; Eskes, H.J.; de Haan, J.F.; Kleipool, Q.; et al. TROPOMI on the ESA Sentinel-5 Precursor: A GMES mission for global observations of the atmospheric composition for climate, air quality and ozone layer applications. Remote Sens. Environ. 2012, 120, 70–83. [Google Scholar] [CrossRef]
- Torres, O.; Tanskanen, A.; Veihelmann, B.; Ahn, C.; Braak, R.; Bhartia, P.K.; Veefkind, P.; Levelt, P. Aerosols and surface UV products from Ozone Monitoring Instrument observations: An overview. J. Geophys. Res. 2007, 112. [Google Scholar] [CrossRef]
- Hahne, A.; Lefebvre, A.; Callies, J. Global ozone monitoring experiment (GOME) on board of ERS 2. In Proceedings of the Environmental Sensing ‘92, Berlin, Germany, 15-19 June 1992. [Google Scholar]
- Dave, J.V. Effect of aerosols on the estimation of total ozone in an atmospheric column from the measurements of its ultra-violet radiance. J. Atmos. Sci. 1978, 35, 899–911. [Google Scholar] [CrossRef]
- Wang, Y.M.; Zhang, Z.; Mao, J.H.; Wang, H.M.; Shi, E.T.; Liu, X.H.; Li, P.D.; Liu, J. In-flight preliminary performance of GF-5B/absorbing aerosol sensor. Remote Sens. 2023, 15, 4343. [Google Scholar] [CrossRef]
- Shi, E.T.; Wang, Y.M.; Jia, N.; Mao, J.H.; Lu, G.D.; Liang, S.L. Absorbing aerosol sensor on Gao-Fen 5B satellite. Adv. Opt. Technol. 2018, 7, 387–393. [Google Scholar] [CrossRef]
- Munro, R.; Lang, R.; Klaes, D.; Poli, G.; Retscher, C.; Lindstrot, R.; Huckle, R.; Lacan, A.; Grzegorski, M.; Holdak, A.; et al. The GOME2 instrument on the Metop series of satellites: Instrument design, calibration, and level 1 data processing—An overview. Atmos. Meas. Tech. 2016, 9, 1279–1301. [Google Scholar] [CrossRef]
- Dawson, O.R.; Harris, W.M. Tunable, all-reflective spatial heterodyne spectrometer for broadband spectral line studies in the visible and near-ultraviolet. Appl. Opti. 2009, 48, 4227–4238. [Google Scholar] [CrossRef] [PubMed]
- de Vries, J.; van den Oord, G.H.J.; Hilsenrath, E.; te Plate, M.B.J.; Levelt, P.F.; Dirksen, R. Ozone monitoring instrument (OMI). Proc. SPIE 2002, 4480, 315–325. [Google Scholar]
- Liu, Y.; Wu, J.; Li, J.H.; Yang, W.; Chen, H.; Li, G.L. SRF: Interest semantic reasoning based fog firewall for information-centric Internet of Vehicles. IET Intell. Transp. Syst. 2019, 13, 975–982. [Google Scholar] [CrossRef]
- Li, Z.G.; Lin, C.; Li, C.L.; Wang, L.; Ji, Z.H.; Xue, H.; Wei, Y.F.; Gong, C.H.; Gao, M.H.; Liu, L. Prelaunch spectral calibration of a carbon dioxide spectrometer. Meas. Sci. Technol. 2017, 28, 065801. [Google Scholar] [CrossRef]
- Smorenburg, K.; Dobber, M.R.; Schenkeveld, E.; et al. Slit function measurement optical stimulus. In International Symposium on Remote Sensing, Crete, Greece, 23-27 September 2003. [Google Scholar]
- Crowell, S.; Haist, T.; Tscherpel, M.; Caron, J.; Burgh, E.; Moore, B. Performance and polarization response of slit homogenizers for the GeoCarb mission. Atmos. Meas. Tech. 2023, 16, 195–208. [Google Scholar] [CrossRef]
- Hummel, T.; Meister, C.; Keim, C.; Krauser, J.; Wenig, M. Slit homogenizer introduced performance gain analysis based on Sentinel-5/UVNS spectrometer. Atmos. Meas. Tech. 2021, 14, 5459–5472. [Google Scholar] [CrossRef]
- Caron, J.; Vink, H.J.P. Slit homogenizer for spectral imaging. EP3830536A1. 2018.
- Graziosi, C.; Pasqui, C.; Brandani, F.; Hohn, R. First test results on SWIR subsystem optical breadboards: Optical mounting characterization, first slit homogenizer, and immersed grating for space applications. In UV/Optical/IR Space Telescopes and Instruments: Innovative Technologies and Concepts, San Diego, California, United States, 11-15 August 2019. [Google Scholar]
- Rank, D.H.; Mccartney, J.S. Some spectral characteristics of mercury arcs for use in study of the Raman effect. J. Opt. Soc. Am. 1948, 38, 279–281. [Google Scholar] [CrossRef] [PubMed]
- Green, S.; Hutson, J. Spectral line shape parameters for HF in a bath of Ar are accurately predicted by a potential inferred from spectra of the van der Waals dimer. J. Chem. Phys. 1994, 100, 891–898. [Google Scholar] [CrossRef]
- Roston, G.D.; Ghatass, Z.F. Experimental investigation of the line center of Hg intercombination spectral line 253.7nm perturbed by Kr. J. Quant. Spectrosc. Radiat. Transf. 2009, 110, 2174–2179. [Google Scholar] [CrossRef]
- Yamashita, M. Local dependence of rise time of spectral line intensities in Ne glow discharge tube. Jpn. J. Appl. Phys. 1983, 22, 1170–1170. [Google Scholar] [CrossRef]
|
Disclaimer/Publisher’s Note: The statements, opinions and data contained in all publications are solely those of the individual author(s) and contributor(s) and not of MDPI and/or the editor(s). MDPI and/or the editor(s) disclaim responsibility for any injury to people or property resulting from any ideas, methods, instructions or products referred to in the content. |
© 2023 by the authors. Licensee MDPI, Basel, Switzerland. This article is an open access article distributed under the terms and conditions of the Creative Commons Attribution (CC BY) license (http://creativecommons.org/licenses/by/4.0/).
