1. Introduction
In recent years, due to the growing trend of energy demand, environmental pollution and depletion of fossil fuel sources, the focus on renewable energy sources has increased considerably [
1]. These energy sources play an important role in the world and provide more than 14% of the total global energy demand [
2]. Wind energy is an available resource compared to other renewable energy sources. In addition, unlike solar energy, changes in weather conditions do not have much effect on it. The task of wind turbines is to convert the kinetic energy of the wind into mechanical energy and then into electrical energy. The output power of turbines depends on various factors such as blade geometry, blade twist angle, rotor rotational speed, wind speed and disturbance characteristics and wind speed gradient at the location of the wind power plant. Accurate aerodynamic predictions are important and necessary in designing rotor blades and improving the performance of devices. This requires the validity of new methods, increasing the accuracy and efficiency of the results. Computational fluid dynamics is one of these design tools and extensive research has been done in the field of development of computational fluid dynamics tools and methods for aerodynamic prediction of wind turbines in the past few years. Research on wind turbines in two main models, horizontal axis and vertical axis, has been continued, but in recent results, it has been almost confirmed that these horizontal axis turbines will play a major role in the future of the wind energy industry.
At the beginning of the 20th century, Albert Betz [
3] showed with the help of classical physics laws that the maximum power that can be extracted from the wind in horizontal axis turbines is 50.73%. The existence of this upper limit has since become known as Betz's law. In the research conducted Foreman et al. [
4], it has been shown that by using a conical duct around the turbine, it is possible to achieve high efficiencies even more than the coefficients provided by Betz. These results reduce the final price of wind power and provide the possibility of creating new changes in the design of turbines. Sicot et al. [
5] have measured a 15% increase in the intensity of turbulence entering a wind turbine due to the presence of upstream turbine wakes. Based on these parameters, various researchers in their works have predicted the severity of disturbances between 5 and 22 percent [
6,
7]. According to the studies of Kelley et al. [
8], today's numerical methods face many problems and difficulties for accurate modeling. This is the reason why the study and research in the field of numerical calculations about the flow around the blades of wind turbines is of high value. Fiedler et al. [
9] studied the effect of changing the connection location of the rotor blades and the initial pitch of the blade on the efficiency of the straight blade vertical axis turbine (without twist) and showed that by choosing the appropriate value of these two parameters, the efficiency coefficient of the turbine can be increased.
González-Longatt et al. [
10] evaluated the effects of the trail on a wind farm using two methods: static performance and dynamic performance. The results provided by them are used in thumb calculations to design a farm. They implemented their wake model by considering effects such as shadow accumulation effect, wind regime and time delay effect of wind speed in MATLAB software and combined it with a power simulation system in order to explain the wake effect on the wind farm. The simulations of the tail effect on the performance of the wind farm showed that the efficiency of the configuration of the turbines depends on the distance between them and the type of wind regime that blows to the turbines. Both simulations (static and dynamic) performed showed that improving the configuration of turbines has a significant effect on improving the output power of a wind farm. The dynamic simulation proved that the increase in electrical losses due to the increase in the distance between the turbines is very insignificant compared to the increase in the power extracted from the wind. Sturge [
11] investigated the effects of the wake of a wind turbine on the performance of downstream turbines. As shown in this research, for a downstream turbine there was a significant power reduction due to the presence of an upstream turbine, which various researchers [
12,
13,
14] have also mentioned it.
In Iran, the existence of a variety of places to build wind farms in special topographies will create the necessity of research in this field. In general, for optimal energy extraction, the performance of wind turbines should be considered. Nowadays, commercial and conventional software in the field of computational fluid dynamics are used to investigate the hydrodynamic performance of wind turbines. Considering different environmental and atmospheric conditions, choosing the type of wind turbine will become more complicated and the flow passing over the blades of the wind turbine will find its own conditions. In order to solve this problem and choose the type of wind turbine, by using computational fluid dynamics, it is possible to investigate these challenging models that will provide accurate results compared to the expensive laboratory data, which in the present work, the performance of horizontal onshore and offshore wind turbines in The steady state has been studied and its results have been compared with the experimental data, and then the effect of different parameters on the performance of the turbine has been studied.
Indeed the aim of the research is that uses computational fluid dynamics (CFD) to investigate the performance of horizontal onshore and offshore wind turbines in steady state. The results of the CFD simulations are compared with experimental data, and the effect of different parameters on the performance of the turbine is studied. The research also investigates the use of conical ducts around the turbine to achieve high efficiencies even more than the coefficients provided by Betz's law.
2. Operational parameters of wind turbines
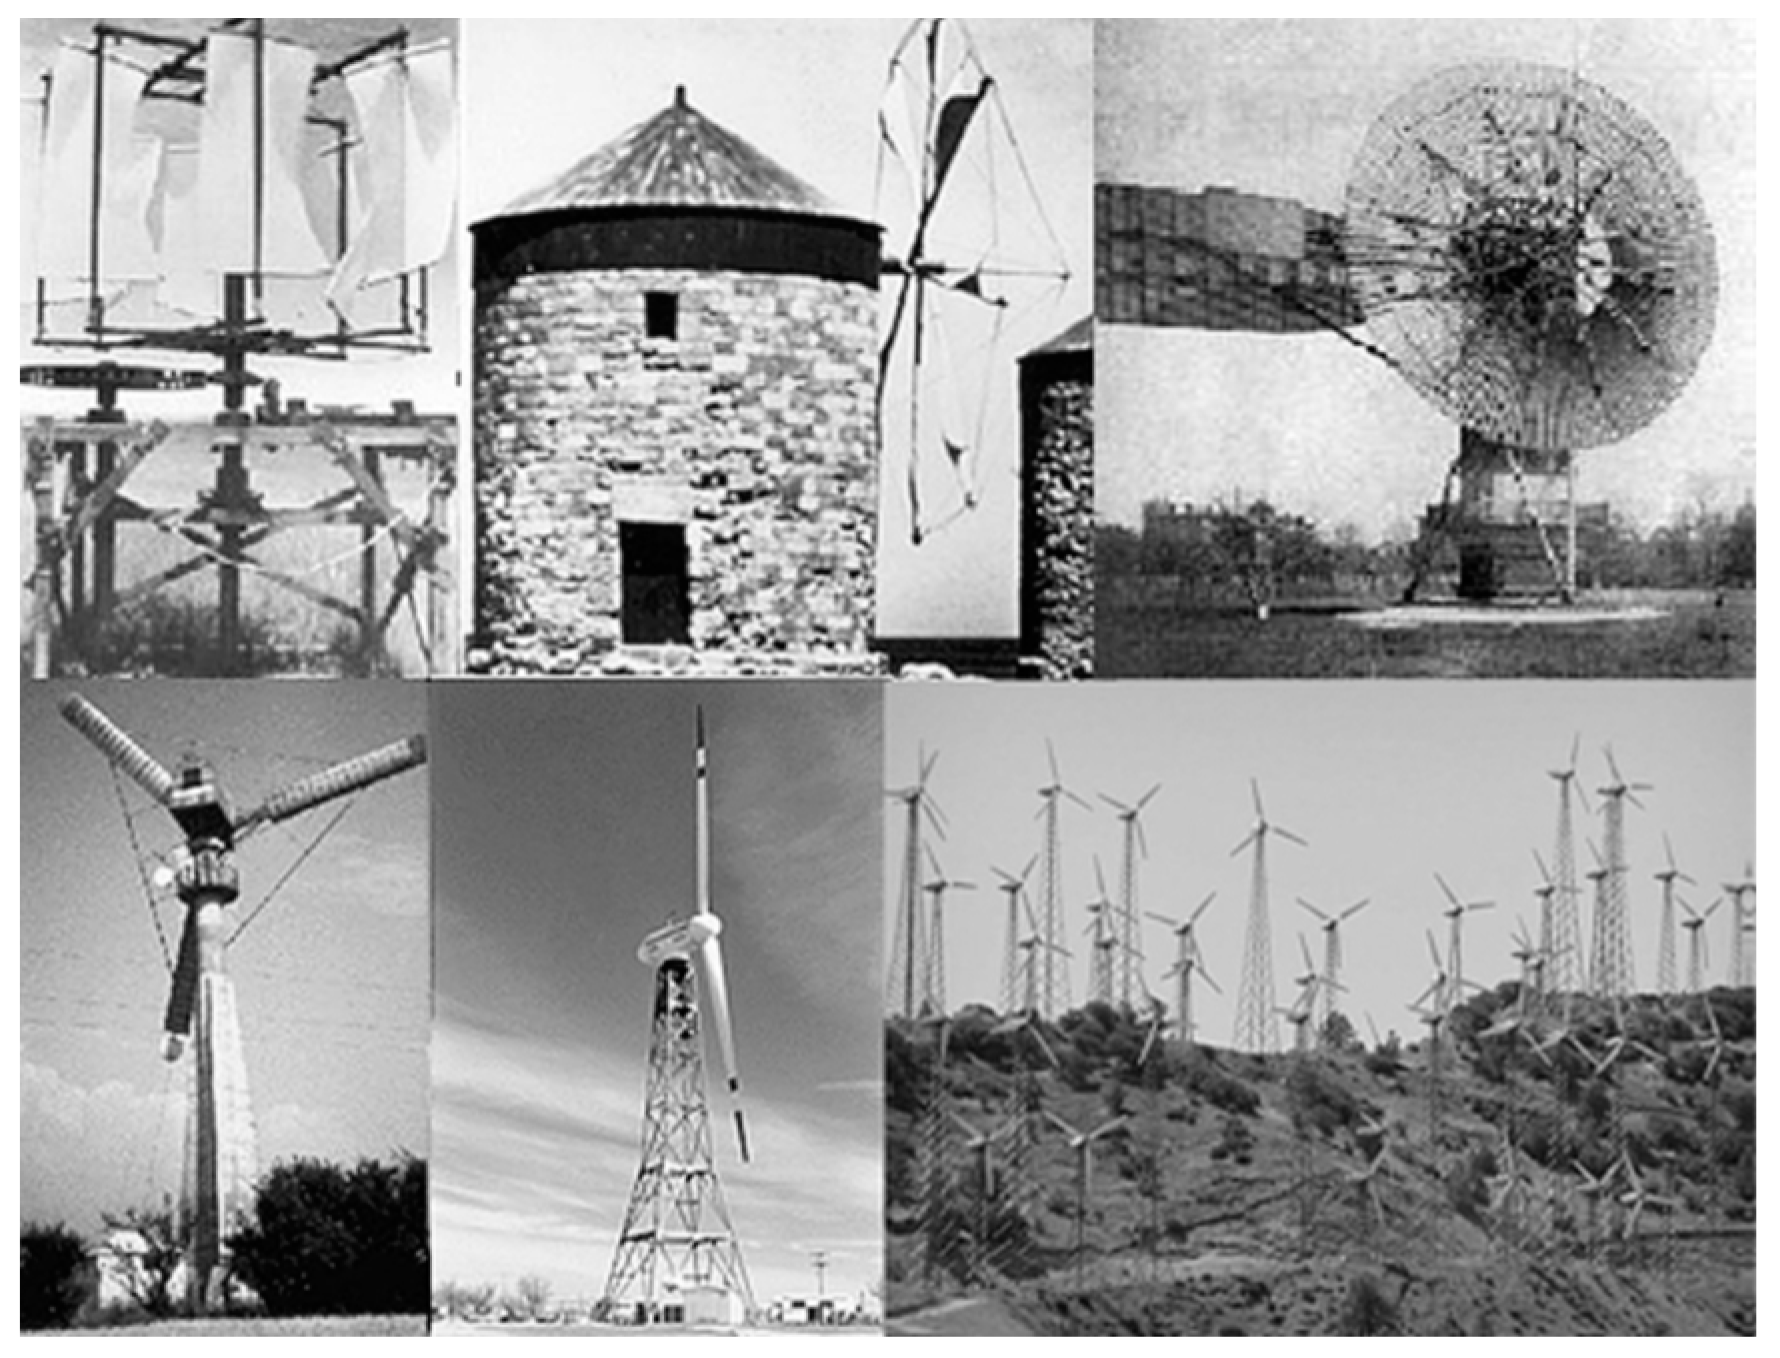
During the last few years, the security of energy supply and environmental issues have been taken into consideration. Vertical axis windmills were created around 200 years ago on the borders of Iran and Afghanistan, and horizontal axis windmills were created in the Netherlands and the Mediterranean years after that. The further development and expansion of these systems (
Figure 1) took place in the 19th century in the United States of America. Wind energy is one of the different forms of solar thermal energy, which is generated due to the heating of the earth by the sun's radiation. Also, due to the movement of the earth's position, the earth's atmosphere causes wind by transferring heat from one region to another. One of the ways to use wind energy is to use wind turbines. The task of these turbines is to convert the kinetic energy of the wind into mechanical work and generate electricity. The main advantage of using wind turbines is the ability to generate electricity in places where electricity transmission is not cost-effective due to the loss caused by the transmission and the cost of the cable. In general, the applications of wind turbines can be divided into two parts: applications disconnected from the grid and applications connected to the grid. Off-grid applications include battery charging, power generation in remote areas, providing energy for temporary bases, and providing electricity for recreational boats. Grid connected applications also include individual wind turbines and wind farms.
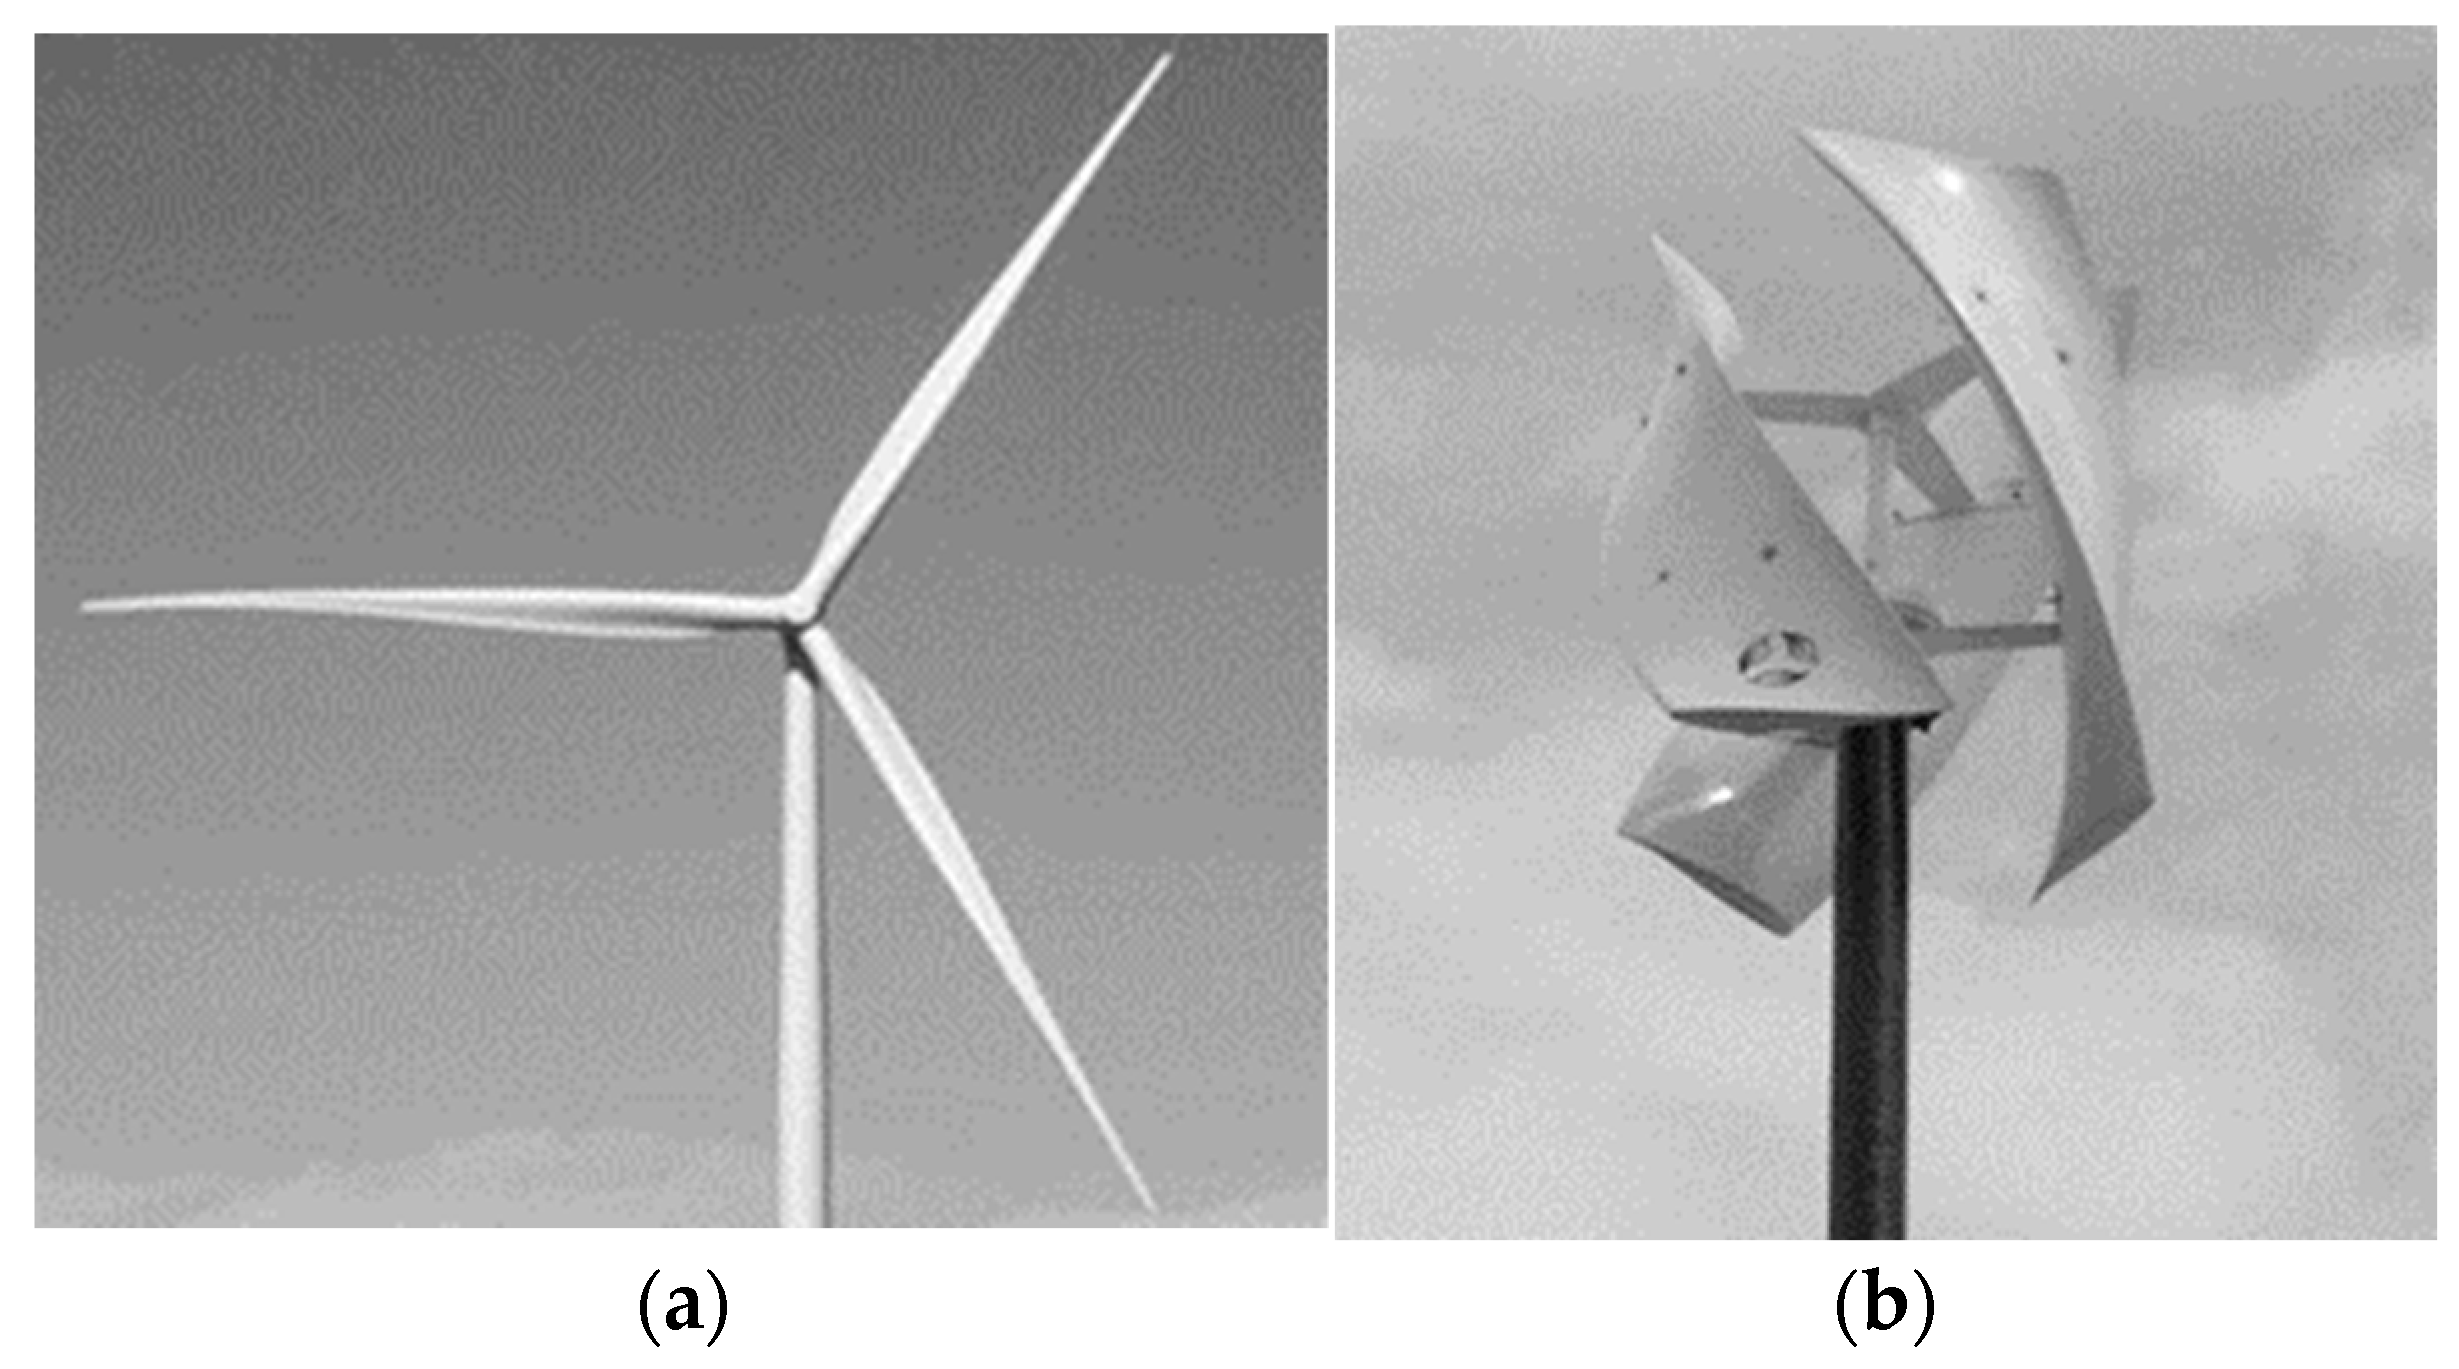
Research on wind turbines has been continued in two main models, horizontal axis and vertical axis.
Figure 2 shows a three-dimensional view of two types of vertical axis wind turbines (
Figure 2 above) and horizontal axis (
Figure 2 below).
Horizontal axis wind turbines are the most commonly used wind turbines due to their high efficiency. In terms of the number of blades, the general rule is that the higher the wind speed, the less number of blades needed. The advantages of horizontal axis turbines include high efficiency, uniform torque generation, the ability to produce electrical energy at low speeds, the ability to be used in uneven terrain, and minimum damage in storms. These turbines have disadvantages such as the difficulty of transportation, hard work near the ground level, difficulty in installation and start-up, making abnormal noise and difficult maintenance. Also, these turbines need a mechanism to adjust against the wind.
Vertical axis wind turbines have a part called the rotor to which the blades are connected. In this type of turbines, the main rotor is placed vertically. Considering the great variety, these turbines can be classified into three general categories: Darius, Savunius, or a combination of these two categories. The main advantage of vertical axis wind turbines is the presence of a moving member (rotor) and they do not need a diverting mechanism (torque axis change gearbox) because this type of turbines control the wind from any direction. The blades of these turbines may have a uniform cross-section without warping, which makes their construction relatively easy; however, the blades in horizontal axis turbines are conical and twisted in order to have optimal performance, which causes complexity in their construction and design [
7].
In most cases, offshore wind turbines will have three blades and onshore wind turbines will have two blades. In general, it can be stated that three-bladed wind turbines have more mechanical torque than two-bladed turbines, while at the same time, they will have a lower rotational speed. Also, due to the increase in the drag force and lift applied on the rotor, the resistance of the wind flow caused by the formation of vortices caused by the tip of the blade is also applied to it. Onshore wind turbines, which are mainly used to generate electricity, need to operate at higher speeds and actually do not need more torque. The main problem that wind turbines with two blades have is the effect of vibration on its performance. This problem in offshore wind turbines will be reduced by increasing the number of blades and the intensity of vibrations will improve. In fact, it can be stated that the amount of noise and depreciation is higher in two-bladed turbines compared to three-bladed turbines.
One of the most important parameters that can be considered in relation to the concept, analysis and design of horizontal axis wind turbines is the blade tip speed ratio parameter. The tip speed ratio will be defined as the ratio of blade tip speed to free wind speed. This parameter strongly depends on the hydraulic efficiency of horizontal axis wind turbines, so that its increase will increase the hydraulic efficiency; but the problem that arises in this regard is the increase in noise and vibration in the turbine, for this reason, the selection of this parameter will play an essential role in the design of wind turbines. This parameter is reported in relation 1. In general, in low speed wind turbines this ratio is between 1 and 4 and in high speed turbines between 5 and 9.
In this relation, ω is the angular velocity of the rotor, R is the radius of the rotor, and V is the wind speed. Another parameter that is very important in the discussion of wind turbines is the Betz limit. Albert Betz, a German physicist, proved that a wind turbine can extract a maximum of 50.73% of the wind energy that blows in its direction. The third is the speed upstream of the rotor. Thus, the value of the maximum power factor (in ideal conditions) will be equal to 0.50.
3. Geometry of onshore wind turbine
Wind turbine modeling will create a challenging role on numerical simulation. To investigate the performance of horizontal axis wind turbines, two types of NREL coastal and offshore wind turbines have been investigated. The offshore wind turbine [
15] (
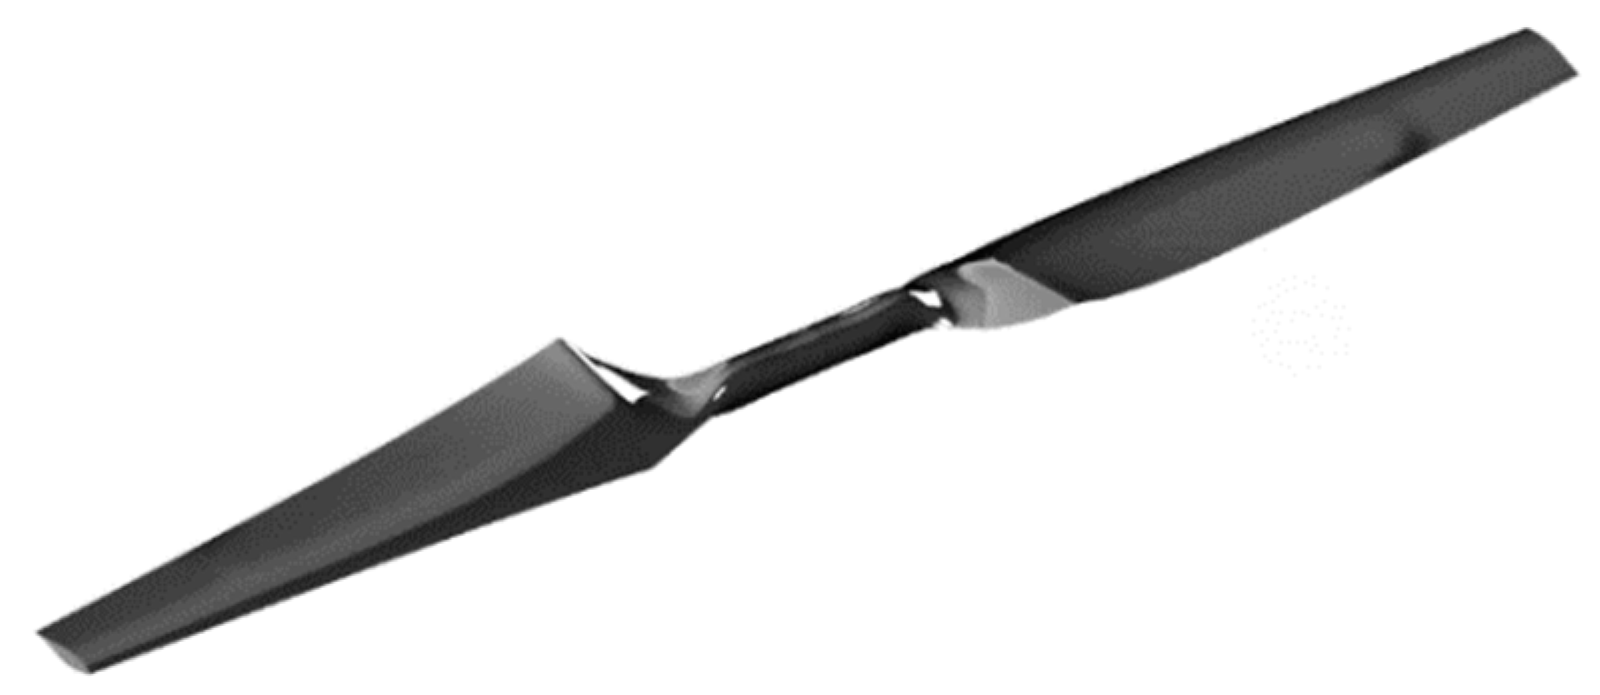
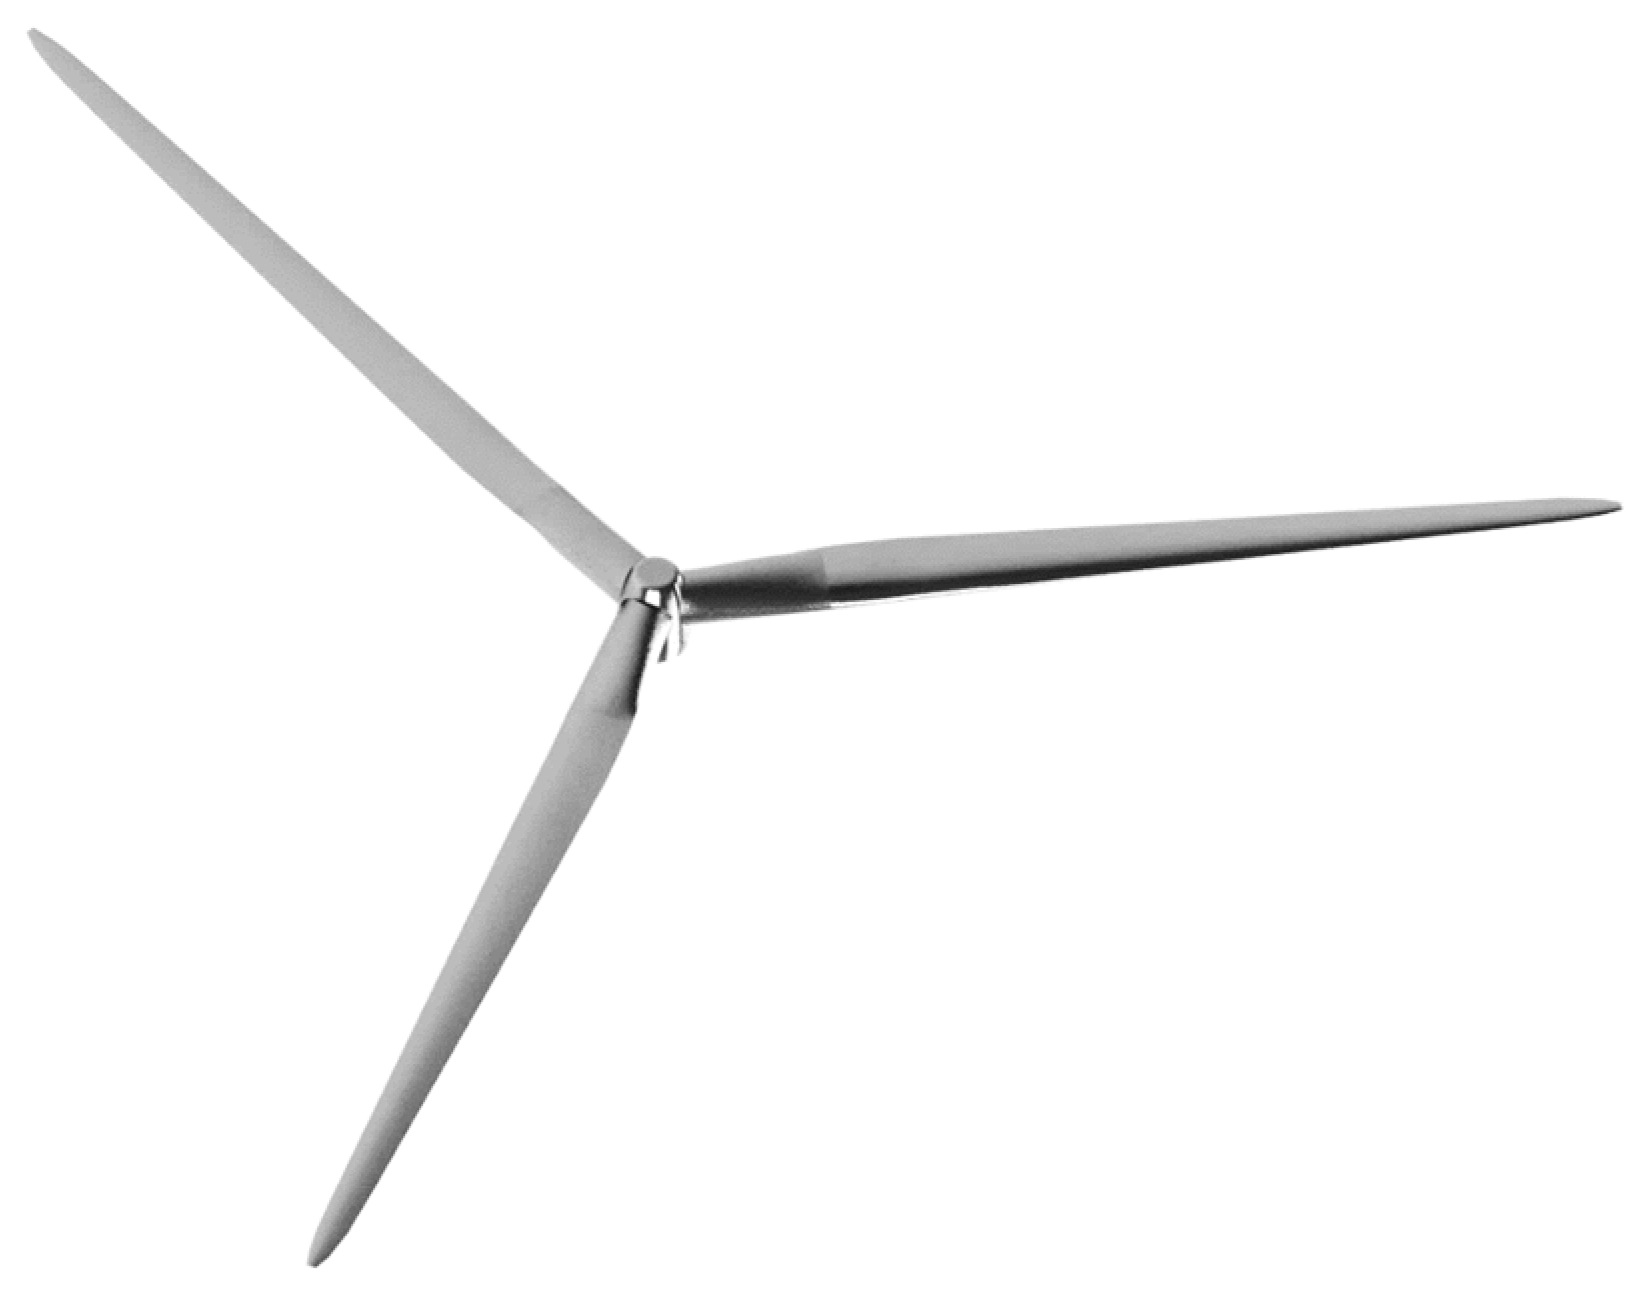
Figure 3) consists of two blades and has a diameter of 10.058 meters and is designed based on the S809 airfoil. Also, the 5 MW offshore wind turbine that was created by improving the DOWEC project has reliable results whose isotropic view is shown in
Figure 4 [
16].
4. Numerical solution
Computational fluid dynamics has been used for simulation. Three-dimensional time averaged Navier-Stokes equations and SST k-ω turbulence model have been used to calculate and analyze the turbulent flow in the flow field around both onshore and offshore wind turbines for a better evaluation of the swirling flow. To discretize the three-dimensional equations of Navier-Stokes and turbulence equations, the second order method has been used. In the present work, the performance of onshore and offshore wind turbines in steady state has been evaluated. The computational domain analyzed can be seen in Figure 5. The boundary conditions of this geometry will be such that the duct and the outlet boundary condition have a remote (open) boundary condition and its speed is equal to the rotation speed of the wind turbine. The rest of the walls will have a no-slip boundary condition. The inlet boundary condition placed in front of the duct inlet will be uniform velocity [
17,
18,
19]. Also, the flow entering the duct is turbulent, and its turbulence intensity is assumed to be 5%. The equations governing the flow are obtained based on relations 2 and 3 for continuity and momentum, respectively.
where
is the mean pressure,
μ is the molecular viscosity and
is the Reynolds stress. This model is based on the hypothesis of Boussinesq [
20], which relates the Reynolds stress to the velocity gradient. Due to the fact that the flow is turbulent, the additional transfer equations for the turbulence model must be solved. Also, in
Table 1 and
Table 2, the operational conditions of onshore and offshore wind turbines are reported respectively.
5. Grid
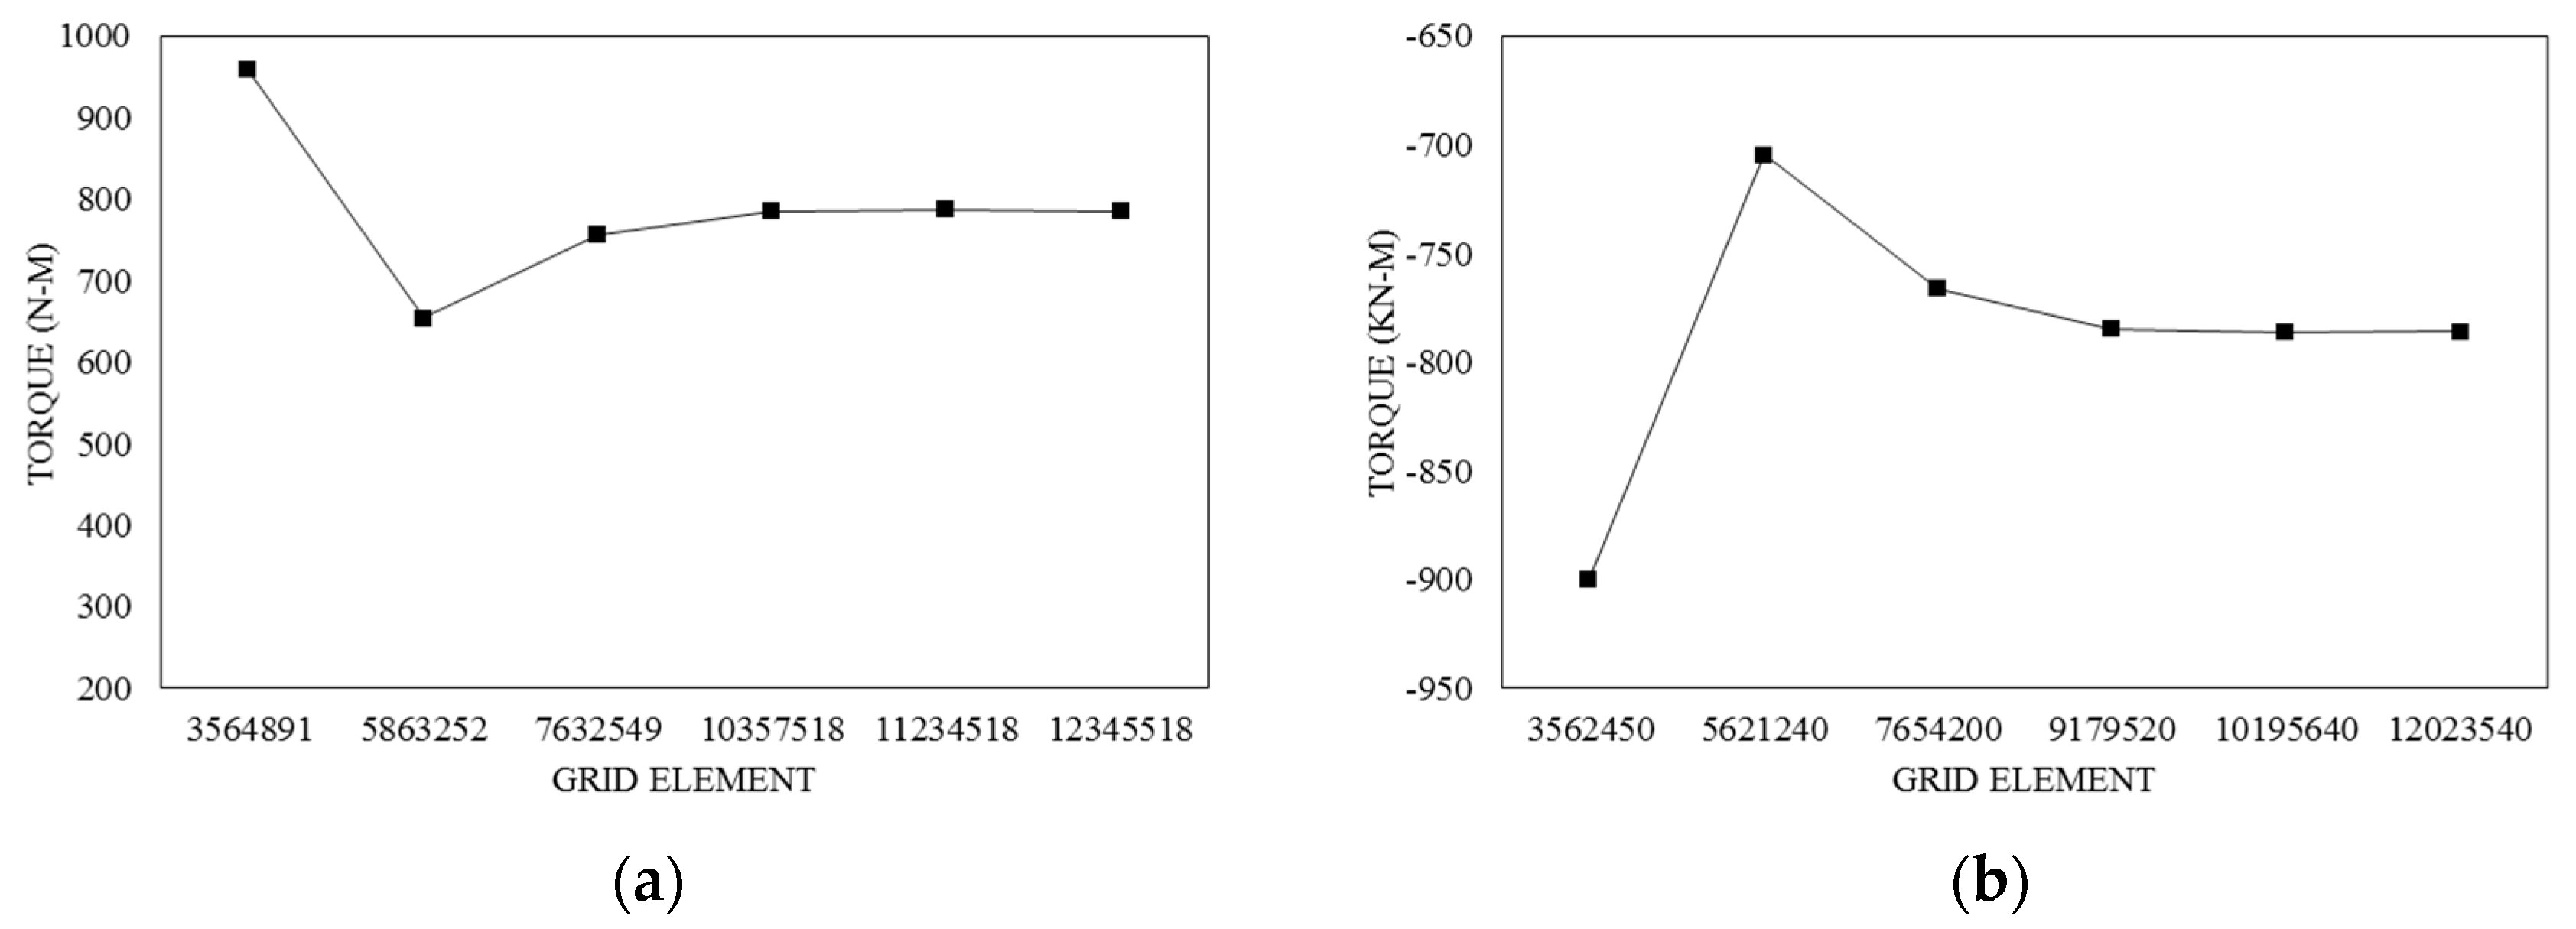
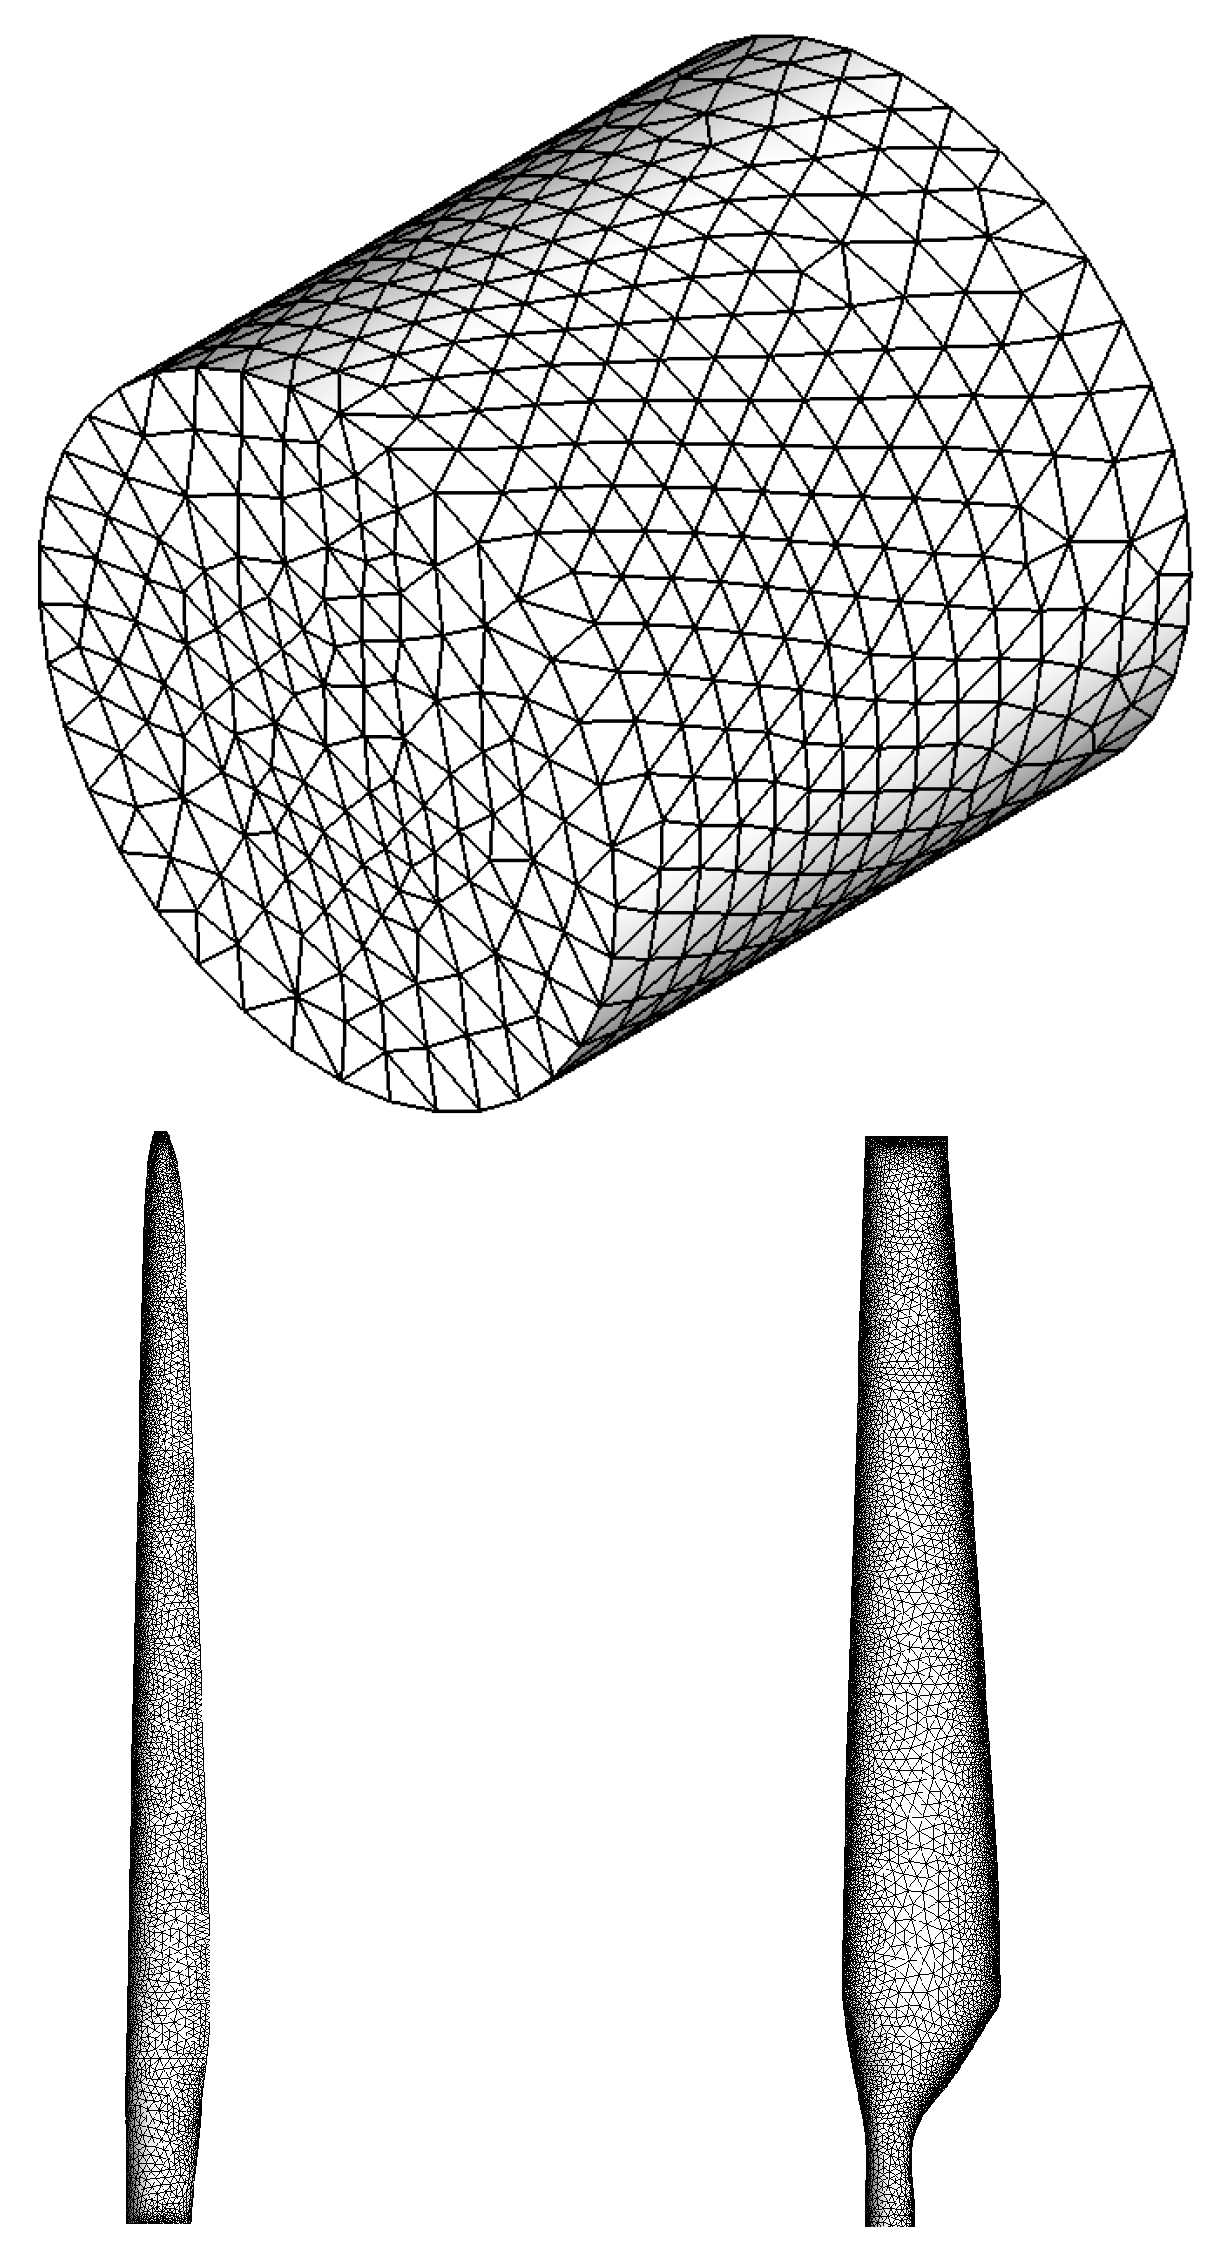
Grid for both wind turbine modes has been done without organization. The cells used in this type of grid will be tetrahedral. In order to check the accuracy of the problems, the grid independence test was used and after checking different grids, finally the best type of grid was selected (
Figure 6 and
Figure 7). In both cases of wind turbine, the number of boundary layers is considered equal to 20. The value of y
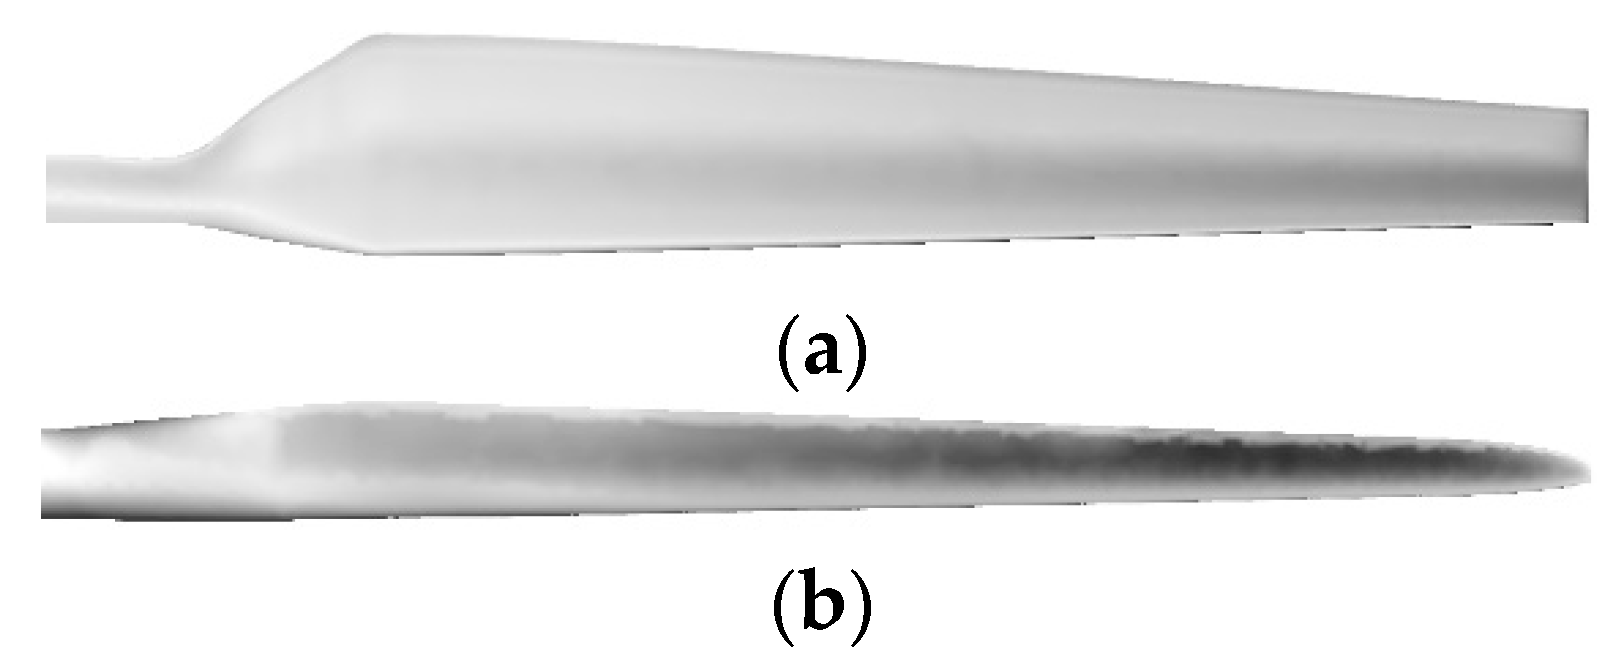
+ in this grid is less than one, which can be seen in
Figure 8, the contour of y
+ along the length of the blade. As it can be seen, the value of y
+ at the tip of the blade will be greater than its root, and the reason for it can be considered to be the increase in speed at the tip of the blade according to the relation y
+.
6. Results
Onshore wind turbine: The steady state of axial wind turbine has been investigated by numerical solution and its results have been compared with experimental data [
7]. According to these results, it can be said that the simulation results have acceptable accuracy. For simulation in this case, according to the conditions explained in
Table 1, the torque and power of the wind turbine will be obtained using Equation (4).
where
P will be the mechanical power,
T will be the torque of the turbine and
Ω will be the rotational speed.
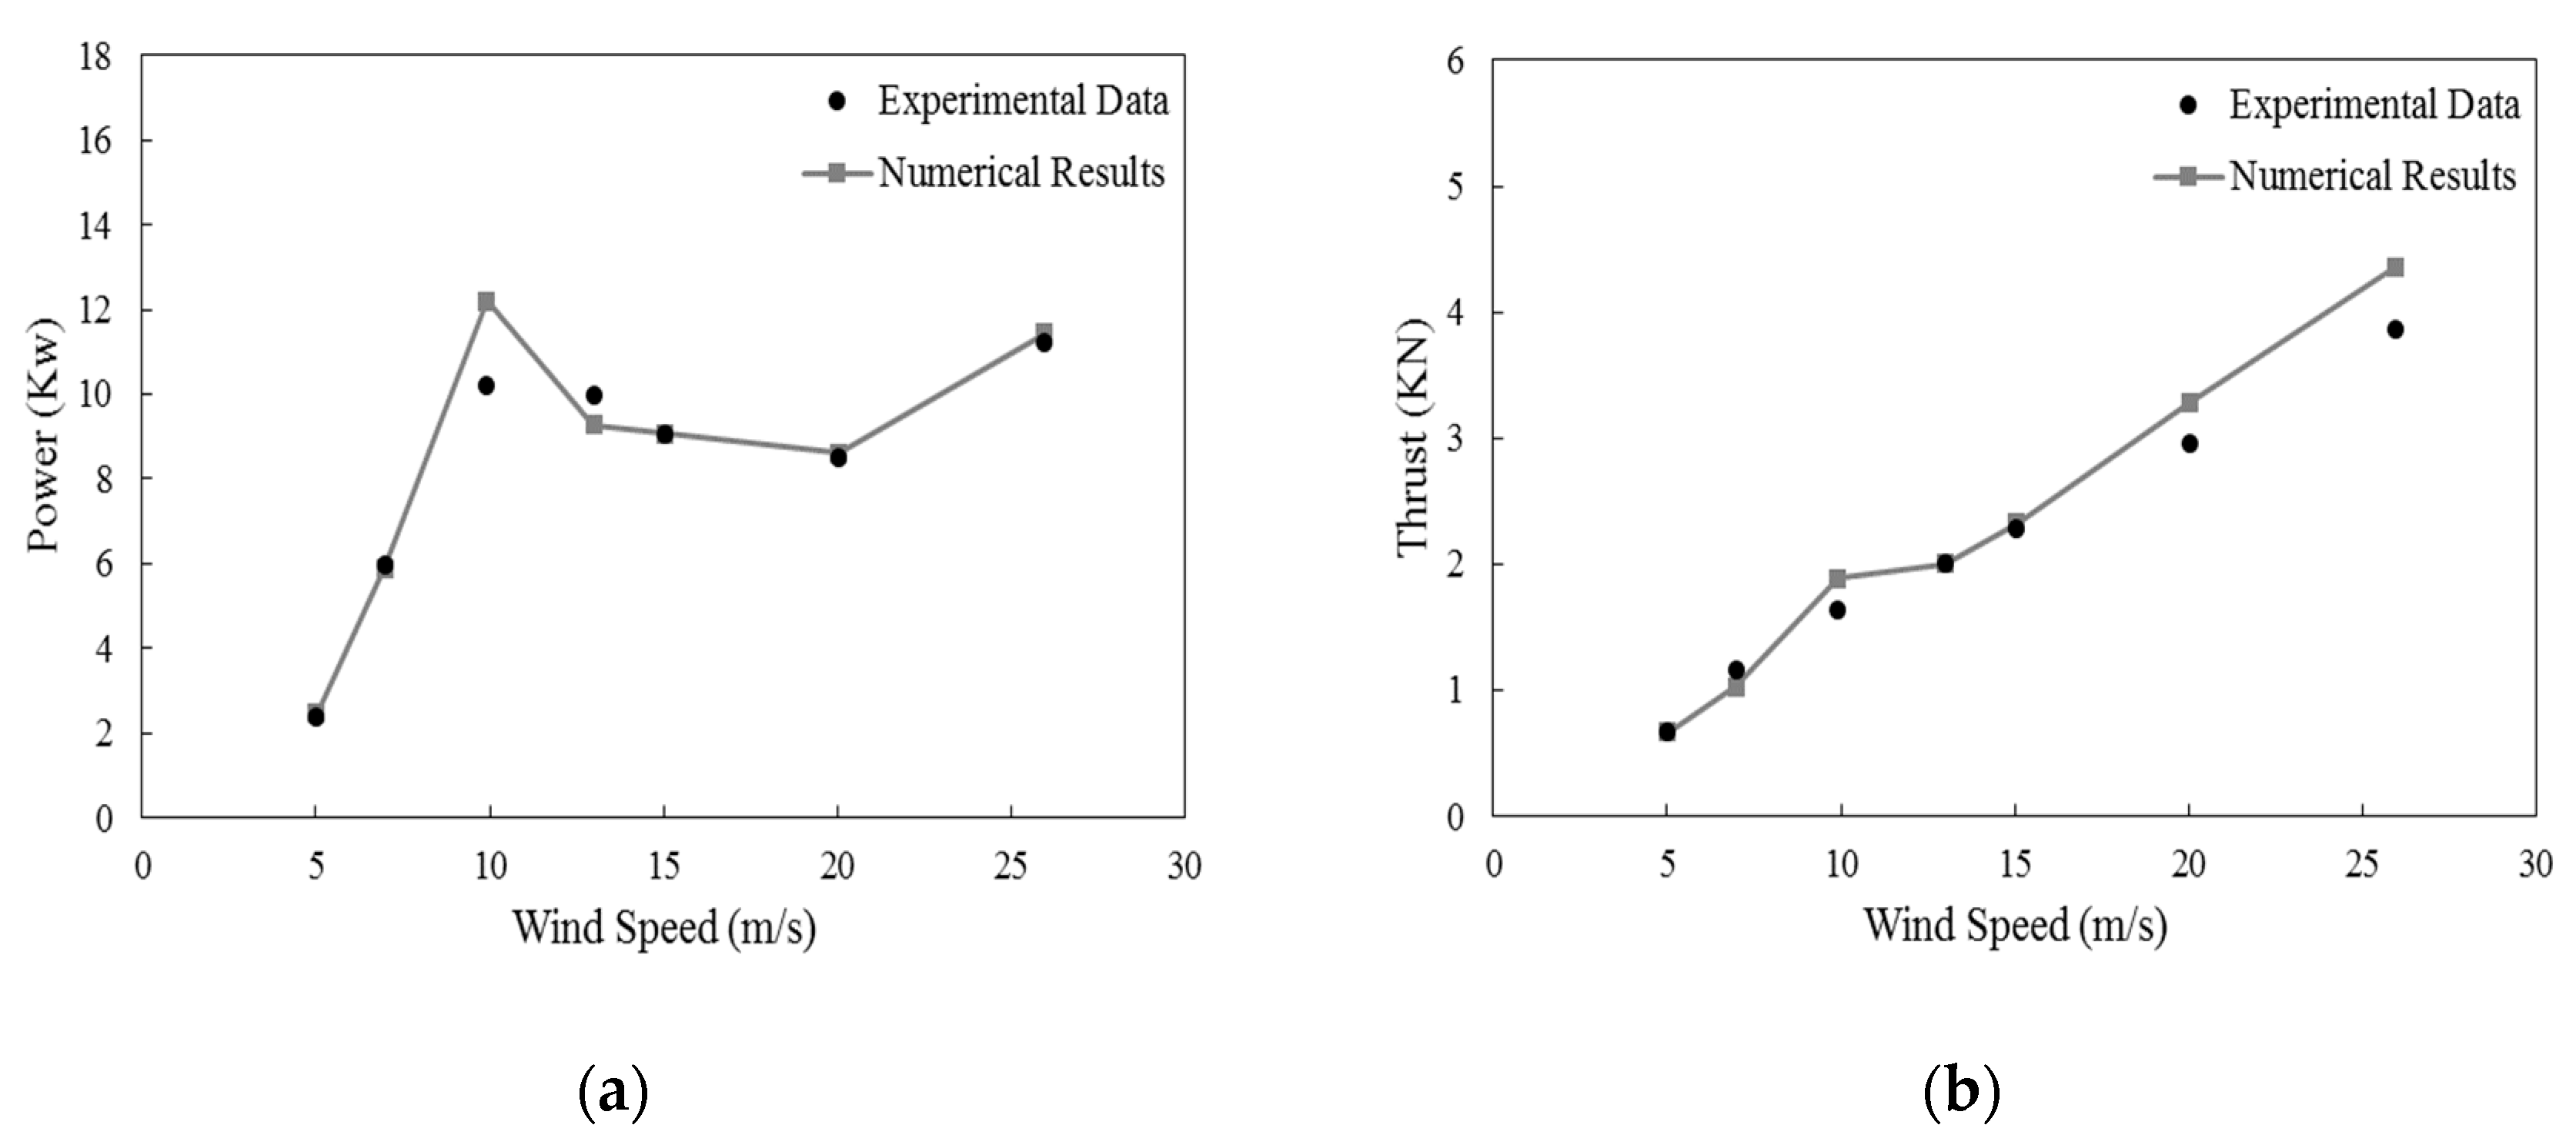
Figure 9 (a) shows the mechanical power obtained from the horizontal axis wind turbine, which is compared with the experimental data. As it is clear, in both graphs, the maximum error is created in the wind speed of 10 meters per second, but in other wind speeds, the results will be very accurate. The average error in these two graphs will be about 5%.
Figure 9 (b) shows the graph related to the turbine thrust, which is compared with the experimental data. As the wind speed increases, the amount of thrust also increases due to the increase in pressure behind the turbine. According to the graph, it can be stated that the accuracy of the numerical solution has decreased slightly with the increase in wind speed. The average error in this graph will be less than 8%.
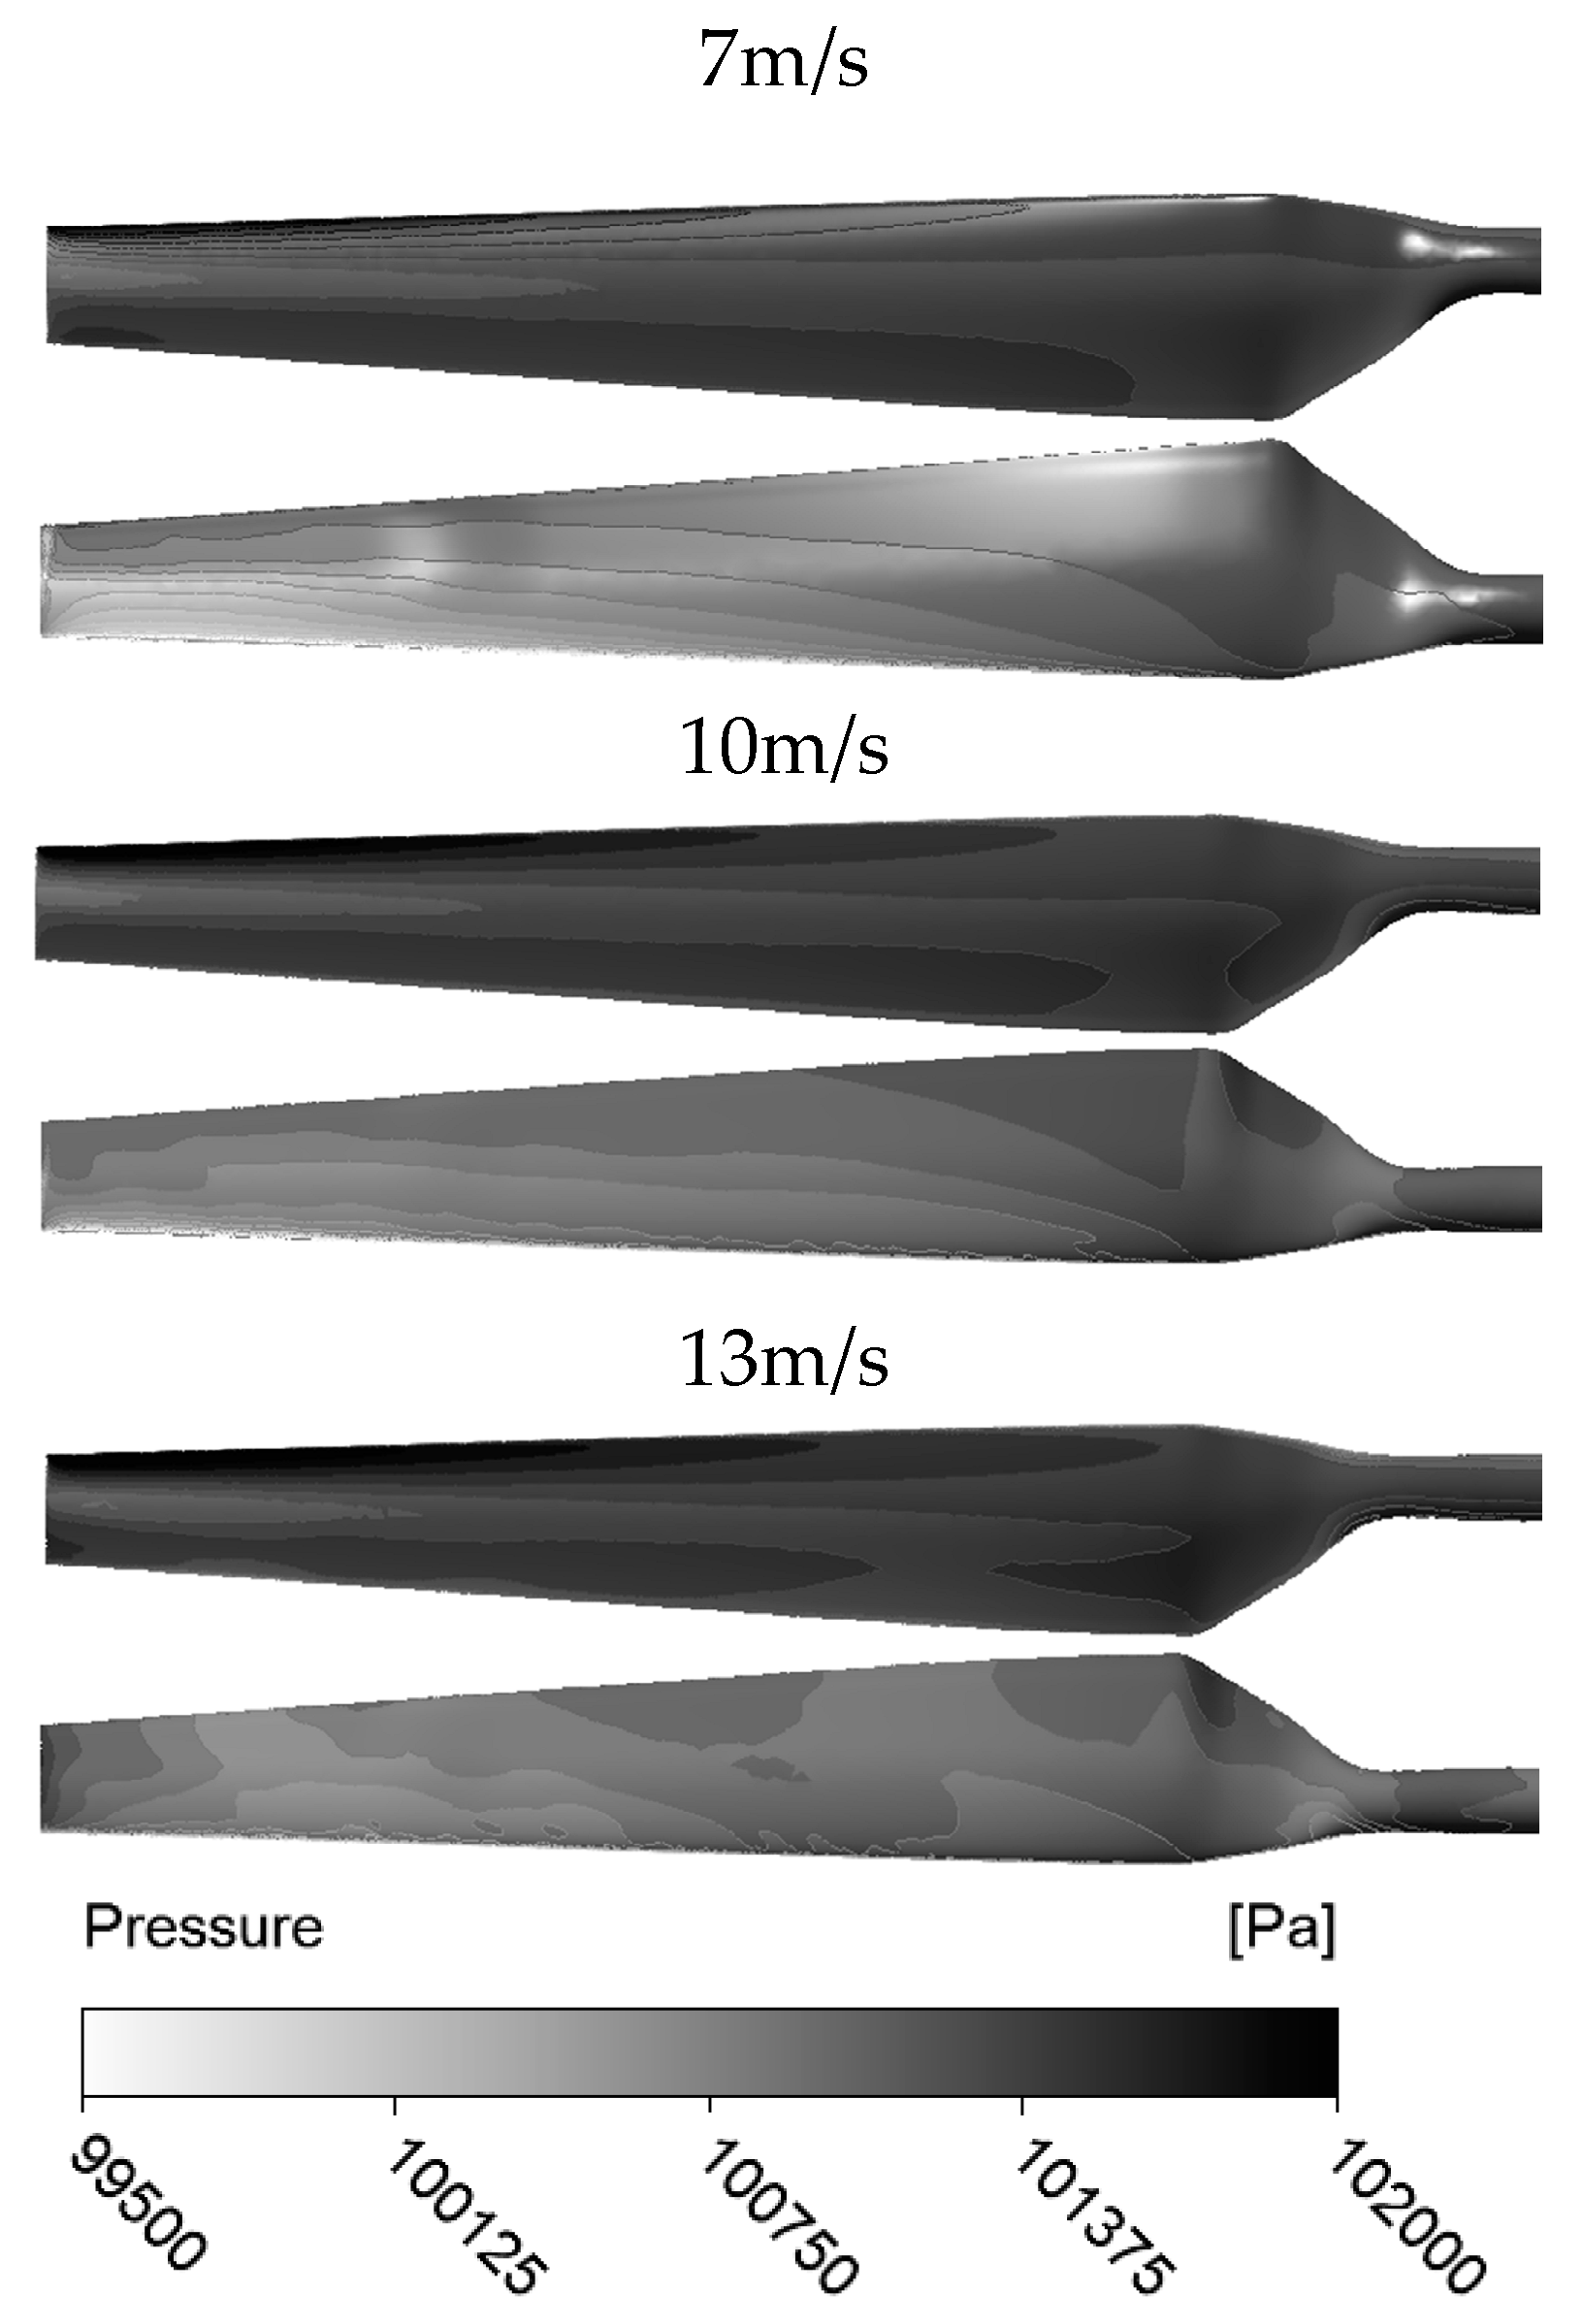
The pressure distribution on the pressure and suction surface of the wind turbine blade is shown in
Figure 10. As shown in the diagram of
Figure 9, the propulsion increases with the increase in wind speed, so the pressure on the suction surface also increases. By increasing the minimum speed, the pressure on the blade surface decreases and it can be said that it increases the pressure.
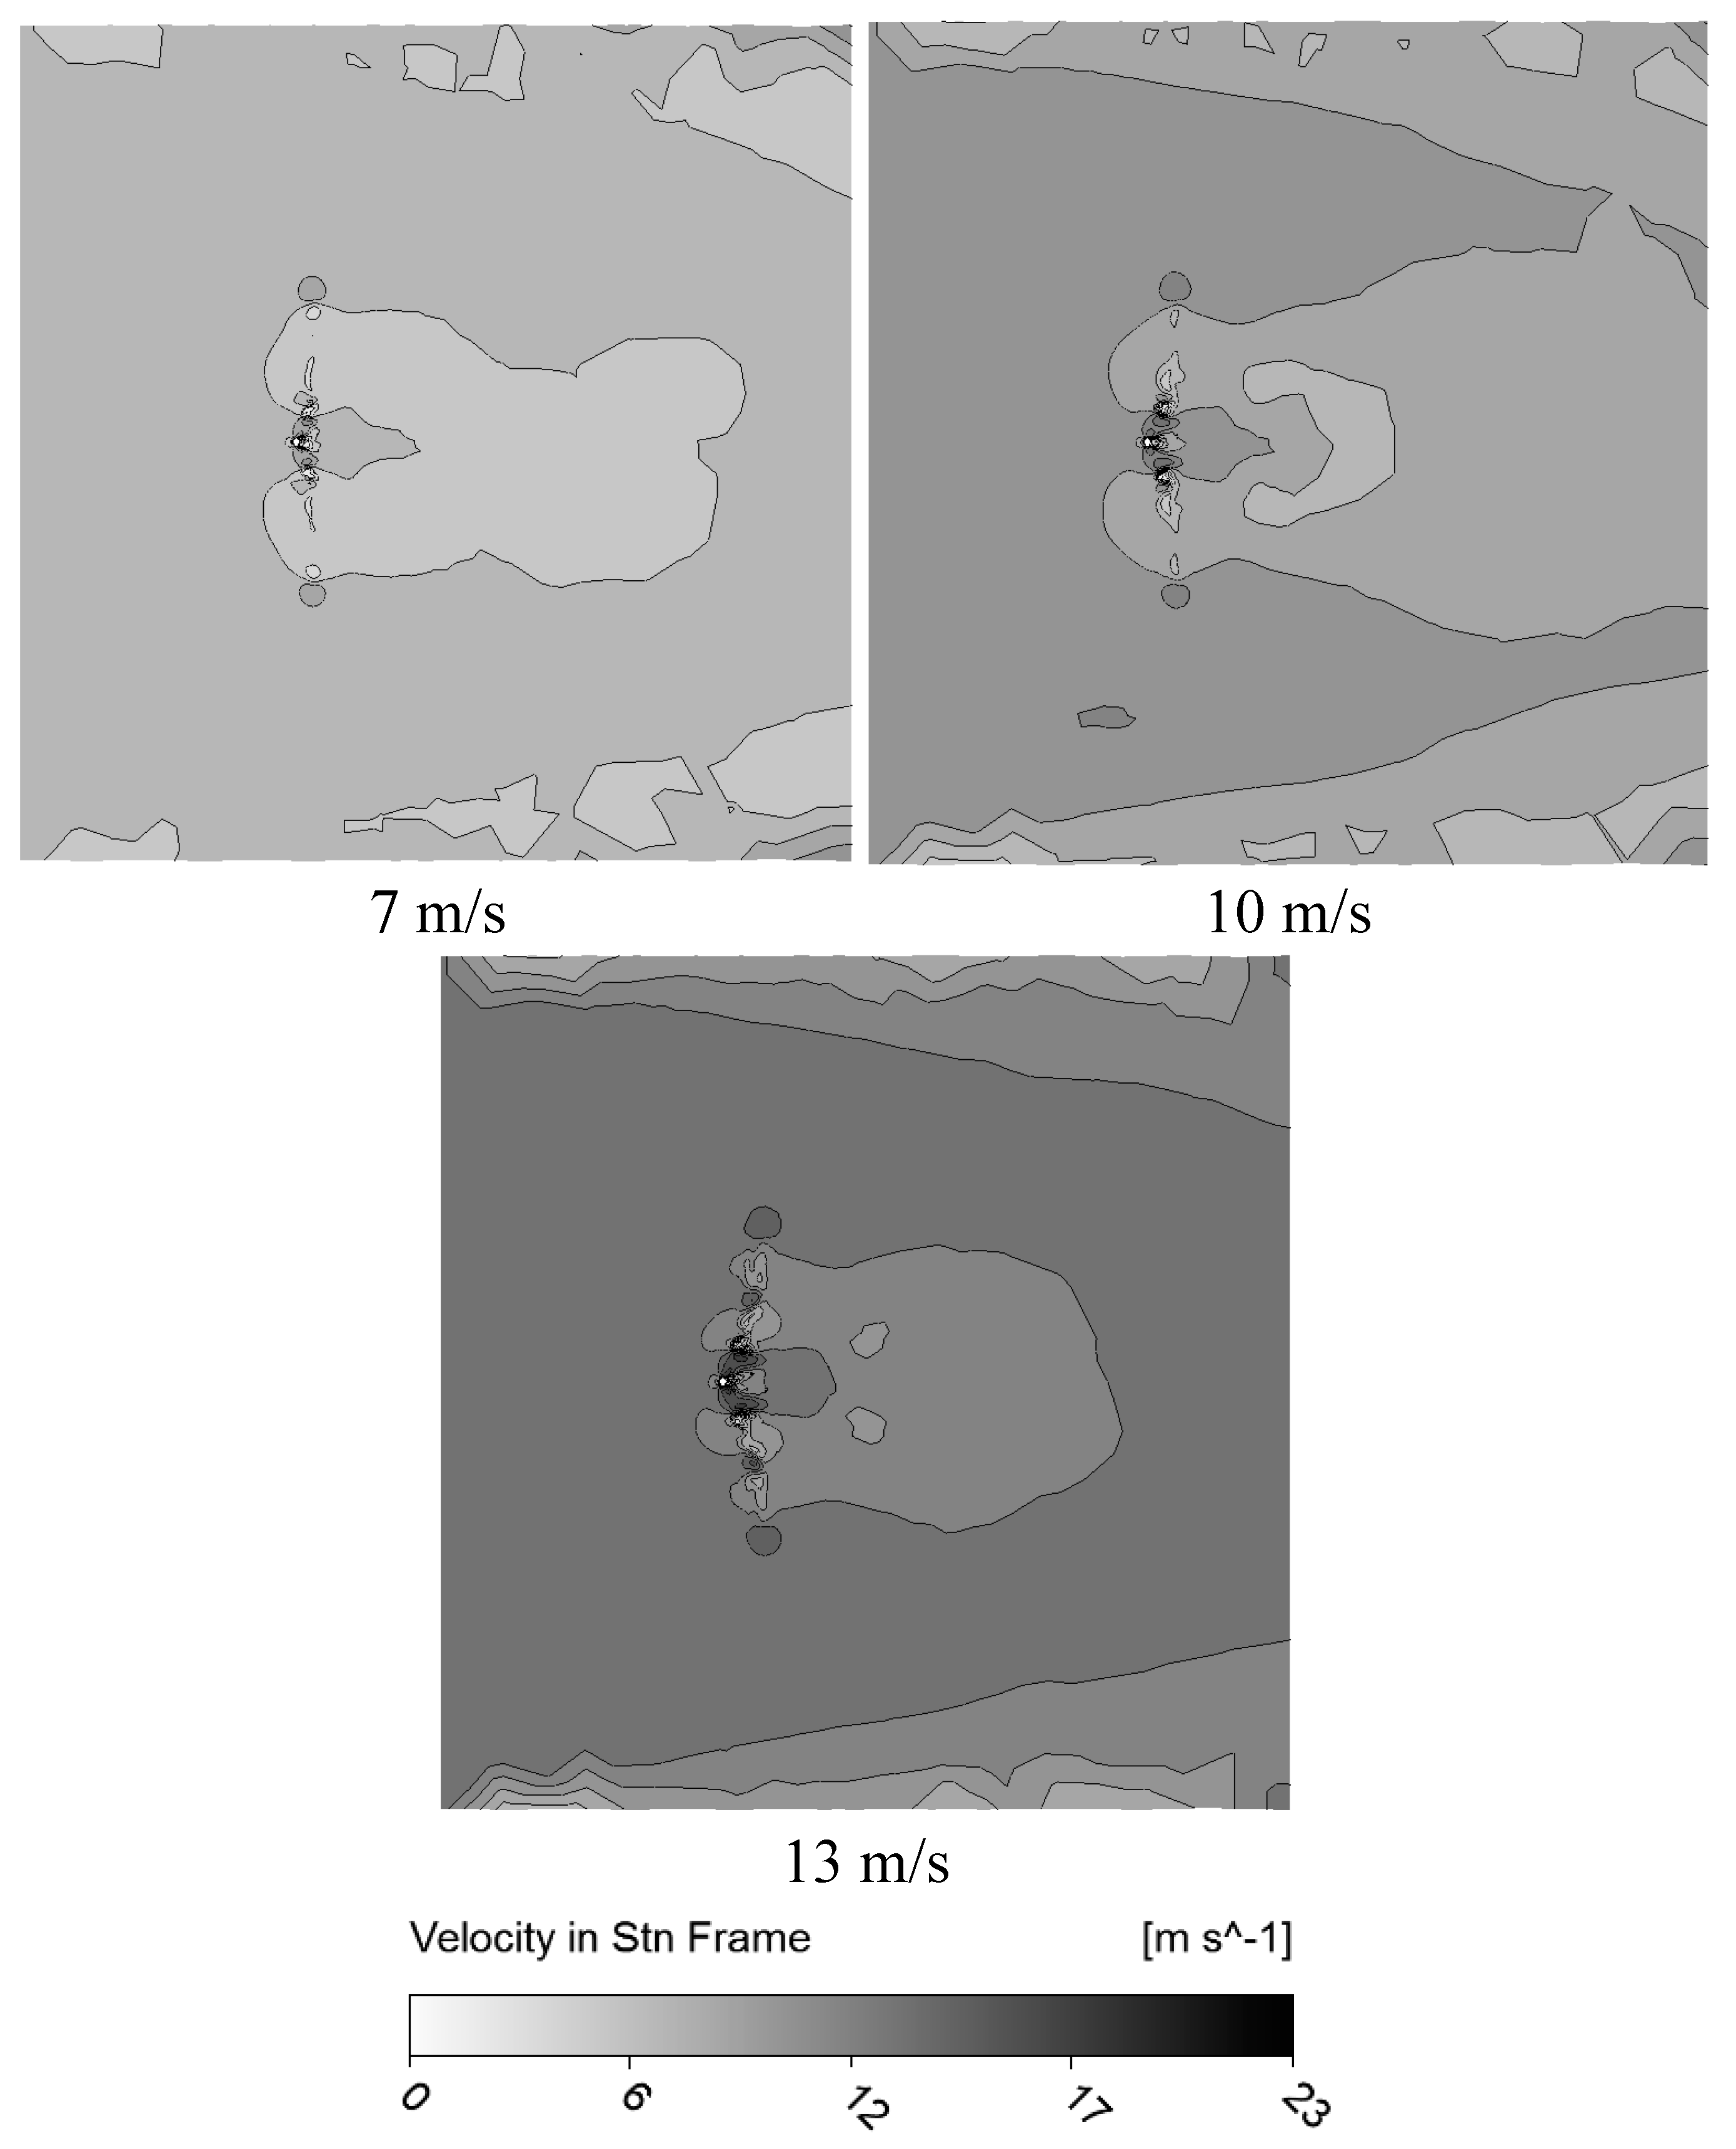
The speed distribution in the plane passing through the center of the wind turbine is shown in
Figure 11. This speed distribution was obtained at wind speeds of 7, 10 and 13 meters per second. The maximum value of this speed is created at the tip of the wind turbine blade. The blue area behind the turbine is caused by the vortices that are created. As the wind speed increases, this area will move further back. The speed at the tip of the blade has also increased with the increase in wind speed.
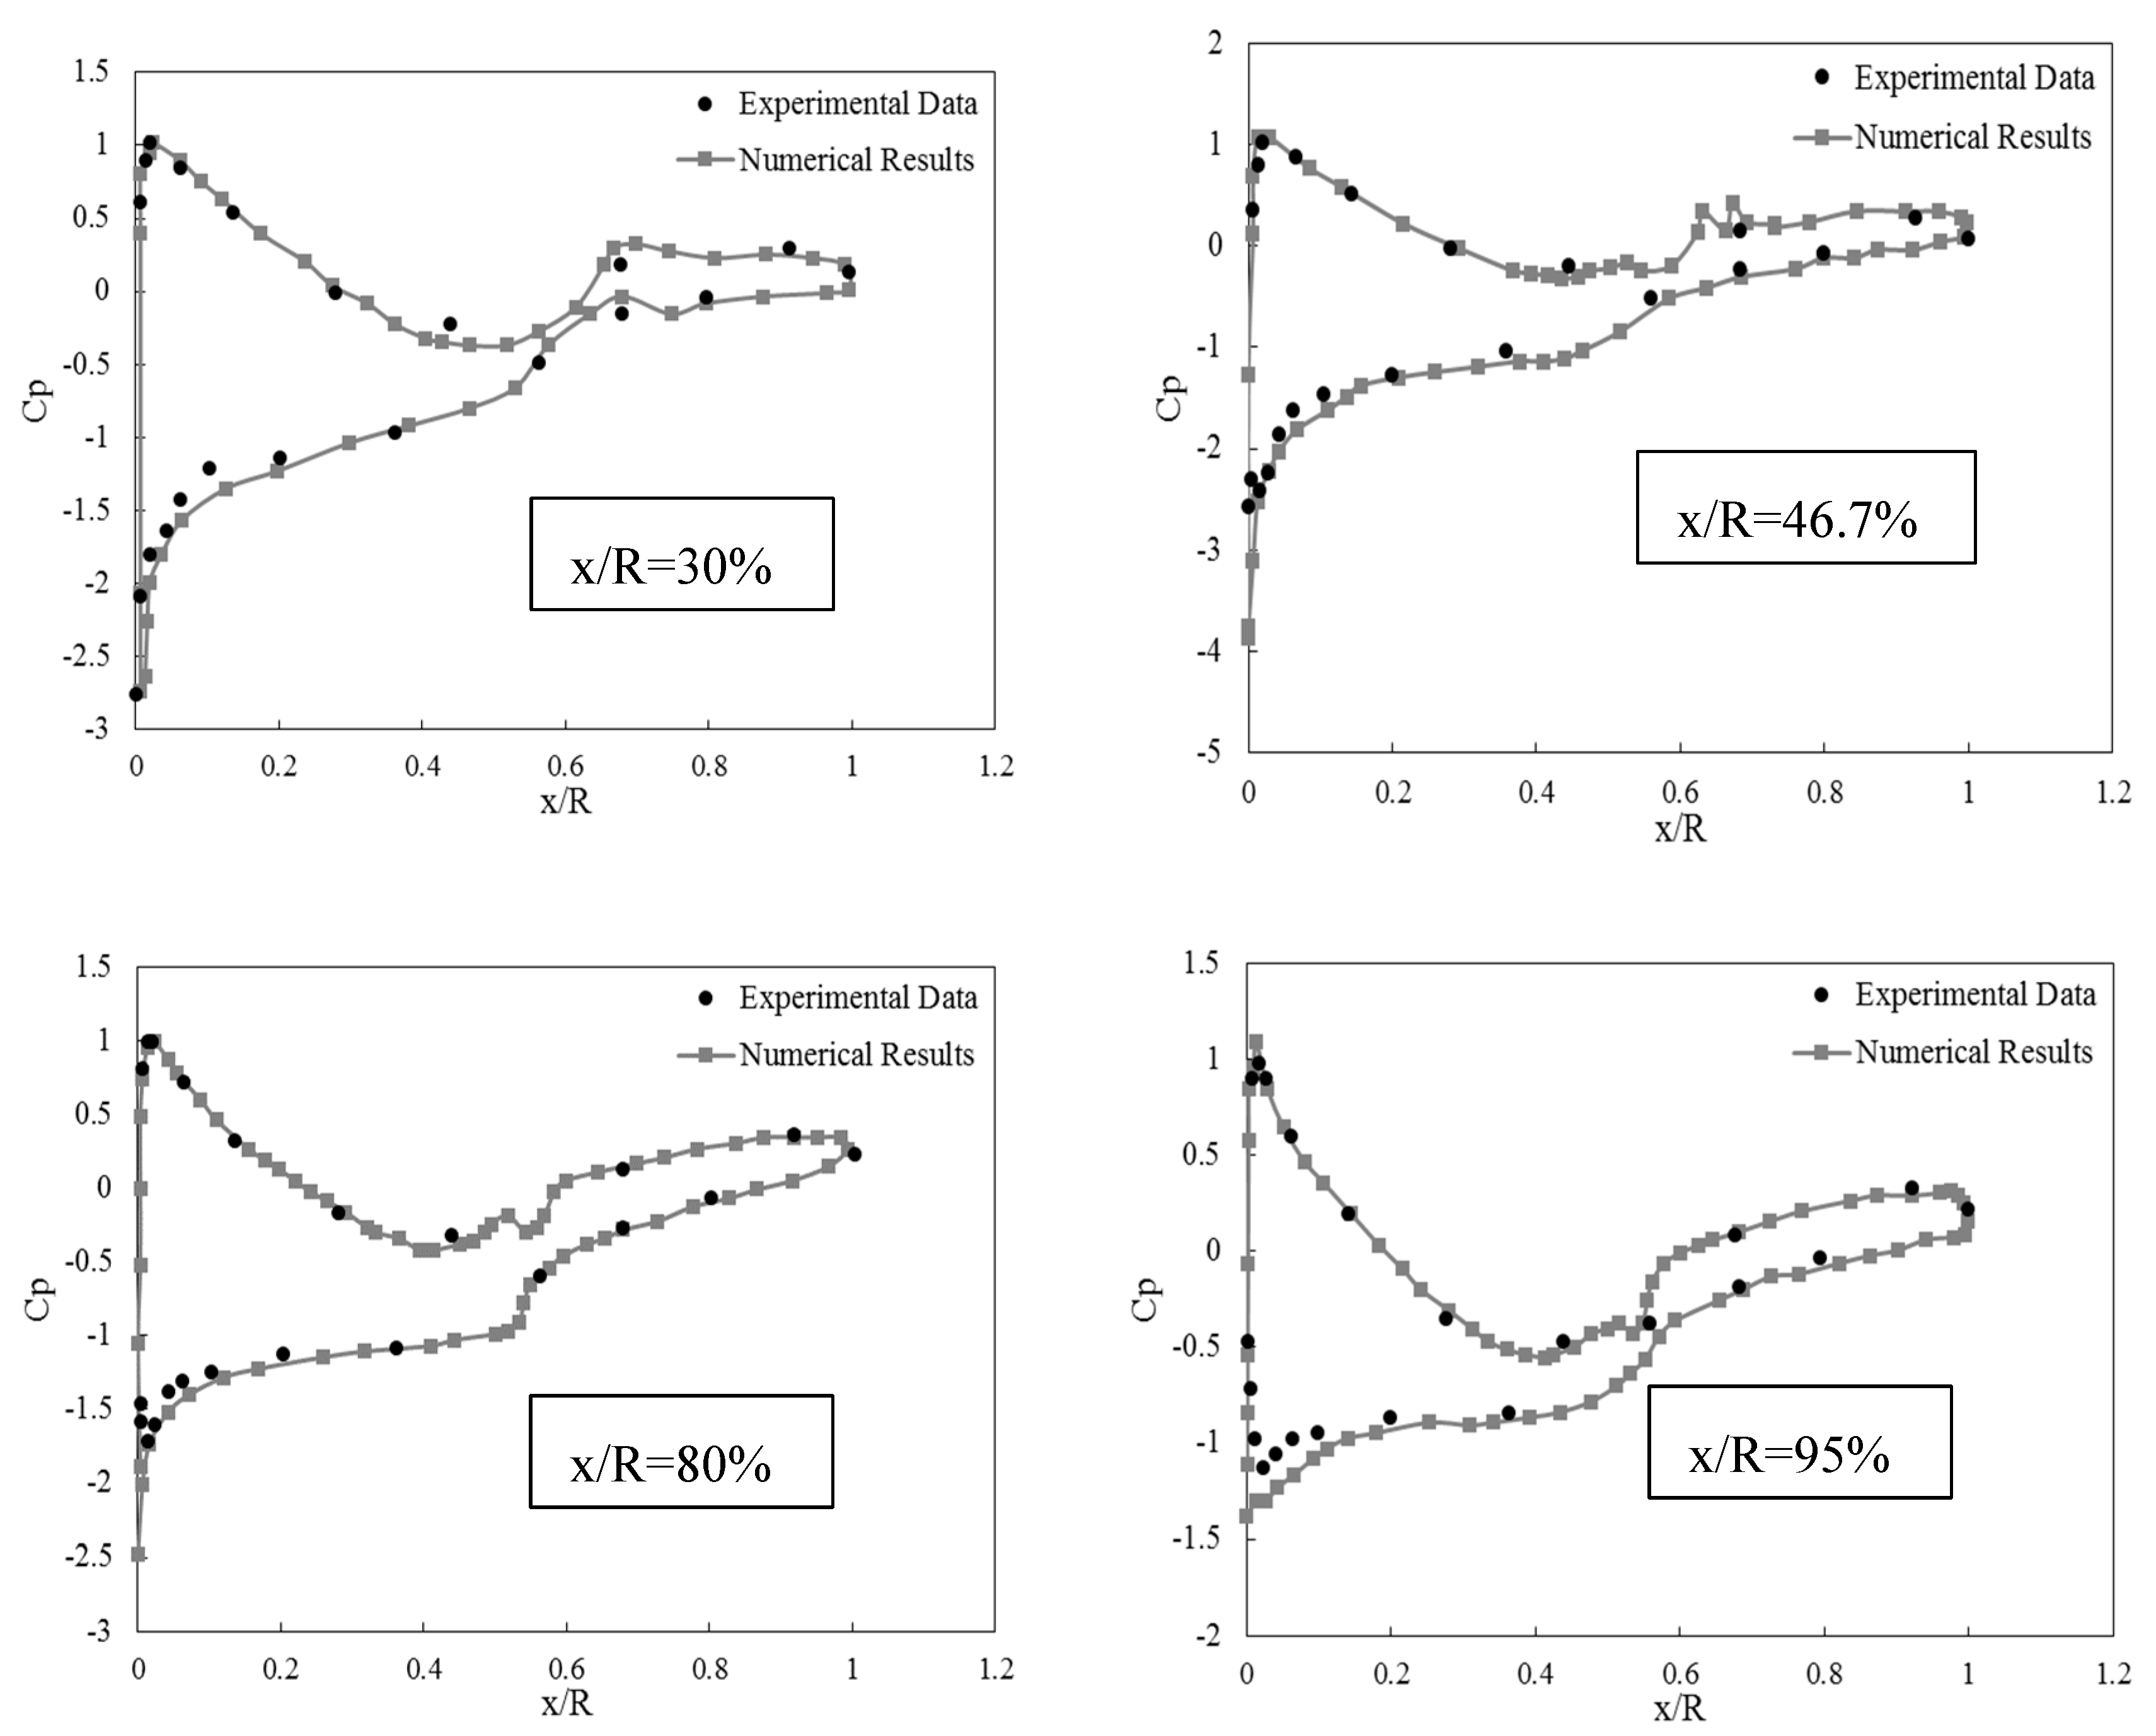
Figure 12 shows the pressure distribution at a wind speed of 7 meters per second, which has been compared with the experimental data. These results were obtained in four x⁄ sections (R=30, 46.7, 80, 95%). As it is known, the results are very close to the experimental data. In some places, there are differences that are caused by the turbulence model, which cannot predict the separation flow well. The pressure coefficient will be obtained according to Equation (5).
where
P is the pressure,
P∞ is the reference pressure,
ρ is the fluid density, and
V∞ is the infinite speed.
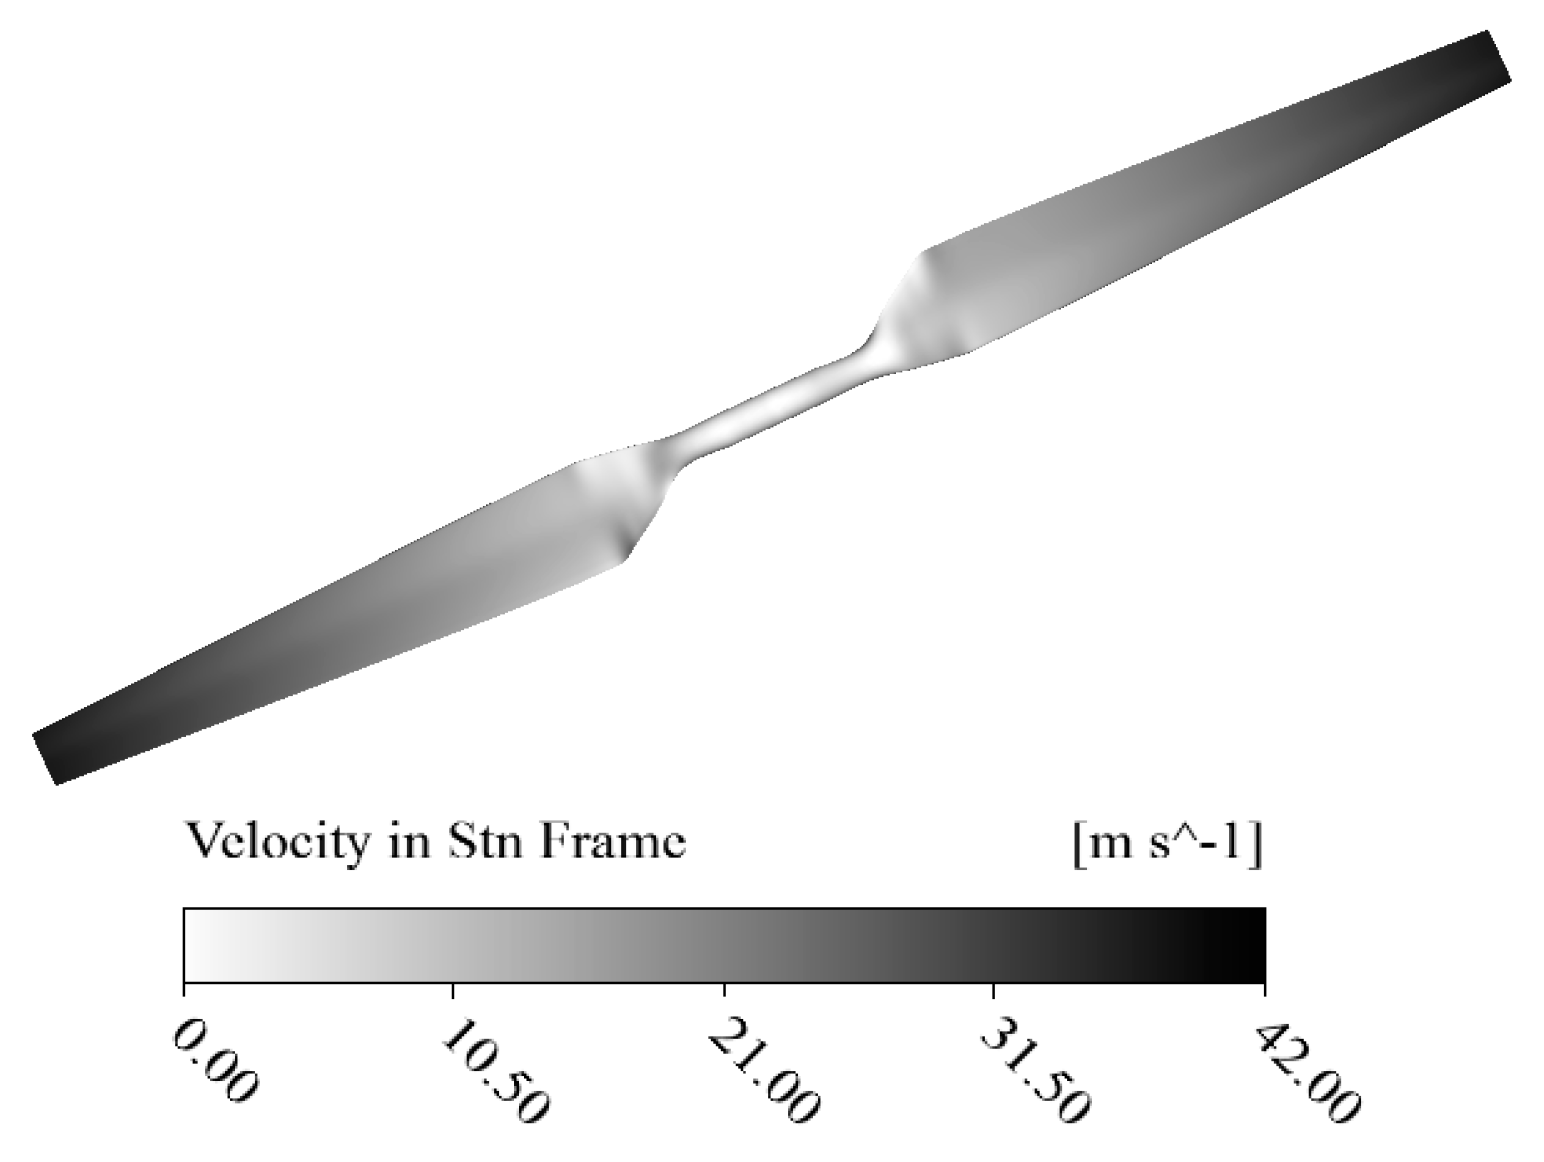
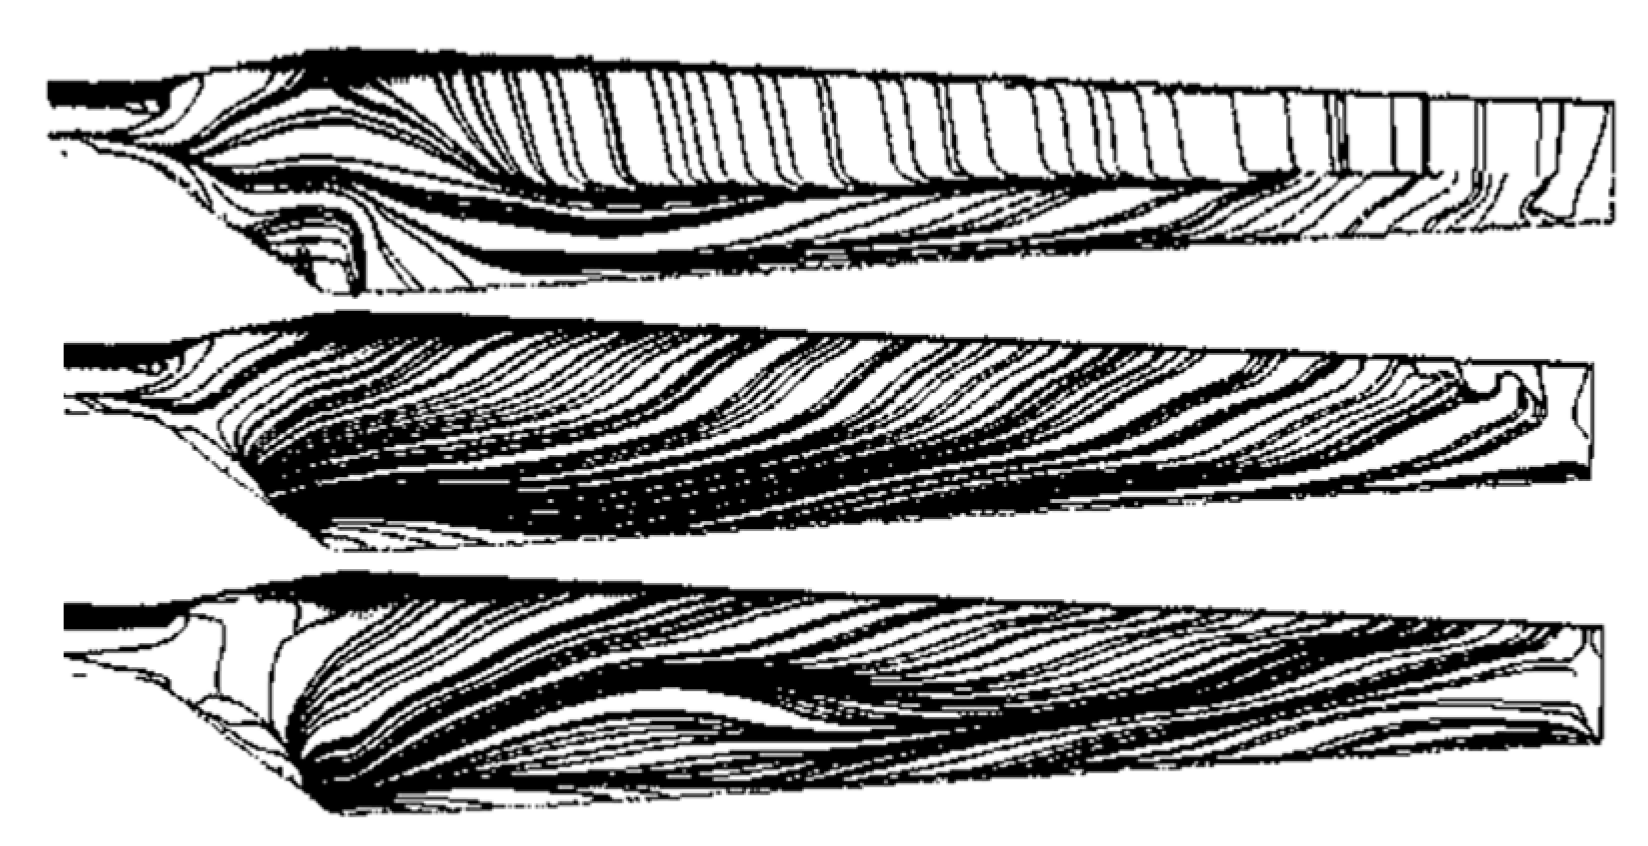
Figure 13 shows the total speed contour on the wind turbine at a wind speed of 7 meters per second. As can be seen, the speed increases with the increase of the radius from the root to the tip of the blade. In general, the maximum speed will be on the tip of the blade. According to this speed distribution, the reason for the increase of y^+ on the tip can be justified. Also, the flow lines created on the suction surface of the turbine blade at the wind speed of 7, 10 and 13 m/s can also be seen in Figure 14. According to Figure 14, it can be seen that increasing the wind speed changes the flow pattern. It can be seen that the flow at the wind speed of 7 meters per second is somewhat stuck on the blade, but with the increase in speed, the separation of the flow on the blade will gradually increase. At a wind speed of 10 m/s, the flow is separated except near the tip of the blade, but at a wind speed of 13 m/s, the flow on the blade is completely separated. This separation will also cause the increase of large vortices, which if not controlled, will reduce the mechanical power and torque of the turbine.
Offshore wind turbine: As explained earlier, the steady state of the offshore wind turbine was investigated and analyzed using computational fluid dynamics at different wind speeds.
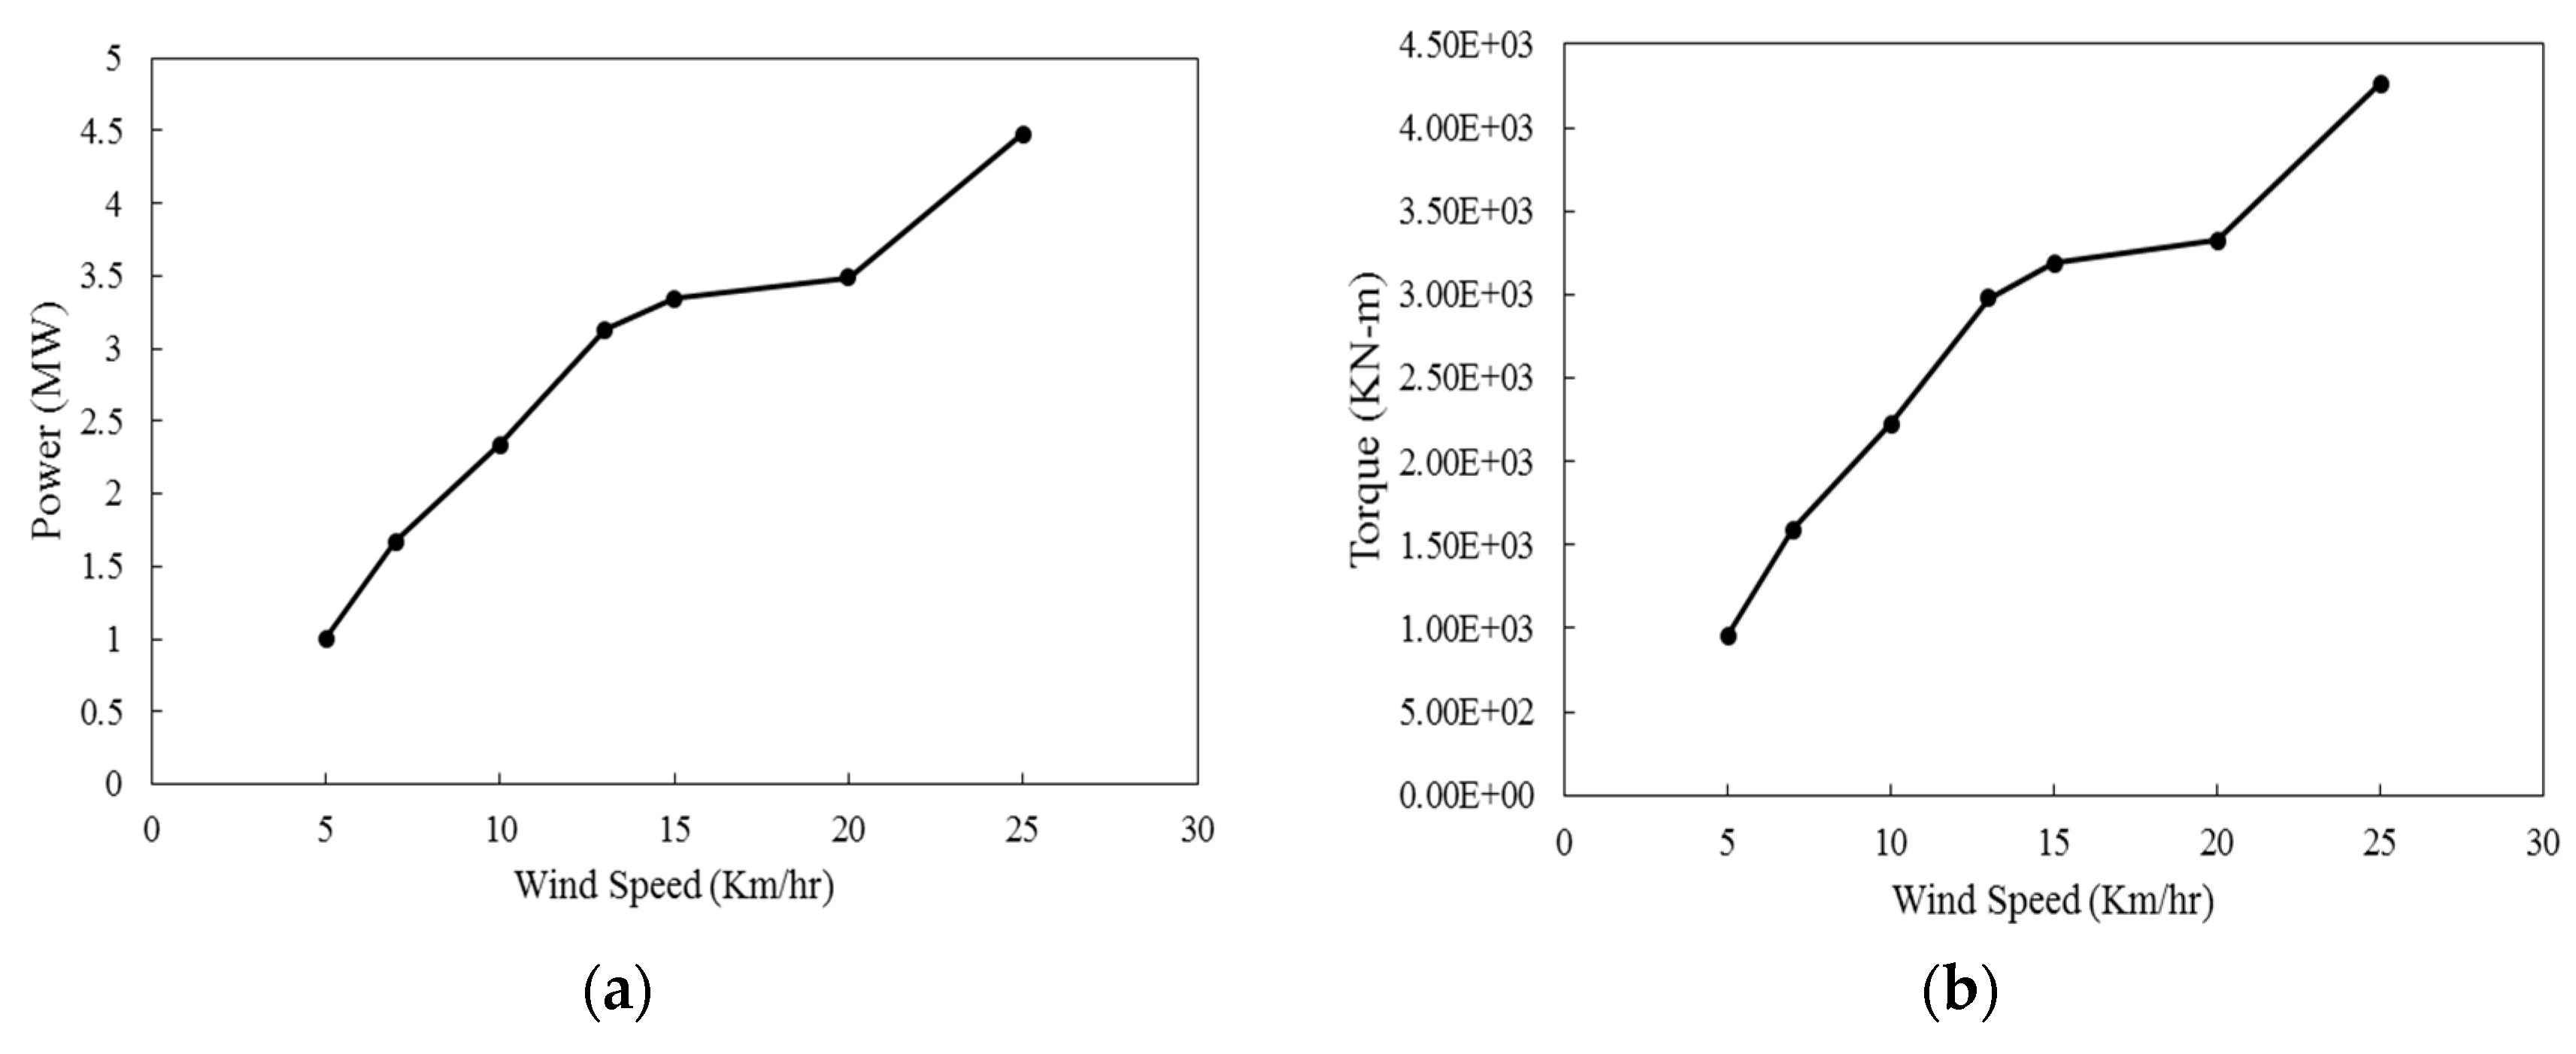
Figure 16 (a) shows the mechanical power diagram and
Figure 18 shows the torque diagram due to the rotation of the wind turbine at different wind speeds. It is clearly visible that with the increase in wind speed, the amount of torque and mechanical power increases. The maximum mechanical power and torque is created at a wind speed of 25 kilometers per hour. The maximum mechanical power for an offshore wind turbine is about 4.6 megawatts.
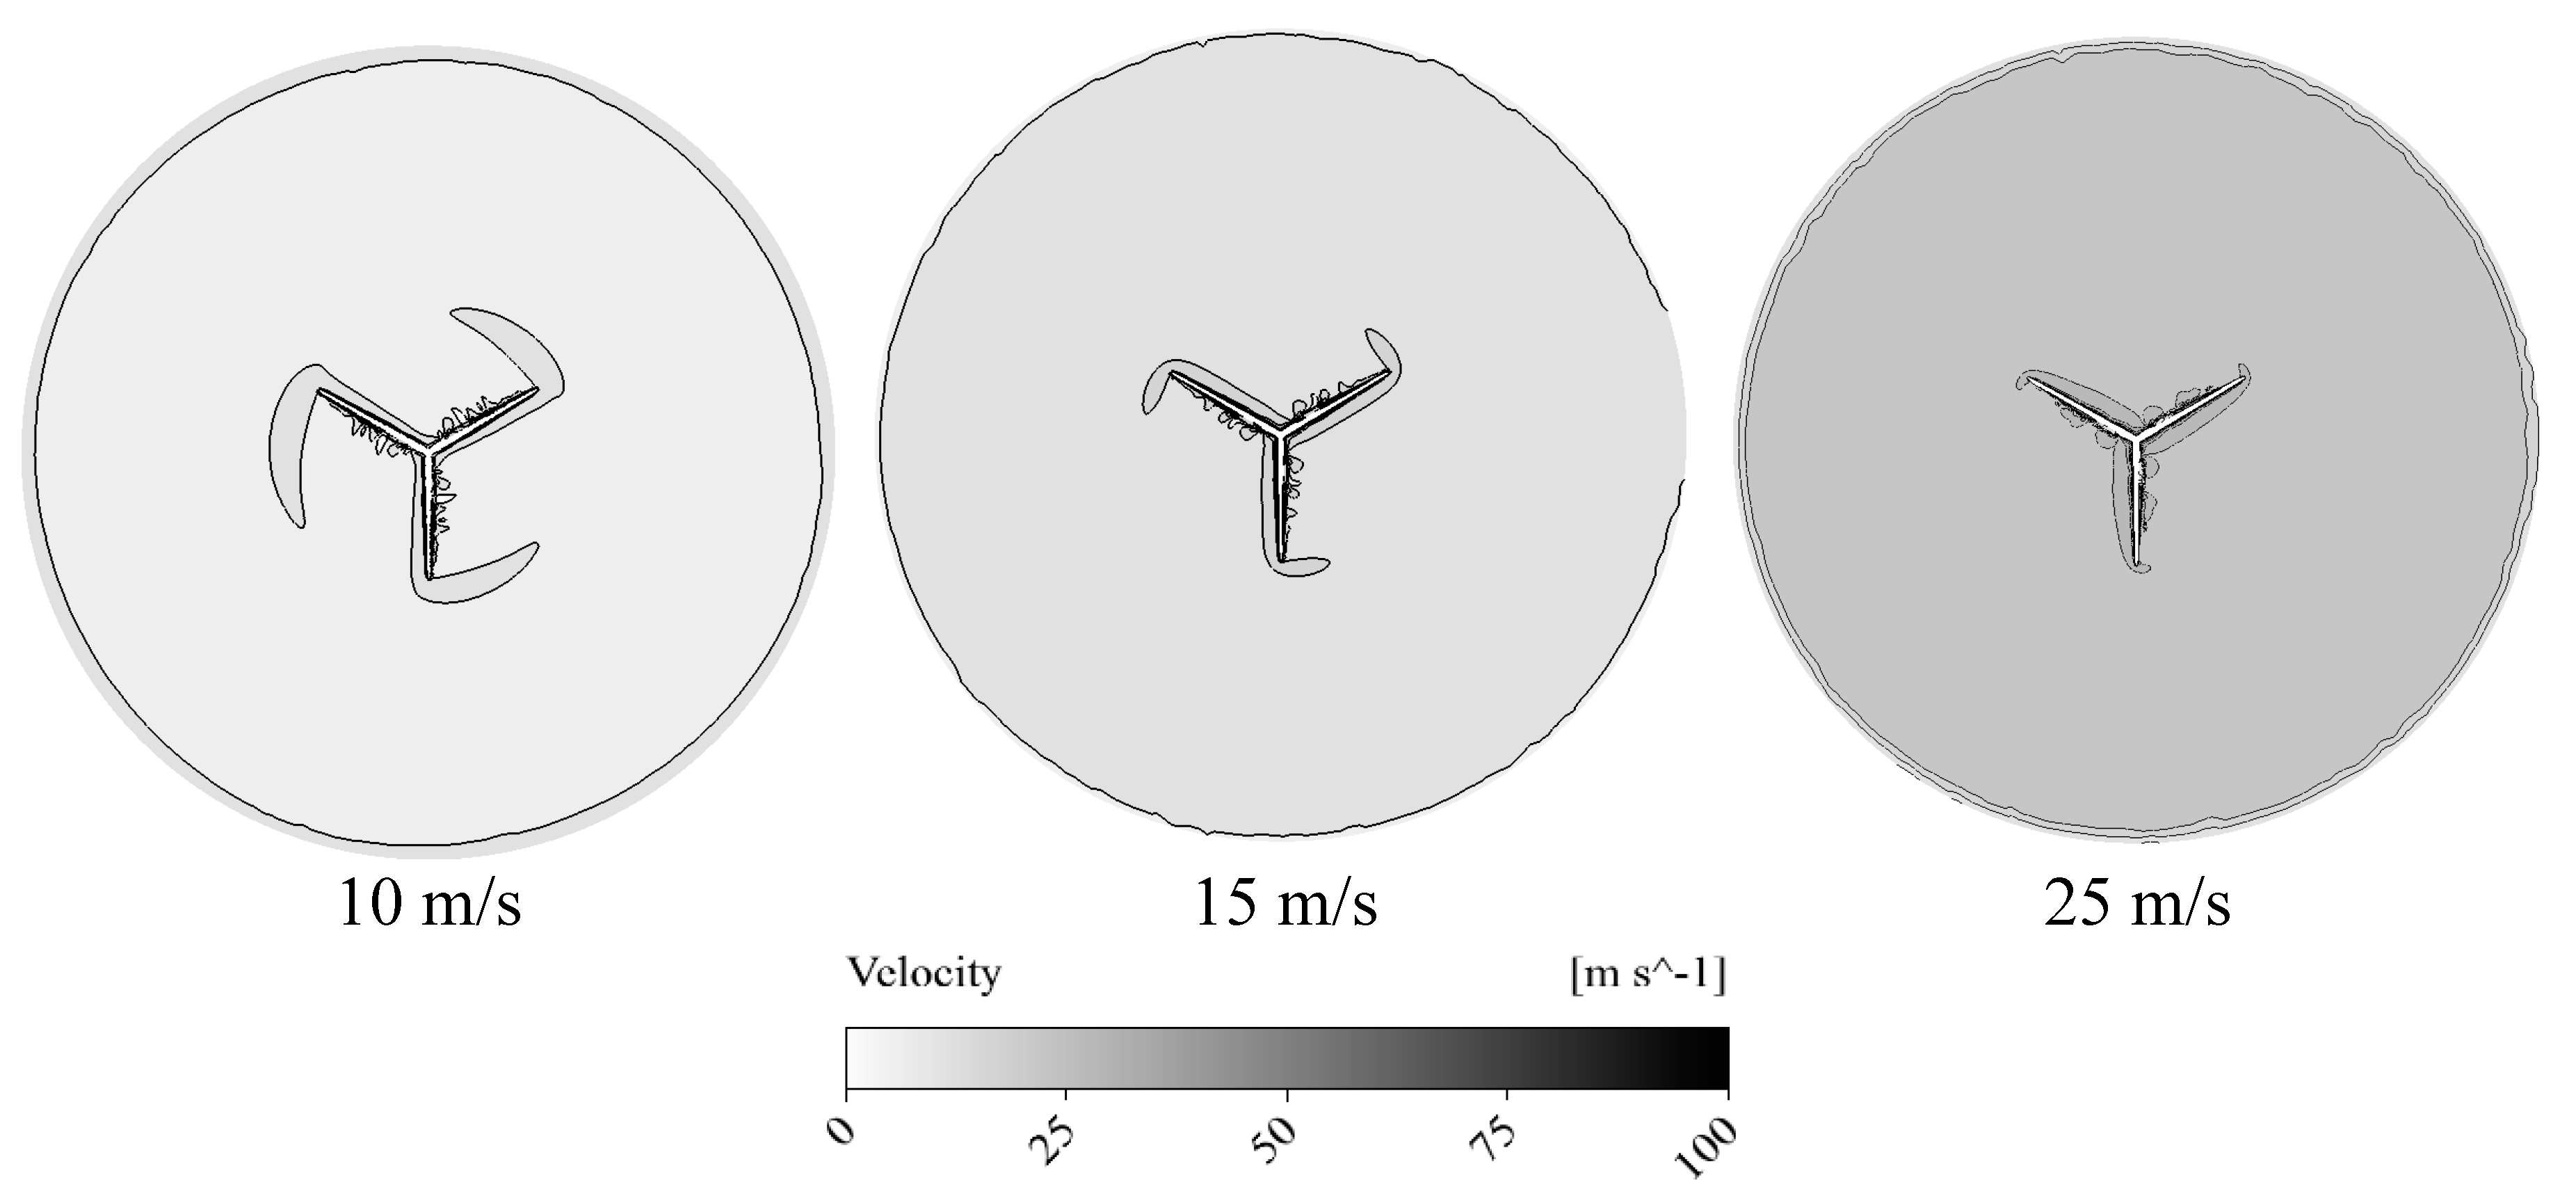
The contour of the wind speed in the plane passing through the center of the wind turbine and from the front view is shown in
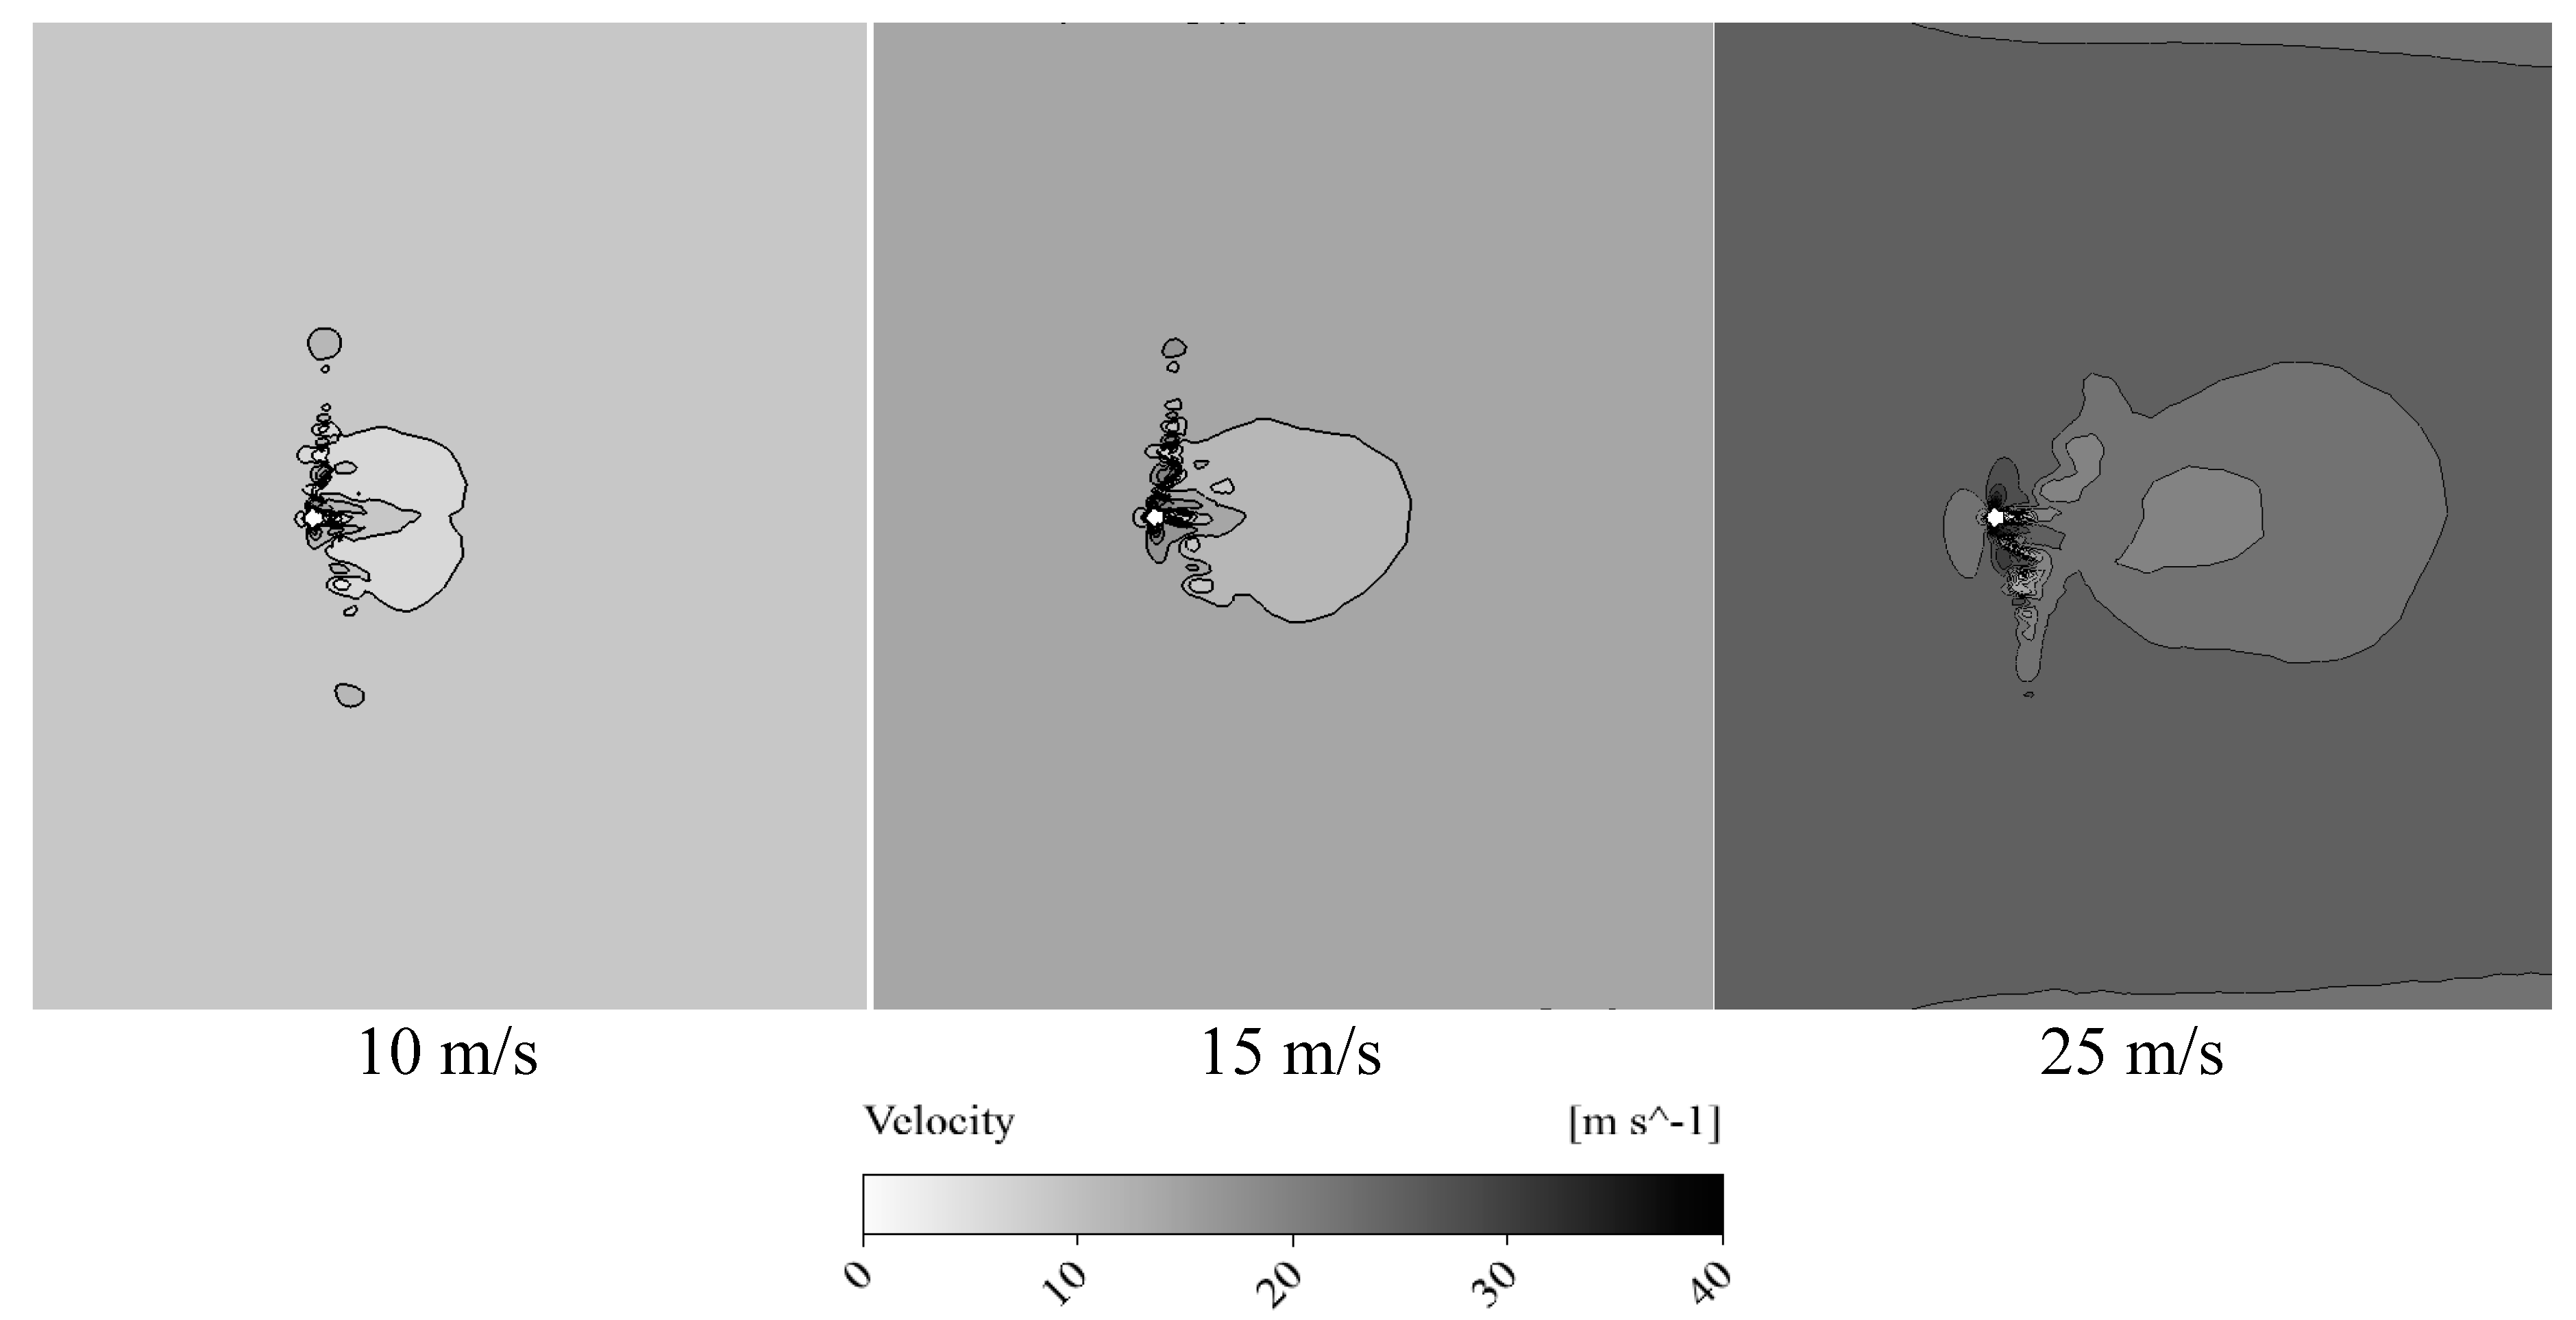
Figure 17. These results were reported in wind speeds of 10, 15 and 25 kilometers per hour. As can be seen, with the increase in the wind speed, the vortices caused by the tip of the blade will also increase, thus increasing the speed in the upstream area. At a wind speed of 25 kilometers per hour, vortices caused by a ball can also be observed. More clearly,
Figure 18 shows the wake of vortices caused by the tip and hub of the wind turbine. With the increase in wind speed, the trail of eddies has become wider. It can also be stated that with the increase in wind speed, the intensity of the current will increase near the ball.
Figure 17.
Velocity contour in the plane passing through the center of the offshore wind turbine from the front view.
Figure 17.
Velocity contour in the plane passing through the center of the offshore wind turbine from the front view.
Figure 18.
Velocity contour in the plane passing through the center of the offshore wind turbine from the side view.
Figure 18.
Velocity contour in the plane passing through the center of the offshore wind turbine from the side view.
7. Conclusion
This shows the importance of more research in this field since wind turbines have a high potential for generating mechanical power. In order to calculate the power rate of wind turbines for scientific applications, a thorough understanding of their hydraulic performance is required. In the simulation, a horizontal axis wind turbine has been used due to its higher efficiency compared to other wind turbines as well as the need for uniform torque and mechanical power. By using computational fluid dynamics, a steady-state simulation of an onshore and offshore horizontal axis wind turbine was conducted. Compared with laboratory data, the obtained results were very accurate. Based on this equalization, the results of the numerical solution showed that as the wind speed increases, the mechanical power, as well as the propulsion force, will gradually increase, and due to the intensity of turbulence, the pressure distribution on the surfaces will gradually become irregular. The minimum speed on the leading edge of the suction surface of the turbine blade will also decrease with increasing wind speed. It has been observed that by increasing the speed of the free flow of the wind, the speed at the tip of the blade and the hub will also increase, resulting in an expansion of the vortices. Both onshore and offshore turbines will achieve the same results. Consequently, the main difference between these two types of turbines is the number of blades, the dimensions, and the number of cross-sections used.
References
- D. Otero and F. L. Ponta, “On the structural behaviour of variable-geometry oval-trajectory Darrieus wind turbines,” Renew. Energy, vol. 34, no. 3, pp. 827–832, Mar. 2009. [CrossRef]
- “World Energy Assessment: Energy and the Challenge of Sustainability | UNDP.”.
- “Introduction to the Theory of Flow Machines - Albert Betz - Google Books.” https://books.google.com/books?hl=en&lr=&id=9s2jBQAAQBAJ&oi=fnd&pg=PP1&dq=Introduction+to+the+Theory+of+Flow+Machines&ots=WkMlI-1vUr&sig=1gy7VXoLiHkD3u6ycGme3N1NJdQ#v=onepage&q=Introduction to the Theory of Flow Machines&f=false (accessed Sep. 12, 2023).
- K. M. Foreman, B. K. M. Foreman, B. Gilbert, and R. A. Oman, “Diffuser augmentation of wind turbines,” Sol. Energy, vol. 20, no. 4, pp. 305–311, Jan. 1978. [CrossRef]
- Sicot, P. Devinant, T. Laverne, S. Loyer, and J. Hureau, “Experimental study of the effect of turbulence on horizontal axis wind turbine aerodynamics,” Wind Energy, vol. 9, no. 4, pp. 361–370, Jul. 2006. [CrossRef]
- J. Zare, S. E. J. Zare, S. E. Hosseini, and M. R. Rastan, “NREL Phase VI wind turbine in the dusty environment,” arXiv Prepr. arXiv2304.06285, Apr. 2023. [CrossRef]
- J. Zare, S. E. J. Zare, S. E. Hosseini, and M. R. Rastan, “Airborne dust-induced performance degradation in NREL phase VI wind turbine: a numerical study,” Int. J. Green Energy, pp. 1–20, Aug. 2023. [CrossRef]
- N. Kelley, M. N. Kelley, M. Hand, S. Larwood, and E. McKenna, “The NREL Large-Scale Turbine Inflow and Response Experiment: Preliminary Results,” ASME 2002 Wind Energy Symp. Wind., pp. 412–426, Feb. 2009. [CrossRef]
- J. Fiedler and S. Tullis, “Blade Offset and Pitch Effects on a High Solidity Vertical Axis Wind Turbine,”. [CrossRef]
- F. González-Longatt, P. P. F. González-Longatt, P. P. Wall, and V. Terzija, “Wake effect in wind farm performance: Steady-state and dynamic behavior,” Renew. Energy, vol. 39, no. 1, pp. 329–338, Mar. 2012. [CrossRef]
- Sturge, D. Sobotta, R. Howell, A. While, and J. Lou, “A hybrid actuator disc – Full rotor CFD methodology for modelling the effects of wind turbine wake interactions on performance,” Renew. Energy, vol. 80, pp. 525–537, Aug. 2015. [CrossRef]
- Karimi, M. K. Koopaee, A. reza Tavakolpour-Saleh, and S. E. Hosseini, “Investigating Overlap Ratio Effect on Performance of a Modified Savonius Wind Turbine: An Experimental Study,” Preprints, Aug. 2023. [CrossRef]
- S. E. Hosseini, O. S. E. Hosseini, O. Karimi, and M. A. AsemanBakhsh, “Experimental Investigation and Multi-objective Optimization of Savonius Wind Turbine Based on modified Non-dominated Sorting Genetic Algorithm-II,” Preprints, Aug. 2023. [CrossRef]
- S. E. Hosseini, O. S. E. Hosseini, O. Karimi, and M. A. arXiv:2308.14648, Aug. 2023. [CrossRef]
- M. M. Hand, D. A. M. M. Hand, D. A. Simms, L. J. Fingersh, D. W. Jager, and J. R. Cotrell, “Unsteady Aerodynamics Experiment Phase V: Test Configuration and Available Data Campaigns; TOPICAL.” 2001.
- M. M. Yelmule and E. A. VSJ, “CFD predictions of NREL Phase VI Rotor Experiments in NASA/AMES Wind tunnel,” Int. J. Renew. Energy Res., vol. 3, no. 2, pp. 261–269, Jun. 2013, Accessed: Sep. 13, 2023. [Online]. Available: https://dergipark.org.tr/en/pub/ijrer/issue/16079/168231.
- S. E. Hosseini and A. Keshmiri, “Experimental and numerical investigation of different geometrical parameters in a centrifugal blood pump,” Res. Biomed. Eng., vol. 38, no. 5, pp. 423–437, 2022. [CrossRef]
- M. H. Shojaeefard, S. E. M. H. Shojaeefard, S. E. Hosseini, and J. Zare, “CFD simulation and Pareto-based multi-objective shape optimization of the centrifugal pump inducer applying GMDH neural network, modified NSGA-II, and TOPSIS,” Struct. Multidiscip. Optim., vol. 60, no. 4, pp. 1509–1525, 19. 20 May. [CrossRef]
- M. H. Shojaeefard, S. E. M. H. Shojaeefard, S. E. Hosseini, and J. Zare, “Numerical simulation and multi-objective optimization of the centrifugal pump inducer,” Modares Mech. Eng., vol. 17, no. 7, pp. 205–216, 2018.
- J. Boussinesq, “Essa sur latheories des eaux courantes. memoires presentes par divers savants a lacademic des sciences de linstitut national de france,” Tome XXIII, no. 1, 1877.
Figure 1.
The flow of the initial stages of using wind energy from Iran until reaching the United States of America.
Figure 1.
The flow of the initial stages of using wind energy from Iran until reaching the United States of America.
Figure 2.
3D view of Hozontal axis wind turbine (a) and vetcal axis wind turbine (b).
Figure 2.
3D view of Hozontal axis wind turbine (a) and vetcal axis wind turbine (b).
Figure 3.
Isometric view of the modeled onshore horizontal axis wind turbine.
Figure 3.
Isometric view of the modeled onshore horizontal axis wind turbine.
Figure 4.
Isometric view of the modeled offshore horizontal axis wind turbine.
Figure 4.
Isometric view of the modeled offshore horizontal axis wind turbine.
Figure 6.
(a) Grid independence check for onshore horizontal axis wind turbine, and (b) offshore horizontal axis wind turbine.
Figure 6.
(a) Grid independence check for onshore horizontal axis wind turbine, and (b) offshore horizontal axis wind turbine.
Figure 7.
Grid on the computing domain and wind turbine blades.
Figure 7.
Grid on the computing domain and wind turbine blades.
Figure 8.
(a) The contour of y+ distribution on the blade of an onshore horizontal axis wind turbine, and (b) an offshore horizontal axis wind turbine.
Figure 8.
(a) The contour of y+ distribution on the blade of an onshore horizontal axis wind turbine, and (b) an offshore horizontal axis wind turbine.
Figure 9.
Comparison of (a) mechanical power and (b) thrust results of numerical solution with experimental data at different wind speeds.
Figure 9.
Comparison of (a) mechanical power and (b) thrust results of numerical solution with experimental data at different wind speeds.
Figure 10.
Pressure contour on the pressure (top) and suction (bottom) surfaces of the turbine blade at speeds of 7, 10 and 13 meters per second.
Figure 10.
Pressure contour on the pressure (top) and suction (bottom) surfaces of the turbine blade at speeds of 7, 10 and 13 meters per second.
Figure 11.
Velocity distribution in the plane passing through the center of the wind turbine and from the side view at different wind speed.
Figure 11.
Velocity distribution in the plane passing through the center of the wind turbine and from the side view at different wind speed.
Figure 12.
Comparison of the pressure distribution of numerical solution results with experimental data at a wind speed of 7 meters per second.
Figure 12.
Comparison of the pressure distribution of numerical solution results with experimental data at a wind speed of 7 meters per second.
Figure 13.
Total speed contour on the turbine at a wind speed of 7 m/s.
Figure 13.
Total speed contour on the turbine at a wind speed of 7 m/s.
Figure 15.
Flow lines on the blade surface at wind speeds of 7 (top), 10 (middle) and 13 (bottom) m/s.
Figure 15.
Flow lines on the blade surface at wind speeds of 7 (top), 10 (middle) and 13 (bottom) m/s.
Figure 16.
Comparison of (a) mechanical power and (b) torque results of numerical solution with experimental data at different wind speeds.
Figure 16.
Comparison of (a) mechanical power and (b) torque results of numerical solution with experimental data at different wind speeds.
Table 1.
Functional conditions of onshore horizontal axis wind turbine.
Table 1.
Functional conditions of onshore horizontal axis wind turbine.
| Pitch-B1 |
Density |
Rotor Speed |
Wind speed |
| (deg) |
(kg/m3) |
(rpm) |
(m/s) |
| 2.98 |
1.24523 |
72 |
5 |
| 2.98 |
1.24598 |
72 |
7 |
| 2.98 |
1.24598 |
72 |
10 |
| 2.98 |
1.226577 |
72 |
13 |
| 2.98 |
1.224037 |
72 |
15 |
| 2.98 |
1.223355 |
72 |
20 |
| 2.98 |
1.219684 |
72 |
25 |
Table 2.
Functional conditions of offshore horizontal axis wind turbine.
Table 2.
Functional conditions of offshore horizontal axis wind turbine.
| Density |
Rotor Speed |
Wind speed |
| (kg/m3) |
(rad/sec) |
(m/s) |
| 1.185 |
1.05 |
5 |
| 1.185 |
1.05 |
7 |
| 1.185 |
1.05 |
10 |
| 1.185 |
1.05 |
13 |
| 1.185 |
1.05 |
15 |
| 1.185 |
1.05 |
20 |
| 1.185 |
1.05 |
25 |
|
Disclaimer/Publisher’s Note: The statements, opinions and data contained in all publications are solely those of the individual author(s) and contributor(s) and not of MDPI and/or the editor(s). MDPI and/or the editor(s) disclaim responsibility for any injury to people or property resulting from any ideas, methods, instructions or products referred to in the content. |
© 2023 by the authors. Licensee MDPI, Basel, Switzerland. This article is an open access article distributed under the terms and conditions of the Creative Commons Attribution (CC BY) license (http://creativecommons.org/licenses/by/4.0/).
