1. Introduction
Graphene, the one-atom-thick strong bonded carbon membrane, exhibits intriguing electronic, thermal, mechanical, and optical properties. By stacking a few layers of graphene nanosheets, the material becomes graphene papers (GPs). GPs can preserve most properties that monolayer graphene possesses. Initially, Dikin et al. [
1] fabricated GO (graphene oxide) paper from GO water solution by vacuum filtration method. The GO paper had a tensile strength of 120 MPa. Suk et al. [
2] first fabricated monolayer graphene by CVD method and then transferred this graphene film onto PET (polyethylene terephthalate) as graphene/PET nanocomposite film to be a loudspeaker. A sound wave was created to the surrounding air by the nanocomposite film due to thermoacoustic effect, and the sound pressure level (SPL) of this film was around 50 dB. Xu [
3] found that the piezoelectric PVDF film could be sandwiched by two graphene layers. Once the voltage was applied on graphenes, the reverse piezoelectric effect could lead to the vibration of PVDF film and sound waves were created. Kim et al. [
4] used nitrogen-doped reduced graphene oxide arrays (N-rGOA) to make a thermoacoustic array loudspeaker. A new type of flexible headset (earphone) based on graphene by laser direct writing method was introduced by Ren et al. [
5]. Compared to the traditional magnetic headphones, this headset could capture subtle sounds in ultrasonic bandwidth, which could be applied in the field of human and animal communication.
Headphone performance is closely related to the vibration behavior of diaphragms. The vibration of graphene sheets via a 2D nanomechanic plate model was studied [
6,
7,
8,
9]. They concluded that the deflection in the vibration of graphene sheets was nonlinear and the amplitude was large. Mirakhory et al. [
10] investigated the vibration behavior of pristine and defective triangular graphene sheets. They found that for increasing the resonance range of sensors based on 2D graphene sheets the triangular structure was better than the square structure. The vibration and damping characteristics of graphene nanoplatelets (GNPs) modified epoxy composites were studied [
11,
12,
13]. The results showed that the damped natural frequencies in GNPs/epoxy composites decreased with the addition of GNPs nanofillers due to the decrease in the toughness of nanocomposites. With the addition of 0.4 wt% GNPs, an increase of 26% in the damping ratio of p-GNPs/epoxy composite was observed.
Based on the literature review, graphene papers are excellent diaphragm candidates for acoustic devices due to their high stiffness and low mass. The aim of this paper is to fabricate graphene oxide paper (GOP) from well-dispersed graphene oxide (GO) nanosheets water suspension using the vacuum filtration method. Besides, graphene oxide paper/epoxy nanocomposites (GOPC) are fabricated by the vacuum bag molding method. Then graphene oxide paper (GOP), and GOP/epoxy nanocomposites (GOPC) with a GO weight fraction of 26% are adopted as diaphragms in the electromagnetic headphones. In addition, lined pattern (GOPC-L) and curved pattern (GOPC-C) indentations are molded onto both surfaces of the diaphragm by hot-press molding. Therefore, there are four important parameters affecting the acoustic performance of the diaphragm, including material type (GOP versus GOPC), pattern type on nanocomposites (line or curve), sonication time (T1~3), and graphene weight fraction in suspension (WF1~3) for GOP. Sound pressure level (SPL) curves of GOP and GOPC diaphragm headphones are analyzed by the Soundcheck measurement system. Compliances of the diaphragms are measured by the Klippel LPM laser measurement system. SEM is used to observe the microstructure of four types of diaphragms and correlated with their SPLs.
2. Materials and Methods
Graphene oxide (GO) nanosheets were fabricated by the modified Hummers method. First, 12-gram expanded graphite powders were added to 460-ml H2SO4 and the suspension was stirred in an ice bath. Later, 60 grams of KMnO4 were slowly added to the suspension, heated to 35 oC, and stirred for 2 hours. Then 920 ml of deionized water was slowly added in the suspension and the temperature had to be kept under 50 oC. The suspension was further diluted in 2800-ml deionized water, and then 50 ml of 30% concentration H2O2 was added. The suspension stood still for 24 hours. After that, the suspension was initially set in a centrifuge by a revolution of 6000 rpm for 1 hour to separate the solute and solvent. The solute was further purified to be GO by the addition of the mixture of water and methanol. The centrifuge and purification processes were repeated for several cycles.
GO papers (GOP) were fabricated by the vacuum filtration method. GO suspension was poured into the upper container of a vacuum filtration apparatus. The lower bottle had an outlet that connects to a vacuum pump. There was a filtration assembly consisting of porous glass and cellulose filter paper between the upper and lower parts of the apparatus. When the vacuum pump was turned on, the solvent of the GO suspension was sucked out and GO nanosheets were combined to be GOP above the filtration assembly. After the drying process, a free-stand circular GOP with diameter of 35 mm can be achieved.
To fabricate GOP/epoxy nanocomposites (GOPC), a vacuum bag molding method was adopted. First, a GOP was soaked into epoxy resin at 60oC for 30 min. Then the soaked GOP covered by release fabrics was placed inside a vacuum bag, and a vacuum pump was connected to the outlet of the bag and started up. At the same time, the vacuum bag and epoxy resin soaked GOP were placed inside an oven at 120oC for 2 hours to cure the epoxy. After the curing process, the GOPC diaphragm was achieved.
To fabricate patterned GOPCs, the initial steps for epoxy soaking and vacuum pumping for GOP were similar to those of GOPCs. Then uncured GOP/epoxy was sandwiched between two patterned molds, either lined or curved patterns, sprayed with the release agent. The molds were further set up between hot pressing platens with suitable pressure at 120oC for 2 hours. Thereafter, GOPC-L and GOPC-C diaphragms were achieved.
In order to clarify the effect of processing parameters on the acoustic performance of various GOP and GOPC diaphragms,
Table 1 shows terminology for various fabricated diaphragms. Sonication times on suspension for T1, T2, and T3 are 1, 5, and 10 minutes, respectively; GO weight fractions in suspension for WF1, WF2, and WF3, are 0.5, 1.0, and 1.5 wt%, respectively; pattern types on nanocomposites are lined (L) and curved (C) indentations, respectively.
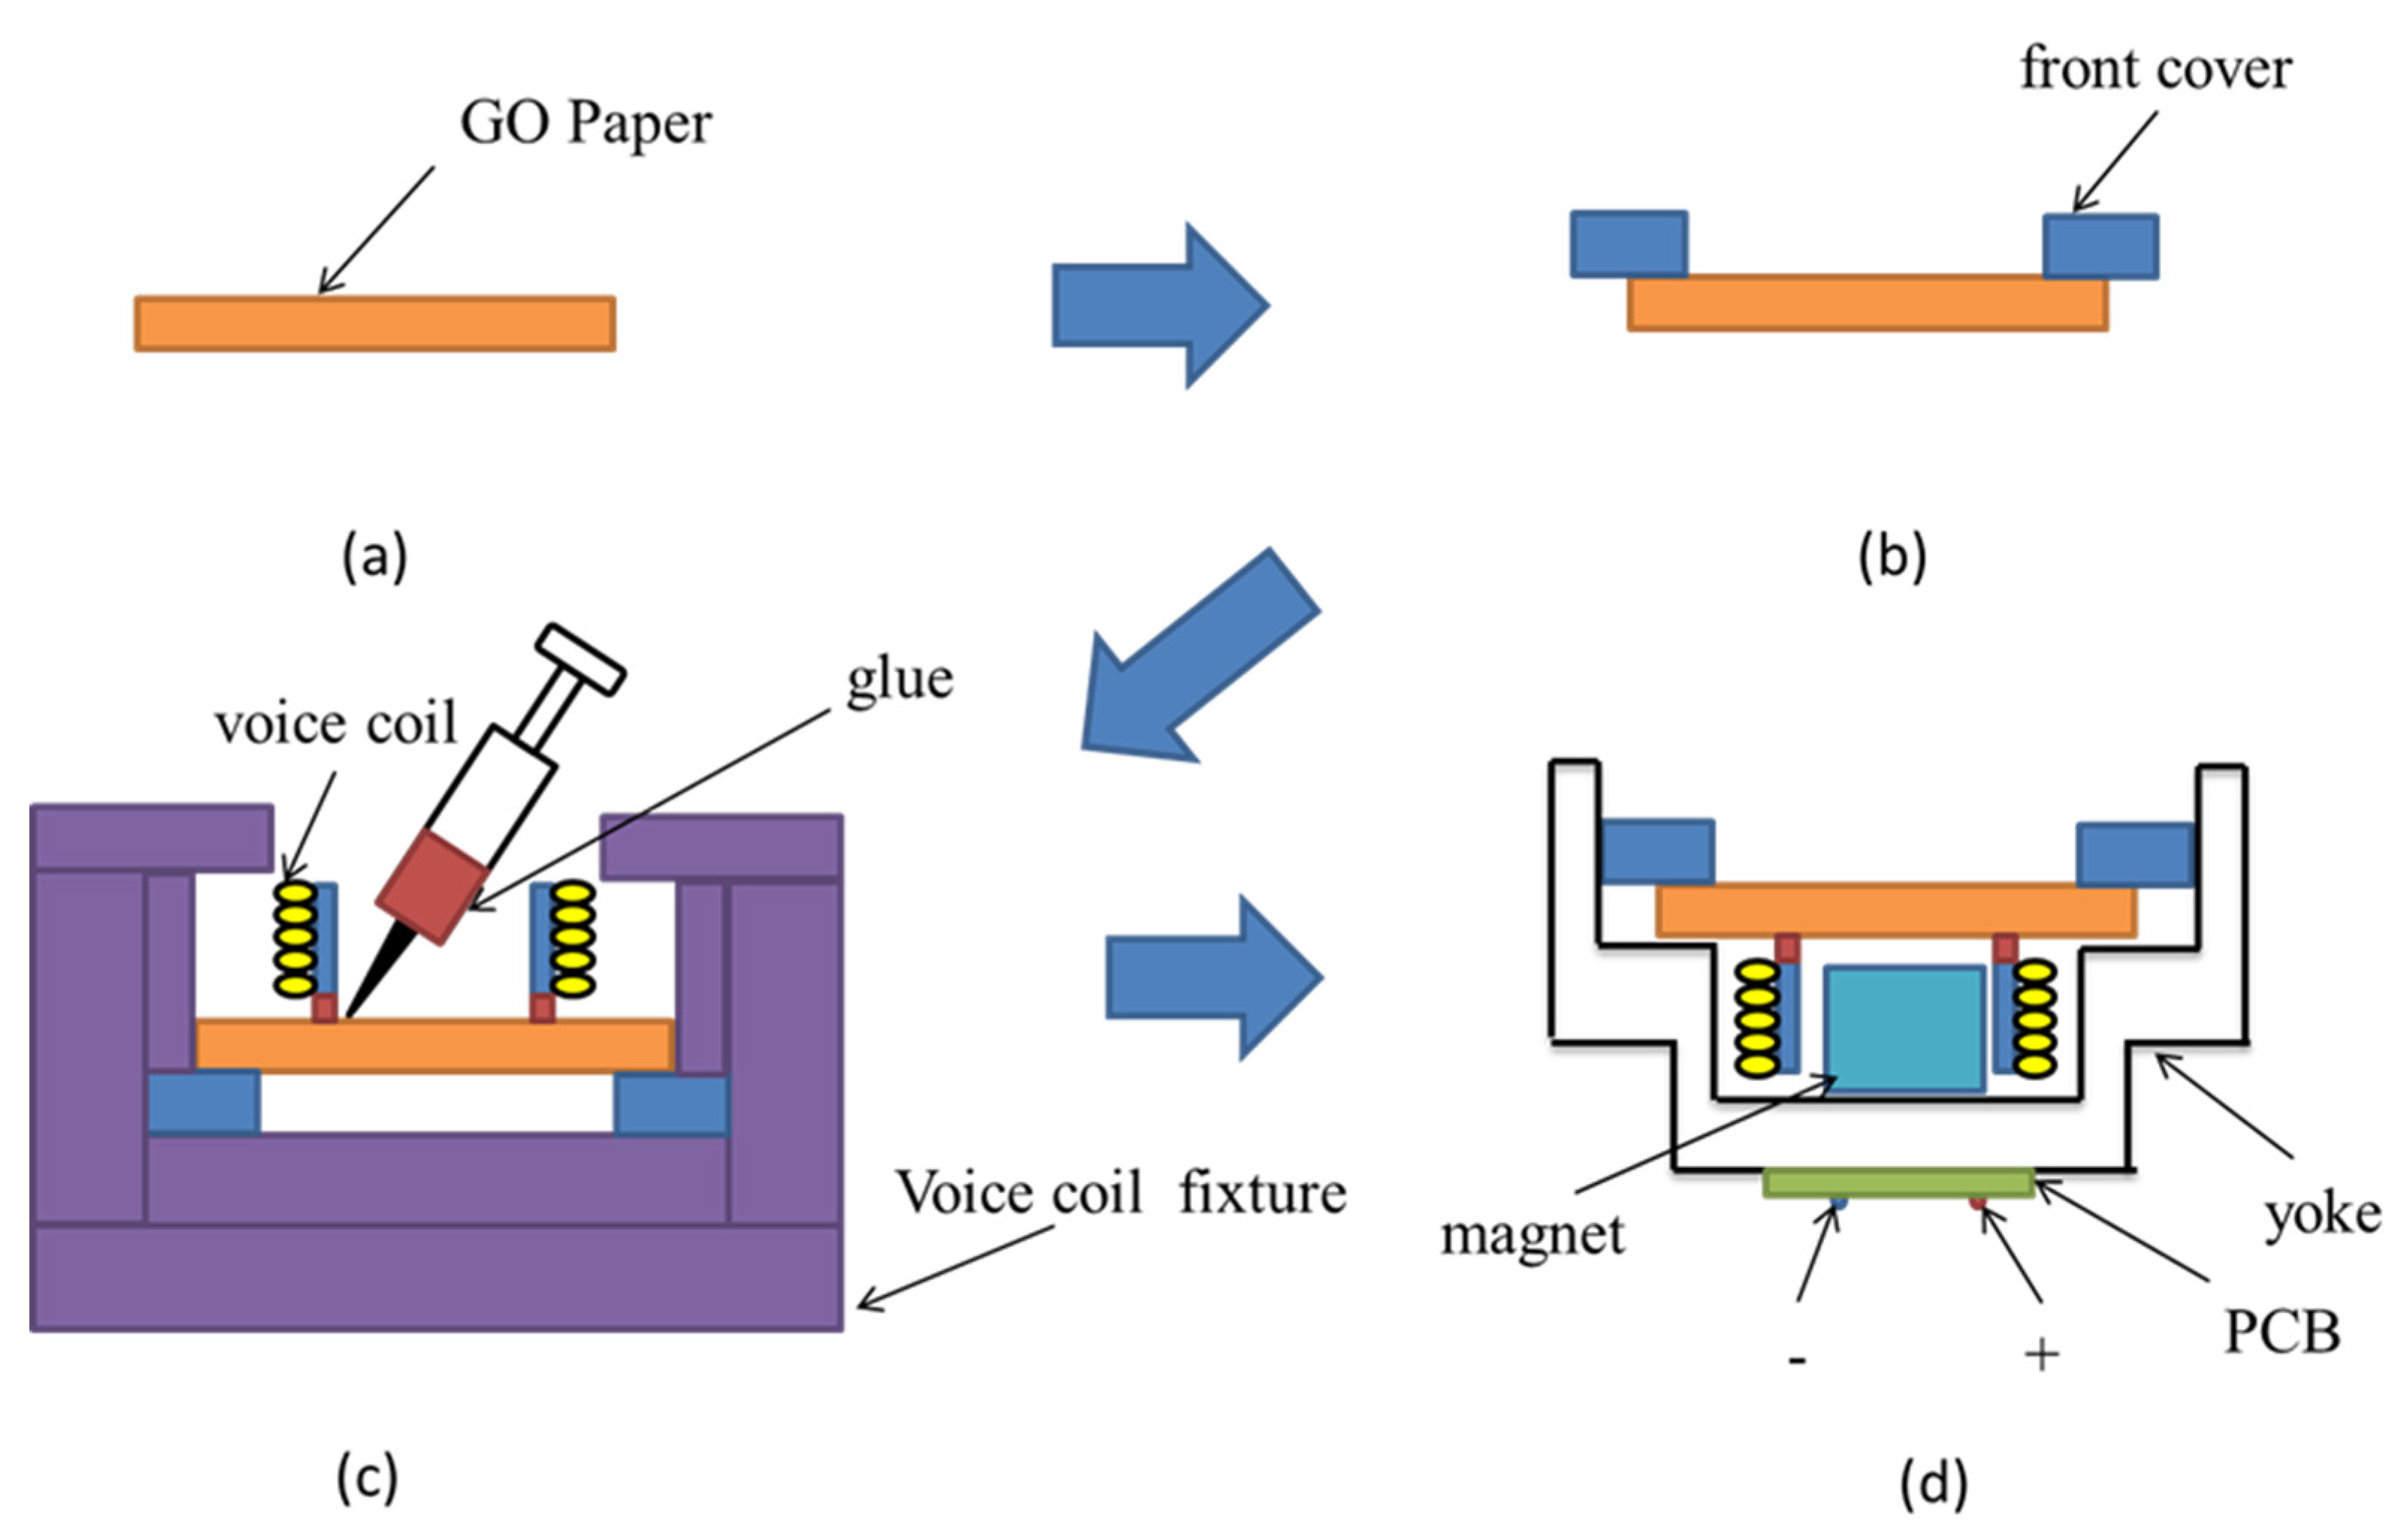
To manufacture an electromagnetic GOP diaphragm headphone, a plastic ring frame was initially adhered on the edge of the GOP to be a front cover as shown from
Figure 1a,b. Then a dynamic voice coil was adhered on the opposite surface of the GOP, and centers of both voice coil and GOP must be aligned by a specific fixture (
Figure 1c). Further, this diaphragm was assembled with a headphone unit consisting of a yoke, a magnet, and a PCB (
Figure 1d). Positive and negative electrodes of the dynamic voice coil were connected to the corresponding electrodes of the PCB, and the headphone was ready for testing. The preparation procedure for the other three diaphragm headphones was similar.
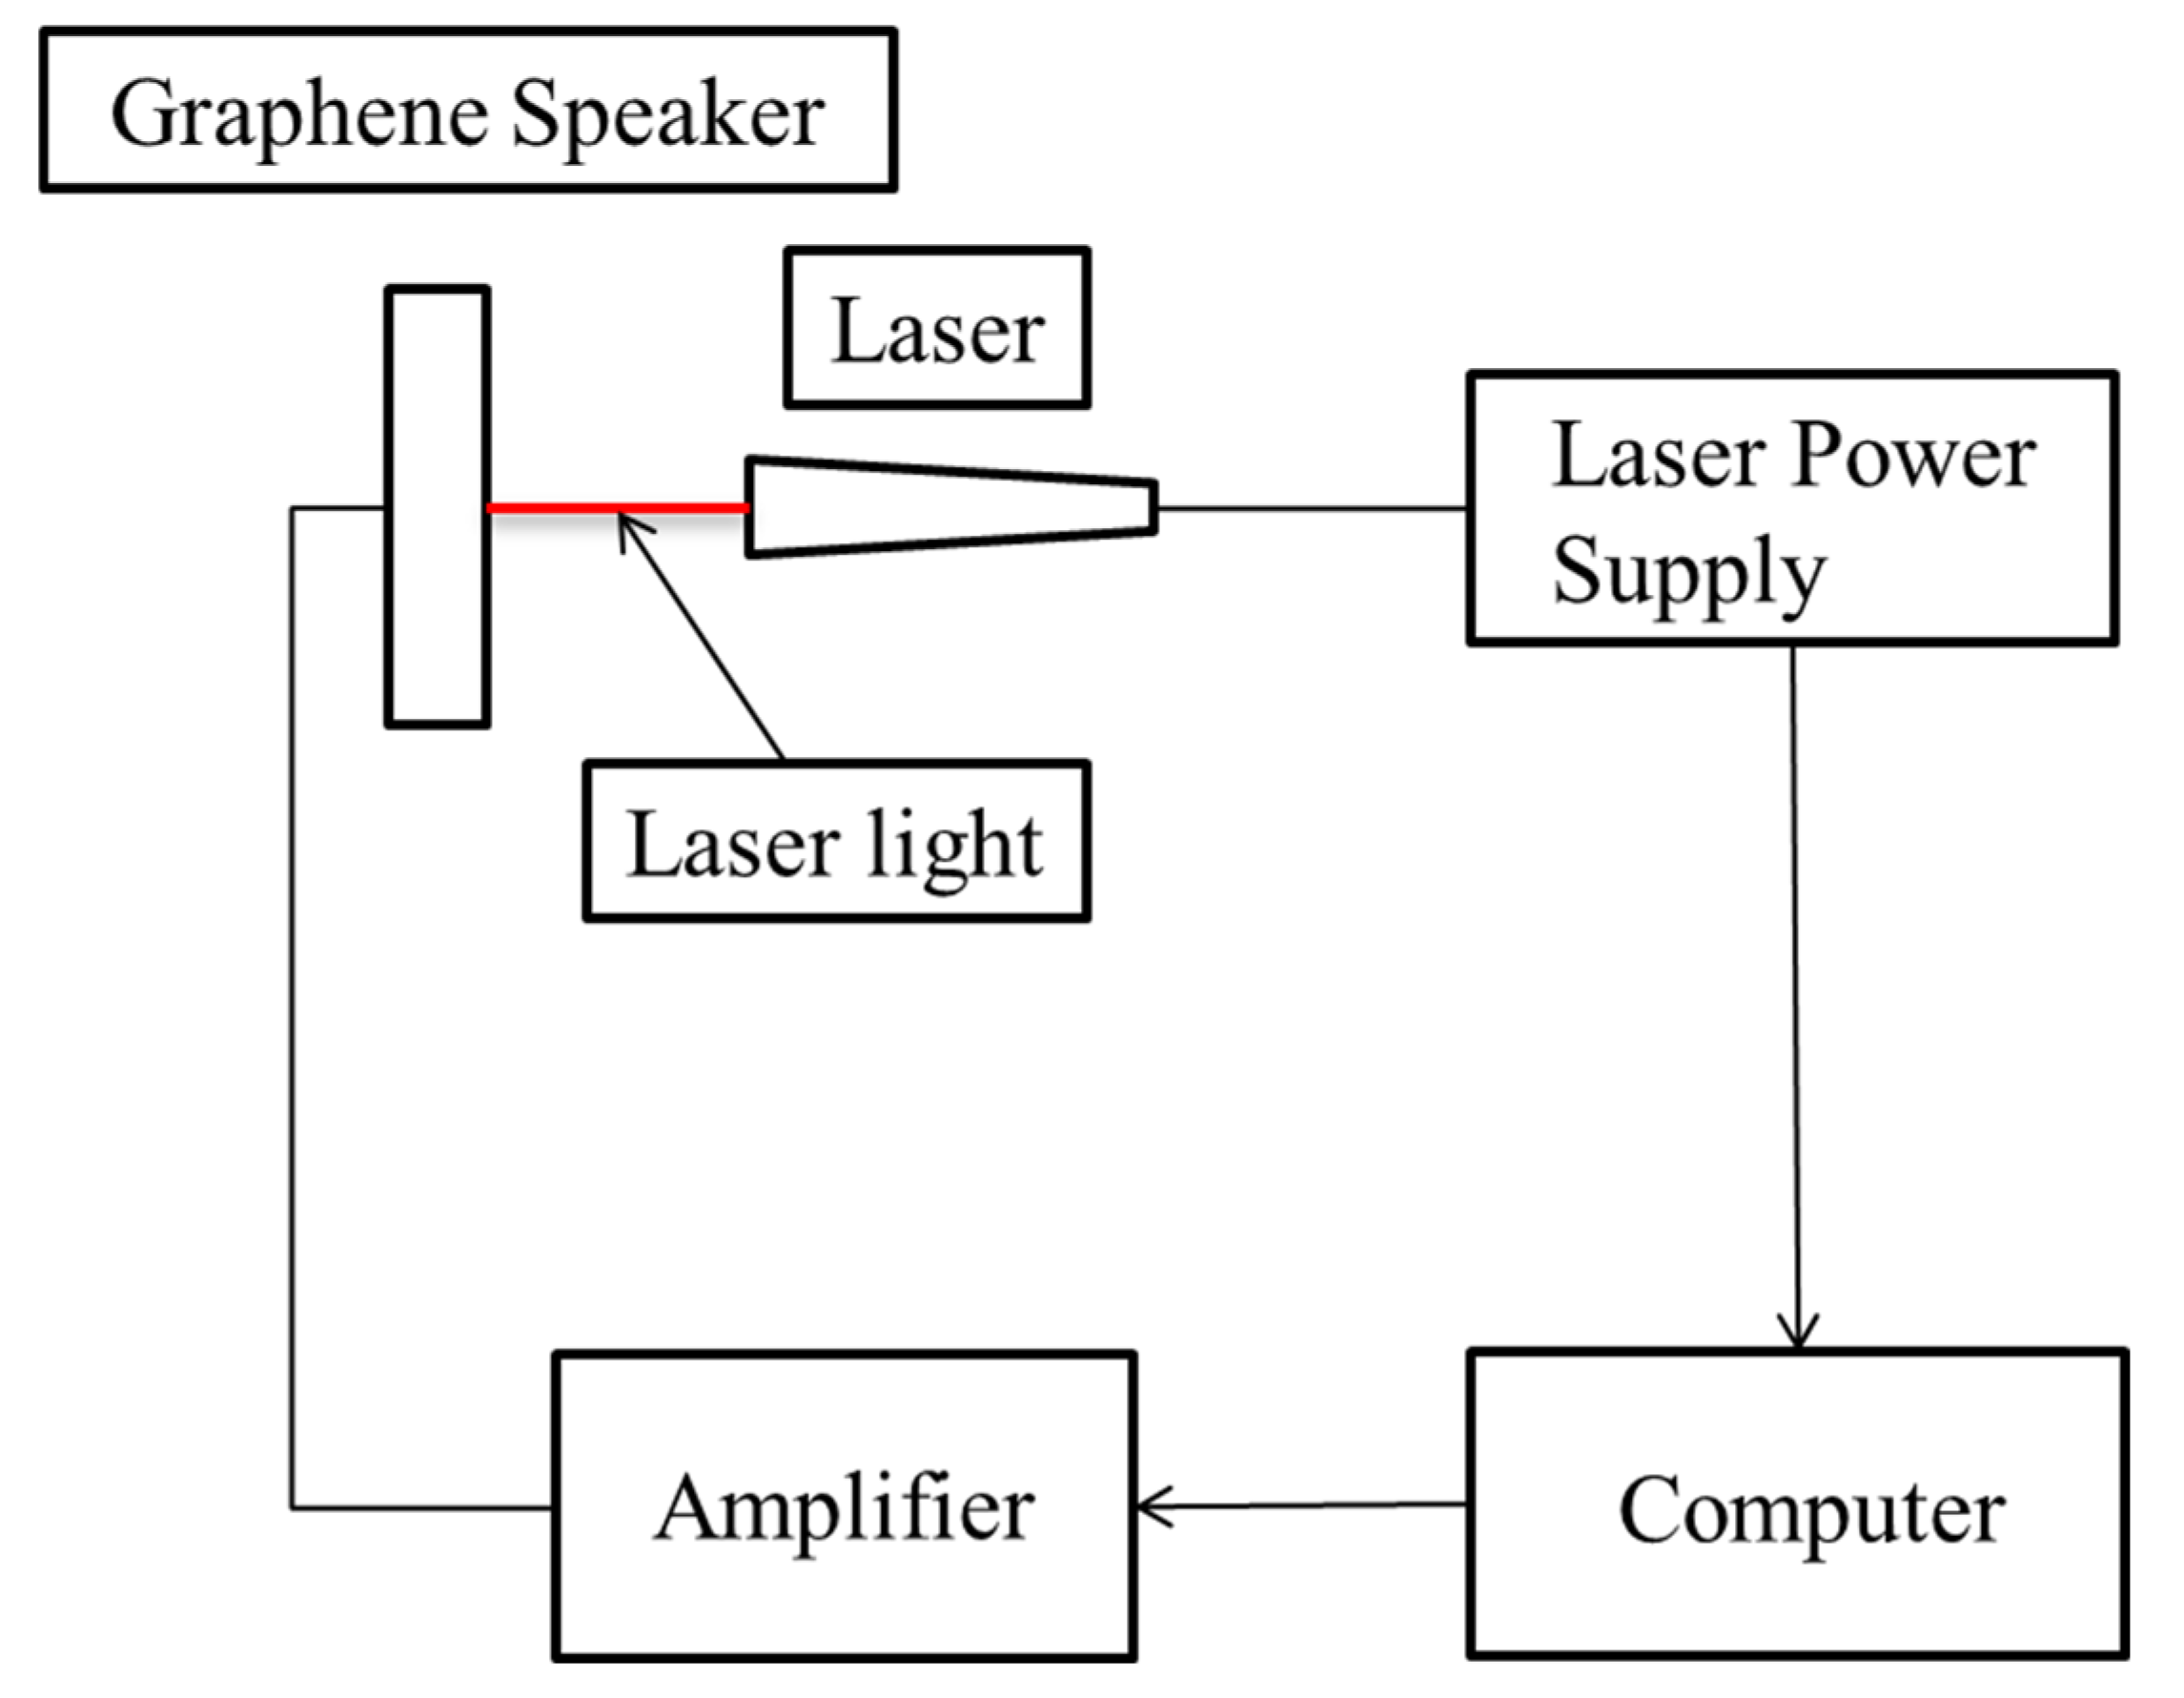
The SPL of the headphone was tested inside an anechoic chamber. A B&K 2716C amplifier was connected to the headphone and sound waves in the frequency range from 100 to 20k Hz were created. The sound waves were detected by a B&K 4191 microphone. The GOP and GOPC headphones were mounted on a baffle board based on an IEC 60268-5 regulation. The distance between the headphones and the microphone was 2 cm. The input voltage of the speaker was 1.73 mV. The amplifier and microphone were connected to a computer with Soundcheck software, and the SPL curve of the graphene diaphragm headphones was measured. To measure the compliance of the diaphragms as shown in
Figure 2, the set-up of the measurement system was similar to that for SPL, except the microphone was replaced by a Klippel LPM laser measurement system.
3. Results
3.1. Effect of material type
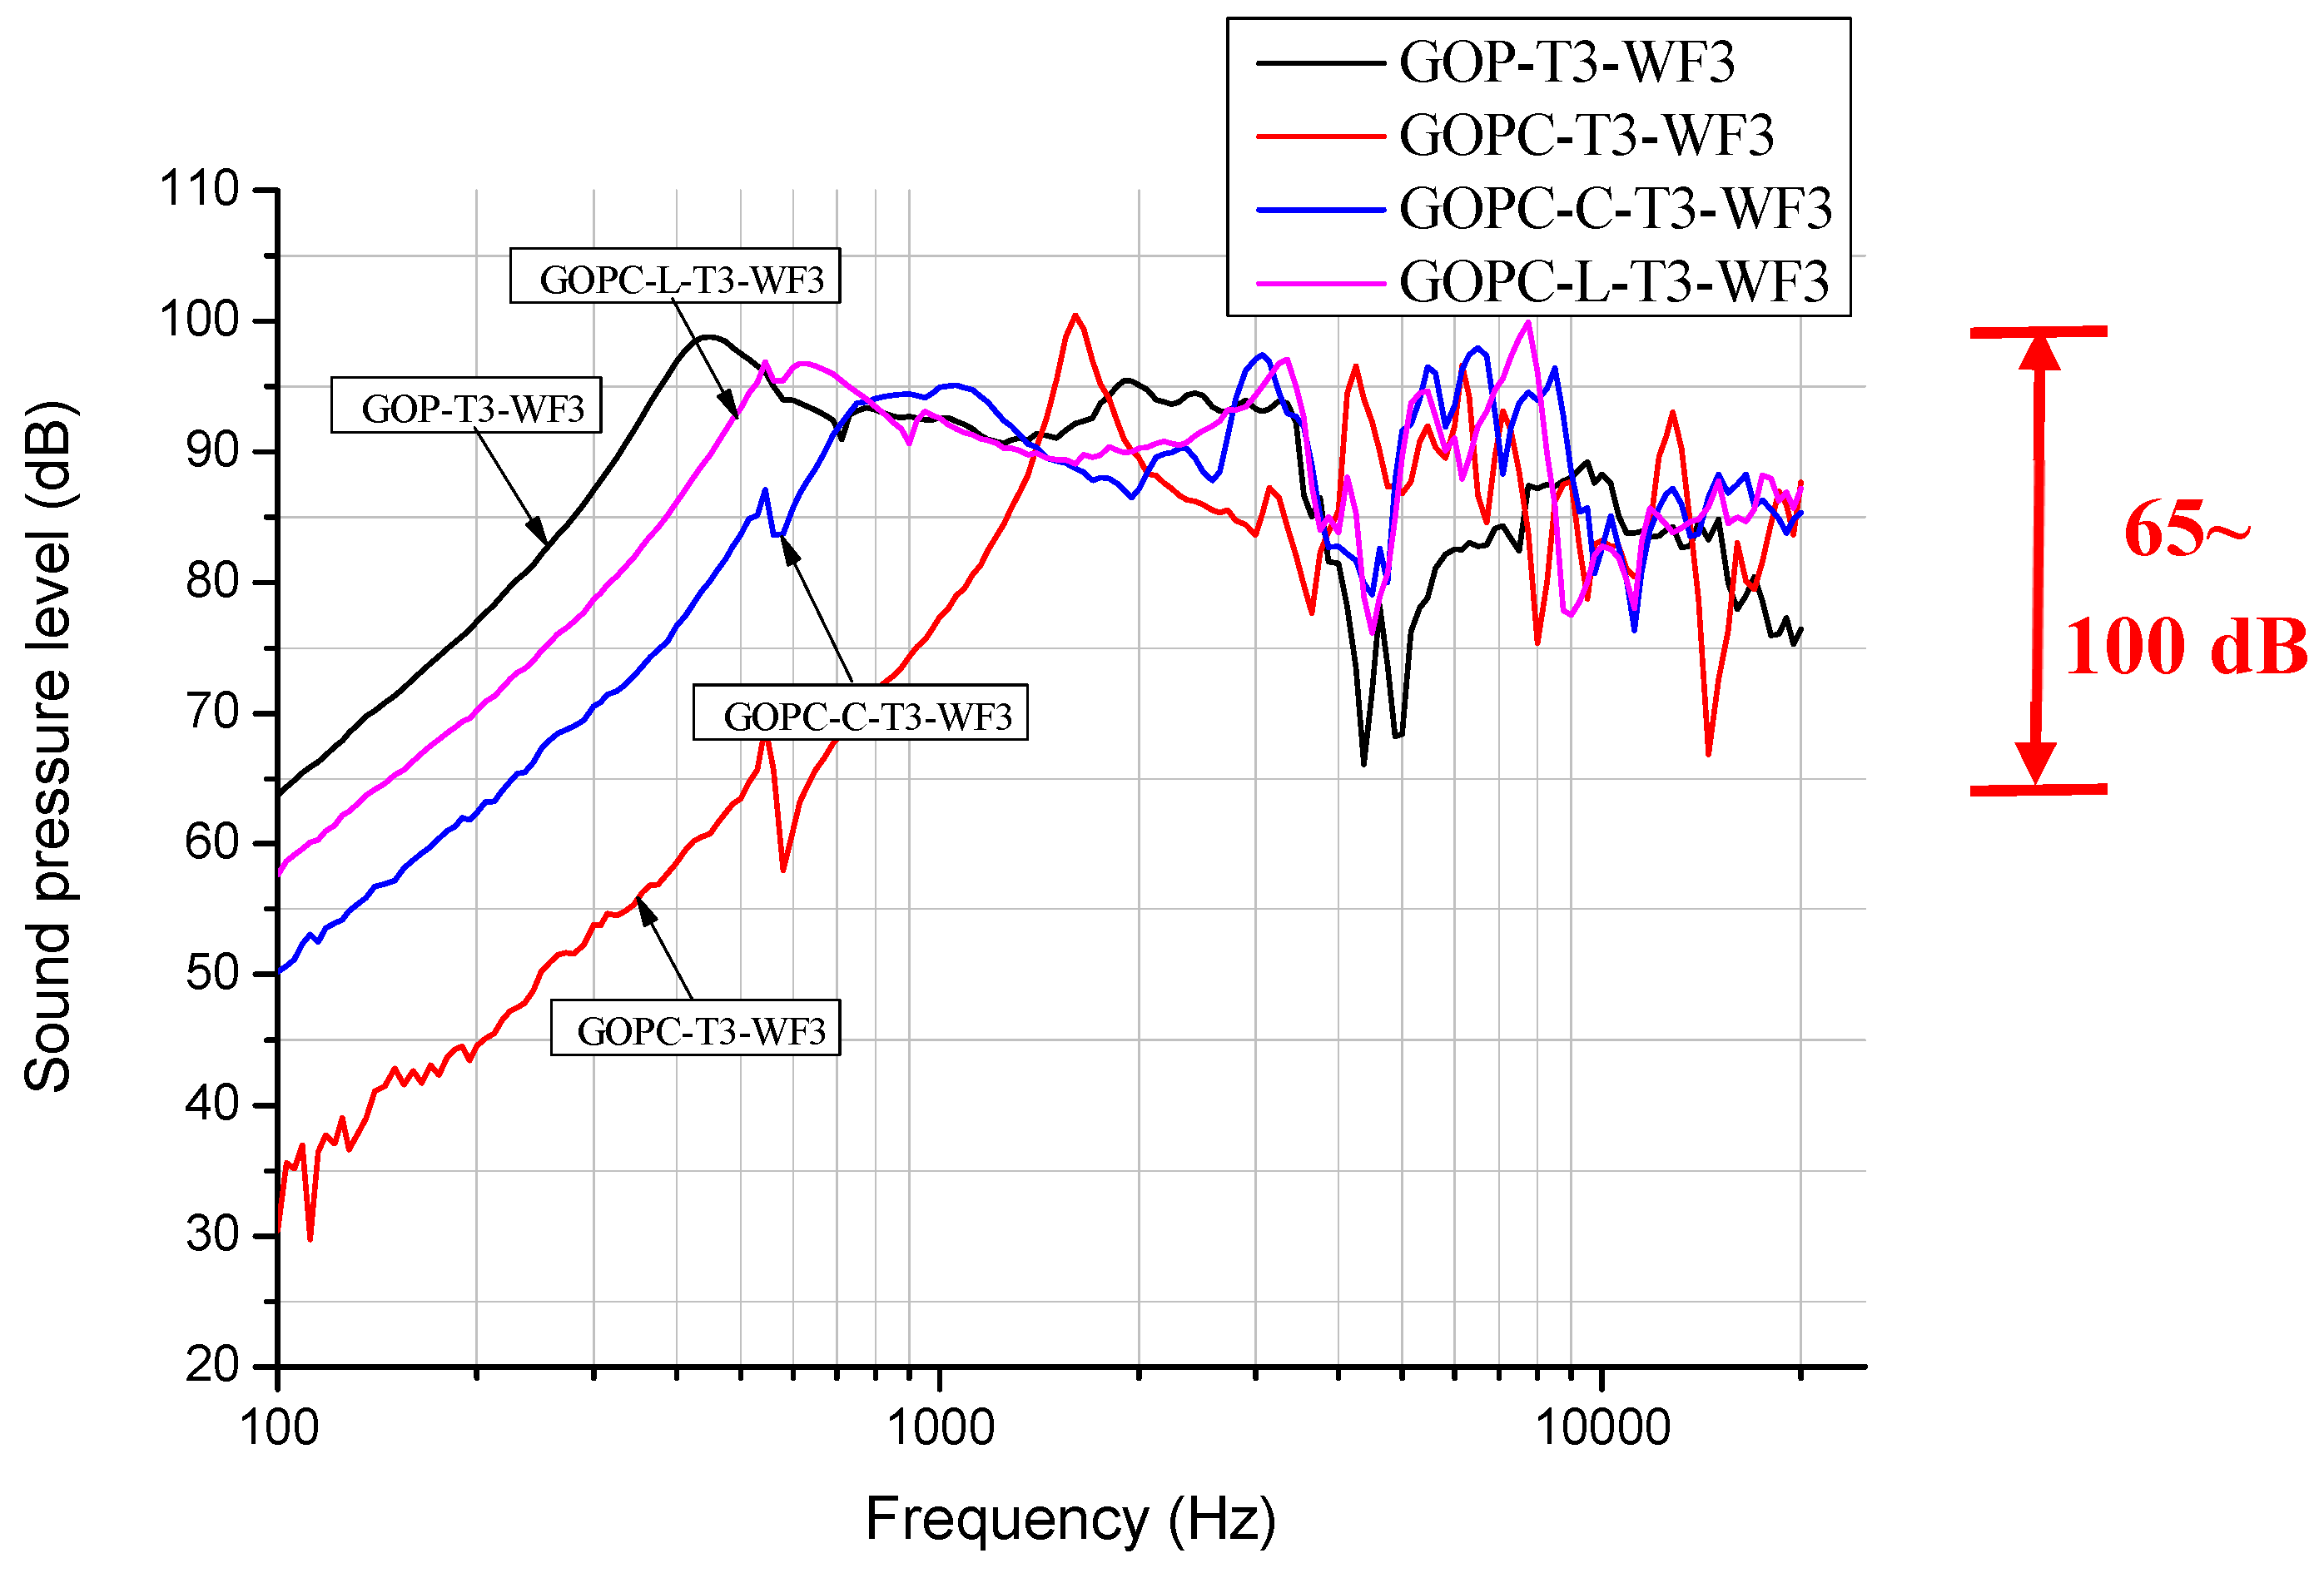
Figure 3 shows SPL (sound pressure level) curves for diaphragm headphones fabricated by GO papers (GOP) as well as GOP/epoxy nanocomposites without patterns (GOPC) and with the curve (GOPC-C) and line (GOPC-L) indented patterns. All diaphragms were fabricated with GO weight fraction of 1.5 wt% (WF3) in suspension and with a sonication time of 10 minutes (T3). At frequencies lower than 3000 Hz, The GOP-T3-WF3 diaphragm has a smoother SPL curve than the other three nanocomposite diaphragms, GOPC-T3-WF3, GOPC-C-T3-WF3, and GOPC-L-T3-WF3. Besides, GOP possesses the largest frequency bandwidth for SPL value above 90 dB, which is between 350 and 3.5k Hz, and the highest initial SPL value of 64 dB at a sweeping frequency of 100 Hz, which indicates that its sensitivity is good. This 90-dB threshold value of the GOP is equivalent to that required for the commercial diaphragm; besides, the approximate flat curve between 2k to 3.5k Hz could provide good sensitivity for human hearing. The smoother SPL curve of GOP is due to its higher mechanical compliance, C
ms of 7.25 m/N as shown in
Table 2. The highest SPL value for GOP is 98 dB at the first resonant frequency of 430 Hz, which is better than 50 dB in reference [
2]. For the nanocomposite GOPC with the lower mechanical compliance of 0.3 m/N (higher stiffness), the first resonant frequency shifts to a higher frequency of 1800 Hz as compared with GOP, and its bandwidth is smallest.
Table 3 shows the maximum SPL values of four kinds of diaphragm headphones. The GOP headphone has the maximum SPL value of 99 dB and the other three kinds of nanocomposite diaphragm headphones possess the maximum SPL values higher than 100 dB. All these results indicate that adopting GOP as diaphragm headphones is a viable route. Besides, as comparing the SPLs in
Table 3 with the compliances in
Table 2, the maximum SPL value seems to be inversely proportional to the compliance value. This could be attributed to the better specific modulus (E/) of the GOP driver compared with that of the commercial beryllium copper (BeCu) thin film driver [
14,
15,
16]. The moduli E of GOP and BeCu films are 3.41 GPa and 102 GPa, respectively; while the densities of GOP and BeCu films are 0.15 and 8.25 g/cm
3, respectively. Therefore, their specific moduli can be calculated as 22.73 (3.41/0.15) and 12.36 (102/8.25), respectively, which show that GOP has a significant higher specific modulus than that of BeCu films. Actually the specific modulus is proportional to sound speed (
), and better specific modulus of GOP could result in good SPL performance.
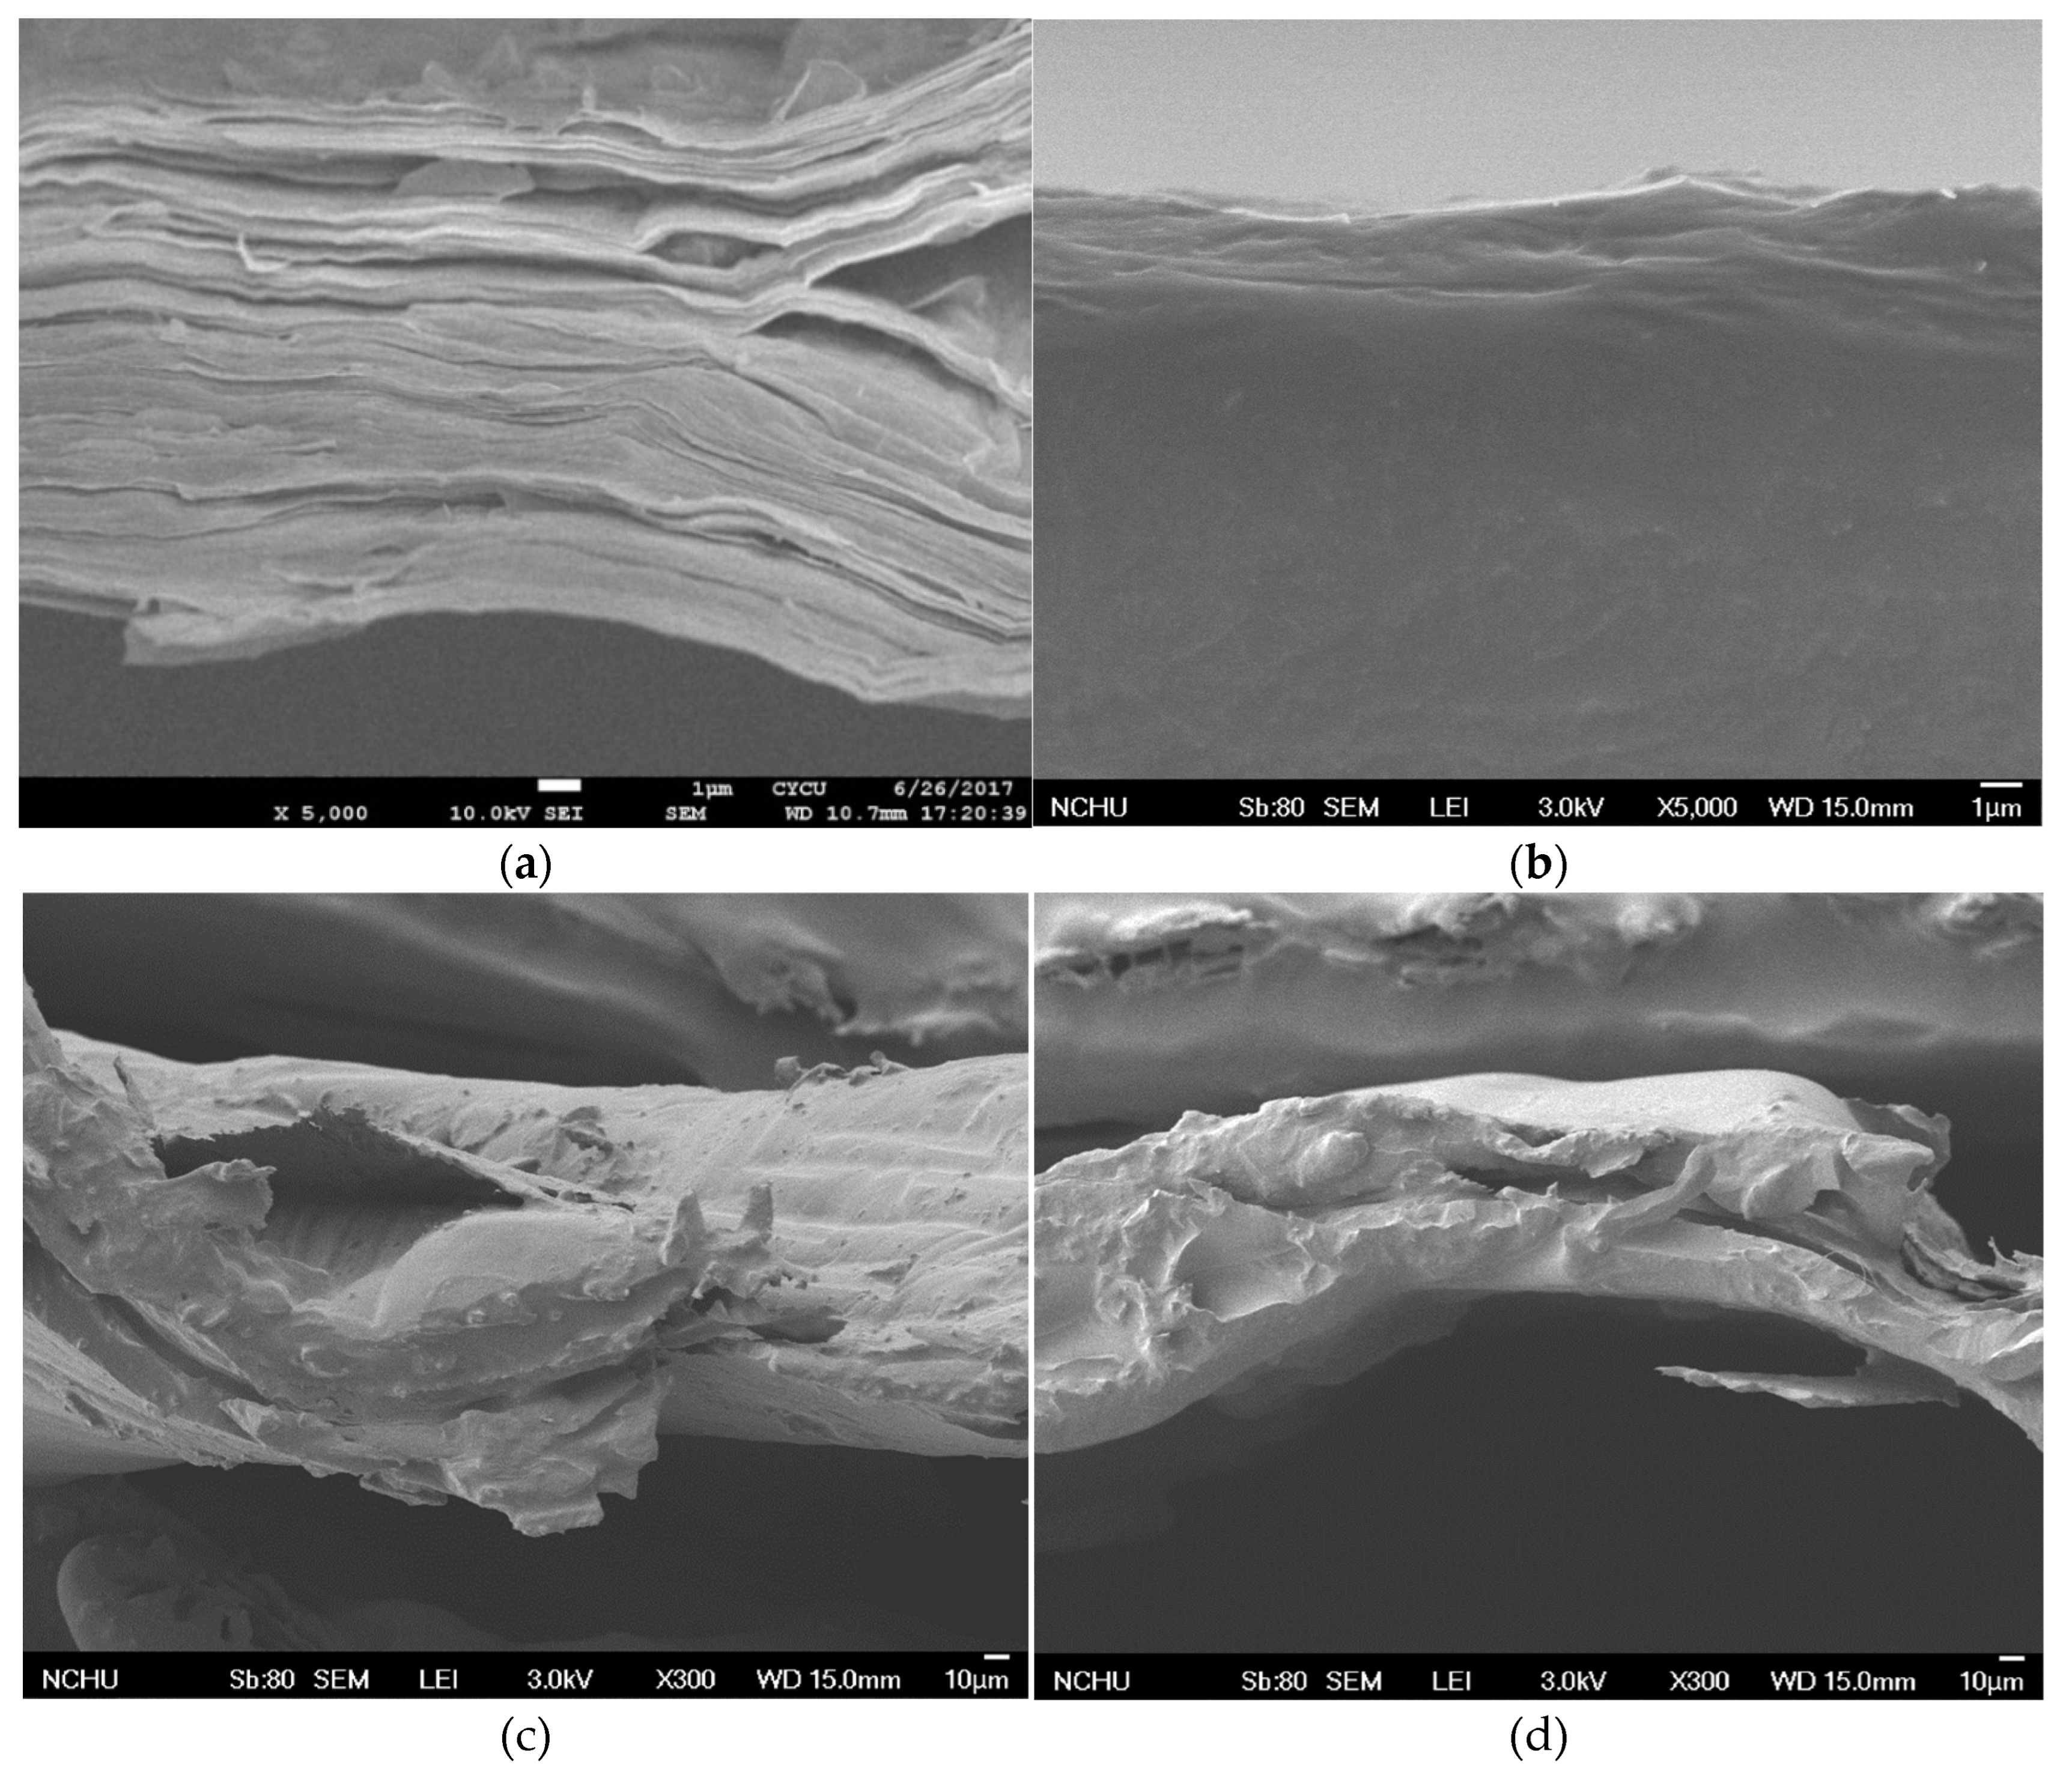
Figure 4 depicts micrographs for the cross-sectional views of four kinds of diaphragms fabricated at same processing parameters of T3 and WF3, and
Figure 4a,b show those for GOP and GOPC, respectively. As shown in
Figure 4a, thick and almost uniform stacked GO nanosheets are found and should be due to the highest GO weight fraction WF3. Only few interlaminar pores are found at the right hand side of the micrograph. On the other hand, more interlaminar holes exist for GOPC as shown in
Figure 4b, and this indicates that there is very little epoxy infiltration. Since the GOPC is fabricated by vacuum bag molding, epoxy is very difficult to infiltrate in the through-thickness direction via tortuous pores inside the stacking 2-D nanosheets of the GOP. More pores in the GOPC lead to its lower dB value at the initial sweeping frequency as shown in
Figure 3.
Figure 4c,d show micrographs for the patterned GOPC-C and GOPC-L diaphragms, respectively. Two features are found in these two micrographs: first, both GOPCs depict a curve shape and the GOPC-C seems to possess the shape with a smaller radius of curvature at the left hand side of
Figure 4c; second, both GOPCs show few intralaminar pores indicating that epoxy infiltration is improved by the help of indentation process. Therefore, both features lead to medium compliance values and more uniform microstructure. Their correlated SPLs are shown in
Figure 3, and the corresponding discussion is proposed in section 3.2.
3.2. Effect of pattern on the nanocomposite
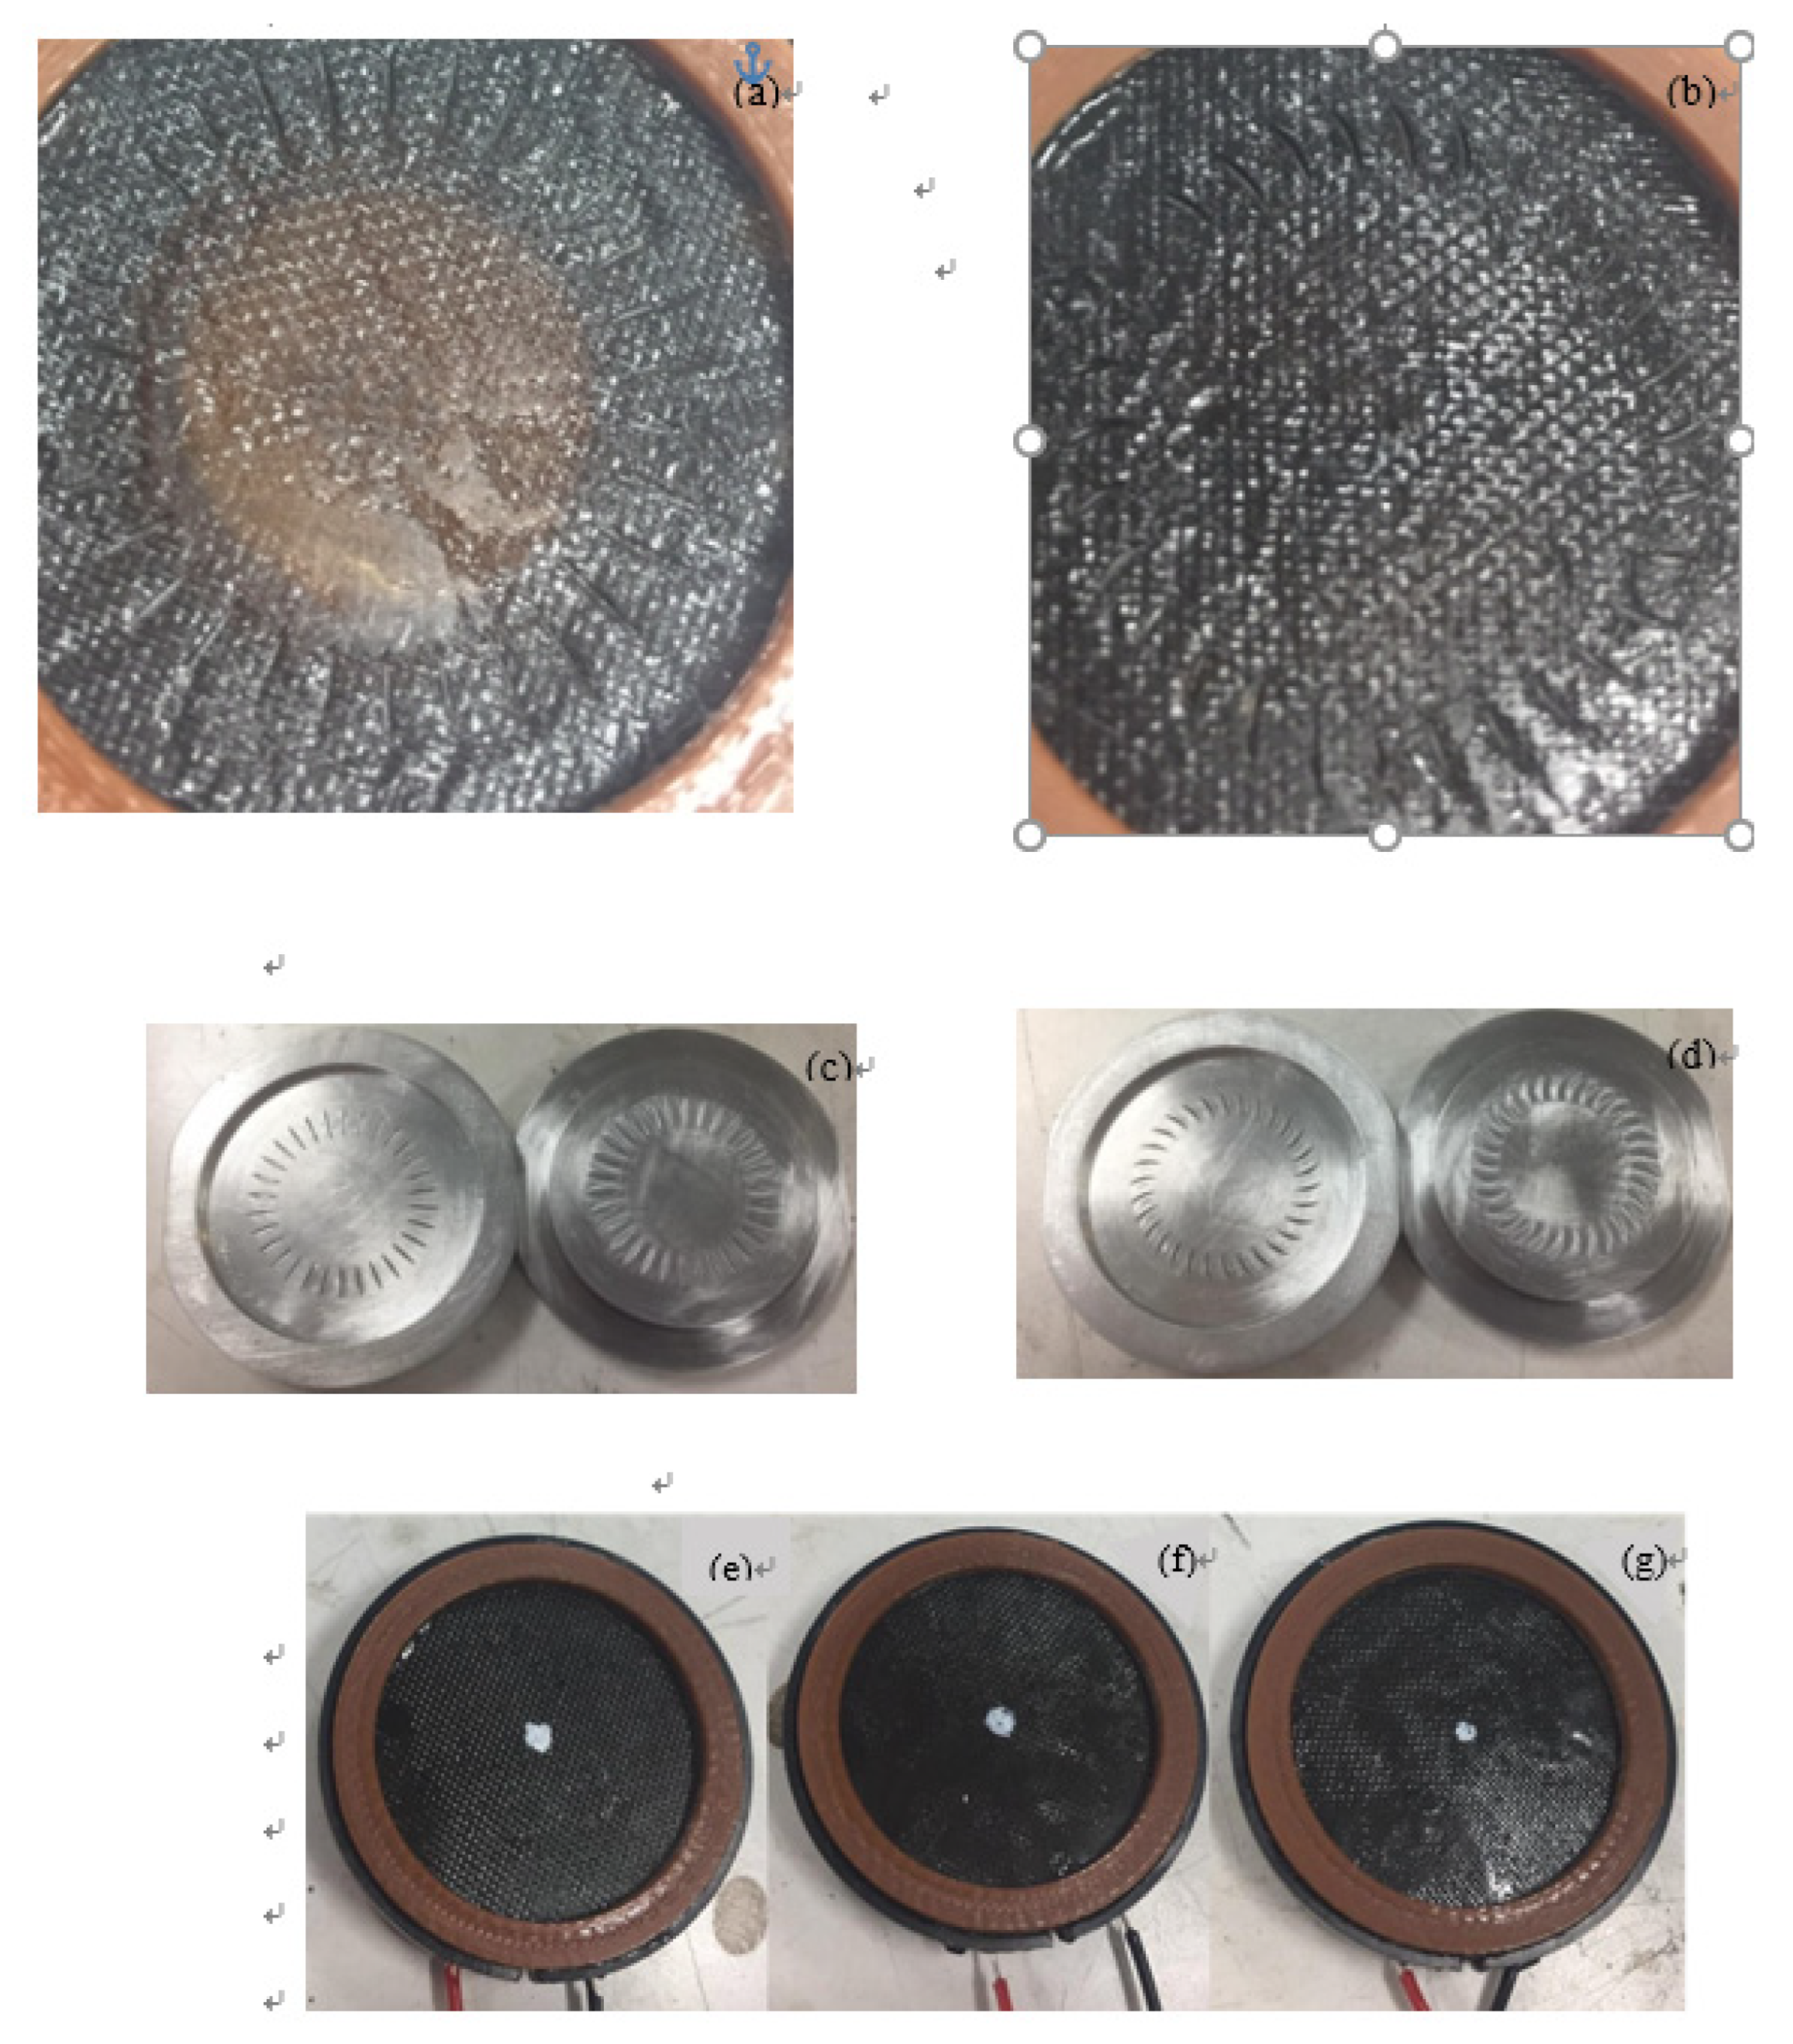
Figure 5a,b depicts respectively the fabricated nanocomposite diaphragm drivers with lined (GOPC-L) and curved (GOPC-C) patterns. Both patterns are uniform short line or arc indentations in the radial direction fabricated respectively by the molds shown in
Figure 5c,d.
Figure 5e, f, and g depict respectively the well fabricated headphones, GOPC-T1-WF3, GOPC-T2-WF3, and GOPC-T3-WF3.
Figure 3 also shows the effect of the two pattern types of nanocomposites on the SPL curves of diaphragm headphones. Due to higher compliances, both GOPC-L and GOPC-C headphones show higher SPL values at the initial 100 Hz compared with GOPC, and also indicate smoother SPL curves for frequencies higher than 10kHz resulted from more uniform microstructure. With patterns on nanocomposite diaphragms, the first resonant frequencies of both GOPC-C and GOPC-L shift back to lower values due to the increase of mechanical compliance to medium values, as compared with that of GOPC. In addition, it is found that both patterned GOPCs could significantly improve the SPL performance of the GOPC diaphragm headphone in the lower frequency range because the compliances of the former are higher than that of the latter. As shown in
Table 2, the compliances C
ms of GOPC-L, GOPC-C, GOPC, and GOP are respectively 1.14, 0.88, 0.30, and 7.25 m/N. In the high frequency range of larger than 3000 Hz as shown in
Figure 3, all four diaphragms depict unstable SPL curves; however, GOPC-L shows a relatively smoother SPL curve. Furthermore, the SPL performance of GOPC-L with higher compliance is better than that of GOPC-C in the low frequency range, because the larger lateral vibration amplitude of the former contributes better to acoustic performance.
3.3. Effect of sonication time
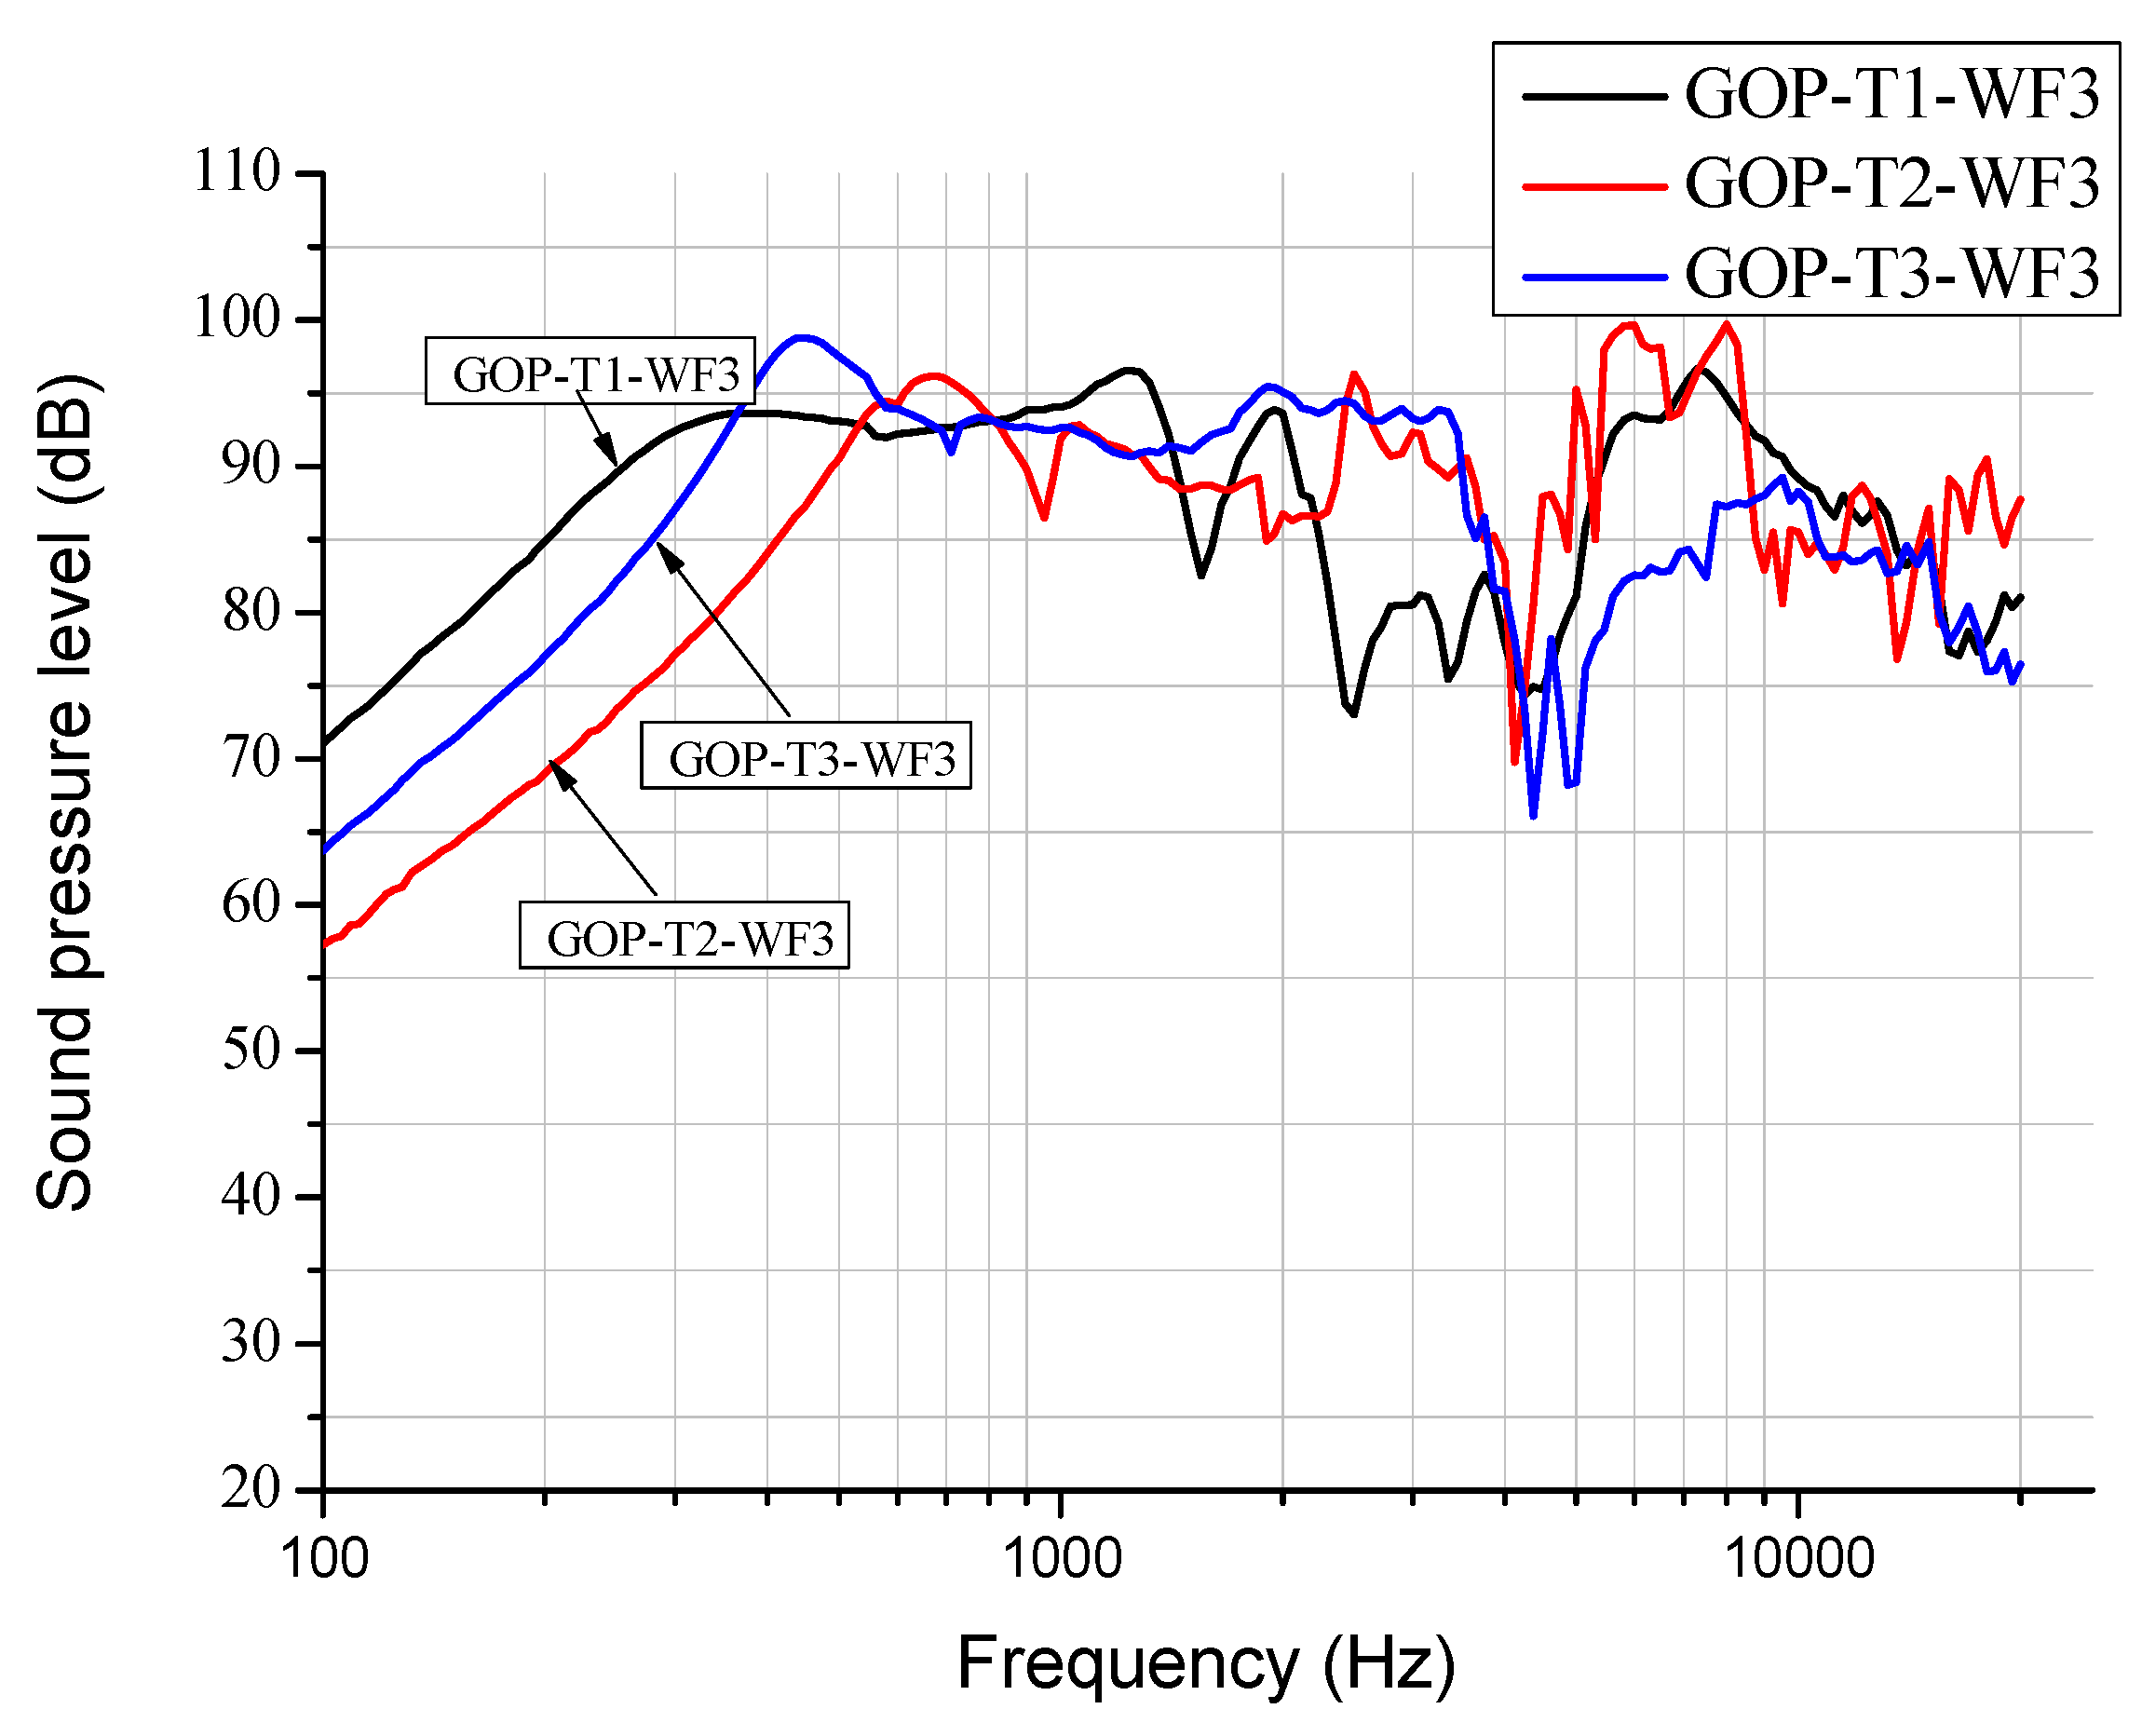
Figure 6 shows the SPL curves for GOP-WF3 diaphragm headphones fabricated by various sonication times T1~T3 (1~10 min) applied in suspension. For lower sonication time T1, the first resonant frequency of diaphragm GOP-T1 seems to shift to a lower frequency of 300 Hz; besides, in the frequency range from 300 to 1050Hz, GOP-T1 also indicates a comparatively smoother curve. By lower sonication time T1 applied in GO suspension, the pristine 2D GO nanosheets are broken and their size is larger compared with that by T3, and when these GO nanosheets combine as GOP they tend to be a loose and interlocked stacking. On the other hand, for GOP-T3 with higher T3, there is a tight packing of smaller GO nanosheets in the GOP with intrinsic small pores indicated in
Figure 4a. Upon frequency sweeping by SPL measurement in the high frequency range around 10k Hz, those pores might lead to the oscillation of the SPL curve. However, this common oscillation phenomenon is called mode splitting occurring even in the commercial diaphragm, which can be improved by increase modulus of diaphragm.
Figure 7 depicts the SPL curves for GOPC-WF3 diaphragm headphones fabricated by various sonication times. The trend of the effect of sonication time on SPL for GOPC is in reverse as compared with that for GOP. GOPC-T3 has a wider bandwidth at lower frequencies and a smoother curve at higher frequencies than GOPC-T1. Fabricated by T3, GOP is stacked by smaller-sized 2D GO nanosheets, and pores inside GOP are less tortuous in the through-thickness direction. Upon fabricating from GOP to be GOPC, epoxy resin is easier to infiltrate GOP. This results in better interlayer bonding of GOPC-T3 as well as better SPL performance.
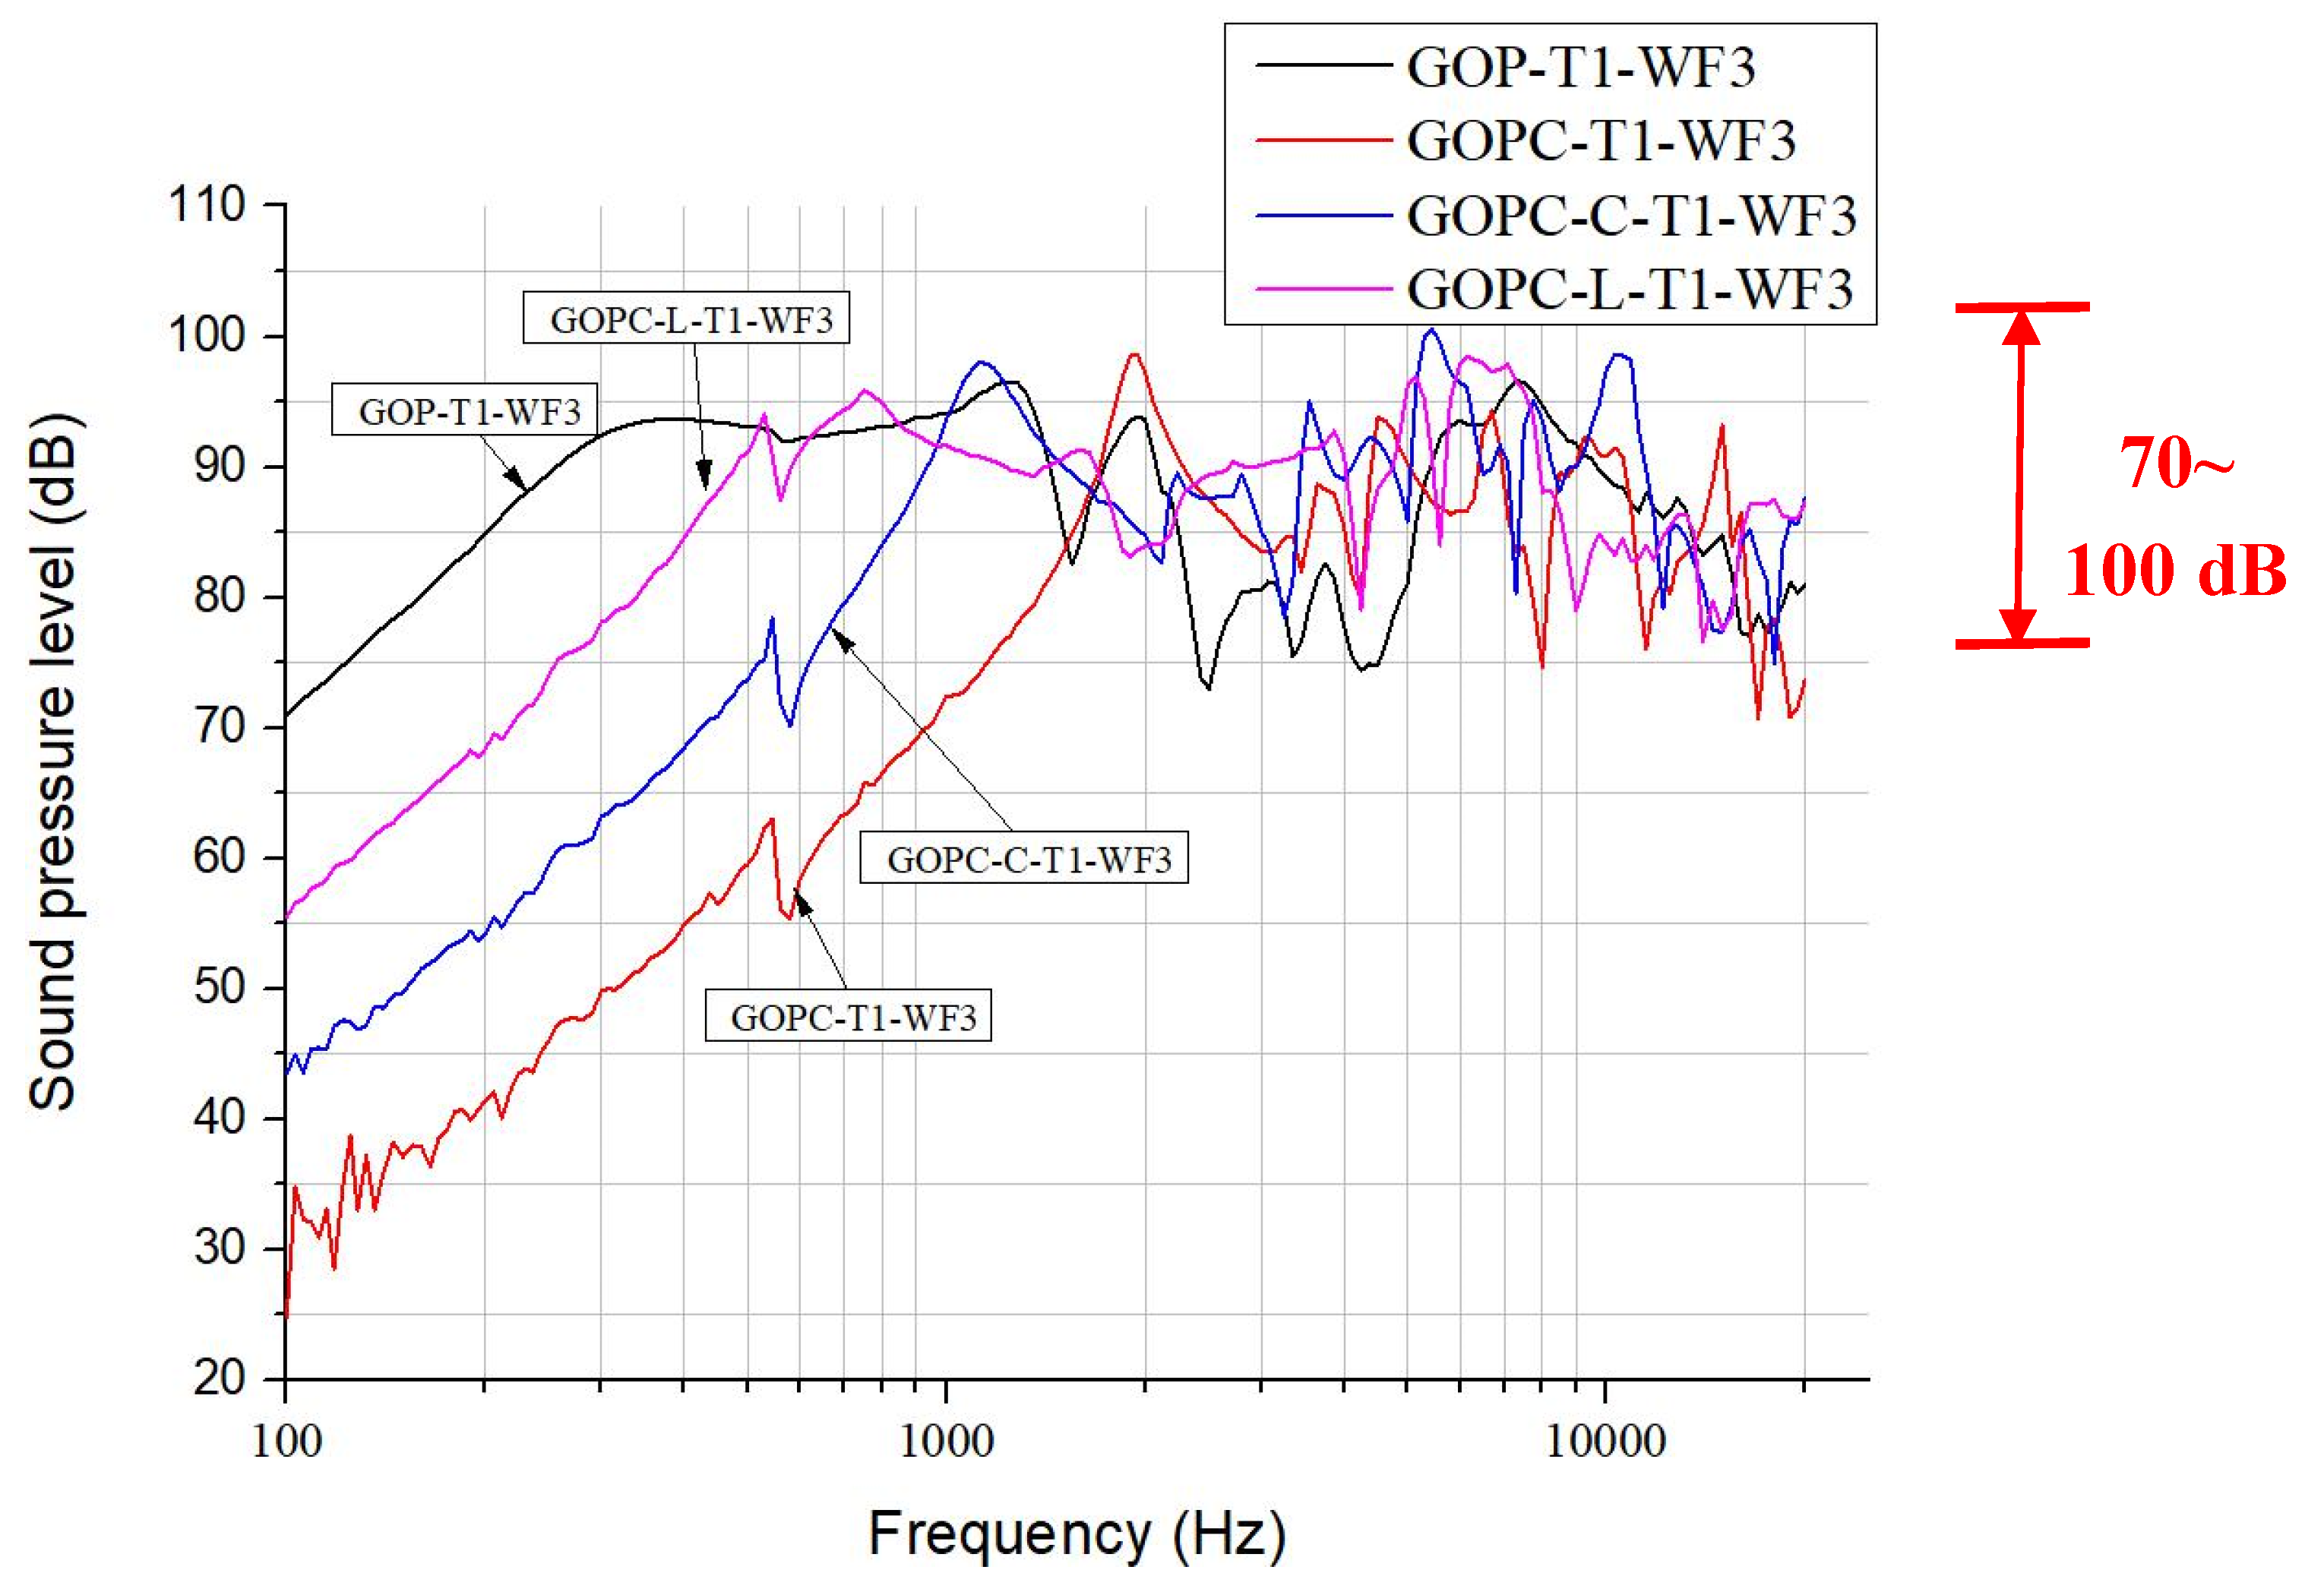
Figure 8 shows the four SPL curves for diaphragm headphones fabricated at lowest sonication time of T1 and WF3 by GOP, GOPC, and patterned GOPC-L and GOPC-C. This figure can be compared with
Figure 3 for the four headphones fabricated by T3. For diaphragms fabricated by T1, GOP-T1-WF3 has a higher initial SPL value of 71 dB at 100 Hz than that of GOP-T3-WF3. Either T1 or T3 may lead to different diaphragms having the highest SPL higher than 100 dB, for GOPC-C-T1-WF3 occurring at 5500 Hz, while for GOPC-T3-WF3 occurring at 1500 Hz. In the high frequency range more than 2k Hz, by T1 the oscillation extent of SPL curves of the diaphragms ranges between 70 to 100 dB as shown in
Figure 8, which is less significant than that by T3 in the range of 65 to 100 dB as shown in
Figure 3.
3.4. Effect of graphene weight fraction
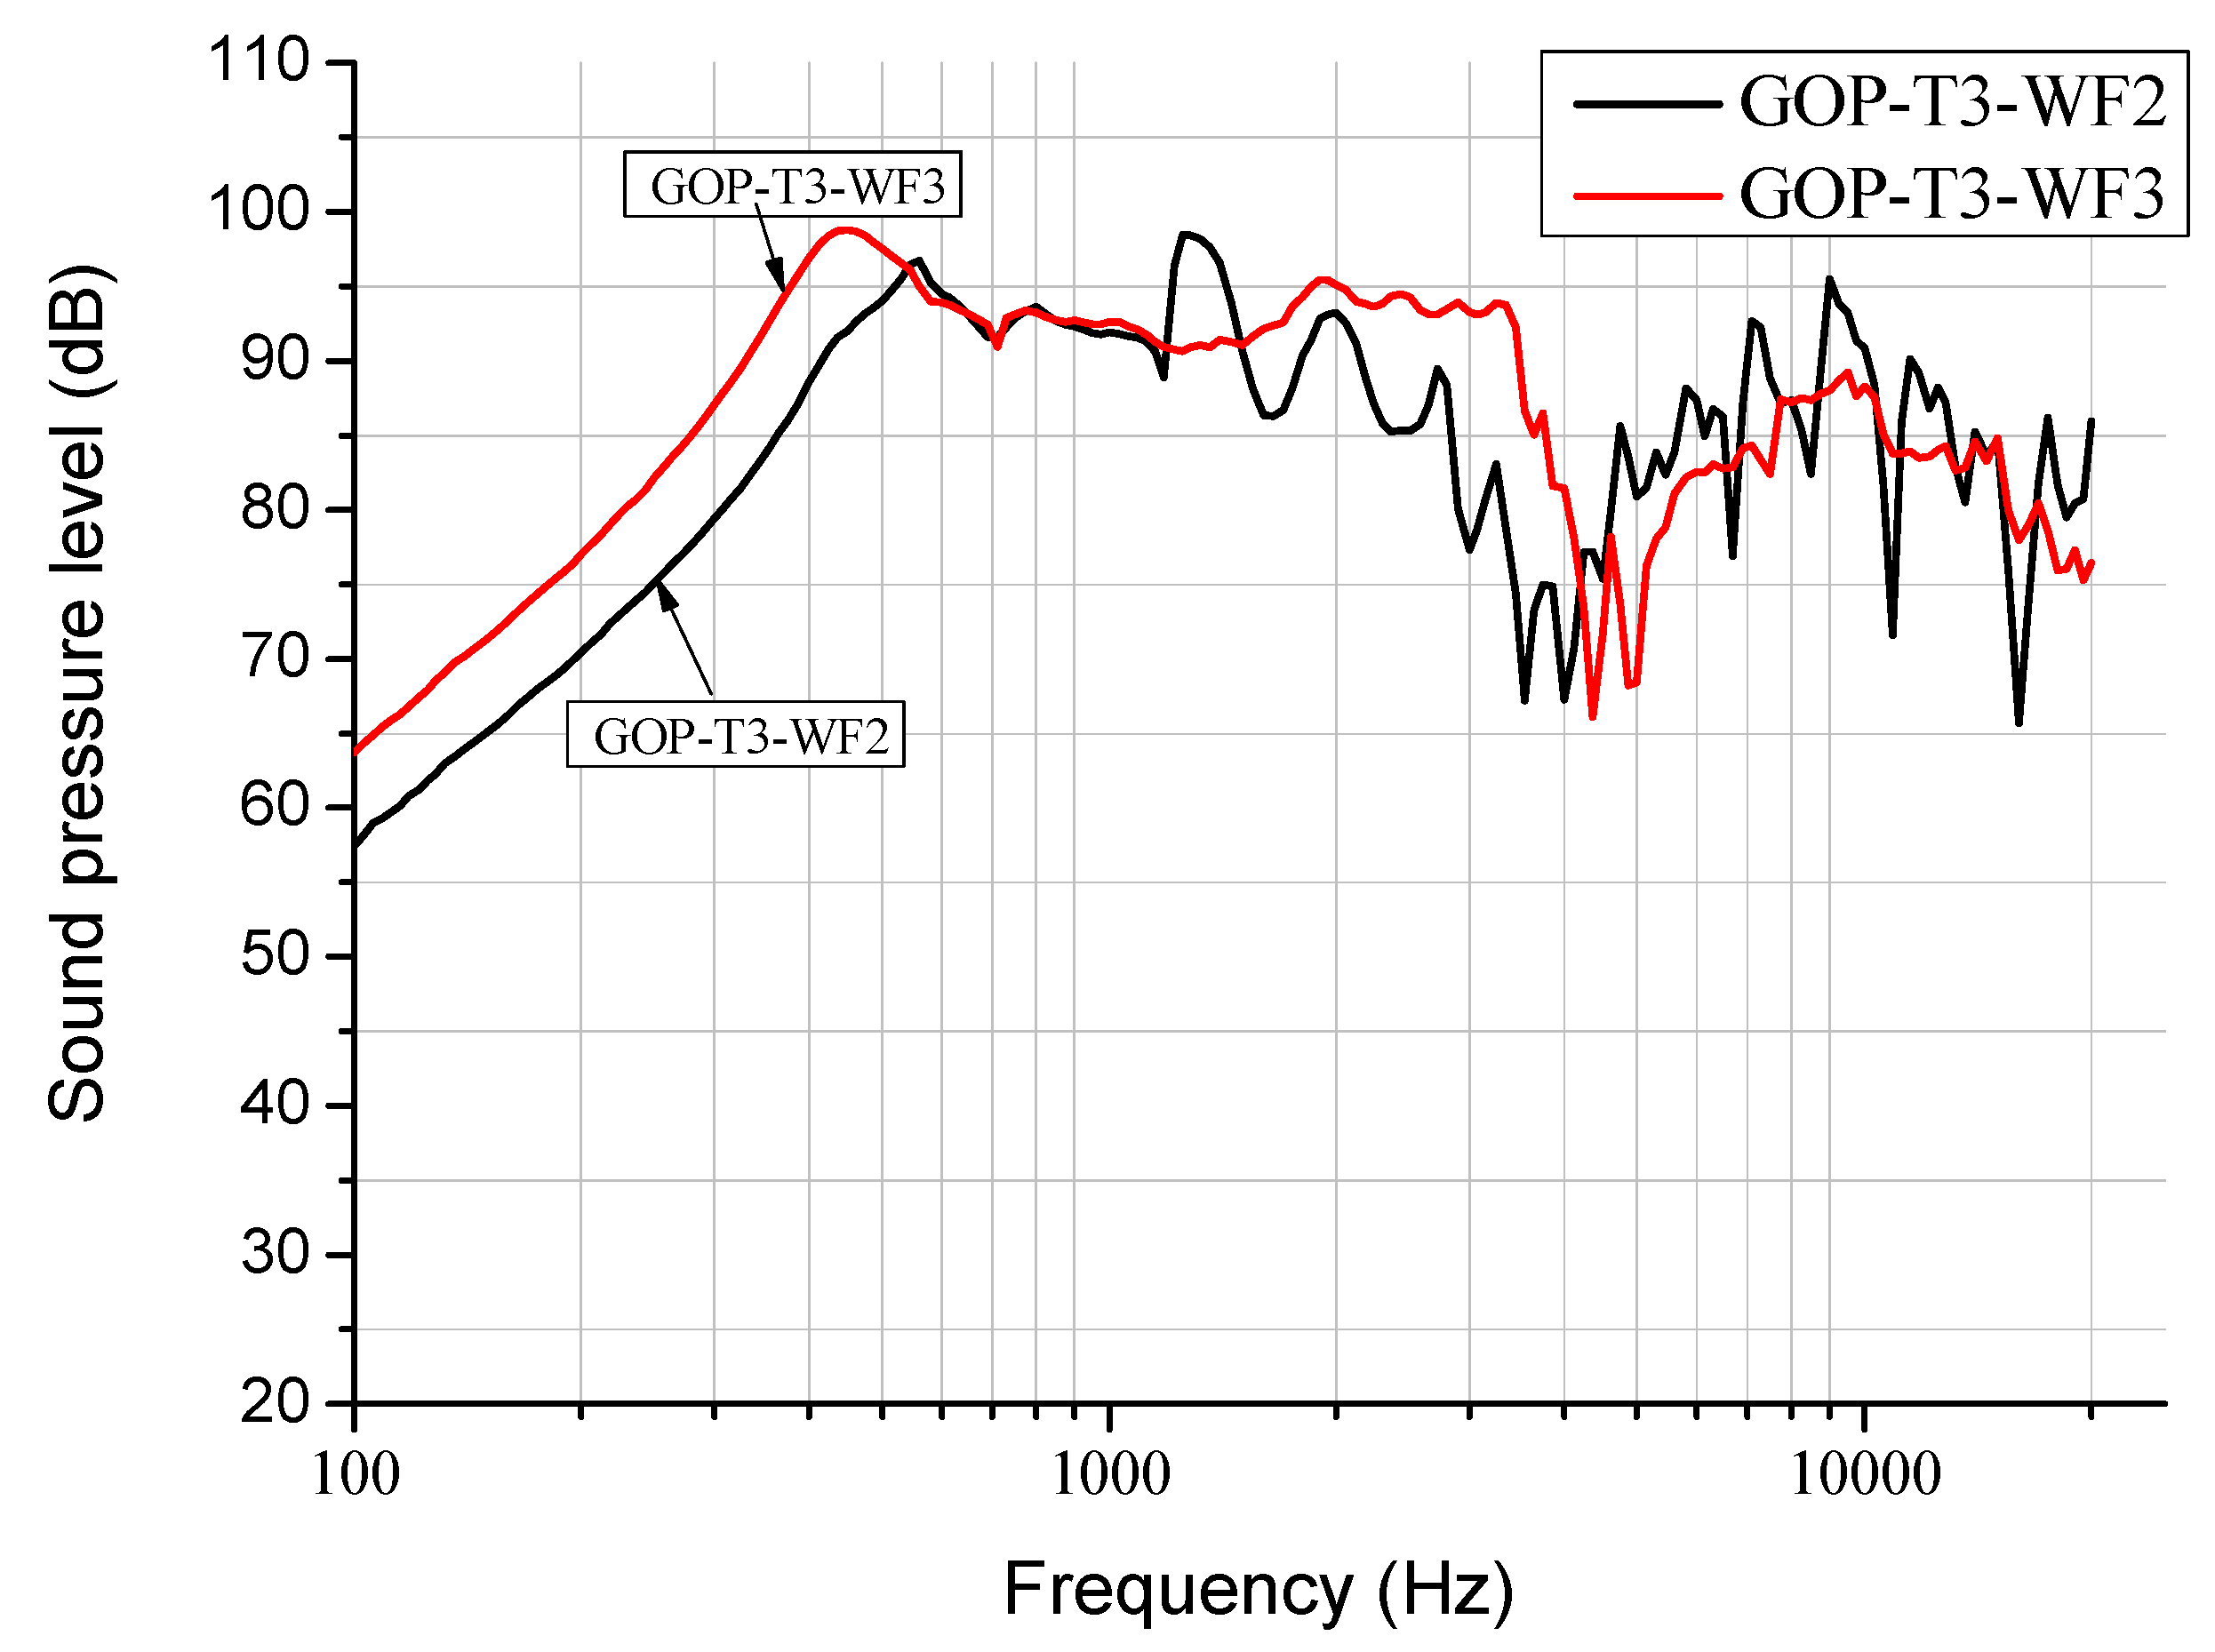
Figure 9 illustrates the SPL curves for GOP diaphragm headphones fabricated by various GO weight fractions in suspension. According to our studies, a higher weight fraction of WF3 can lead to thicker GOP with higher compliance which results in the GOP-T3-WF3 headphone with a larger bandwidth around 500 Hz, a smoother curve around 10k Hz, and a higher maximum SPL value of 98 dB at 500 Hz as compared with that by WF2. In contrast,
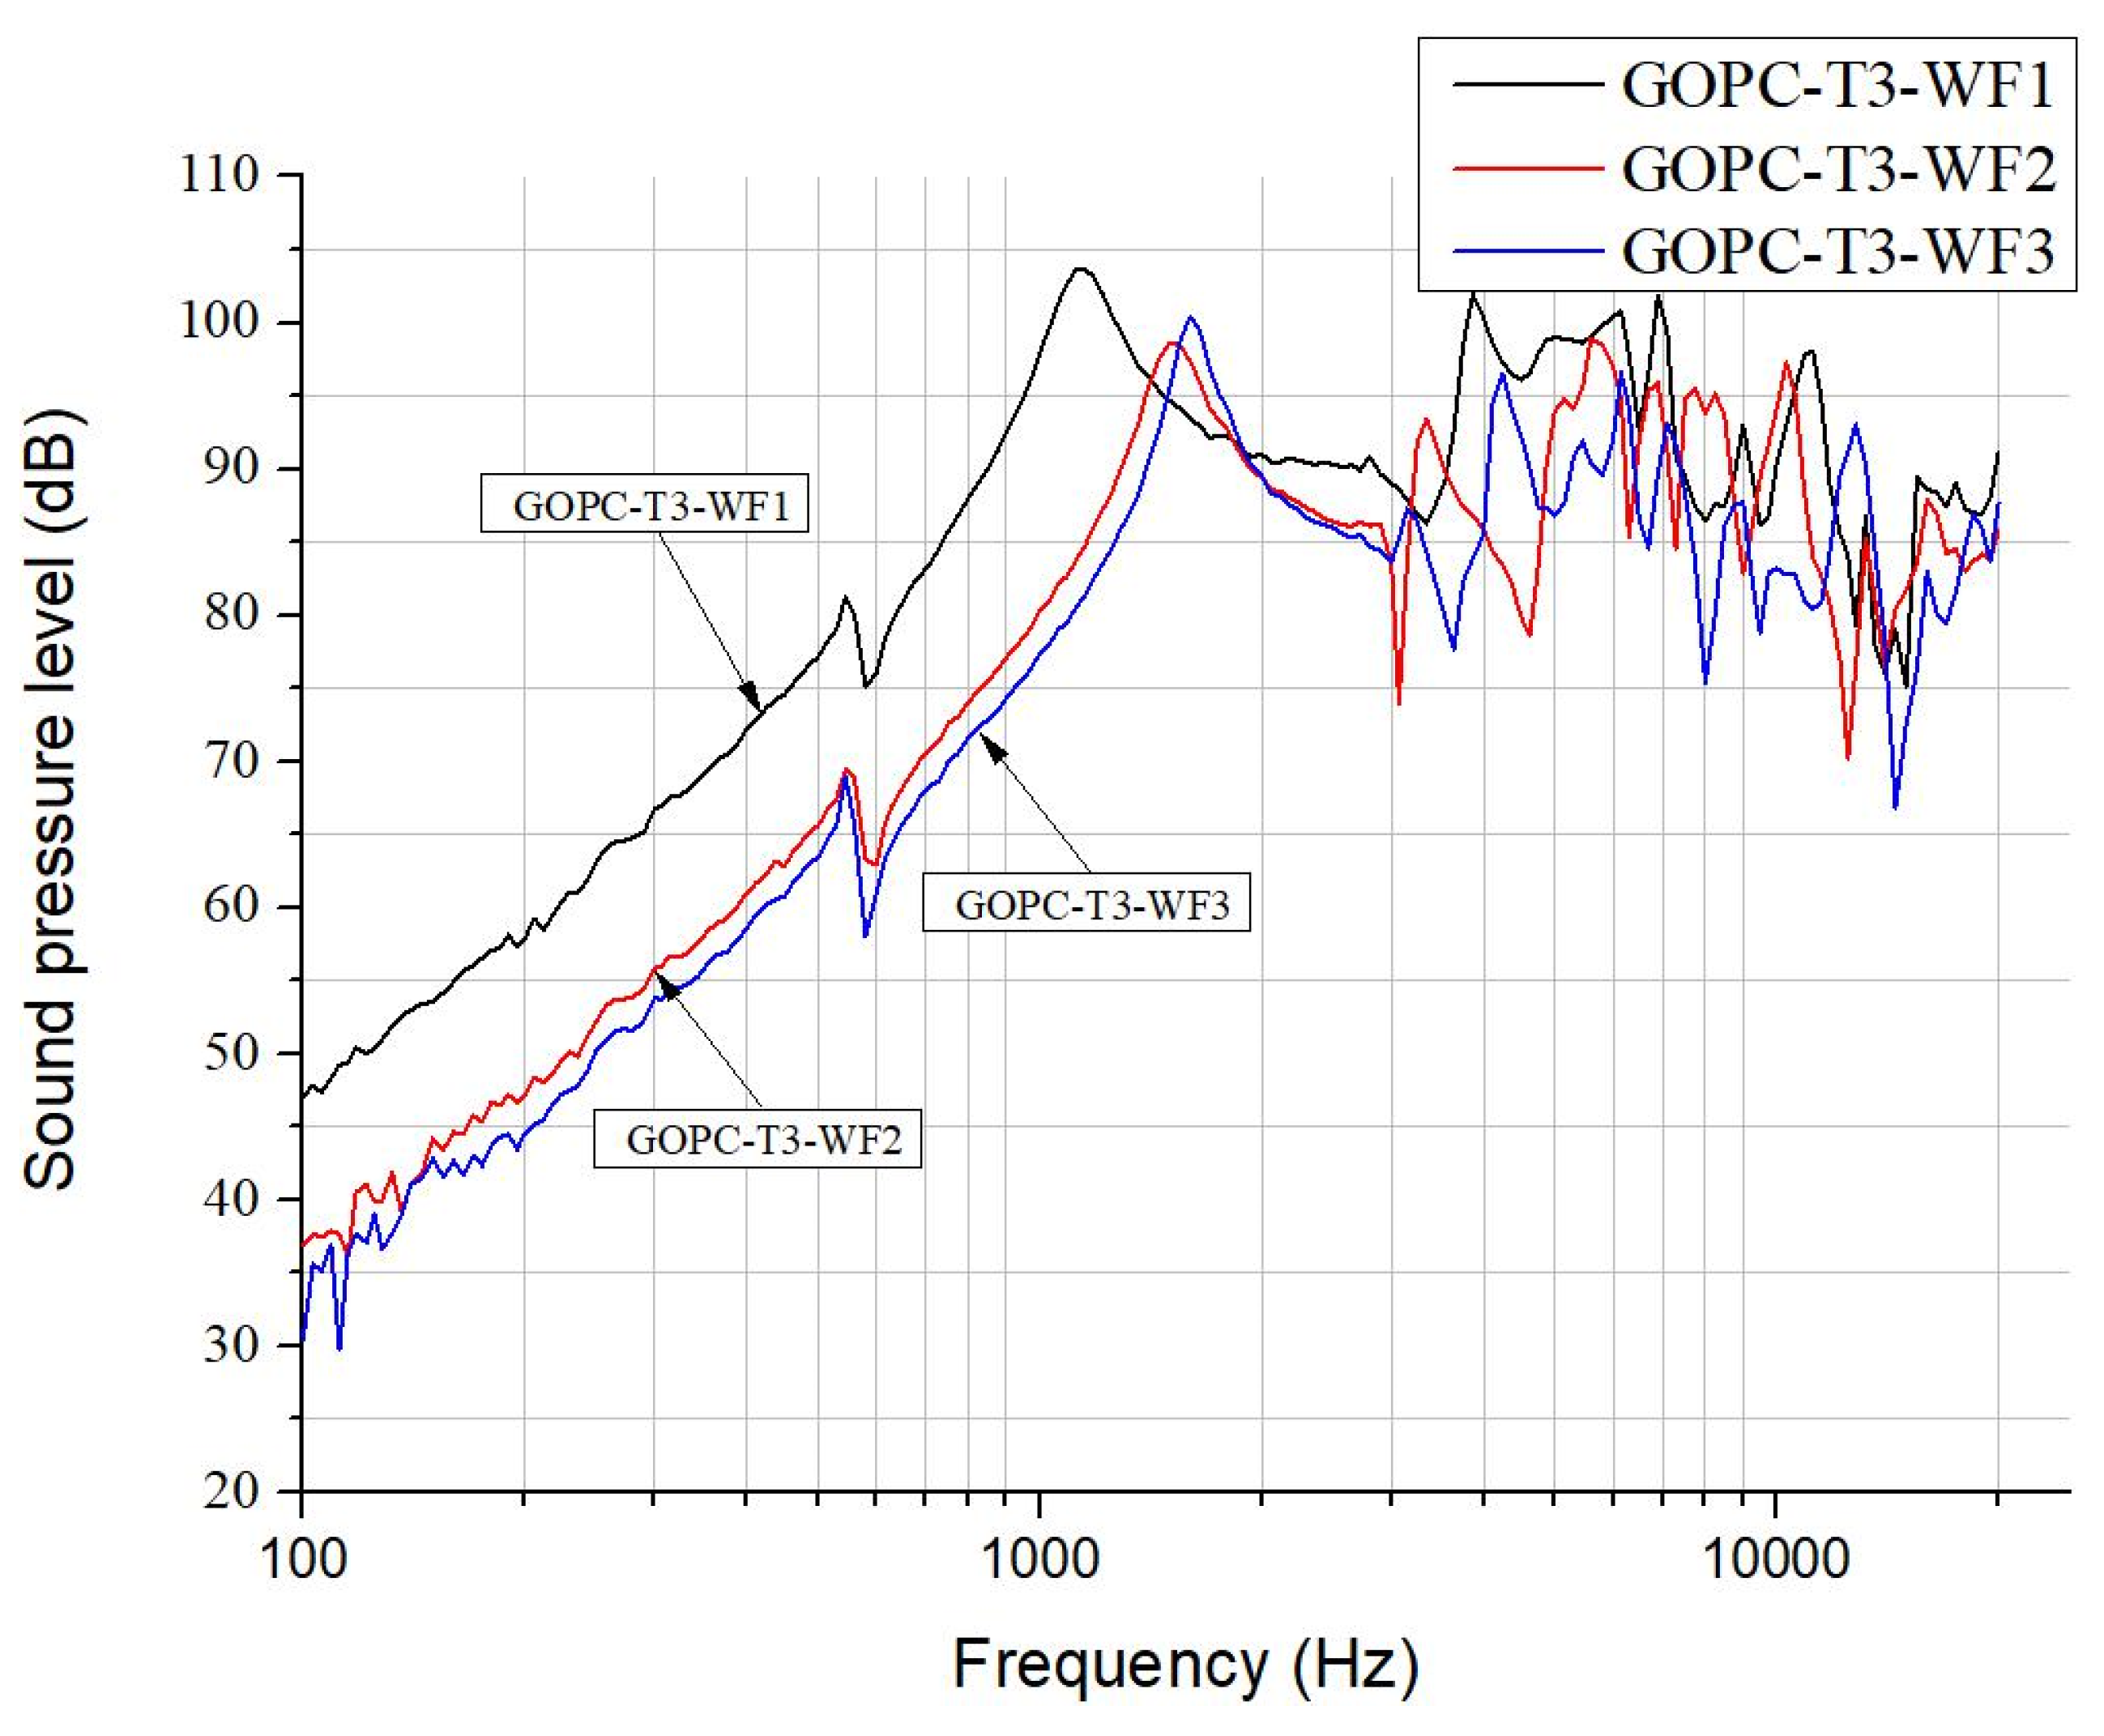
Figure 10 depicts a different trend of the effect of GO weight fraction in suspension on SPL curves for GOPC diaphragm headphones as compared with
Figure 9. Among these three headphones, the lowest weight fraction of WF1 leads to GOPC-T3-WF1 with the highest SPL value of 104 dB, and the best bandwidth at 1500 Hz. This is because a lower weight fraction of WF1 can lead to thin GOP where epoxy resin is easier to infiltrate, and this further results in better interlayer bonding of GOPC.
Based on the results in reference [
11], the addition of graphene in the epoxy resin would reduce its toughness. Therefore, it can be inferred that the toughness of GOPC is higher than that of GOP, and the resonant frequency of GOPC is also higher than that of GOP because the frequency is proportional to the toughness value. This is verified in
Figure 9 and
Figure 10, in which the first resonant frequencies of GOP-T3-WF3 and GOPC-T3-WF3 are 450 Hz and 1500 Hz, respectively. Another result [
11] showed that the damping ratio of GNPs-reinforced composites is higher than neat epoxy and proportional to the weight fraction of GNP addition. According to the rule of mixtures, it is inferred that a single graphene nanosheet has a higher damping ratio than the epoxy. However, due to non-uniformity and pores inside the laminate GOP, it could be assumed that the damping ratio of GOPC is higher than that of GOP in our work. A higher damping ratio could be beneficial to reduce transient distortion; in other words, the headphone could perform a smoother SPL curve at middle to higher frequency range because upon frequency sweeping the vibration of the diaphragm could quickly reduce to its original position. This can be proved in
Figure 3 that at around 4-5k Hz the SPL curves for GOP-T3 have a significant drop; while the drop for GOPC-T3 is flatter. This drop probably can be better adjusted by using a different designing headphone unit (case) as shown in
Figure 1d.
4. Conclusions
In this paper, four kinds of diaphragm headphones are fabricated including GOP (graphene oxide paper), GOPC (GOP/epoxy nanocomposites), GOPC-L (Line indented GOPC), and GOPC-C (Curve indented GOPC) headphones, and the influencing factors on their SPL performance are investigated. Several interesting findings are summarized as follows. Results show that the GOP diaphragm headphone possesses a wider bandwidth and a smoother SPL curve in a lower frequency range, a high initial SPL value of 71 dB at a sweeping frequency of 100 Hz, and a good SPL value of 99 dB at the first resonant frequency of 430 Hz. On the other hand, the GOPC diaphragm headphone has a comparative smoother SPL curve in a higher frequency range, a lower initial SPL value of 30 dB at 100 Hz, and the highest SPL value of 104 dB. The higher initial SPL value of GOP is caused by its high compliance value. Besides, even without the addition of epoxy a pure GOP diaphragm can achieve a maximum SPL of 99 dB due to its high specific modulus. Higher damping ratio and lower compliance of 0.3 m/N result in the GOP diaphragm with flatter SPL curve at higher frequency. Both indented patterns on GOPC seem to improve initial SPL values at the lowest frequency of 100 Hz due to the increase of compliance. Besides, the patterns lead to smoother SPL curves for frequencies higher than 10k Hz because of the more uniform microstructure.
Owing to the different fabrication features of GOP and GOPC, the effects of sonication time and graphene weight fraction on their SPLs are in reverse. Both T1 and WF3 lead to the GOP with better SPL because they all provide better interlocked 2D nanosheets for a good diaphragm. On the other hand, both T3 and WF1 result in the GOPC with better SPL because they provide a more uniform microstructure for the composite. To sum up, GOP and GOPC diaphragms could be high potential candidates for headphones applied in lower and higher frequency ranges, respectively. Therefore, GOP and GOPC diaphragms may be synergistically combined into a high performance two-way headphone.
Author Contributions
S.H.: conceptualization, methodology, validation, investigation, writing—original draft preparation, writing—review and editing. H.L. conceptualization, methodology formal analysis, investigation, project administration, funding acquisition, writing—review and editing, supervision, resources. W.L.: investigation, writing—review and editing. Y.C.: investigation, data curation. All authors have read and agreed to the published version of the manuscript.
Funding
This research was funded by National Science and Technology Council, grant number NSTC 112-2221-E-035-072.
Institutional Review Board Statement
Not applicable.
Informed Consent Statement
Not applicable.
Data Availability Statement
Not applicable.
Conflicts of Interest
The authors declare no conflict of interest.
References
- Dikin, D.A.; Stankovich, S.; Zimney, E.J.; Piner, R.D.; Dommett, G.H.B.; Evmenenko, G.; Nguyen, S.T.; Ruoff, R.S. Preparation and characterization of graphene oxide paper. Nature. 2007, 448, 457–460. [Google Scholar] [CrossRef] [PubMed]
- Suk, J.W.; Kirk, K.; Hao, Y.; Hall, N.A.; Ruoff, R.S. Thermoacoustic sound generation from monolayer graphene for transparent and flexible sound sources. Adv. Mater. 2012, 24, 6342–6347. [Google Scholar] [CrossRef] [PubMed]
- Xu, S.C.; Man, B.Y.; Jiang, S.Z.; Chen, C.S.; Yang, C.; Liu, M.; Gao, X.G.; Sun, Z.C.; Zhang, C. Flexible and transparent graphene-based loudspeakers. Appl. Phys. Lett. 2013, 102, 151902. [Google Scholar] [CrossRef]
- Kim, C.S.; Lee, K.E.; Lee, J.M.; Kim, S.O.; Cho, B.J.; Choi, J.W. Application of n-doped three-dimensional reduced graphene oxide aerogel to thin film loudspeaker. ACS Appl. Mater. Interfaces. 2016, 8, 22295–22300. [Google Scholar] [CrossRef]
- Ren, S.; Rong, P.; Yu, Q. Preparations, properties and applications of graphene in functional devices: a concise review. Ceram. Int. 2018, 44, 11940–11955. [Google Scholar] [CrossRef]
- Mehrez, S.; Karati, S.A.; DolatAbadi, P.T.; Shah, S.N.R.; Azam, S.; Khorami, M.; Assilzadeh, H. Nonlocal dynamic modeling of mass sensors consisting of graphene sheets based on strain gradient theory. Adv. Nano. Res. 2020, 9, 221–235. [Google Scholar] [CrossRef]
- Jiang, S.; Shi, S.; Wang, X. Nanomechanics and vibration analysis of graphene sheets via a 2D plate model. J. Phys. D Appl. Phys. 2014, 47, 045104. [Google Scholar] [CrossRef]
- Garcia-Sanchez, D.; van der Zande, A.M.; Paulo, A.S.; Lassagne, B.; McEuen, P.L.; Bachtold, A. Imaging mechanical vibrations in suspended graphene sheets. Nano. Lett. 2008, 8, 1399–1403. [Google Scholar] [CrossRef] [PubMed]
- Sakhaee-Pour, A.; Ahmadian, M.T.; Naghdabadi, R. Vibrational analysis of single-layered graphene sheets. Nanotechnology. 2008, 19, 085702. [Google Scholar] [CrossRef] [PubMed]
- Mirakhory, M.; Khatibi, M.M.; Sadeghzadeh, S. Vibration analysis of defected and pristine triangular single-layer graphene nanosheets. Curr. Appl. Phys. 2018, 18, 1327–1337. [Google Scholar] [CrossRef]
- Rafiee, M.; Nitzsche, F.; Labrosse, M.R. Processing, manufacturing, and characterization of vibration damping in epoxy composites modified with graphene nanoplatelets. Polym. Compos. 2019, 40, 3914–3922. [Google Scholar] [CrossRef]
- Jamal-Omidi, M.; ShayanMehr, M. An experimental study on the nonlinear free vibration response of epoxy and carbon fiber-reinforced composite containing single-walled carbon nanotubes. J. Vib. Control. 2018, 24, 4529–4540. [Google Scholar] [CrossRef]
- Rafiee, M.; Nitzsche, F.; Labrosse, M.R. Modeling and mechanical analysis of multiscale fiber-reinforced graphene composites: nonlinear bending, thermal post-buckling and large amplitude vibration. Int. J. Non Linear Mech. 2018, 103, 104–112. [Google Scholar] [CrossRef]
- Liu, H.K.; Hwang, S.F.; Yang, S.H.; Lei, C.H. Fatigue analysis of graphene oxide papers fabricated under various processing parameters. Fatigue Fract. Eng. Mater. Struct. 2020, 43, 2287–2297. [Google Scholar] [CrossRef]
- Zhang, L.; Alvarez, N.T.; Zhang, M.; Haase, M.; Malik, R.; Mast, D.; Shanov, V. Preparation and characterization of graphene paper for electromagnetic interference shielding. Carbon. 2015, 82, 353–359. [Google Scholar] [CrossRef]
- Kang, D.J.; Chen, F.; Park, J.H. New measurement method of Poisson’s ratio of thin films by applying digital image correlation technique. Int. J. Precis. Eng. Manuf. 2014, 15, 883–888. [Google Scholar] [CrossRef]
Figure 1.
The fabrication procedure for a GOP headphone (a) preparation of GOP, (b) adhesion of GOP on a plastic ring, (c) alignment and adhesion of GOP/voice coil, (d) assemblage of the GOP diaphragm with a headphone unit.
Figure 1.
The fabrication procedure for a GOP headphone (a) preparation of GOP, (b) adhesion of GOP on a plastic ring, (c) alignment and adhesion of GOP/voice coil, (d) assemblage of the GOP diaphragm with a headphone unit.
Figure 2.
Set-up of the Klippel LPM laser measurement system for compliance of the GOP diaphragm.
Figure 2.
Set-up of the Klippel LPM laser measurement system for compliance of the GOP diaphragm.
Figure 3.
SPL curves for diaphragm headphones fabricated at highest sonication time of T3 and WF3 by GO papers (GOP), GOP/epoxy nanocomposite without a pattern (GOPC), and with lined (GOPC-L) and curved patterns (GOPC-C).
Figure 3.
SPL curves for diaphragm headphones fabricated at highest sonication time of T3 and WF3 by GO papers (GOP), GOP/epoxy nanocomposite without a pattern (GOPC), and with lined (GOPC-L) and curved patterns (GOPC-C).
Figure 4.
Micrographs of diaphragms (a) GOP-T3-WF3, (b) GOPC-T3-WF3, (c) GOPC-C-T3-WF3 and (d) GOPC-L-T3-W3.
Figure 4.
Micrographs of diaphragms (a) GOP-T3-WF3, (b) GOPC-T3-WF3, (c) GOPC-C-T3-WF3 and (d) GOPC-L-T3-W3.
Figure 5.
Photographs for fabricated nanocomposite diaphragm drivers and headphones (a) driver GOPC-L, (b) driver GOPC-C, (c) line patterned molds, (d) curve patterned molds, and (e) headphone GOPC-T1-WF3, (f) headphone GOPC-T2-WF3, (g) headphone GOPC-T3-WF3.
Figure 5.
Photographs for fabricated nanocomposite diaphragm drivers and headphones (a) driver GOPC-L, (b) driver GOPC-C, (c) line patterned molds, (d) curve patterned molds, and (e) headphone GOPC-T1-WF3, (f) headphone GOPC-T2-WF3, (g) headphone GOPC-T3-WF3.
Figure 6.
SPL curves for GO paper diaphragm headphones fabricated by various sonication times on suspension.
Figure 6.
SPL curves for GO paper diaphragm headphones fabricated by various sonication times on suspension.
Figure 7.
SPL curves for GOP/epoxy diaphragm headphones fabricated by various sonication times on suspension.
Figure 7.
SPL curves for GOP/epoxy diaphragm headphones fabricated by various sonication times on suspension.
Figure 8.
SPL curves for diaphragm headphones fabricated at lowest sonication time of T1 and WF3 by GO papers (GOP), GOP/epoxy nanocomposite without a pattern (GOPC), and with lined (GOPC-L) and curved patterns (GOPC-C).
Figure 8.
SPL curves for diaphragm headphones fabricated at lowest sonication time of T1 and WF3 by GO papers (GOP), GOP/epoxy nanocomposite without a pattern (GOPC), and with lined (GOPC-L) and curved patterns (GOPC-C).
Figure 9.
SPL curves for GO paper diaphragm headphones fabricated by various GO weight fractions in suspension.
Figure 9.
SPL curves for GO paper diaphragm headphones fabricated by various GO weight fractions in suspension.
Figure 10.
SPL curves for GOP/epoxy diaphragm headphones fabricated by various GO weight fractions in suspension.
Figure 10.
SPL curves for GOP/epoxy diaphragm headphones fabricated by various GO weight fractions in suspension.
Table 1.
Terminology for various graphene diaphragms.
Table 1.
Terminology for various graphene diaphragms.
| Diaphragm type |
Sonication time on suspension (min) |
GO weight fraction in suspension (wt%) |
Pattern type on nanocomposite |
GOP
(Graphene oxide paper)
GOPC
(GOP/epoxy nanocomposite) |
T1 (1) |
WF1 (0.5) |
Lined (GOPC-L) |
| T2 (5) |
WF2 (1.0) |
Curved (GOPC-C) |
| T3 (10) |
WF3 (1.5) |
|
Table 2.
Compliance of various diaphragm headphones.
Table 2.
Compliance of various diaphragm headphones.
| T3-WF3 |
Compliance Cms of various diaphragm headphones |
| Cms (m/N) |
GOP |
GOPC |
GOPC-L |
GOPC-C |
| 7.25 |
0.30 |
1.14 |
0.88 |
Table 3.
Maximum SPL values of various diaphragm headphones.
Table 3.
Maximum SPL values of various diaphragm headphones.
| Maximum SPL (dB) |
|---|
| GOP |
GOPC |
GOPC-L |
GOPC-C |
| 99 |
104 |
101 |
103 |
|
Disclaimer/Publisher’s Note: The statements, opinions and data contained in all publications are solely those of the individual author(s) and contributor(s) and not of MDPI and/or the editor(s). MDPI and/or the editor(s) disclaim responsibility for any injury to people or property resulting from any ideas, methods, instructions or products referred to in the content. |
© 2023 by the authors. Licensee MDPI, Basel, Switzerland. This article is an open access article distributed under the terms and conditions of the Creative Commons Attribution (CC BY) license (http://creativecommons.org/licenses/by/4.0/).
