Submitted:
13 September 2023
Posted:
18 September 2023
You are already at the latest version
Abstract
Keywords:
1. Introduction
Review of studies on the speed-reducing effect of horizontal deflections located on the refuge island approach sections
Review of previous before-and-after speed studies with the use of heuristic method
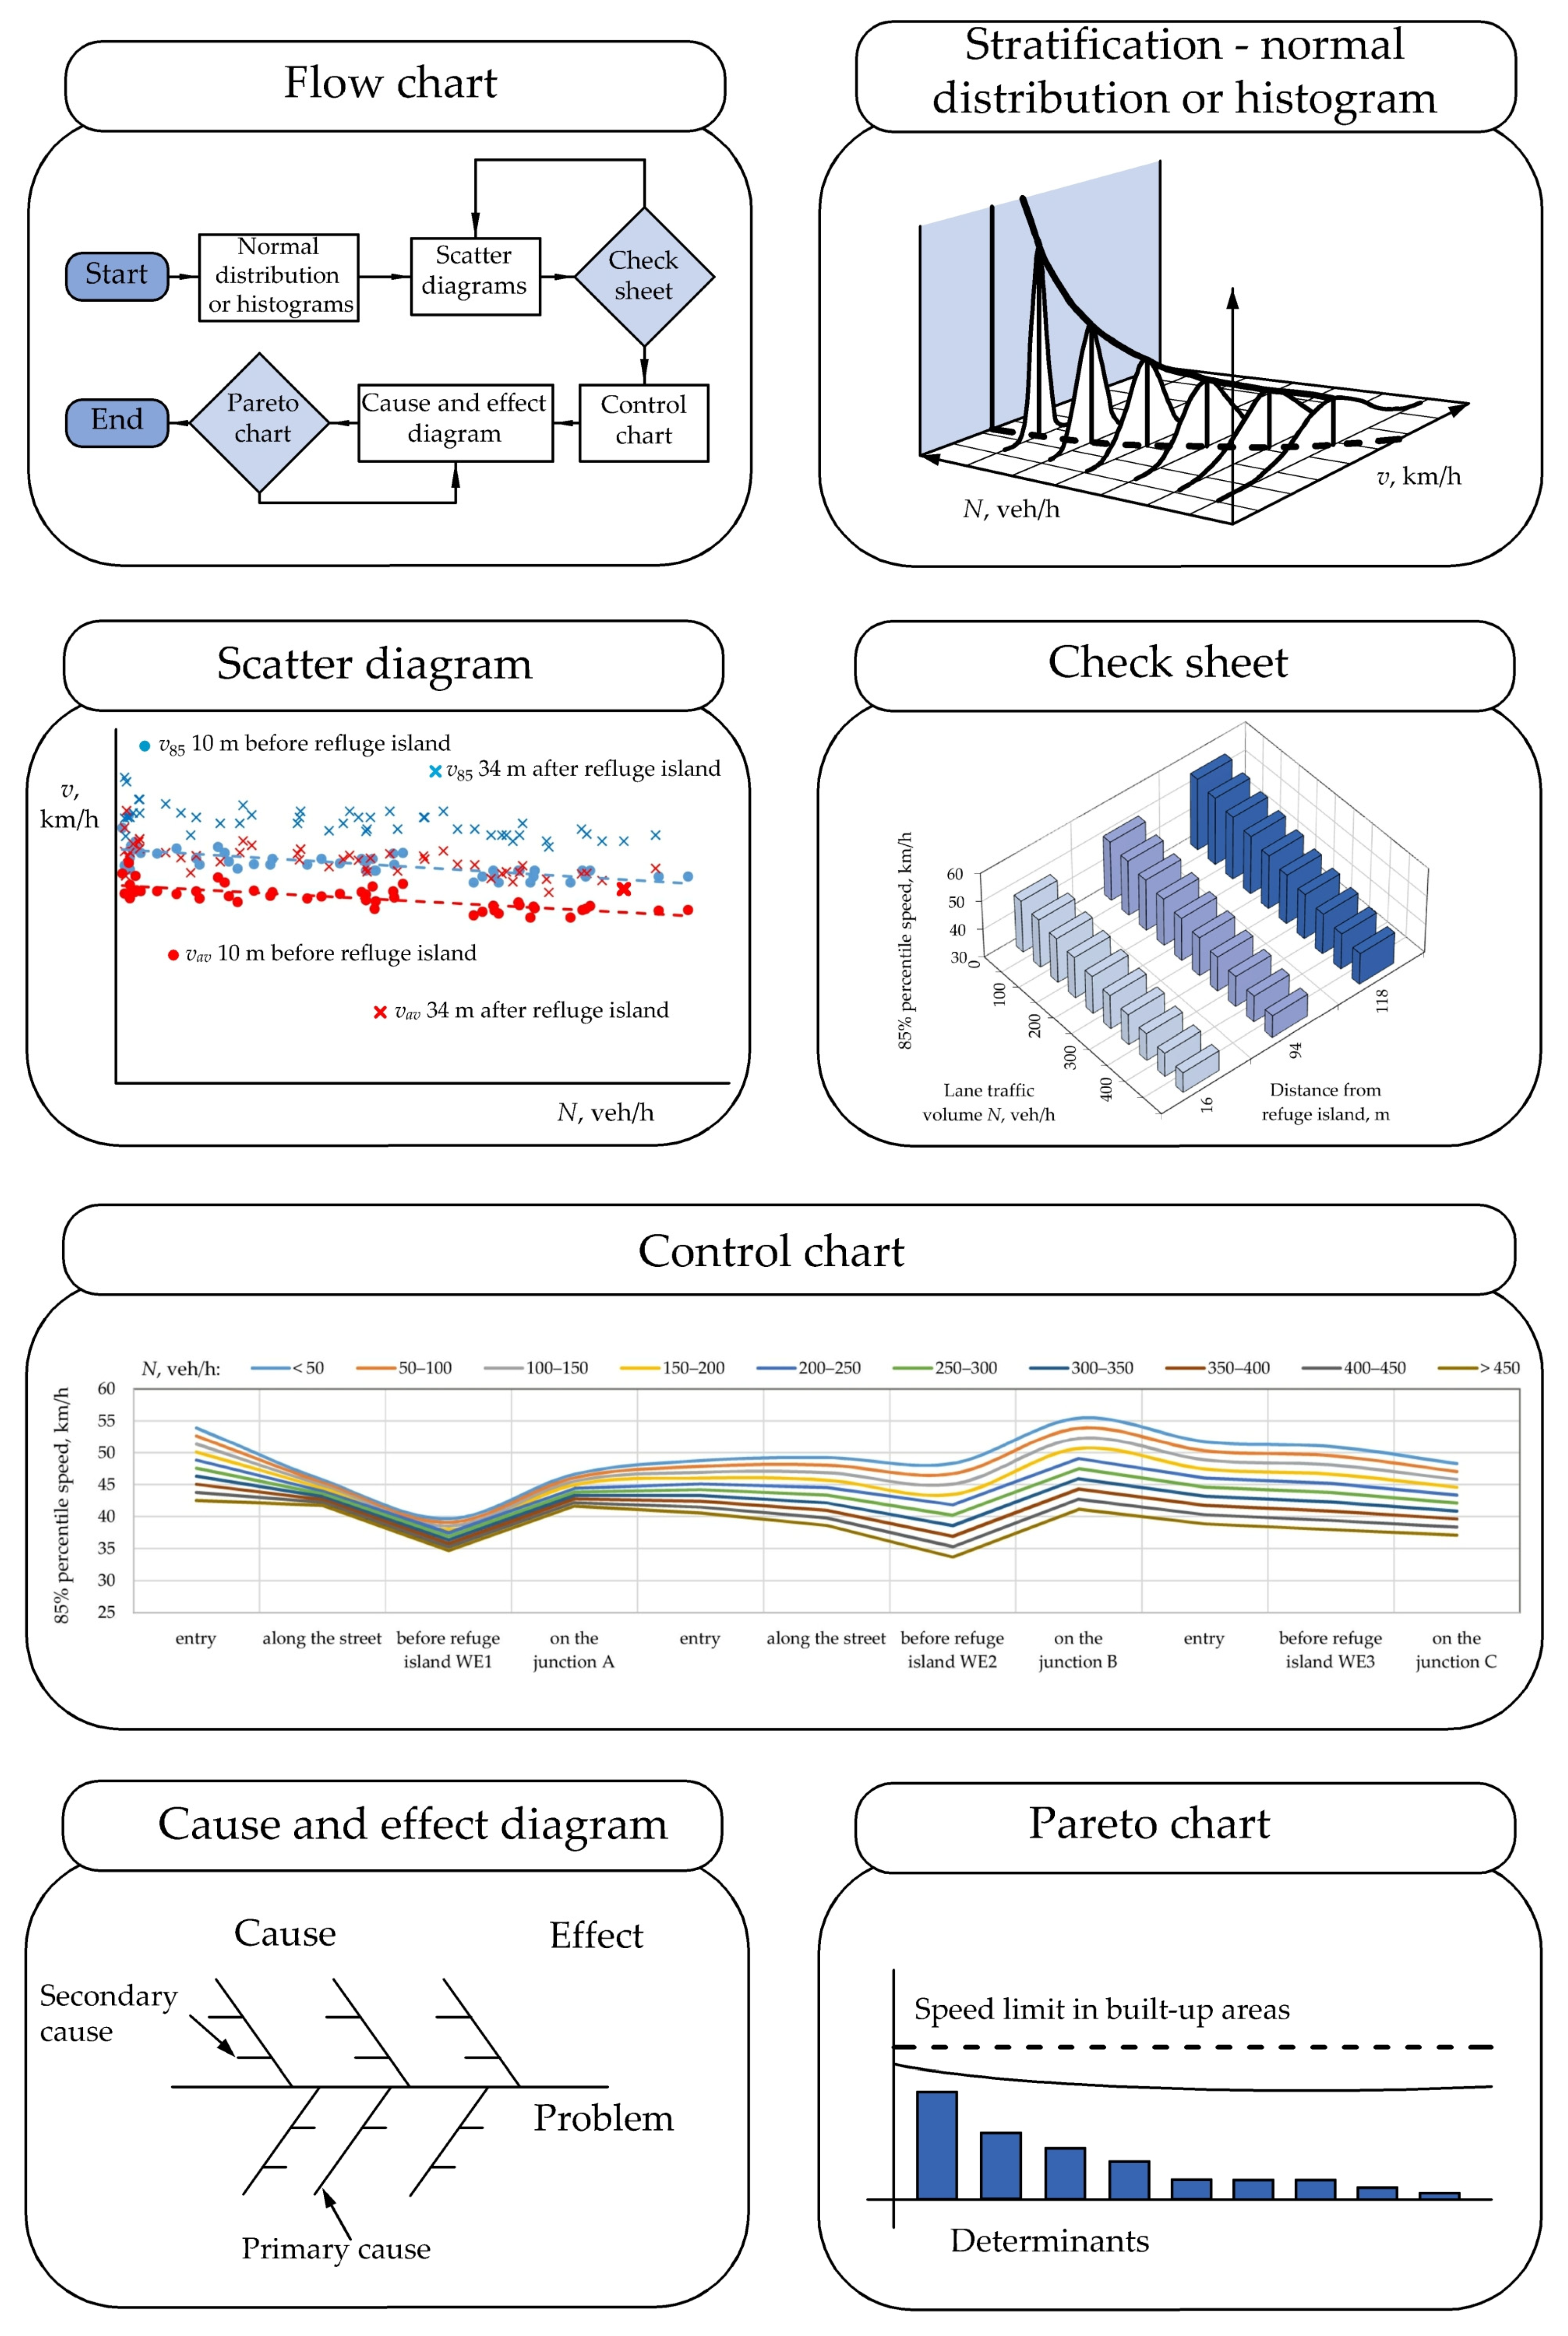
- flow chart presenting the steps of the analysis,
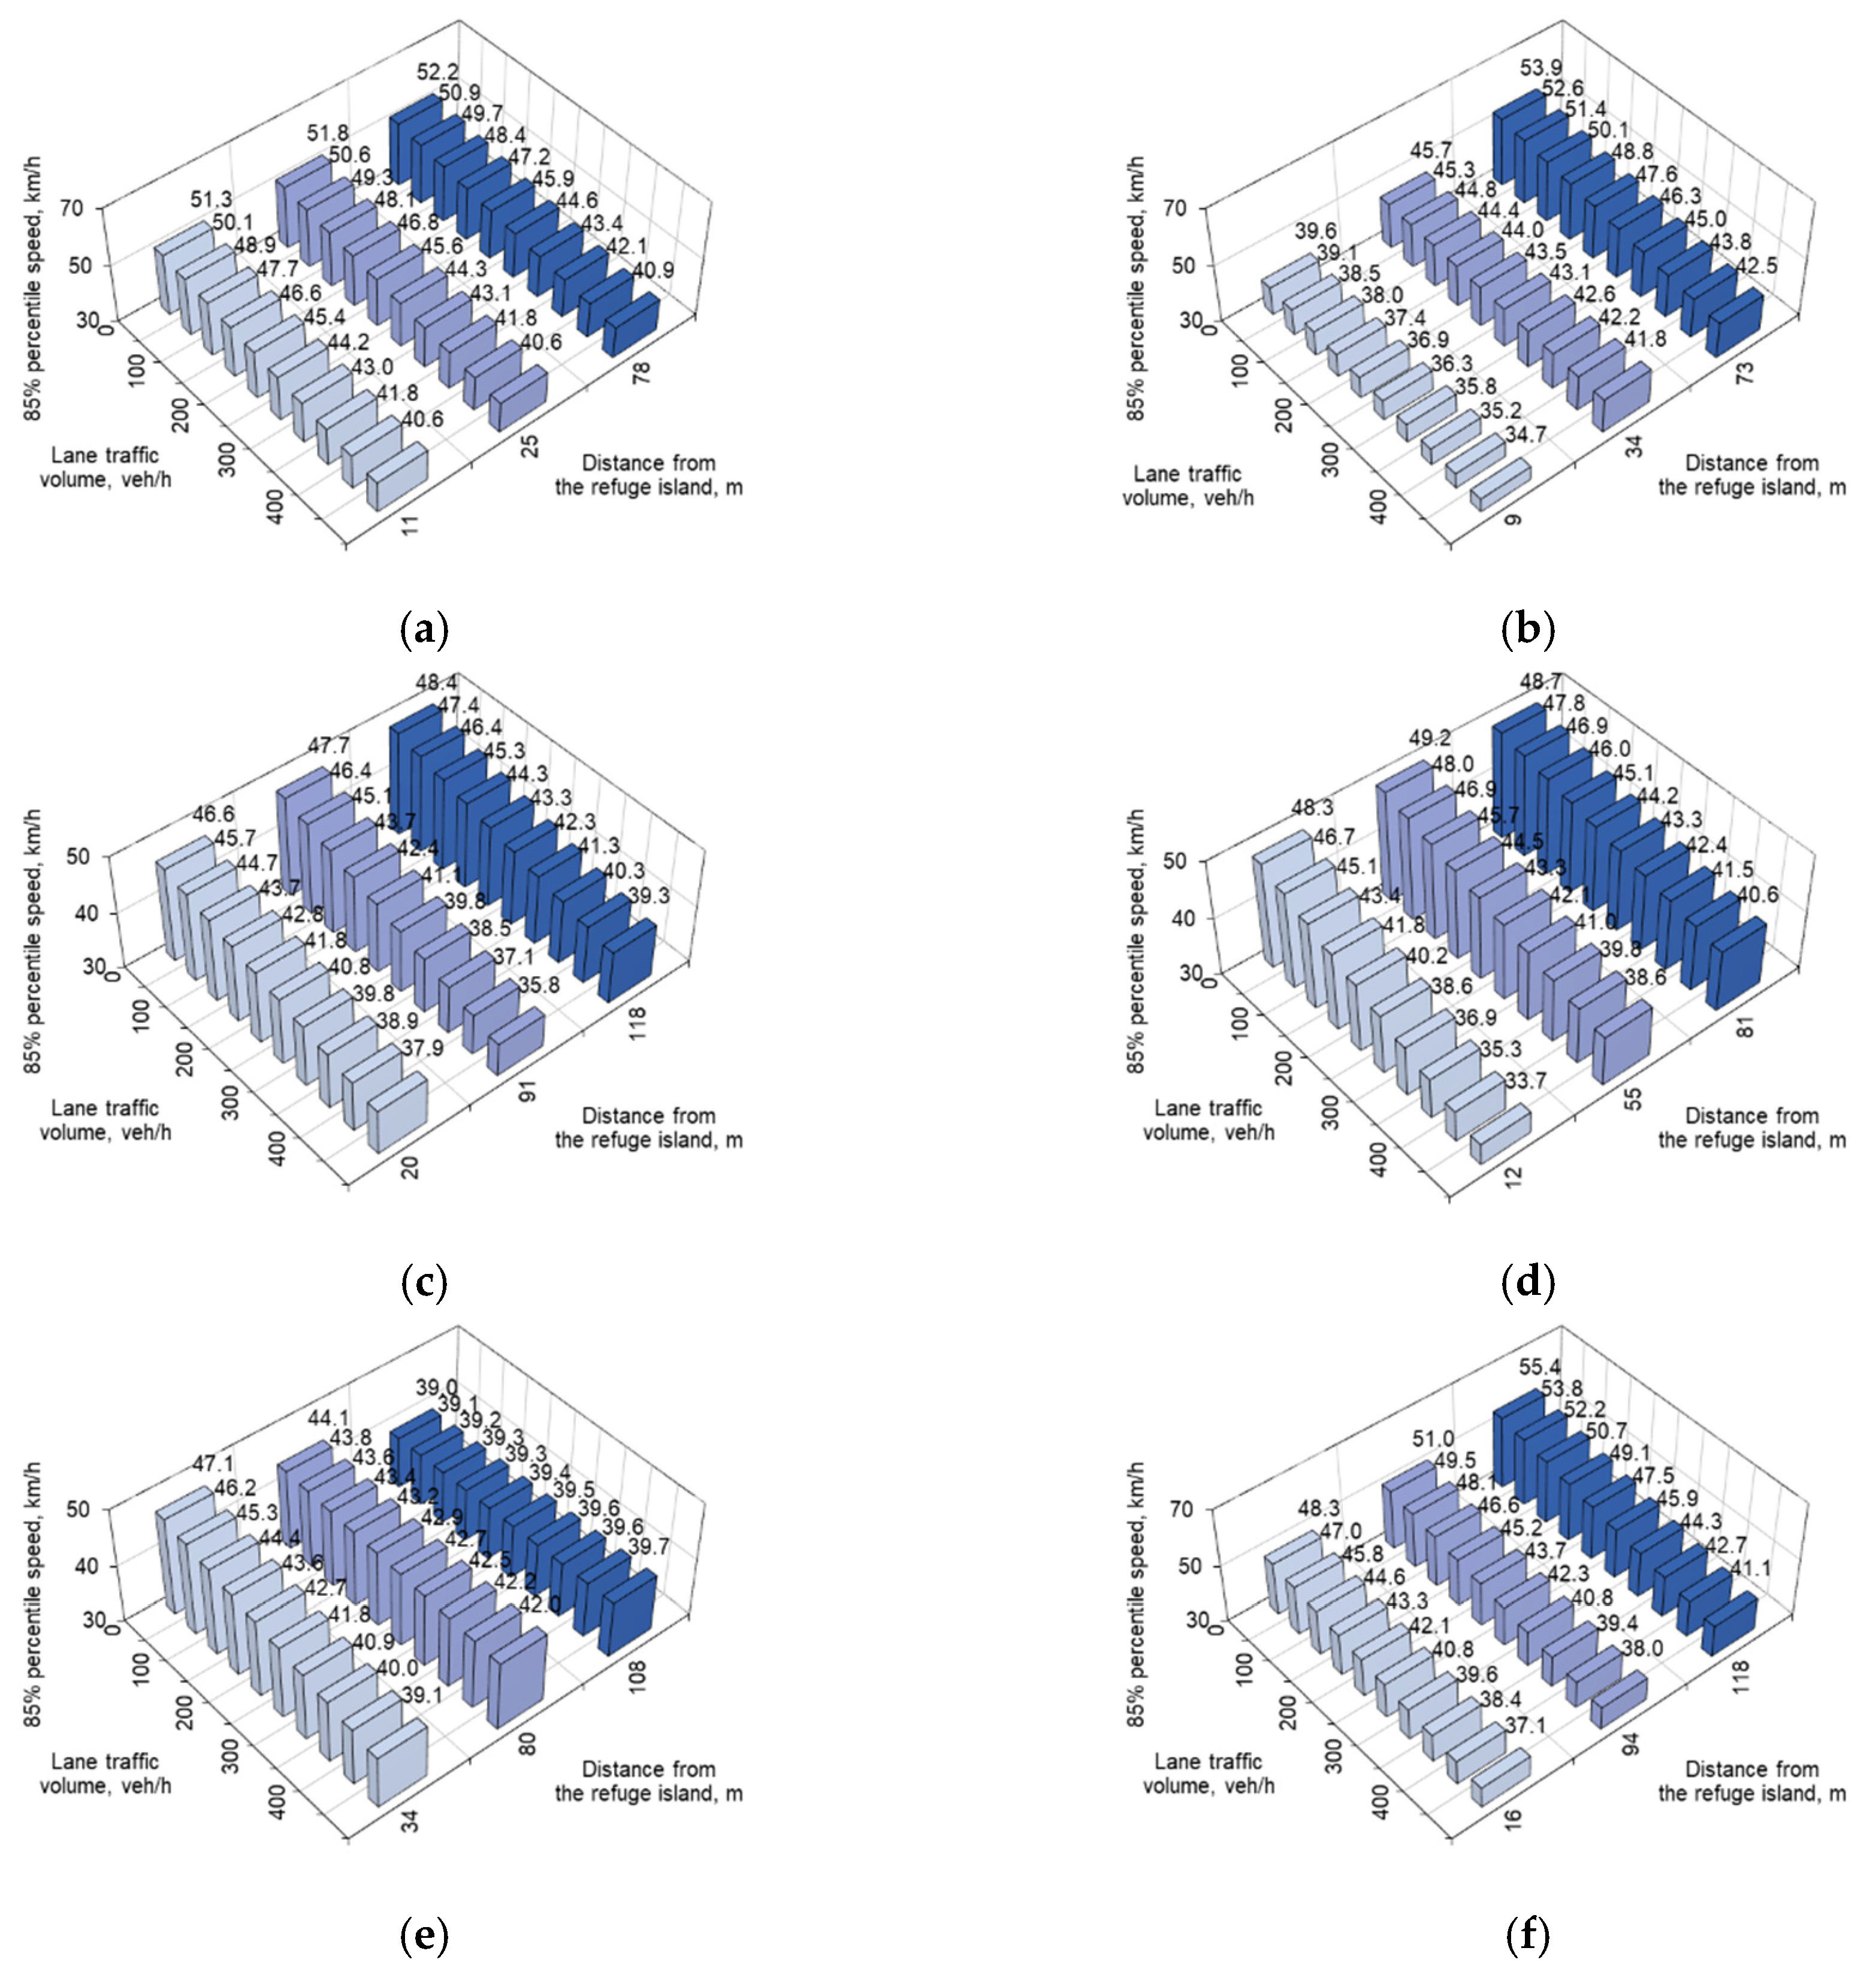
- check sheet, specifically statistical tests to check speed consistency among the consecutive survey sites deployed on the street under analysis,
- normal distribution histograms,
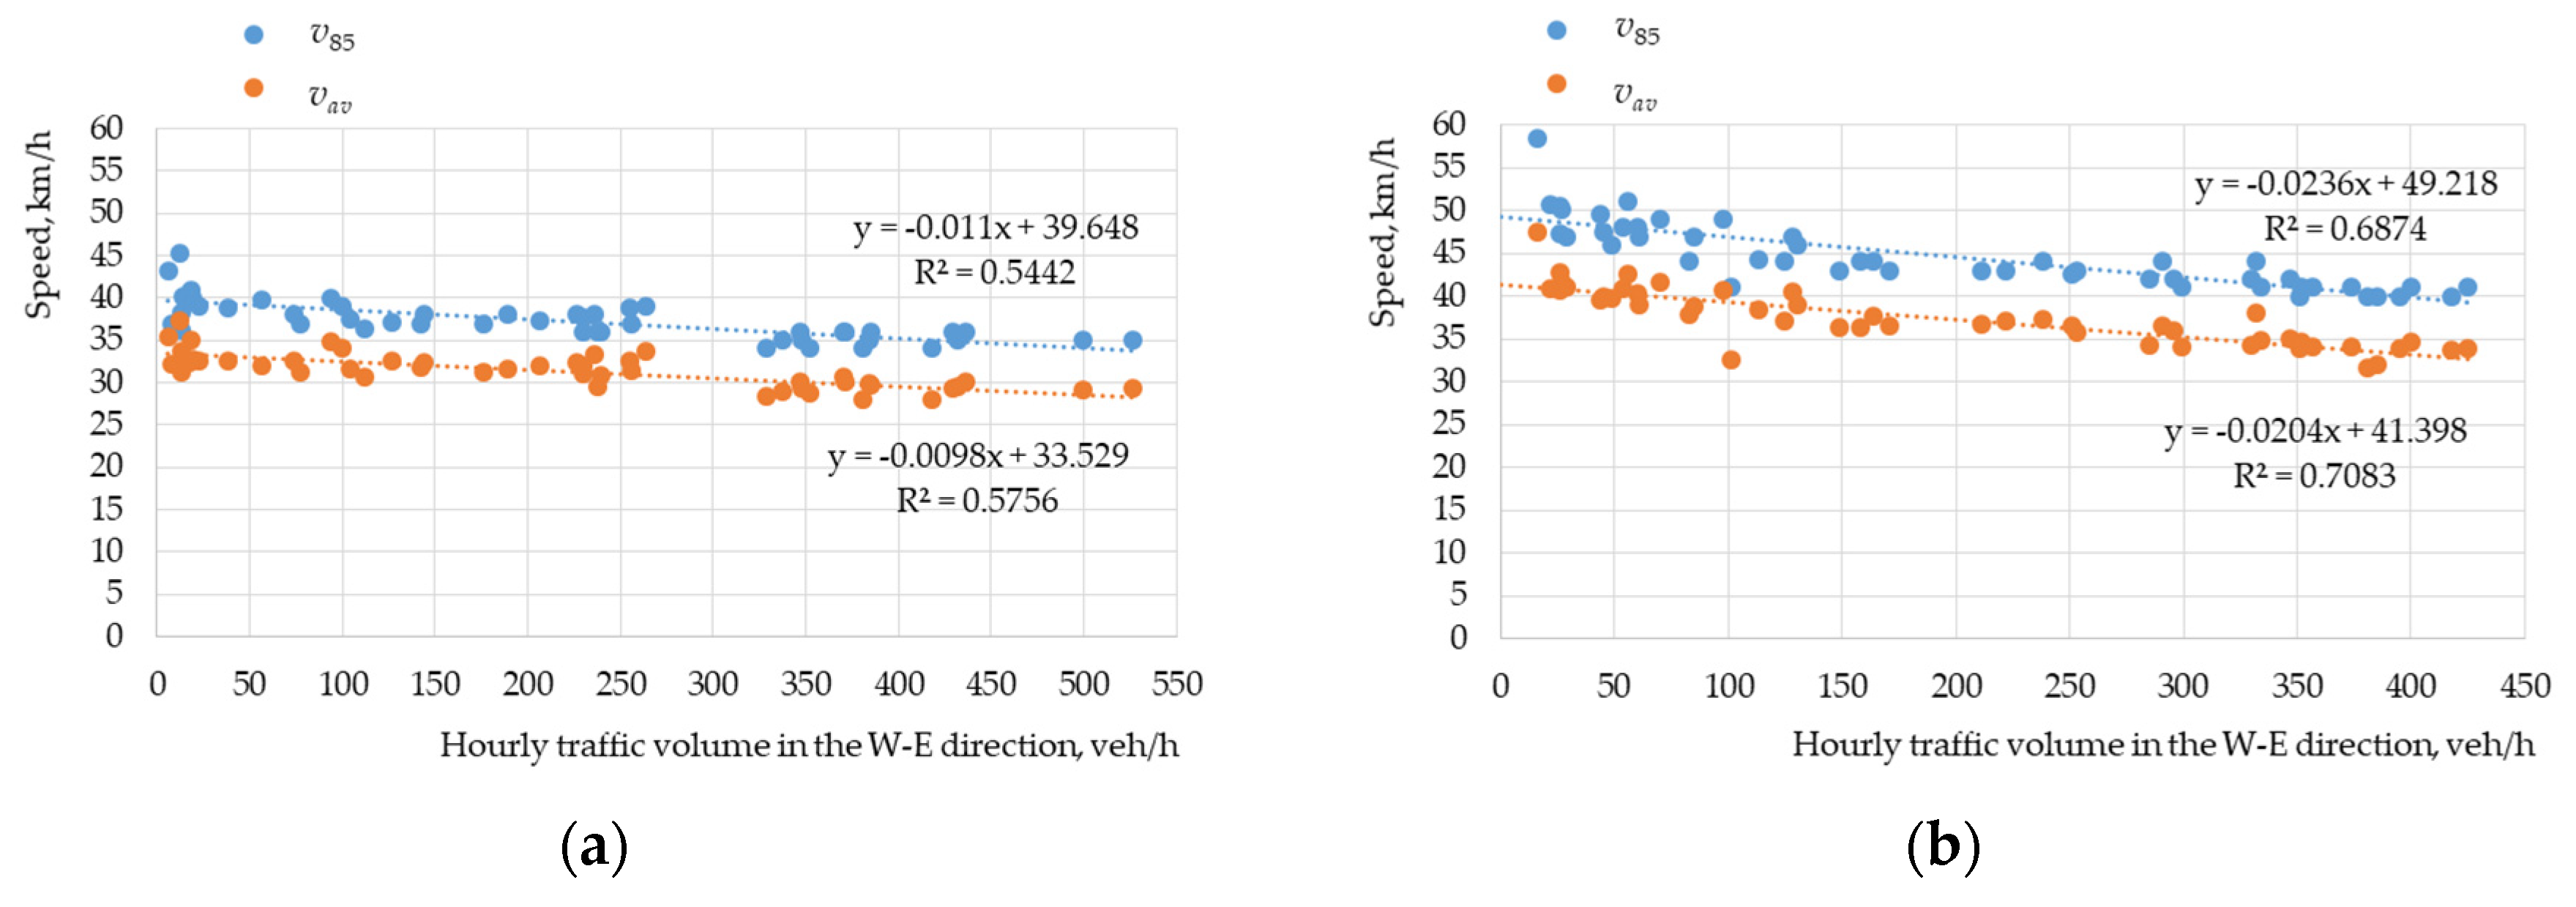
- scatter diagram showing relationships,
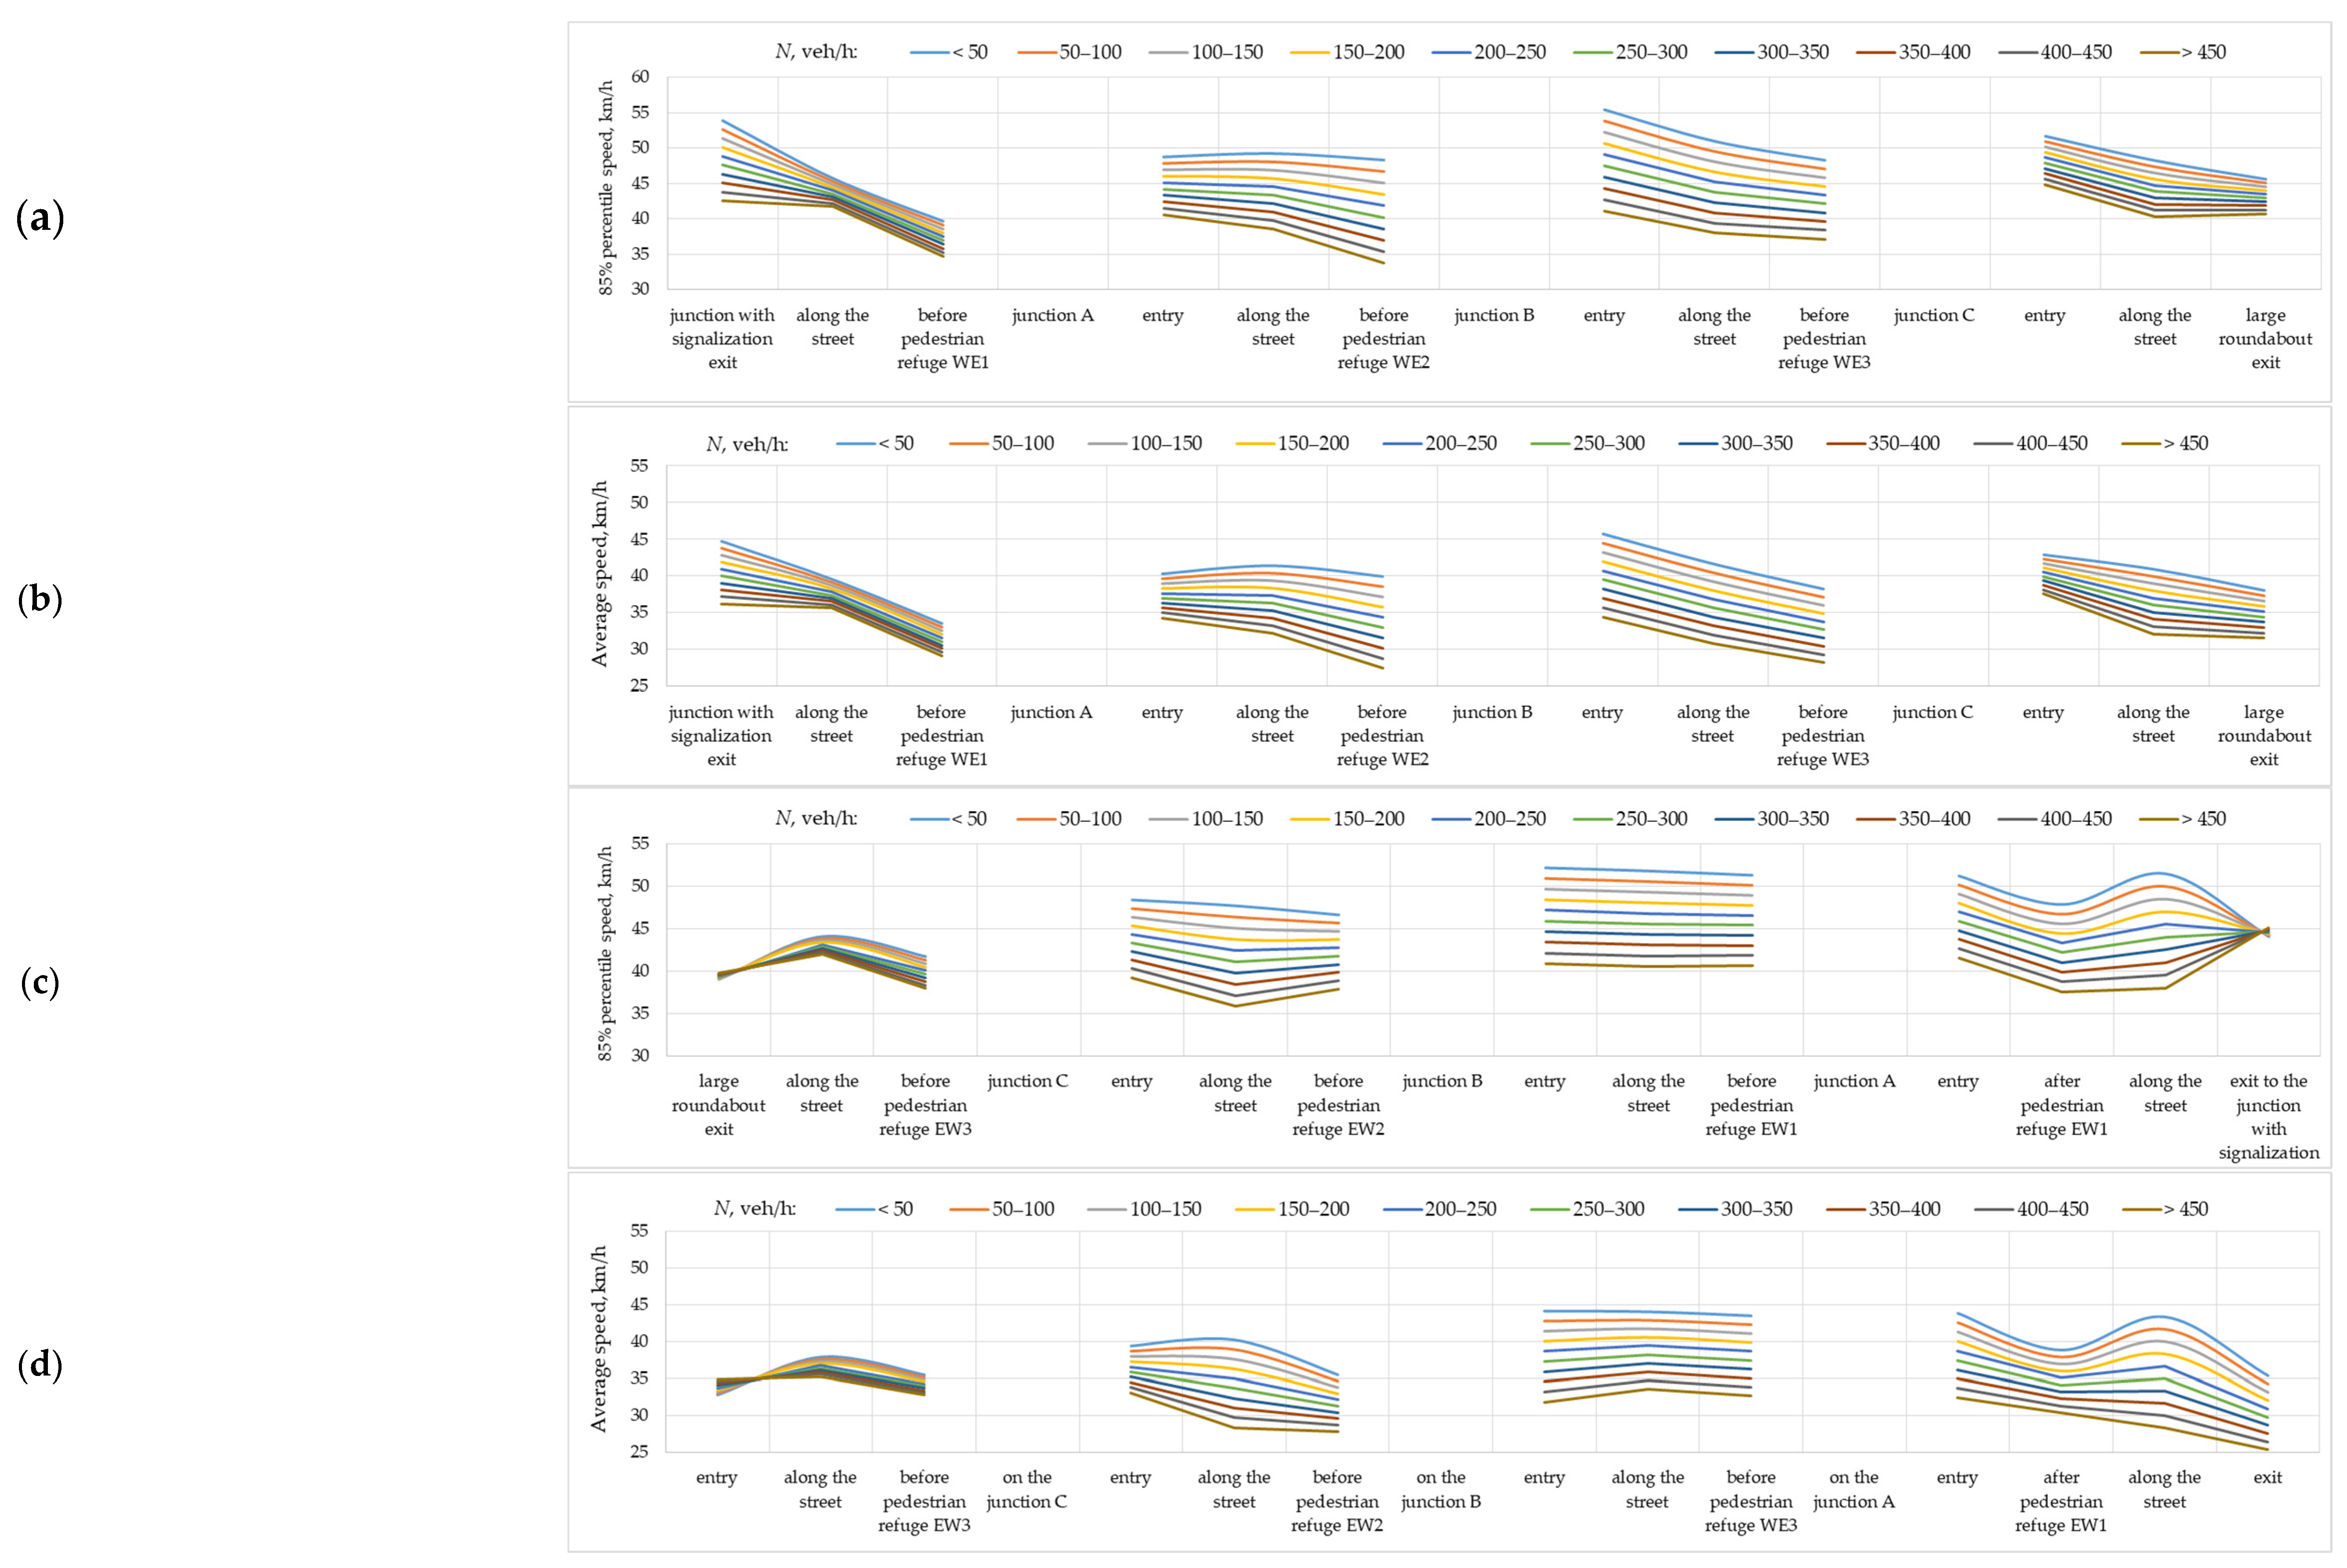
- control chart showing speed changes along the analysed street,
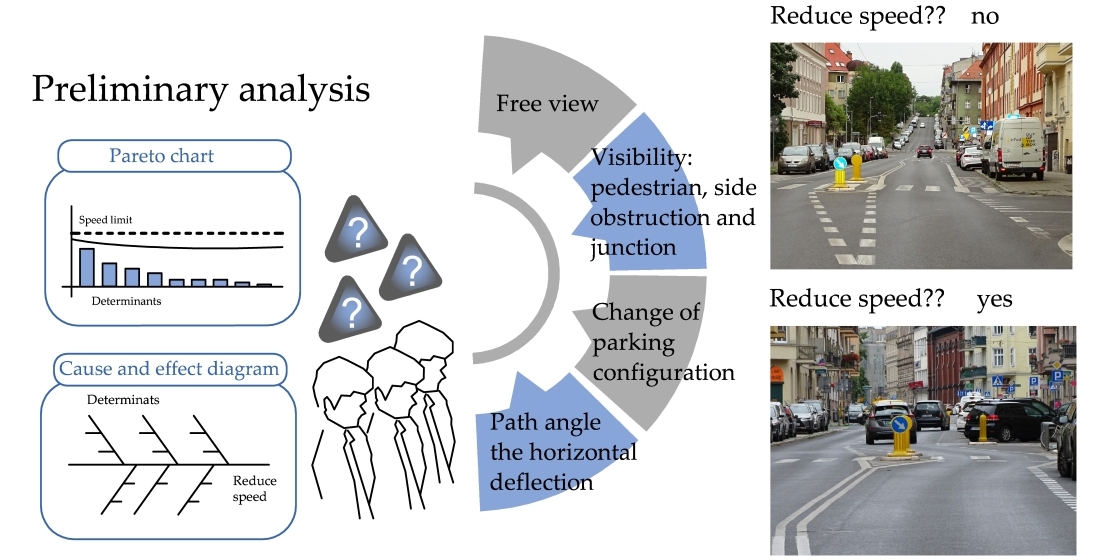
- cause and effect diagram (diagram fishbone or diagram Ishikawa’s) for defining the primary and secondary factors,
- Pareto chart to define the finally identified speed reduction determinants.
- -
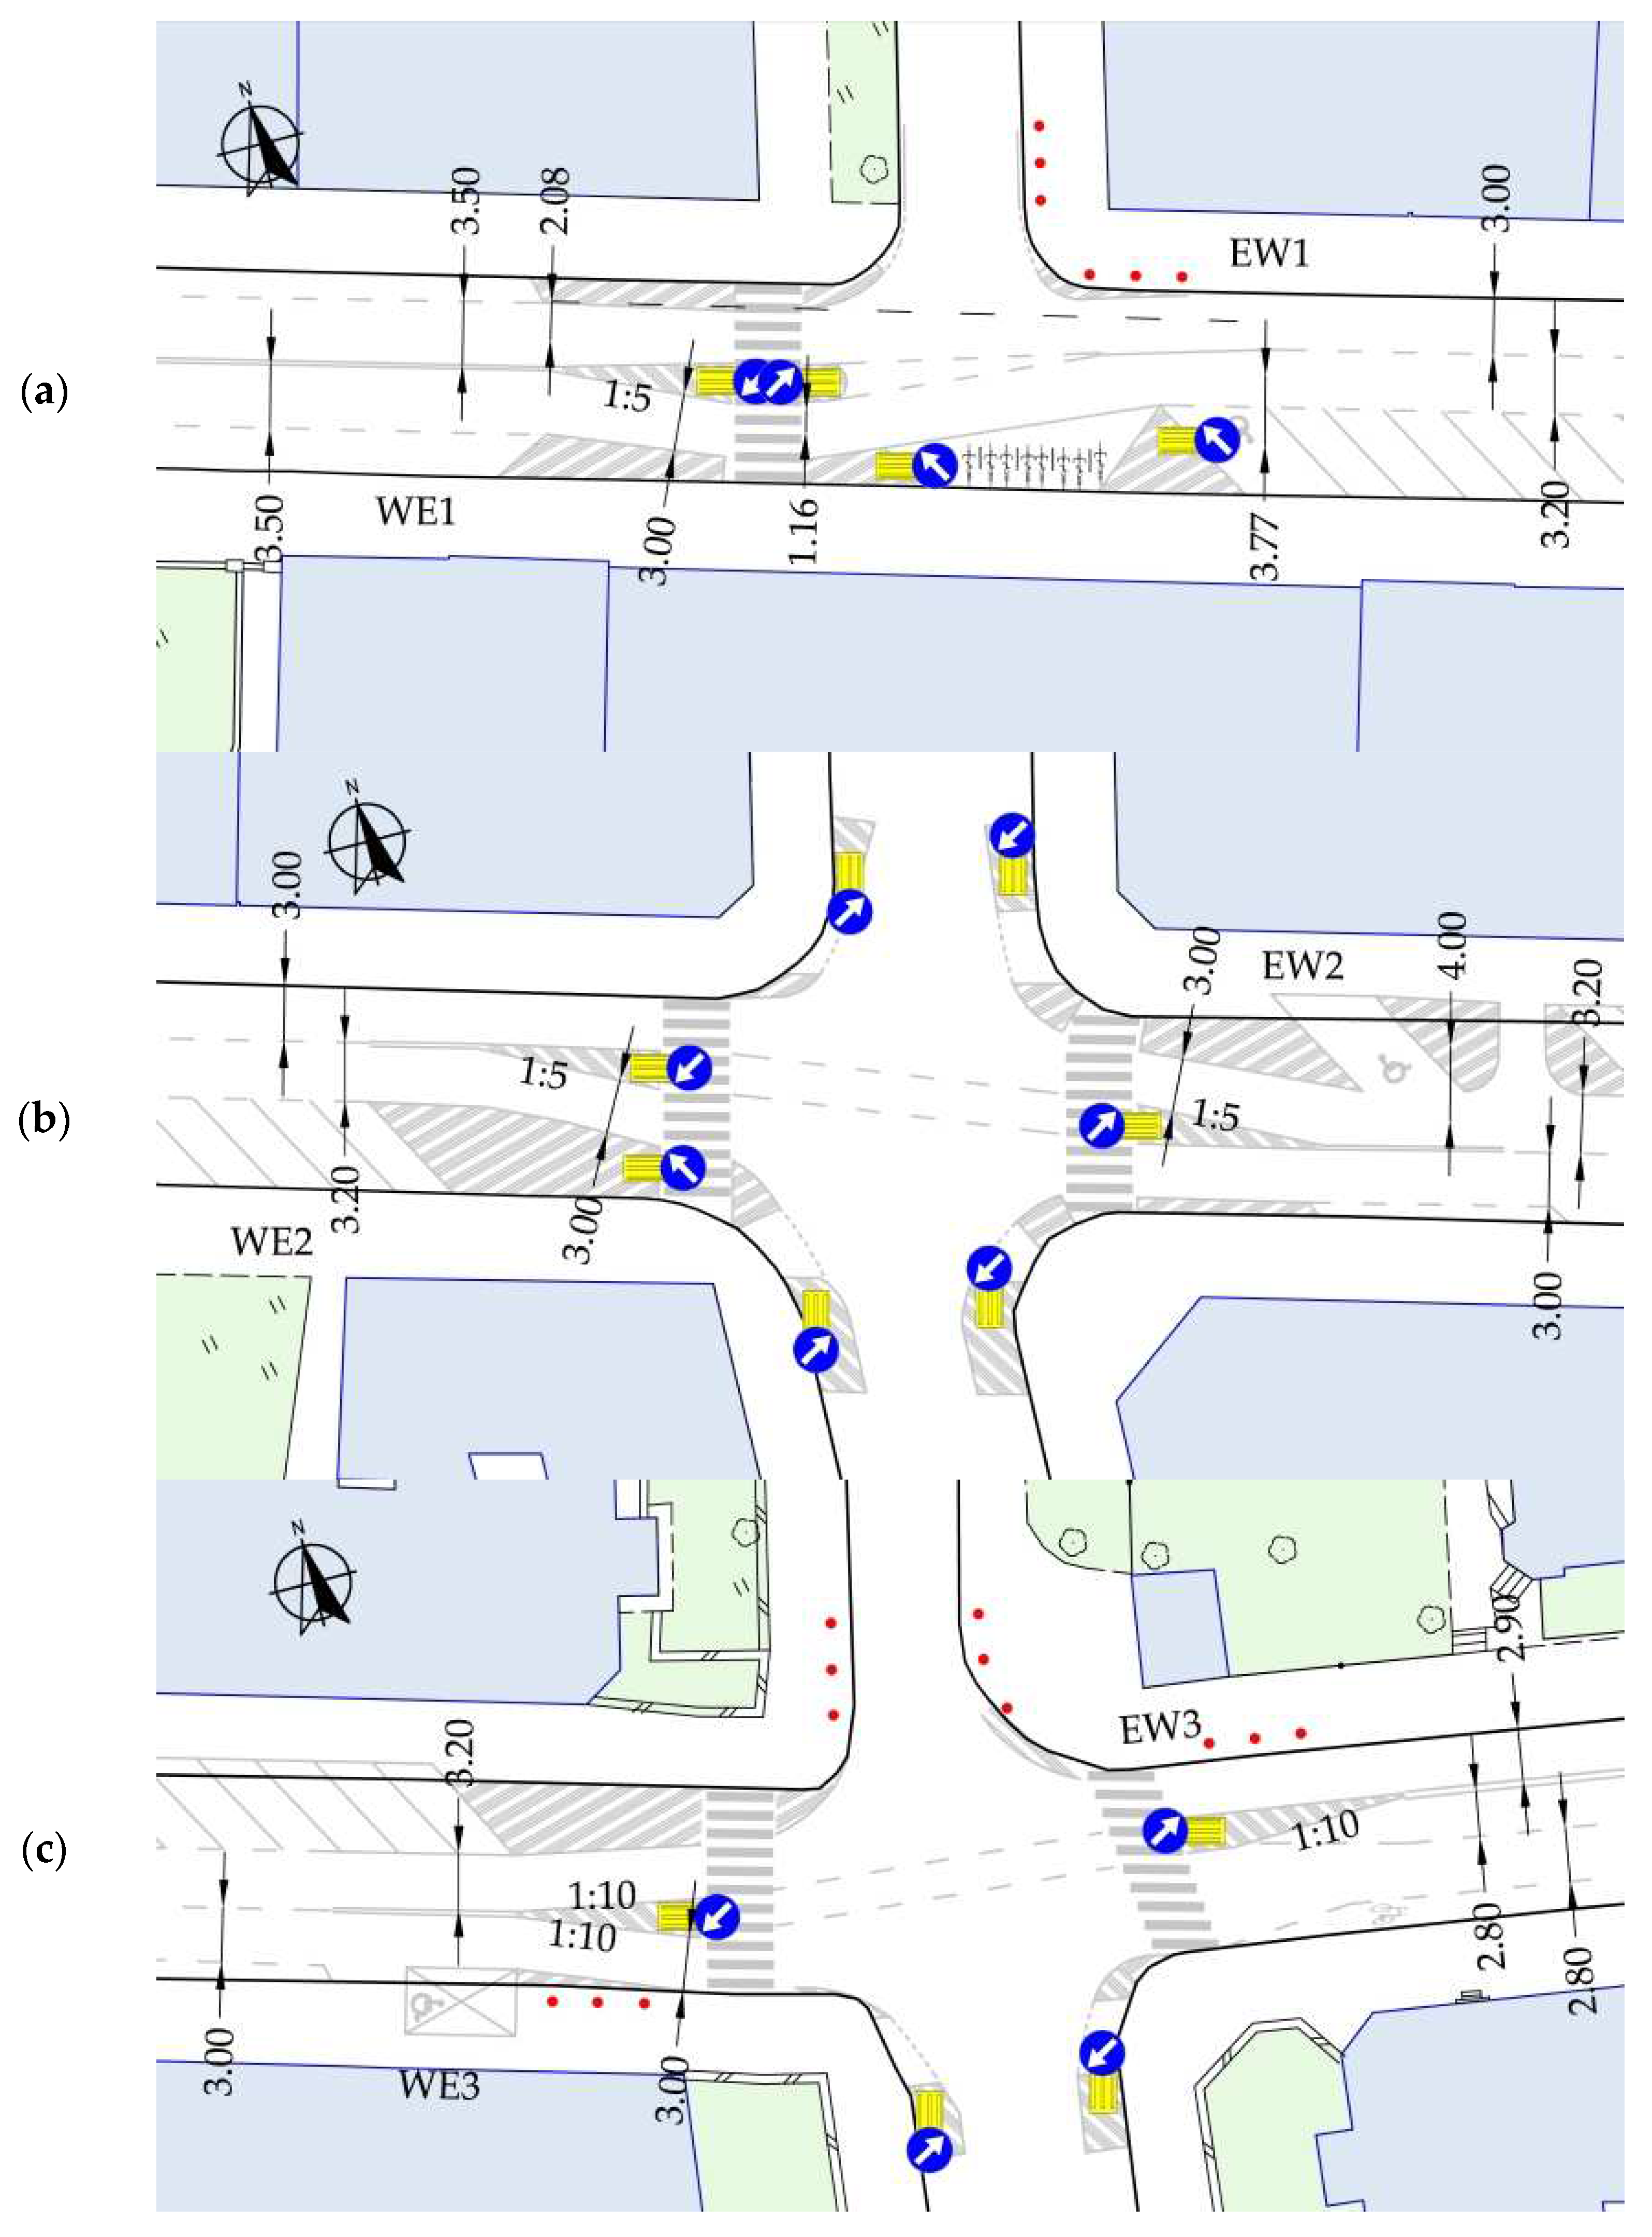
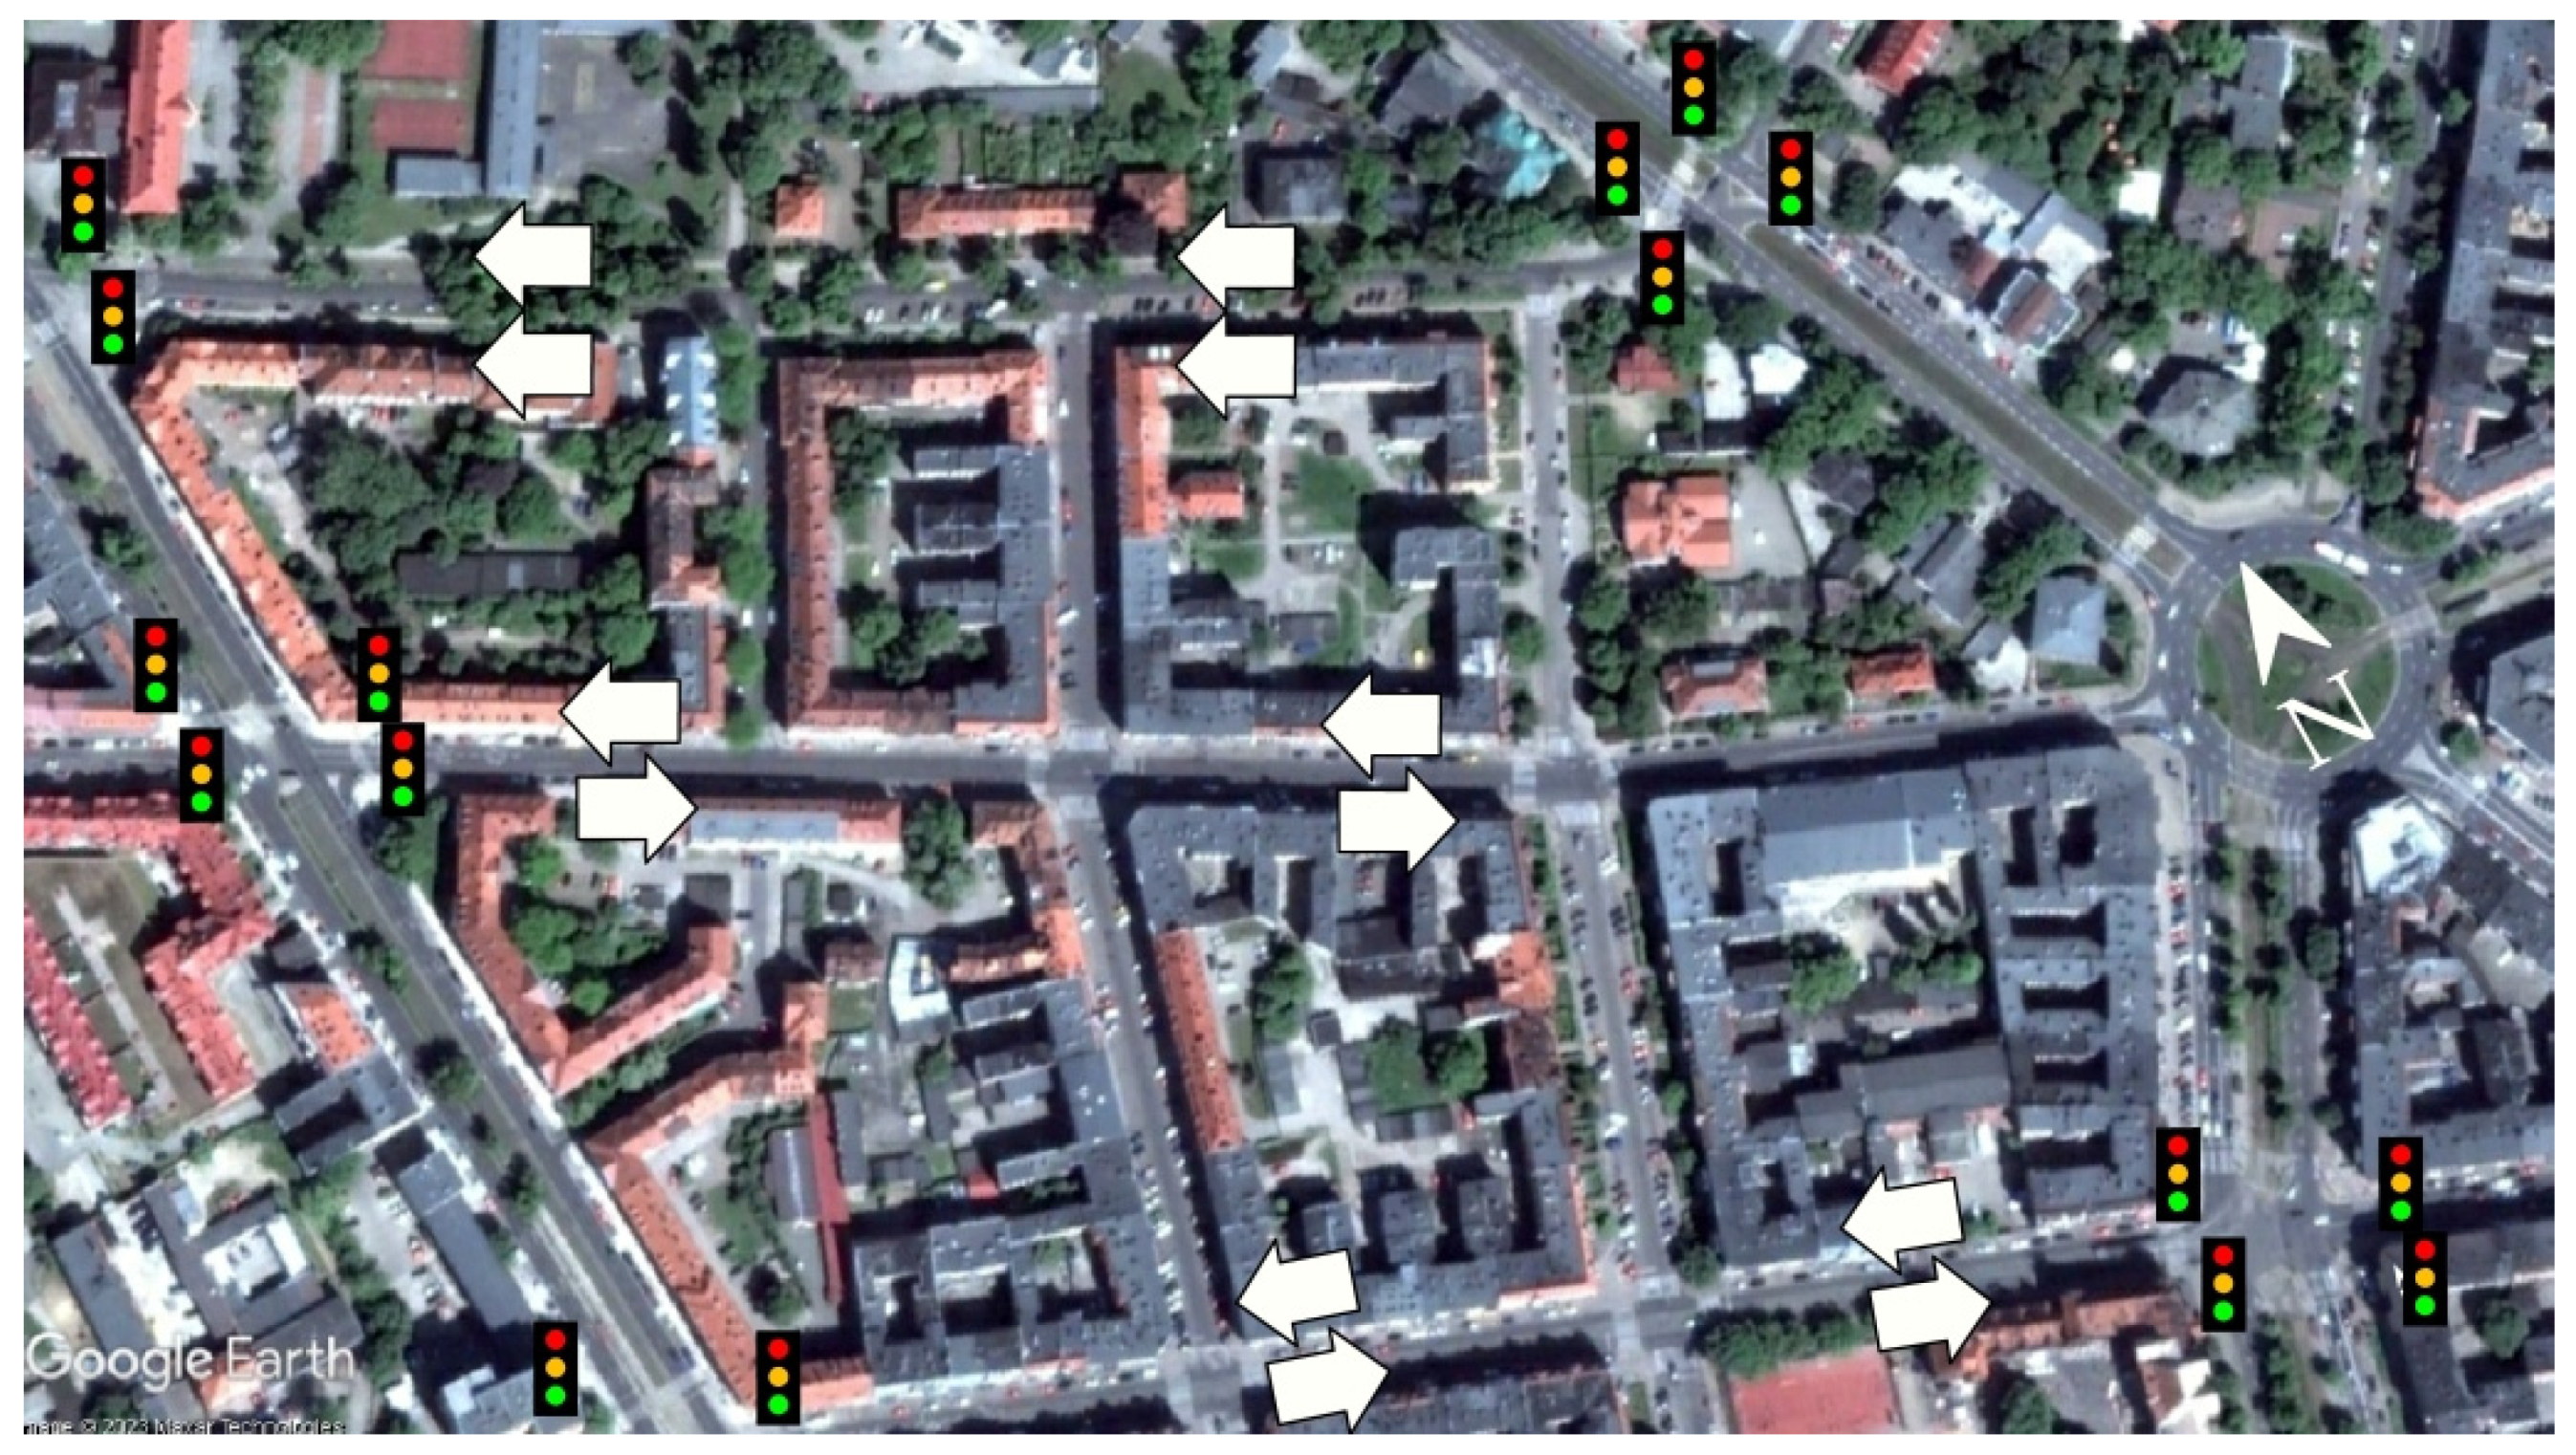
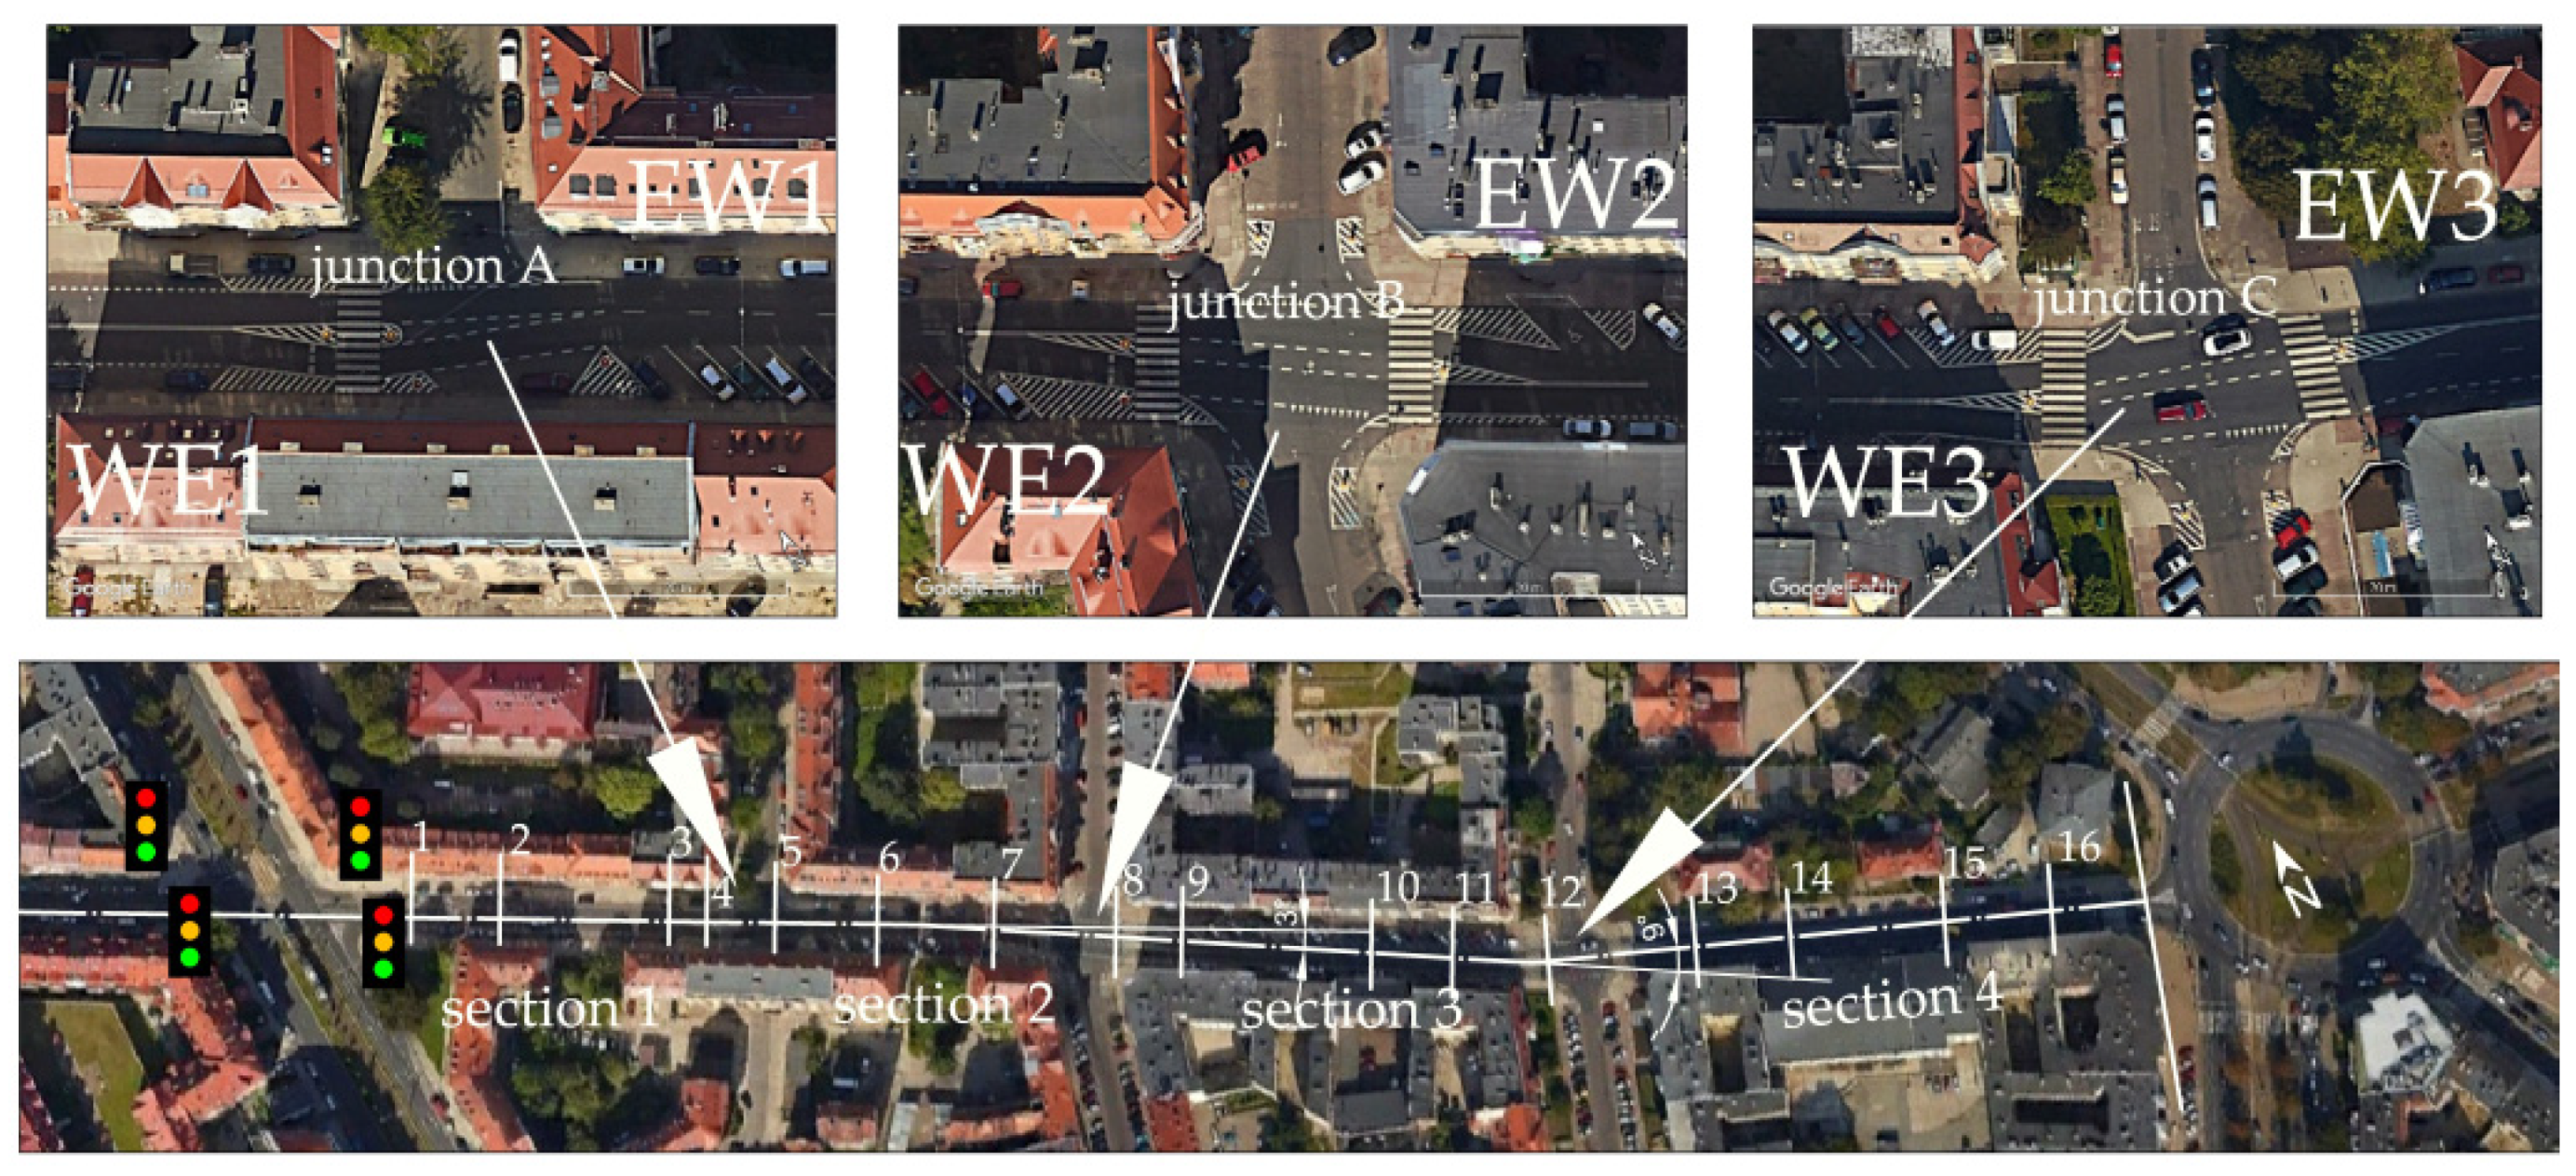
- information on the study site (a two-way city street with 50 km/h speed limit) and details of the respective study sections with different parking and TCM arrangements,
- -
- traffic safety analyses before and after changes to the traffic organization plan,
- -
- description of the heuristic method used in the study.
2. Materials and Methods
2.1. Study area
2.2. Traffic safety and volume count data for the analysed street
2.2. Measurement and analysis method
- -
- 85th percentile speeds varied by up to 0.1-0.2 km/h,
- -
- average speeds ranged 0.5-1.0 km/h.
2.3. Research methods
3. Results
4. Discussion
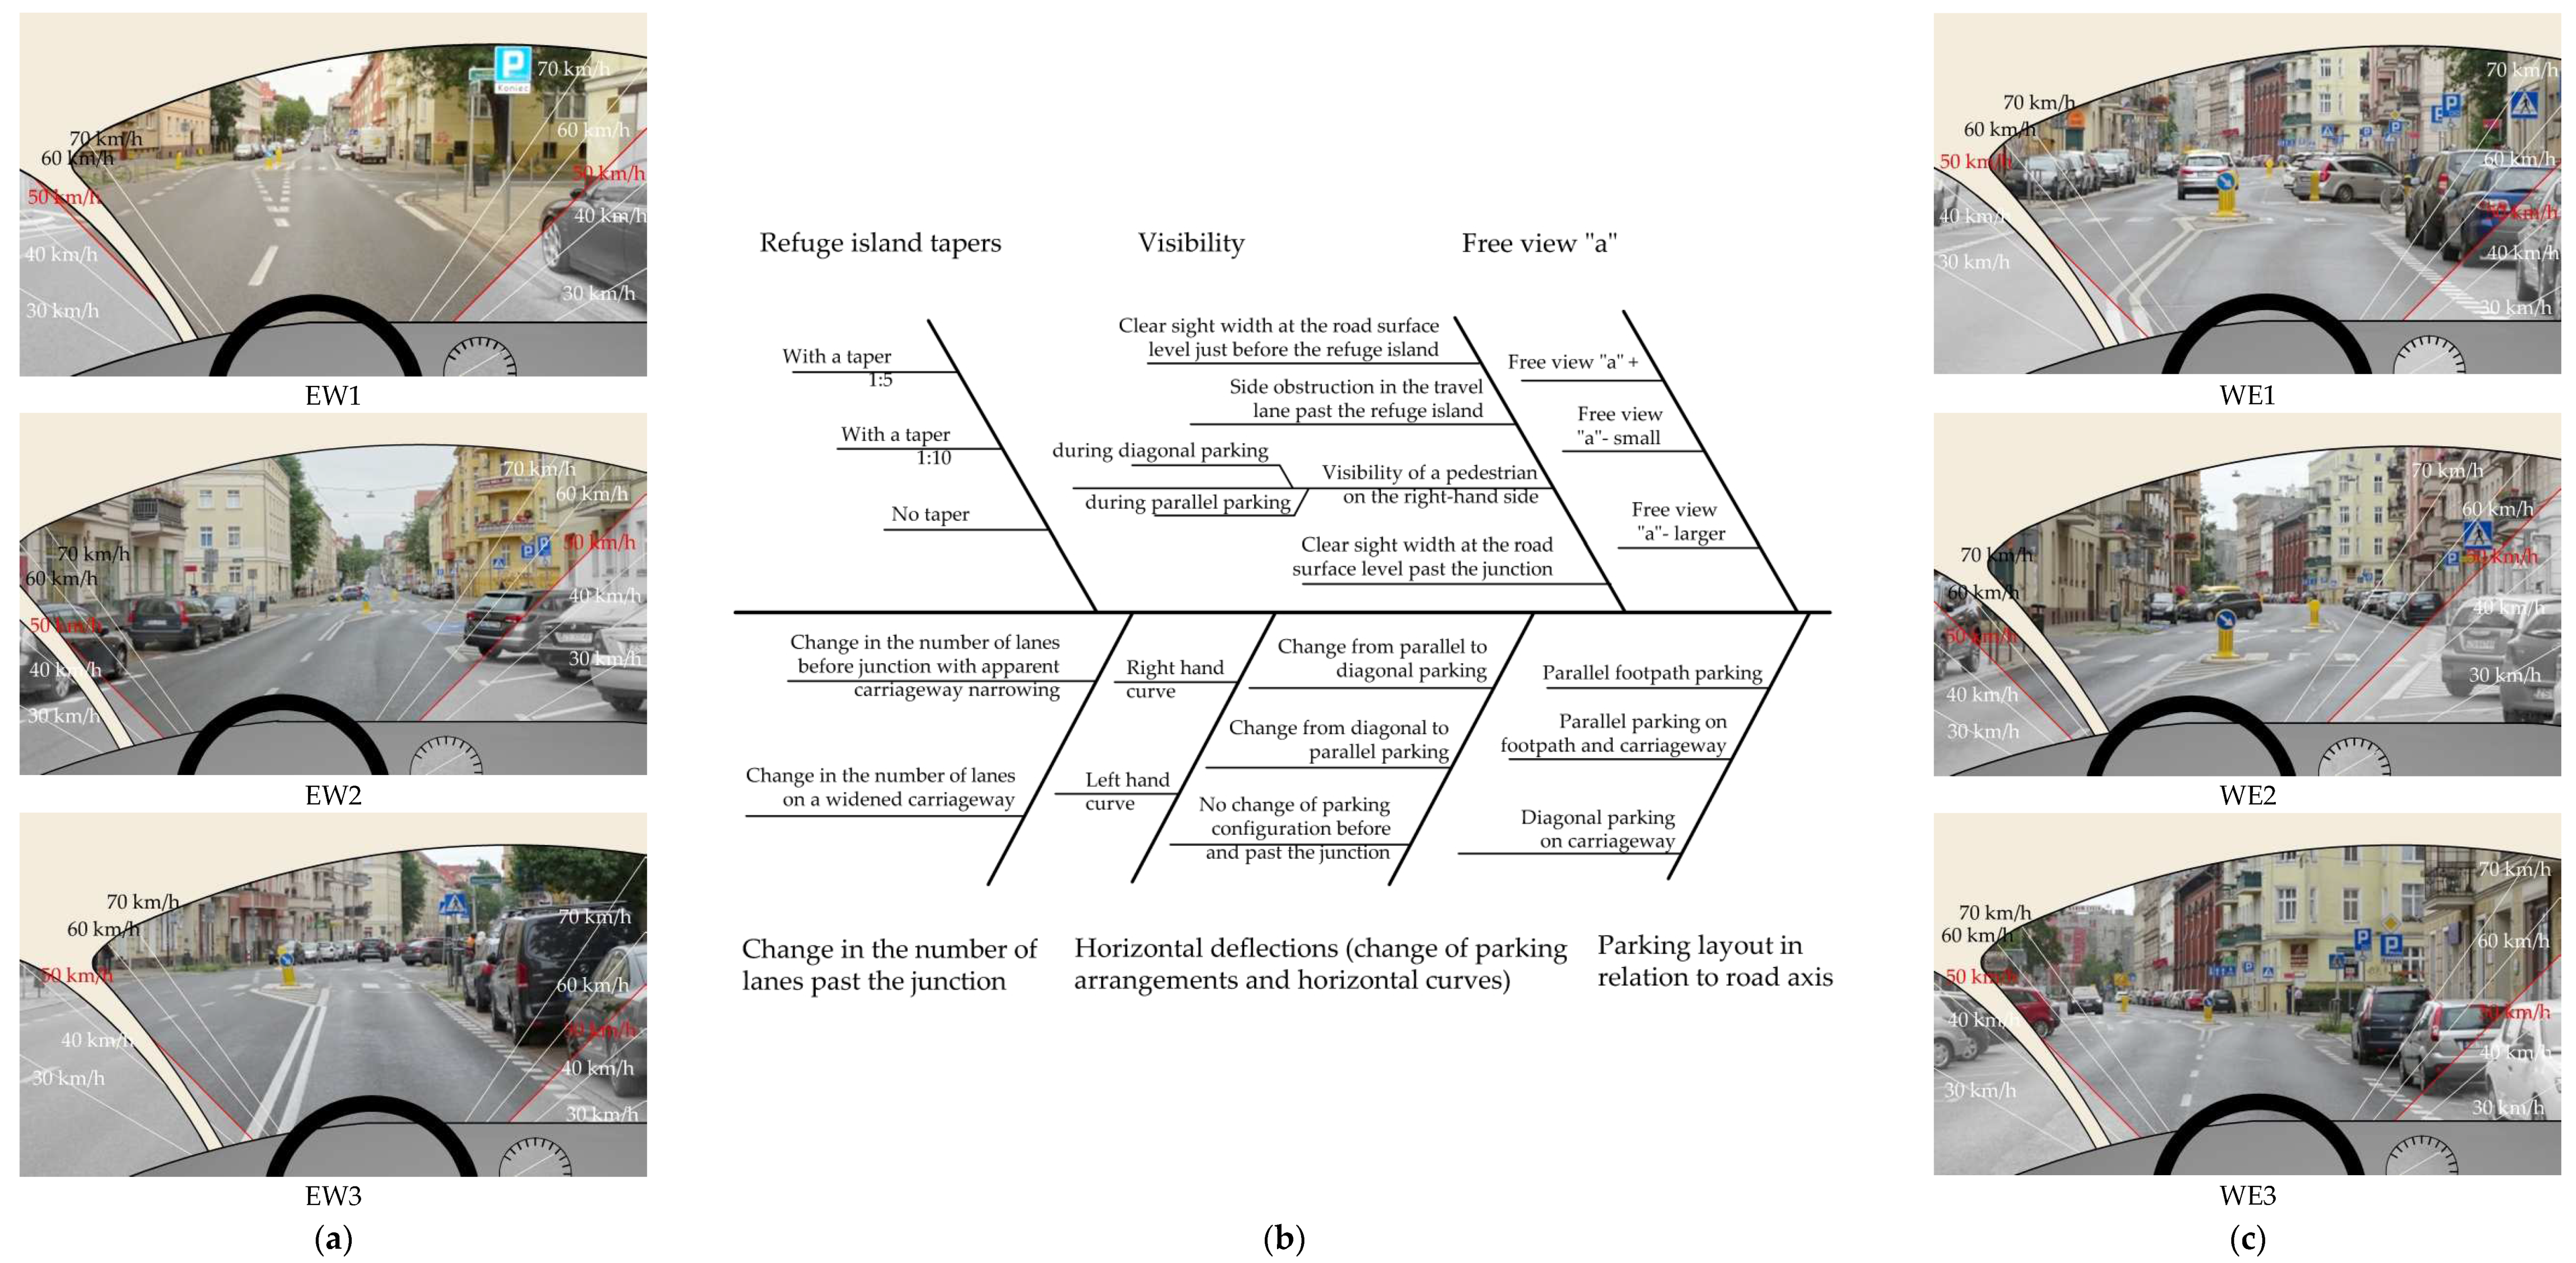
4.1. Primary and secondary determinants—cause and effect diagram
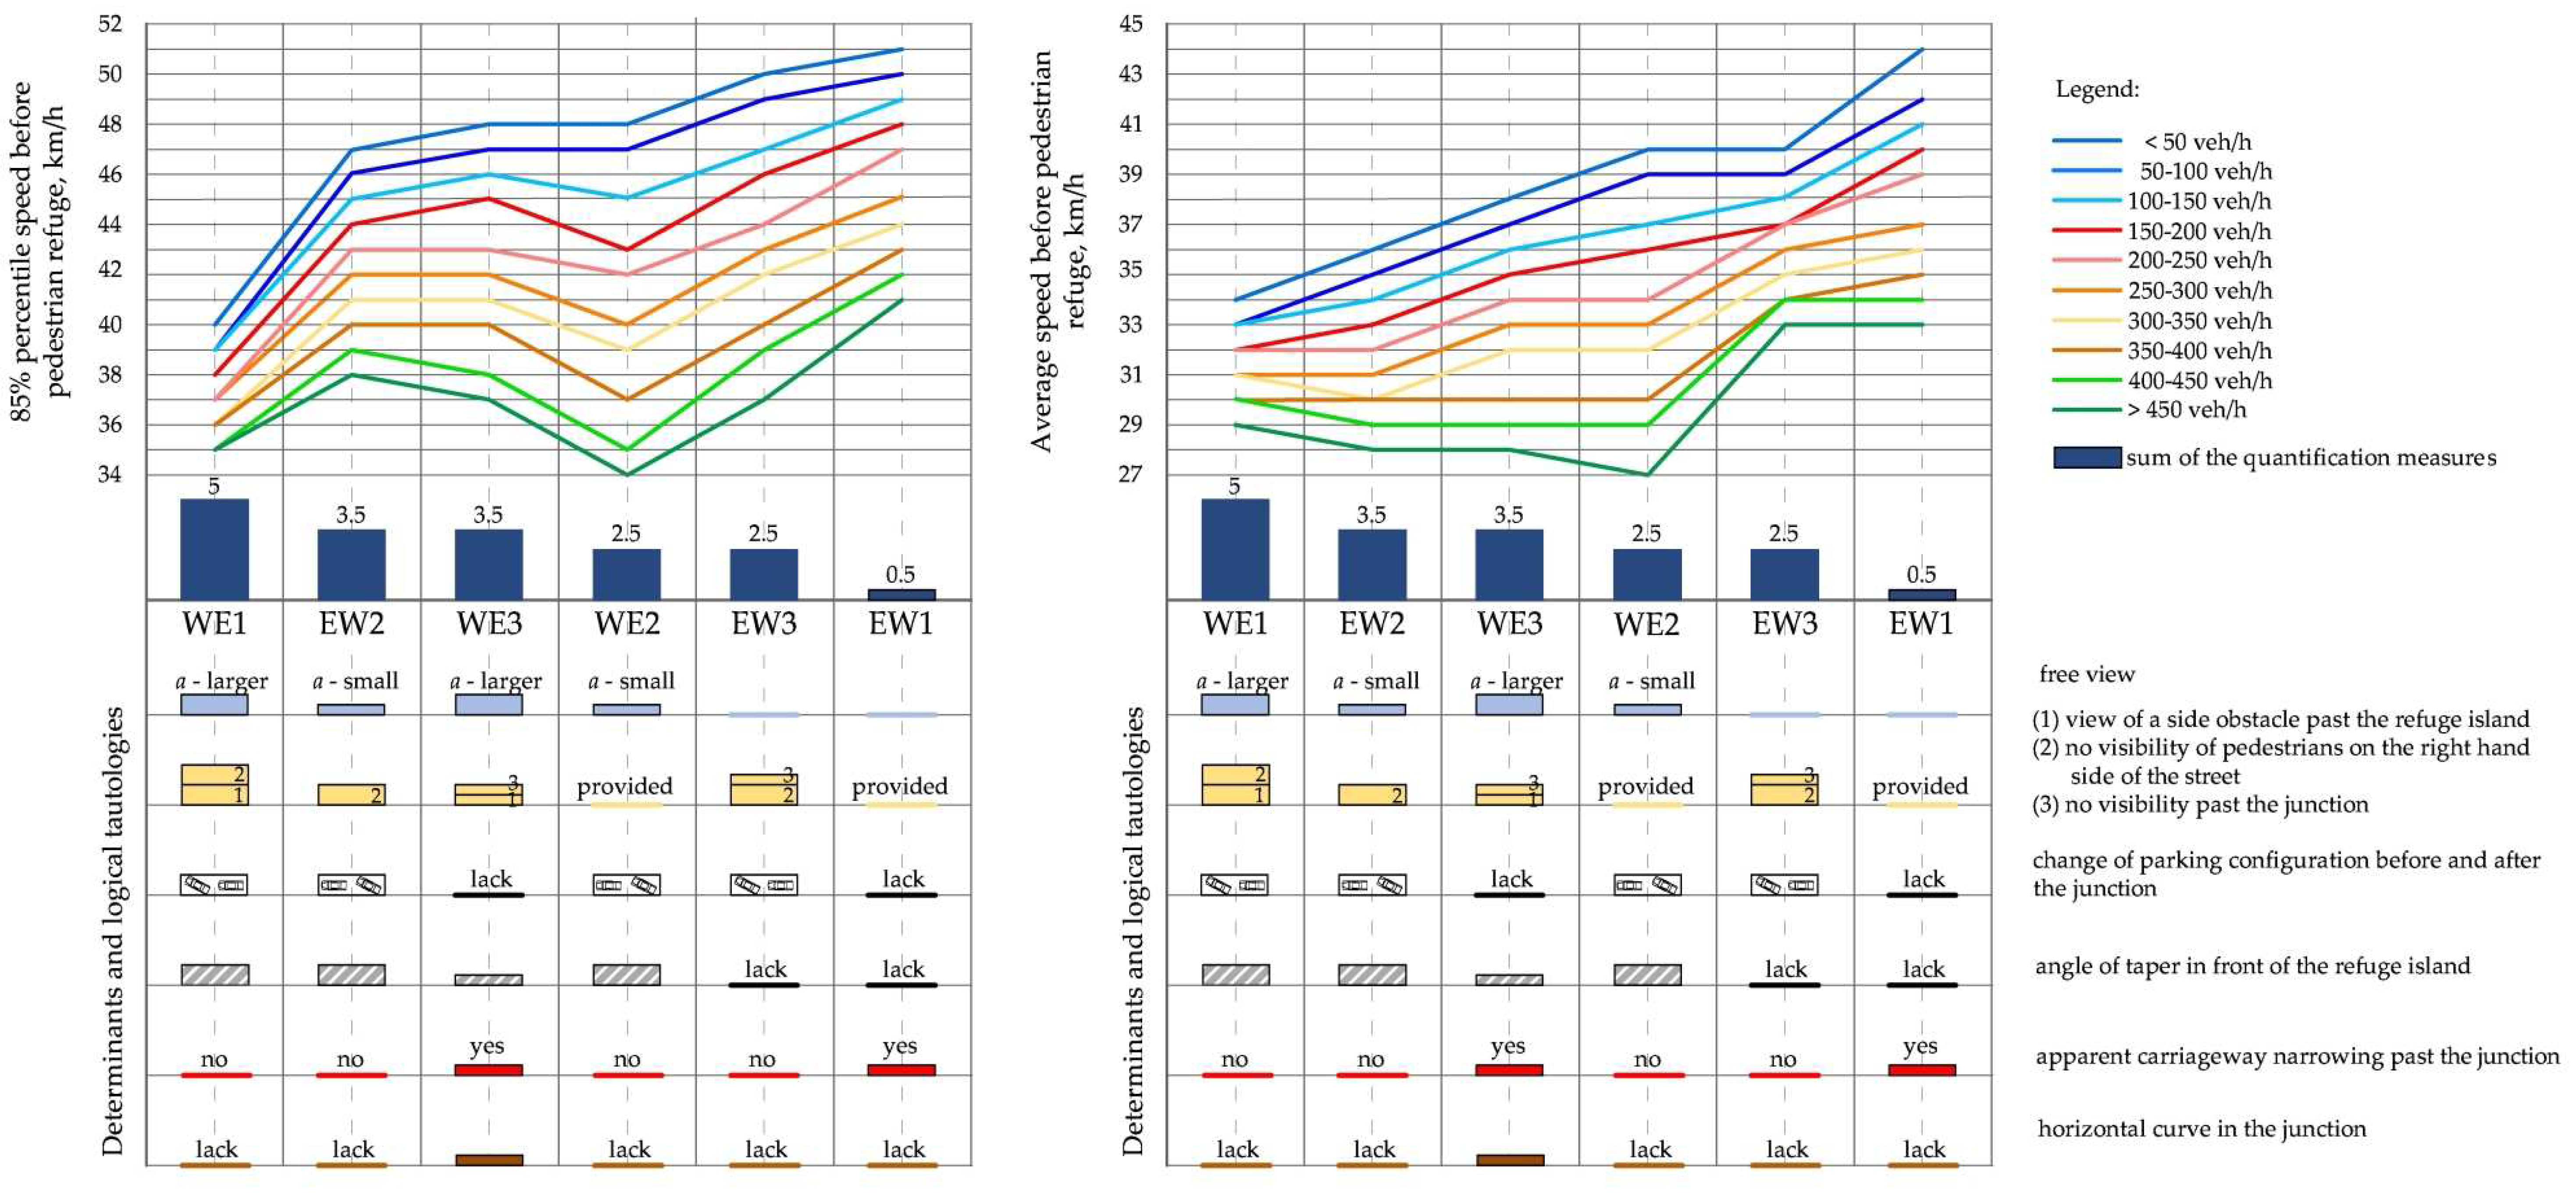
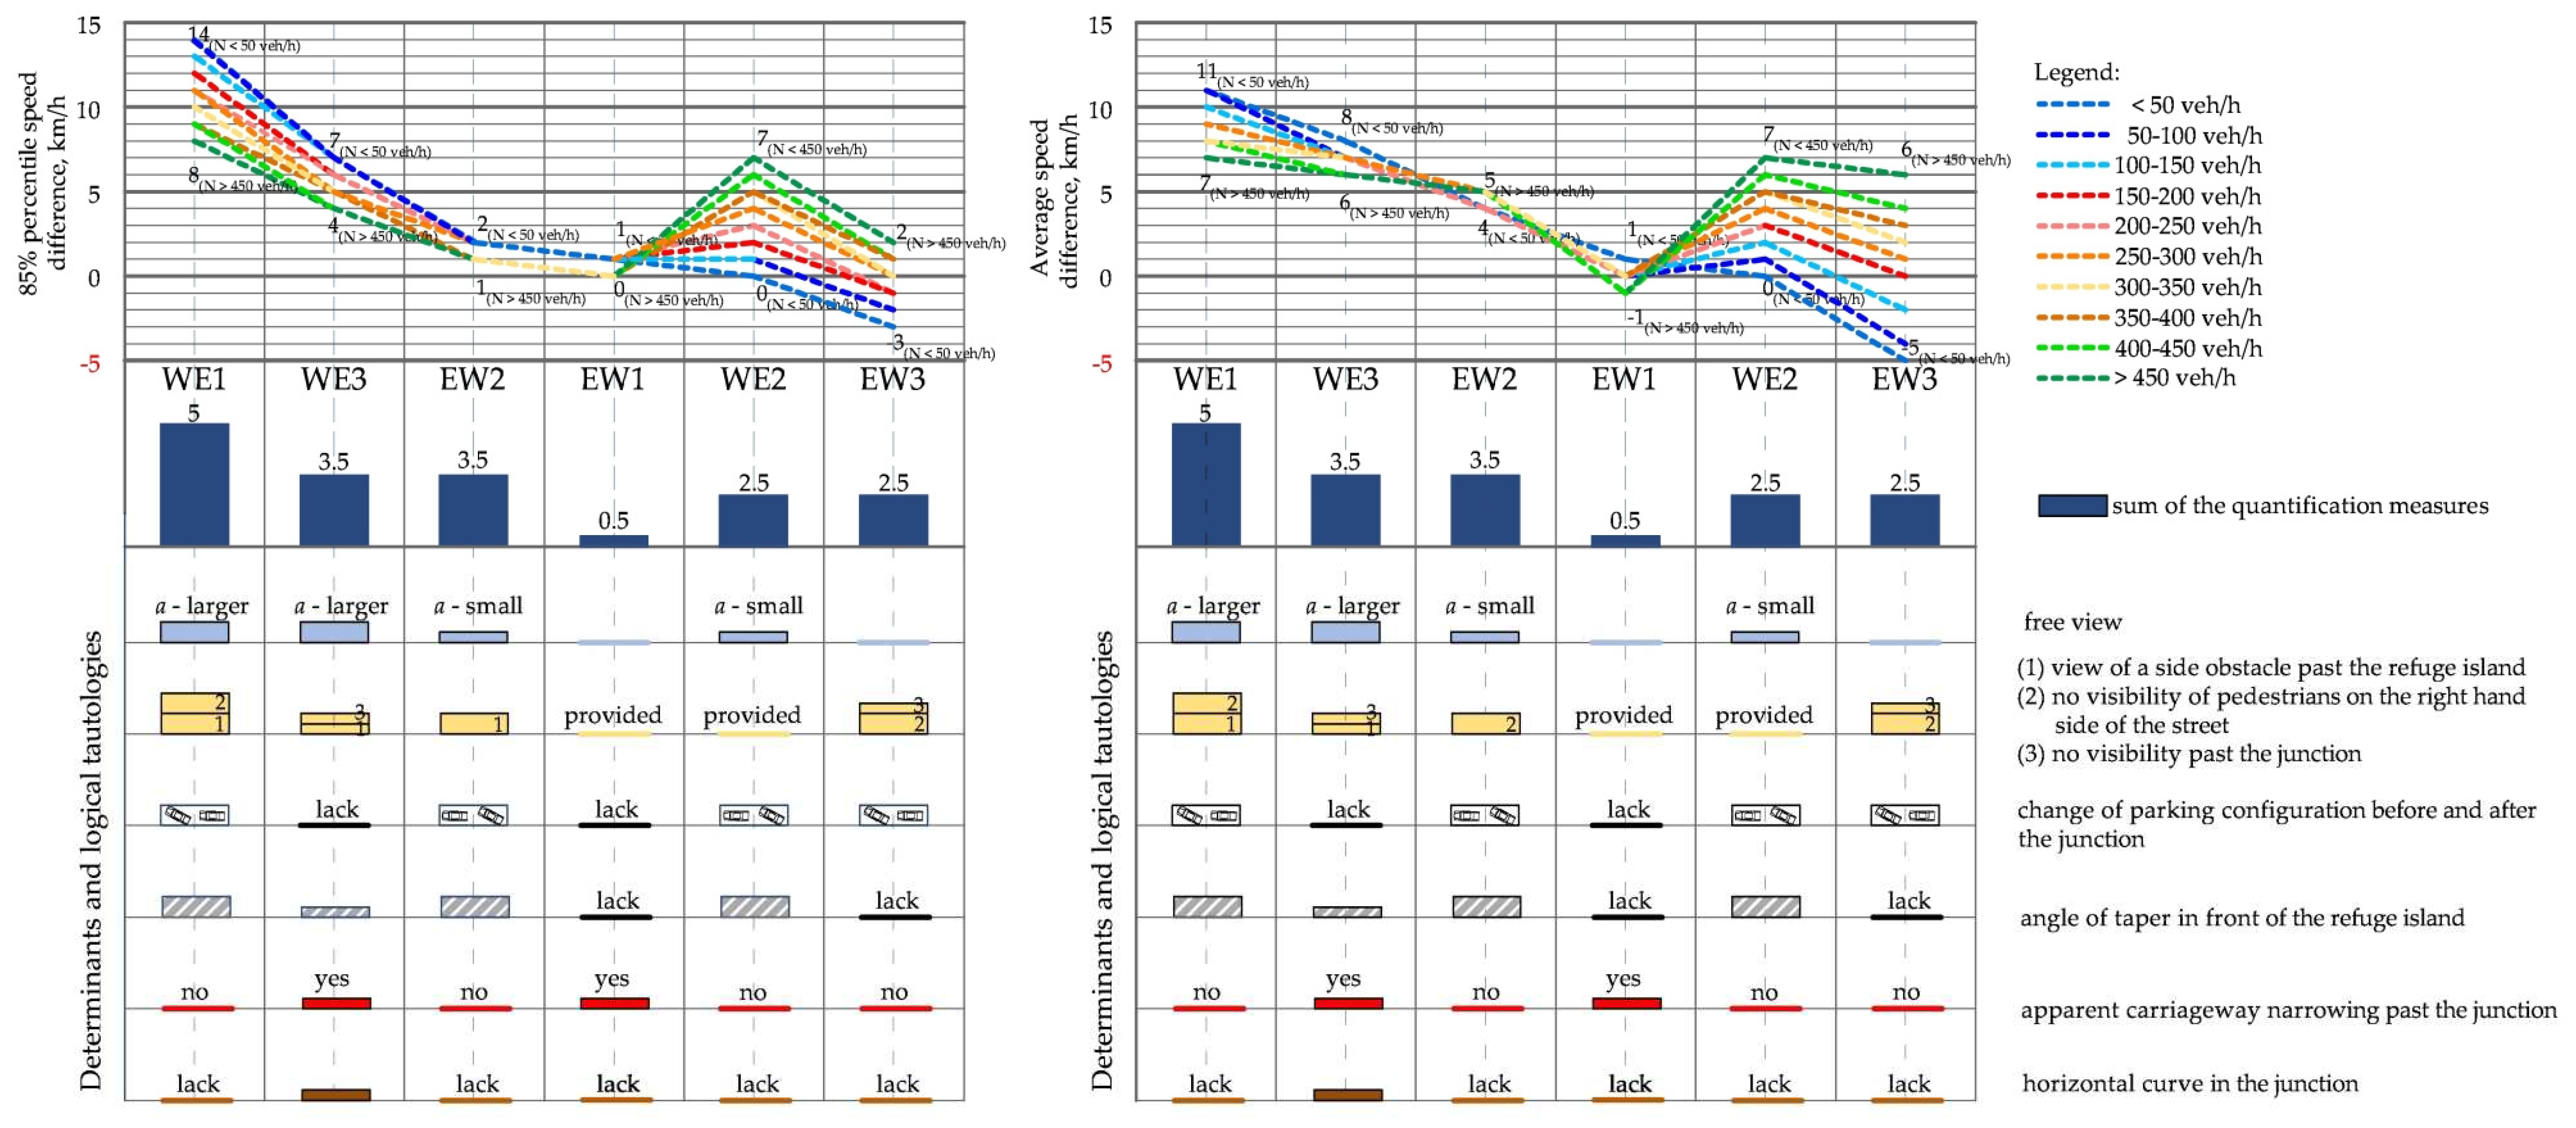
4.2. Analysis of determinants based on Pareto chart
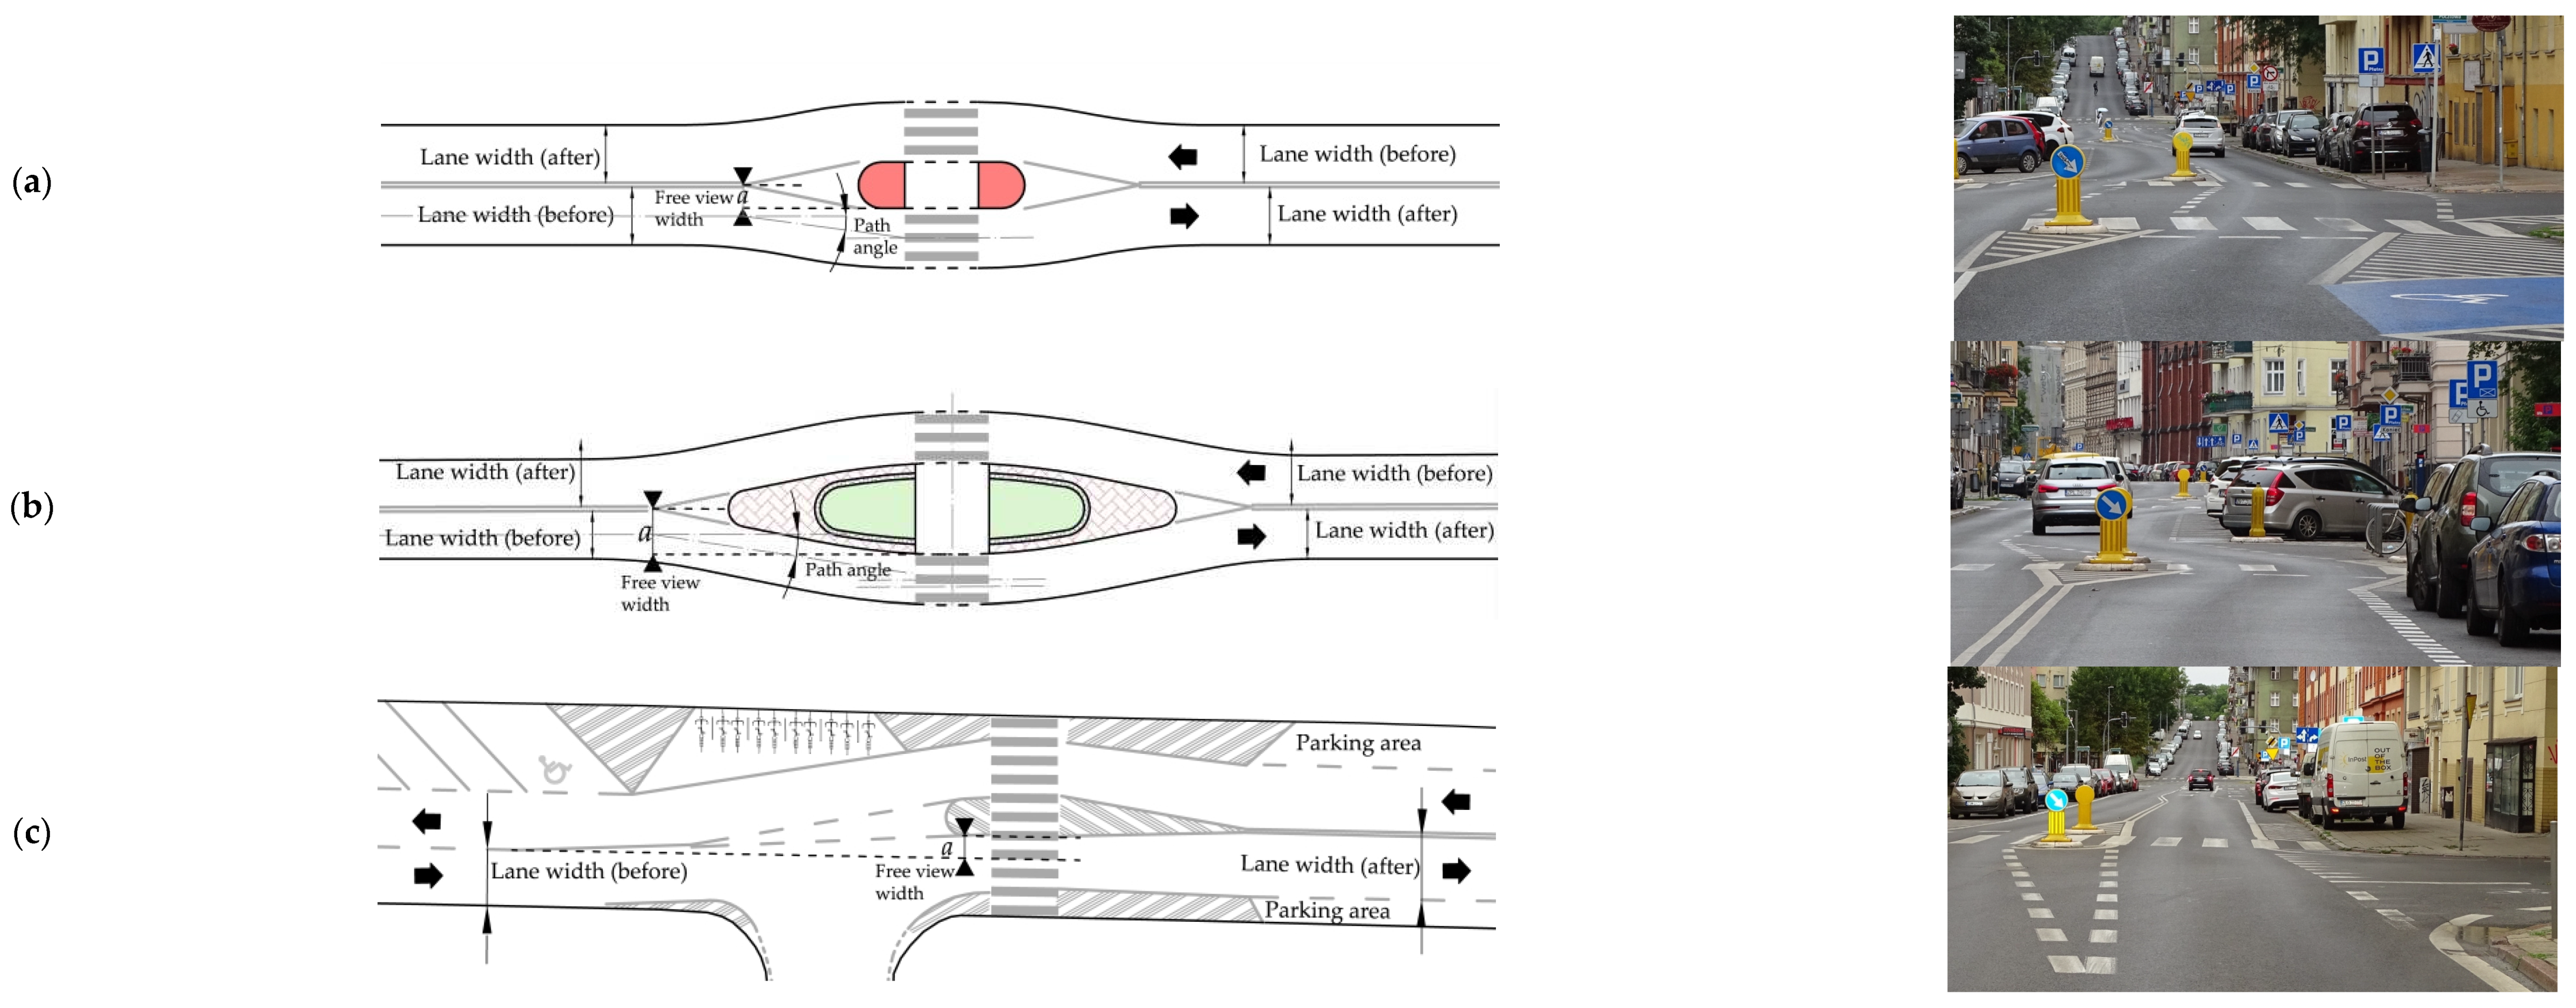
- (a)
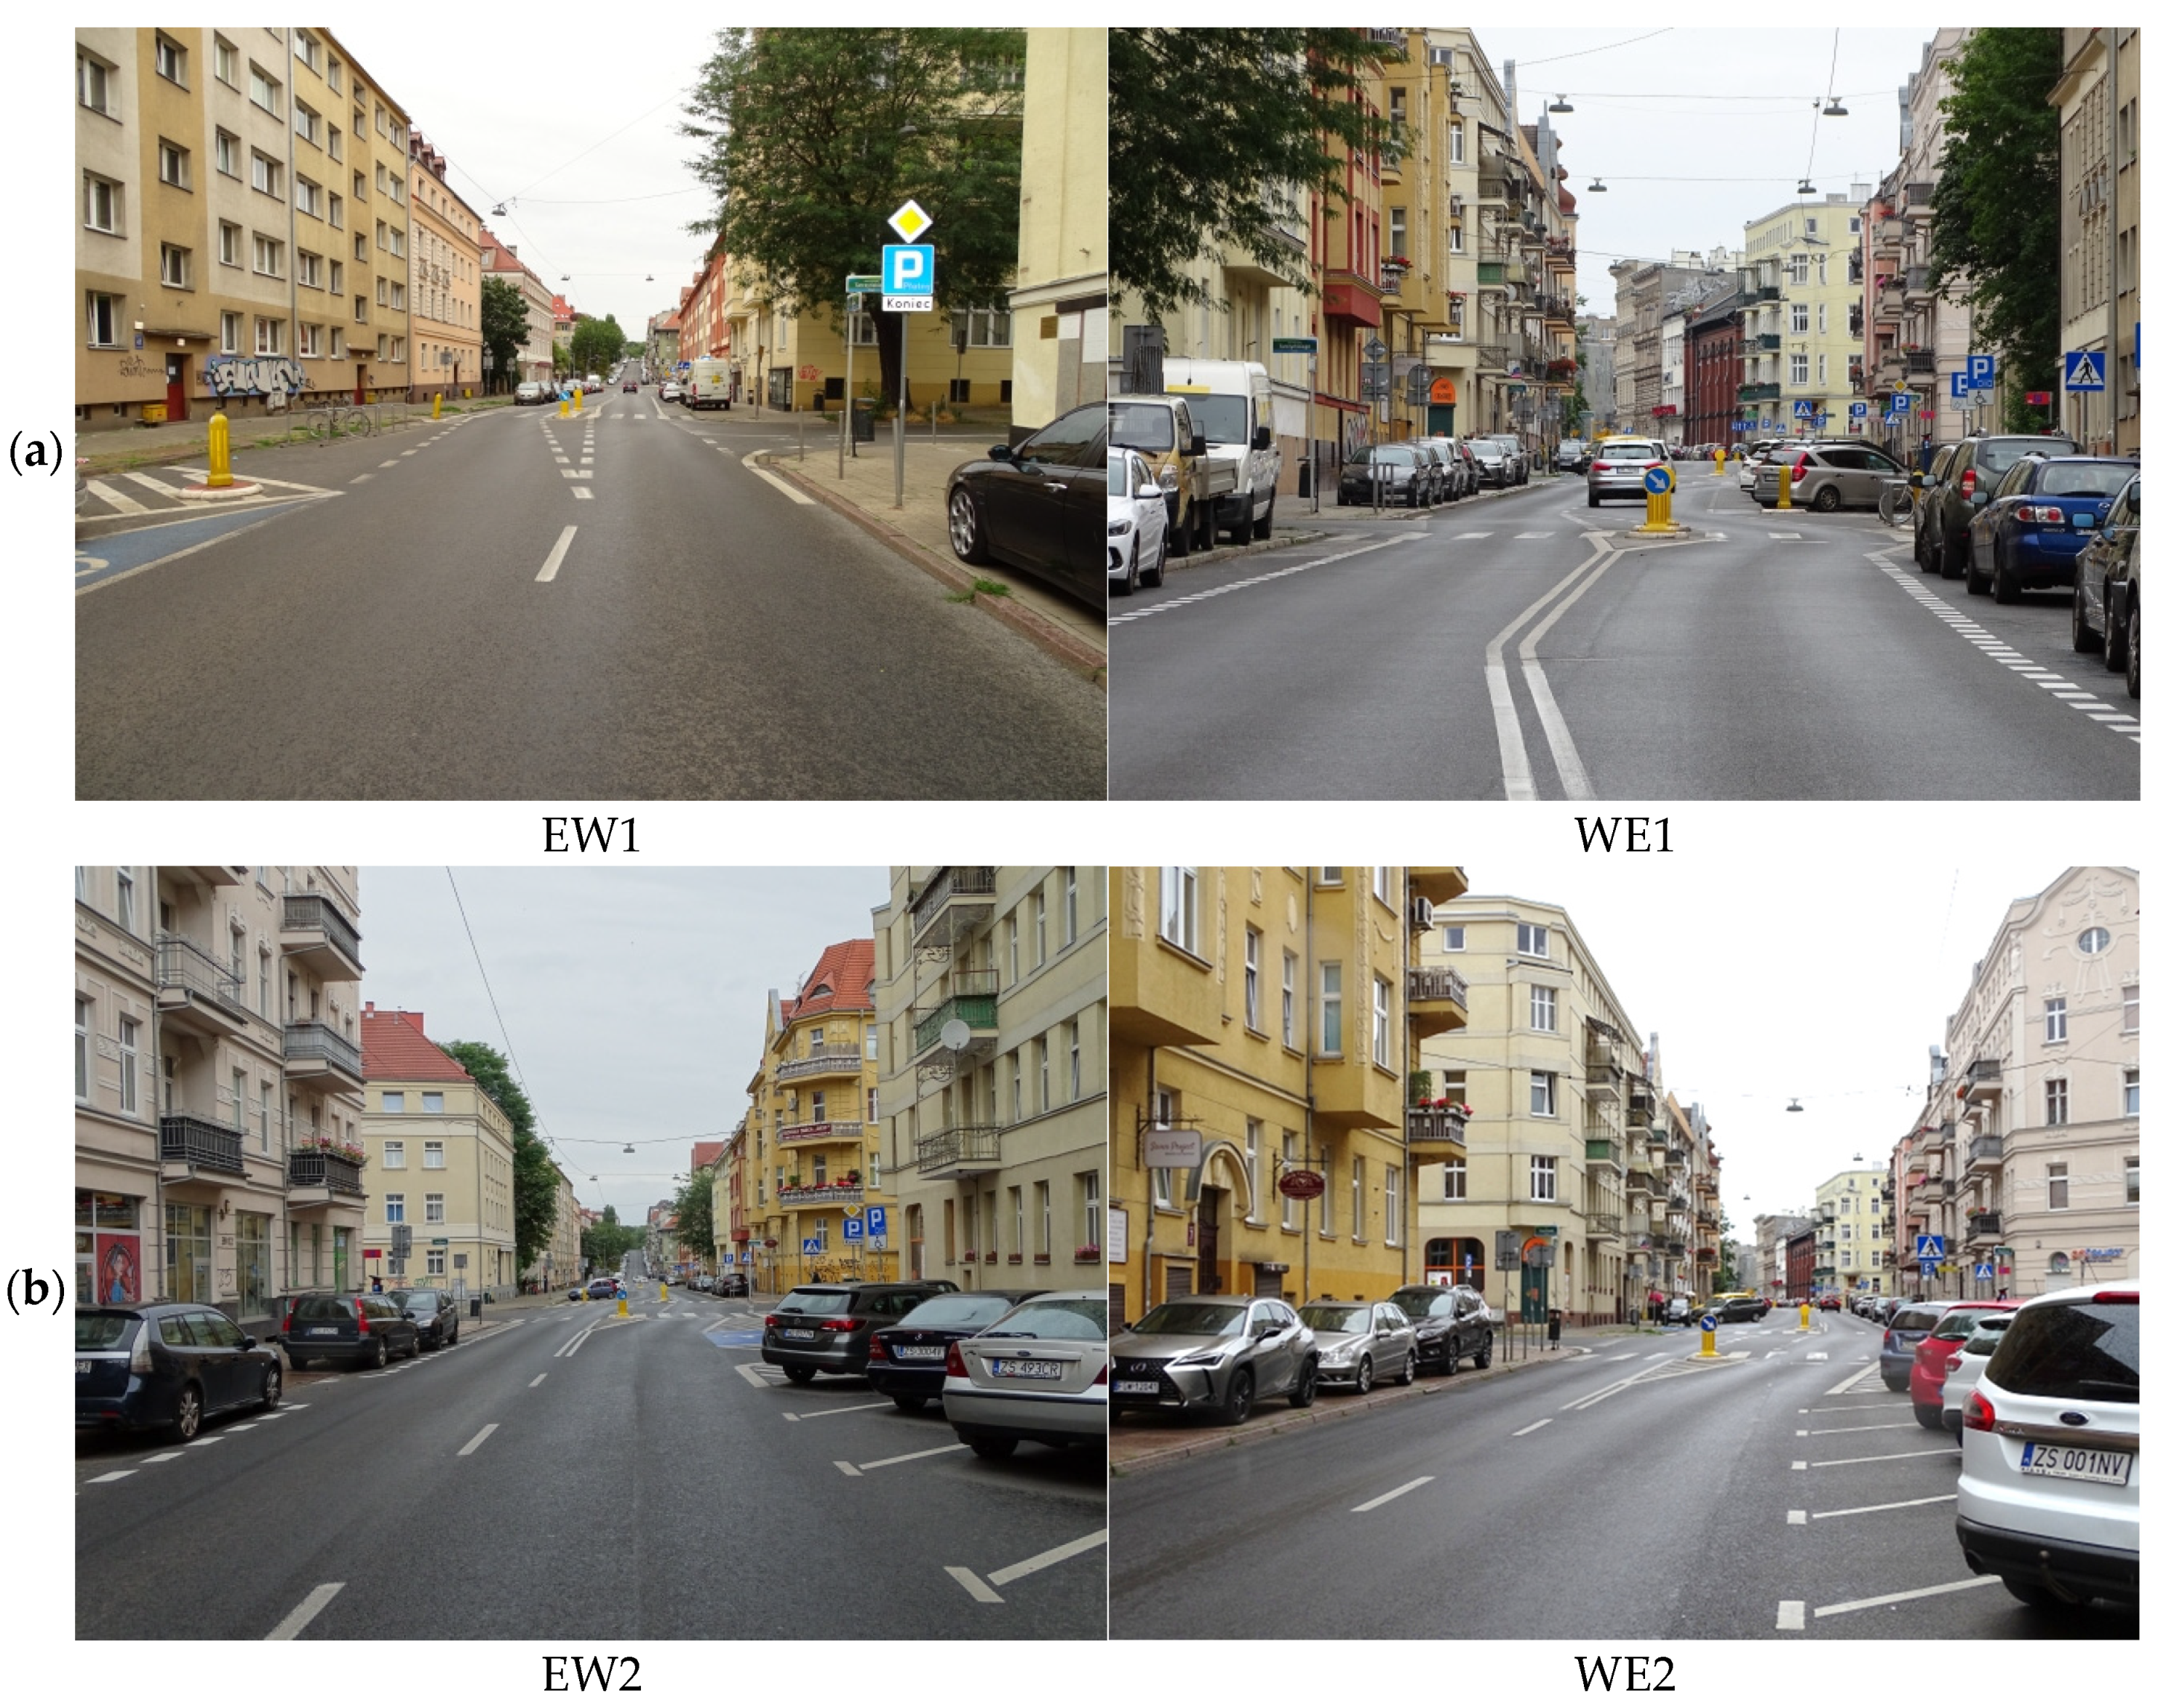
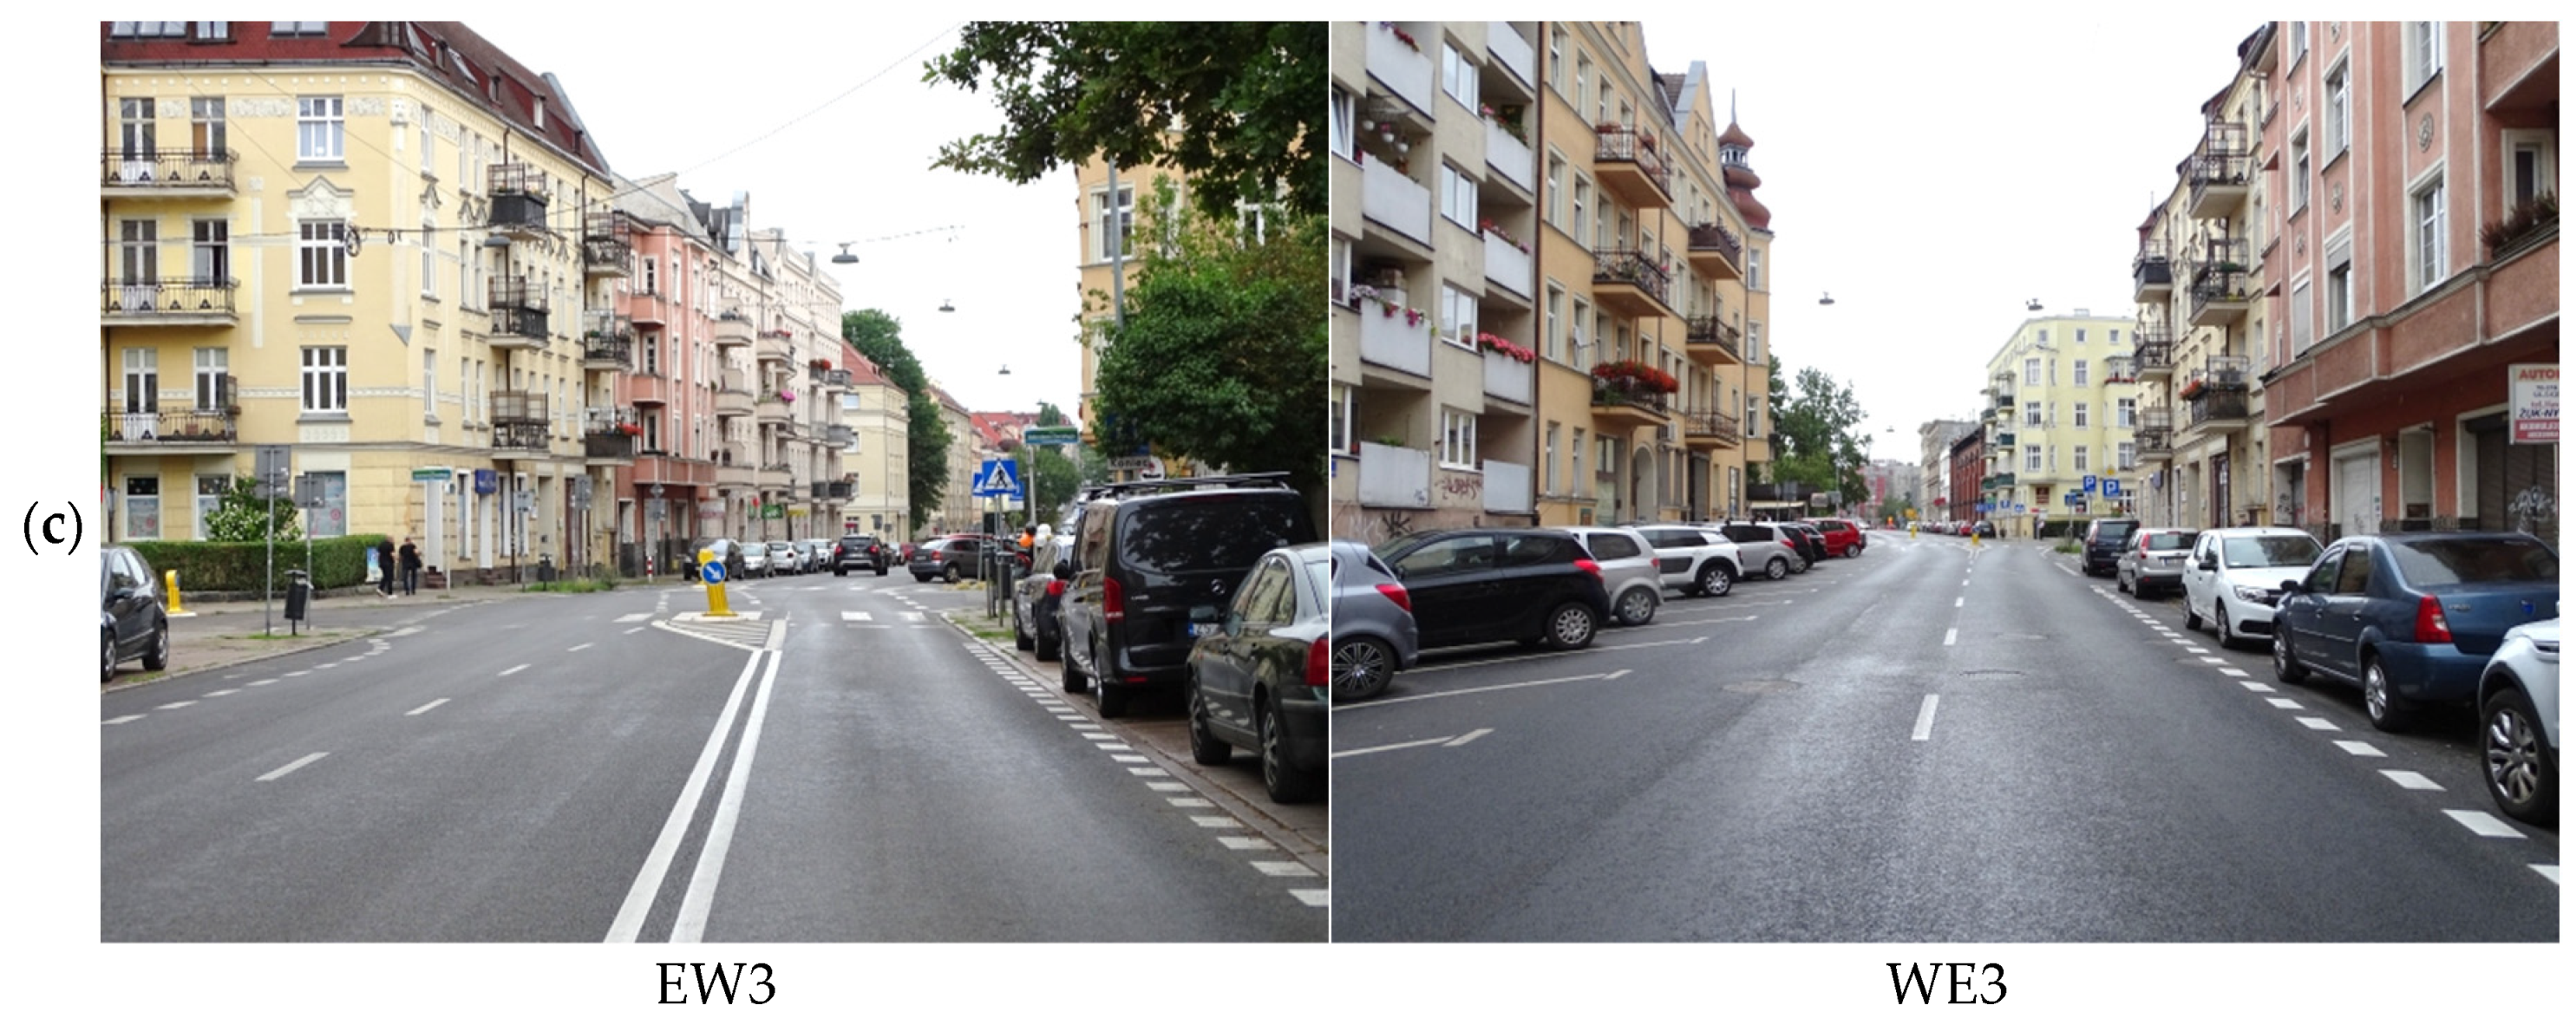
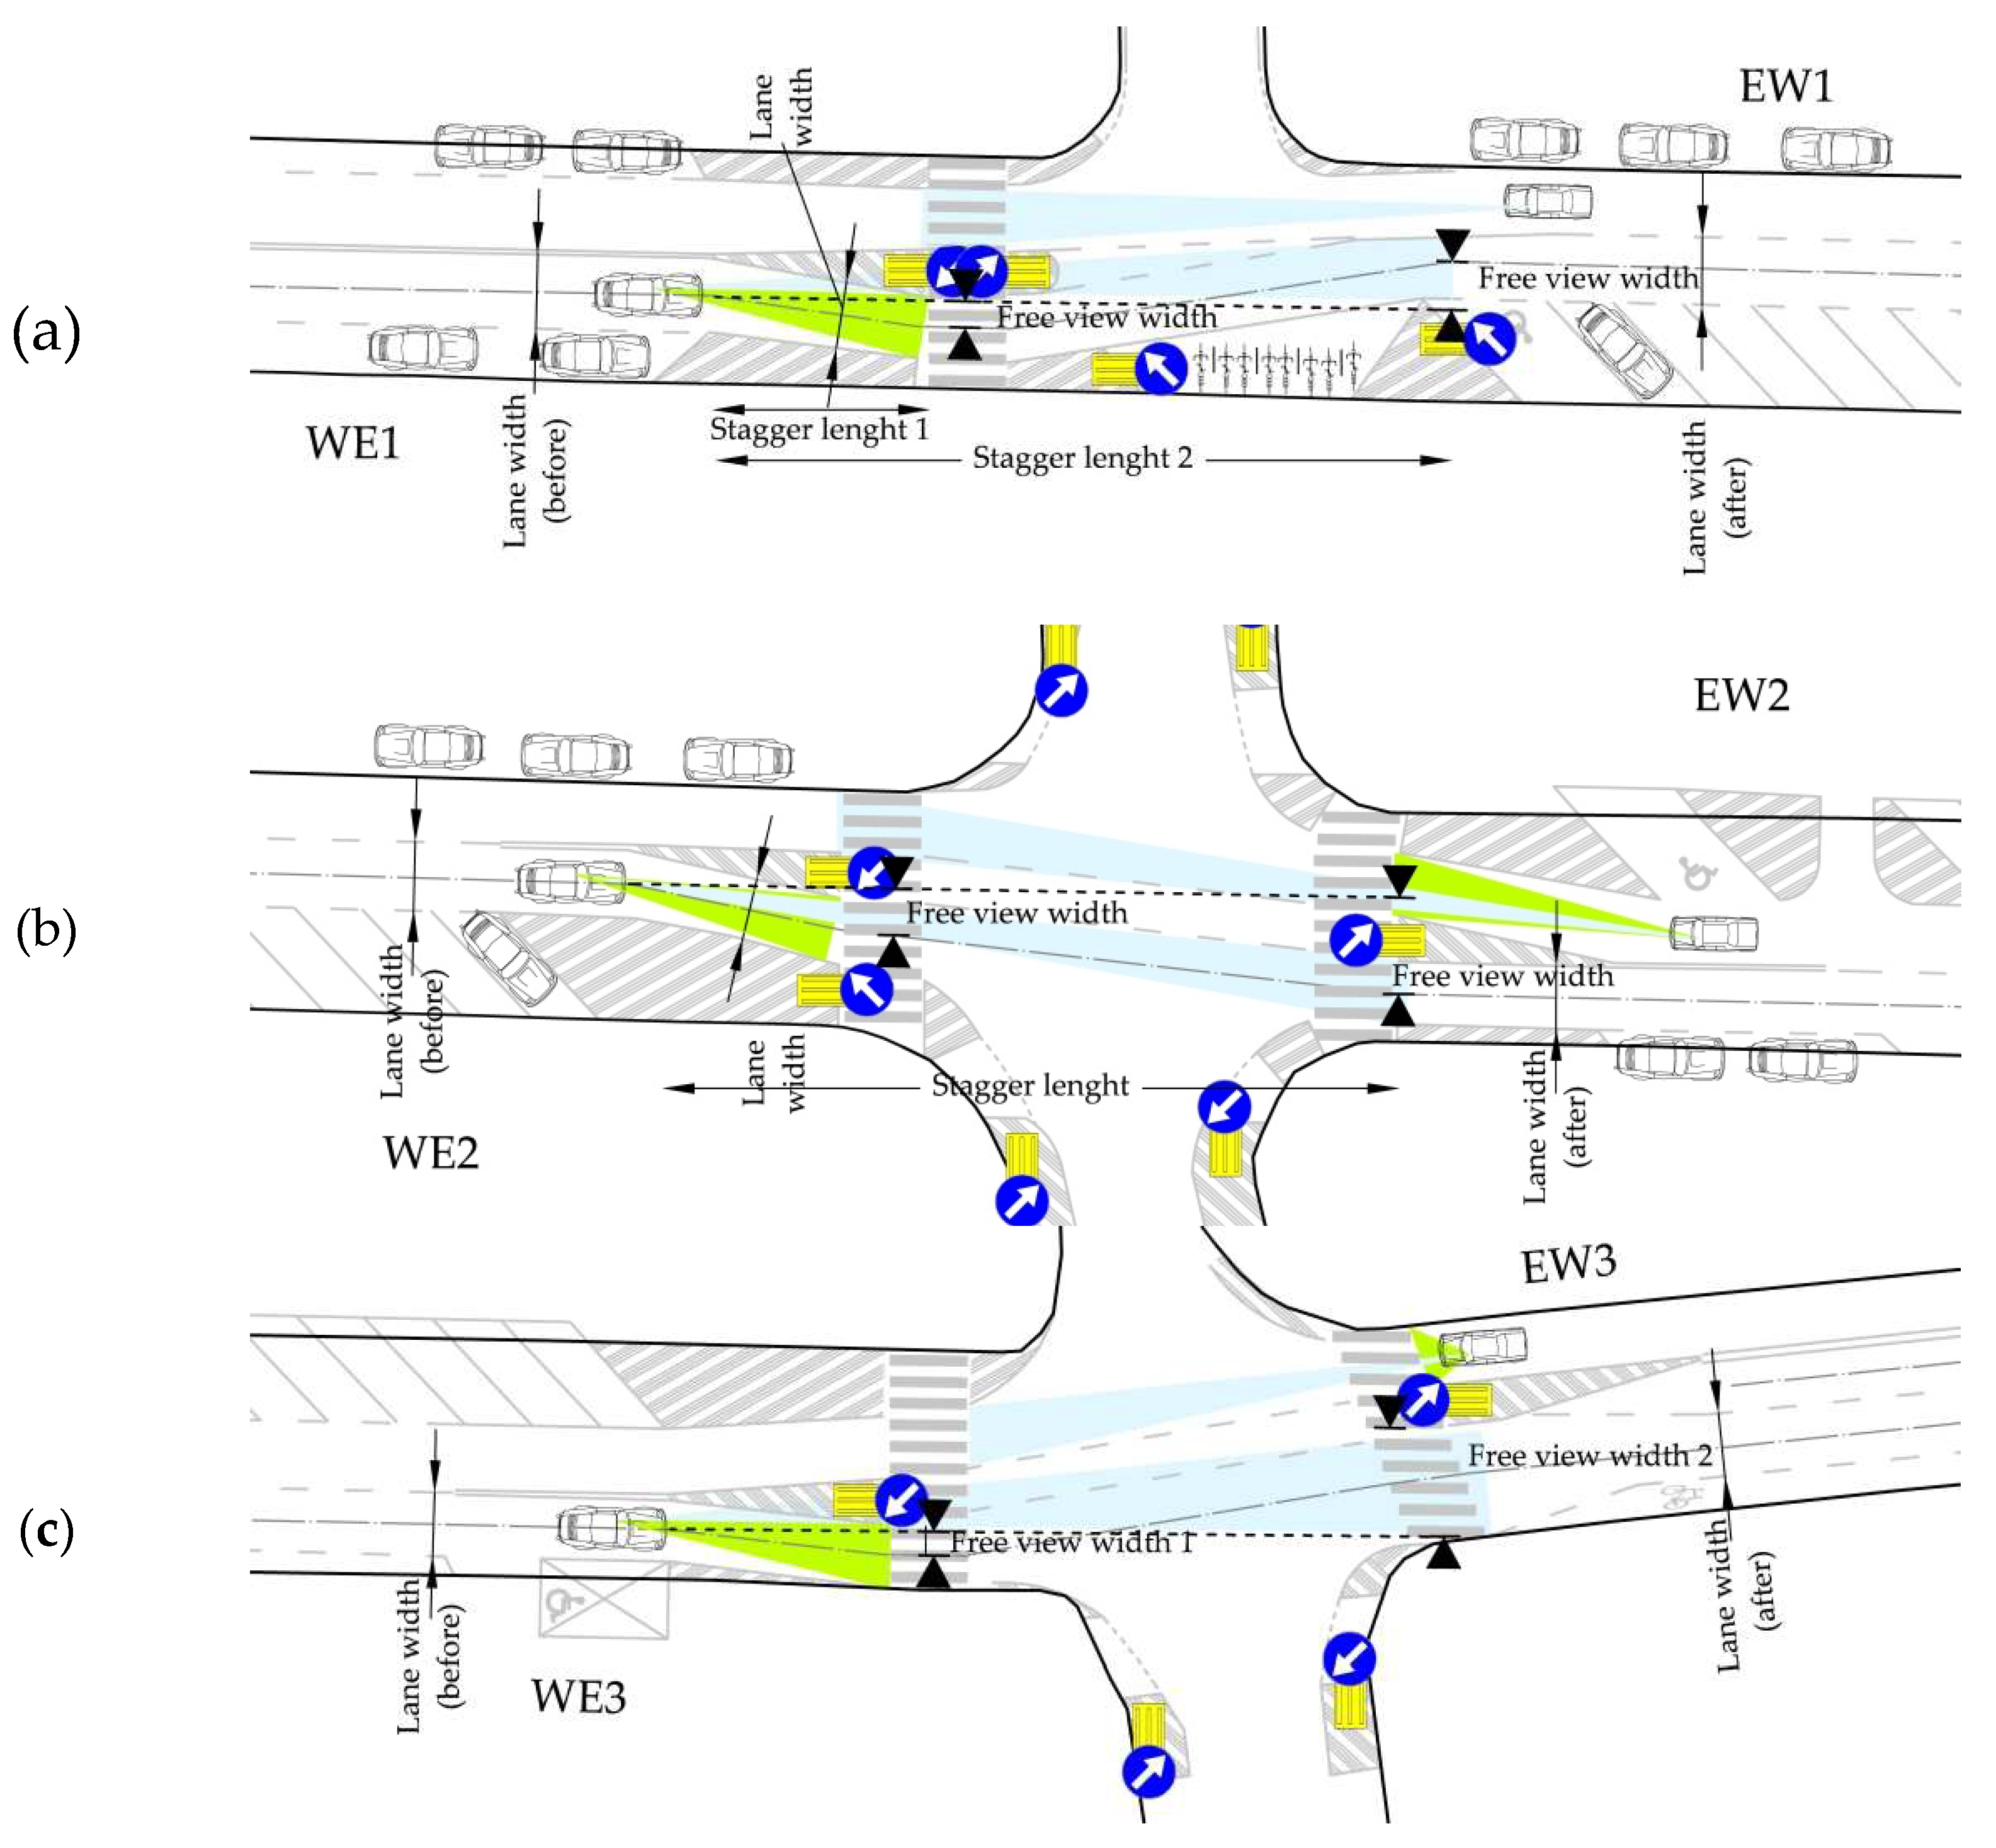
- effective (WE1)—with a change of on-street parking configuration from parallel to diagonal or vice-versa requiring the driver to change the travel path, 1:5 taper or road and island geometry designed to get free view “a” - larger so that a vehicle parked in the travel lane is visible as a side obstacle and the travel lane at the road surface level past the island is not visible by the driver approaching the island, altogether resulting in lower island approach speeds;
- (b)
- moderately effective (WE2, WE3 and EW2) with narrower free view width of “a” - small, 1:5 or 1:10 painted taper and change in parking configuration and different ways of targeting parking spaces, which in combination produce different geometry and visibility configurations offering the driver a reliable assessment of the road situation during approaching and passing the island and resulting in moderate speed reduction;
- (c)
- ineffective (EW2 and EW3) with “a” + free view, no change of parking configuration, no painted tapers, no horizontal deflection and no sight restrictions for the driver approaching and passing the island, discouraging speed reduction.
5. Conclusions
Author Contributions
Funding
Institutional Review Board Statement
Informed Consent Statement
Data Availability Statement
Acknowledgments
Conflicts of Interest
Appendix A
Appendix B

Appendix C
References
- Urban Street Design Guide; National Association of City Transportation Officials: Washington, US, 2013.
- Urban Traffic Areas—Part 7—Speed Reducers; Vejdirektoratet-Vejregeludvalget: Copenhagen, Denmark, 1991.
- Traffic Calming Guidelines; Devon County Council Engineering and Planning Department: Devon, UK, 1992.
- Roads Development Guide; East Ayrshire, Strathclyde Regional Council: London, UK, 2010.
- Working Group Highway Design, Directives for the Design of Urban Roads RASt 06. Working Group Highway Design FGSV, Kӧln, Germany, 2006.
- Elvik, R. Area-wide urban traffic calming schemes: A meta-analysis of safety effects. Accident Analysis and Prevention 2001, 33, 327–336. [Google Scholar] [CrossRef] [PubMed]
- Jones, P.; Hervik, A. Restraining car traffic in European cities: An emerging role for road pricing. Transportation Research Part A-Policy and Practice, 1992; 26, 133–145. [Google Scholar] [CrossRef]
- Mei, Z.Y.; Feng, C.; Kong, L.; Zhang, L.H.; Chen, J. Assessment of different parking pricing strategies: a simulation-based analysis. Sustainability 2020, 12(5), 2056. [Google Scholar] [CrossRef]
- Mingardo, G.; van Wee, B.; Rye, T. Urban parking policy in Europe: A conceptualization of past and possible future trends. Transportation Research Part A-Policy and Practice, 2015; 74, 268–281. [Google Scholar] [CrossRef]
- VanHoose, K.; de Gante, A.R.; Bertolini, L.; Kinigadner, J.; Büttner, B. From temporary arrangements to permanent change: Assessing the transitional capacity of city street experiments. Journal of Urban Mobility, 2022; 2, 100015. [Google Scholar] [CrossRef]
- Jazcilevich, A.; Vázquez, M.J.M.; Ramírez, P.L.; Pérez, I.R. Economic-environmental analysis of traffic-calming devices. Transportation Research Part D: Transport and Environment. [CrossRef]
- Lee, G.; Joo, S.; Oh, C.; Choi, K. An evaluation framework for traffic calming measures in residential areas. Transportation Research Part D-Transport and Environment, 2013; 36, 86–95. [Google Scholar] [CrossRef]
- Bellefleur, O. Urban Traffic Calming and Air Quality: Effects and Implications for Practice. National Collaborating Centre for Healthy Public Policy, Québec, Canada, 2012.
- Bellefleur, O.; Gagnon, F.; Urban Traffic Calming and Health: A Literature Review. National Collaborating Centre for Healthy Public Policy, Montréal 2011. Available online: http://www.ncchpp.ca/175/publications.ccnpps?id_article=686 (accessed on 2 August 2023).
- Daham, B.; Andrews, G.E.; Li, H.; Partridge, M.; Bell, M. C.; Tate, J.; Quantifying the Effects of Traffic Calming on Emissions Using On-road Measurements (Report No. 2005-01-1620). Warrendale 2005, U.S.: SAE Internationalm. Available online: http://eprints.whiterose.ac.uk/2050/1/2005-01-1620SOrion_peedbump.pdf (accessed on 2 August 2023).
- Daham, B.; Andrews, G. E.; Li, H. , Partridge, M.; Bell, M. C., Ed.; Tate, J. Quantifying the Effects of Traffic Calming on Emissions Using On-road Measurements (Report No. 2005-01-1620). In: General Emissions. Society of Automotive Engineers SAE, Warrendale, US, 2005. [Google Scholar]
- Sun, M.; Sun, X.; Shan, D. Pedestrian crash analysis with latent class clustering method. Accident Analysis & Prevention, 2019; 124, 50–57. [Google Scholar] [CrossRef]
- Guéguen, N.; Meineri, S.; Eyssartier, C. A pedestrian’s stare and drivers’ stopping behavior: A field experiment at the pedestrian crossing. Safety Science, 2015; 75, 87–89. [Google Scholar] [CrossRef]
- Balasubramanian, V. , Bhardwaj, R. Pedestrians’ perception and response towards vehicles during road-crossing at nighttime. Accident Analysis & Prevention. [CrossRef]
- Li, Y.; Fan, W. Modelling severity of pedestrian-injury in pedestrian-vehicle crashes with latent class clustering and partial proportional odds model: A case study of North Carolina. Accident Analysis & Prevention, 2019; 131, 284–296. [Google Scholar] [CrossRef]
- Sołowczuk, A.; Kacprzak, D. Identification of determinants of the speed-reducing effect of pedestrian refuges in villages located on a chosen regional road. Symmetry 2019, 11(4), 597. [Google Scholar] [CrossRef]
- Balant, M.; Lep, M. Comprehensive traffic calming as a key element of sustainable urban mobility plans-impacts of a neighbourhood redesign in Ljutomer. Sustainability 2020, 12, 8143. [Google Scholar] [CrossRef]
- Road and Transportation Research Association Directives for the Design of Urban Roads, Road and Transportation Research Association, Köln, Germany, 2012.
- Zalewski, A.; Kempa, J. , Traffic calming as a comprehensive solution improving traffic road safety. In: IOP Conference Series: Materials Science and Engineering, New York, USA: IOP Publishing, 2019, 471, 062035. [Google Scholar] [CrossRef]
- Jamroz, K.; Gaca, S.; Michalski, L.; Kieć, M.; Budzyński, M.; Gumińska, L.; Kustra, W.; Mackun, T.; Oskarbska, I.; Rychlewska, J.; Ryś, A.; Wachnicka, J.; Wierzbicka, J. Protection of Pedestrians. Guidelines for pedestrian traffic organizers; National Road Safety Council: Gdańsk, Warsaw, Cracow, Poland, 2014. (In Polish) [Google Scholar]
- Rokade, S.; Kumar, R.; Rokade, K.; Dubey, S.; Vijayawargiya, V. Assessment of effectiveness of vertical deflection type traffic calming measures and development of speed prediction models in urban perspective, International Journal of Civil Engineering and Technology (IJCIET) 2017 8(5): 1135–1146, Article ID: IJCIET_08_05_120, Available online:. Available online: https://iaeme.com/MasterAdmin/Journal_uploads/IJCIET/VOLUME_8_ISSUE_5/IJCIET_08_05_120.pdf. (accessed on 23 July 2023).
- Mohammadipour, A.; Archilla, A.R.; Papacostas, C.S.; Alavi, S.H.; Pedestrian (RPC) influence on speed reduction, Conference: Transportation Research Board (TRB) 91st Annual Meeting, Washington, D.C. 22–26 January 2012. Available online: https://www.researchgate.net/publication/273687736_Pedestrian_RPC_Influence_on_Speed_Reduction (accessed on 3 August 2023).
- Gonzalo-Orden, H.; Rojo, M.; Perez-Acebo, H.; Linares, A. Traffic calming measures and their effect on the variation of speed, Paper presented at the 12th Conference on Transport Engineering (CIT), Valencia 7 – 9 June, Spain, Transportation Research Procedia 2016, 18: 349 – 356. [CrossRef]
- Distefano, N.; Leonardi, S. Evaluation of the benefits of traffic calming on vehicle speed reduction, Civil Engineering and Architecture 2019, 7(4): 200-214. [CrossRef]
- Distefano, N.; Leonardi, S. Effects of speed table, chicane and road narrowing on vehicle speeds in urban areas, VI International Symposium New Horizons 2017 of Transport and Comunications 17 –18 November 2017 Doboj, Serbia. 18 November.
- Kruszyna, M. , Matczuk-Pisarek M. The Effectiveness of Selected Devices to Reduce the Speed of Vehicles on Pedestrian Crossings, Sustainability 2021, 13, 9678. [CrossRef]
- Sołowczuk, A. Effect of Traffic Calming in a Downtown District of Szczecin, Poland. Energies, 2021; 14, 5838. [Google Scholar] [CrossRef]
- Akgol, K.; Gunay, B.; Aydin, M.M. Geometric optimisation of chicanes using driving simulator trajectory data, Proceedings of the Institution of Civil Engineers – Transport, 2022, 175(4): 238–248. [CrossRef]
- Aydin, M.M.; Akgöl, K.; Günay, B. The investigation of different chicane applications in traffic calming studies using driving symulator, Journal of the Faculty of Engineering and Architecture of Gazi University, 2019, 34(4): 1793-1805. [CrossRef]
- Hussain, Q.; Alhajyaseen, W.K.M.; Kharbeche, W.; Almallah, M. Safer pedestrian crossing facilities on low-speed roads: Comparison of innovative treatments, Accident Analysis & Prevention 2023, 180: 106908. [CrossRef]
- Sayer, I.A.; Parry, D.I.; Speed control using chicanes—a trial at TRL. TRL Project Report PR 102. Transport Research Laboratory, Crowthorne 1994. dostęp on-line (25.03.2018). Available online: https://trid.trb.org/view/425130 (accessed on 2 July 2023).
- Sayer, I.; A, Parry D.I., Barker J. K., Traffic calming – An assessment of selected on-road chicane schemes, Transport Research Laboratory TRL Report 313, Crowthorne 1998, dostęp on-line (20.03.2018). Available online: https://trl.co.uk/sites/default/files/TRL313.pdf (accessed on 25 June 2025).
- Zhang, C.; Qin, S.; Yu, H.; Zheng, B.; Li, Z. A Review on Chicane Design based on Calming Theory. Journal of Engineering Science and Technology Review. J. Eng. Sci. Technol. Rev. 2020, 13, 188–197. [Google Scholar] [CrossRef]
- Wirksamkeit geschwindigkeitsdämpfender Maßnahmen außerorts, Hessisches Landesamt für Straßen- und Verkehrswesen: Hessen, Germany 1997. Available online: https://docplayer.org/57666796-Wirksamkeit-geschwindigkeitsdaempfender-massnahmen.html (accessed on 2 August 2020).
- Hunnel, T.; Mackie, A.; Wells, P. Traffic calming measures in built-up areas. Literature Review, Unpublished Project Report PR/SE/622/02 Vägverket TR80 2002:15779, Swedish National Road Administration, Borlänge, Sweden 2002.
- Juran, J.M.; Gryna, F.M. Juran’s Quality Control Handbook, Sixth ed.; Publisher: McGraw-Hill, NY, US, 2010. [Google Scholar]
- Stephens, K.S. ; Juran, Quality, And A Century Of Improvement, 15 ed.; Publisher: ASQ, Milwaukee, US, 2004. [Google Scholar]
- Feigenbaum, A.V. Quality Control: Principles, Practice, and Administration, McGraw Hill Book Company Inc., New York City, US, 1951.
- Deming, W. E. Out of the crisis, fifth ed.; Publisher: The MIT Press, Cambridge, Great Britain, 2000. [Google Scholar]
- Ishikawa, K.; Loftus, J.H. Introduction to quality control, 3rd ed.; Publisher: 3A Corporation, Tokyo, Japan, 1990. [Google Scholar]
- Ishikawa, K. , Introduction to quality control, Publisher: Taylor & Francis, Pennsylvania, US, 1990.
- Ishikawa, K. , What Is Total Quality Control? The Japanese Way, Publisher: Prentice-Hall Direct, Michigan, US, 1985.
- Sołowczuk, А. Metod TQM v zadačah ocenki tehničeskogo sostoâniâ dorog, Transportnoe stroitel’stvo 2005, (7): 11 – 12.
- Sołowczuk, А. Naučnye osnowy ocenki tehničeskogo sostoâniâ dorog po potrebitel’skim svojstvam, Dorogi i mosty 2005, 13(1): 165–175.
- Evans, S.R. ; P. Norbacka, J.P. An Heuristic Method for Solving Time-Sensitive Routing Problems, The Journal of Operational Research Society 1984, 35(5):407-414. [CrossRef]
- Wang, Z.; Wang, Z. A novel two-phase heuristic method for vehicle routing problem with backhauls, Computers & Mathematics with Applications 2009, 57(11–12): 1923-1928. [CrossRef]
- Ichoua, S.; Gendreau, M. ; Potvin, J-Y. Vehicle dispatching with time-dependent travel Times, European Journal of Operational Research 2003 144(2): 379-396. [CrossRef]
- Malandraki, C.; Daskin, M.S. Time dependent vehicle routing problems: Formulations, properties and heuristic algorithms, Transportation Science 1992, 26, pp. 185–200.
- Hill, A.C.; Benton, W.C. Modelling intra-city time-dependent travel speeds for vehicle scheduling problems, Journal of Operational Research Society 1992, 43: 343-351.
- Kim, J-S.; Jeong, J. Development of the Dripping Speed Measurement System of Medical Liquid using Heuristic, Journal of Korean institute of intelligent systems 2014, 24(5): 542-547. [CrossRef]
- Bujak, K. Traffic organization design along 5 Lipca Street on the section from Bohaterów Warszawy Avenue to Szarych Szeregów Place, City Office of Szczecin, Szczecin, Poland, 2015.
- Ustawa – Prawo o ruchu drogowym, Dziennik Ustaw z dnia 20 czerwca 1997 Nr 98 poz. 602, z późn. zm. Available online: https://isap.sejm.gov.pl/isap.nsf/DocDetails.xsp?id=wdu19970980602 (accessed on 2 July 2023).
- Google Earth. Available online: http://www.earth.google.com. (accessed on 2 July 2023).
- Accident and Collision Registration System SEWIK. Available online: https://sewik.pl/ (accessed on 2 July 2023).
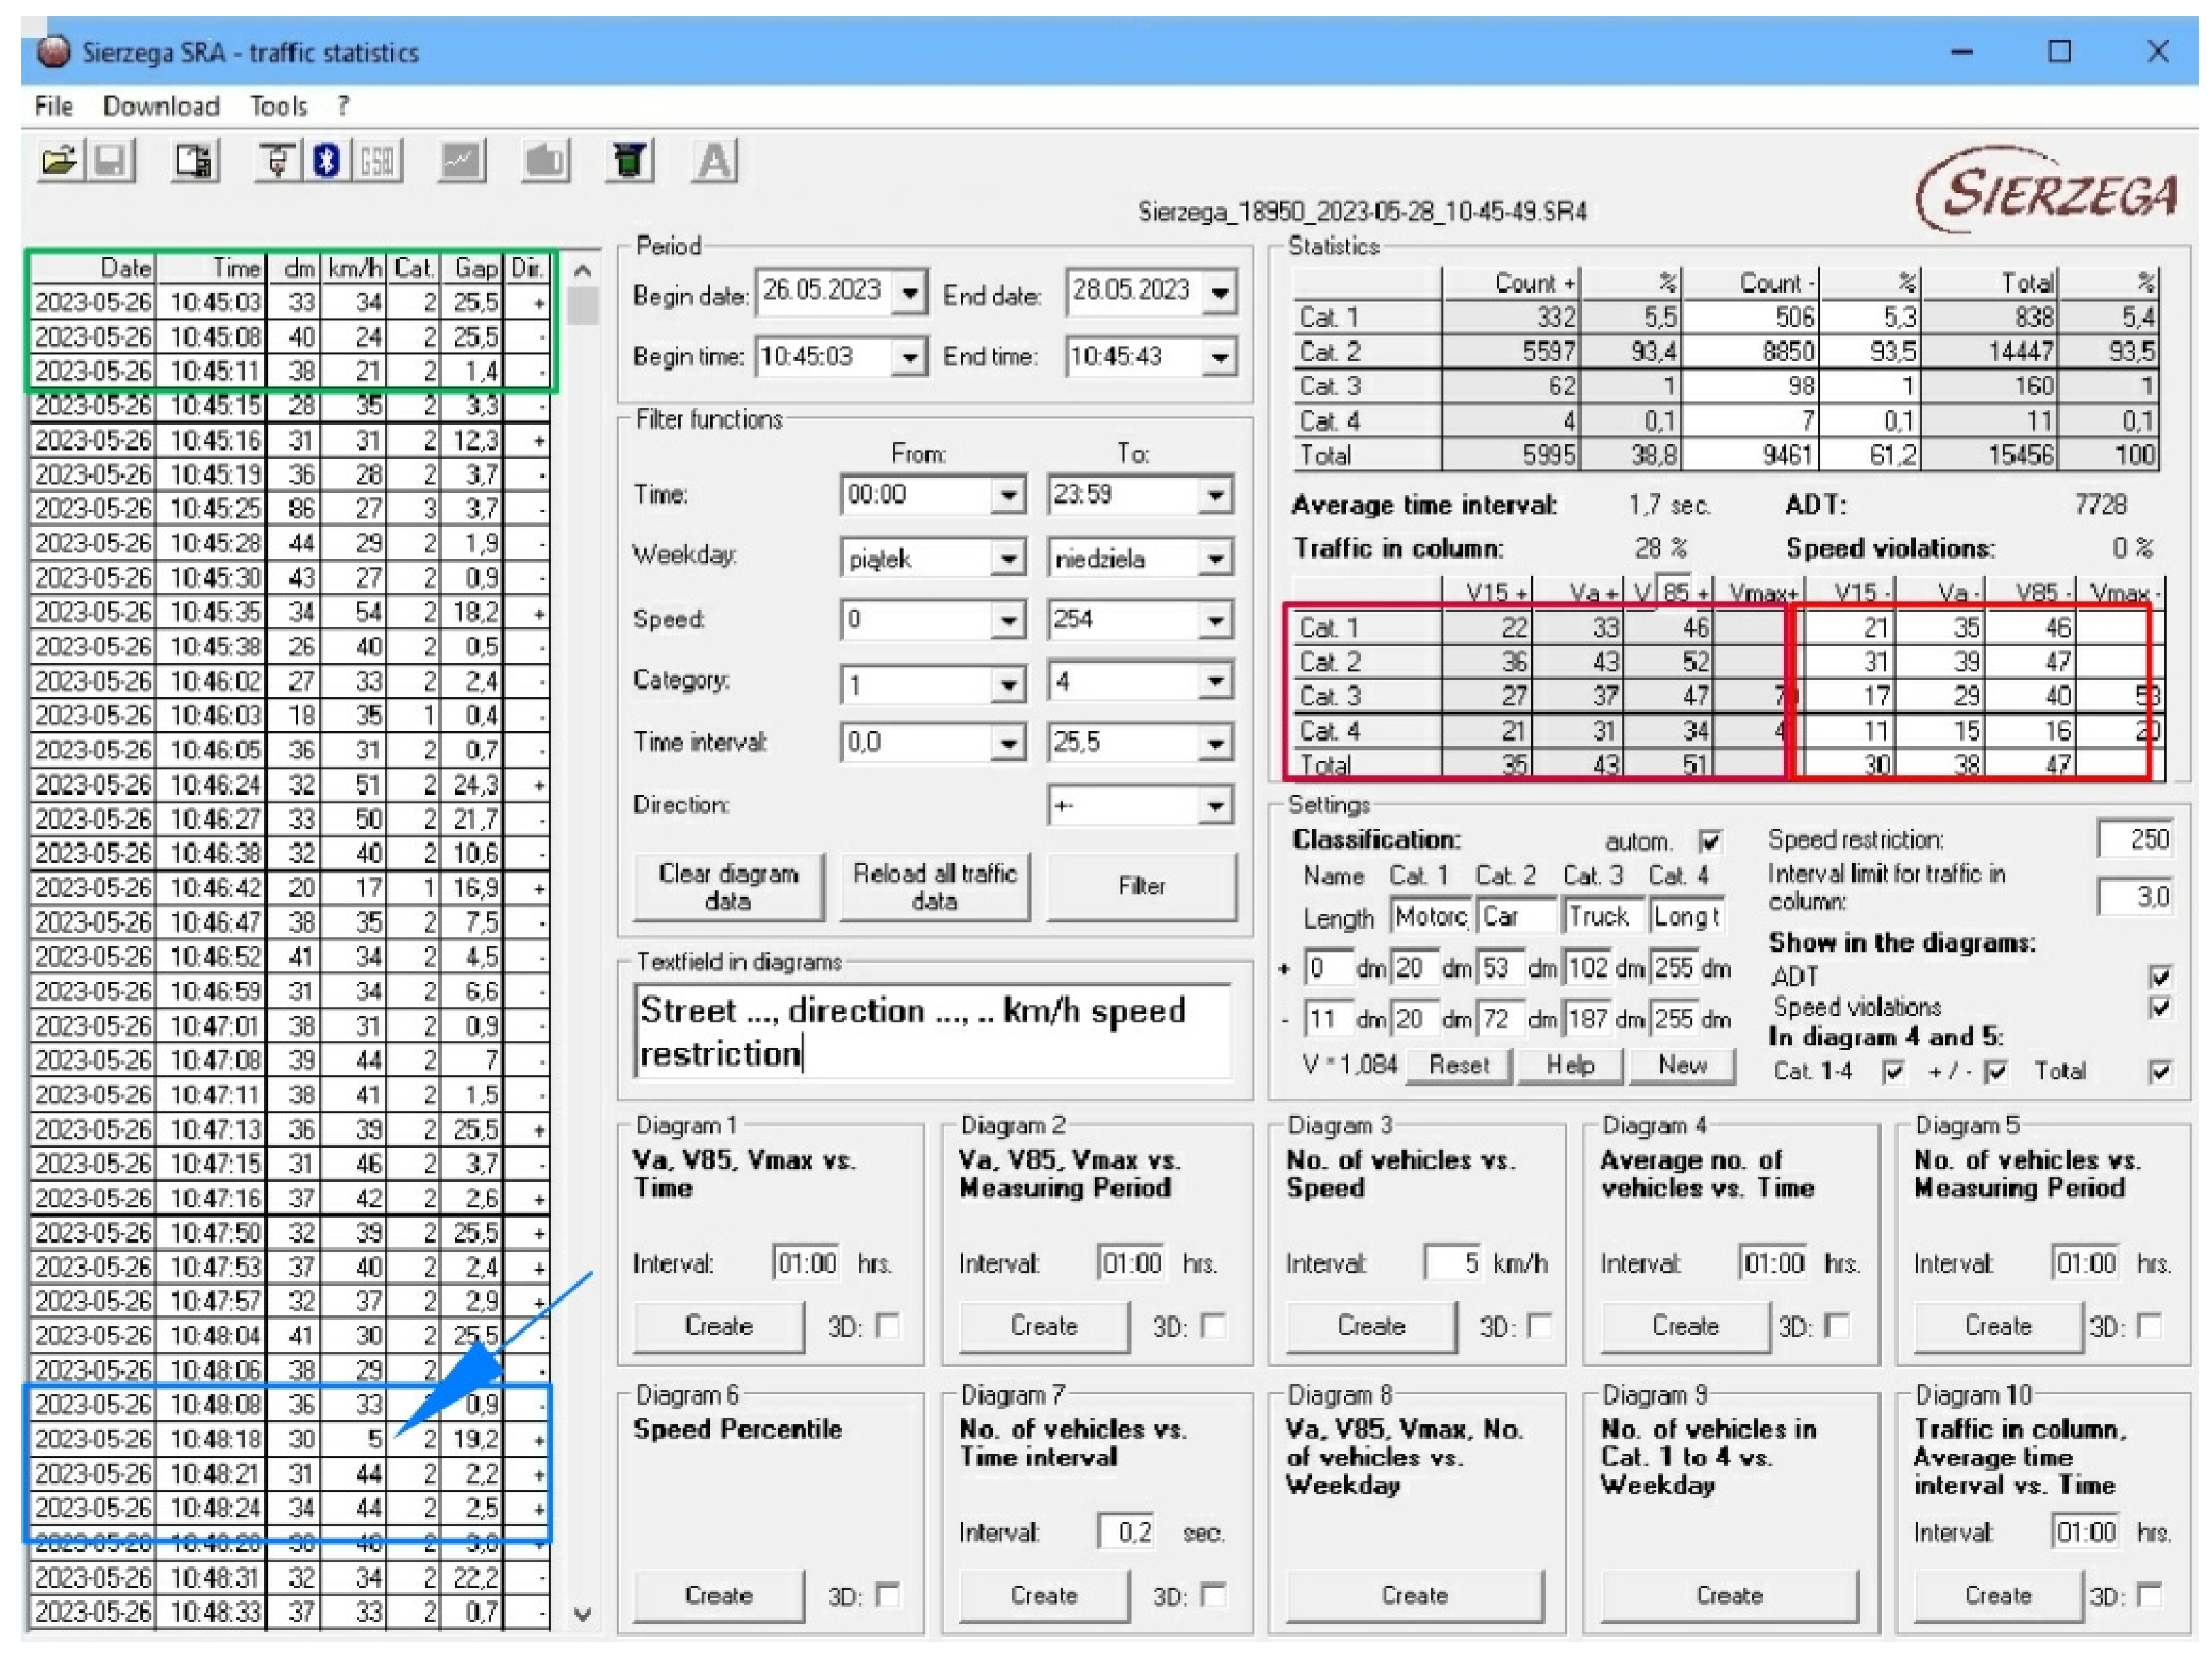
- 60. Speed displays traffic detection, Radar, Detection, Software, 2015.
- Sobczyńska, D. , Art of Experimental Research, habilitation monograph, Scientific Papers of the Philosophy and Logic, series No. 71 Scientific Publishing House UAM, Poznań, Poland, 1993.
- Roess, R.P. ,Prassas, E.S., McShane W.,R. Traffic Engineering, Fourth Edition, Pearson Higher Education, London, UK, 2018.
- Taylor, J.R. An introduction to error analysis, 6 ed, Scientific Publishing House, Warszawa, Poland 2022.
- Ziółkowski, R. Zachowania kierowców pojazdów w otoczeniu środków uspokojenia ruchu w warunkach miejskich, doctoral dissertation, Politechnika Białostocka, Białystok, Poland, 2022. Available online: https://pb.edu.pl/oficyna-wydawnicza/wp-content/uploads/sites/4/2022/10/Zachowania-kierowcow-pojazdow-w-otoczeniu-srodkow-uspokojenia-ruchu-w-warunkach-miejskich.pdf accessed on ). 2 August.
- Daniel, B.D.; Nicholson, A.; Koorey, G. Investigating speed patterns and estimating speed on traffic-calmed streets, IPENZ Transportation Group Conference, Auckland, 27 March 2011. Available online: https://www.researchgate.net/publication/267370096_INVESTIGATING_SPEED_PATTERNS_AND_ESTIMATING_SPEED_ON_TRAFFIC-CALMED_STREETS (accessed on 30 November 2022).
- Alavi, S.H. Analyzing raised crosswalks dimensions influence on speed reduction in urban streets. In Proceedings of the 3rd Urban Street Symposium, Seattle, WA, USA, 24–27 June 2007. Available online: https://www.researchgate.net/publication/273687736_Pedestrian_RPC_Influence_on_Speed_Reduction (accessed on 1 December 2015); Available online: https://www.researchgate.net/publication/273687736_Pedestrian_RPC_Influence_on_Speed_Reduction (accessed on 1 December 2015).
- Domenichini, L.; Branzi, V.; Meocci, M. Virtual testing of speed reduction schemes on urban collector roads. Accident Analysis & Prevention. [CrossRef]
- Jorgensen, M.; Agerholm, N.; Lahrmann, H.; Araghi, B. Driving Speed on Throughfares in Minor. Towns in Denmark; Aalborg University: Aalborg Ost, Denmark, 2014; Available online: https://www.ictct.net/wp-content/uploads/26-Maribor-2013/26-Agerholm-Full-paper.pdf (accessed on 19 November 2015).
- Kang, B. Identifying street design elements associated with vehicle-to-pedestrian collision reduction at intersections in New York City. Accid Anal Prev, 0: 122. [CrossRef]
- Jamroz, K.; Gumińska, L.; Mackun, T.; Rychlewska, J. Widoczność na przejściach dla pieszych, Drogownictwo 2015, 4-5: 142–149. Available online: https://www.researchgate.net/publication/352121417_Widocznosc_na_przejsciach_dla_pieszych (accessed on 2 August 2023).
- Jamroz, K.; Kempa, J.; Rychlewska, J.; Mackun, T.; Metoda wyznaczania obszaru dobrej widoczności na przejściach dla pieszych w Polsce. Transport Miejski i Regionalny 2015. 4: 10–21. Available online: http://yadda.icm.edu.pl/baztech/element/bwmeta1.element.baztech-42c6a790-a9b5-4ff0-9171-13d47b93c747 (accessed on 18 August 2023).
- Das Land Kärnten: Abteilung 7. Kompetenzzentrum Wirtschaftsrecht und Infrastruktur Richtlinie. Grundlagen für die Anordnung eines Schutzweges. 2013. Available online: https://docplayer.org/64254869-Richtlinie-grundlagen-fuer-die-anordnung-eines-schutzweges.html (accessed on 18 August 2023).
- Antoine, D.; Janssens, I.; Chevalier, N.; Dullaert, I.; Trussart, S.; Blanquet, D.; Delbart, E. Visibilité et Sécurité des abords d’écoles, Dirk DE SMET, Directeur général DGO1, Namur, Belgium, 2011. Available online: https://rue-avenir.ch/wp-content/uploads/files/resources/Securite-abords-ecoles-Wallonie.pdf (accessed on 18 August 2023).
- Liu, C.; Wang, W. Integrating Visibility, Parking Restriction, and Driver’s Field View for Enhancing Pedestrian Crossing Safety. International Journal of Transportation Science and Technology. [CrossRef]
- KfV, Leitfaden für die Anlage von Schutzwegen und sonstigen Fußgängerquerungsstellen, Kuratorium für Verkehrs, LF/Schutzweg/V02, Land Oberösterreich 2006. Available online: https://www.tirol.gv.at/fileadmin/themen/verkehr/service/downloads/lf_schutzweg_v02end.pdf (accessed on 2 August 2023).
- Høye, A.; Mosslemi, M. Fartsdempende tiltak i gangfelt – eksempler og erfaringer, TØI rapport 1033/2009, Transportøkonomisk Institutt, Oslo 2009. Available online: https://www.toi.no/getfile.php?mmfileid=16942 (accessed on 2 August 2023).
- Fressancourt, M. Une limitation de la vitesse pour un meilleur partage de la route…, AQTr 21.06.2011. Available online: https://aqtr.com/association/actualites/limitation-vitesse-meilleur-partage-route (accessed on 3 August 2023).
- How to calculate stopping distances! Available online:. Available online: https://www.drivingcrawley.co.uk/blog/how-to-calculate-stopping-distances (accessed on 3 August 2023).
- Stopping Distances and The Theory Test 2018, Available online:. Available online: https://driving-test-success.myshopify.com/pages/stopping-distances-and-the-theory-test (accessed on 3 August 2023).
- What is stopping distance? Available online:. Available online: https://www.reddrivingschool.com/stopping-distances/ (accessed on 3 August 2023).
- Everything you need to know about vehicle stopping distances, Available online:. Available online: https://www.unicominsurance.com/insurance-news/everything-you-need-to-know-about-vehicle-stopping-distances (accessed on 3 August 2023).


| Years | Traffic accidents in general | Pedestrian accidents |
|---|---|---|
| Before data: 2000.01.01–2015.12.31 | 27 | 6 |
| After data: 2016.01.01–2023.05.31 | 6 | 1 |
| The Chi-square significance test χ2 was used to confirm or refute the efficacy of a given TCM and the resulting traffic safety improvement. Null hypothesis H0: χ2 = (n1 t2 − n2 t1)2/(t1 t2 (n1 + n2))1 ≤ χα2; (no statistically significant difference exists). Alternative hypothesis H1: χ2 > χα2; (a statistically significant difference does exist).The following inequation should be satisfied at the same time: n1/t1 > n2/t2.Critical value χα2 = 3.84 at the significance level α = 0.05. | ||
| χ2 = | 3.0 < 3.84 | 1.0 < 3.84 |
| n1/t1 > n2/t2 | 1.7 > 0.8 | 0.38 > 0.13 |
| No. | Traffic volume, veh/h | Traffic flow directions | |||||||
|---|---|---|---|---|---|---|---|---|---|
| Before measurement data | After measurement data | ||||||||
| W→E | E→W | W→E | E→W | W→E | E→W | W→E | E→W | ||
| Test K-S1 | Median test 2 | Test K–S1 | Median test2 | ||||||
| 1 | N ≤ 50 & 50 < N ≤ 100 | 9.8 | 12.4 | 120.3 | 1392.4 | 14.3 | 15.6 | 2469.4 | 1544.9 |
| 2 | 50 < N ≤ 100 & 100 < N ≤ 150 | 12.1 | 13.5 | 1737.1 | 308.2 | 17.9 | 17.4 | 2344.7 | 3113.2 |
| 3 | 100 < N ≤ 150 & 150 < N ≤ 200 | 20.4 | 11.9 | 16893.3 | 189.6 | 16.9 | 20.9 | 1744.0 | 7370.2 |
| 4 | 150 < N ≤ 200 & 200 < N ≤ 250 | 24.6 | – | 7490.0 | – | 17.3 | 25.4 | 2735.2 | 16035.3 |
| 5 | 200 < N ≤ 250 & 250 < N ≤ 300 | – | – | – | – | 19.6 | 23.8 | 4905.4 | 5532.8 |
| 6 | 250 < N ≤ 300 & 300 < N ≤ 350 | – | – | – | – | 24.2 | 19.3 | 26238.0 | 2549.3 |
| 7 | 300 < N ≤ 350 & 350 < N ≤ 400 | – | – | – | – | 33.8 | – | 56117.9 | – |
| 8 | 350 < N ≤ 400 & 400 < N ≤ 450 | – | – | – | – | 32.2 | – | 21759.6 | – |
| Determinants | Scores given to the study sections | |||||
|---|---|---|---|---|---|---|
| WE1 | WE2 | WE3 | EW1 | EW2 | EW3 | |
| Free view | 1 | 0.5 | 1 | 0 | 0.5 | 0 |
| Side obstruction in the travel lane past the refuge island | 1 | 0 | 0.5 | 0 | 0 | 0 |
| Lack of visibility of a pedestrian on the right hand side of the island | 1 | 0 | 0 | 0 | 1 | 1 |
| Lack of visibility of the road surface past the junction | 0 | 0 | 0.5 | 0 | 0 | 0.5 |
| Painted taper applied on the section | 1 | 1 | 0.5 | 0 | 1 | 0 |
| Left hand curve in the junction | 0 | 0 | 0.5 | 0 | 0 | 0 |
| Parking configuration changed from diagonal to parallel | 0 | 1 | 0 | 0 | 1 | 0 |
| Parking configuration changed from parallel to diagonal | 1 | 0 | 0 | 0 | 0 | 1 |
| Apparent carriageway narrowing past the junction | 0 | 0 | 0.5 | 0.5 | 0 | 0 |
| Total quantification measure scores: | 5 | 2.5 | 3.5 | 0.5 | 3.5 | 2.5 |
Disclaimer/Publisher’s Note: The statements, opinions and data contained in all publications are solely those of the individual author(s) and contributor(s) and not of MDPI and/or the editor(s). MDPI and/or the editor(s) disclaim responsibility for any injury to people or property resulting from any ideas, methods, instructions or products referred to in the content. |
© 2023 by the authors. Licensee MDPI, Basel, Switzerland. This article is an open access article distributed under the terms and conditions of the Creative Commons Attribution (CC BY) license (http://creativecommons.org/licenses/by/4.0/).


