
Submitted:
15 September 2023
Posted:
18 September 2023
You are already at the latest version
Abstract
Due to a shortage of funding and other market challenges, Small and Medium-sized Enterprises (SMEs) have a tough time adopting new technologies. Numerous technological obstacles nega-tively impact the long-term commercial achievement of SMEs. The deployment of Industry 4.0 might resolve several technological challenges. A sustainable city is a difficult structure whose economical, societal, and ecological components interact and compete with one another. There is a dearth of actual methodologies for measuring interaction. The objective of Industry 4.0 is to obtain a better degree of performance effectiveness and profitability, and greater automation. Conse-quently, the purpose of the research is to determine the influence of Industry 4.0 in fostering economic efficiency in small and medium enterprises' sustainability. A Sustainable City using Multi-Criteria Decision Making (SC-MCDM) system is designed in this research to test and achieve sustainable developmental goals. This paper then gives a technique for calculating the interaction between various standards, such as static interactions and dynamical pattern resemblance, as well as the weight variables of every indication generated by the connection. Furthermore, the ap-plication of the suggested technique is proved by assessing the sustainable development goals of twelve Chinese cities within the Triple Bottom Line (TBL) paradigm. From a geographic-temporal viewpoint, spatial variations in city sustainability reveal regional inequalities in sustainability. Indicator scores suggest that the lack of research spending, falling financing in stationary assets, shortage of financial development, and inadequate shared transit are the most significant limiting factors for most communities. Furthermore, the growth of tertiary industries, the improvement of energy performance, the expansion of green areas, and the reduction of pollution emissions are the key driving forces for enhancing sustainability. Compared to other methodologies, Multi-Criteria Decision Making (MCDM) considers the interplay between conditions, which is an excellent way to assess the sustainability of a city. The experimental findings show the impact of MCDM and sustainability to achieve sustainable development goals.
Keywords:
Sustainable Developmental Goal
; Sustainable City
; Industry 4.0
; Multi-Criteria Decision Making
1. Introduction to sustainable city and industry 4.0
Sustainable cities play a critical role in strategically sustainable development; thus, they have assumed a prominent role in implementing this concept and this rhetoric. This is represented clearly in Sustainable Development Goal 11 of the 2030 Plan of the United Nations, which seeks to make cities more sustainable, adaptable, accessible, and safe [1]. Modernism has been dominated by the concept of sustainable cities for more than three decades. Many players are active in the scientific and practical elements of "sustainable cities," including builders and designers, green technologies experts, built and global ecosystems experts, environmental and social academics, software engineers, data analysts, and urban researchers [2]. All these players do research and devise strategies and initiatives to address the difficult aspects of sustainable urbanization. This contributes to the work of legislators and political decision-makers in the formulation and implementation of regulatory processes as well as the design and application of ideological processes and effective governance to advertise and stimulate innovation as well as supervise and preserve progress in sustainable communities [3].
Industry 4.0 seeks to obtain a superior degree of performance effectiveness and production, and a greater level of automation [4]. It has a strong link with performance since it shows a crucial role in the production and service industries. Numerous aspects of Industry 4.0 are heavily intertwined with internet technology and progressive analytics. In manufacturing, they state that Industry 4.0 is one of the technological techniques for value addition and efficient knowledge administration practices.
Despite the vast research on Industry 4.0, a systematic and exhaustive evaluation of the study is lacking [5]. Accordingly, this research provides a methodology using Industry 4.0 and discusses the implications of this fourth industrial revolution for SMS [6]. It describes how Industry 4.0 may help SMEs overcome a variety of technical obstacles and boost their long-term company success.
From a larger viewpoint, the evaluation of a sustainable city may be seen as an MCDM issue [7]. The construction of an evaluation system, selection of a weighting technique, and determination of the aggregating operators are the three primary phases in the MCDM procedure for assessing the sustainability of a city. Widely, an index system including economical, societal, and ecological factors (Triple Bottom Line (TBL)) is used to obtain sustainable developmental activities. The weighing system was calculated using the Analytical Hierarchy Procedure (AHP) [8], the Entropy Methodology [9], the DEMATEL Methodology [10], TOPSIS [11], and the Coefficient-Variation Mechanism (CVM) [12].
MCDM concludes with the identification of the aggregating operator. Numerous operators have been created to accumulate criteria and related weights, including Ordered Weighted Aggregating (OWA) [13], Induction Ordering Weighted Aggregating (IOWA) [14], Dense Weighted Aggregating (DWA) [15], and Intuitionistic Fuzzy Weighted Geometrical Aggregating (IFWGA) [16]. In this regard, any MCDM may be utilized to combine all indications with various units in an acceptable manner. Furthermore, many studies overstate the MCDM issue by assuming that markers are independent of one another and ignoring these interdependencies. The assessment findings must be skewed if the interaction is significant.
Compared to existing material, this study makes three significant additions. Firstly, it gives actual evidence of the assessment of city sustainability for a particular instance, focusing on the interplay between criteria. Secondly, it adds to the theoretical approach in the absence of verified techniques for measuring the interaction between criteria, particularly dynamic trend similarities. Thirdly, it offers policymakers academic consequences about the use of assessment to enhance environmental sustainability. For this reason, the research includes the relationship between criteria in the technique used to determine the scoring when evaluating the sustainability of a city.
The remaining parts of the article are laid out in the following fashion: In part 2, we will discuss the historical context of the sustainable city as well as its long-term objectives. Within this part, the Sustainable City using Multi-Criteria Decision Making (SC-MCDM) system that has been presented is constructed and theoretically proved. In the fourth section, the findings of the experiments and the system's effects are shown graphically. The discussion of the results and the conclusion may be found in Section 5.
2. Background to the sustainable city and its long-term objectives
Sustainability in whatever form may assist in developing ideal circumstances for addressing corporate and environmental concerns of the 21st century, among many others. When it comes to its administration, planning, construction, evolution, and administration within the framework of sustainability, sustainable cities face a variety of problems, conflicts, and obstacles (i.e., shortcomings, restrictions, problems, misconceptions, and ambiguities).
This article examined each ingredient required for a sustainable, functioning city [17]. The system followed a straightforward strategy, elucidating each sustainability concept, emphasizing its underlying principles, and elaborating on why it is an essential choice for city planning. The system evaluated the present sustainable cities by providing justifications for their advantages and descriptions of their weaknesses.
This report assesses 28 European capital cities according to their intelligence and sustainability [18]. The research synthesized 32 parameters into 4 elements using the clustering technique and Principal Component Analysis (PCA) and then generated ranking ratings. Depending on this ranking value, European capital cities were ranked. These data assist cities in understanding their position relative to other cities, allowing politicians to discover places for improvements while capitalizing on areas of strength.
A systematic technique for assessing urban sustainability in developing nations is offered [19]. Using Iraq as a test case, a stakeholder-driven structural technique that discovers and evaluates context-relevant signals and sets weights for collecting indication values by using an Analytic Hierarchical Process (AHP) is provided. The system is anticipated to show an important role in promoting the durability of the constructed landscape.
This study offers a critical analysis of the advantages of trees [20]. By eliminating air pollution, decreasing stress, increasing physical exercise, and fostering social relationships and communities, trees enhance health and social well-being. While urban weather conditions are rising, trees may mitigate urban warming. They offer animals a home and nourishment. Lastly, trees are essential to storm water management and green architecture.
The suggested approach for sustainability evaluation integrates building information modeling and energy simulation modeling [21]. The entire process of evaluating sustainability is based on explicit mathematical methodologies and user-friendliness. The findings demonstrated that the suggested method could indicate regional deviations via the created multiple-level weight structure.
A revolutionary smart city platform design is offered [22]. Regarding the queue length, testable theories are gathered and examined in terms of efficiency metrics including power consumption, battery lifespan, latency, variance, and Packet Loss Ratios (PLR).
The research investigates green building evaluation tools from a social standpoint [23]. Consequently, the aim of this study is to construct a system of social criteria, backed by classifications and metrics, for evaluating sustainable growth in structures. The suggested framework was combined with the current green construction analysis tool to enhance the appraisal of sustainable buildings in the pursuit of achieving growth in the constructed landscape.
This paper provides a dependable smart city resource delivery system at the platform's edge [24]. To improve the accessibility, stability, and protection of smart city systems, the solution employs a collaborative method including dispersed network edges and private mediation nodes, with the assistance of intrusion detection technology.
This research evaluates the sustainable city facilities being created by the Korean National Strategy Smart Project (NSSP) against those provided in 15 towns in Australia, and London [25]. The use of 5G telecommunications technology and the development of its information format define the NSSP services. In recent times, smart city plans have included not only steps to make cities sustainable but also actions to create promising industrial regions, which need collaboration between publicly available and construction technologies.
This paper examines how to construct citizen- and resource-centric stronger cities relying on current Smart City (SC) growth activities, including proven use examples, future SC planning processes, and several additional SC application development services [26]. SC's primary characteristics are presented in the context of current technological progress, specific municipal needs, and dynamics. This approach is intended to be implemented into real-world SC developmental initiatives.
When formulating hypothetical outcomes and methods to attain them, sustainable cities look farther ahead. Environment, Information and Communication Technology (ICT), and urbanization are three major components or macro-shifts that are rapidly reshaping society and driving the push toward a long-term perspective. Realizing a connection between these developments, sustainable cities throughout the world have established far-reaching objectives and devised various strategies to attain them.
2.1. Gap Analysis and Contribution of the Paper
2.1.1. Gap Analysis
The present study exposes an imbalance in current methods of urban planning by drawing attention to the fact that the several sectors required for sustainable urban expansion, such as energy, transportation, and waste management, are rarely coordinated with one another. The research additionally emphasizes the importance of making judgments in urban development based on objective criteria as opposed to subjective beliefs.
2.1.2. Contribution of the Paper
-The research presents a framework to achieve sustainable urban development by integrating Industry 4.0 technologies with MCDM techniques.
-To aid in making decisions that are in line with the SDGs, the suggested framework takes into account numerous criteria, including environmental effect, economic feasibility, and social equality.
-The framework fills a void in present urban development methods, where there is frequently a lack of integration between the many sectors involved in sustainable urban development, by permitting a more data-driven and integrated approach to such development.
3. Proposed Sustainable City using Multi-Criteria Decision-Making system
This study focuses on the three primary components of Industry 4.0, namely Big Data (BD), Information Technology (IT), and Smart Factories (SF). All these characteristics have a substantial relationship with the manufacturing and operations of SMEs and boost their success. It branches such as BD, the Internet of Things (IoT), and intelligent manufacturing unit may help SMEs overcome technical obstacles, enhancing their long-term commercial success.
The sustainable industry 4.0 structure is shown in Figure 1. It demonstrates that five aspects of Industry 4.0 have a substantial influence on manufacturing and operations. Production and activities have a substantial impact on the success of the production services. This demonstrates that it improves the effectiveness of the industrial operations. The literature demonstrates that it has a favorable effect on manufacturing and operations and improves efficiency.
The paper's Sustainable City Multi-Criteria Decision Making (SC-MCDM) framework provides a decision-making framework that takes sustainability criteria into account when implementing Industry 4.0 technologies in manufacturing and operations, and thus is related to the Sustainable Industry 4.0 structure in Figure 1.
Specifically, as shown in the Sustainability Assessment block of Figure 1, the SC-MCDM framework can be used to assess and select Industry 4.0 technologies and solutions that are in line with sustainability goals. To aid in making decisions that are in line with the SDGs, the framework takes into account several variables, such as environmental effect, economic feasibility, and social equality. There is congruence between this and the Sustainability Goals section of Figure 1.
Together, government agencies, private businesses, and non-profits can use the SC-MCDM framework to build cities that are more sustainable and resilient. This is in line with the Collaboration section of Figure 1, which stresses the need for cooperation between different groups for a sustainable Industry 4.0.
By offering a decision-making framework that takes sustainability goals and stakeholder engagement into account, the SC-MCDM framework suggested in this paper can be considered as a tool for operationalizing the Sustainable Industry 4.0 structure in Figure 1.
3.1. Evaluation process
The primary objective is to offer a technique for calculating the inactivity between criteria by combining static interactions and dynamical trend similarities. In addition, this methodology was used to evaluate the sustainability initiatives of 1w towns in China during the previous five years. This study's assessment procedure includes data standardization, a weighting scheme, and an aggregation operation. In the meantime, the weighting scheme is determined by the Orness assessments resulting from the interplay of numerous criteria. In addition, the IOWA operation is used as the aggregating technique. to explain the assessment method, while the major steps are detailed below.
3.2. Selection criteria
The absence of a clear definition, and the vagueness of certain of its aspects, there are currently no standard indications for developing the city sustainability criterion system. However, the TBL incorporates economical, societal, and ecological components, and is commonly acknowledged for evaluating the sustainability of a city. To pick indicators for the construction of the criterion framework, the variables utilized in this study must satisfy the conditions: (1) Measures have an immediate or indirect link with urban sustainability; (2) they may designate distinct economical, societal, and ecological properties; and (3) data are available and quantifiable. Due to data limitations, 21 variables were derived from statistical handbooks. These 21 indications were chosen to provide a balance among the depth and breadth of this study and to cover all the method's subject areas.
C(1,1) and C(1,2) were chosen to represent the economic expansion and advanced level of independent cities as one of the requirements for financial stability. C(1,3) accurately reflects the advancement of the service sector; C(1,4) reveals the town's level of financial openness; C(1,5) was chosen to reveal the city's financial system's capabilities of expanding procreation; C(1,6) demonstrates the city's level of innovation assistance; and C(1,7) reveals the state of employment and labor. Regarding social sustainability, C(2,1) symbolizes the rate of population expansion within a city; C (2,2) was chosen to represent the schooling support of an autonomous community. C (2,3) and C (2,4) depict the current state of healthcare centers and doctors in the city; C (2,5) and C (2,6) depict the degree of sociocultural connectivity; and C (2,7) show the present system of social health coverage. C(3,1) and C(3,2) were chosen for the ecological sustainability stage to represent the scenario of vegetation spaces within a city; C(3,3) must reflect the utilization productivity of manufacturing wastes; C(3,4), C(3,5), and C(3,6) accurately depict the discharge quality of wastewater, air demography, and dust emissions generated by commercial advancement; and C(3,7) reveals the power effectiveness of a city.
3.3. Weighting and aggregation methods
This condition must be considered since existing anomalies in the criterion often impact evaluation findings. Let represent the beginning information of the substitute x for indication y in the year t, when, n is the number of sustainable towns assessed,, m is the number of markers assessed, and is the number of years examined. The research used Equation (1) in situations where the greater the criteria value, the greater the outcome (or indication of advantage).
The normalized indicator x data for substitute y in the given year t is represented by. The highest and lowest values for marker x over all years t are and, respectively, where and. Take note that. In circumstances where the smaller the criteria value, the higher the outcome (or cost indication), the system used Equation (2).
Considering that the IOWA operation might indicate a preference, it chose to combine the standard information. Assume reflect the alternative's assessment value in the period t. A translation that such and is described as an IOWA operation of dimensions m with an accompanying weighted vector. The output function is shown in Equation (3).
Where is the order-inducing component resulting from the combination of criteria for indication y and is the weighted factor of the indication with the yth longest ordering parameter. The input data is denoted.
The IOWA process of the proposed system is shown in Figure 2. It has a weighting system and aggregation operator. The data from the source are computed using IOWA and the results are evaluated and plotted. Calculating the interaction between the conditions of indication y and each other yields the order-inducing parameter . This research distinguished between static connections and dynamical trend similarities in terms of interaction. The stationary interactions among criteria are described as the length between a criterion and a substitute in year t. The dynamical trend similarities are described as the resemblance of alternatives that changes as a tendency over time.
When making a decision based on many criteria, it can be helpful to take into account the criteria's static link to one another, like in SC-MCDM (Stationary link-based many Criteria Decision Making). The suggested approach employs the inverse Hamming value between parameters to determine the static connection.
Figure 2 depicts the IOWA method, which uses a weighting system and an aggregation operator to compute the source data. Using this information, we can determine the order-inducing parameter, which stands in for the relationship between the y-indicator conditions.
In SC-MCDM, the distance between a criterion and its substitute in year t describes the static links between the criteria. This means that the distance between criteria is employed to establish the relative weight of each factor. The inverse Hamming value between each parameter a measure of the distance or dissimilarity between the criteria is then used to determine the static connection.
Because of this shared emphasis on computing the interaction and importance of criteria in the decision-making process, the IOWA method and SC-MCDM are closely related. SC-MCDM employs the distance between criteria and their substitutes in year t, whereas the IOWA process uses the order-inducing parameter. Both strategies intend to offer a methodical and impartial approach to decision-making that takes into account a variety of factors.
The static connection is then computed using the inverse of the Hamming value between each parameter. This circumstance is expressed in Equation (4).
When represents the static interactions of the substitute x for criteria y in the year t and is greater than zero, the static interactions (m) are superior. The dynamical trend similarity is denoted as are determined using Grey Grid Interaction Modeling (GGIM). The normalized indicator is denoted The dynamical condition is determined by Equations (5) and (6).
reflect the trend modification of criteria u for alternative x, and criteria y for alternative x, while indicates the sign function, i.e., if, the,; . The dynamical trend similarities between option x and criteria y are denoted by . Clearly, as approaches, the pattern of condition x similarity among all standards is increasing over the period. The total samples denoted T, and the dimension is denoted n. The first order differentiation is denoted, and the second order differentiation is denoted . The ordering factor is, essentially the interactions between numerous criteria, is then calculated by Equation (7).
The static indicator is denoted . The total samples denoted T, and the dimension is denoted n. The exponential constant is. The dynamical trend similarity among option x and option y is denoted. If is the weighted array in decreasing order inspired by their triggering parameters is denoted as, and . The weight function is denoted in Equation (8).
The exponential constant is denoted , and the decision-making function is denoted . f(.) > 0 if f(.) is an emotional character variable that reflects the decision maker's desire for interactivity among criteria. Specifically, the system defines it as the exponential constant (), . Since the system gives more priority to those with greater engagement, . Yager's Orness variable is determined as y is used to show the preferences of interacting among variables, such as Orness. The Orness variable is shown in Equation (9).
The exponential factor is denoted , and the total sample size is denoted m. The decision making function is denoted. The bigger values of O(w) indicate that the MCDM provides a weighted factor to the larger connection criteria (). Smaller values of O(w) imply collected scenarios in which the decision maker (m) prioritizes the interactions as determined as k with the smallest magnitude (y). All the variables and its meaning are shown below:
3.4. Multi-criteria decision-making analysis
Using the SC-MCDM approach, the previous section's framework was then analyzed. By the SC-MCDM technique, professionals were entrusted wit evaluating the facilitation of the big group and that of the subgroups. It was possible that the professionals would be unable to eliminate ambiguity and cope with uncertainty during the pair-wise comparisons phase.
Instead of providing a specific number for a comparison between the two capabilities, a range was supplied. Described here is the method for performing the SC-MCDM.
Step 1: This procedure included completing the circumstances that were to be addressed for problem-solving. In this case, a set of criteria () was used to choose among available alternatives.
Step 2: Assignment of the best and worst criteria: This phase included assigning the Best and Worst parameters to the Primary Group and all its Subgroups. The primary groups are shown in Equations (10a) and (10b).
The best and worst criteria are shown as .
Step 3: In establishing the paired assessments, a range rather than a specific number was supplied. For instance, the relationship between enablers Y and W was provided as a range between 2.4 and 3.6. Consequently, an optimal value within this region was determined rather than a fixed number.
Step 4: Identifying the optimal option: The approach was used to discover the optimal solution for the given situation.
This method guaranteed the preservation of ambiguity and assisted decision-makers and operators in predicting the most favorable impact values of sustainable adoption facilitators.
Flow chart diagram
The above flowchart Figure 3 describes that Multiple-criteria decision making (MCDM) involves weighing potential courses of action using a number of different standards. There are a number of steps involved, some of which may be:
-The process of determining the issue at hand or the choice that must be made
-Specifying the standards or benchmarks against which the review will be conducted
-Placing a weight on each of the criteria to show how important they are in comparison to the others
-Consider each potential option and assign a rating or score to it based on each of the criteria.
-Compiling all of the marks or ratings into a single total in order to produce an overall rating for each option
In this paper, the researchers use MCDM to evaluate the sustainability of twelve Chinese cities using the Triple Bottom Line (TBL) framework. The MCDM system was developed to determine how different criteria interact with one another and then construct weight variables for each indicator based on the results of those calculations. After determining the primary driving forces and limiting variables for sustainability, the researchers rated each city's sustainability using the MCDM approach.
The research concludes that MCDM has great promise as a method for evaluating urban sustainability and for realizing sustainable development objectives. MCDM facilitates a more thorough and coordinated assessment of many criteria, which might reveal interactions between factors and rank measures for enhancing sustainability.
4. Experimental findings and analysis
Experimental Setup and Environment:
-The research methodology employed in this study entailed an examination of the sustainability of a dozen urban centers through the application of the Triple Bottom Line framework, which was evaluated based on a set of 21 distinct criteria.
-The analysis was conducted using a laptop computer that was equipped with an octa-core processors, 16GB memory, and a solid-state driver.
-The experimental setup employed software tools such as MATLAB version 2021b and Python version 3.9.
-The database utilized for analysis encompassed a range of sustainability criteria metrics, including but not limited to energy consumption, releases of greenhouse gases, waste management measurements, social equity indexes and economic efficiency measurements.
-The data was obtained from credible sources, including official government reports and global databases, and underwent preprocessing to facilitate subsequent analysis.
Reasons for Using MATLAB and Experimental Setup:
-The choosing of MATLAB as the software of choice was based on its robust functionality in the fields of data analysis, modeling, and optimization. This made it a suitable candidate for managing the intricate computations required for MCDM.
-Using MATLAB's inherent matrix functioning and optimizing functions enabled the proficient tampering and analysis of the extensive database.
-Python was employed for specific tasks, such as data preparation and representation, owing to its versatility, extensive libraries, and user-friendly nature.
-The laptop's configuration was deemed adequate in terms of processing power as well as memory.
-The utilization of selected software tools and testing arrangement facilitated a thorough assessment of the environmental performance of the cities, considering various factors. This approach enabled well-informed decision-making and inter-city comparisons.
It is possible to implement MCDM systems with a wide variety of software tools and programming languages; this choice is made in response to the particular requirements of the project. MATLAB is an instance of a software package that is frequently utilized for MCDM. It is possible for the hardware requirements for MCDM systems to change depending on the size and complexity of the problem that is being studied; nonetheless, in most cases, MCDM systems require a computer with appropriate processing power and memory.
Since it offers a wide variety of tools and capabilities for data analysis, modeling, and simulation, MATLAB has become one of the most widely used software packages for Multi-Criteria Decision Making (MCDM). Because of the intuitive design of the software's interface and the comprehensive nature of its accompanying documentation, it may be utilized by users with varied degrees of prior programming knowledge.
MATLAB's capacity to manage enormous data sets and intricate calculations is one of the primary reasons why MCDM practitioners choose to work with this software. Because it has built-in functions for matrix operations and optimization, the software is ideally suited for modeling and addressing multi-criteria decision making (MCDM) problems that involve a number of different criteria and options.
The Triple Bottom Line (TBL) is a widely employed method of evaluating sustainability that considers all three aspects, namely social, ecological, and financial. Within the context of urban sustainability analysis, the TBL structure affords a thorough assessment of cities' efficacy in relation to the economic, social, and environmental dimensions. To carry out the analysis, a total of 21 distinct criteria were chosen to accurately reflect diverse facets of sustainability across all dimensions of the Triple Bottom Line. Possible indicators that could be considered as criteria are:
-The social dimension encompasses various factors such as access to medical care, education, fairness in society, and the incidence of crime.
-The environmental dimension encompasses various aspects such as air quality, handling of water, handling of waste, and the utilization of renewable energy sources.
-The economic dimension encompasses various indicators such as gross domestic product (GDP) per capita, job satisfaction, equality of earnings, and the expenditure on sustainable facilities.
-The analysis sought to encompass a broad spectrum of variables which contributes to the general ecological viability of the cities under investigation, through the utilization of these 21 conditions.
A comprehensive examination, a multi-criteria investigation, and comparable assessment are also performed in TBL. In addition, the weight factor of the signal was computed including static interactions and dynamical pattern similarities, and the induction-ordered weighing mean was used to combine criteria. This research concludes that China's urban sustainability and subsystems were subpar and had weak growth velocities.
The determination of decision weights for individual groups is commonly achieved by means of techniques such as pairwise comparison. Professionals or individuals with a vested interest allocate numerical values that signify the comparative significance of criteria within every category. Analyses are performed on the decision weights of several groups, such as Information Technology (IT), environment, management, and economy, Sustainable City (SC), and organizational and social groups, and Table 1(a) is used to depict those weights. The various decision-making weights, such as worst minimum (W_min), worst maximum (W_max), best minimum (Best_min), and best maximum (Best_max), are analyzed for different groups of the sustainable city, and the findings demonstrate variances in their choice making weightage. When it comes to reaching sustainable developmental objectives in industry 4.0 by employing the MCDM capacity of a variety of groups, the recommended SC-MCDM works very well.

Table 1.
(a). Decision weight comparison of the SC-MCDM.
| Group | W_min | W_max | Best_min | Best_max |
|---|---|---|---|---|
| Organisational & social | 1.4 | 0.9 | 7.5 | 8.4 |
| SC | 2.4 | 3.7 | 2.3 | 3.4 |
| Management & economy | 1.8 | 2.1 | 3.3 | 4.3 |
| Environment | 7.3 | 8.3 | 1.4 | 1.3 |
| IT | 3.7 | 4.2 | 1.7 | 2.6 |
The group weight, which depicts the relative significance of each group in the SC-MCDM evaluation, used to calculate the ranking in Table 1(b). A weight analysis approach, pairwise comparison, is used to calculate the group weight to give values that represent the perceived significance of each category in the decision-making process. With a higher rank signifying more relevance in the SC-MCDM evaluation, the ranking shows how the categories are prioritized based on their relative weights. The MCDM expertise of the sustainable city is analyzed using 10 different cities in China, which are randomly selected based on the group weight and rankings of entire China, and the results are tested with various groups of sustainable city residents, including IT, environmental, management, SC, organizational, and social group residents. Table 1 contains the calculated and tabulated results of the overall group weights as well as the rankings of the groups. The most recent weights are used to produce the best possible outcomes using MCDM, which in turn contributes to the accomplishment of the sustainable development objectives for the sustainable city and industry 4.0. The IOWA approach further simplifies the process and makes it easier to locate results in a shorter amount of time.
Table 1.
This is a table. Tables should be placed in the main text near to the first time they are cited.
Table 1.
This is a table. Tables should be placed in the main text near to the first time they are cited.
| Terms | Meaning |
|---|---|
| Normalized indicator x data for substitute y in the given year t | |
| Smaller criteria and higher outcome indicator | |
| Rank | |
| Weight | |
| Statistic indicator | |
| Dynamic indicator | |
| Trend modification of criteria | |
| Criteria | |
| Best criteria | |
| Worst criteria |
Table 1.
b). MCDM weight analysis of the SC-MCDM.
| Group | Group weight | Rank |
|---|---|---|
| IT | 0.18 | 3 |
| Environment | 0.24 | 2 |
| Management & Economy | 0.27 | 1 |
| SC | 0.15 | 5 |
| Organisational & Social | 0.16 | 4 |
The experimental results of the sustainable city are analyzed using many approaches, including Principal Component Analysis (PCA), Analytical Hierarchical Processing (AHP), the Contingent Valuation (CVM) method, entropy, and the suggested SC-MCDM system. The effectiveness of these strategies in terms of decision-making as well as their long-term viability are put to the test using 10 distinct cities from China, and the aggregated results are presented in Table 2(a).
Table 2.
a). Experimental findings of the sustainable city.
| Method | Decision making efficiency (%) | Sustainability (%) |
|---|---|---|
| PCA | 55.2 | 46.7 |
| AHP | 42.4 | 49.7 |
| CVM | 63.2 | 61.4 |
| Entropy | 59.7 | 57.8 |
| SC-MCDM | 89.7 | 92.1 |
Based on smallest weight and smallest ranking, cities are randomly selected. It’s difficult to analysis for entire china, so randomly 10 cities are selected for the analysis, and the results are integrated to entire China. The findings indicate that the recommended SC-MCDM approach would result in improved levels of MCDM efficiency as well as greater sustainability across all 10 cities. This is accomplished via the use of IOWA and MCDM abilities to adjust the weights of the various groupings. Figure 4 represents Graphical Analysis of Experimental findings of the sustainable city. It shows comparison of our proposed approach among Principal Component Analysis (PCA), Analytical Hierarchical Processing (AHP), the Contingent Valuation (CVM) method, entropy.
Each criterion or category is often given a weight based on their relative relevance to establish the ranking in the SC-MCDM assessment. Group weight, that is established by subjective or objective weighing procedures, is the relevance given to each category. The proposed SC-MCDM system is put through its paces by employing 10 distinct towns in China as test subjects for its decision-making abilities. After determining the relative weights of each factor in the decision-making process and ranking them, the findings are shown in Table 2(b). With the assistance of MCDM and IOWA, the SC-MCDM system can reach a greater level of sustainability. The best minimum, best maximum, worst minimum, and worst maximum weights are used in the analysis of the MCDM weights. These data are used to update the optimal weights, which in turn contributes to the achievement of the sustainable development objectives set out by Industry 4.0.
Table 2.
b). Multi-criteria decision-making ability analysis of the suggested SC-MCDM system.
| City | Weight | Rank |
|---|---|---|
| 1 | 0.74 | 1 |
| 2 | 0.31 | 10 |
| 3 | 0.58 | 5 |
| 4 | 0.51 | 6 |
| 5 | 0.48 | 7 |
| 6 | 0.63 | 3 |
| 7 | 0.59 | 4 |
| 8 | 0.73 | 2 |
| 9 | 0.36 | 9 |
| 10 | 0.42 | 8 |
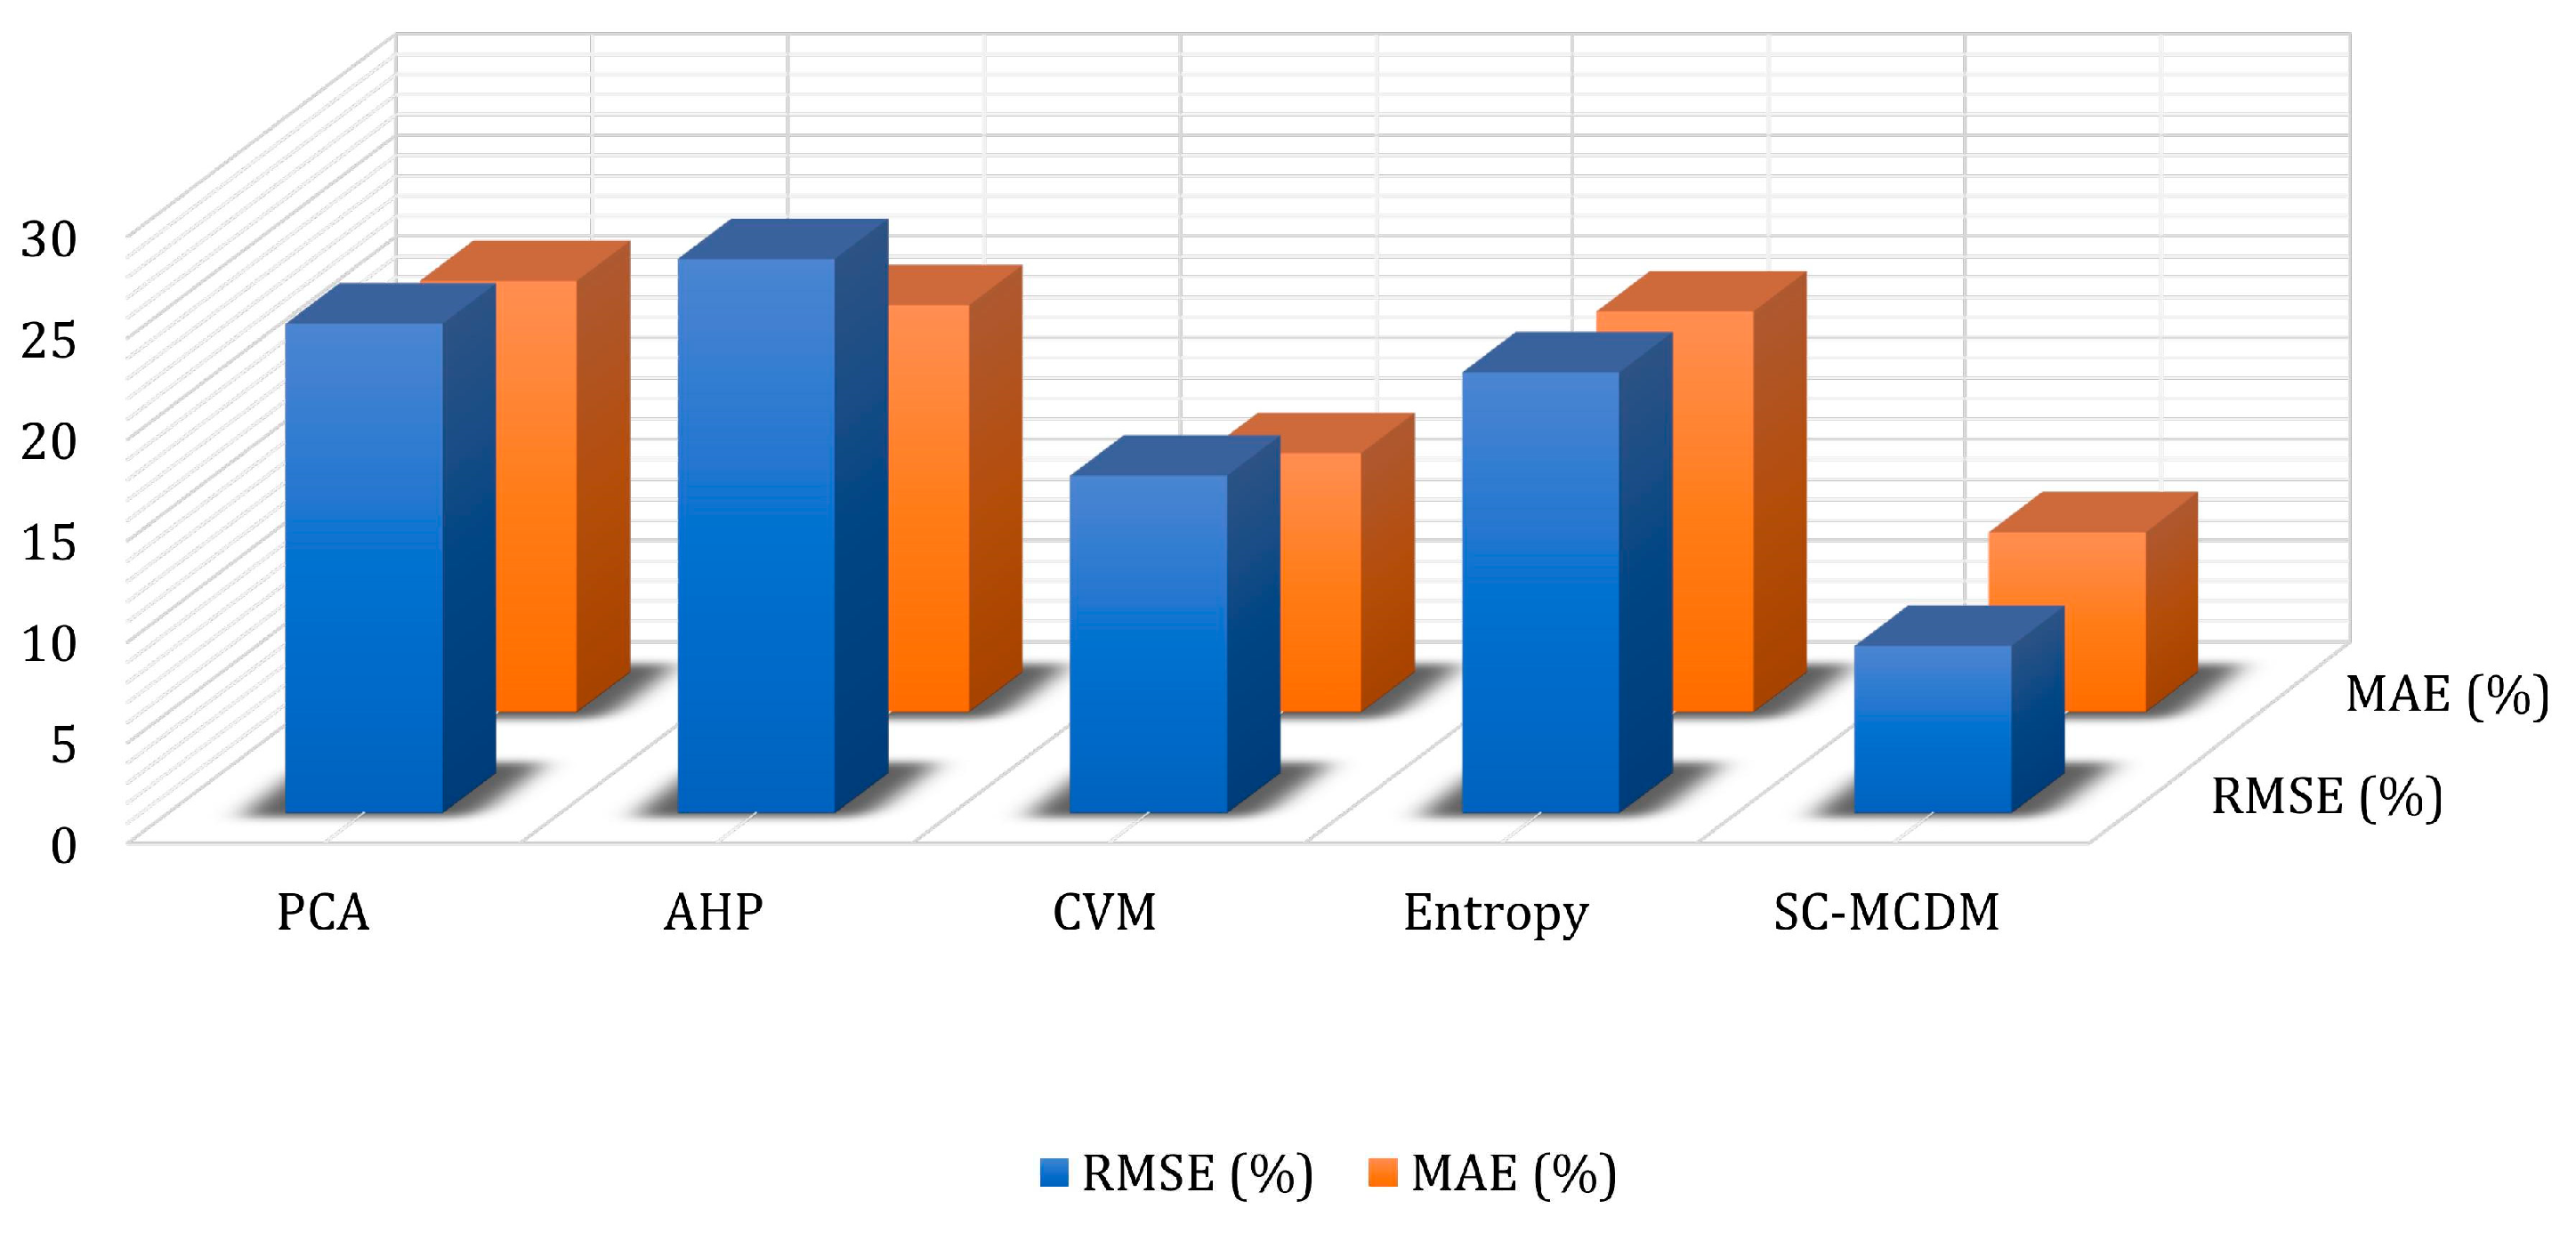
The results of the simulation study of the SC-MCDM system in terms of precision, accuracy, Root Mean Squared Error (RMSE) and Mean Absolute Error (MAE) are calculated, and Table 3(a) and 3(b), respectively, indicate the findings of the analysis. The accuracy, precision, RMSE, and MAE are computed for sustainable development of 10 cities in China’s sustainability prediction value. The results of the SC-MCDM system are compared with the models that are already in existence, and the comparison demonstrates that the suggested system with the MCDM model is effective in Industry 4.0. The system functions more effectively and with fewer errors than before.
Table 3.
a). Simulation analysis of the SC-MCDM system.
| Method | Precision (%) | Accuracy (%) |
|---|---|---|
| PCA | 47 | 52 |
| AHP | 54 | 57 |
| CVM | 86 | 82 |
| Entropy | 75 | 79 |
| SC-MCDM | 93 | 95 |
Table 3.
b). Error analysis of the SC-MCDM system.
| Method | RMSE (%) | MAE (%) |
|---|---|---|
| PCA | 24.2 | 21.3 |
| AHP | 27.4 | 20.1 |
| CVM | 16.7 | 12.8 |
| Entropy | 21.8 | 19.8 |
| SC-MCDM | 8.3 | 8.9 |
The outcomes of the simulation study on the SC-MCDM system have been computed in terms of precision, accuracy, Root Mean Squared Error (RMSE), and Mean Absolute Error (MAE). The findings of the analysis are presented in the Figure 5 and Figure 6 correspondingly. The metrics of accuracy, precision, root mean square error (RMSE), and mean absolute error (MAE) are calculated to assess the sustainable growth of ten cities in China's sustainability forecast value. The efficacy of the SC-MCDM system is assessed by comparing it with existing models, revealing its effectiveness in the context of Industry 4.0.
4.1. Comparison Analysis section
These numerical findings were obtained using simulations and experimental data that were carried out utilizing a variety of techniques, including PCA, AHP, CVM, Entropy, and the SC-MCDM method. The values provide quantitative measurements for assessing the proposed SC-MCDM system and indicate the efficiency and efficacy of each technique in terms of decision-making performance, sustainability prediction, precision, accuracy, and evaluation of errors. The SC-MCDM system outperforms other approaches in terms of decision-making effectiveness (89.7%), sustainability (92.1%), precision (93%), accuracy (95%), RMSE (8.3%), and MAE (8.9%), demonstrating its superiority over other approaches in accomplishing sustainable city development objectives.
5. Conclusion and findings
This research aims to determine the impact of Industry 4.0 on promoting sustainable business efficiency in SMEs, which face several technological difficulties. Through Industry 4.0, this research tried to address the resolution of several technological difficulties. The report examines three key elements of Industry 4.0: BD, the IoT, and smart manufacturing industries.
To achieve sustainable development goals, a survey employs a cross-sectional study design. To do this, the study devised a technique for calculating the interaction between several criteria, such as static connections and dynamical trend similarities, and for calculating the weight factors of every indication depending on the connection. In addition, the Induction Ordering Weighted Averaging (IOWA) operation, whose including parameter is generated by the interactions between criteria, was used to combine criteria and related weighted factors.
While MCDM has proved to be an excellent tool for assessing the sustainability of a city, the study will require more research to pick more precise criteria. Due to information accessibility and measuring restrictions, only 21 indicators were extracted from statistics yearbooks, resulting in inadequate indicators. Utilizing more extensive and specific data to refine the indication method may become a focus of future development. Since small and medium-sized enterprises have scarce resources, the existing approach should be extended to high-tech SMEs. Future studies should include other features of Industry 4.0, including connectivity and Cyber-Physical Systems (CPS). To enhance the evaluation of sustainable development in the context of Industry 4.0, future research should concentrate on broadening the selection of criteria and improving the indication technique utilizing more comprehensive and precise data. A worthwhile area for more research would be the integration of connection and CPS inside small and medium-sized businesses.
Author Contributions
The concept analysis A Sustainable City using Multi-Criteria Decision Making (SC-MCDM) system was created and designed by S.P. and D.A; S. M. and S. J. created the theory and ran a framework to achieve sustainable urban development by integrating Industry 4.0 technologies with MCDM techniques. The analytical approaches for assessing decisions aligned with the Sustainable Development Goals (SDGs) have been validated by S.P. The proposed framework incorporates multiple factors, such as environmental impact, economic viability, and social equity. The data and analysis tools were gathered by B. S. and D. A.; K. S. conducted the analysis and drafted the paper. S. M. and S. P. have gone over the results and analysis section. The objective is to establish a framework that addresses the prevalent issue of limited integration among various sectors engaged in sustainable urban development. This framework aims to enable a more comprehensive and data-driven approach to facilitate the integration of these sectors. The authors engaged in comprehensive deliberation over the outcomes and then granted their endorsement to the ultimate iteration of the manuscript. At the end, all the authors make a review for making it more transparent to the readers.
Funding
This research received funding from MMU.
Institutional Review Board Statement
NA.
Informed Consent Statement
Informed consent was obtained from all subjects involved in the study.
Data Availability Statement
Not applicable.
Conflicts of Interest
The authors declare no conflict of interest.
References
- McGowan, P.J.; Stewart, G.B.; Long, G.; Grainger, M.J. An imperfect vision of indivisibility in the Sustainable Development Goals. Nature Sustainability 2019, 2, 43–45. [Google Scholar] [CrossRef]
- Bouzguenda, I.; Alalouch, C.; Fava, N. Towards smart sustainable cities: A review of the role digital citizen participation could play in advancing social sustainability. Sustainable Cities and Society 2019, 50, 101627. [Google Scholar] [CrossRef]
- Bouzguenda, I.; Alalouch, C.; Fava, N. Towards smart sustainable cities: A review of the role digital citizen participation could play in advancing social sustainability. Sustainable Cities and Society 2019, 50, 101627. [Google Scholar] [CrossRef]
- Ghobakhloo, M. Industry 4.0, digitization, and opportunities for sustainability. Journal of cleaner production 2020, 252, 119869. [Google Scholar] [CrossRef]
- Sony, M.; Naik, S. Key ingredients for evaluating Industry 4.0 readiness for organizations: a literature review. Benchmarking: An International Journal 2020, 27, 2213–2232. [Google Scholar] [CrossRef]
- Pech, M.; Vrchota, J. Classification of small-and medium-sized enterprises based on the level of industry 4.0 implementation. Applied Sciences 2020, 10, 5150. [Google Scholar] [CrossRef]
- Uslu, B.; Eren, T.; Gür, Ş.; Özcan, E. Evaluation of the difficulties in the internet of things (IoT) with multi-criteria decision-making. Processes 2019, 7, 164. [Google Scholar] [CrossRef]
- Mastrocinque, E.; Ramírez, F.J.; Honrubia-Escribano, A.; Pham, D.T. An AHP-based multi-criteria model for sustainable supply chain development in the renewable energy sector. Expert Systems with Applications 2020, 150, 113321. [Google Scholar] [CrossRef]
- Mahajan, A.; Binaz, V.; Singh, I.; Arora, N. Selection of natural fiber for sustainable composites using hybrid multi-criteria decision-making techniques. Composites Part C: Open Access 2022, 7, 100224. [Google Scholar] [CrossRef]
- Wu, Y.; Liao, M.; Hu, M.; Lin, J.; Zhou, J.; Zhang, B.; Xu, C. A decision framework of low-speed wind farm projects in hilly areas based on DEMATEL-entropy-TODIM method from the sustainability perspective: a case in China. Energy 2020, 213, 119014. [Google Scholar] [CrossRef]
- Memari, A.; Dargi, A.; Jokar, M.R.A.; Ahmad, R.; Rahim, A.R.A. Sustainable supplier selection: A multi-criteria intuitionistic fuzzy TOPSIS method. Journal of manufacturing systems 2019, 50, 9–24. [Google Scholar] [CrossRef]
- Maghsood, F.F.; Moradi, H.; Berndtsson, R.; Panahi, M.; Daneshi, A.; Hashemi, H.; Bavani, A.R.M. Social acceptability of flood management strategies under climate change using contingent valuation method (CVM). Sustainability 2019, 11, 5053. [Google Scholar] [CrossRef]
- Mishra, A.R.; Rani, P.; Prajapati, R.S. Multi-criteria weighted aggregated sum product assessment method for sustainable biomass crop selection problem using single-valued neutrosophic sets. Applied Soft Computing 2021, 113, 108038. [Google Scholar] [CrossRef]
- Chen, Y.; Zhang, D. Evaluation of city sustainability using multi-criteria decision-making considering interaction among criteria in Liaoning province China. Sustainable Cities and Society 2020, 59, 102211. [Google Scholar] [CrossRef]
- Liesefeld, H.R.; Müller, H.J. Distractor handling via dimension weighting. Current opinion in psychology 2019, 29, 160–167. [Google Scholar] [CrossRef] [PubMed]
- Zeng, S. , Zhou, J., Zhang, C.; Merigó, J.M. Intuitionistic fuzzy social network hybrid MCDM model for an assessment of digital reforms of the manufacturing industry in China. Technological Forecasting and Social Change 2022, 176, 121435. [Google Scholar] [CrossRef]
- Sodiq, A.; Baloch, A.A.; Khan, S.A.; Sezer, N.; Mahmoud, S.; Jama, M.; Abdelaal, A. Towards modern sustainable cities: Review of sustainability principles and trends. Journal of Cleaner Production 2019, 227, 972–1001. [Google Scholar] [CrossRef]
- Akande, A.; Cabral, P.; Gomes, P.; Casteleyn, S. The Lisbon ranking for smart sustainable cities in Europe. Sustainable Cities and Society 2019, 44, 475–487. [Google Scholar] [CrossRef]
- Ameen, R.F.M.; Mourshed, M. Urban sustainability assessment framework development: The ranking and weighting of sustainability indicators using analytic hierarchy process. Sustainable Cities and Society 2019, 44, 356–366. [Google Scholar] [CrossRef]
- Turner-Skoff, J.B.; Cavender, N. The benefits of trees for livable and sustainable communities. Plants People Planet 2019, 1, 323–335. [Google Scholar] [CrossRef]
- Mahmoud, S.; Zayed, T.; Fahmy, M. Development of sustainability assessment tool for existing buildings. Sustainable Cities and Society, 2019, 44, 99–119. [Google Scholar] [CrossRef]
- Sodhro, A.H.; Pirbhulal, S.; Luo, Z.; De Albuquerque, V.H.C. Towards optimal resource management for IoT-based Green and sustainable smart cities. Journal of Cleaner Production 2019, 220, 1167–1179. [Google Scholar] [CrossRef]
- Atanda, J.O. Developing a social sustainability assessment framework. Sustainable cities and society 2019, 44, 237–252. [Google Scholar] [CrossRef]
- Jararweh, Y.; Otoum, S.; Al Ridhawi, I. Trustworthy and sustainable smart city services at the edge. Sustainable Cities and Society 2020, 62, 102394. [Google Scholar] [CrossRef]
- Yang, J.; Kwon, Y.; Kim, D. Regional smart city development focus: The South Korean national strategic smart city program. IEEE Access 2020, 9, 7193–7210. [Google Scholar] [CrossRef]
- Kuru, K.; Ansell, D.T. CitySmartF: A comprehensive systematic framework for transforming cities into cities. IEEE Access 2020, 8, 18615–18644. [Google Scholar] [CrossRef]
Figure 1.
The sustainable industry 4.0 structure.
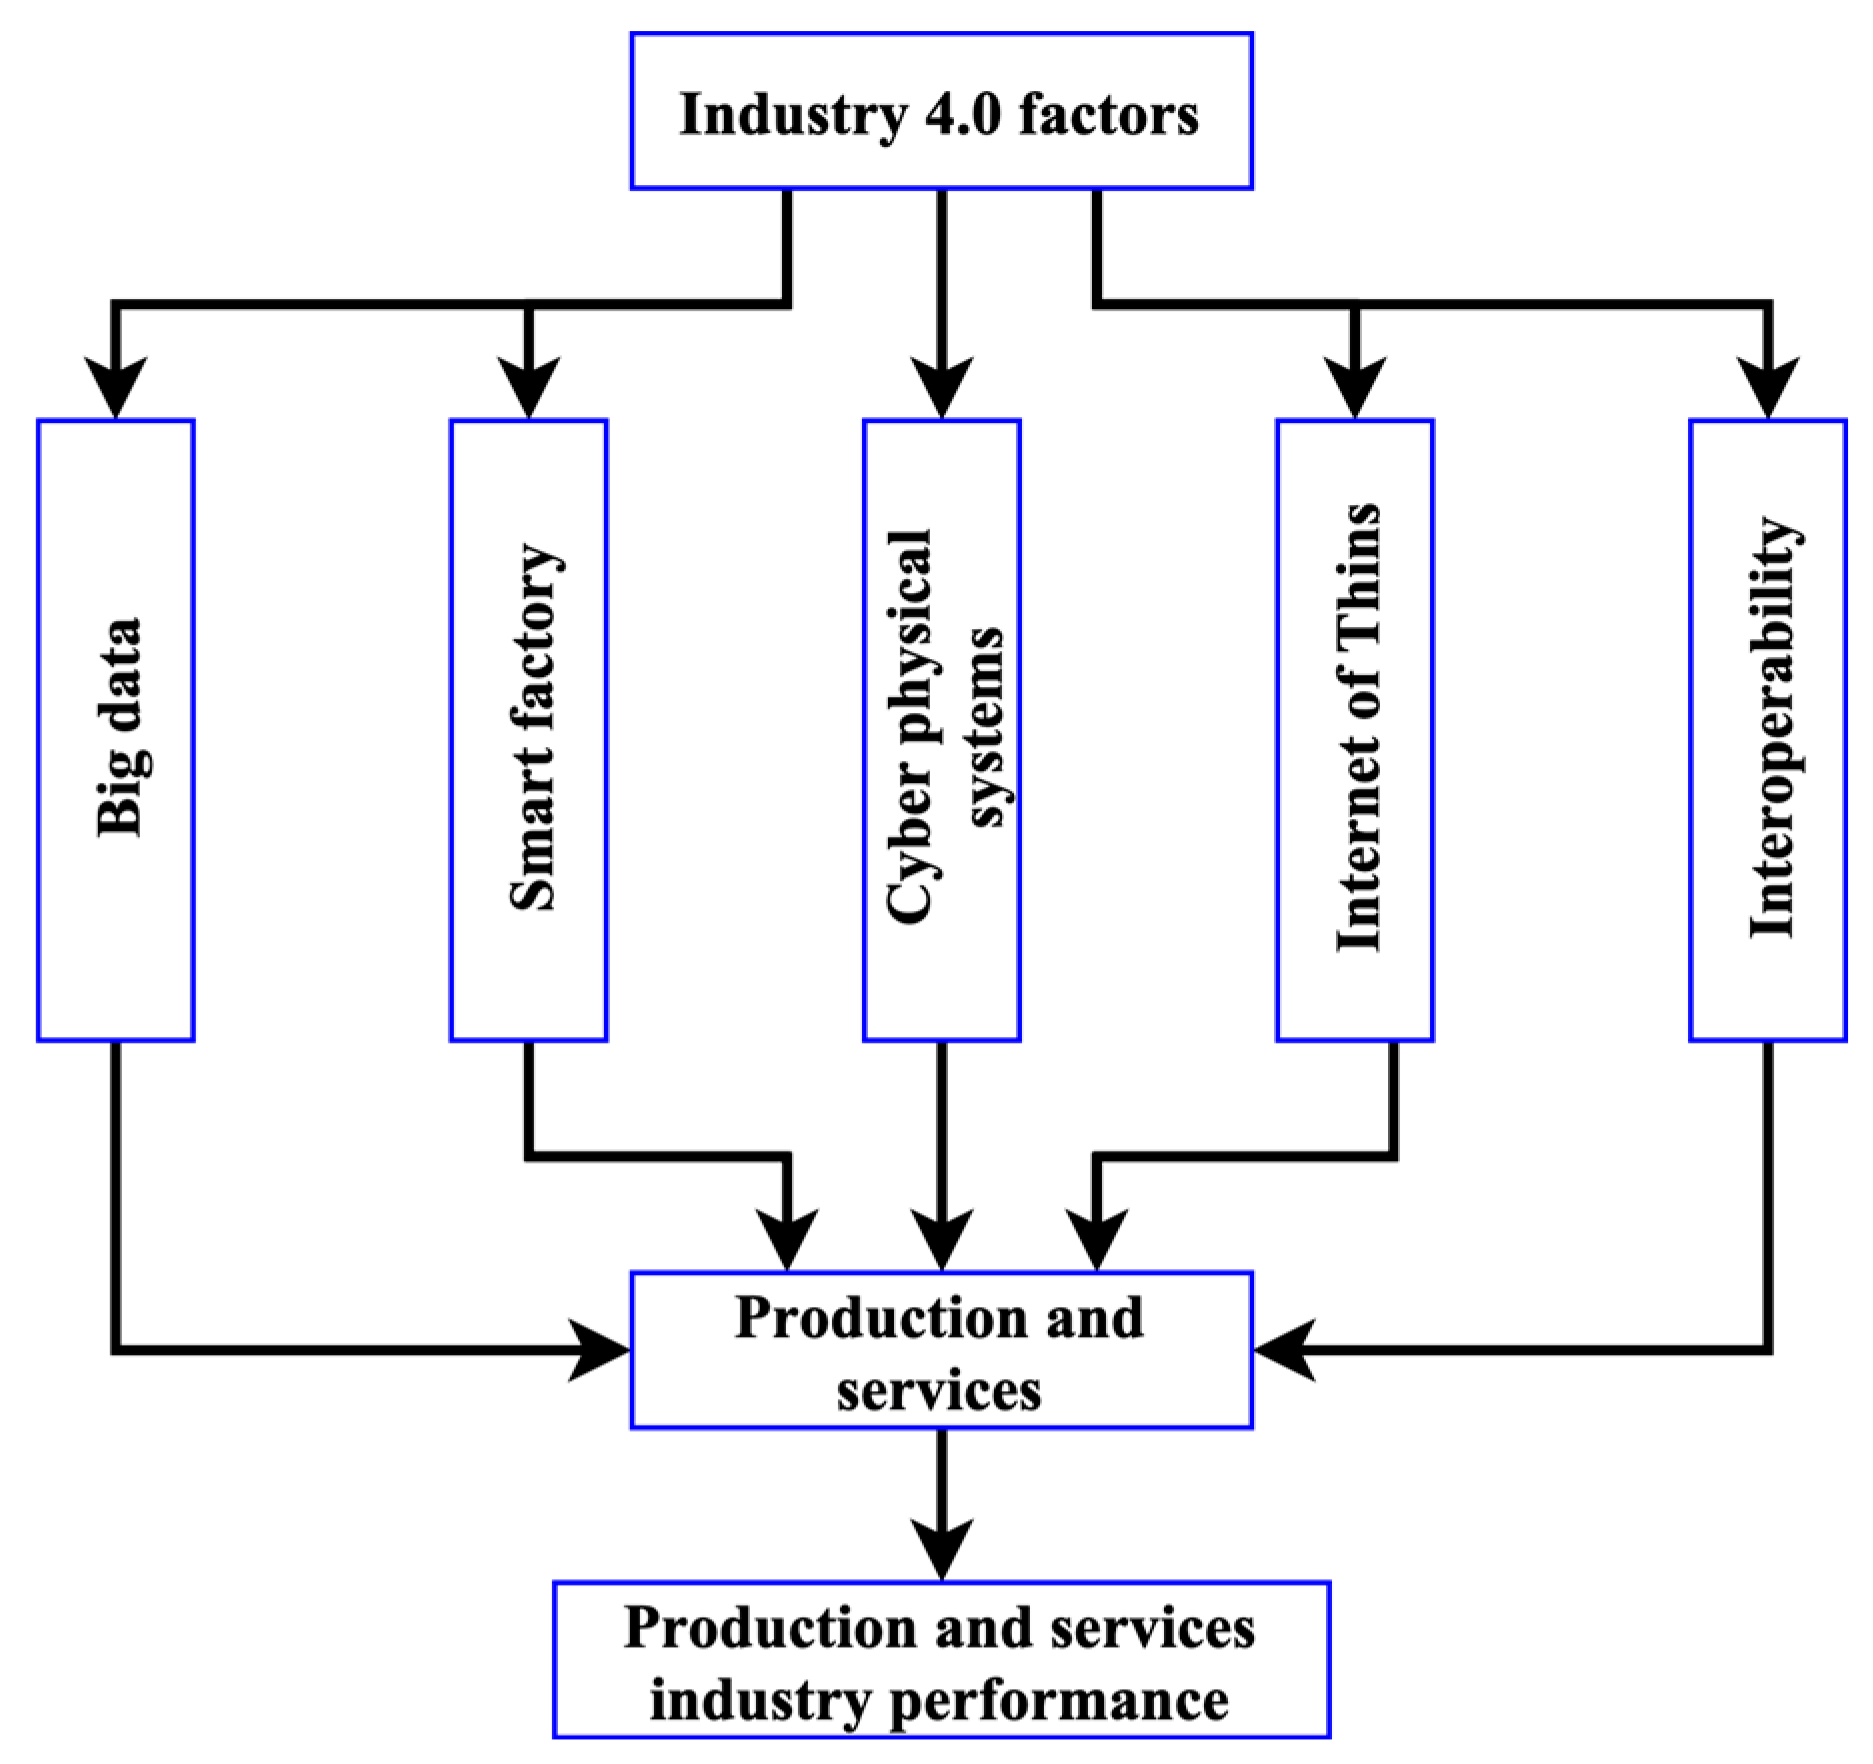
Figure 2.
The IOWA process of the suggested system.
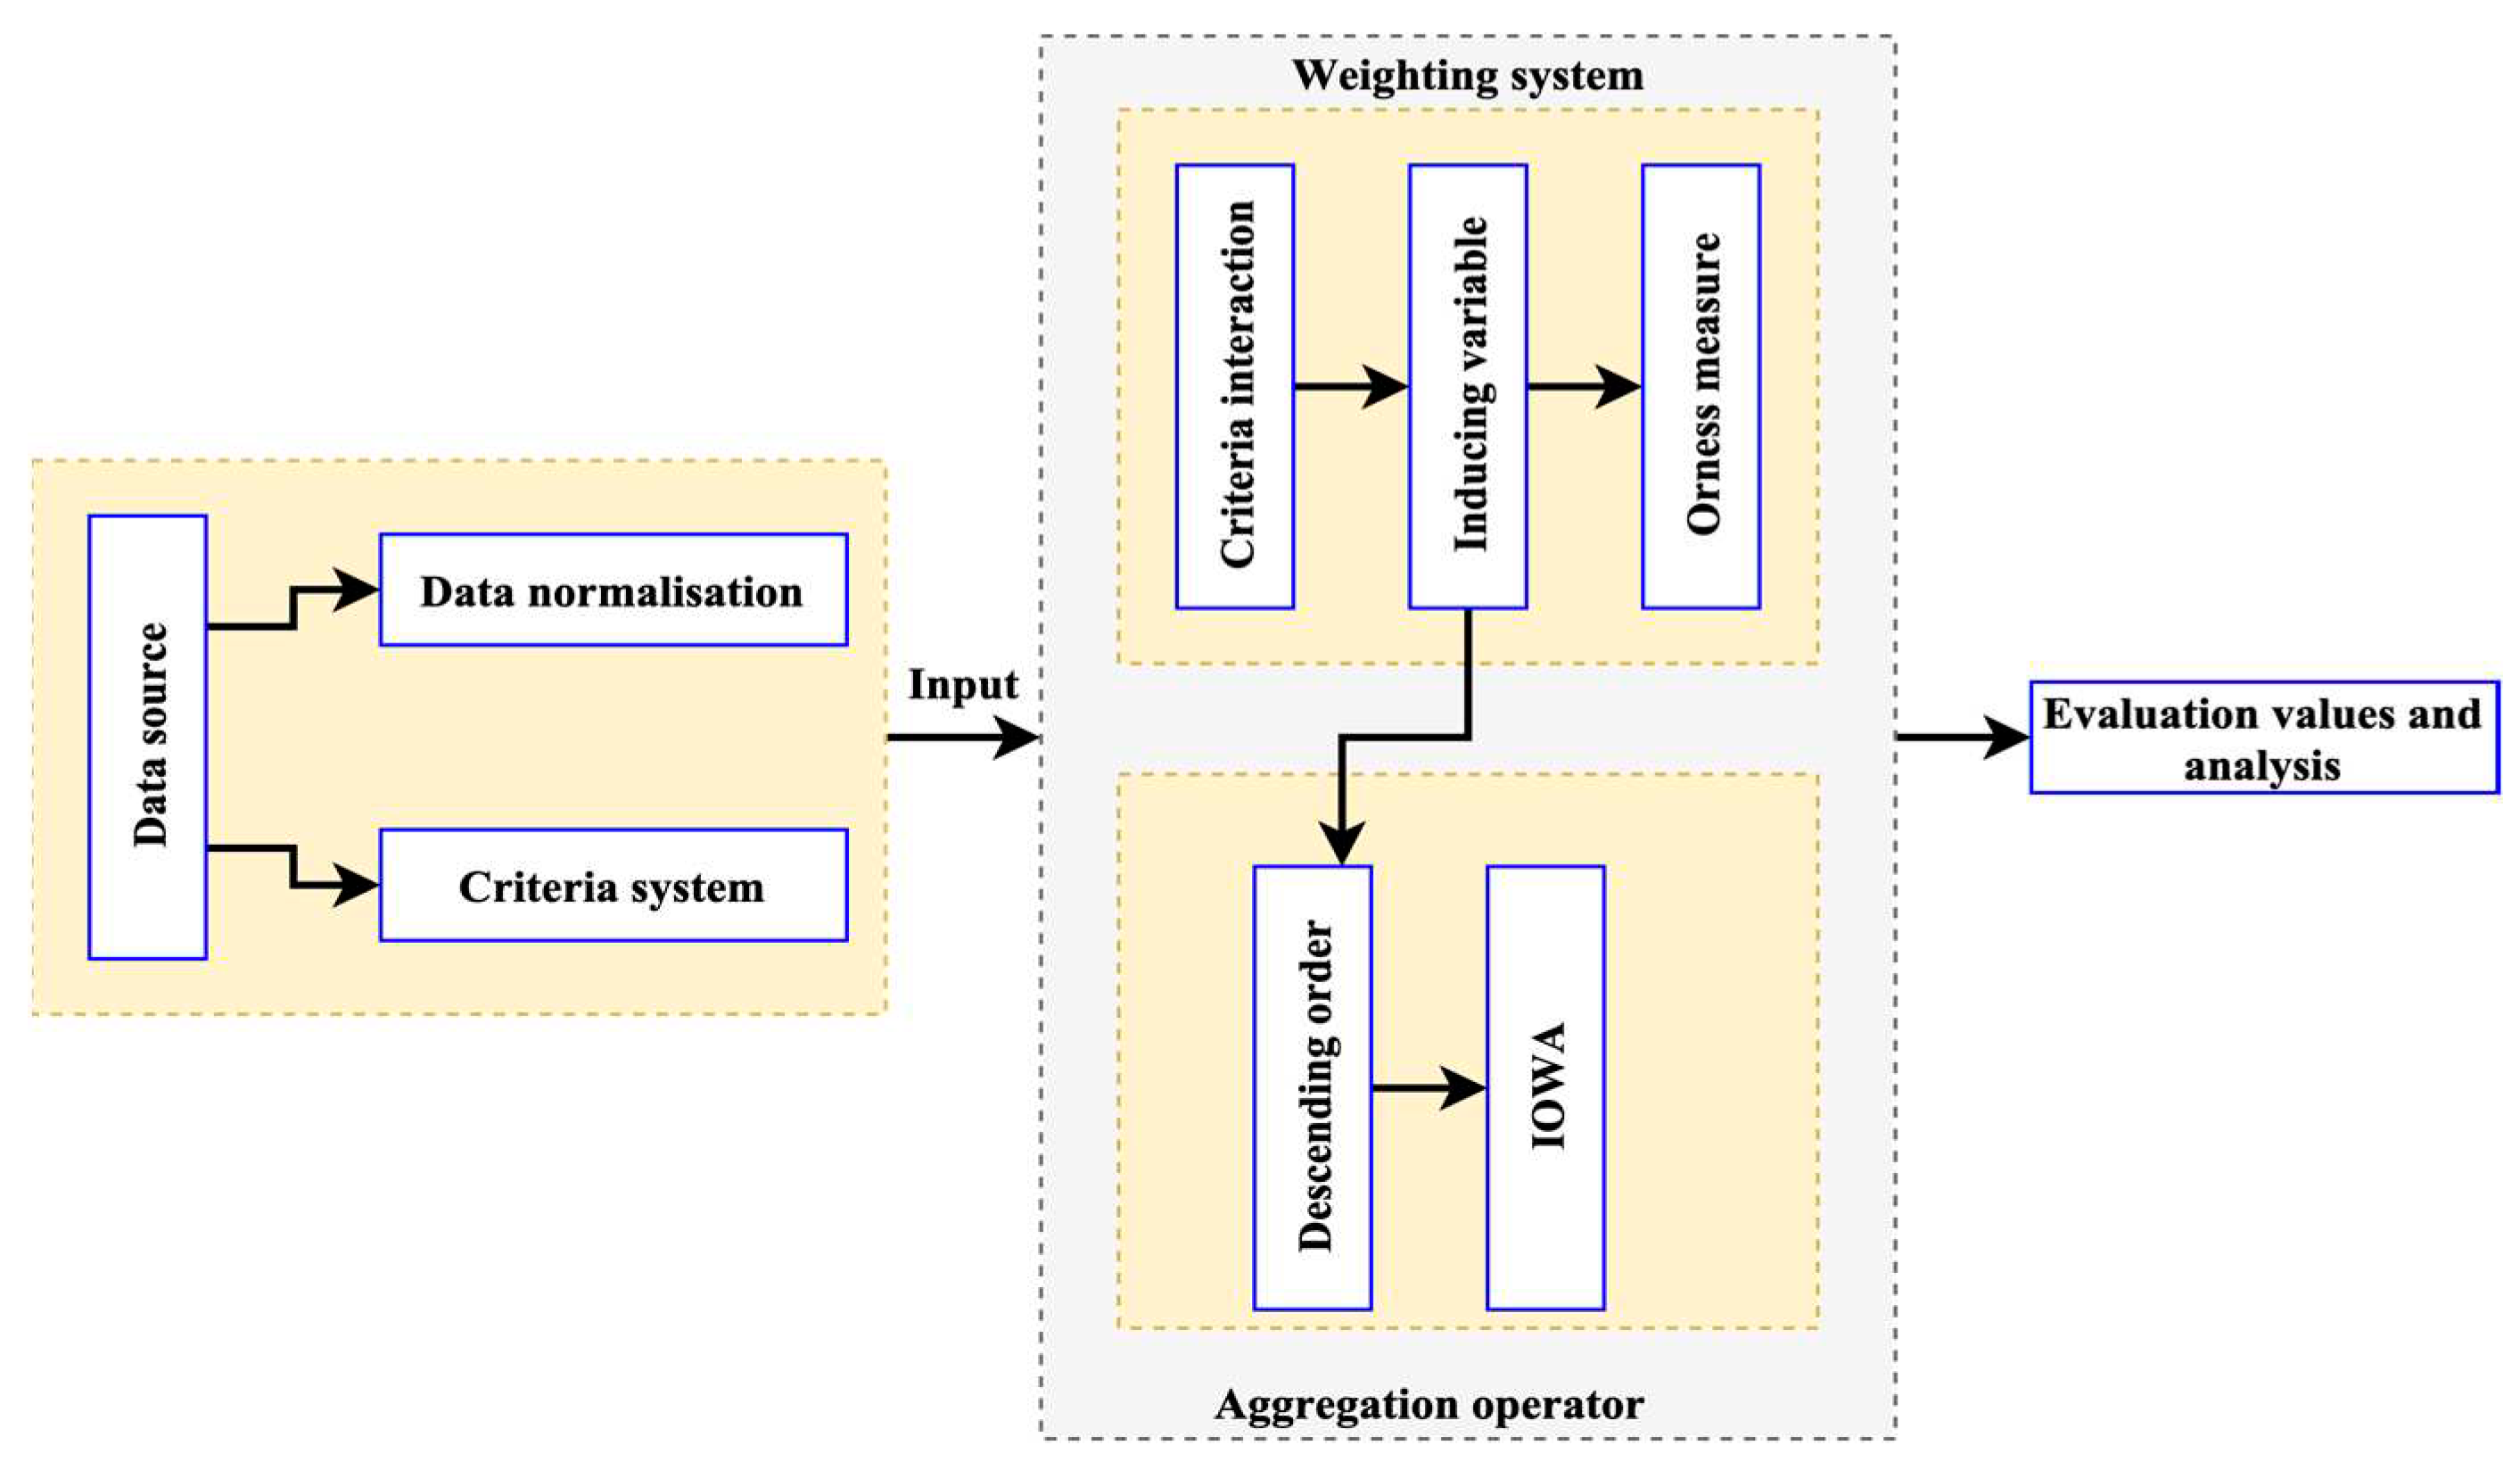
Figure 3.
Flow Chart Diagram.
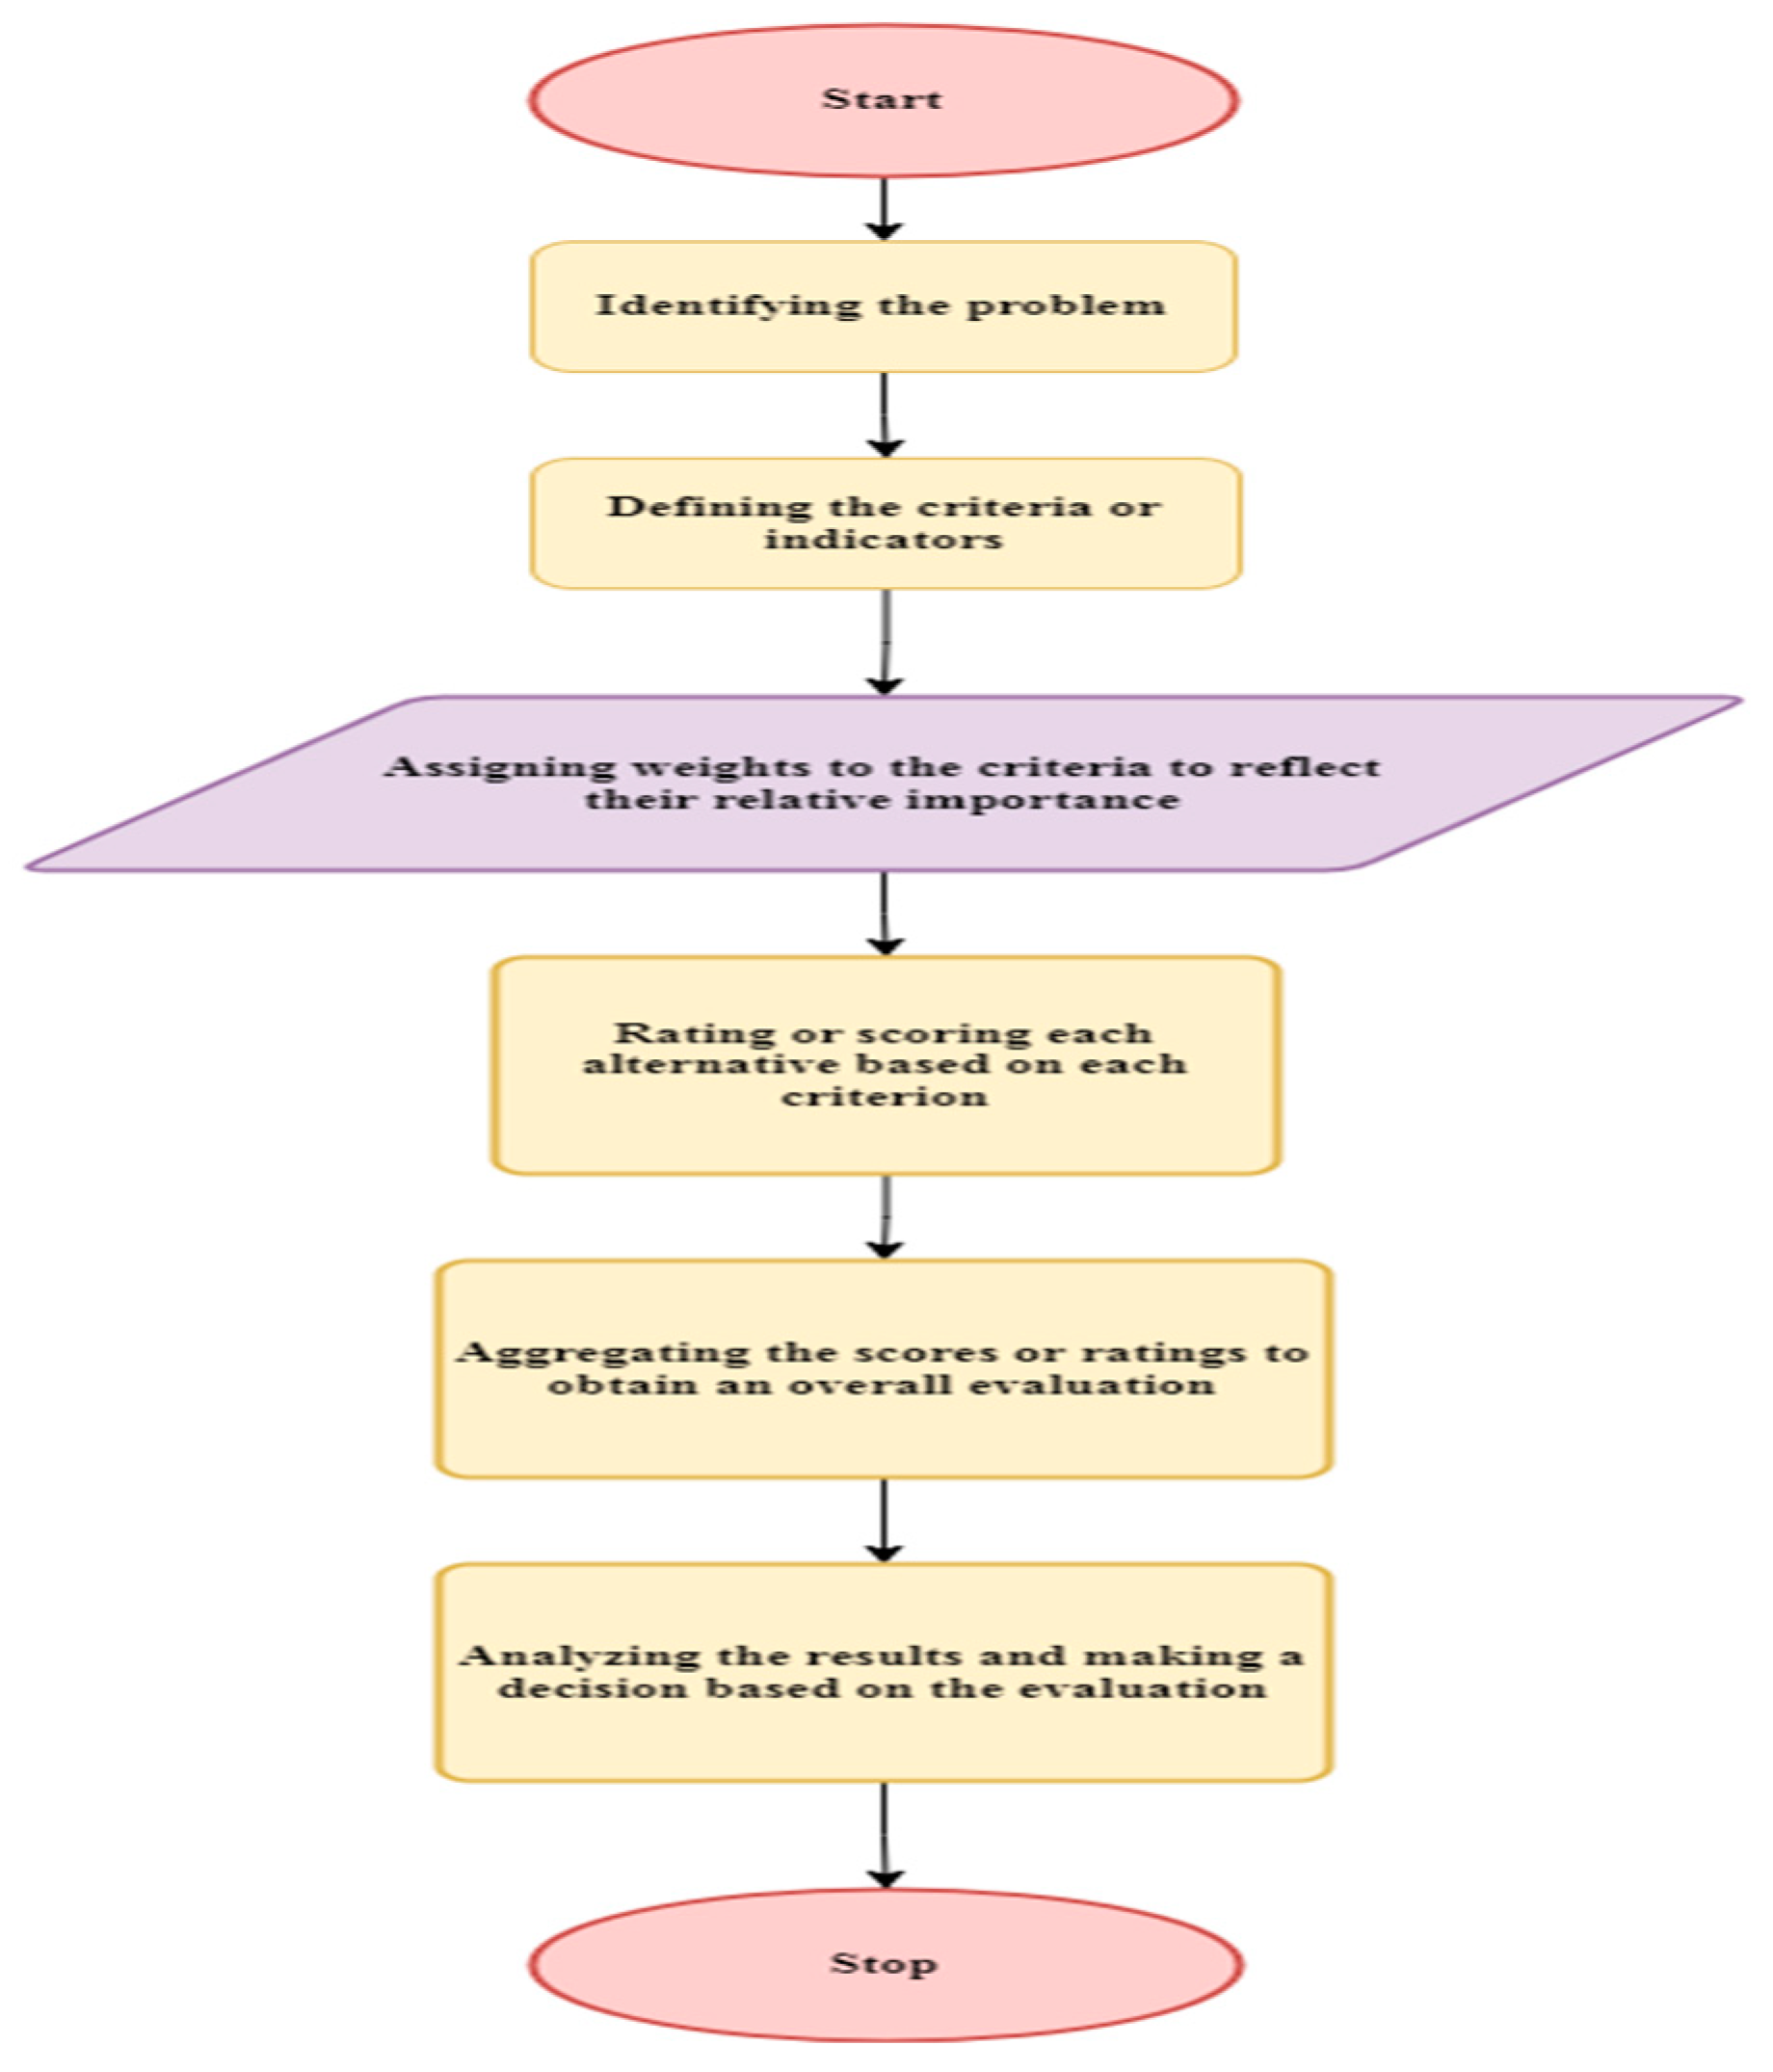
Figure 4.
Graphical Analysis of Experimental findings of the sustainable city.
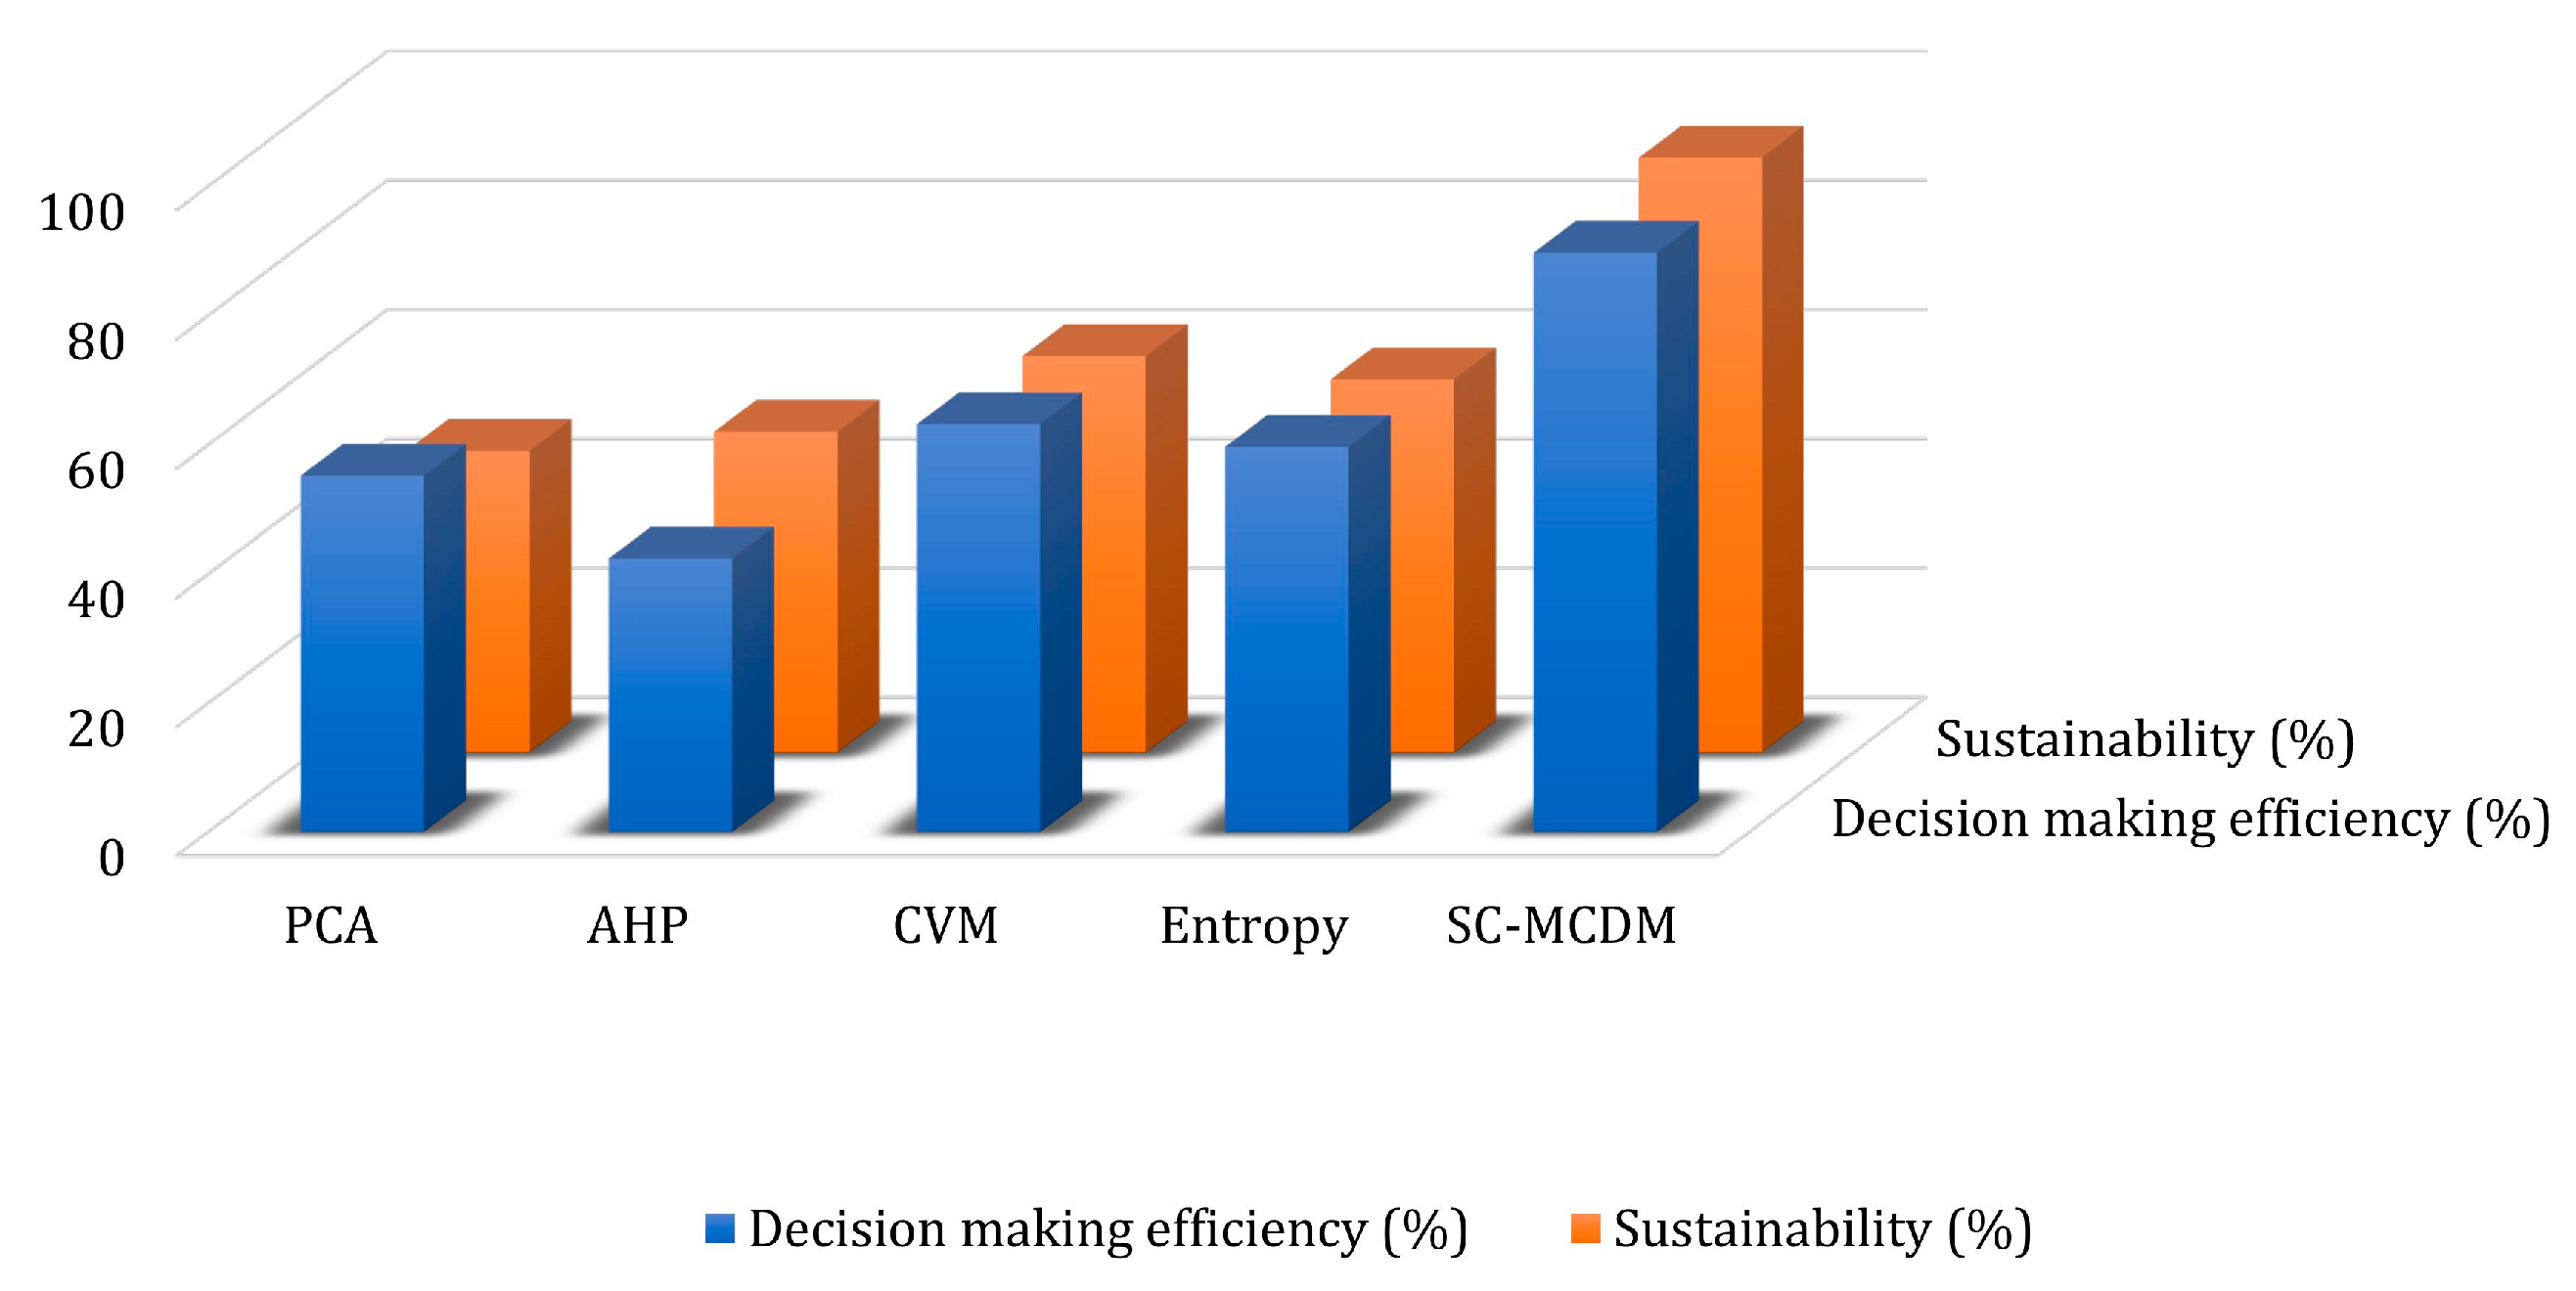
Figure 5.
Graphical Analysis of Simulation analysis of the SC-MCDM system.
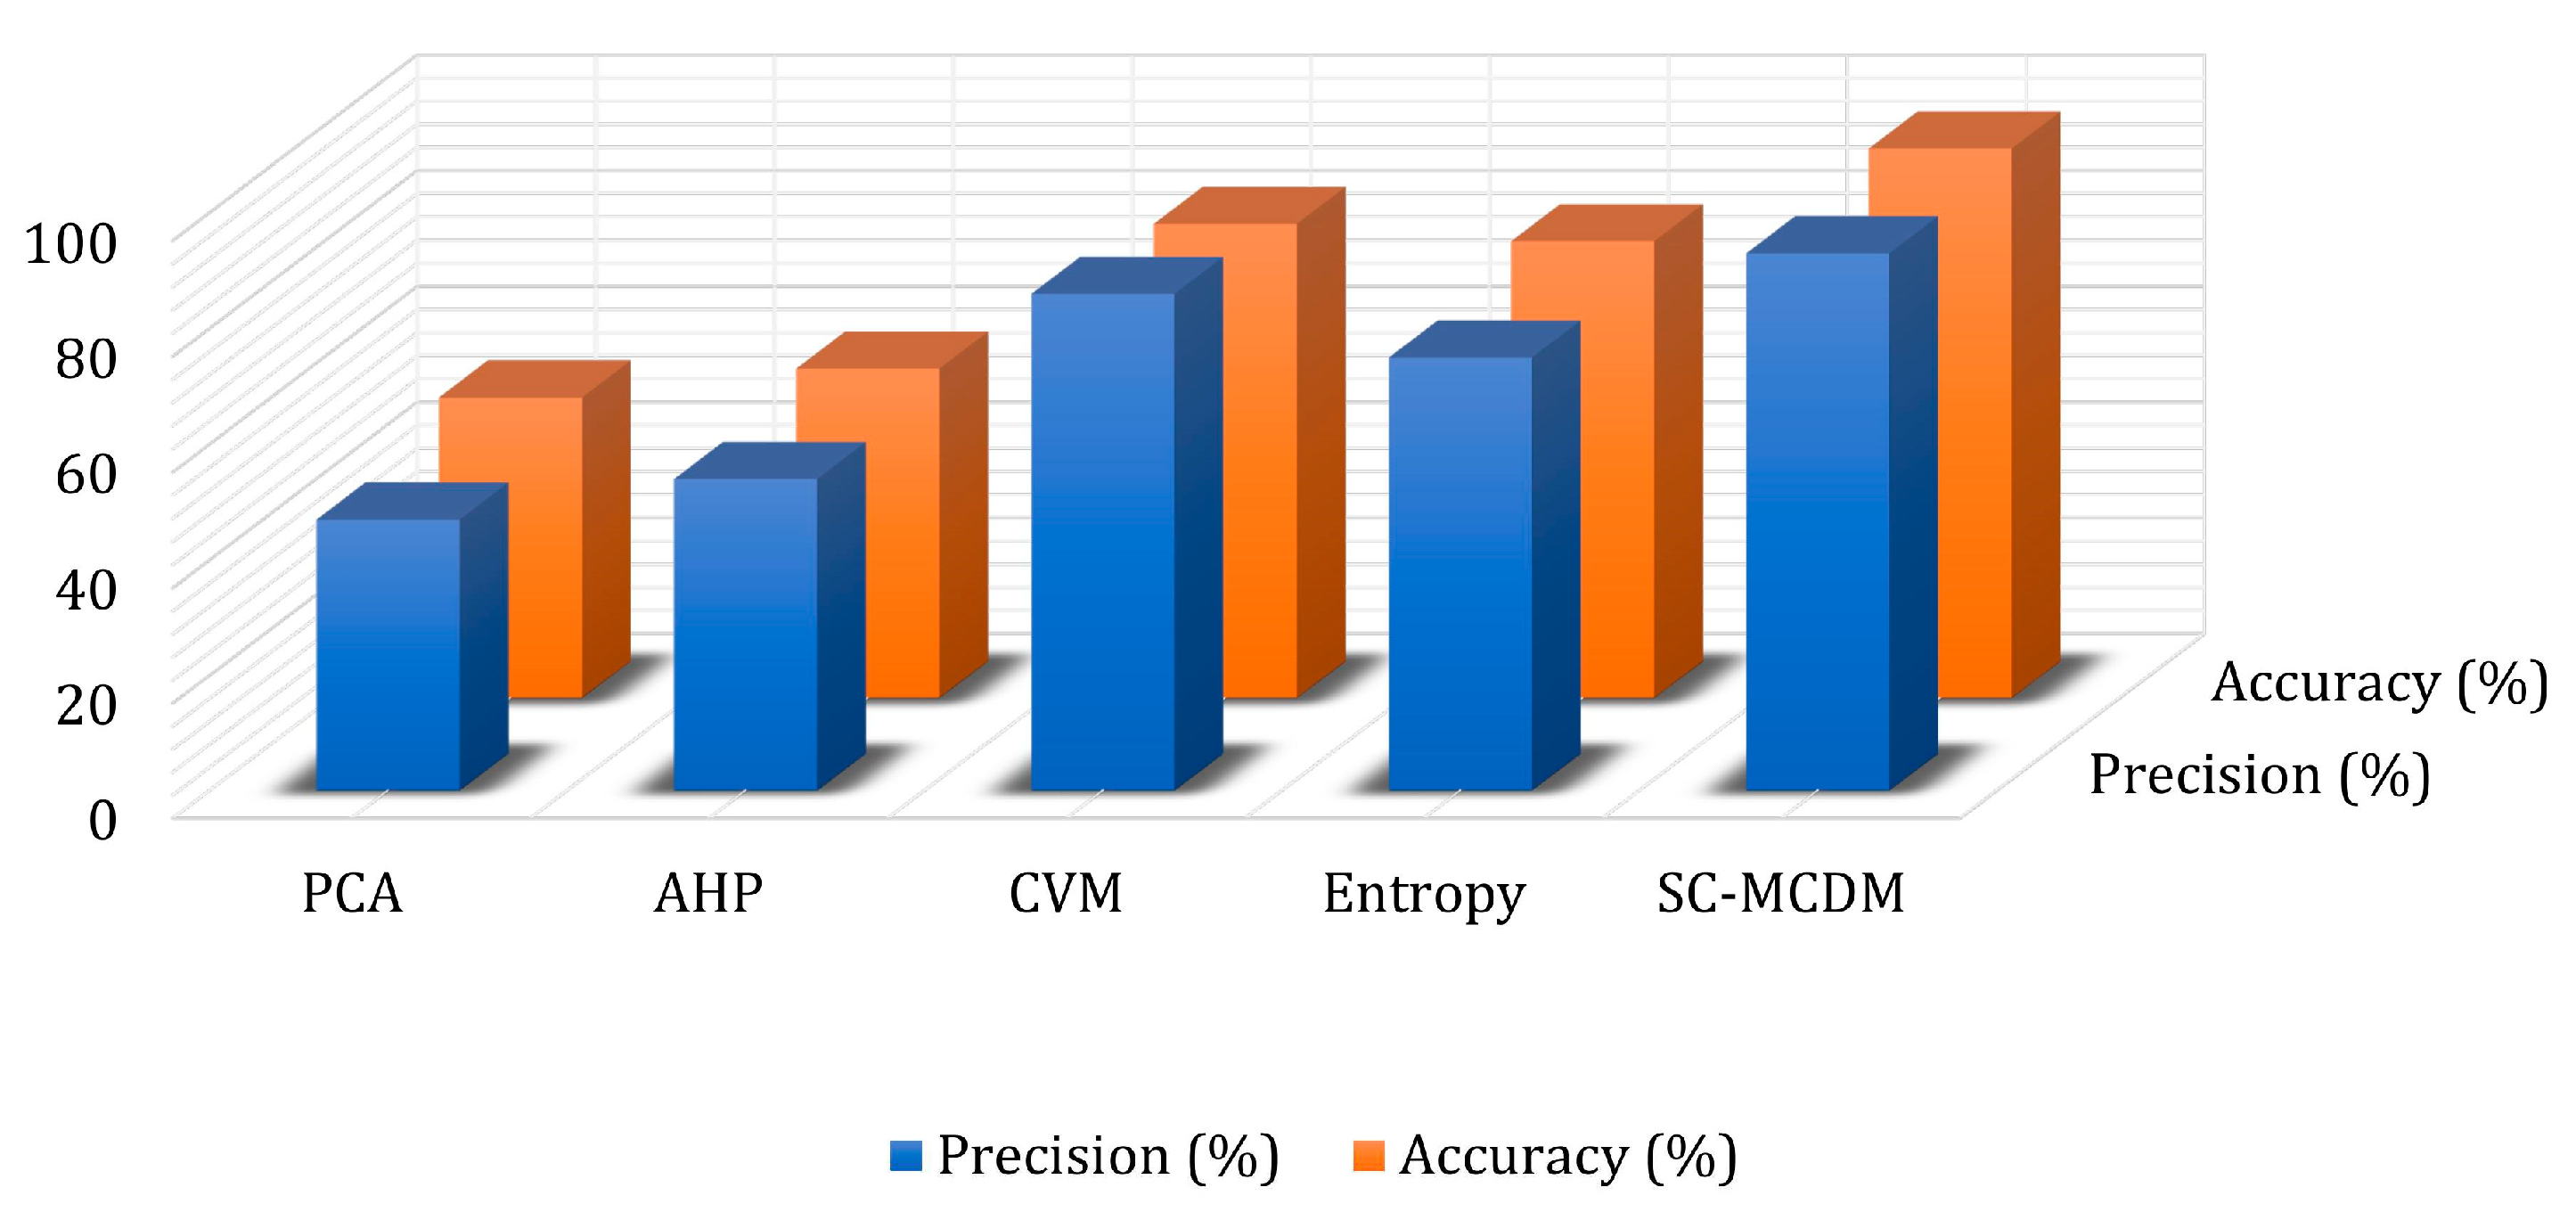
Figure 6.
Graphical Analysis of Error analysis of the SC-MCDM system.
Disclaimer/Publisher’s Note: The statements, opinions and data contained in all publications are solely those of the individual author(s) and contributor(s) and not of MDPI and/or the editor(s). MDPI and/or the editor(s) disclaim responsibility for any injury to people or property resulting from any ideas, methods, instructions or products referred to in the content. |
© 2023 by the authors. Licensee MDPI, Basel, Switzerland. This article is an open access article distributed under the terms and conditions of the Creative Commons Attribution (CC BY) license (http://creativecommons.org/licenses/by/4.0/).
Copyright: This open access article is published under a Creative Commons CC BY 4.0 license, which permit the free download, distribution, and reuse, provided that the author and preprint are cited in any reuse.


