Submitted:
05 September 2023
Posted:
18 September 2023
You are already at the latest version
Abstract
Keywords:
1. Introduction
2. Mathematical Formulation of NBL
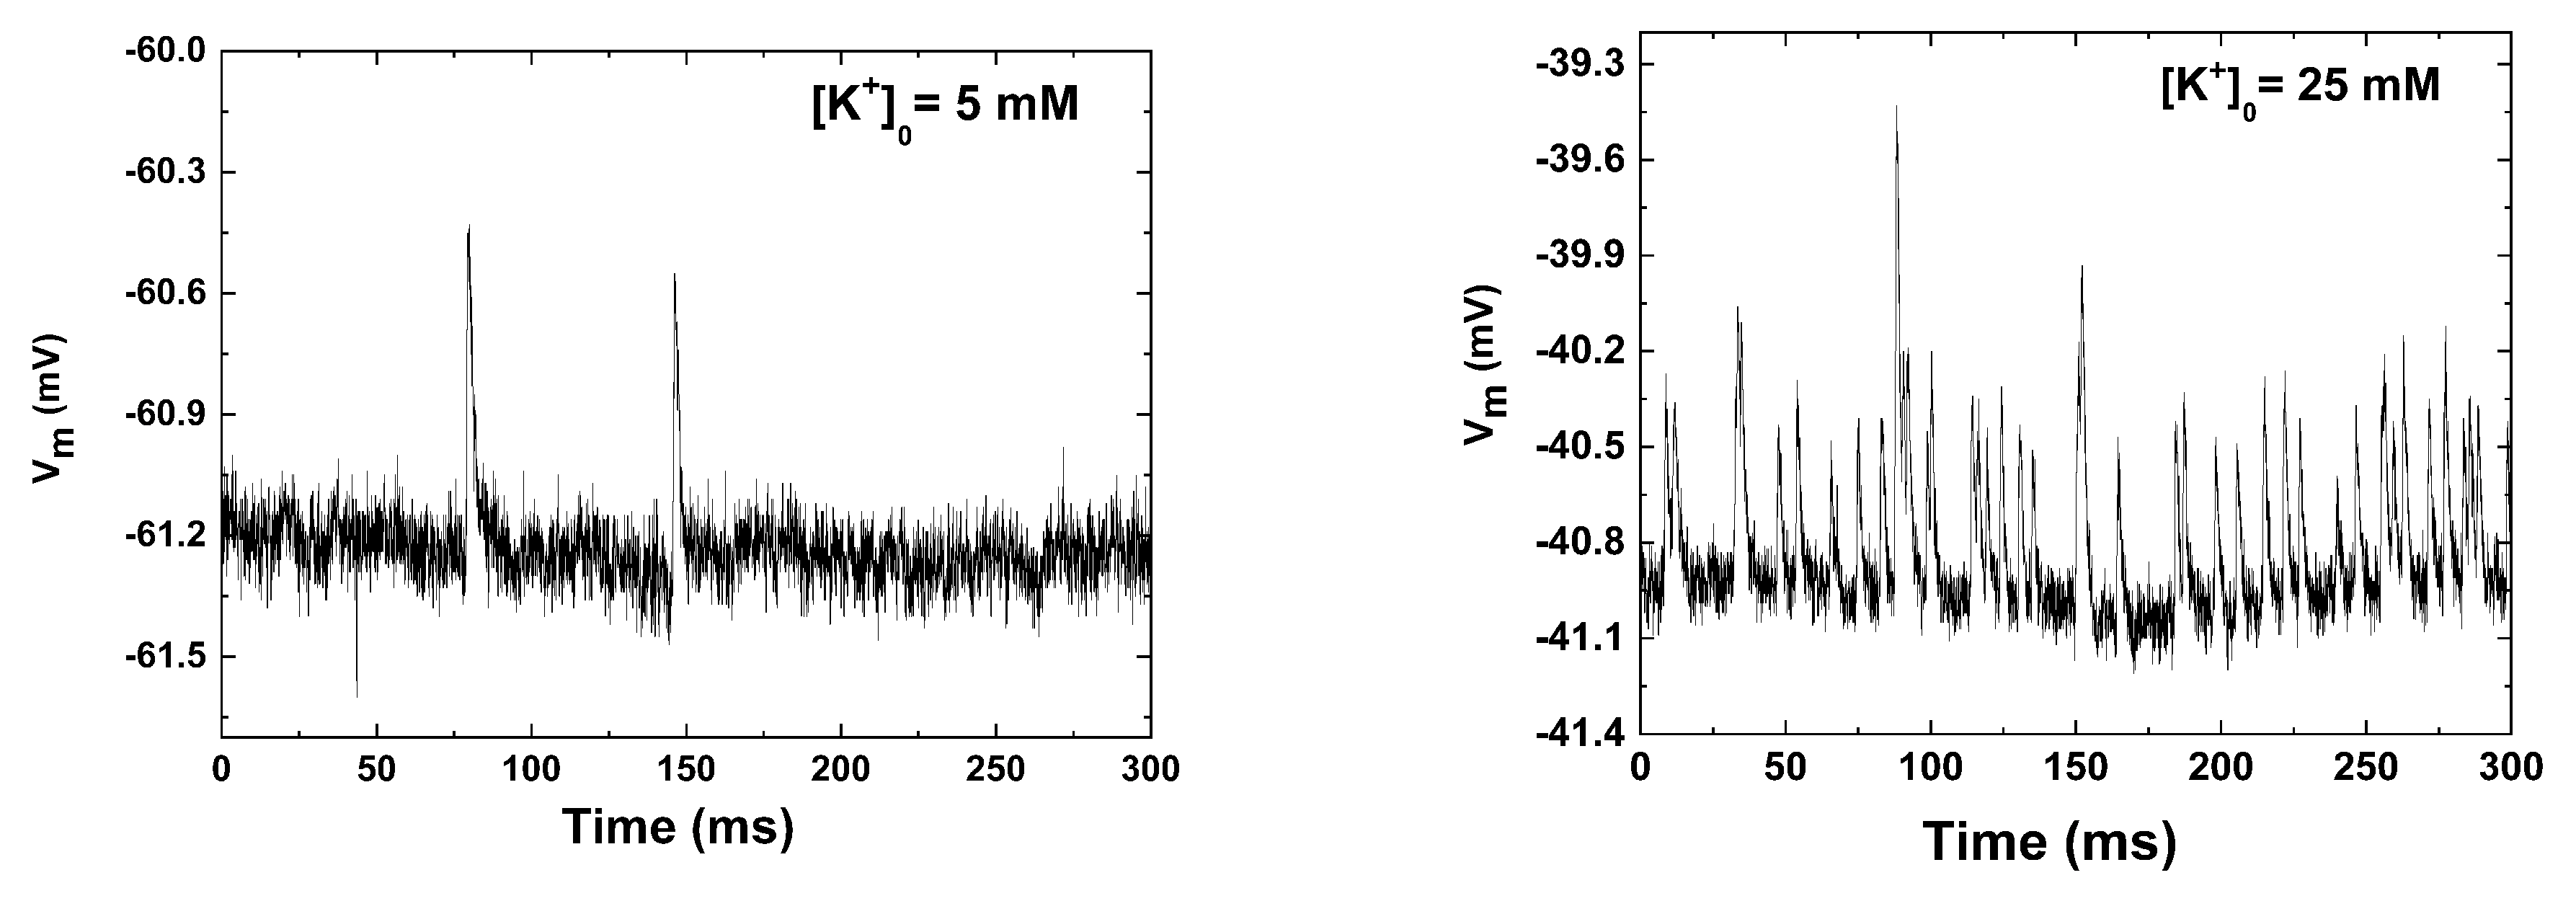
3. Electrophysiological Recordings
4. Conformity Analysis
5. Results
6. Discussion
7. Conclusions
Author Contributions
Funding
Data Availability Statement
Acknowledgments
Conflicts of Interest
References
- Silva, A.J.; Floquet, S.; Santos, D.O.C.; Lima, R.F. On the validation of Newcomb-Benford law and Weibull distribution in neuromuscular transmission. Phys. A Stat. Mech. Appl. 2020, 553, 124606. [Google Scholar] [CrossRef]
- Van der Kloot, W. The regulation of quantal size. Prog. Neurobiol. 1991; 36, 93–130. [Google Scholar]
- Katz, B. Quantal mechanism of neural transmitter release. Science 1971, 173, 123–126. [Google Scholar] [CrossRef]
- Bennett, M.R.; Kearns, J.L. Statistics of transmitter release at nerve terminals. Prog. Neurobiol. 2000, 60, 545–606. [Google Scholar] [CrossRef]
- Robinson, J. Estimation of parameters for a model of transmitter release at synapses. Biometrics. 1976, 32, 61–68. [Google Scholar] [CrossRef] [PubMed]
- Washio, H.M.; Inouye, S.T. The statistical analysis of spontaneous transmitter release at individual junctions on cockroach muscle. J. Exp. Biol. 1980, 87, 195–201. [Google Scholar] [CrossRef] [PubMed]
- Cohen, I.; Kita, H.; Van der Kloot, W. Miniature end-plate potentials: evidence that the intervals are not fit by a Poisson distribution. Brain Res. 1973, 54, 318–323. [Google Scholar] [CrossRef] [PubMed]
- Lowen, S.B.; Cash, S.S.; Poo, M.; Teich, M.C. Quantal neurotransmitter secretion rate exhibits fractal behavior. J Neurosci. 1997, 17, 5666–5677. [Google Scholar] [CrossRef] [PubMed]
- Takeda, T.; Sakata, A.; Matsuoka, T. Fractal dimensions in the occurrence of miniature end-plate potential in a vertebrate neuromuscular junction. Prog. Neuropsychopharmacol. Biol. Psychiatry. 1999, 23, 1157–1169. [Google Scholar] [CrossRef]
- Harlow, M.L.; Ress, D.; Stoschek, A.; Marshall; R.M.; McMahan, U.J. The architecture of active zone material at the frog’s neuromuscular junction. Nature 2001, 409, 479–484. [CrossRef]
- Bennett, M.R.; Robinson, J. Probabilistic secretion of quanta from nerve terminals at synaptic sites on muscle cells: non-uniformity, autoinhibition and the binomial hypothesis. Proc. R. Soc. Lond. B. Biol. Sci. 1990, 239, 329–358. [Google Scholar] [CrossRef]
- Newcomb, S. Note on the Frequency of Use of the Different Digits in Natural Numbers. Am. J. Math. 1881, 04, 39–40. [Google Scholar] [CrossRef]
- Benford, F. The Law of Anomalous Numbers. Benford. Proc. Am. Philos. Soc. 1938, 78, 551–572. [Google Scholar]
- Kossovsky, A.E. Benford’s Law: Theory, the General Law of Relative Quantities, and Forensic Fraud Detection Applications; World Scientific: Singapore, 2014. [Google Scholar]
- Berger, A.; Hill, T. An Introduction to Benford’s Law; Princeton University Press; Princeton, NJ, USA, 2015.
- Hill, T. P. A Statistical Derivation of the Significant-Digit Law. Statistical Science 1995, 10, 354–363. [Google Scholar] [CrossRef]
- Hill, T. P. The Significant-Digit Phenomenon. The American Mathematical Monthly 1995, 102, 322–327. [Google Scholar] [CrossRef]
- Hill, T. P. Base-Invariance Implies Benford’s Law. Proceedings of the American Mathematical Society 1995, 123, 887–895. [Google Scholar]
- Burgos, A.; Santos, A. Am. J. Phys. 2021, 89, 851–861.
- Morag, S.; Salmon-Divon, M. Characterizing Human Cell Types and Tissue Origin Using the Benford Law. Cells 2019, 8, 1004. [Google Scholar] [CrossRef] [PubMed]
- Crocetti, E.; Randi, G. Using the Benford’s Law as a First Step to Assess the Quality of the Cancer Registry Data. Front. Public Health. 2016, 13, 225. [Google Scholar] [CrossRef]
- Yan, X.; Yang, S.; Kim, B. J.; Minnhagen, P. Benford’s law and first letter of words. Phys. A Stat. Mech. Appl. 2018, 512, 305–315. [Google Scholar] [CrossRef]
- Toledo, P.A.; Riquelme, S. R.; Campos, J. A. Earthquake source parameters that display the first digit phenomenon. Nonlin. Processes Geophys. 2015; 22, 625–632. [Google Scholar] [CrossRef]
- Bassingthwaighte, J.B.; Leibovitch, L.S.; West, B.J. Fractal Physiology; Oxford University Press: New York, NY, USA, 1994. [Google Scholar]
- Seenivasan, P.; Easwaran. S.; Sridhar, S. Sinha, S. Using Skewness and the First-Digit Phenomenon to Identify Dynamical Transitions in Cardiac Models. Front. Physiol. 2015, 06, 390.
- Tirunagari,S.; Abasolo, D.; Iorliam, A.; Ho, A. T. S.; Poh, N. Using Benford’s law to detect anomalies in electroencephalogram: An application to detecting alzheimer’s disease. IEEE Conference on Computational Intelligence in Bioinformatics and Computational Biology. 2017; 1–6. [CrossRef]
- Lindinger, M.I.; Cairns, S.P. Regulation of muscle potassium: exercise performance, fatigue and health implications. Eur. J. Appl. Physiol. 2021, 121, 721–748. [Google Scholar] [CrossRef]
- Maljevic, S.; Lerche, H. Potassium channels: a review of broadening therapeutic possibilities for neurological diseases. J. Neurol. 2013, 260, 2201–2211. [Google Scholar] [CrossRef] [PubMed]
- Grohovaz, F.; Fesce, R.; Haimann, C. Dual effect of potassium on transmitter exocytosis. Cell Biol. Int. Rep. 1989, 12, 1085–1095. [Google Scholar] [CrossRef] [PubMed]
- Adrian, R.H. The effect of internal and external potassium concentration on the membrane potential of frog muscle. J. Physiol. 1956, 133, 631–658. [Google Scholar] [CrossRef] [PubMed]
- Ceccarelli, B.; Fesce, R.; Grohovaz, F.; Haimann, C. The effect of potassium on exocytosis of transmitter at the frog neuromuscular junction. J. Physiol. 1988, 401, 163–183. [Google Scholar] [CrossRef] [PubMed]
- Syková, E.; Nicholson, C. Diffusion in brain extracellular space. Physiol. Rev. 2008, 88, 1277–1340. [Google Scholar] [CrossRef]
- Diekmann, A. Not the First Digit! Using Benford’s Law to Detect Fraudulent Scientif ic Data. J. Appl. Stat. 2007, 34, 321–329. [Google Scholar] [CrossRef]
- Nigrini, M.J. Benford’s Law: Applications for Forensic Accounting, Auditing, and Fraud Detection; John Wiley & Sons: Hoboken, NJ, USA, 2012. [Google Scholar]
- Díaz, J.; Gallart, J.; Ruiz, M. On the Ability of the Benford’s Law to Detect Earthquakes and Discriminate Seismic Signals. Seismol. Res. Lett. 2014, 86, 192–201. [Google Scholar] [CrossRef]
- Gauvrit, N.G.; Houillon, J.C.; Delahaye, J.P. Generalized Benford’s Law as a Lie Detector. Adv. Cogn. Psychol. 2017, 13, 121–127. [Google Scholar] [CrossRef]
- Pietronero, L.; Tosatti, E.; Tosatti, V.; Vespignani, A. Explaining the uneven distribution of numbers in nature: the laws of Benford and Zipf, Explaining the uneven distribution of numbers in nature: the laws of Benford and Zipf. Phys. A. 2001, 293, 297–304. [Google Scholar] [CrossRef]
- Silva, A.J.; Trindade, M.A.; Santos, D.O.; Lima, R.F. Maximum-likelihood q-estimator uncovers the role of potassium at neuromuscular junctions. Biol. Cybern. 2016, 110, 31–40. [Google Scholar] [CrossRef] [PubMed]
- Lima, R. F.; Prado, V.F.; Prado, M.A.; Kushmerick, C. Quantal release of acetylcholine in mice with reduced levels of the vesicular acetylcholine transporter. J. Neurochem. 2010, 113, 943–951. [Google Scholar] [CrossRef]
- Cerqueti, R.; Maggi, M. Data validity and statistical conformity with Benford’s Law. Chaos Solit. Fractals. 2021, 144, 110740. [Google Scholar] [CrossRef]
- Cerqueti, R.; Lupi, C. Severe testing of Benford’s law. TEST. 2023, 32, 677–694. [Google Scholar] [CrossRef]
- Nakanishi, T.; Norris, F.H. Effect of local temperature on resting membrane potential in rat muscle. Electroencephalogr. Clin. Neurophysiol. 1969, 718, 633–636. [Google Scholar] [CrossRef]
- Ward, D.; Crowley, W.J.; Johns, T.R. Effects of temperature at the neuromuscular junction. Am. J. Physiol. 1972, 222, 216–219. [Google Scholar] [CrossRef]
- White, R. Effects of high temperature and low calcium on neuromuscular transmission in frog. J. Therm. Biol. 1976, 01, 227–232. [Google Scholar] [CrossRef]
- Procopio, J.; Fornés, J.A. Fluctuation-dissipation theorem imposes high-voltage fluctuations in biological ionic channels. Phys. Rev. E. 1995, 51, 829–831. [Google Scholar] [CrossRef]
- Chame, A.; Mello, E. V. L. The fluctuation-dissipation theorem in the framework of the Tsallis statistics J. Phys. A: Math. Gen. 1994, 27, 3663–3670. [Google Scholar] [CrossRef]
- Silva, A.J.; Floquet, S.; Santos, D.O.C. Statistical crossover and nonextensive behavior of neuronal short-term depression. J. Biol. Phys. 2018, 44, 37–50. [Google Scholar] [CrossRef]
- Shao. L.; Ma, B.Q. First-digit law in nonextensive statistics. Phys. Rev. E 2010, 82, 041110. [Google Scholar] [CrossRef] [PubMed]
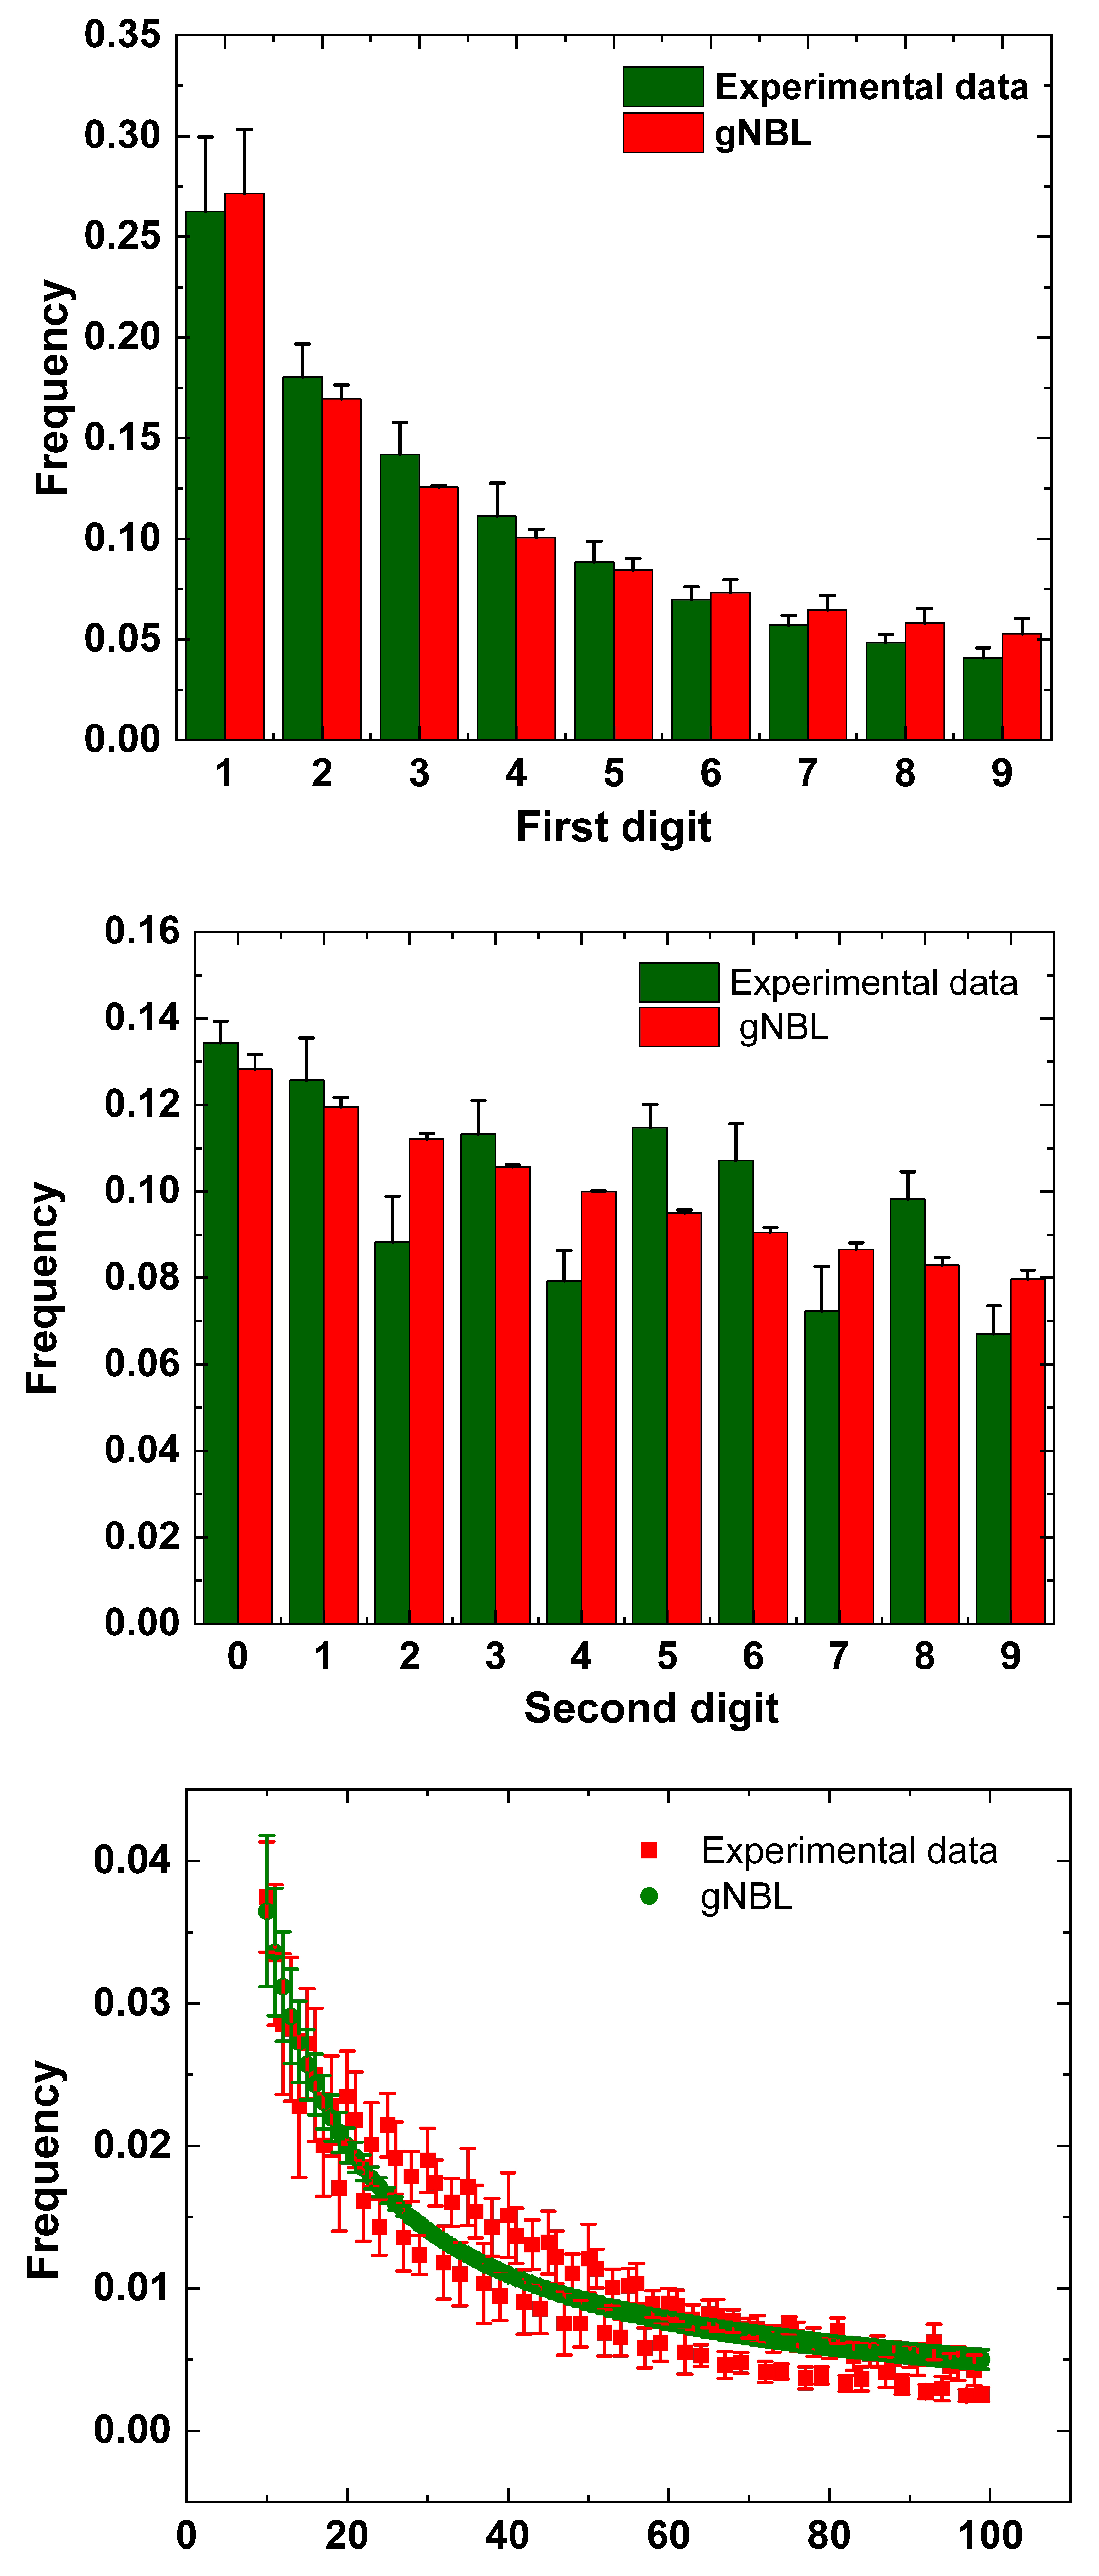
| Digit | 0 | 1 | 2 | 3 | 4 | 5 | 6 | 7 | 8 | 9 |
|---|---|---|---|---|---|---|---|---|---|---|
| 1st | - | 0.30103 | 0.17609 | 0.12494 | 0.09691 | 0.07918 | 0.06695 | 0.05799 | 0.05115 | 0.04576 |
| 2nd | 0.11968 | 0.11389 | 0.10882 | 0.10433 | 0.10031 | 0.09668 | 0.09337 | 0.09035 | 0.08757 | 0.08500 |
| First Digit | Second Digit | First-two Digits | |||||
|---|---|---|---|---|---|---|---|
| Range | Conformity | Range | Conformity | Range | Conformity | ||
| MAD | to | Close | to | Close | to | Close | |
| to | Acceptable | to | Acceptable | to | Acceptable | ||
| to | Marginal | to | Marginal | to | Marginal | ||
| above | Nonconformity | above | Nonconformity | above | Nonconformity | ||
| SSD | 0 to 2 | Close | 0 to 2 | Close | 0 to 2 | Close | |
| 2 to 25 | Acceptable | 2 to 10 | Acceptable | 2 to 10 | Acceptable | ||
| 25 to 100 | Marginal | 10 to 50 | Marginal | 10 to 50 | Marginal | ||
| above 100 | Nonconformity | above 50 | Nonconformity | above 50 | Nonconformity | ||
| First digit | ||||
|---|---|---|---|---|
| Data | n | MAD | Excess MAD | SSD |
| 1 | 730 | 0.00837 | -0.00032 | 12.28475 |
| 2 | 869 | 0.01995 | 0.01198 | 86.45288 |
| 3 | 2181 | 0.00989 | 0.00486 | 16.56178 |
| 4 | 928 | 0.00858 | 0.00087 | 10.08629 |
| 5 | 2973 | 0.01305 | 0.00874 | 21.54770 |
| 6 | 642 | 0.00986 | 0.00060 | 9.91123 |
| 7 | 1349 | 0.00887 | 0.00248 | 10.38188 |
| 8 | 1162 | 0.01270 | 0.00581 | 18.13111 |
| 9 | 1685 | 0.00845 | 0.00273 | 11.65409 |
| 10 | 1009 | 0.01137 | 0.00398 | 16.06490 |
| 11 | 2048 | 0.00807 | 0.00288 | 7.53752 |
| 12 | 3060 | 0.00722 | 0.00298 | 8.61009 |
| 13 | 1510 | 0.01192 | 0.00588 | 27.89886 |
| 14 | 2436 | 0.00916 | 0.00440 | 9.96616 |
| Second digit | ||||
| Data | n | MAD | Excess MAD | SSD |
| 1 | 730 | 0.00683 | -0.00202 | 8.19079 |
| 2 | 869 | 0.00950 | 0.00139 | 12.32210 |
| 3 | 2181 | 0.00544 | 0.00033 | 4.28136 |
| 4 | 928 | 0.00851 | 0.00067 | 12.11295 |
| 5 | 2973 | 0.00318 | -0.00120 | 1.80299 |
| 6 | 642 | 0.00558 | -0.00385 | 4.44022 |
| 7 | 1349 | 0.00466 | -0.00184 | 3.15052 |
| 8 | 1162 | 0.00785 | 0.00084 | 8.96622 |
| 9 | 1685 | 0.00692 | 0.00110 | 7.73984 |
| 10 | 1009 | 0.00494 | -0.00258 | 3.72527 |
| 11 | 2048 | 0.00525 | -0.00003 | 3.96622 |
| 12 | 3060 | 0.00495 | 0.00063 | 3.65075 |
| 13 | 1510 | 0.00612 | -0.00003 | 5.18546 |
| 14 | 2436 | 0.00529 | 0.00045 | 4.44622 |
| Data | n | MAD | Excess MAD | SSD |
| 1 | 730 | 0.00253 | -0.00040 | 10.83412 |
| 2 | 869 | 0.00366 | 0.00097 | 21.72249 |
| 3 | 2181 | 0.00232 | 0.00062 | 8.81407 |
| 4 | 928 | 0.00276 | 0.00016 | 12.93240 |
| 5 | 2973 | 0.00177 | 0.00031 | 5.02102 |
| 6 | 642 | 0.00268 | -0.00045 | 9.19816 |
| 7 | 1349 | 0.00225 | 0.00009 | 7.40826 |
| 8 | 1162 | 0.00244 | 0.00012 | 8.78088 |
| 9 | 1685 | 0.00225 | 0.00031 | 8.69891 |
| 10 | 1009 | 0.00240 | -0.00010 | 7.84890 |
| 11 | 2048 | 0.00169 | -0.00006 | 4.39289 |
| 12 | 3060 | 0.00141 | -0.00002 | 4.12983 |
| 13 | 1510 | 0.00263 | 0.00059 | 10.24864 |
| 14 | 2436 | 0.00167 | 0.00007 | 4.34060 |
| First digit | ||||
|---|---|---|---|---|
| Data | n | MAD | Excess MAD | SSD |
| 1 | 56853 | 0.02687 | 0.02589 | 117.77678 |
| 2 | 40951 | 0.02383 | 0.02267 | 102.72734 |
| 3 | 72519 | 0.01827 | 0.01740 | 69.91262 |
| 4 | 51207 | 0.00910 | 0.00807 | 11.41064 |
| 5 | 112330 | 0.01375 | 0.01305 | 36.17818 |
| 6 | 107801 | 0.01952 | 0.01881 | 52.04470 |
| 7 | 36330 | 0.00619 | 0.00496 | 4.52025 |
| 8 | 37758 | 0.00117 | -0.00004 | 0.25865 |
| 9 | 37703 | 0.00732 | 0.00611 | 7.98955 |
| 10 | 72787 | 0.02064 | 0.01977 | 92.09016 |
| 11 | 34833 | 0.01054 | 0.00928 | 19.34788 |
| 12 | 29313 | 0.00318 | 0.00180 | 1.77512 |
| Data | n | MAD | Excess MAD | SSD |
| 1 | 56853 | 0.00995 | 0.00895 | 16.15754 |
| 2 | 40951 | 0.00705 | 0.00586 | 6.48468 |
| 3 | 72519 | 0.02088 | 0.02000 | 46.27171 |
| 4 | 51207 | 0.01589 | 0.01484 | 26.70868 |
| 5 | 112330 | 0.01601 | 0.01530 | 29.43487 |
| 6 | 107801 | 0.02213 | 0.02140 | 52.58192 |
| 7 | 36330 | 0.01576 | 0.01450 | 26.28400 |
| 8 | 37758 | 0.01441 | 0.01318 | 21.98806 |
| 9 | 37703 | 0.01253 | 0.01130 | 16.74141 |
| 10 | 72787 | 0.02409 | 0.02320 | 61.55550 |
| 11 | 34833 | 0.01854 | 0.01726 | 37.01945 |
| 12 | 29313 | 0.01897 | 0.01757 | 38.09396 |
| First-two digits | ||||
| Data | n | MAD | Excess MAD | SSD |
| 1 | 56853 | 0.00301 | 0.00268 | 15.60049 |
| 2 | 40951 | 0.00249 | 0.00209 | 12.89166 |
| 3 | 72519 | 0.00308 | 0.00278 | 13.89474 |
| 4 | 51207 | 0.00181 | 0.00146 | 4.98217 |
| 5 | 112330 | 0.00231 | 0.00207 | 8.19403 |
| 6 | 107801 | 0.00318 | 0.00294 | 14.78929 |
| 7 | 36330 | 0.00192 | 0.00150 | 3.94064 |
| 8 | 37758 | 0.00163 | 0.00122 | 2.85762 |
| 9 | 37703 | 0.00160 | 0.00119 | 3.65519 |
| 10 | 72787 | 0.00349 | 0.00320 | 17.89426 |
| 11 | 34833 | 0.00243 | 0.00200 | 6.71510 |
| 12 | 29313 | 0.00217 | 0.00171 | 5.13421 |
| First digit | ||||
|---|---|---|---|---|
| Data | n | Alpha | MAD | SSD |
| 1 | 730 | 1,09734 | 0,00636 | 5,35810 |
| 2 | 869 | 1,30536 | 0,01065 | 16,90700 |
| 3 | 2181 | 0,85783 | 0,00349 | 1,97250 |
| 4 | 928 | 0,98698 | 0,00828 | 9,96370 |
| 5 | 2973 | 0,87338 | 0,00851 | 9,87620 |
| 6 | 642 | 1,07180 | 0,00713 | 5,96820 |
| 7 | 1349 | 0,96904 | 0,00844 | 9,65490 |
| 8 | 1162 | 1,08773 | 0,01008 | 12,10020 |
| 9 | 1685 | 0,93251 | 0,00728 | 8,23990 |
| 10 | 1009 | 0,89552 | 0,00824 | 8,04460 |
| 11 | 2048 | 1,05146 | 0,00661 | 5,51620 |
| 12 | 3060 | 1,09466 | 0,00368 | 1,97250 |
| 13 | 1510 | 0,86705 | 0,01149 | 14,54340 |
| 14 | 2436 | 1,06165 | 0,00794 | 7,02810 |
| Second digit | ||||
| Data | n | Alpha | MAD | SSD |
| 1 | 730 | 0,88315 | 0,00703 | 7,88420 |
| 2 | 869 | 1,20207 | 0,00977 | 11,27090 |
| 3 | 2181 | 0,76299 | 0,00480 | 3,19950 |
| 4 | 928 | 0,56741 | 0,00699 | 8,74690 |
| 5 | 2973 | 0,96940 | 0,00328 | 1,78210 |
| 6 | 642 | 0,82057 | 0,00565 | 3,79340 |
| 7 | 1349 | 0,83357 | 0,00431 | 2,57830 |
| 8 | 1162 | 1,14257 | 0,00794 | 8,44120 |
| 9 | 1685 | 1,14975 | 0,00653 | 7,19650 |
| 10 | 1009 | 1,04217 | 0,00485 | 3,68420 |
| 11 | 2048 | 0,82621 | 0,00465 | 3,33970 |
| 12 | 3060 | 1,08013 | 0,00531 | 3,49580 |
| 13 | 1510 | 0,61821 | 0,00425 | 2,57810 |
| 14 | 2436 | 0,98519 | 0,00538 | 4,44090 |
| Data | n | Alpha | MAD | SSD |
| 1 | 730 | 1,11785 | 0,00241 | 9,63330 |
| 2 | 869 | 1,24452 | 0,00329 | 16,11180 |
| 3 | 2181 | 0,86327 | 0,00214 | 7,27660 |
| 4 | 928 | 0,97734 | 0,00276 | 12,88900 |
| 5 | 2973 | 0,87317 | 0,00157 | 3,66930 |
| 6 | 642 | 1,06433 | 0,00259 | 8,82400 |
| 7 | 1349 | 0,94217 | 0,00219 | 7,11010 |
| 8 | 1162 | 1,07238 | 0,00236 | 8,29090 |
| 9 | 1685 | 0,91808 | 0,00223 | 8,10760 |
| 10 | 1009 | 0,90327 | 0,00230 | 7,05690 |
| 11 | 2048 | 1,05125 | 0,00166 | 4,15790 |
| 12 | 3060 | 1,09810 | 0,00129 | 3,28490 |
| 13 | 1510 | 0,84443 | 0,00248 | 8,13420 |
| 14 | 2436 | 1,03307 | 0,00165 | 4,23940 |
| First digit | ||||
|---|---|---|---|---|
| Data | n | Alpha | MAD | SSD |
| 1 | 56853 | 0,68616 | 0,01982 | 45,09730 |
| 2 | 40951 | 0,73411 | 0,02093 | 47,66000 |
| 3 | 72519 | 0,75305 | 0,01487 | 23,73950 |
| 4 | 51207 | 1,10501 | 0,00427 | 3,05230 |
| 5 | 112330 | 0,83126 | 0,01152 | 14,63950 |
| 6 | 107801 | 0,87603 | 0,01860 | 39,84270 |
| 7 | 36330 | 0,92700 | 0,00228 | 0,68170 |
| 8 | 37758 | 1,00437 | 0,00123 | 0,24450 |
| 9 | 37703 | 1,02816 | 0,00712 | 7,37960 |
| 10 | 72787 | 0,70165 | 0,01540 | 25,51630 |
| 11 | 34833 | 0,84972 | 0,00475 | 2,89430 |
| 12 | 29313 | 0,96620 | 0,00265 | 0,92750 |
| Data | n | Alpha | MAD | SSD |
| 1 | 56853 | 1,26913 | 0,00928 | 14,27730 |
| 2 | 40951 | 0,95827 | 0,00709 | 6,44590 |
| 3 | 72519 | 1,26304 | 0,01965 | 44,44780 |
| 4 | 51207 | 1,30622 | 0,01444 | 24,16300 |
| 5 | 112330 | 1,28374 | 0,01468 | 27,29740 |
| 6 | 107801 | 1,32020 | 0,02061 | 49,80040 |
| 7 | 36330 | 1,29637 | 0,01436 | 23,90470 |
| 8 | 37758 | 1,27543 | 0,01312 | 19,94300 |
| 9 | 37703 | 1,21247 | 0,01155 | 15,56480 |
| 10 | 72787 | 1,29532 | 0,02269 | 59,22550 |
| 11 | 34833 | 1,38829 | 0,01666 | 32,80310 |
| 12 | 29313 | 1,31114 | 0,01749 | 35,45490 |
| First-two digits | ||||
| Data | n | Alpha | MAD | SSD |
| 1 | 56853 | 0,71868 | 0,00249 | 9,14370 |
| 2 | 40951 | 0,73705 | 0,00220 | 6,82500 |
| 3 | 72519 | 0,76779 | 0,00272 | 9,27860 |
| 4 | 51207 | 1,08779 | 0,00183 | 4,27770 |
| 5 | 112330 | 0,84541 | 0,00215 | 6,12730 |
| 6 | 107801 | 0,87479 | 0,00314 | 13,35130 |
| 7 | 36330 | 0,95909 | 0,00189 | 3,80170 |
| 8 | 37758 | 1,00499 | 0,00164 | 2,85540 |
| 9 | 37703 | 1,00683 | 0,00160 | 3,65090 |
| 10 | 72787 | 0,72606 | 0,00309 | 11,62400 |
| 11 | 34833 | 0,88760 | 0,00224 | 5,66890 |
| 12 | 29313 | 0,97453 | 0,00214 | 5,07780 |
Disclaimer/Publisher’s Note: The statements, opinions and data contained in all publications are solely those of the individual author(s) and contributor(s) and not of MDPI and/or the editor(s). MDPI and/or the editor(s) disclaim responsibility for any injury to people or property resulting from any ideas, methods, instructions or products referred to in the content. |
© 2023 by the authors. Licensee MDPI, Basel, Switzerland. This article is an open access article distributed under the terms and conditions of the Creative Commons Attribution (CC BY) license (http://creativecommons.org/licenses/by/4.0/).


