Submitted:
13 September 2023
Posted:
19 September 2023
You are already at the latest version
Abstract
Keywords:
1. Introduction
2. Materials and Methods
2.1. Materials
2.2. Synthesis Procedures
2.3. 1H NMR and FTIR Measurements
2.4. Physicochemical Characterization
2.5. Oxidative Stability
2.6. Thermal Stability
2.7. Tribological Evaluation
3. Results and Discussion
3.1. Physicochemical Characterization
3.2. Chemical Characterization
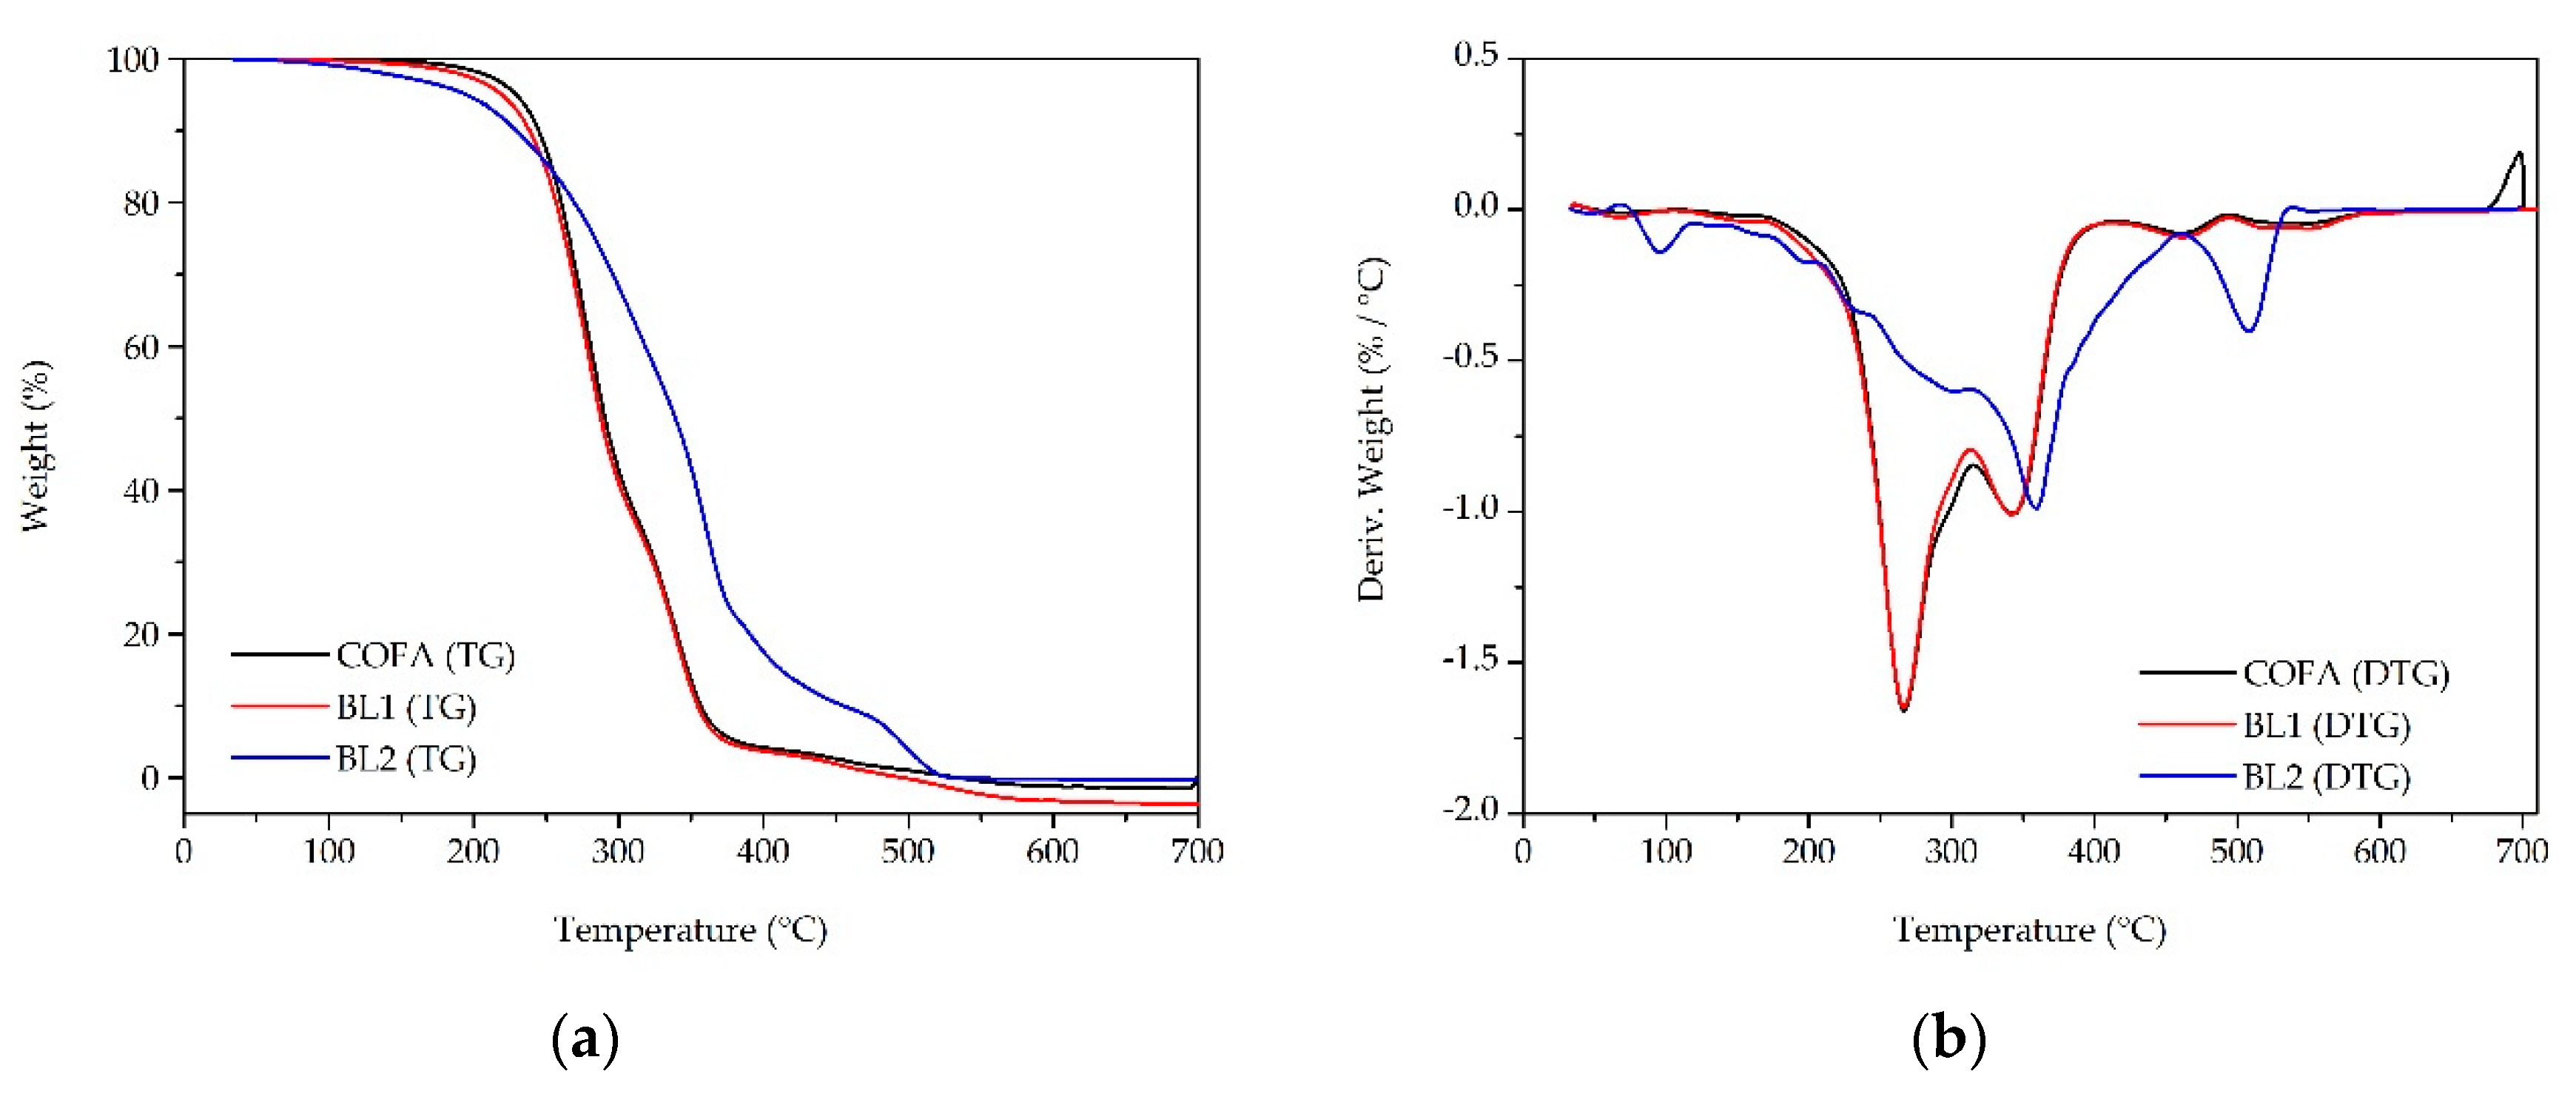
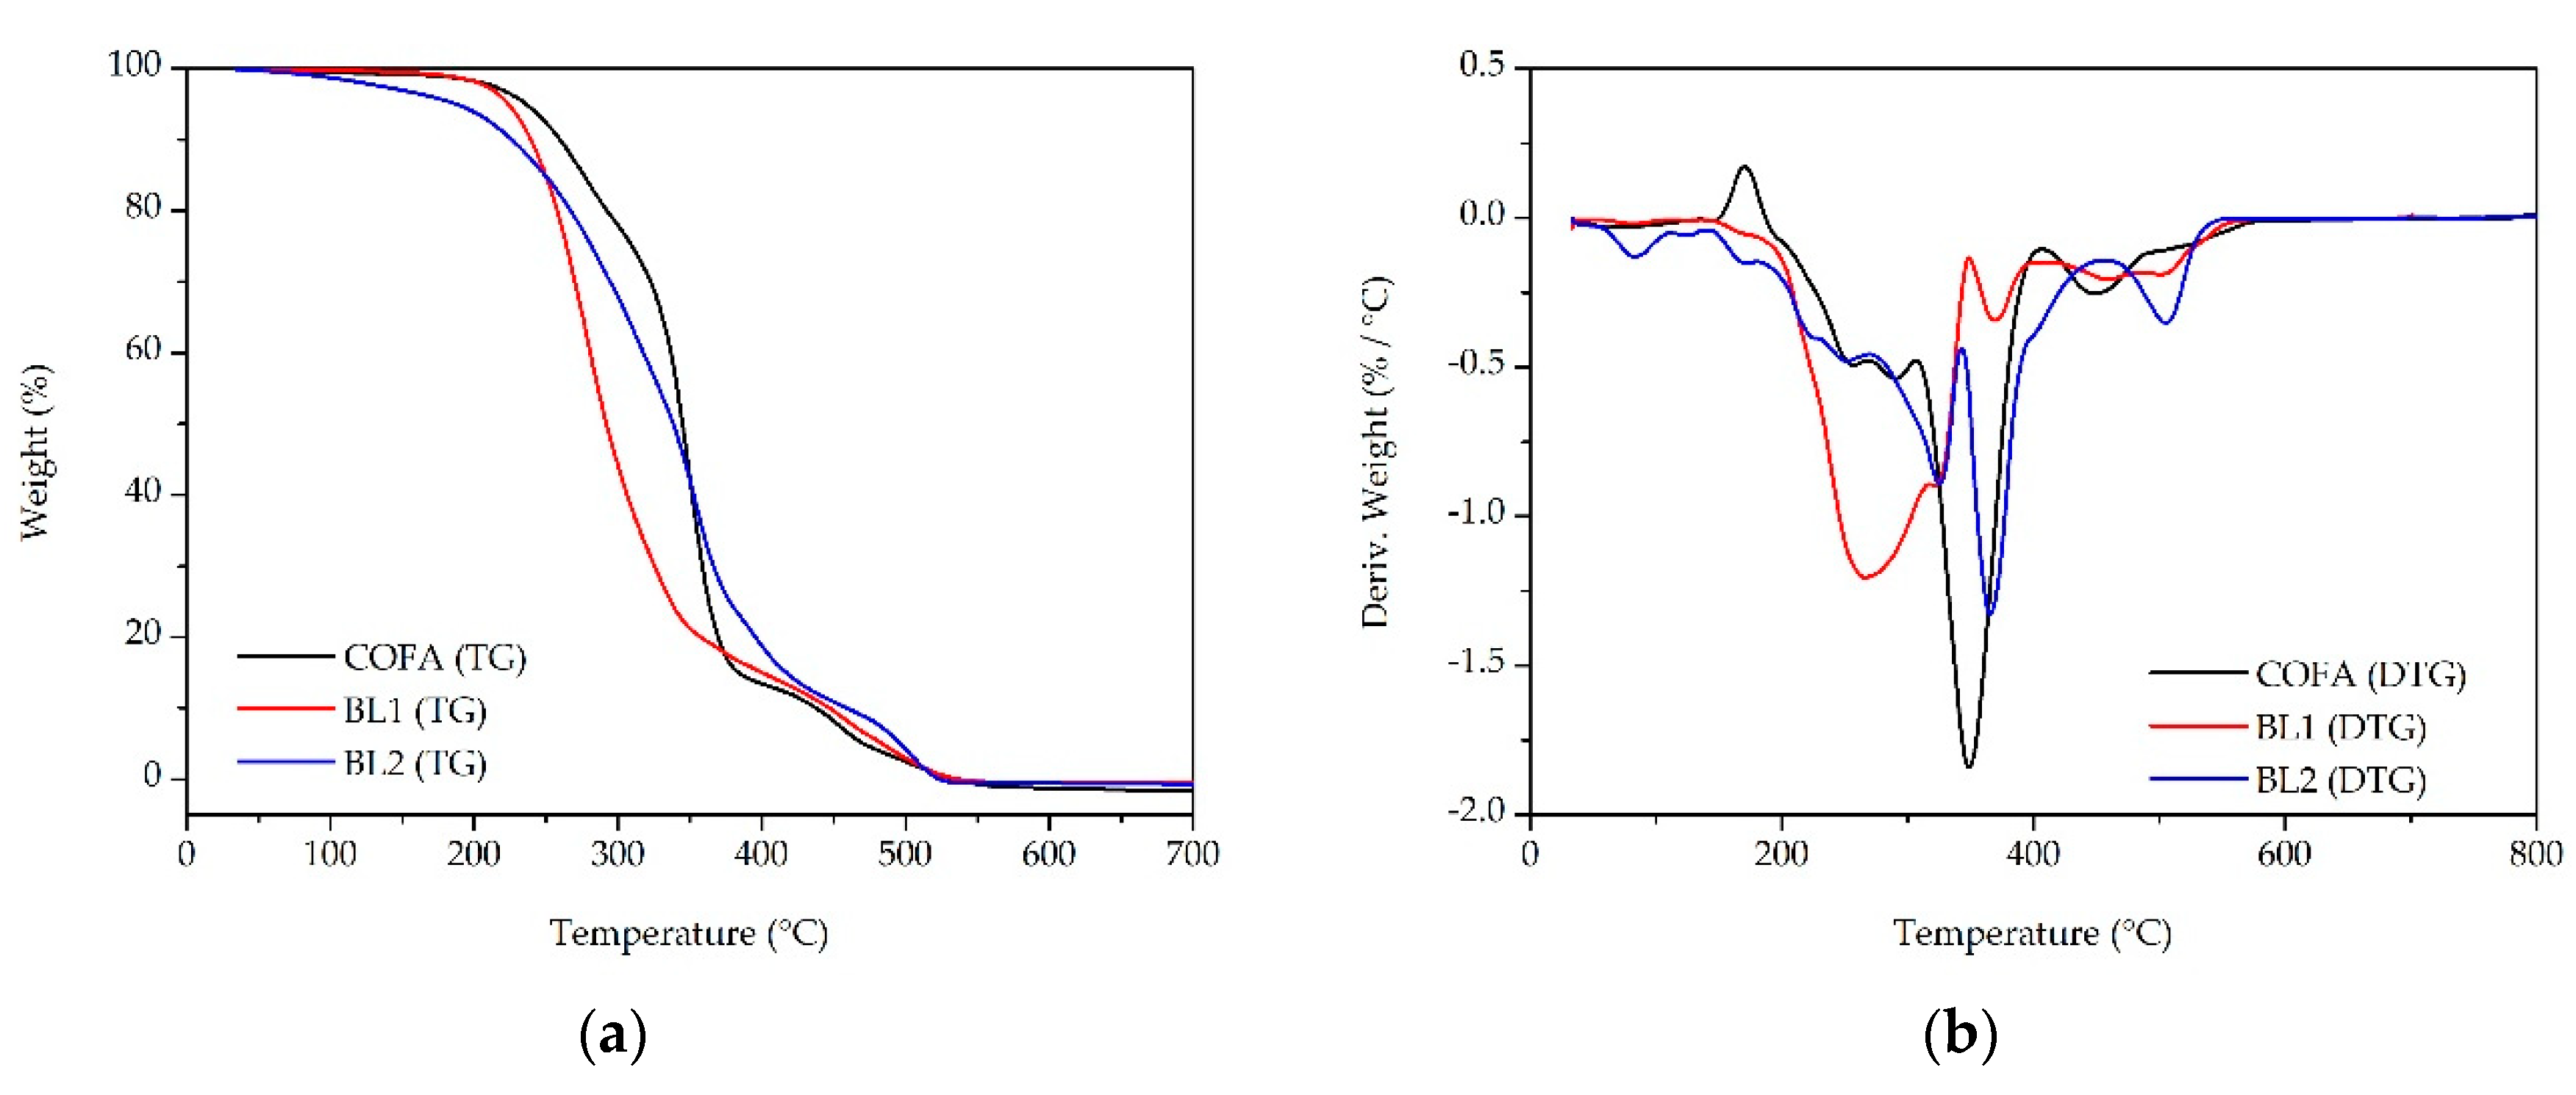
3.3. Thermal-Oxidative Stability
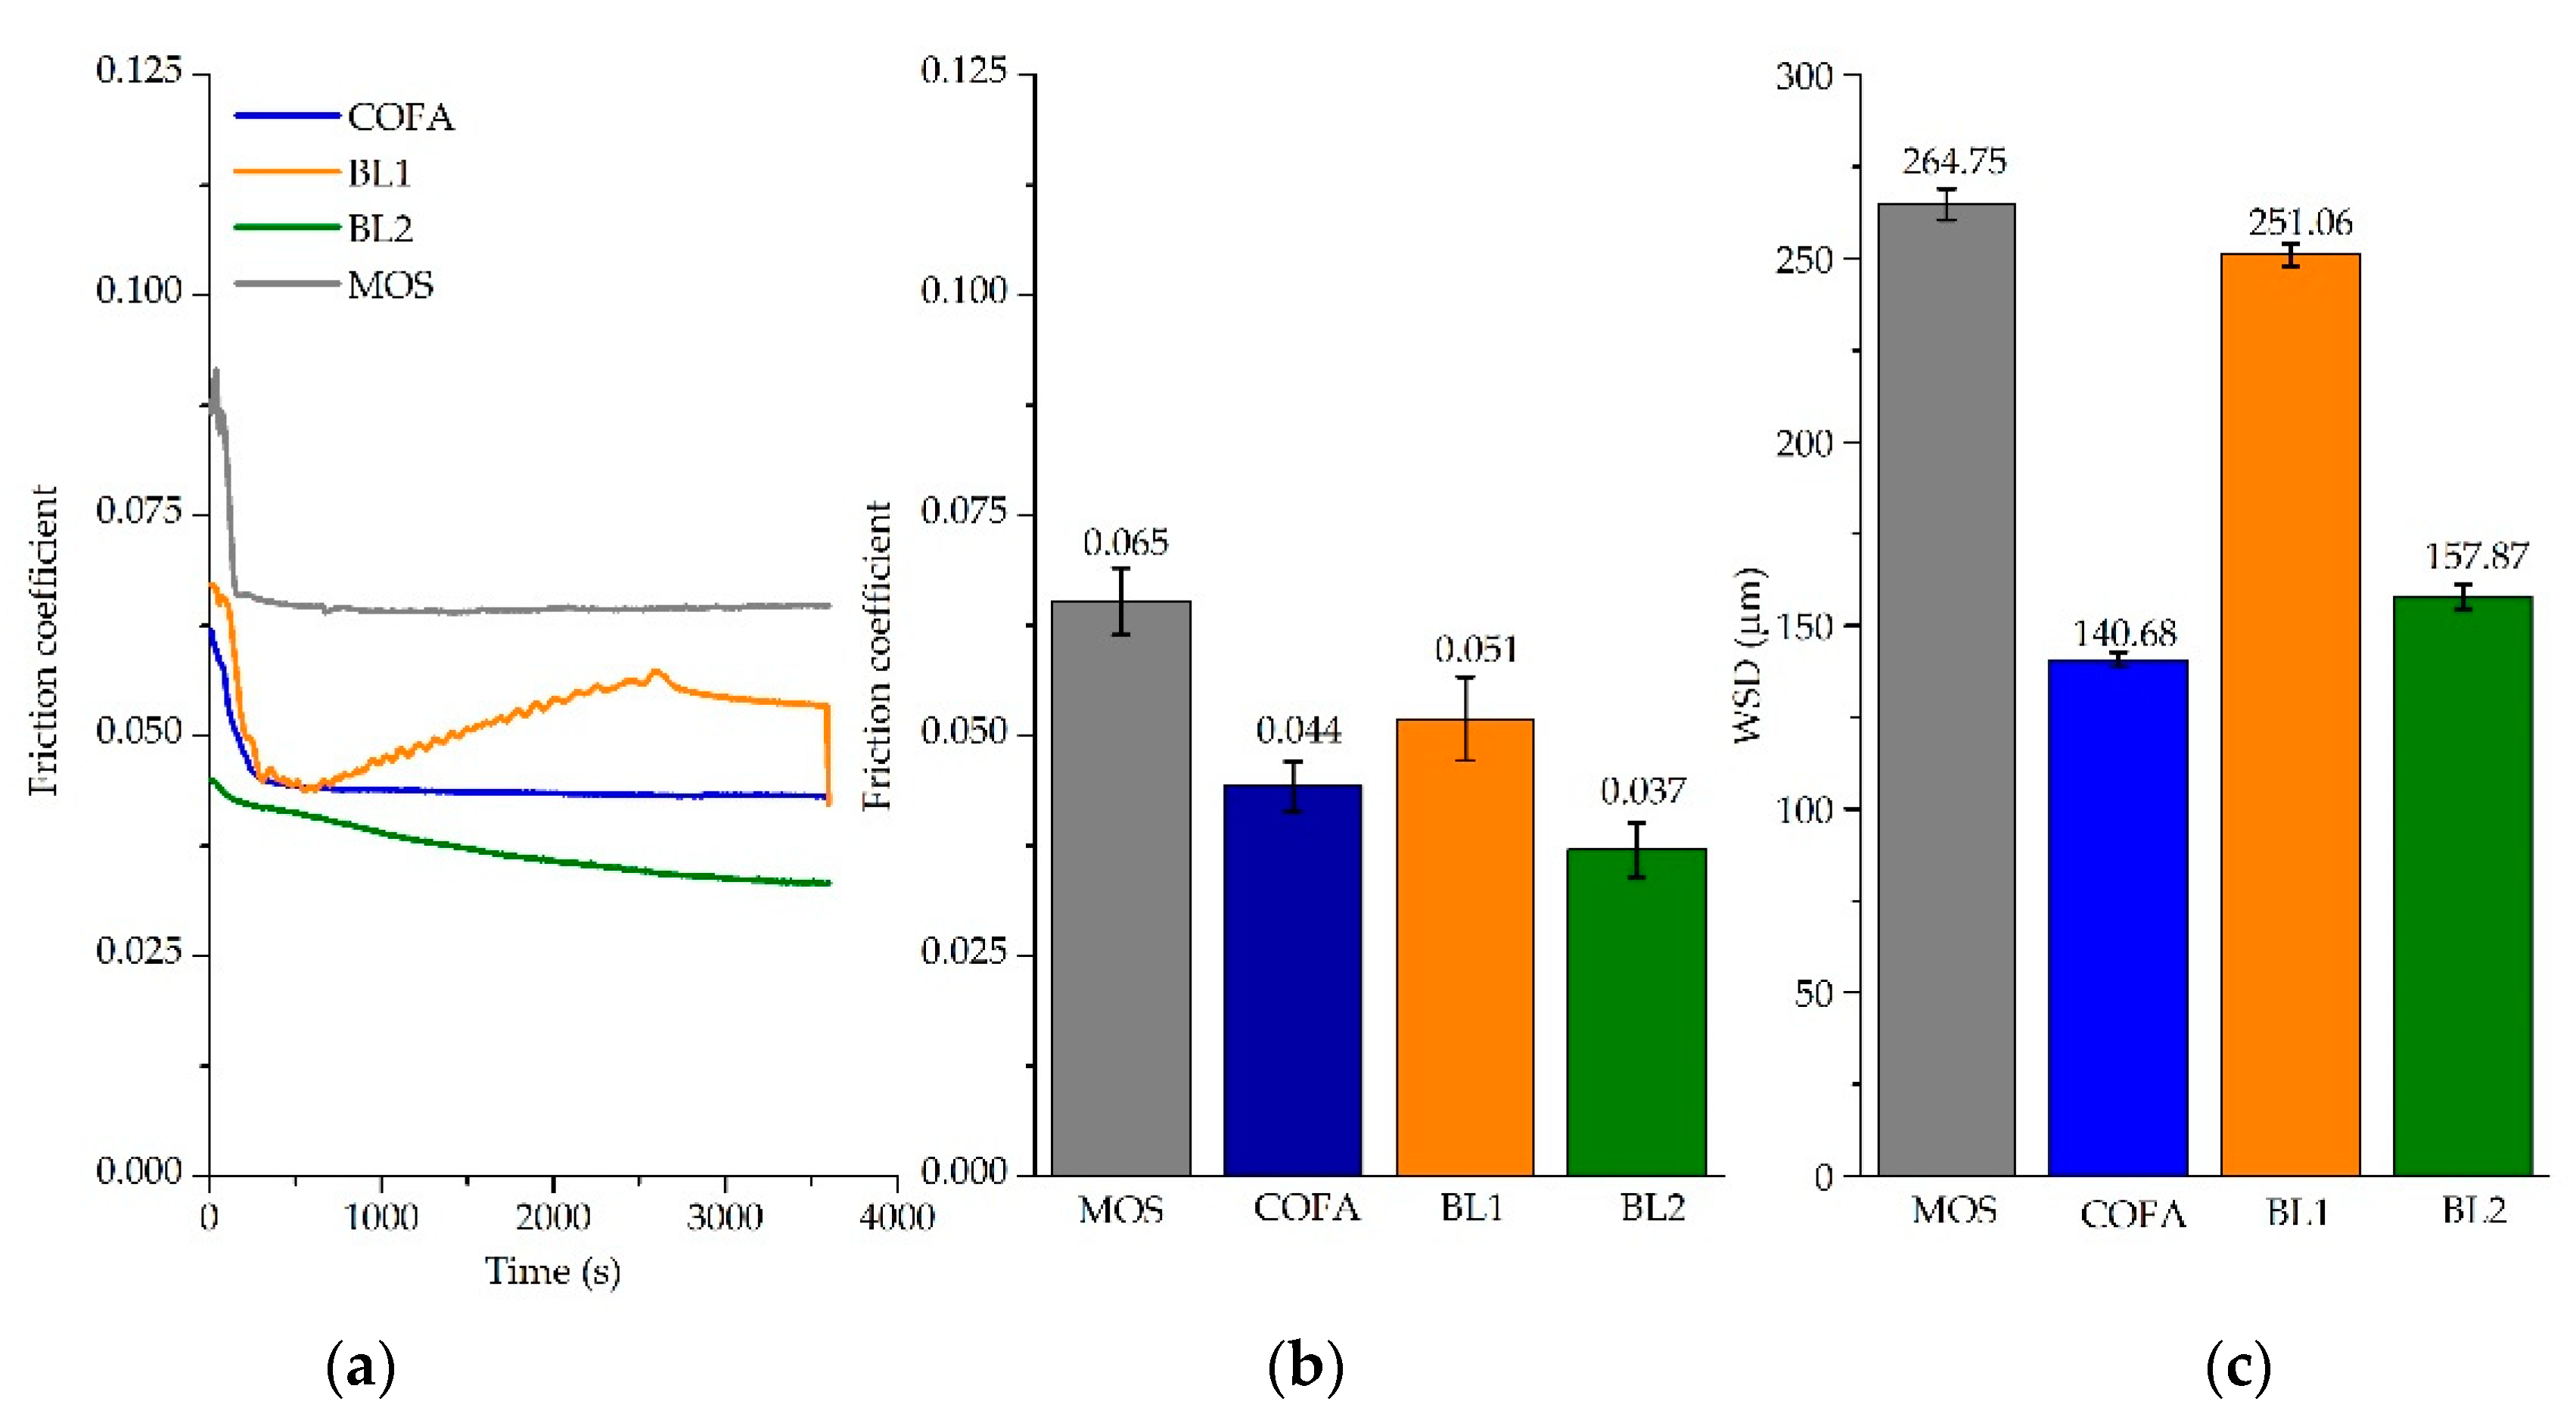
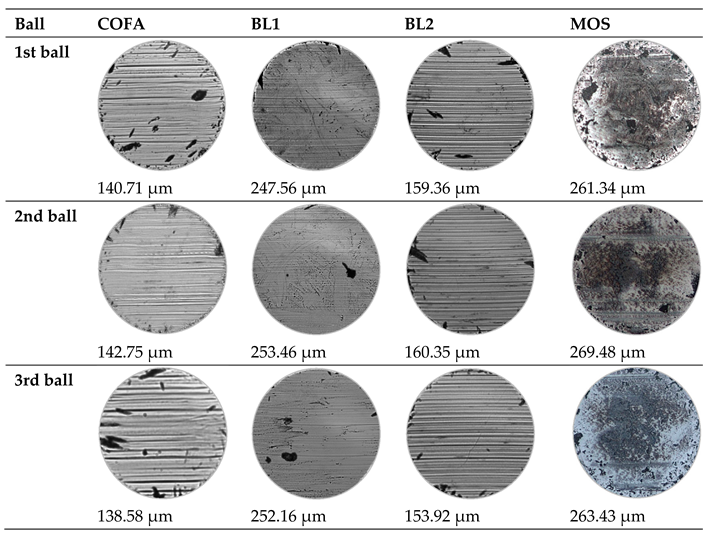
3.5. Tribological Results
4. Conclusions
Funding
Data Availability Statement
Acknowledgments
Conflicts of Interest
References
- Karmakar, G.; Ghosh, P.; Sharma, B. Chemically Modifying Vegetable Oils to Prepare Green Lubricants. Lubricants 2017, 5, 44. [Google Scholar] [CrossRef]
- Zzeyani, S.; Mikou, M.; Naja, J.; Elachhab, A. Spectroscopic analysis of synthetic lubricating oil. Tribol. Int. 2017, 114, 27–32. [Google Scholar] [CrossRef]
- Suganthi, S.H.; Murshid, S.; Sriram, S.; Ramani, K. Enhanced biodegradation of hydrocarbons in petroleum tank bottom oil sludge and characterization of biocatalysts and biosurfactants. J. Environ. Manage. 2018, 220, 87–95. [Google Scholar] [CrossRef] [PubMed]
- Sabarinath, S.; Rajendrakumar, P.; Nair, K.P. , “Evaluation of tribological properties of sesame oil as biolubricant with SiO2 nanoparticles and imidazolium-based ionic liquid as hybrid additives,”. P I MECH ENG J-J ENG 2019, 233, 1306–1317. [Google Scholar] [CrossRef]
- Soni, S.; Agarwal, M. Lubricants from renewable energy sources – a review. Green Chem Lett Rev 2014, 7, 359–382. [Google Scholar] [CrossRef]
- Shah, R.; Woydt, M.; Zhang, S. The Economic and Environmental Significance of Sustainable Lubricants. Lubricants 2021, 9, 21. [Google Scholar] [CrossRef]
- Cardoso, B.F.; Shikida, P.F.A.; Finco, A. Development of Brazilian Biodiesel Sector from the Perspective of Stakeholders. Energies (Basel) 2017, 10, 399. [Google Scholar] [CrossRef]
- Ribeiro Filho, P.R.C.F.; Nascimento, M.R.; Silva, S.S.O.; Luna, F.M.T.; Rodríguez-Castellón, E.; Cavalcante, C.L. , Synthesis and Frictional Characteristics of Bio-Based Lubricants Obtained from Fatty Acids of Castor Oil. Lubricants 2023, 11, 57. [Google Scholar] [CrossRef]
- Salimon, J.; Salih, N.; Yousif, E. Biolubricants: Raw materials, chemical modifications and environmental benefits. Eur J Lipid Sci Technol 2010, 112, 519–530. [Google Scholar] [CrossRef]
- Singh, N.; Agarwal, P.; Porwal, S.K. ; Natural Antioxidant Extracted Waste Cooking Oil as Sustainable Biolubricant Formulation in Tribological and Rheological Applications. Waste Biomass Valorization 2022, 13, 3127–3137. [Google Scholar] [CrossRef]
- Chan, C.H.; Tang, S.W.; Mohd, N.K.; Lim, W.H.; Yeong, S.K.; Idris, Z. Tribological behavior of biolubricant base stocks and additives. Renew. sustain. energy rev. 2018, 93, 145–157. [Google Scholar] [CrossRef]
- Singh, Y.; Farooq, A.; Raza, A.; Mahmood, M.A.; Jain, S. Sustainability of a non-edible vegetable oil based bio-lubricant for automotive applications: A review. Process Saf. Environ. Prot. 2017, 111, 701–713. [Google Scholar] [CrossRef]
- Severino, L.S.; Auld, D.L.; Baldanzi, M.; Cândido, M.J.D.; Chen, G.; Crosby, W.; Tan, D.; He, X.; Lakshmamma, P.; Lavanya, C.; Machado, O.L.T.; Mielke, T.; Milani, M.; Miller, T.D.; Morris, J.B.; Morse, S.A.; Navas, A.A.; Soares, D.J.; Sofiatti, V.; Wang, M.L.; Zanotto, M.D.; Zieler, H. A Review on the Challenges for Increased Production of Castor. Agron J 2012, 104, 853–880. [Google Scholar] [CrossRef]
- Patel, V.R.; Dumancas, G.G.; Viswanath, L.C.K.; Maples, R.; Subong, B.J.J. Castor Oil: Properties, Uses, and Optimization of Processing Parameters in Commercial Production. Lipid Insights 2016, 9, LPI.S40233. [Google Scholar] [CrossRef]
- Salih, N.; Salimon, J. Optimization of High Yield Epoxidation of Malaysian Castor Bean Ricinoleic Acid with Performic Acid. Indones. J. Chem. 2022, 22, 609. [Google Scholar] [CrossRef]
- Montes-Núñez, D.G.; Montero-Alpírez, G.; Coronado-Ortega, M.A.; Ayala-Bautista, J.R.; León-Valdez, J.A.; Vázquez-Espinoza, A.M.; Torres-Ramos, R.; García-González, C. From seeds to bioenergy: a conversion path for the valorization of castor and jatropha sedes. Grasas y Aceites 2022, 73, e482. [Google Scholar] [CrossRef]
- Salimon, J.; Nallathamby, N.; Salih, N.; Abdullah, B.M. ; Synthesis and Physical Properties of Estolide Ester Using Saturated Fatty Acid and Ricinoleic Acid. J. autom. methods manag. chem. 2011, 2011, 1–4. [Google Scholar] [CrossRef]
- Salih, N.; Salimon, J.; Yousif, E.; Abdullah, B.M. Biolubricant basestocks from chemically modified plant oils: ricinoleic acid based-tetraesters. Chem Cent J 2013, 7, 128. [Google Scholar] [CrossRef]
- Luna, F.M.T.; Salmin, D.C.; Santiago, V.S.; Maia, F.J.N.; Silva, F.O.N.; Mazzetto, S.E.; Cavalcante, C.L. Oxidative Stability of Acylated and Hydrogenated Ricinoleates Using Synthetic and Natural Antioxidants. J. Chem. 2019, 2019, 1–10. [Google Scholar] [CrossRef]
- Rios, I.C.; Marques, J.P.C.; Arruda, T.B.M.G.; Rodrigues, F.E.A.; Uchoa, A.F.J.; Luna, F.M.T.; Cavalcante, C.L.; Ricardo, N.M.P.S. Chemical modification of castor oil fatty acids (Ricinus communis) for biolubricant applications: An alternative for Brazil’s green market. Ind Crops Prod 2020, 145, 112000. [Google Scholar] [CrossRef]
- Mensah, M.B.; Awudza, J.A.M.; O’Brien, P.; Castor oil: a suitable green source of capping agent for nanoparticle syntheses and facile surface functionalization. Royal Soc. Open Sci. 2018, 5, 180824. [Google Scholar]
- Mubofu, E.B. Castor oil as a potential renewable resource for the production of functional materials. Sustain. Chem. Process. 2016, 4, 11. [Google Scholar] [CrossRef]
- Marques, J.P.C.; Rios, I.C.; Arruda, T.B.M.G.; Rodrigues, F.E.A.; Uchoa, A.F.J.; Luna, F.M.T.; Cavalcante, C.L.; Ricardo, N.M.P.S. Potential Bio-Based Lubricants Synthesized from Highly Unsaturated Soybean Fatty Acids: Physicochemical Properties and Thermal Degradation. Ind. Eng. Chem. Res. 2019, 58, 17709–17717. [Google Scholar] [CrossRef]
- Salih, N.; Salimon, J.; Yousif, E. “The effect of chemical structure on pour point, oxidative stability and tribological properties of oleic acid triester derivatives,”. Malaysian J. Anal. Sci. 2013, 17, 119–128. [Google Scholar]
- Saha, D.K.; Ghosh, P. Almond Oil as Potential Biodegradable Lube Oil Additive: A Green Alternative. J Polym Environ 2018, 26, 2392–2400. [Google Scholar] [CrossRef]
- Souza, L.A.; Moreira, D.R.; Ricardo, N.M.P.S.; Maier, M.E.; Ribeiro Filho, P.R.C.F.; Luna, F.M.T.; Petzhold, C.L. Esters from castor oil functionalized with aromatic amines as a potential lubricant. J Am Oil Chem Soc 2023, 100, 175–184. [Google Scholar] [CrossRef]
- Singh, Y.; Sharma, A.; Singla, A. Non-edible vegetable oil–based feedstocks capable of bio-lubricant production for automotive sector applications—a review. Environ. Sci. Pollut. Res. 2019, 26, 14867–14882. [Google Scholar] [CrossRef] [PubMed]
- Cecilia, J.A.; Plata, D.B.; Saboya, R.M.A.; Luna, F.M.T.; Cavalcante, C.L.; Rodríguez-Castellón, E. An Overview of the Biolubricant Production Process: Challenges and Future Perspectives. Processes 2020, 8, 257. [Google Scholar] [CrossRef]
- Nagendramma, P.; Kaul, S. Development of ecofriendly/biodegradable lubricants: An overview. Renew. sustain. energy rev. 2012, 16, 764–774. [Google Scholar] [CrossRef]
- Reeves, C.J.; Menezes, P.L.; Jen, T.-C.; Lovell, M.R. The influence of fatty acids on tribological and thermal properties of natural oils as sustainable biolubricants. Tribol Int 2015, 90, 1123–134. [Google Scholar] [CrossRef]
- Dutta, S.; Ghosh, M.; Mitra, D. Performance evaluation studies of PEG esters as biolubricant base stocks derived from non-edible oil sources via enzymatic esterification. Ind Crops Prod 2023, 195, 116429. [Google Scholar] [CrossRef]
- Sulaimi, R. Al; Macknojia, A.; Eskandari, M.; Shirani, A.; Gautam, B.; Park, W.; Whitehead, P.; Alonso, A.P.; Sedbrook, J.C.; Chapman, K.D.; Berman, D. Evaluating the effects of very long chain and hydroxy fatty acid content on tribological performance and thermal oxidation behavior of plant-based lubricants. Tribol Int 2023, 185, 108576. [Google Scholar] [CrossRef]
- Ferreira, E.N.; Arruda, T.B.M.G.; Rodrigues, F.E.A.; Arruda, D.T.D.; da Silva Júnior, J.H.; Porto, D.L.; Ricardo, N.M.P.S. Investigation of the thermal degradation of the biolubricant through TG-FTIR and characterization of the biodiesel – Pequi (Caryocar brasiliensis) as energetic raw material. Fuel 2019, 245, 398–405. [Google Scholar] [CrossRef]
- Zhang, W.; Ji, H.; Song, Y.; Ma, S.; Xiong, W.; Chen, C.; Chen, B.; Zhang, X. Green preparation of branched biolubricant by chemically modifying waste cooking oil with lipase and ionic liquid. J. Clean. Prod. 2020, 274, 122918. [Google Scholar] [CrossRef]
- ASTM International. Standard Test Method for Kinematic Viscosity of Transparent and Opaque Liquids (and Calculation of Dynamic Viscosity); ASTM International: West Conshohocken, PA, USA, 2006. [Google Scholar]
- ASTM International. Standard Test Method for Dynamic Viscosity and Density of Liquids by Stabinger Viscometer (and the Calculation of Kinematic Viscosity); ASTM International: West Conshohocken, PA, USA, 2014. [Google Scholar]
- ASTM International. Standard Practice for Calculating Viscosity Index from Kinematic Viscosity at 40 °C and 100 °C.; ASTM International: West Conshohocken, PA, USA, 2016. [Google Scholar]
- Marques, J.P.C.; Rios, I.C.; Parente, E.J.S.; Quintella, S.A.; Luna, F.M.T.; Cavalcante, C.L. Synthesis and Characterization of Potential Bio-Based Lubricant Basestocks via Epoxidation Process. J Am Oil Chem Soc 2020, 97, 437–446. [Google Scholar] [CrossRef]
- Arumugam, S.; Chengareddy, P.; Sriram, G. Synthesis, characterisation and tribological investigation of vegetable oil-based pentaerythryl ester as biodegradable compressor oil. Ind Crops Prod 2018, 123, 617–628. [Google Scholar] [CrossRef]
- Tribo-Rheometry Accessory - TA Instruments.” Available online:. Available online: https://www.tainstruments.com/tribo-rheometry-accessory/ (accessed on 14 June 2023).
- Sarma, R.N.; Vinu, R. Current Status and Future Prospects of Biolubricants: Properties and Applications. Lubricants 2022, 10, 70. [Google Scholar] [CrossRef]
- Valle, C.P.; Rodrigues, J.S.; Fechine, L.M.U.D.; Cunha, A.P.; Malveira, J.Q.; Luna, F.M.T.; Ricardo, N.M.P.S. Chemical modification of Tilapia oil for biolubricant applications. J. Clean. Prod. 2018, 191, 158–166. [Google Scholar] [CrossRef]
- Attia, N.K.; El-Mekkawi, S.A.; Elardy, O.A.; Abdelkader, E.A. Chemical and rheological assessment of produced biolubricants from different vegetable oils. Fuel 2020, 271, 117578. [Google Scholar] [CrossRef]
- Mohamed, A.M.; Gülten, Y.Z.; Mustafa, D. Experimental investigation of the production of biolubricant from waste frying oil. Biomass Convers. Biorefin. 2023, 13, 6395–6407. [Google Scholar] [CrossRef]
- Heikal, E.K.; Elmelawy, M.S.; Khalil, S.A.; Elbasuny, N.M. Manufacturing of environment friendly biolubricants from vegetable oils. Egypt. J. Pet. 2017, 26, 53–59. [Google Scholar] [CrossRef]
- Bahadi, M.; Salimon, J.; Derawi, D. Synthesis of di-trimethylolpropane tetraester-based biolubricant from Elaeis guineensis kernel oil via homogeneous acid-catalyzed transesterification. Renew. Energ. 2021, 171, 981–993. [Google Scholar] [CrossRef]
- Bashiri, S.; Ghobadian, B.; Soufi, M.D.; Gorjian, S. Chemical modification of sunflower waste cooking oil for biolubricant production through epoxidation reaction. Mater. Sci. Technol. 2021, 4, 119–127. [Google Scholar] [CrossRef]
- Bezerra, R.C.F.; Rodrigues, F.E.A.; Arruda, T.B.M.G.; Moreira, F.B.F.; Chaves, P.O.B.; Assunção, J.C.C.; Ricardo, N.M.P.S. Babassu-oil-based biolubricant: Chemical characterization and physicochemical behavior as additive to naphthenic lubricant NH-10. Ind Crops Prod 2020, 154, 112624. [Google Scholar] [CrossRef]
- Torrentes-Espinoza, G.; Miranda, B.C.; Vega-Baudrit, J.; Mata-Segreda, J.F. Castor oil (Ricinus communis) supercritical methanolysis. Energy 2017, 140, 426–435. [Google Scholar] [CrossRef]
- Slivniak, R.; Domb, A.J. Macrolactones and Polyesters from Ricinoleic Acid. Biomacromolecules 2005, 6, 1679–1688. [Google Scholar] [CrossRef]
- Doudin, K.I. Quantitative and qualitative analysis of biodiesel by NMR spectroscopic methods. Fuel 2021, 284, 119114. [Google Scholar] [CrossRef]
- Salimon, J.; Salih, N.; Yousif, E. Biolubricant basestocks from chemically modified ricinoleic acid. J King Saud Univ Sci 2012, 24, 11–17. [Google Scholar] [CrossRef]
- Somidi, A.K.R.; Das, U.; Dalai, A.K. One-pot synthesis of canola oil based biolubricants catalyzed by MoO3/Al2O3 and process optimization study. Chem. Eng. J. 2016, 293, 259–272. [Google Scholar] [CrossRef]
- Kulkarni, R.D.; Deshpande, P.S.; Mahajan, S.U.; Mahulikar, P.P. Epoxidation of mustard oil and ring opening with 2-ethylhexanol for biolubricants with enhanced thermo-oxidative and cold flow characteristics. Ind Crops Prod 2013, 49, 586–592. [Google Scholar] [CrossRef]
- Zainal, N.A.; Zulkifli, N.W.M.; Gulzar, M.; Masjuki, H.H. A review on the chemistry, production, and technological potential of bio-based lubricants. Renew. sustain. energy rev. 2018, 82, 80–102. [Google Scholar] [CrossRef]
- Daniel, L.; Ardiyanti, A.R.; Schuur, B.; Manurung, R.; Broekhuis, A.A.; Heeres, H.J. Synthesis and properties of highly branched Jatropha curcas L. oil derivatives. Eur J Lipid Sci Technol 2011, 113, 18–30. [Google Scholar] [CrossRef]
- Azzena, U.; Montenero, A.; Carraro, M.; Crisafulli, R.; Luca, L.D.; Gaspa, S.; Muzzu, A.; Nuvoli, L.; Polese, R.; Pisano, L.; Pintus, E.; Pintus, S.; Girella, A.; Milanese, C. Recovery, Purification, Analysis and Chemical Modification of a Waste Cooking Oil. Waste Biomass Valorization 2023, 14, 145–157. [Google Scholar] [CrossRef]
- Sharma, U.C. , Chandra, A.K.; Sachan, S. Investigation on Thermo-Oxidative Stability of Karanja Oil Derived Biolubricant Base Oil. Asian J. Chem. 2019, 31, 839–844. [Google Scholar] [CrossRef]
- Santos, J.C.O.; Almeida, R.A.; Carvalho, M.W.N.C.; Lima, A.E.A.; Souza, A.G. Recycling of lubricating oils used in gasoline/alcohol engines. J. Therm. Anal. Calorim. 2019, 137, 1463–1470. [Google Scholar] [CrossRef]
- Ogunniyi, D.S. Castor oil: A vital industrial raw material. Bioresour. Technol. 2006, 97, 1086–1091. [Google Scholar] [CrossRef]
- Zhu, L.; Dong, J.; Zeng, Q.; Chao, M.; Gong, K.; Li, W.; Wang, X. A comprehensive study of amino acids based ionic liquids as green lubricants for various contacts. Tribol Int 2021, 162, 107137. [Google Scholar] [CrossRef]
- Jiang, H.; Hou, X.; Dearn, K.D.; Su, D.; Ali, M.K.A. Thermal stability enhancement mechanism of engine oil using hybrid MoS2/h-BN nano-additives with ionic liquid modification. Adv Powder Technol 2021, 32, 4658–4669. [Google Scholar] [CrossRef]
- Sabi, G.J.; Gama, R.S.; Fernandez-Lafuente, R.; Cancino-Bernardi, J.; Mendes, A.A. Decyl esters production from soybean-based oils catalyzed by lipase immobilized on differently functionalized rice husk silica and their characterization as potential biolubricants. Enzyme Microb. Technol. 2022, 157, 110019. [Google Scholar] [CrossRef]
- Xie, M.; Xu, D.; Zhang, C. Tribological properties and thermal-stability of epoxide-functionalized biolubricant derived from the abandon aerial part of Codonopsis pilosula. Tribol Int 2023, 185, 108537. [Google Scholar] [CrossRef]
- Borugadda, V.B.; Goud, V.V. Epoxidation of Castor Oil Fatty Acid Methyl Esters (COFAME) as a Lubricant base Stock Using Heterogeneous Ion-exchange Resin (IR-120) as a Catalyst. Energy Procedia 2014, 54, 75–84. [Google Scholar] [CrossRef]
- Almeida, M.O.; Silva, L.R.R.; Kotzebue, L.R.V.; Maia, F.J.N.; Acero, J.S.R.; Melé, G.; Mazzetto, S.E.; Sinatora, A.; Lomonaco, D. Development of Fully Bio-Based Lubricants from Agro-Industrial Residues under Environmentally Friendly Processes. Eur J Lipid Sci Technol 2020, 122, 1900424. [Google Scholar] [CrossRef]
- Ferreira, E.N.; Arruda, T.B.M.G.; Rodrigues, F.E.A.; Moreira, D.R.; Chaves, P.O.B.; Rocha, W.S.; Silva, L.M.R.; Petzhold, C.L.; Ricardo, N.M.P.S. Pequi Oil Esters as an Alternative to Environmentally Friendly Lubricant for Industrial Purposes. ACS Sustain. Chem. Eng. 2022, 10, 1093–1102. [Google Scholar]
- Minami, I.; Hong, H.S.; Mathur, N.C. Lubrication performance of model organic compounds in high oleic sunflower oil. J. Synth. Lubr. 1999, 16, 1–12. [Google Scholar] [CrossRef]
- Gates, R.S.; Hsu, S.M. Effect of selected chemical compounds on the lubrication of silicon nitride. Tribol. Trans. 1991, 34, 417–425. [Google Scholar] [CrossRef]
- Fox, N.J.; Tyrer, B.; Stachowiak, G.W. Boundary lubrication performance of free fatty acids in sunflower oil. Tribol. Lett. 2004, 16, 275–281. [Google Scholar] [CrossRef]
- Ribeiro Filho, P.R.C.F.; Nascimento, M.R.; Cavalcante, C.L.; Luna, F.M.T. Synthesis and tribological properties of bio-based lubricants from soybean oil. Biomass Convers. Biorefin 2023. [Google Scholar]
- Salih, N.; Salimon, J.; Abdullah, B.M.; Yousif, E. Thermo-oxidation, friction-reducing and physicochemical properties of ricinoleic acid based-diester biolubricants. Arab. J. Chem. 2017, 10, S2273–S2280. [Google Scholar] [CrossRef]
- Salimon, J.; Salih, N.; Yousif, E. Chemically modified biolubricant basestocks from epoxidized oleic acid: Improved low temperature properties and oxidative stability. J. Saudi Chem. Soc. 2011, 15, 195–201. [Google Scholar] [CrossRef]
- Quinchia, L.A.; Delgado, M.A.; Reddyhoff, T.; Gallegos, C.; Spikes, H.A. Tribological studies of potential vegetable oil-based lubricants containing environmentally friendly viscosity modifiers. Tribol. Int. 2014, 69, 110–117. [Google Scholar] [CrossRef]
- Qi, C.; Renhui, Z.; Zhongyi, H.; Liping, X. Effect of carbon-chain length and hydroxyl number on lubrication performance of alcohols. J. Hebei Univ. Sci. Technol. 2021, 42, 1–7. [Google Scholar]
- Ribeiro Filho, P.R.C.F.; Silva, S.S.O.; Nascimento, M.R.; Soares, S.A.; Luna, F.M.T.; Cavalcante, C.L. Tribological properties of bio-based lubricant basestock obtained from pequi oil (Caryocar brasiliensis). J. Braz. Soc. Mech. Sci. Eng. 2022, 44, 1–9. [Google Scholar] [CrossRef]
- Noorawzi, N.; Samion, S. Tribological effects of vegetable oil as alternative lubricant: A pin-on-disk tribometer and wear study. Tribol. Trans. 2016, 59, 831–837. [Google Scholar] [CrossRef]
- Afifah, A.N.; Syahrullail, S.; Azlee, N.I.W.; Sidik, N.A.C.; Yahya, W.J.; Abd Rahim, E. Biolubricant production from palm stearin through enzymatic transesterification method. Biochem. Eng. J. 2019, 148, 178–184. [Google Scholar] [CrossRef]
- Bahari, A. Investigation into Tribological Performance of Vegetable Oils as Biolubricants at Severe Contact Conditions. Ph.D. Thesis, University of Sheffield, Sheffield, UK.
| Property | COFA | MOS | Method |
|---|---|---|---|
| Density at 20 °C (g/cm³) | 0.9393 | 0.9017 | ASTM D7042 |
| Kinematic viscosity at 40 °C (cSt) | 173.18 | 20.38 | ASTM D445 |
| Kinematic viscosity at 100 °C (cSt) | 16.938 | 3.590 | ASTM D445 |
| Viscosity index | 104 | 13 | ASTM D2270 |
| Pour point (°C) | -42 | -33 | ASTM D97 |
| Flash point (°C) | 216 | 160 | ASTM D92 |
| BL1 | BL2 | Method | |
|---|---|---|---|
| Density at 20 °C (g/cm³) | 0.9080 | 0.9437 | ASTM D7042 |
| Kinematic viscosity at 40 °C (cSt) | 28.23 | 96.92 | ASTM D445 |
| Kinematic viscosity at 100 °C (cSt) | 5.215 | 10.286 | ASTM D445 |
| Viscosity index | 116 | 85 | ASTM D2270 |
| Pour point (°C) | -27 | -45 | ASTM D97 |
| Acid value | 9.58 | 5.61 | AOCS CD 3d-63 |
| TG temperature/ °C per weight loss | |||||
|---|---|---|---|---|---|
| Samples | Tonset | 10% | 20% | 50% | 90% |
| COFA | 229.30 | 244.75 | 260.34 | 290.65 | 356.65 |
| BL1 | 219.27 | 238.622 | 256.947 | 287.93 | 354.50 |
| BL2 | 195.03 | 229.528 | 269.384 | 339.04 | 455.04 |
| TG temperature/°C per weight loss | |||||
|---|---|---|---|---|---|
| Samples | Tonset | 10% | 20% | 50% | 90% |
| COFA | 236.14 | 259.59 | 292.49 | 344.97 | 437.86 |
| BL1 | 223.72 | 239.68 | 257.83 | 291.98 | 447.31 |
| BL2 | 187.62 | 226.36 | 267.23 | 338.47 | 459.09 |
 |
Disclaimer/Publisher’s Note: The statements, opinions and data contained in all publications are solely those of the individual author(s) and contributor(s) and not of MDPI and/or the editor(s). MDPI and/or the editor(s) disclaim responsibility for any injury to people or property resulting from any ideas, methods, instructions or products referred to in the content. |
© 2023 by the authors. Licensee MDPI, Basel, Switzerland. This article is an open access article distributed under the terms and conditions of the Creative Commons Attribution (CC BY) license (http://creativecommons.org/licenses/by/4.0/).


