Preprint
Article

Valley–Selective High Harmonic Generation and Polarization Induced by an Orthogonal Two–Color Laser Field

Altmetrics

Downloads

117

Views

71

Comments

0

A peer-reviewed article of this preprint also exists.

This version is not peer-reviewed

Submitted:

18 September 2023

Posted:

19 September 2023

You are already at the latest version

Alerts
Abstract
The valley pseudospin properties of electrons in two–dimensional hexagonal materials result in lots of fascinating physical phenomena, which opens up the new field of valleytronics. The valley-contrasting physics aims at distinguishing the valley degree of freedom based on valley–dependent effects. Here, we theoretically demonstrate that both of the valley–selective high harmonic generation and valley–selective electronic excitation can be achieved by using an orthogonal two–color (OTC) laser field in gapped graphene. It is shown that the asymmetry degrees of harmonic yields in the plateaus, cutoff energies of generated harmonics and electron populations from two different valleys can be precisely controlled by the relative phase of the OTC laser field. Thus the selectivity of the dominant valley for the harmonic radiation and electronic polarization can be switched by adjusting the relative phase of the OTC laser field. Our work offers an all–optical route to produce the valley–resolved high harmonic emissions and manipulate the ultrafast valley polarization on a femtosecond timescale in condensed matter.
Keywords: 
Subject: Physical Sciences  -   Optics and Photonics

1. Introduction

When matter is exposed to intense laser fields, some interesting light–induced phenomena will be observed due to the highly nonlinear processes [1,2,3,4]. In particular, high harmonic generation (HHG) is one of the most attractive subjects in strong–field physics and has been studied extensively in the past several decades [5,6,7,8,9,10]. In the HHG process, a fundamental frequency laser is converted into bursts of high–energy photons. Thus the obtained harmonics enable the generation of coherent extreme ultraviolet or soft X–ray light sources [11,12,13]. HHG is typically activated in atomic or molecular gases. The experimental observation of high harmonic emissions from solids has aroused great interest in recent years [14,15,16,17,18,19,20]. High harmonic spectroscopy in solids provides an efficient way to probe the electronic structures and ultrafast dynamics of solid targets, such as the reconstruction of band structures [21,22] and the detect of topological phase transitions [23] in materials.
The energy bands of two–dimensional (2D) hexagonal crystals (such as pristine and gapped graphene) in Brillouin zone (BZ) contain two energy-degenerated and nonequivalent extrema, which are called Dirac points and are denoted as K and K [24,25]. The motions of charge carriers near the Dirac points are described by the massless Dirac equation, which brings in an extra electronic degree of freedom called valley pseudospin. The magical properties of the valley pseudospin lead to lots of novel physical phenomena and open up the frontier of valleytronics [26,27,28]. Nowadays, how to effectively distinguish the valley degree of freedom by breaking the symmetry between the K and K valleys has become a popular research topic, i.e., valley–contrasting physics [29]. Many valley asymmetry effects have been found in light–induced phenomena [30,31,32,33,34].
For hexagonal lattices with broken inversion symmetry, the orbital magnetic moments are opposite due to the sign reversals of the non–vanishing Berry curvatures in the neighborhood of the K and K valleys [29]. This fact gives rise to the valley optical selection rules [30,31,32]. That is, K and K valleys are coupled exclusively to the left and right circularly polarized photons respectively in direct interband transitions. The unique valley–selective circular dichroism (VSCD) promises that the valley–selectivity of the electronic excitation can be controlled by using a bandgap–resonant circularly polarized (CP) pump laser with the matching helicity [35]. However, it is widely recognized that the linearly polarized (LP) light is unsuitable for the valley polarization because the LP laser field responds equally to two valleys [26,27,28,29,30]. Recently, Jiménez–Galán et al [32] have offered an ingenious proposal to implement the valley polarization by using a few–cycle LP laser pulse with the controlled carrier-envelope phase (CEP). In addition, the valley selectivity of the HHG has also been achieved via the counter–rotating bicircular (CRB) laser field in the latest studies [36,37,38].
In this work, we propose a general scheme to generate the valley–selective high harmonic radiation and electronic polarization using an orthogonal two–color (OTC) laser field in gapped graphene. Our results suggest that the relative magnitudes of harmonic yields in plateaus, cutoff energies of emitted harmonics and excitation probabilities contributed by K and K valleys can be regulated accurately by the relative phase of the OTC laser field. The controlled asymmetries between two different valleys can serve as a promising tool for achieving the ultrafast valley switching in the intense laser field.

2. Theoretical Models

In our simulations, the gapped graphene is imitated by a 2D two–band model with the tight–binding approximation [24,39]. Herein, only the p z orbitals are considered at each atomic site for the sake of simplicity. Atomic units are used throughout this paper unless otherwise stated. The lattice constant of the gapped graphene is chosen as a = 2.46 A ˚ [36]. In this model, analytical expressions of physical quantities involving electronic structures can be derived [40,41,42,43] . The dispersion relations of the conduction band (CB) and valence band (VB) in the gapped graphene can be expressed as
E m = ± γ 2 | f k | 2 + Δ 2 2 ,
where the band subscript m = c , v stands for the CB and VB, respectively. k = k x , k y is the wave vector in k space. In Eq. (1), the positive and negative signs correspond to the CB and VB, respectively. γ is the transfer energy of the nearest–neighbor hopping and is chosen as 3.03 eV [40].  Δ is the energy gap between the CB and VB at Dirac points and is given by Δ = 1 eV in the model. For the gapped graphene, the inversion symmetry is broken due to the nonzero bandgap Δ . f ( k ) is represented as
f k = exp i a 3 k x + 2 exp i a 2 3 k x cos a 2 k y .
Thus the modulus of f ( k ) is calculated by
| f k | = 1 + 4 cos 3 a 2 k x cos a 2 k y + 4 cos 2 a 2 k y .
The transition dipole moment (TDM) of the gapped graphene is obtained as [40,41]
d k = γ | f k | 2 E c k k ϕ k + i γ Δ 4 E c 2 k k | f k | ,
where ϕ k = Arg f k . Figure 1a shows the calculated band structures of the CB and VB for the gapped graphene, where six Dirac cones are presented in k space. The energy band of the VB is depicted individually using a 2D pseudocolor diagram to clearly display the K and K valleys in Figure 1b.
The interaction of an intense laser field and target material is described by the 2D two–band density matrix equations (DMEs) [44,45,46,47] :
π ˙ K , t = i Ω K , t w K , t e i S K , t π K , t T 2 ,
n ˙ v K , t = i Ω * K , t π K , t e i S K , t + c . c . ,
n ˙ c K , t = i Ω * K , t π K , t e i S K , t + c . c . ,
where n v and n c are the crystal-momentum-resolved populations of the VB and CB, respectively. w = n v n c is the population difference between the VB and CB. π is the off–diagonal element of the density matrix. The classical action with vector potential A ( t ) is given by S K , t = t ε g K + A τ d τ , where ε g = E c E v is the bandgap between the CB and VB. Ω is the Rabi frequency and is written as Ω K , t = F t · d K + A t , where F t = d A / d t is the laser field. T 2 is the dephasing time accounting for the decoherence effect in solids. In the strong laser field, the light–induced excitations occur mainly in the vicinity of Dirac points because the energy difference between the CB and VB reaches the minimum here. Hence, valence electrons in VB are initially occupied within the circular areas centered at the Dirac points in our calculations. The radius of the circular area is chosen as 0.1 k D , where k D = 4 π / ( 3 a ) is the distance between two adjacent Dirac points in the reciprocal space.
We adopt an OTC laser field polarized in the x y plane. The OTC laser pulse is composed of two mutually orthogonal LP laser fields with the fundamental frequency and its second harmonic. In our calculations, the ratio of strengths for the two LP fields is 1 : 1 . The OTC laser field reads as
F t = f t F 0 cos ω t e ^ x + cos 2 ω t + φ e ^ y ,
where ω is the fundamental frequency of the laser field, F 0 is the amplitude of the laser field, and f ( t ) is the envelope of the laser pulse. e ^ x and e ^ y are the unit vectors of x and y axes, respectively. φ is the relative phase of the two LP laser fields. The wavelength of the fundamental laser field is 3200 nm. The laser intensity is 6 × 10 11 W / cm 2 for both of the two LP laser fields in all calculations. Sine-squared envelope is adopted with a total duration of 8 T 0 , where T 0 is the duration of one optical cycle for the fundamental laser field. The dephasing time is chosen as T 2 = 0.2 T 0 in our calculation.
The total laser–induced current j in solids is divided into the intraband current j ra and interband current j er , i.e., j = j ra + j er . The intraband current and interband current are calculated by [44]
j ra t = m = c , v BZ v m K + A t n m K , t d 2 K ,
j er t = d d t BZ p K , t d 2 K ,
respectively, where v m k = k E m k is the band velocity, and p K , t is given by
p K , t = d K + A t π K , t e i S K , t + c . c .
The high harmonic spectrum is obtained by calculating the Fourier transform of the total current j . A Hanning window [48,49,50] is used before the Fourier transformation to improve the signal-to-noise ratio of generated harmonic signals. The time–dependent electron population in the CB is obtained as
N c t = BZ n c K , t d 2 K .

3. Results and Discussion

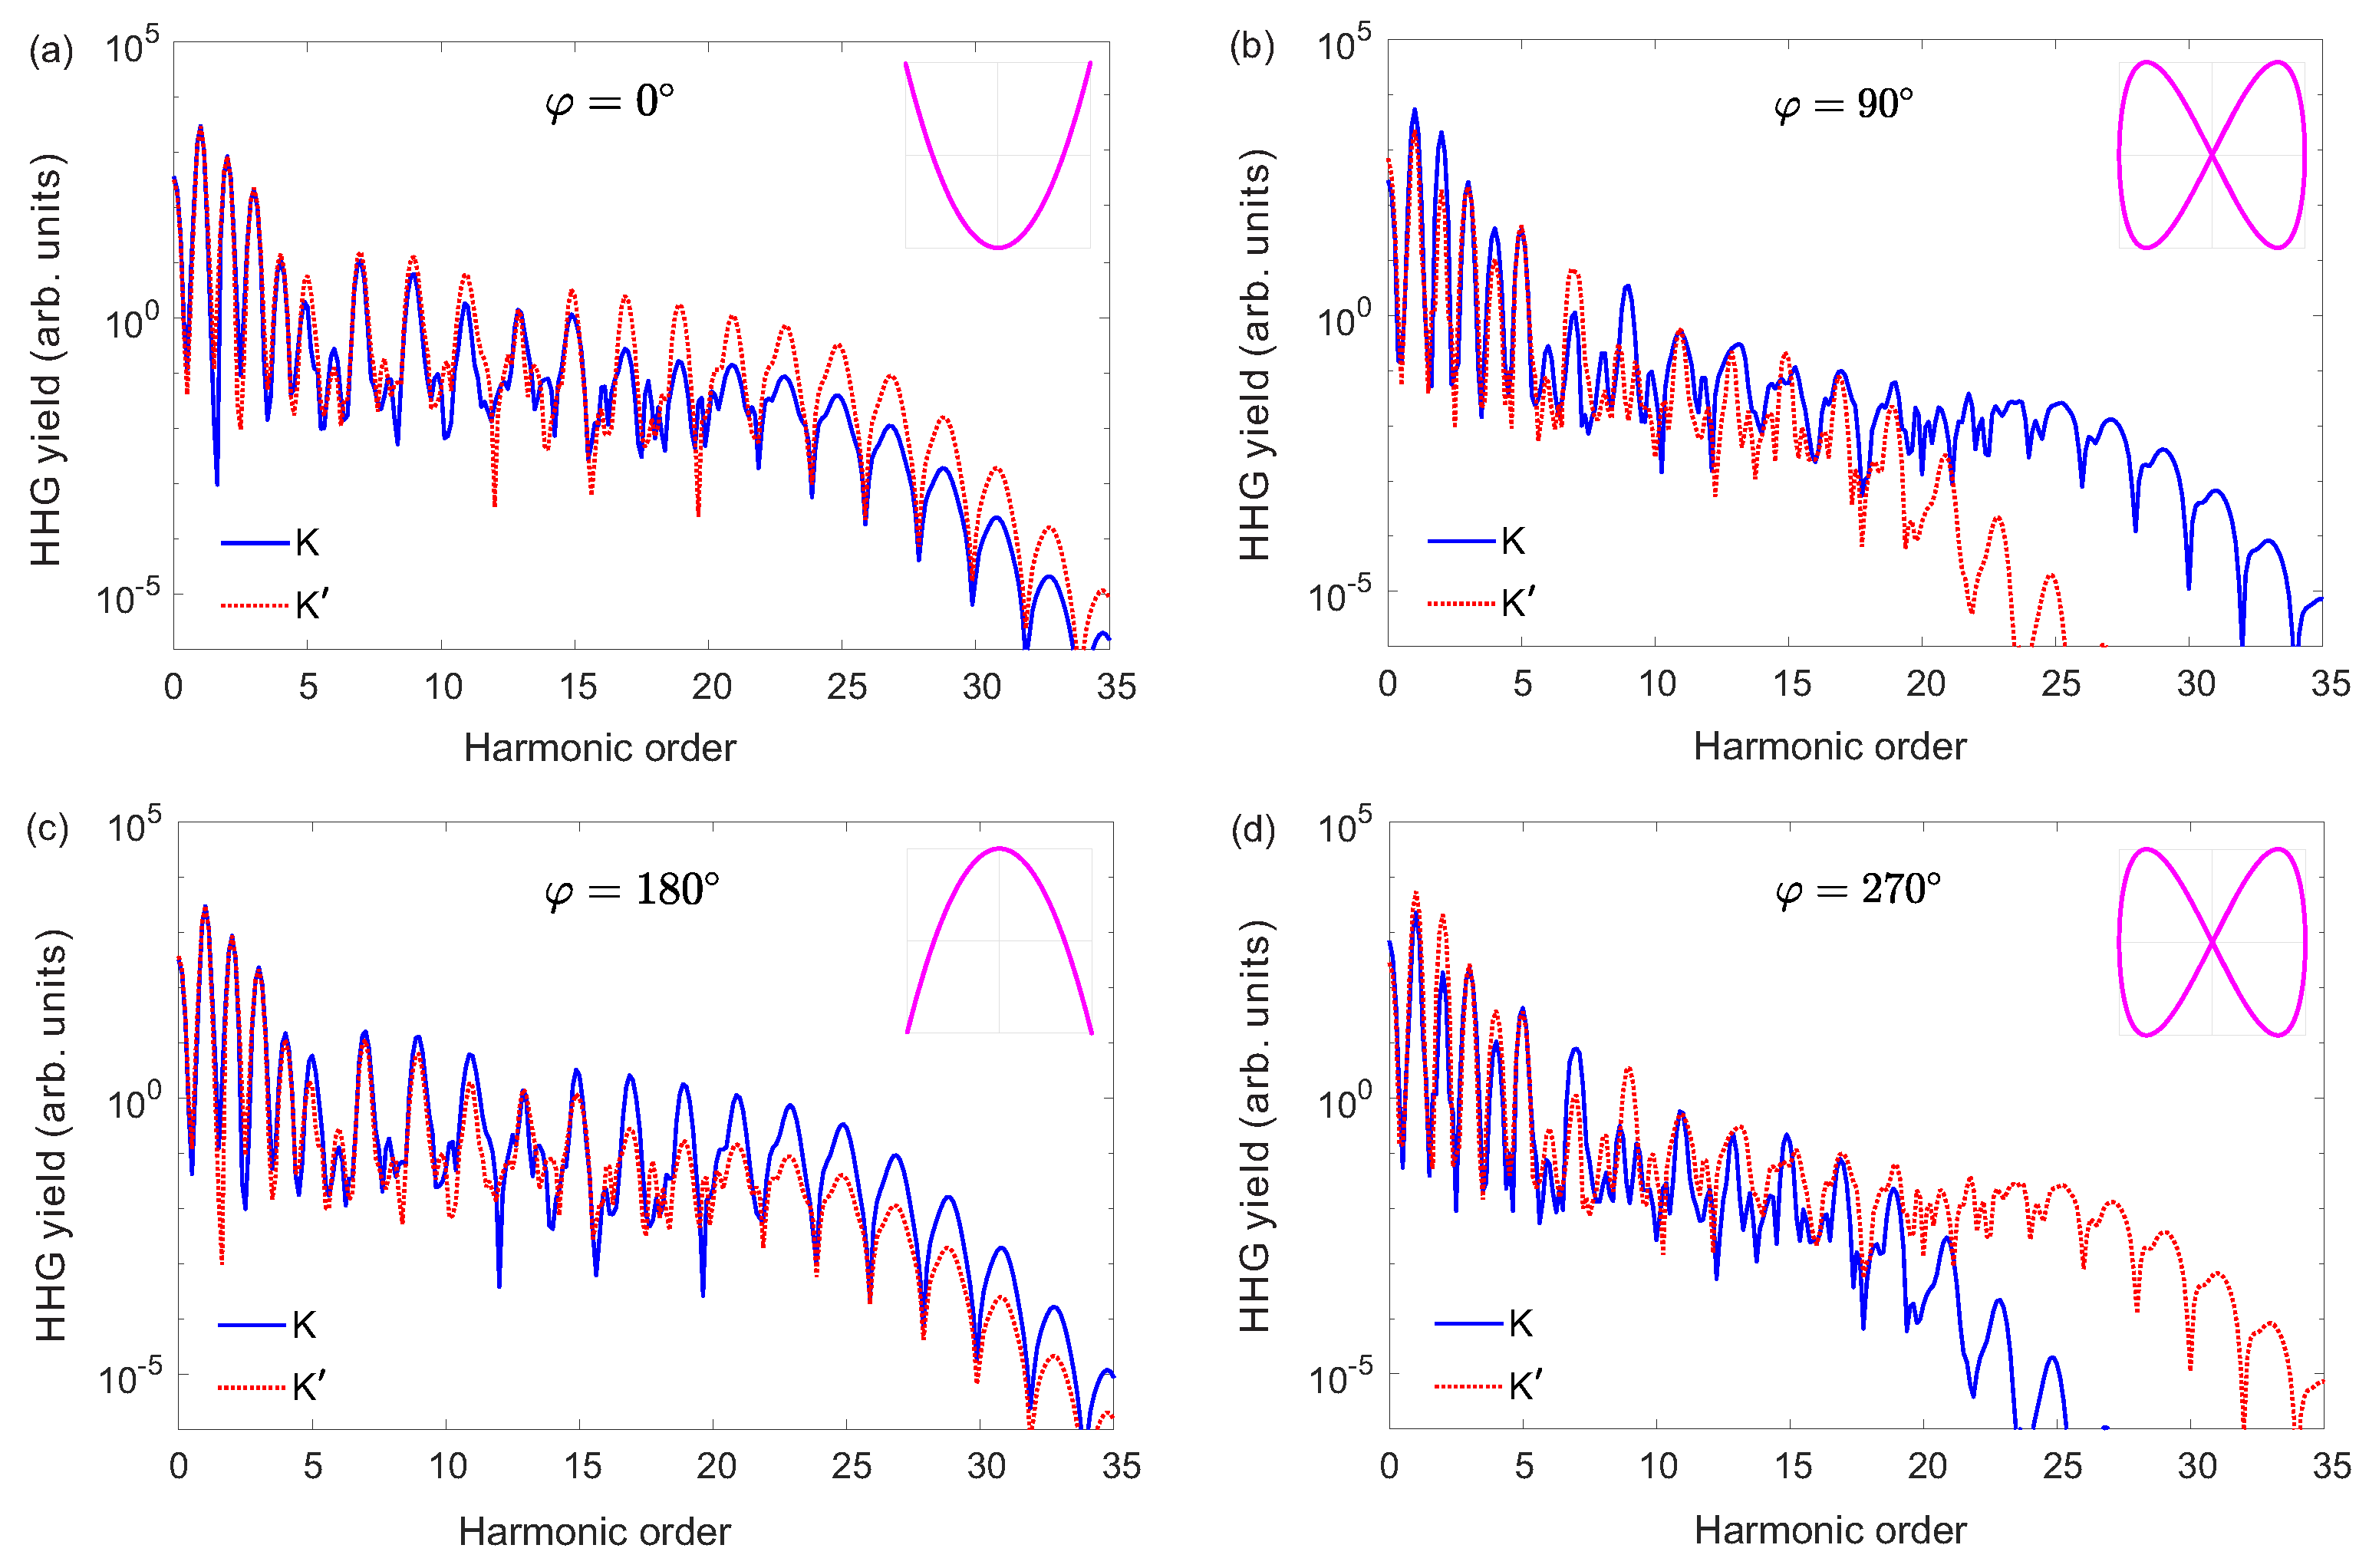
High harmonic spectra contributed by the K and K valleys are calculated severally by assuming that valence electrons are initially occupied in the vicinity of two different valleys. Figure 2(a)–(d) show the obtained valley–resolved harmonic spectra with φ = 0 , 90 , 180 , and 270 , respectively. Herein, the observed odd–order harmonics are LP along the x direction, whereas the even–order harmonics are LP along the y direction. In our calculations, it is found that the obtained harmonics contributed by intraband currents contain both odd and even orders. However, obtained harmonics arising from interband transitions contain only odd orders. Therefore, even–order harmonics in the plateau are absent in observed harmonic spectra, because intraband and interband harmonics are respectively dominant in the below–band–gap regions and harmonic plateau as pointed in previous studies [19,44,50].
Significant valley–discriminating harmonic signals can be observed in Figure 2(a)–(d). As shown in Figure 2(a), one can see clearly that the intensities of harmonics from the K valley are about one order of magnitude higher than those from the K valley in the plateau region when φ = 0 . Thus the observed overall harmonics in plateau are dominated by the contributions from the K valley in this case. When φ is chosen as 180 , the relative intensities of harmonics in plateaus from two different valleys are exactly reversed compared to the case of φ = 0 . As shown in Figure 2(c), the yields of harmonics in plateau from the K valley are about one order of magnitude lower than those from the K valley when φ = 180 , where the harmonics contributed by the K valley are dominant in plateau region for the observed overall harmonics. Furthermore, the intensities of harmonic plateaus from two different valleys become approximately equal in magnitude when φ is chosen as 90 or 270 as presented in Figure 2(b) and Figure 2(d). Herein, the generated harmonics in plateau are contributed equally to the K and K valleys. Our results suggest that the relative yields of harmonic plateaus from the K and K valleys can be effectively controlled by the relative phase of the OTC laser field, which is significant for achieving valley–selective HHG from solids. In fact, the unequal responses of two different valleys in the HHG processes originate from the asymmetries of OTC laser fields in real space. Specifically, the Lissajous figures always preserve the inversion symmetry in x direction for arbitrary φ as shown in the insets in Figure 2(a)–(d). However, the inversion symmetries of Lissajous figures in y direction are broken except for the cases of φ = 90 and φ = 270 . The light–induced valley asymmetry in y direction for the HHG process leads to the valley–resolved HHG, such as the cases of φ = 0 and φ = 180 shown in Figure 2(a) and Figure 2(c) respectively.
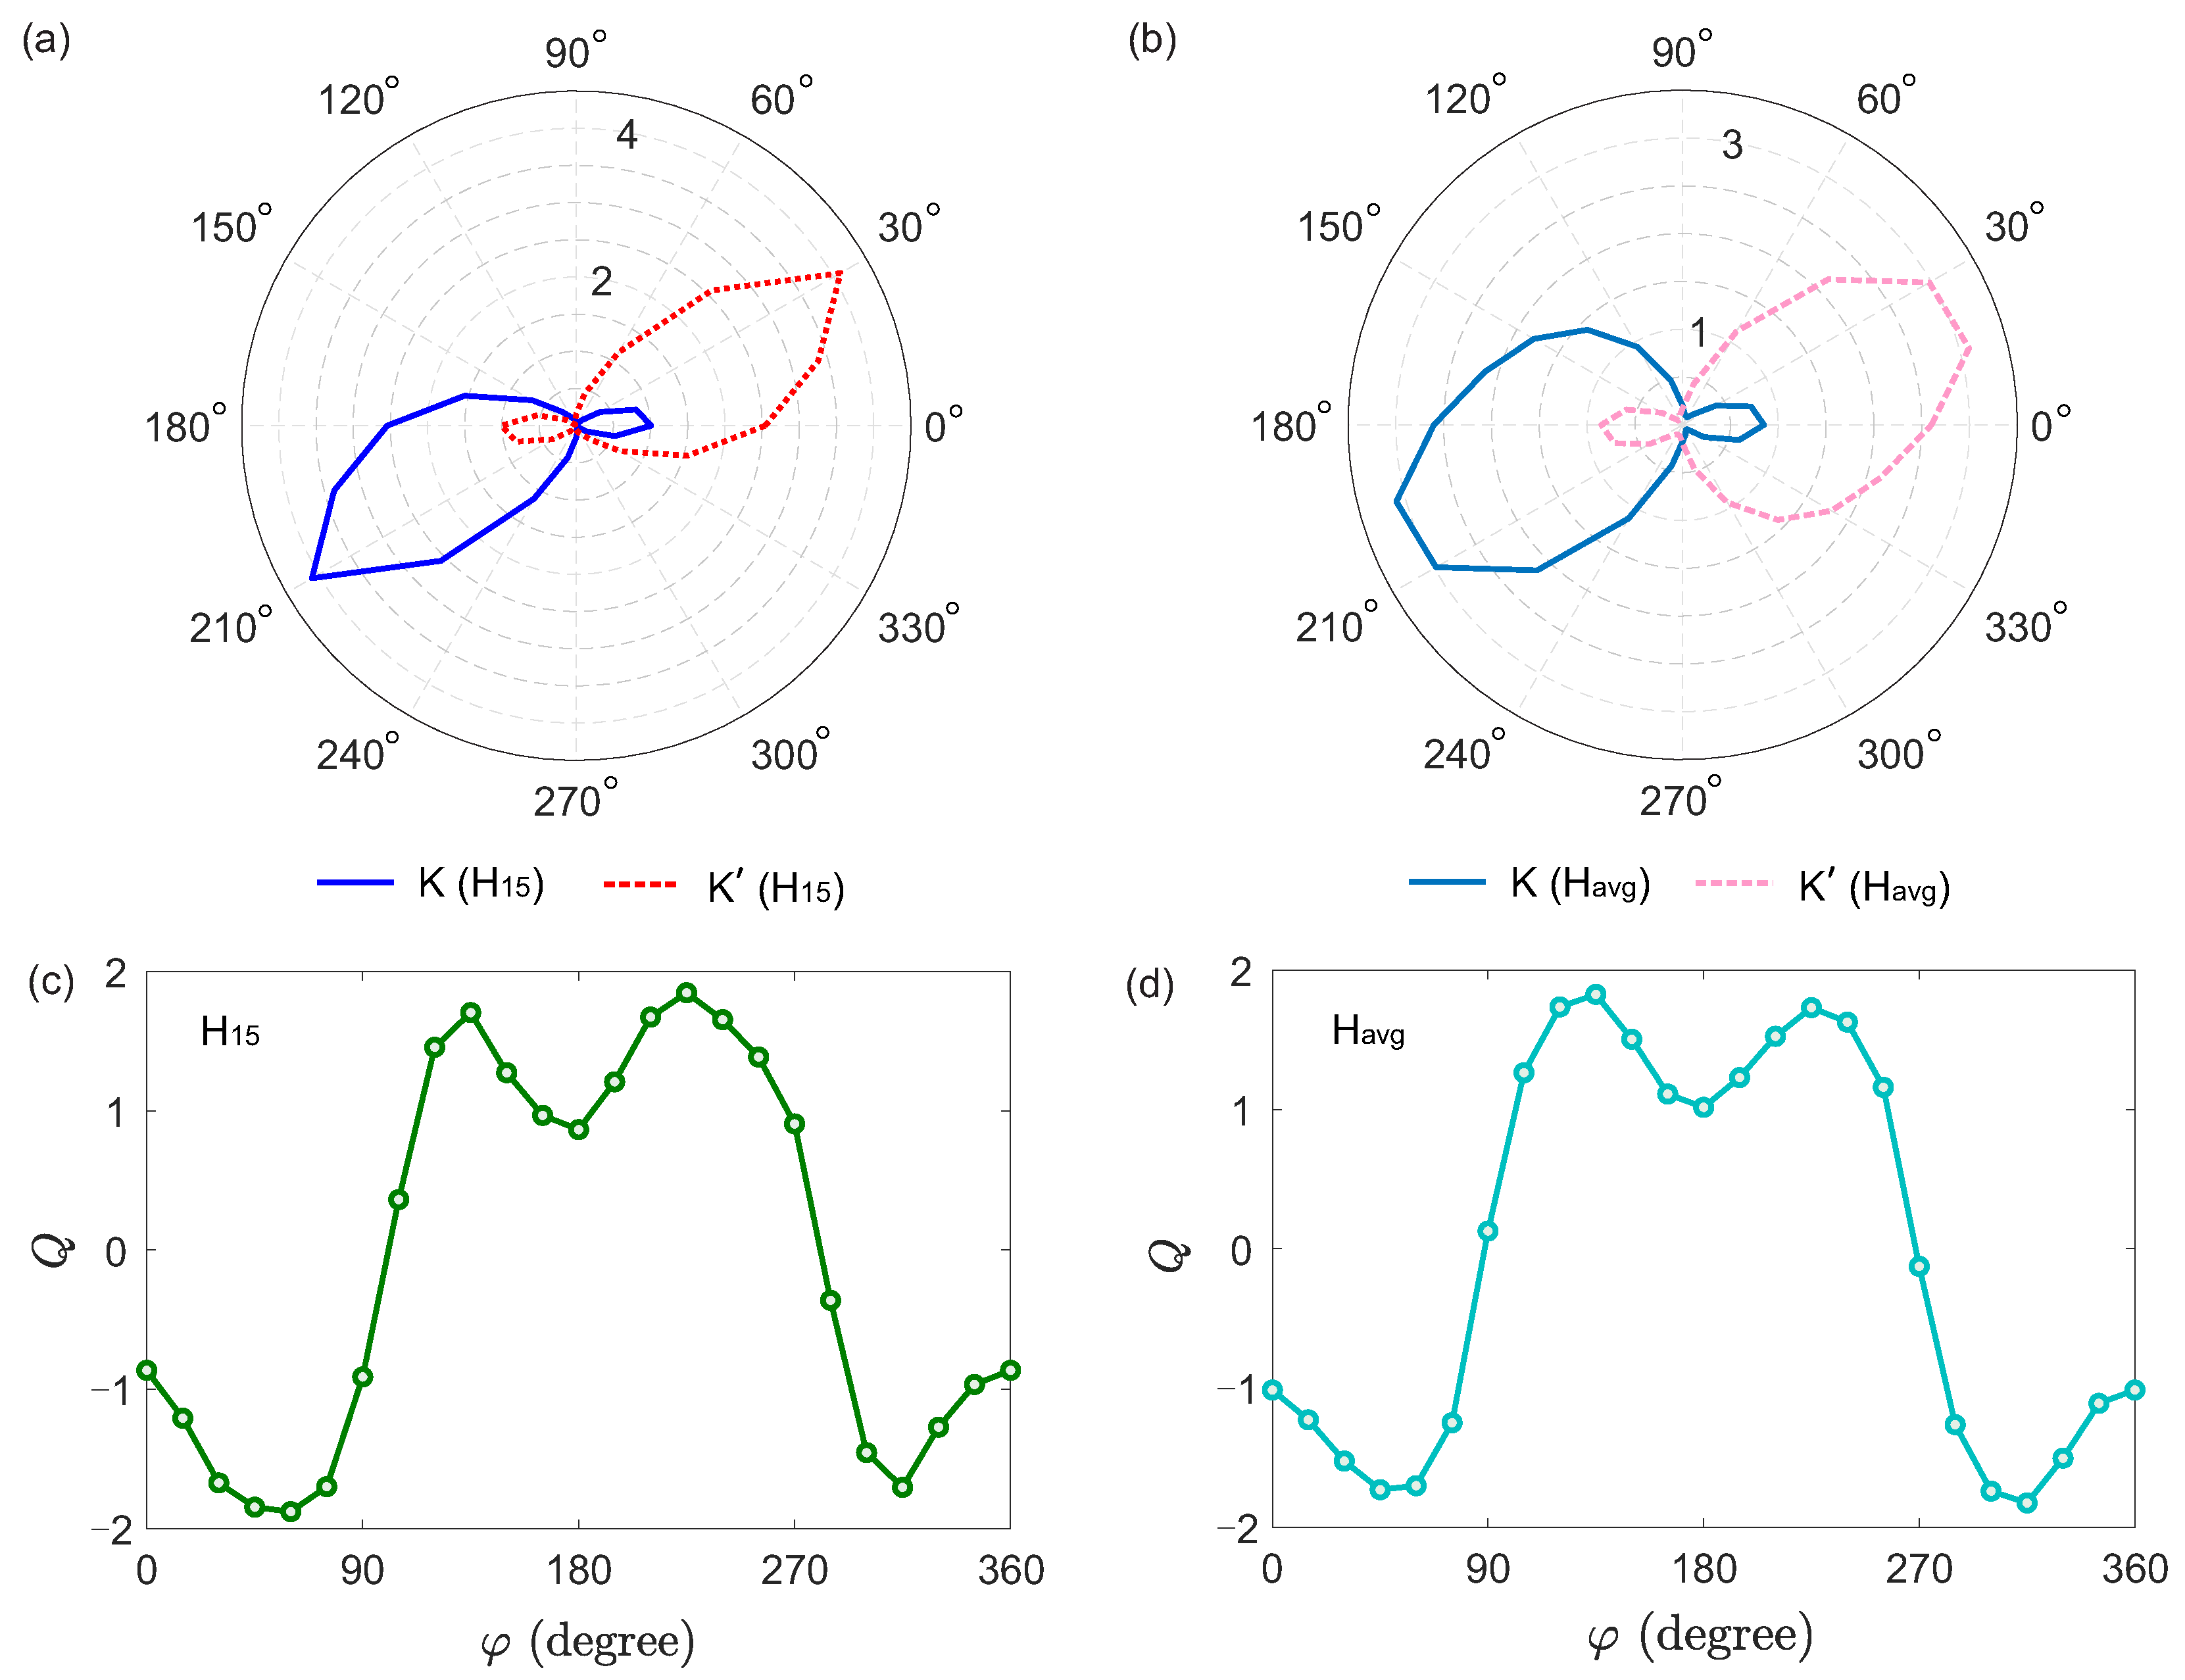
In order to demonstrate the manipulation of the valley–selective HHG, the dependence of harmonic yields in plateau from two different valleys on φ is further investigated in our study. The 15th–order harmonic (denoted as H 15 ) is chosen as the representative of obtained harmonics in plateau. Figure 3(a) shows the harmonic yields of H 15 from the K and K valleys as a function of φ in polar coordinates. The significantly distinguishable harmonic yields from the two valleys can be observed in certain intervals of φ . Specifically, the harmonic yield from the K valley is overwhelming with φ ranging from 30 to 60 , whereas the harmonic yield from the K valley is distinctively predominant when φ is located at the interval ranging from 150 to 240 as shown in Figure 3(a). The harmonic yields from two different valleys are comparable in other intervals of φ . We also calculate the average yield between 11th–order and 19th–order harmonics (denoted as H avg ) to evaluate the harmonic efficiency in plateau. Figure 3(b) shows H avg contributed by the K and K valleys as a function of φ in polar coordinates. One can see clearly that H avg is prominently dominated by the K valley in the interval ranging from 60 to 60 and by the K valley in that ranging from 120 to 240 , respectively.
To quantitatively evaluate the deviation degree of the harmonic yield between the two different valleys, we calculate the valley deviation parameter Q defined as [36,51,52,53]
Q = H K H K H K + H K / 2 ,
where H K and H K are the obtained harmonic yields from the K and K valleys, respectively. Figure 3(c) and Figure 3(d) show the calculated Q as a function of φ for H 15 and H avg , respectively. It turns out that the valley asymmetry of the HHG in plateau region can be regulated precisely by the relative phase φ . From Figure 3(c) and Figure 3(d), it is found that the valley deviation of the harmonic yield in plateau is close to 0 when φ is approximately equal to 90 or 270 , which corresponds to the results shown in Figure 2(b) and Figure 2(d). On the contrary, the valley asymmetries of harmonic plateaus between K and K valleys reach maximum when φ is close to ± 45 and 180 ± 45 , respectively. Our results suggest that the relative contribution of the two different valley for the HHG in plateau can be well controlled via φ . This feature guarantees the capability of generating valley–selective HHG in solids.
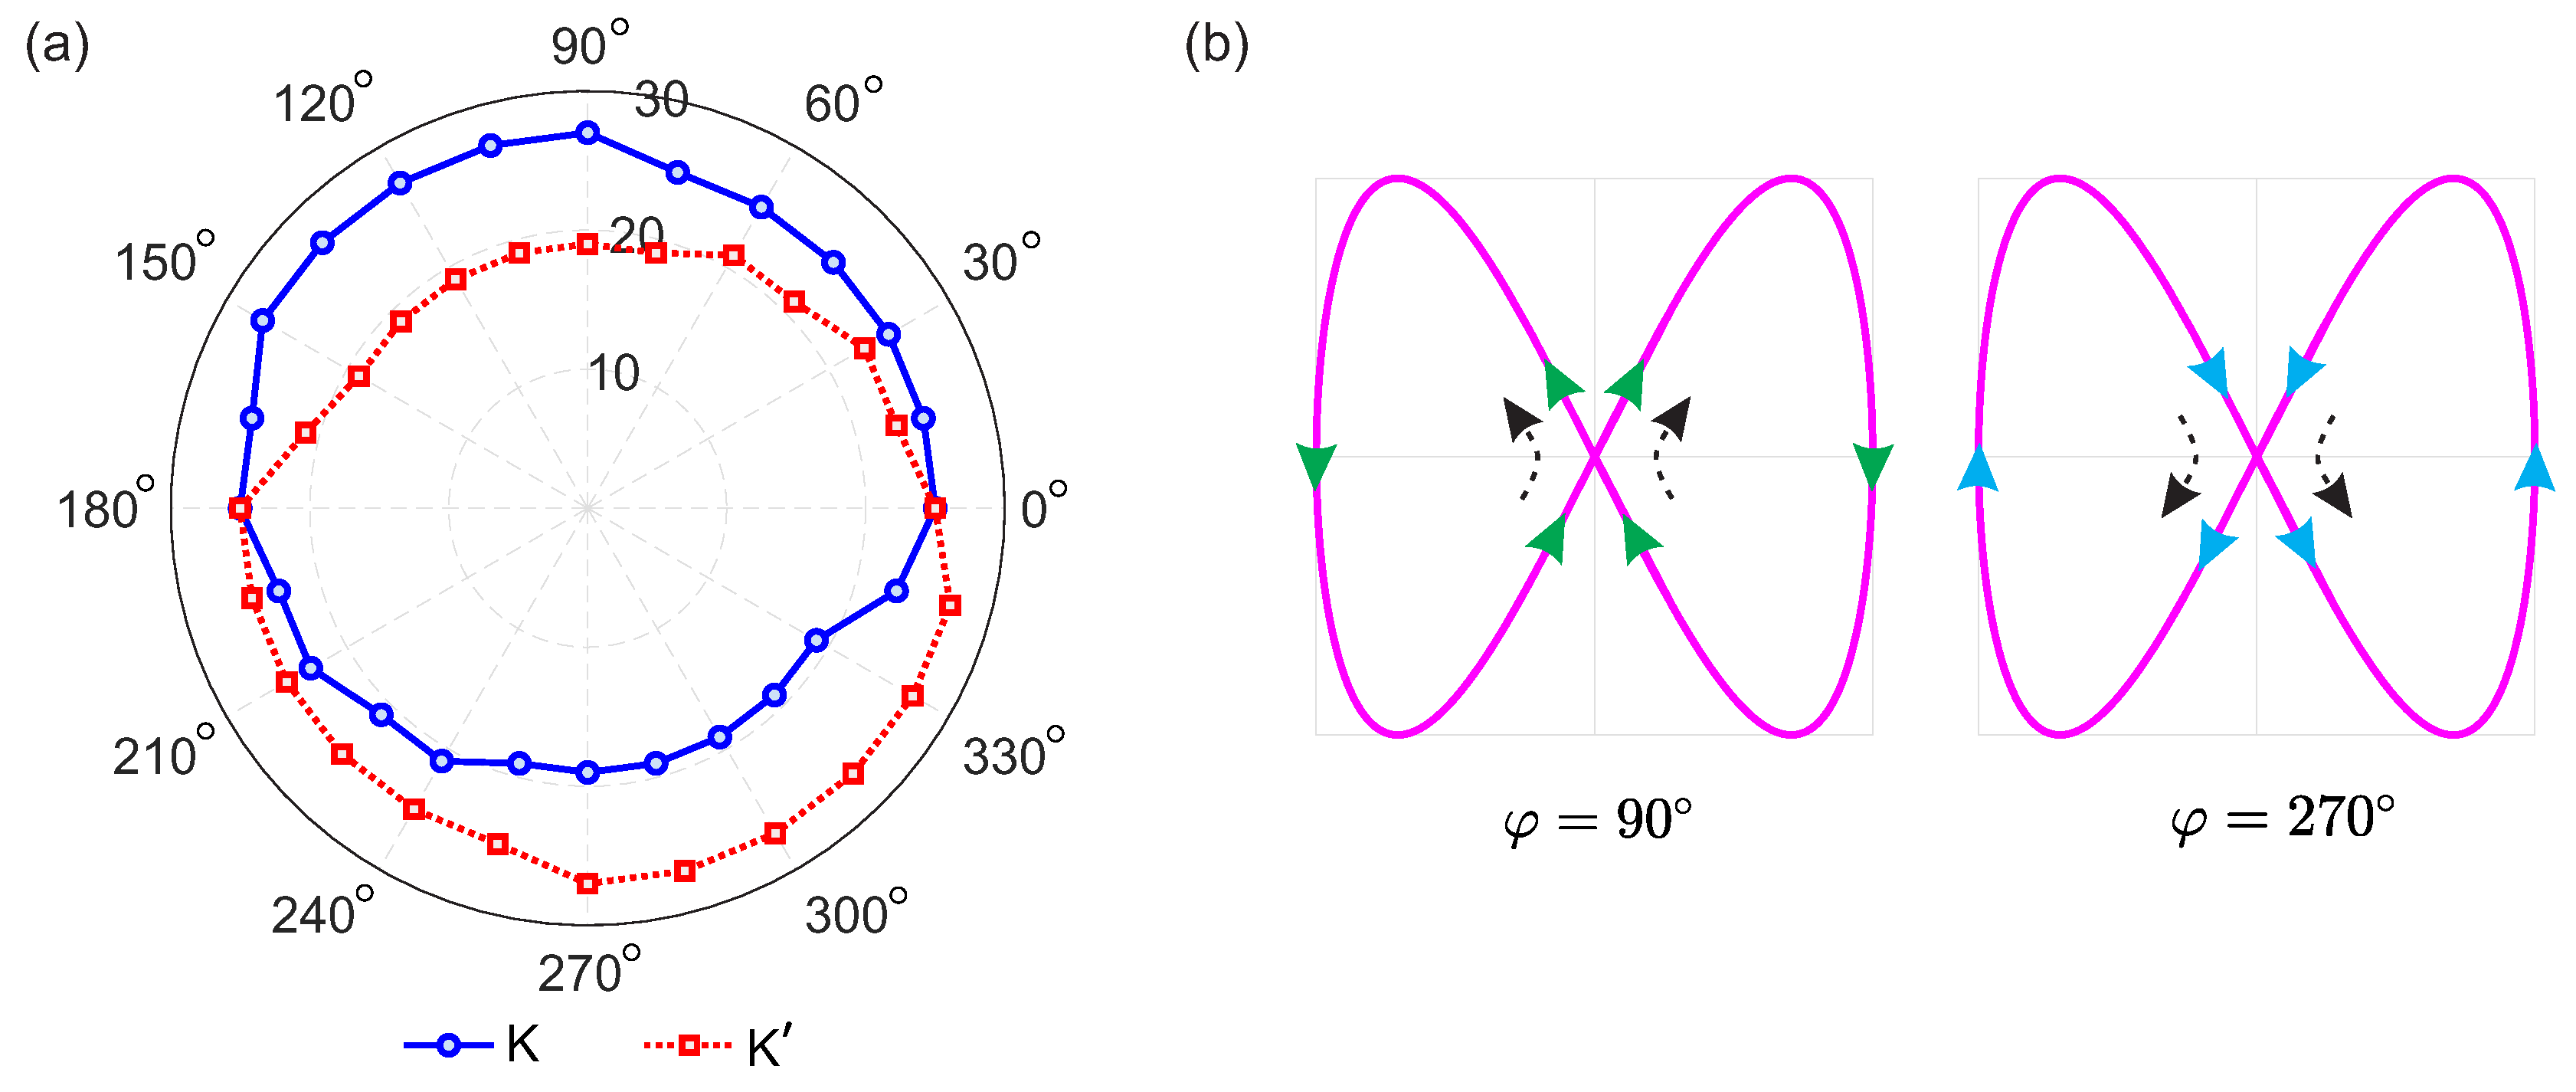
Apart from the harmonic yield in plateau, the valley asymmetry of the harmonic cutoff is also found in our studies. The cutoff orders of generated harmonics from the K and K valleys as a function of φ are shown in Figure 4(a) with polar coordinates. Here, the observed cutoff orders of harmonics from two valleys exhibit the obvious difference for the various φ except for the case of φ = 0 and 180 . From Figure 4(a), one can see that the harmonic cutoff from the K valley is greater that from the K valley when φ varies from 0 to 180 , whereas the relativeness is reversed when φ belongs to the interval ranging from 180 to 360 . It is noticed that the Lissajous figure of the OTC laser field exhibits a bivalve structure containing the left and right lobes when φ 0 or 180 . We find that the valley selectivity of the harmonic cutoff is associated with the helicity of the left/right lobe of the OCT laser field. Specifically, the left lobe of the OTC laser field rotates in an anticlockwise direction and the right lobe of that rotates in a clockwise direction when φ ranges from 0 to 180 . However, the helicities of both two lobes reverse when φ is located at the interval ranging from 180 to 360 . The rotation directions and helicity configurations of the OTC laser fields with φ = 90 and 270 are chosen as the examples and are shown in Figure 4(b). The asymmetric couplings of the two different valleys to the specific helicity of the OCT laser field result in the valley discrimination of the harmonic cutoff.
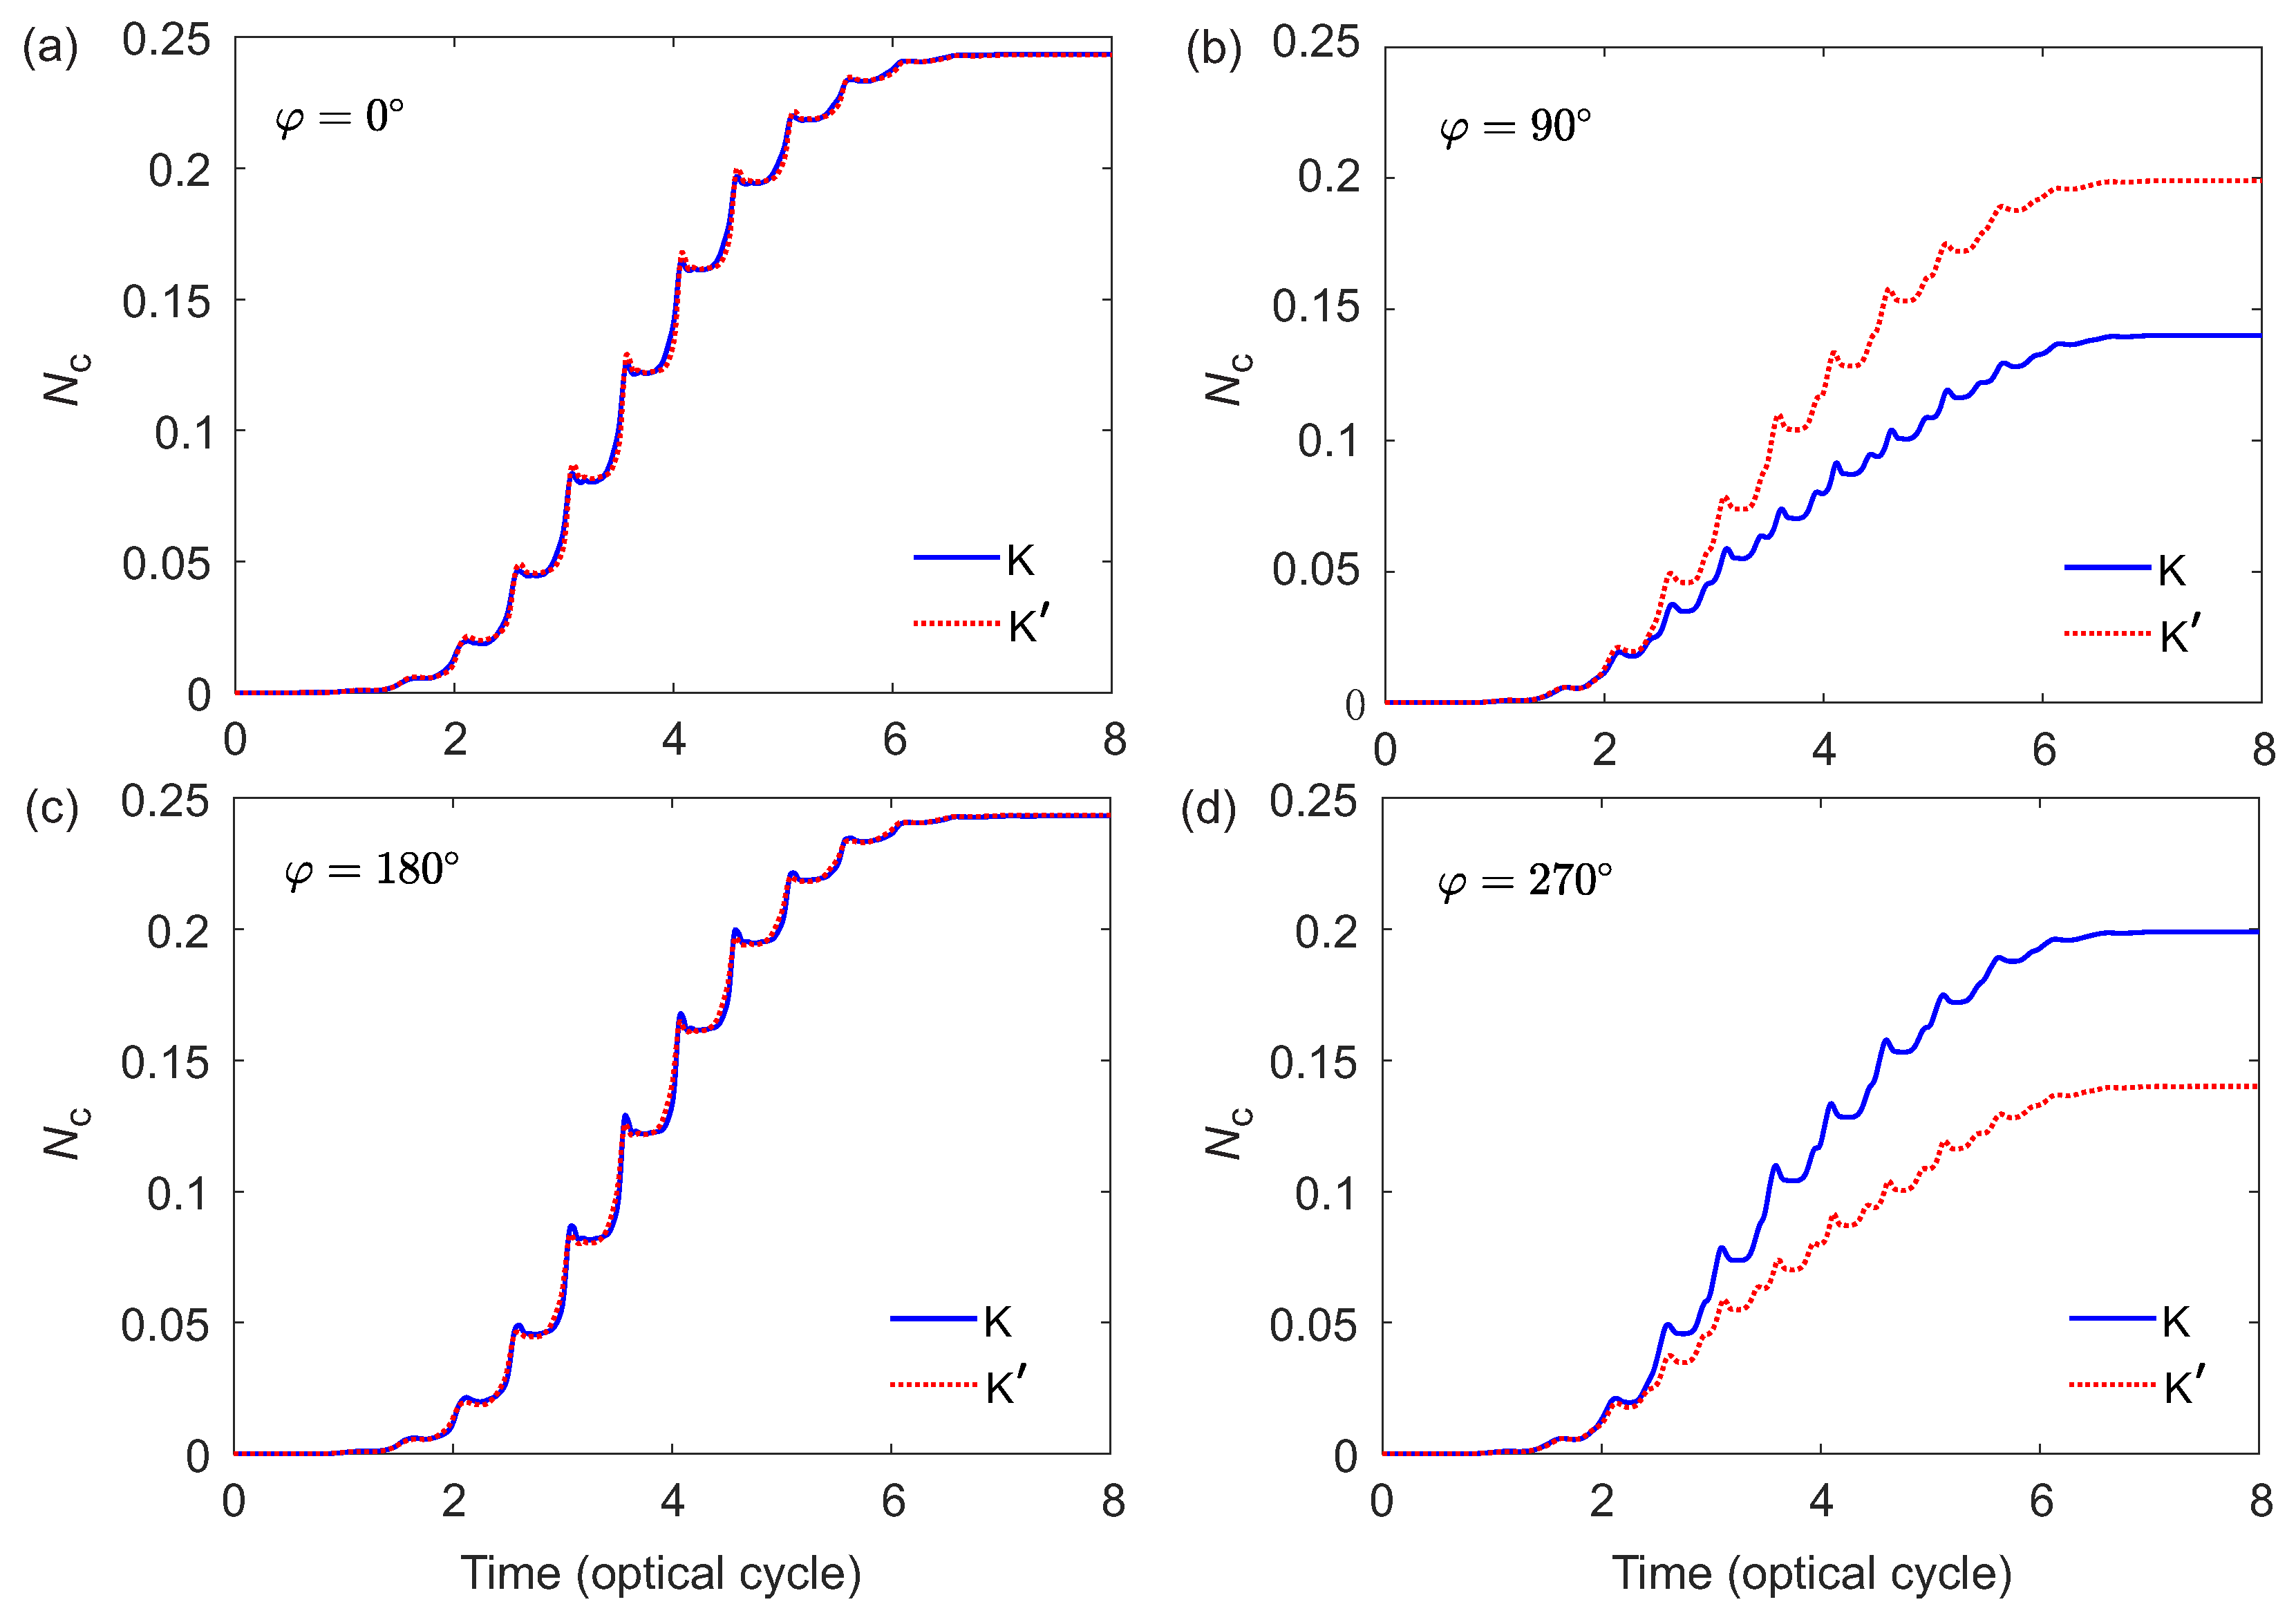
The substantial contrast between the two valleys for the electronic excitation can also be obtained via the OTC laser field in our scheme. Figure 5(a)–(d) show the time–dependent electron populations of the CB from K and K valleys with φ = 0 , 90 , 180 and 270 , respectively. One can see clearly that N c is almost exactly the same when φ = 0 or 180 , whereas remarkable divergences are present for the cases of φ = 90 and 270 . As shown in Figure 5(b), the electronic excitation from the K valley is distinctly superior to that from the K valley when φ = 90 . The electron population at the end of the laser pulse from the K valley is nearly twice as much as that from the K valley. However, the relativity of electronic excitations from two valleys is exactly reversed when φ = 270 as presented in Figure 5(d). The valley asymmetry of the electronic excitation induced by the OTC laser field offers a useful way to achieve the valley polarization using the LP laser pulse. Compared with a traditional method via the bandgap–resonant CP laser pulse based on the valley optical selection rules, our scheme performed with non–resonant LP laser pulses has the advantages of better accessibility and flexibility.
Our research further suggests that the degree of the valley polarization can be precisely controlled by the relative phase of the OTC laser field. Figure 6(a) shows the electron populations at the end of the laser pulse from two valleys as a function of φ for the CB. This result indicates that the asymmetry degree of the electron populations between two different valleys changes simultaneously with φ . Thus the dominant valley for the electronic polarization can be shifted by choosing given φ . As shown in Figure 6(a), the valley polarization always occurs for various φ except for the cases of φ = 0 and 180 . The K and K are prevailing for the valley polarization with φ belonging to the interval ranging from 0 to 180 and that ranging from 180 to 360 , respectively. It is worth noting that the dependence of the electron population from two valleys on φ is highly similar to that of the harmonic cutoff shown in Figure 4(a). Hence, the valley polarization induced by the OTC laser field can also be attributed to the asymmetric responses of two valleys to the helicities of two lobes of the OTC laser field. In order to quantify the degree of valley polarization, valley asymmetry parameter η is introduced and is defined as [36,51,52,53]
η = N c K N c K N c K + N c K / 2 ,
where N c K and N c K are the electron populations at the end of the laser pulse from K and K valleys in CB, respectively. The obtained values of η as a function of φ is shown in Figure 6(b). One can see that the curve of η exhibits a typical fluctuation like a negative sinusoidal waveform. The valley polarization reaches the global maximum when φ = 90 or 270 , where values of η are as high as ± 34.8 % . The valley asymmetry of the electron population vanishes when φ = 0 or 180 . The canonical modulation curve of η on φ provides a solid foundation for manipulating the valley polarization accurately by varying the relative phase of the OTC laser field.

4. Conclusions

In summary, we theoretically investigate the contributions from K and K valleys in the responses of HHG and electronic excitation induced by the OTC laser field in gapped graphene. It is concluded that the deviation degrees of harmonic yield in plateau, harmonic cutoff and electron population between both two valleys are precisely controlled by the relative phase of the OTC laser field. The relative–phase–dependent valley asymmetries permit that the valley–selective HHG and electronic polarization can be achieved by choosing applicable relative phase of the OTC laser field. Our scheme has the outstanding advantage of better manipulability and accessibility due to the usage of non–resonant LP laser pulses. This work opens an all–optical way to realize and control the valley asymmetry on a femtosecond timescale, which facilitates our understanding of ultrafast electron dynamics near Dirac points.

Author Contributions

Conceptualization, X.L.; methodology, X.L.; software, X.L.; validation, X.L., D.L. and Y.S.; formal analysis, X.L., D.L. and Y.S.; investigation, X.L. and Y.L.; resources, X.L.; data curation, X.L. and C.Z.; writing—original draft preparation, X.L.; writing—review and editing, X.L. and C.Z.; visualization, X.L. and C.Z.; supervision, X.L.; project administration, X.L.; funding acquisition, X.L. All authors have read and agreed to the published version of the manuscript.

Funding

This research was funded by the National Natural Science Foundation of China under Grants No. 12004325, the Six Talent Peaks Program of Jiangsu Province under Grant No. JY–105 and the State Key Laboratory Open Fund of Millimeter Waves under Grant No. K202105. Dongdong Liu was supported by the Jiangsu Qinglan project.

Institutional Review Board Statement

Not applicable.

Informed Consent Statement

Not applicable.

Data Availability Statement

The data supporting the findings of this study are available from the corresponding author upon reasonable request.

Conflicts of Interest

The authors declare no conflict of interest.

References

  1. Krausz, F.; Ivanov, M. Attosecond physics. Rev. Mod. Phys. 2009, 81, 163. [Google Scholar] [CrossRef]
  2. Corkum, P.B.; Krausz, F. Attosecond science. Nat. Phys. 2007, 3, 381–387. [Google Scholar] [CrossRef]
  3. Hentschel, M.; Kienberger, R.; Spielmann, C.; Reider, G.A.; Milosevic, N.; Brabec, T.; Corkum, P.; Heinzmann, U.; Drescher, M.; Krausz, F. Attosecond metrology. Nature 2001, 414, 509–513. [Google Scholar] [CrossRef]
  4. Zhu, X.; Lu, P.; Lein, M. Control of the Geometric Phase and Nonequivalence between Geometric–Phase Definitions in the Adiabatic Limit. Phys. Rev. Lett. 2022, 128, 030401. [Google Scholar] [CrossRef] [PubMed]
  5. Schafer, K.J.; Yang, B.; DiMauro, L.F.; Kulander, K.C. Above threshold ionization beyond the high harmonic cutoff. Phys. Rev. Lett. 1993, 70, 1599. [Google Scholar] [CrossRef]
  6. Corkum, P.B. Plasma perspective on strong field multiphoton ionization. Phys. Rev. Lett. 1993, 71, 1994. [Google Scholar] [CrossRef]
  7. Lewenstein, M.; Balcou, P.; Ivanov, M.Y.; L’Huillier, A.; Corkum, P.B. Theory of high-harmonic generation by low–frequency laser fields. Phys. Rev. A 1994, 49, 2117. [Google Scholar] [CrossRef]
  8. He, L.; Lan, P.; Le, A.; Wang, B.; Wang, B.; Zhu, X.; Lu, P.; Lin, C.D. Real–Time Observation of Molecular Spinning with Angular High–Harmonic Spectroscopy. Phys. Rev. Lett. 2018, 121, 163201. [Google Scholar] [CrossRef]
  9. Ganeev, R.A. High–Order Harmonics Generation in Selenium–Containing Plasmas. Photonics 2023, 10, 854. [Google Scholar] [CrossRef]
  10. Liu, X.; Zhu, X.; Li, L.; Li, Y.; Zhang, Q.; Lan, P.; Lu, P. Selection rules of high–order–harmonic generation: Symmetries of molecules and laser fields. Phys. Rev. A 2016, 94, 033410. [Google Scholar] [CrossRef]
  11. Paul, P.M.; Toma, E.S.; Breger, P.; Mullot, G.; Augé, F.; Balcou, P.; Muller, H.G.; Agostini, P. Observation of a Train of Attosecond Pulses from High Harmonic Generation. Science 2001, 292, 1689–1692. [Google Scholar] [CrossRef] [PubMed]
  12. Chatziathanasiou, S.; Kahaly, S.; Skantzakis, E.; Sansone, G.; Lopez-Martens, R.; Haessler, S.; Varju, K.; Tsakiris, G.D.; Charalambidis, D.; Tzallas, P. Generation of Attosecond Light Pulses from Gas and Solid State Media. Photonics 2017, 4, 26. [Google Scholar] [CrossRef]
  13. Zhai, C.; Zhu, X.; Long, J.; Shao, R.; Zhang, Y.; He, L.; Tang, Q.; Li, Y.; Lan, P.; Yu, B.; Lu, P. Generation of elliptically polarized attosecond pulses in mixed gases. Phys. Rev. A 2021, 103, 033114. [Google Scholar] [CrossRef]
  14. Ghimire, S.; DiChiara, A.D.; Sistrunk, E.; Agostini, P.; DiMauro, L.F.; Reis, D.A. Observation of high–order harmonic generation in a bulk crystal. Nat. Phys. 2011, 7, 138–141. [Google Scholar] [CrossRef]
  15. Kruchinin, S.Y.; Krausz, F.; Yakovlev, V.S. Colloquium: Strong–field phenomena in periodic systems. Rev. Mod. Phys. 2018, 90, 021002. [Google Scholar] [CrossRef]
  16. Vampa, G.; Hammond, T.J.; Thiré, N.; Schmidt, B.E.; Légaré, F.; McDonald, C.R.; Brabec, T.; Corkum, P.B. Linking high harmonics from gases and solids. Nature 2015, 522, 462–464. [Google Scholar] [CrossRef]
  17. Yoshikawa, N.; Tamaya, T.; Tanaka, K. High-harmonic generation in graphene enhanced by elliptically polarized light excitation. Science 2017, 356, 736–738. [Google Scholar] [CrossRef]
  18. Han, S. High–Harmonic Generation Using a Single Dielectric Nanostructure. Photonics 2022, 9, 427. [Google Scholar] [CrossRef]
  19. Liu, X.; Zhu, X.; Lan, P.; Zhang, X.; Wang, D.; Zhang, Q.; Lu, P. Time–dependent population imaging for high–order–harmonic generation in solids. Phys. Rev. A 2017, 95, 063419. [Google Scholar] [CrossRef]
  20. Fu, S.; Feng, Y.; Li, J.; Yue, S.; Zhang, X.; Hu, B.; Du, H. Recollision dynamics analysis of high–order harmonic generation in solids. Phys. Rev. A 2020, 101, 023402. [Google Scholar] [CrossRef]
  21. Lanin, A.A.; Stepanov, E.A.; Fedotov, A.B.; Zheltikov, A.M. Mapping the electron band structure by intraband high–harmonic generation in solids. Optica 2017, 4, 516–519. [Google Scholar] [CrossRef]
  22. Li, L.; Lan, P.; He, L.; Cao, W.; Zhang, Q.; Lu, P. Determination of Electron Band Structure using Temporal Interferometry. Phys. Rev. Lett. 2020, 124, 157403. [Google Scholar] [CrossRef] [PubMed]
  23. Bauer, D.; Hansen, K.K. High–Harmonic Generation in Solids with and without Topological Edge States. Phys. Rev. Lett. 2018, 120, 177401. [Google Scholar] [CrossRef] [PubMed]
  24. Castro Neto, A.H.; Guinea, F.; Peres, N.M.R.; Novoselov, K.S.; Geim, A.K. The electronic properties of graphene. Rev. Mod. Phys. 2009, 81, 109. [Google Scholar] [CrossRef]
  25. Geim, A.K. Graphene: Status and Prospects. Science 2009, 324, 1530–1534. [Google Scholar] [CrossRef]
  26. Schaibley, J.R.; Yu, H.; Clark, G.; Rivera, P.; Ross, J.S.; Seyler, K.L.; Yao, W.; Xu, X. Valleytronics in 2D materials. Nat. Rev. Mater. 2016, 1, 16055. [Google Scholar] [CrossRef]
  27. Vitale, S.A.; Nezich, D.; Varghese, J.O.; Kim, P.; Gedik, N.; Jarillo–Herrero, P.; Xiao, D.; Rothschild, M. Valleytronics: Opportunities, Challenges, and Paths Forward. Small 2018, 14, 1801483. [Google Scholar] [CrossRef]
  28. Langer, F.; Schmid, C.P.; Schlauderer, S.; Gmitra, M.; Fabian, J.; Nagler, P.; Schüller, C.; Korn, T.; Hawkins, P.G.; Steiner, J.T.; Huttner, U.; Koch, S.W.; Kira, M.; Huber, R. Lightwave valleytronics in a monolayer of tungsten diselenide. Nature 2018, 557, 76–80. [Google Scholar] [CrossRef]
  29. Xiao, D.; Yao, W.; Niu, Q. Valley–Contrasting Physics in Graphene: Magnetic Moment and Topological Transport. Phys. Rev. Lett. 2007, 99, 236809. [Google Scholar] [CrossRef]
  30. Mak, K.F.; Xiao, D.; Shan, J. Light–valley interactions in 2D semiconductors. Nat. Photon. 2018, 12, 451–460. [Google Scholar] [CrossRef]
  31. Jiménez–Galán, Á.; Silva, R.E.F.; Smirnova, O.; Ivanov, M. Lightwave control of topological properties in 2D materials for sub–cycle and non-resonant valley manipulation. Nat. Photon. 2020, 14, 728–732. [Google Scholar] [CrossRef]
  32. Jiménez–Galán, Á.; Silva, R.E.F.; Smirnova, O.; Ivanov, M. Sub-cycle valleytronics: control of valley polarization using few-cycle linearly polarized pulses. Optica 2021, 8, 277–280. [Google Scholar] [CrossRef]
  33. Sharma, S.; Elliott, P.; Shallcross, S. Valley control by linearly polarized laser pulses: example of WSe2. Optica 2022, 9, 947–952. [Google Scholar] [CrossRef]
  34. Golub, L.; Tarasenko, S. Valley polarization induced second harmonic generation in graphene. Phys. Rev. B 2014, 90, 201402. [Google Scholar] [CrossRef]
  35. Mak, K.F.; McGill, K.L.; Park, J.; McEuen, P.L. The valley Hall effect in MoS2 transistors. Science 2014, 344, 1489–1492. [Google Scholar] [CrossRef] [PubMed]
  36. Mrudul, M.S.; Jiménez–Galán, Á.; Ivanov, M.; Dixit, G. Light–induced valleytronics in pristine graphene. Optica 2021, 8, 422–427. [Google Scholar] [CrossRef]
  37. He, Y.; Guo, J.; Gao, F.; Liu, X. Dynamical symmetry and valley–selective circularly polarized high–harmonic generation in monolayer molybdenum disulfide. Phys. Rev. B 2022, 105, 024305. [Google Scholar] [CrossRef]
  38. Chen, J.; Liu, C.; Li, R. Valley-Selective Polarization in Twisted Bilayer Graphene Controlled by a Counter-Rotating Bicircular Laser Field. Photonics 2023, 10, 516. [Google Scholar] [CrossRef]
  39. Reich, S.; Maultzsch, J.; Thomsen, C.; Ordejon, P. Tight–binding description of graphene. Phys. Rev. B 2002, 66, 035412. [Google Scholar] [CrossRef]
  40. Jiang, S.; Wei, H.; Chen, J.; Yu, C.; Lu, R.; Lin, C.D. Effect of transition dipole phase on high–order–harmonic generation in solid materials. Phys. Rev. A 2017, 96, 053850. [Google Scholar] [CrossRef]
  41. Dimitrovski, D.; Madsen, L.B.; Pedersen, T.G. High–order harmonic generation from gapped graphene: Perturbative response and transition to nonperturbative regime. Phys. Rev. B 2017, 95, 035405. [Google Scholar] [CrossRef]
  42. Avetissian, H.K.; Avetissian, A.K.; Avchyan, B.R.; Mkrtchian, G.F. Wave mixing and high harmonic generation at two–color multiphoton excitation in two–dimensional hexagonal nanostructures. Phys. Rev. B 2019, 100, 035434. [Google Scholar] [CrossRef]
  43. Avetissian, H.K.; Mkrtchian, G.F.; Knorr, A. Efficient high–harmonic generation in graphene with two–color laser field at orthogonal polarization. Phys. Rev. B 2022, 105, 195405. [Google Scholar] [CrossRef]
  44. Vampa, G.; McDonald, C.R.; Orlando, G.; Klug, D.D.; Corkum, P.B.; Brabec, T. Theoretical Analysis of High-Harmonic Generation in Solids. Phys. Rev. Lett. 2014, 113, 073901. [Google Scholar] [CrossRef] [PubMed]
  45. Liu, X.; Li, L.; Zhu, X.; Huang, T.; Zhang, X.; Wang, D.; Lan, P.; Lu, P. Wavelength dependence of high–order harmonic yields in solids. Phys. Rev. A 2018, 98, 063419. [Google Scholar] [CrossRef]
  46. Zhang, Y.; Li, J.; Li, L.; Huang, T.; Zhu, X.; Lan, P.; Lu, P. Enhancement of the photocurrents injected in gapped graphene by the orthogonally polarized two–color laser field. Opt. Express 2021, 29, 17387–17397. [Google Scholar] [CrossRef]
  47. Vampa, G.; McDonald, C.R.; Orlando, G.; Corkum, P.B.; Brabec, T. Semiclassical analysis of high harmonic generation in bulk crystals. Phys. Rev. B 2015, 91, 064302. [Google Scholar] [CrossRef]
  48. Guan, Z.; Zhou, X.; Bian, X. High–order–harmonic generation from periodic potentials driven by few-cycle laser pulses. Phys. Rev. A 2016, 93, 033852. [Google Scholar] [CrossRef]
  49. Wang, H.; Feng, Y.; Fu, S.; Li, J.; Zhang, X.; Du, H. Complex carrier-envelope-phase effect of solid harmonics under nonadiabatic conditions. Phys. Rev. A 2019, 99, 023406. [Google Scholar] [CrossRef]
  50. Liu, X.; Li, Y.; Liu, D.; Zhu, X.; Zhang, X.; Lu, P. Effects of quantum interferences among crystal–momentum–resolved electrons in solid high–order harmonic generation. Phys. Rev. A 2021, 103, 033104. [Google Scholar] [CrossRef]
  51. Cireasa, R.; Boguslavskiy, A.E.; Pons, B.; Wong, M.C.H.; Descamps, D.; Petit, S.; Ruf, H.; Thiré, N.; Ferré, A.; Suarez, J.; Higuet, J.; Schmidt, B.E.; Alharbi, A.F.; Légaré, F.; Blanchet, V.; Fabre, B.; Patchkovskii, S.; Smirnova, O.; Mairesse, Y.; Bhardwaj, V.R. Probing molecular chirality on a sub–femtosecond timescale. Nat. Phys. 2015, 11, 654–658. [Google Scholar] [CrossRef]
  52. Smirnova, O.; Mairesse, Y.; Patchkovskii, S. Opportunities for chiral discrimination using high harmonic generation in tailored laser fields. J. Phys. B: At. Mol. Opt. Phys. 2015, 48, 234005. [Google Scholar] [CrossRef]
  53. Zhu, X.; Liu, X.; Lan, P.; Wang, D.; Zhang, Q.; Li, W.; Lu, P. Anomalous circular dichroism in high harmonic generation of stereoisomers with two chiral centers. Opt. Express 2016, 24, 24824–24835. [Google Scholar] [CrossRef] [PubMed]
Figure 1. (a) Band structures of the CB and VB for the gapped graphene with a bandgap Δ = 1 eV . (b) K and K valleys in the VB.
Preprints 85390 g001
Figure 2. High harmonic spectra from the K and K valleys with various relative phases of OTC laser fields: (a) φ = 0 , (b) φ = 90 , (c) φ = 180 , and (d) φ = 270 . The Lissajous figures of the laser fields are plotted in the insets at the upper-right corners of the panels.
Preprints 85390 g002
Figure 3. High harmonic yields from the K and K valleys as a function of relative phase φ of the OTC laser field for (a) H 15 and (b) H avg . Valley deviation parameter Q as a function of φ for (c) H 15 and (d) H avg . H 15 denotes the 15th–order harmonic. H avg denotes the average yield of harmonics in plateau, which is calculated as the average yield between 11th–order and 19th–order harmonics.
Preprints 85390 g003
Figure 4. (a) Cutoff orders of harmonics contributed by the K and K valleys as a function of φ . (b) The Lissajous figures of adopted OTC laser fields with φ = 90 and 270 . The solid arrow indicates the rotation direction of the laser field. The dashed arrow indicates the helicity for the left/right lobe of the laser field.
Preprints 85390 g004
Figure 5. The time–dependent electron populations N c from K and K valleys with various relative phases of OTC laser fields: (a) φ = 0 , (b) φ = 90 , (c) φ = 180 , and (d) φ = 270 .
Preprints 85390 g005
Figure 6. (a) The electron populations at the end of the laser pulse from K and K valleys as a function of φ for the CB. (b) Valley asymmetry parameter η as a function of φ for the CB.
Preprints 85390 g006
Disclaimer/Publisher’s Note: The statements, opinions and data contained in all publications are solely those of the individual author(s) and contributor(s) and not of MDPI and/or the editor(s). MDPI and/or the editor(s) disclaim responsibility for any injury to people or property resulting from any ideas, methods, instructions or products referred to in the content.
Copyright: This open access article is published under a Creative Commons CC BY 4.0 license, which permit the free download, distribution, and reuse, provided that the author and preprint are cited in any reuse.
Prerpints.org logo

Preprints.org is a free preprint server supported by MDPI in Basel, Switzerland.

Subscribe

© 2024 MDPI (Basel, Switzerland) unless otherwise stated