1. Introduction
As well known, the current target of international policies for energy independence and clean energy transition [
1,
2,
3], is the reduction of the dependence on fossil fuels and related emissions through the enhancement of Renewable Energy Sources (RES). The worldwide production from RES exceeded 7,857 TWh in 2021, with solar photovoltaic (PV) and wind power accounting for more than 57% of installed capacity [
4] and planned additions for 2023 of 290 GW for PV and 107 GW for wind turbines [
5]. However, the increasing penetration of non-dispatchable renewables, such as solar and wind energy, is directly linked to more and more frequent cases of generation curtailment for grid safety reasons [
6]. According to the International Energy Agency (IEA), the way to further increase the share of RES without simultaneously increasing generation curtailment is to improve the power system flexibility [
7].
Apart from structural improvements on the grid and the introduction of suitable energy management strategies applied to both demand and supply sides, the enhancement of the power system flexibility can be mainly achieved by the widespread diffusion of energy storage systems, which allow to shift the RES overproduction (typically during daytime) towards periods of overdemand (typically during night hours). What is more, in the context of grid congestion control through the so called “marked-based methods” [
8], progressively more high tariffs are being offered for increasing the demand during moments of overproduction and decreasing it (or even supply energy) during moments of overdemand [
9,
10,
11].
Currently, the ancillary services to the grid are mainly operated by thermal power plants based of the use of simple cycle and combined cycle gas turbine plants fueled by natural gas [
12]. According to the International Energy Agency (IEA), about 22% of global CO
2 emissions derived from natural gas combustion in 2021 [
3], and same levels were maintained in 2022 [
13]. A widely studied way to offer the same ancillary services of conventional gas turbines while avoiding CO
2 emissions, is represented by substituting natural gas with hydrogen [
14,
15,
16,
17]. Nowadays, a successful example of a gas turbine running on blends up to 100% hydrogen and low NOx brought the studies on this technology to a TRL of 4 [
18]. Obviously, CO
2 emissions can be effectively avoided only if the hydrogen is produced starting from renewable energy.
On the other hand, many energy storage technologies are currently available or under development, each characterized by specific features in terms of maximum deliverable power, storage capacity, round-trip efficiency, lifetime etc. [
19]. Among the energy storage technologies characterized by medium-high storage capacities Compressed Air Energy Storage (CAES) systems are one of the most interesting options, potentially more cost-effective compared to batteries and somehow comparable to pumping hydro systems. CAES technology is very similar to conventional gas turbine plants, but the compression and expansion processes are deferred in time and thus require a suitable reservoir to store the compressed air. Depending on the use of the heat generated during air compression, the different CAES configurations can be classified as Diabatic CAES (no heat recovery), Adiabatic CAES (the compression heat is recovered, stored, and subsequently used to heat the air before expansion) and Isothermal CAES (the compression and expansion processes occur at approximately constant temperature) [
20].
Within this framework, the present study proposes a new energy storage concept based on a Diabatic Compressed Air Energy Storage plant fueled with green hydrogen, produced directly on site through a Proton Exchange Membrane (PEM) electrolyzer powered by a PV plant. Although CAES technology is not new, its integration with various RES forms [
21,
22,
23,
24,
25,
26] and its related management represents a promising research field for energy storage [27, 28]. What is more, the proposed H2-CAES plant can provide high flexibility to the grid and effectively addresses all the previously described issues. In fact, it is able to: 1) shift the RES production towards the night hours, 2) eliminate the dependency on both fossil fuel and gas pipelines, 3) provide ancillary services (time shift, peak shaving, spinning power delivery and frequency regulation), 4) operate with zero CO
2 emissions 5) reduce grid congestion not only by varying its power production, but also its consumption profile.
The proposed plant layout is derived from a conventional diabatic CAES system [
20]. Currently, the McIntosh [
29] and the Huntorf [
30] plants are the only two examples of operative CAES technology. The Huntorf plant, originally built with a 270 MW power capacity, started its operation in 1978 and was later retrofitted in 2006 with a 321 MW turbine to increase its electricity generation. The McIntosh plant was built later in 1991, with a turboexpander power of 110 MW [
20].
Since one of the main targets of the European Union (EU) directives is the promotion of sustainable energy communities (such as a small town, a small industrial district, etc.), energy storage systems of medium size storage capacity will play a fundamental role to enhance the flexibility of mini grids powered by renewable electricity [
31]. For this reason, as well as to avoid unreasonable sizes of the PV plant, the proposed layout is originated from a down-scaled version of the McIntosh plant.
In this paper, the main features of this new energy storage concept and the results of the performance analysis are reported and discussed. In particular, the H2-CAES performance was evaluated with the aim to optimize the Self-Consumption (SC) share of the PV energy generation as a function of the main design parameters (nominal power of both PV system and electrolyzer, discharge time and energy storage capacity).
2. Methods
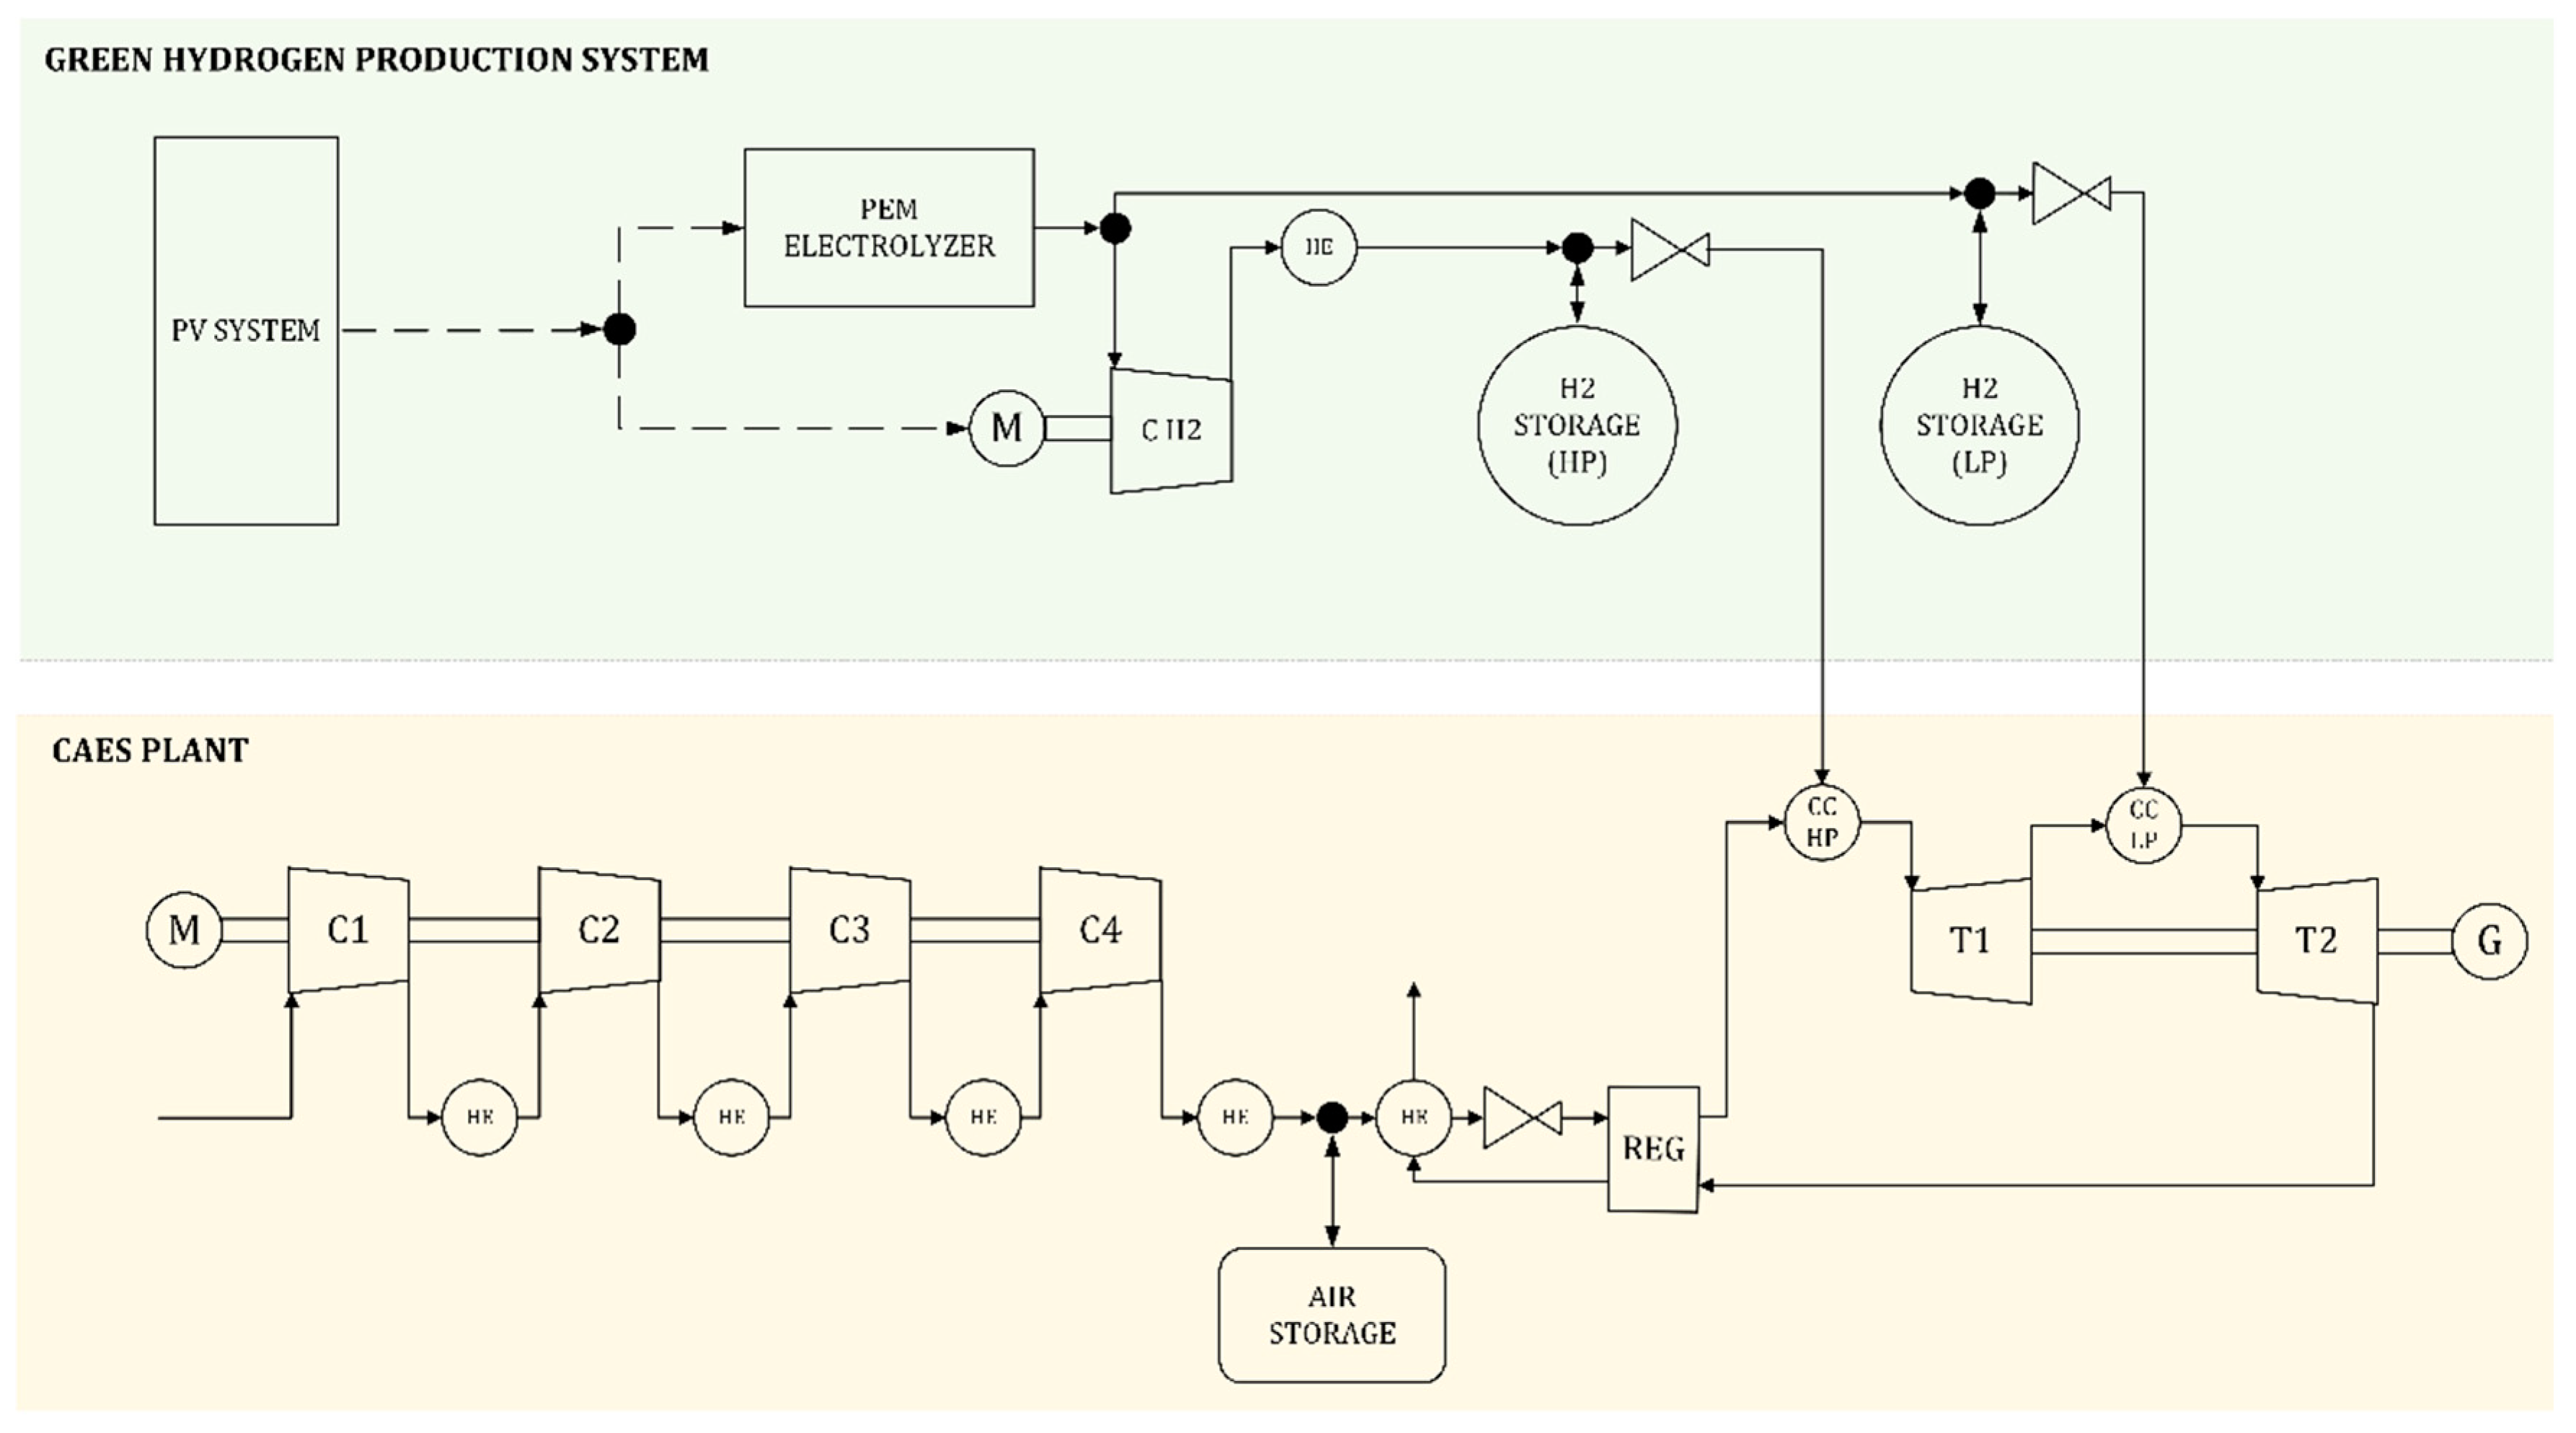
A schematic diagram of the proposed H2-CAES plant configuration is illustrated in
Figure 1. The H2-CAES plant here analyzed includes two main sections: the CAES section fueled with hydrogen and the hydrogen production section. The latter includes a PV power plant, a PEM electrolyzer and the hydrogen storage tanks.
In particular, the CAES section here considered is originated from a downscaled version of the McIntosh plant (used as reference case and from now on named “CH4-CAES”). The original McIntosh CAES configuration consists of a compression train with four compressors, an air storage unit, a turboexpander train with two turbines, two combustion chambers and a regenerator.
The operational strategy of the McIntosh plant is based on a weekly cycle, repeated throughout all 52 weeks of the year. A single cycle consists of a 40-hour charge phase, which occurs during the nighttime and weekends, and a 24-hour discharge phase, which occurs during daytime of working days. The 40 hours of charge, as well as the 24 hours of discharge, are not consecutive but rather distributed across the working days of the week (around 5 hours of discharge per day). It's important to consider that the McIntosh plant was designed during the late 1980s, when RES penetration was very low, excesses of energy production occurred during the night, while peaks of demand occurred during daytime. For this reason, the plant’s operational strategy included a nocturnal charge phase and a diurnal discharge phase. Clearly, such a strategy is no longer appropriate in a global scenario of high, and growing, RES penetration, where the charge and discharge periods must follow the RES production and are typically reversed. For this reason and considering the current scenario, the operational strategy of the proposed H2-CAES plant involves a nocturnal discharge phase and a diurnal charge phase, where the air cavern and the hydrogen tank are charged independently each other. In particular, the air cavern is charged depending on the overproduction of the electrical grid, while the hydrogen tank is charged according to the energy availability of the PV power plant.
The power output of the turboexpander train was set to be equal to that of the McIntosh plant, downscaled by a factor of 2.62. The main parameters of the original and downscaled McIntosh plants are reported in
Table 1.
2.1. Mathematical model
The mathematical model of the H2-CAES system was developed using the MATLAB software [
32]. Simulations were carried throughout one year with a time step of 1 hour.
2.1.1. CAES plant model
The turboexpander train was modelled assuming steady-state conditions [
17] and constant isentropic efficiency for the turbines (80%). The efficiency of the combustion chambers was set equal to 98%. In addition, all sub-components were considered adiabatic and without any pressure losses. The turbines inlet temperatures and pressures, as well as the regeneration level, were set equal to those of the McIntosh plant (T
HP = 811K; P
HP = 42 bar; T
LP = 1144K; P
LP = 15 bar; R=68%). The Lower Heating Values LHVs of methane and hydrogen were assumed equal to 50 MJ/kg and 120 MJ/kg, respectively. The power output of the turboexpander train was set to be equal to that of McIntosh, downscaled by a factor of 2.62. The design mass flow rates of both air and hydrogen were calculated by solving the mass and energy balances for the two combustion chambers. The masses (and volumes) of air and hydrogen to be stored were calculated, according to Sadreddini et al [
3], to ensure the supply of the discharging mass flows of air and hydrogen for the required time (
). The compressor train, which was designed to replicate the configuration of the McIntosh plant, consists of four multistage compressors, with a design polytropic efficiency of 85 %, with intercooling and aftercooling. The compressors design and off-design performance were calculated according to the Casey-Robinson method [
33]
2.1.2. Green hydrogen production system
The energy production of the PV system was simulated as suggested by Duffie et al. [
34], considering solar panels inclined at 30° from the horizontal plane (tilt=30°) and oriented towards the south (azimuth=0°). Typical weather conditions provided by Meteonorm software [
35] for a latitude of 39.21° were considered. The PEM electrolyzer was modelled by using the steady state model proposed by Zhao et al. [
36].
3. Results and discussion
In this chapter, the results of the study are reported and discussed. The design parameters here investigated include the nominal power of the PV system (), assumed within the range 40-100 MW, the nominal power of the PEM electrolyzer () , assumed within the range 40-85 MW, the minimum discharge time (), assumed within the range 5-9 h, and the maximum discharge time (), assumed within the range 5-15 h.
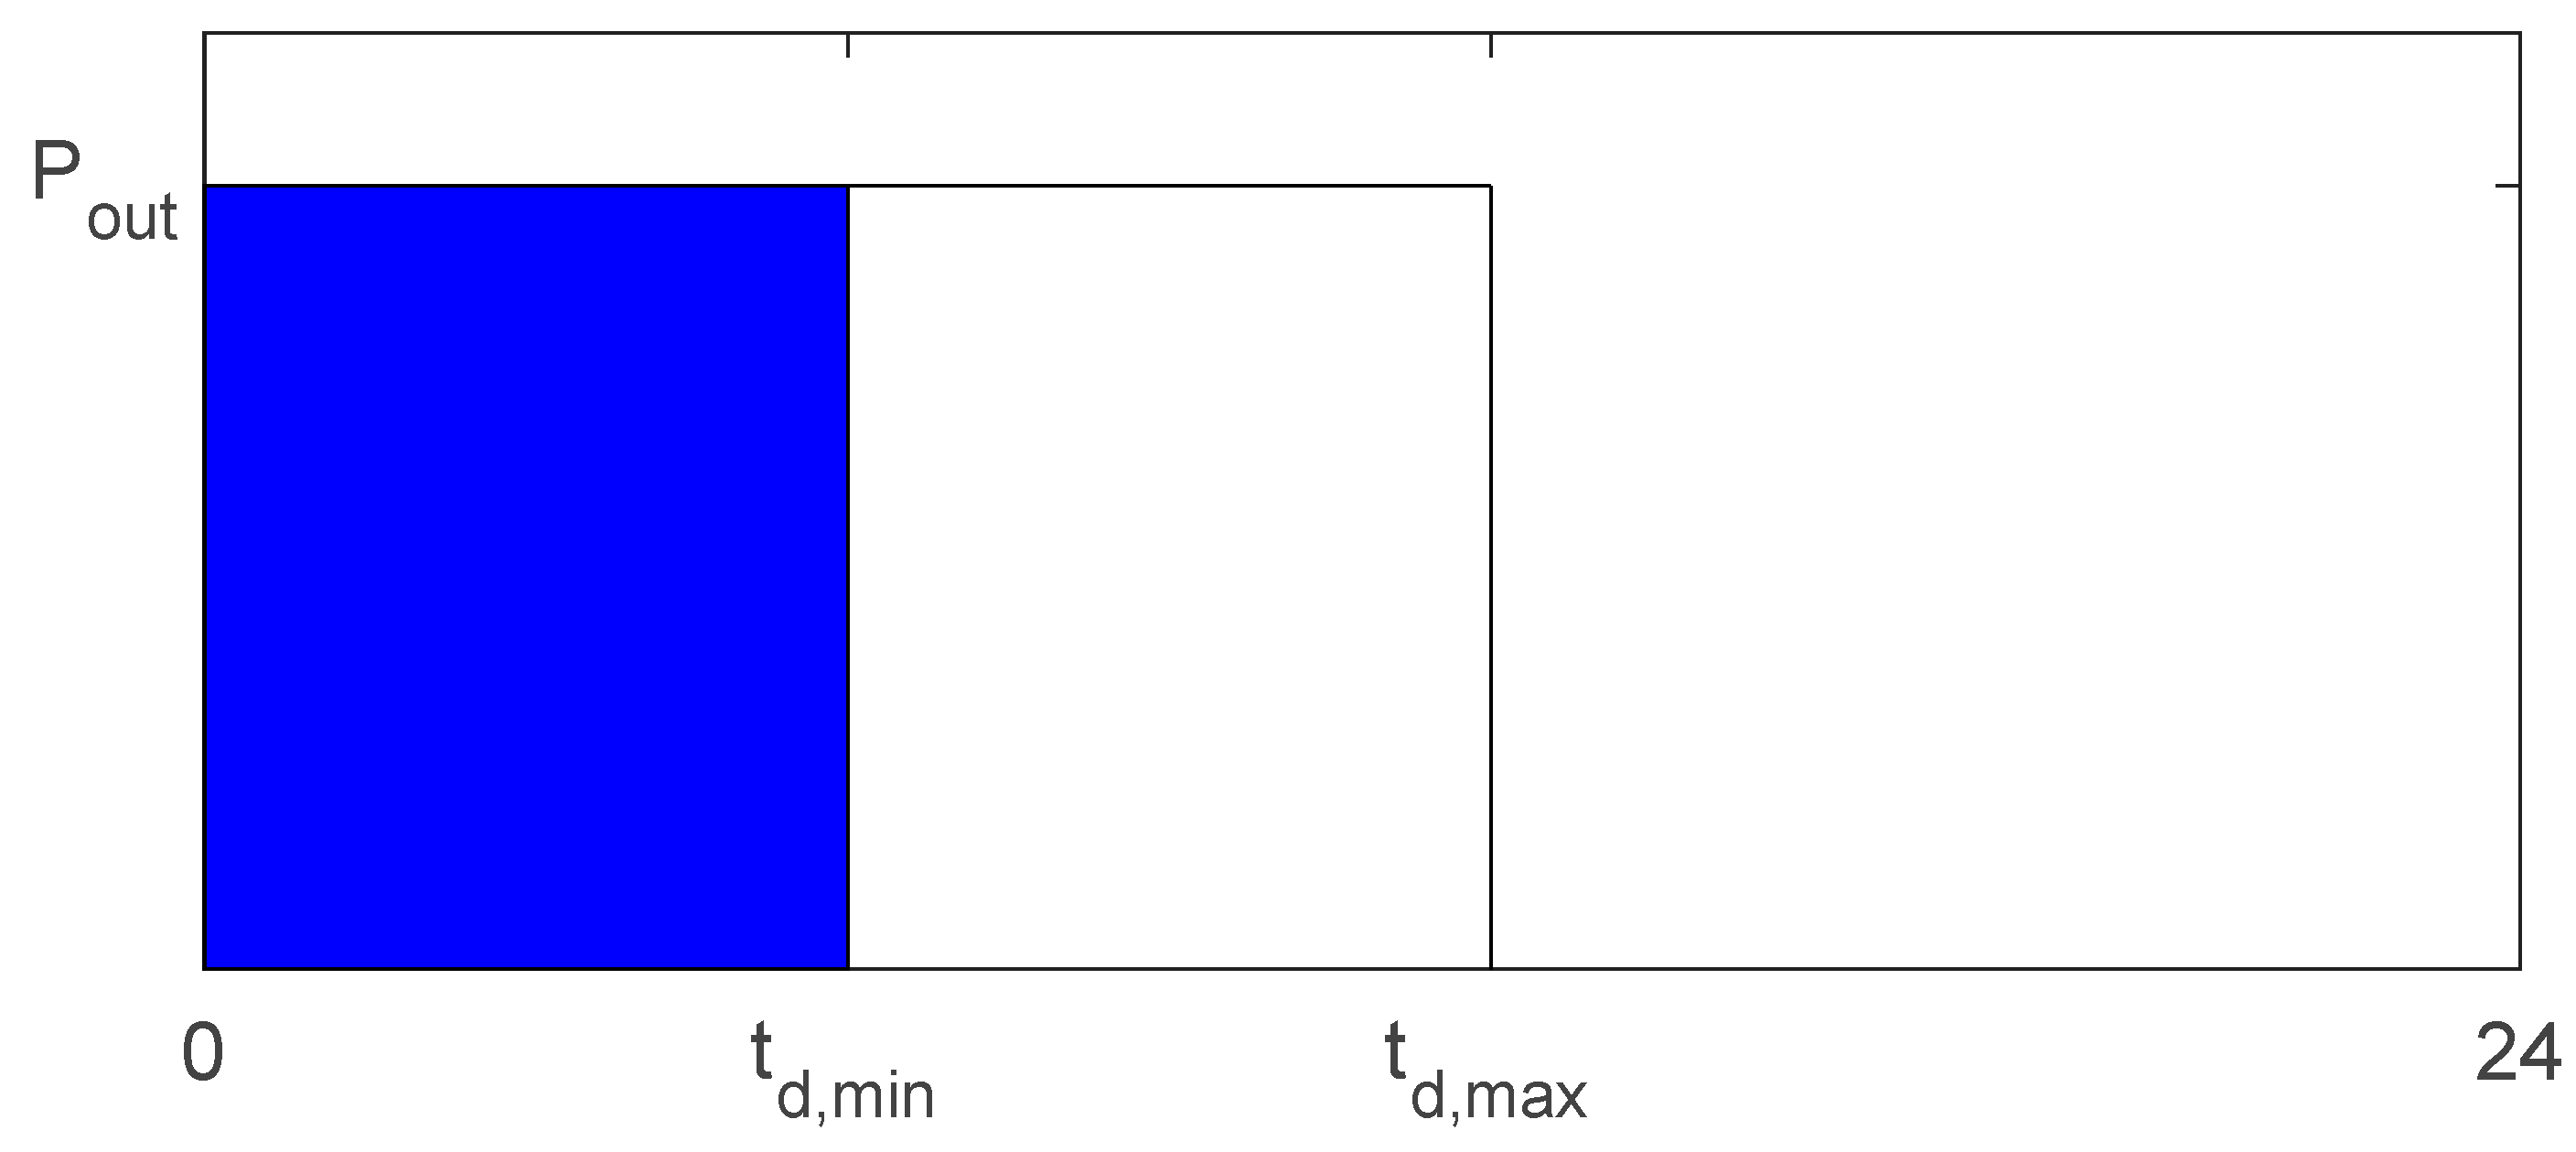
Figure 2 is useful to better explain the difference between the two discharge time parameters
and
here considered. The ancillary services of the H2-CAES plant considered in this study refer to the provision of a power generation profile, as the one represented in
Figure 2, given by a constant output power (
) for a certain discharge time of the CAES section (
). In order to best highlight the high flexibility of the H2-CAES, instead of considering only a fixed value of
, in the present study results are also shown by assuming that the power generation profile of the H2-CAES can vary between a minimum (
) and a maximum (
) discharge time. Given that, the fixed value of
occurs when
.
The H2-CAES performance was evaluated with the aim to optimize the self-consumption (SC) share of the PV energy generation. Therefore, for a given values of the design parameters, higher values of SC indicate a more performing system. Moreover, the performance of the H2-CAES plant is compared with that of the CH4-CAES plant, which is characterized by a yearly net electrical energy production of 52.5 GWh and a discharge time of 5 h.
The influence of each design parameter (
on the H2-CAES performance was assessed starting from the design parameters of the reference H2-CAES configuration, reported in
Table 2. In this configuration, the design parameters were calculated by assuming a yearly energy production (
) equal to that of the CH4-CAES plant and a minimum discharge time (
) equal to the average discharge time of the CH
$-CAES plant. For clarity, it is important to highlight a difference between the production profiles of the CH4-CAES and the H2-CAES plants: while in the CH4-CAES case the production profile remains the same throughout the year (
=5 h repeated
=52 times), in the H2-CAES case (when
) the production profile can vary during the year (with
and
=variable), but always with an annual production identical to that of the CH
4-CAES.
3.1. Influence of minimum and maximum discharge times
Figure 3 (a-b) show the influence of the minimum (
) and maximum (
) discharge time on the Self Consumption (SC) and on the energy output (
) of the H2-CAES plant. In
Figure 3 (b), the dashed line represents the energy production
of the CH4-CAES plant.
It is generally notable that different combinations of and are able to obtain SC values around 1, as well as values of equal to that of the CH4-CAES.
For a given , the lowest values of each curve represent the SC and the when . In these cases, the shape of the power profile of the H2-CAES is always the same, SCs are within the range 0.68-0.82 and . As increases, SC and increase up to a maximum of SC=1 and .
For a given , increasing results in a decrease of SC and of . This means that power profiles with longer minimum durations entail reduced shares of self-consumption and, consequently, energy production.
Results of this analysis allow to conclude that the H2-CAES design parameters can be chosen by fixing the most appropriate values of and , according to the service to be provided by the energy storage plant, also considering that small values of and implicate short and frequent discharges while high values of and entail less frequent but longer discharge phases.
3.2. Influence of PV system size and PEM electrolyzer size
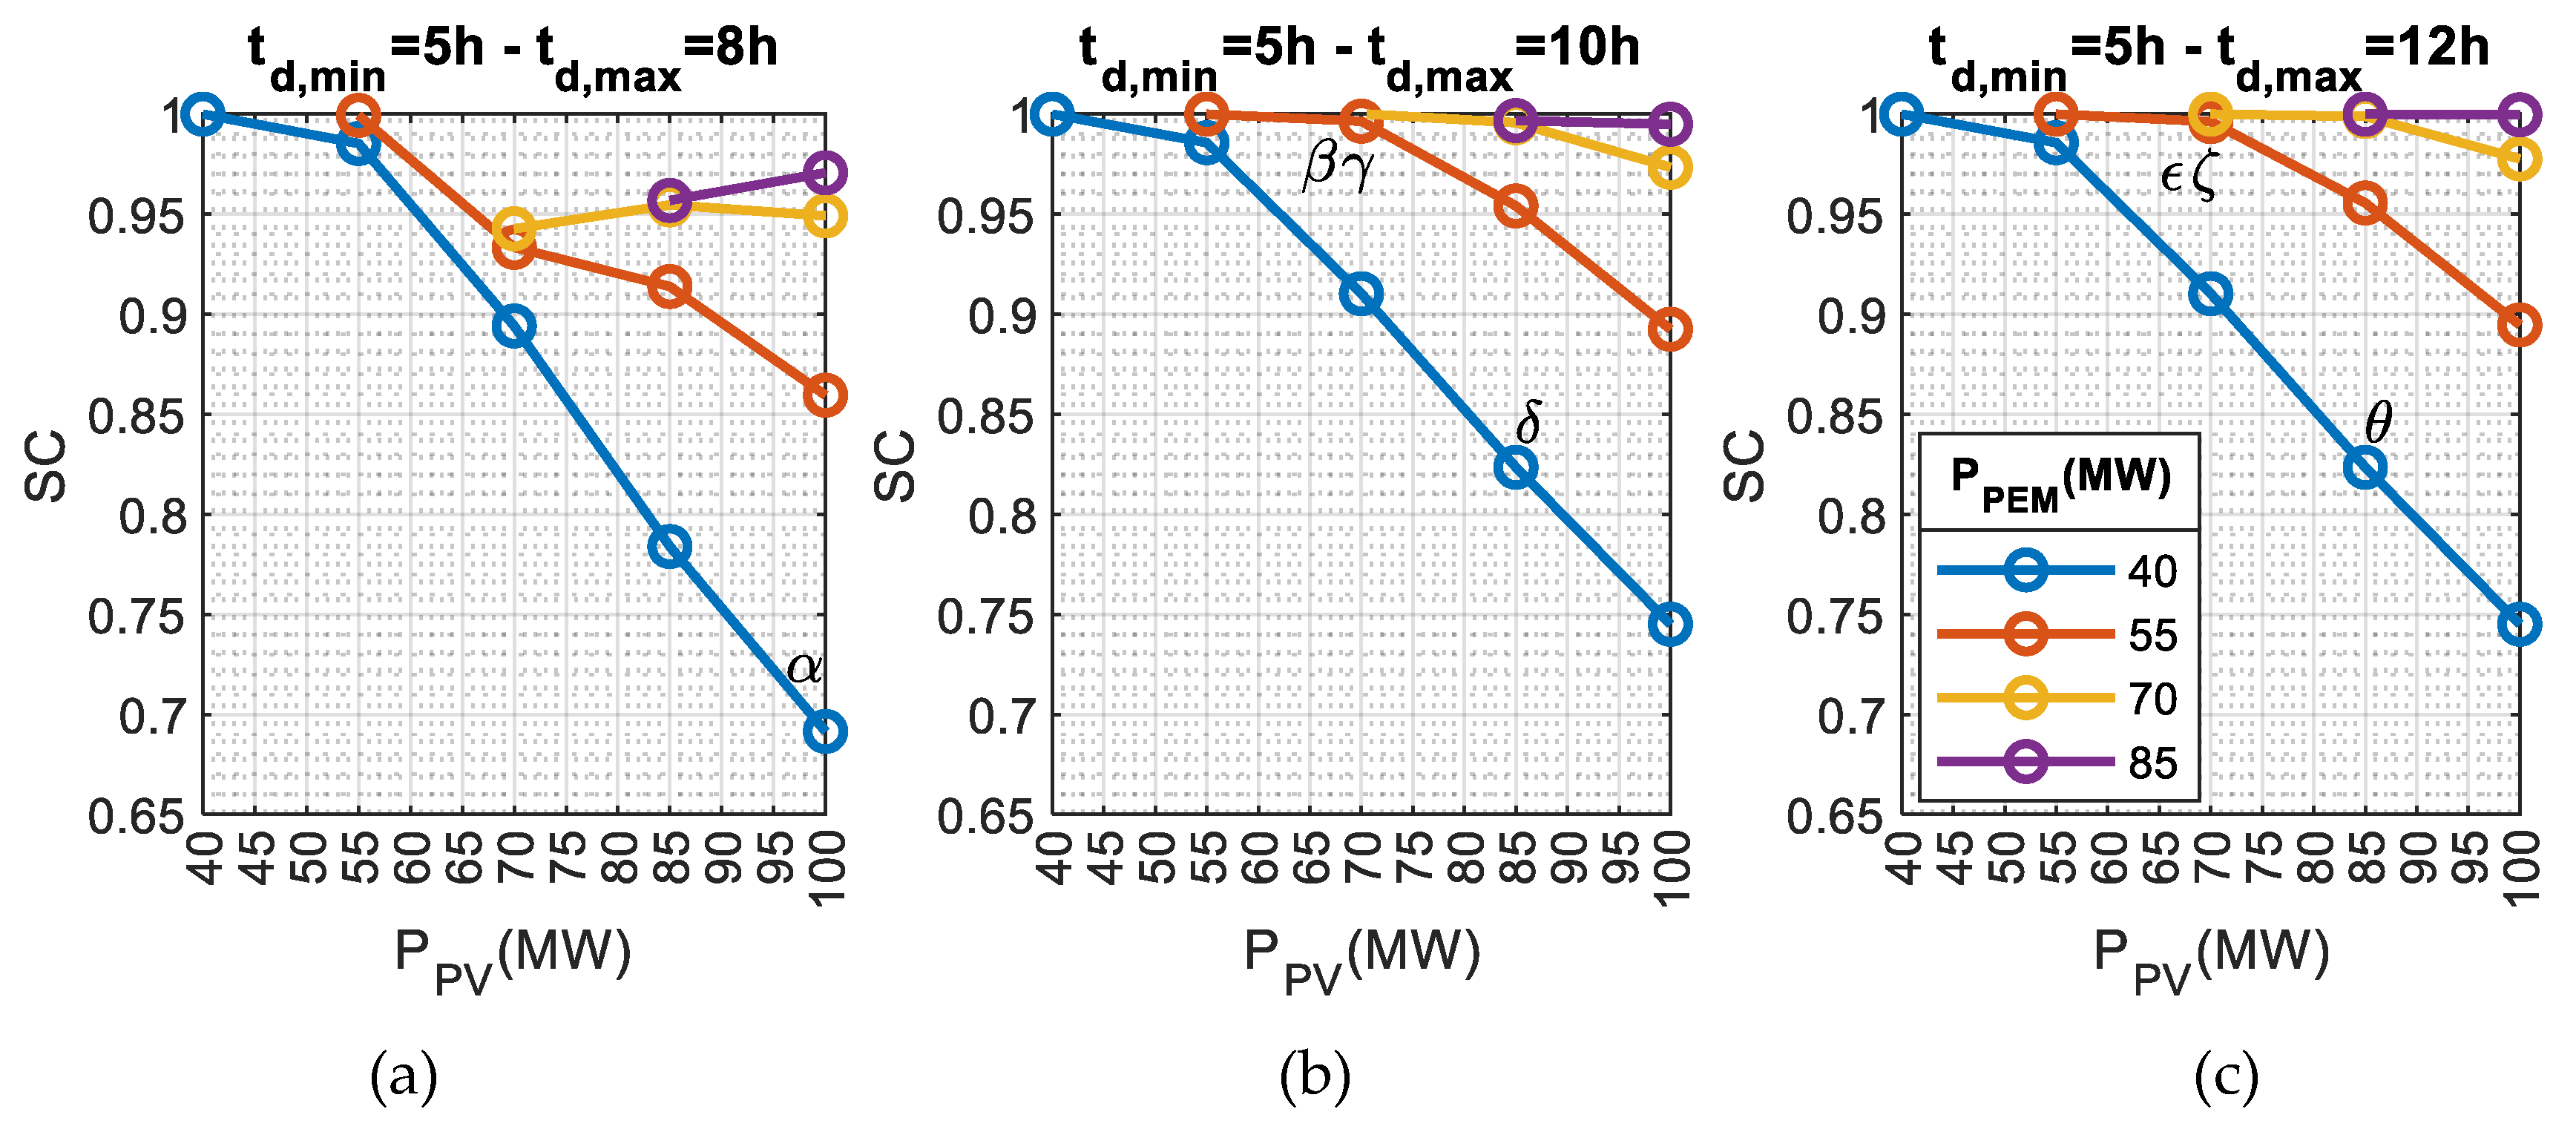
Figure 4(a-c) shows the SC of the H2-CAES plant as a function of
and
for
=5h and three different values of
: 8h (a), 10 h (b) and 12h (c). Obviously, results are shown for values of
. Similarly,
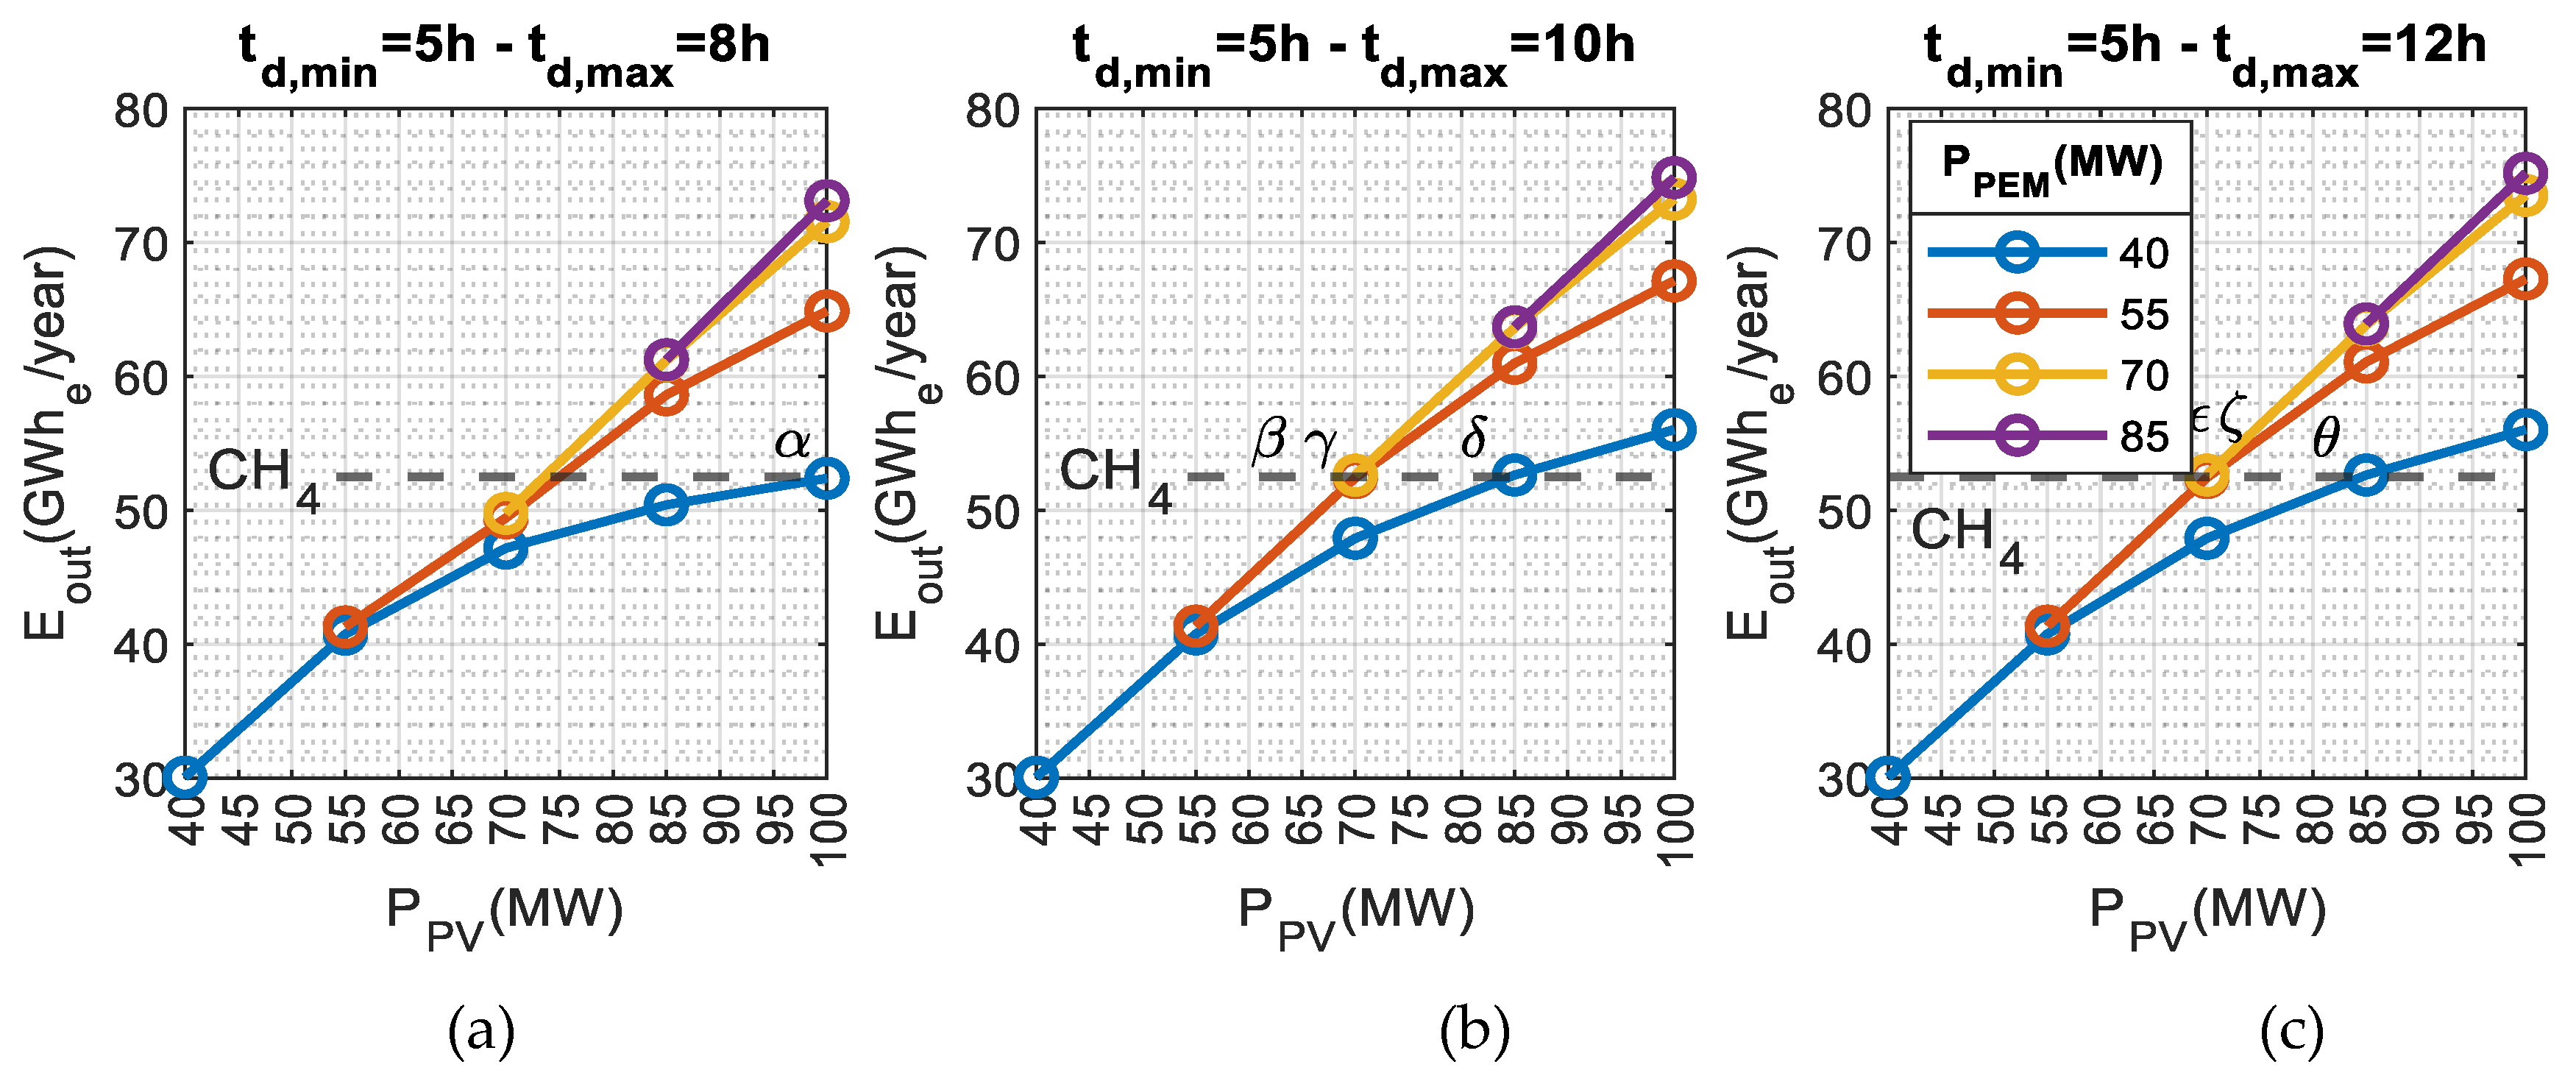
Figure 5(a-c) reports the energy production (
) of the same H2-CAES plants of the CH4-CAES plant.
Figure 4(a-c) demonstrates that several combinations of
,
and
allow to obtain very high values of SC, sometimes around 1. Moreover, it is generally notable that, for a given
, the increase of
results in a decrease of SC, despite the growth of
represented in
Figure 5(a-c). Apart from case (a), where the storage is clearly undersized for
values greater than 55 MW, for cases (b) and (c) it is noticeable that as
increases, SC decreases with a steeper slope for lower
values. This means that, for storages with an adequate capacity, the lower the PEM size, the worse the harnessing of energy from the PV system. The SC worsening is also reflected in the decrease of the rate of growth of
for lower values of
as
increases.
For a fixed value of , it is evident that highest SC rates can be obtained only for sizes above a certain value and that values of SC around 1 can be generally achieved for .
Considering the values of
and
of the reference H2-CAES configuration reported in
Table 2 (
= 70MW –
= 55MW), the comparison between (a-c) subfigures of
Figure 4 and
Figure 5 allows to observe that a storage capacity
=8h is not sufficient to reach a SC above 0.95 nor to match
and a storage capacity
=12h does not results is an increase of SC nor
with respect to
=10h.
Aiming to identify the minimum combination of the design parameters required to achieve the highest values of Self-Consumption (SC) under the previously reported assumptions (
=52.5 GWh,
= 5 h), it is interesting to note that
=52.5 GWh can be obtained for the different combinations of
,
and
reported in
Table 3 together with the SC share.
Configurations ε, ζ and ϑ are characterized by the same and values of the configurations β, γ and δ, respectively. However, configurations β, γ and δ exhibit higher values of without any improvement in SC. In fact, = ; = and = . Moreover, β and γ configurations achieve substantially the same SC ( obtained, for the configuration γ, with a lower value (). When comparing configurations α, γ and δ, it becomes evident that configurations α and δ employ a smaller PEM electrolyzer (), at the cost of a considerably larger PV plant. This results in lower SCs, which in turn implies less flexibility on the supply side (since surplus energy should be fed into the grid). Therefore, configuration γ is the solution that achieves the highest values of energy self-consumption (SC) for =52.5 GWh and = 5 h.
3.3. Influence of PV system size and PEM electrolyzer size on monthly and system start-ups
Since the power output
is constant, the yearly energy production
directly depends on the yearly discharge time, that is on the average discharge time
and the number of turboexpander start-ups. The influence of
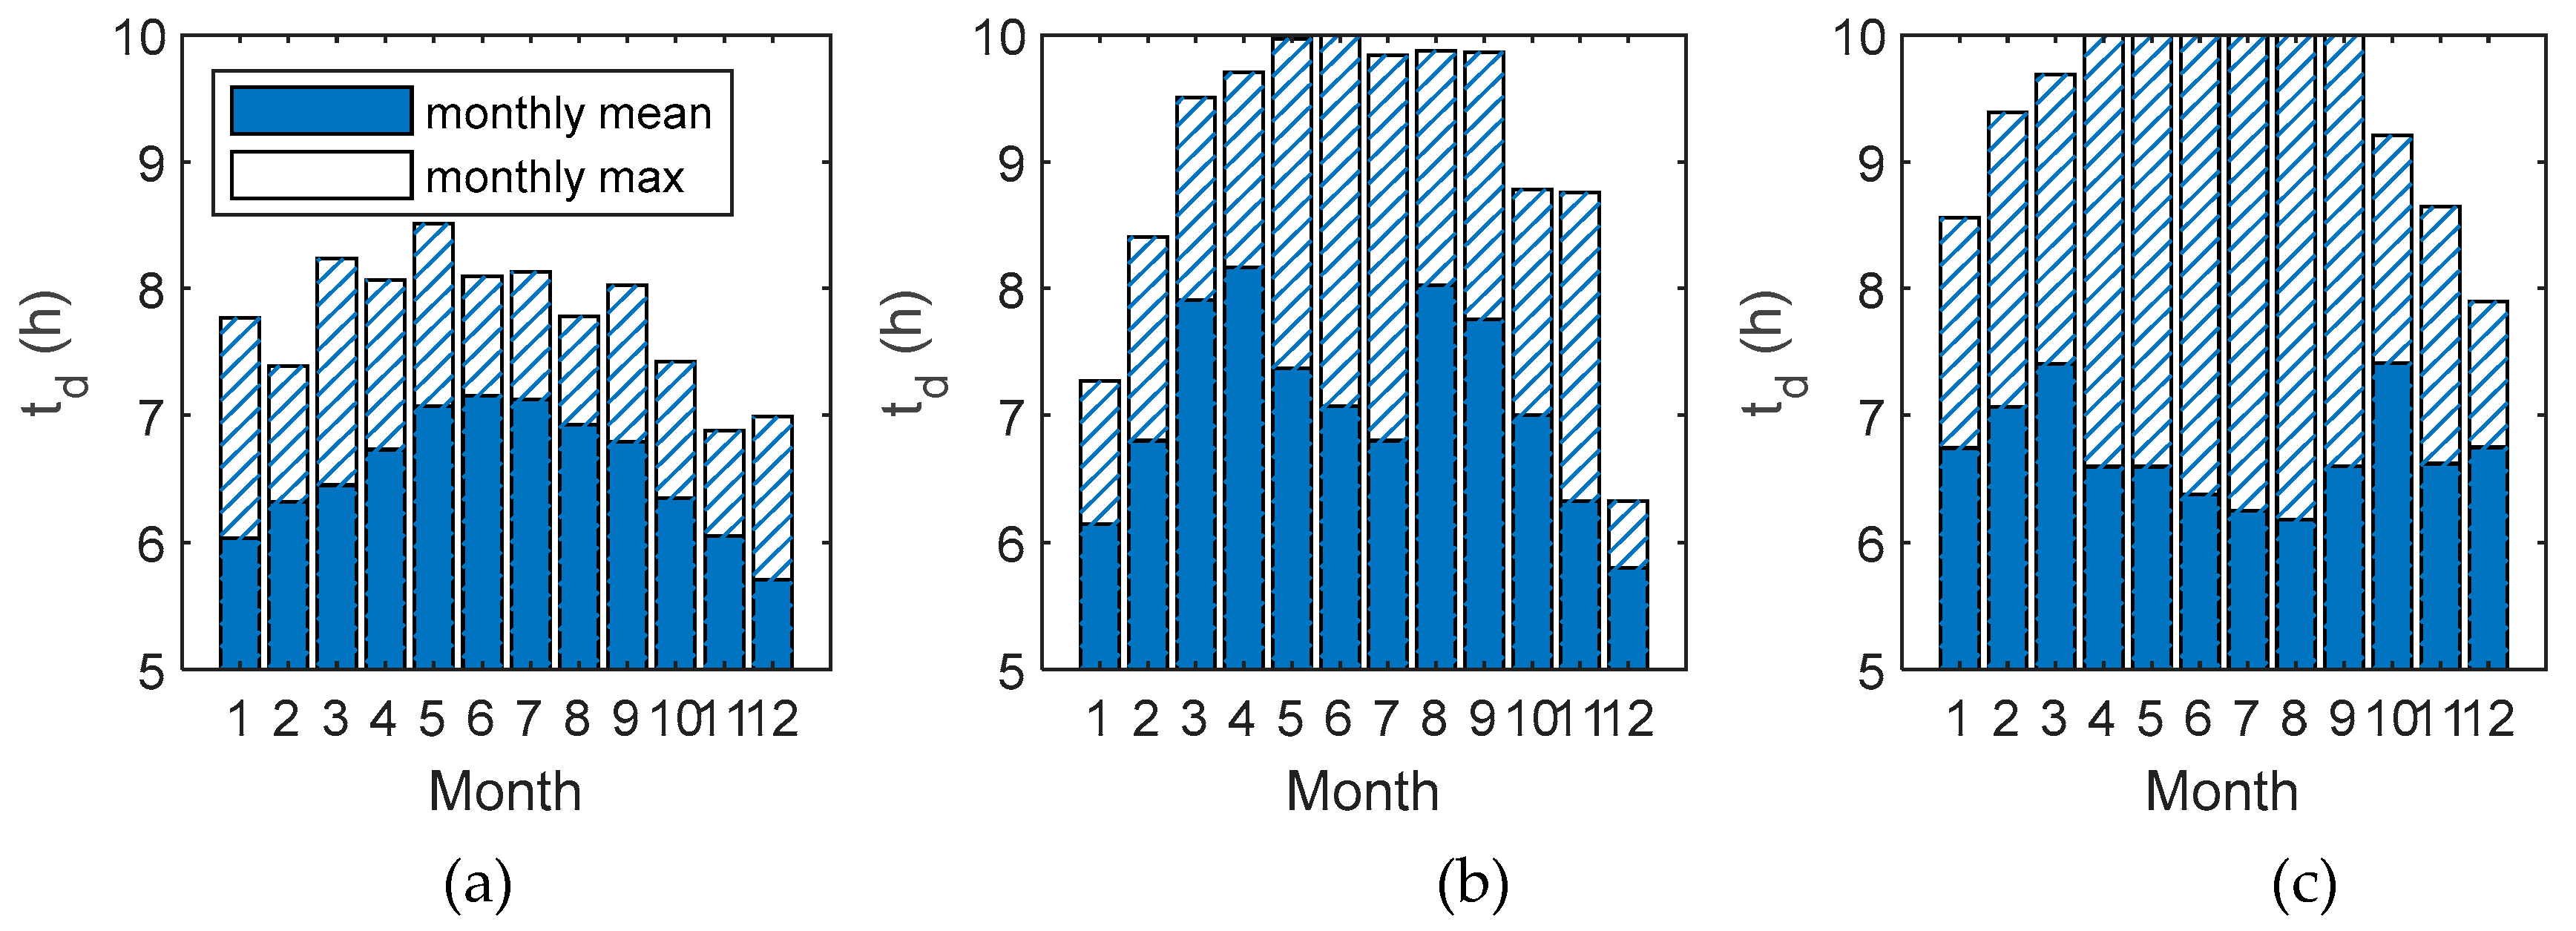
on the average monthly discharge time
is reported in
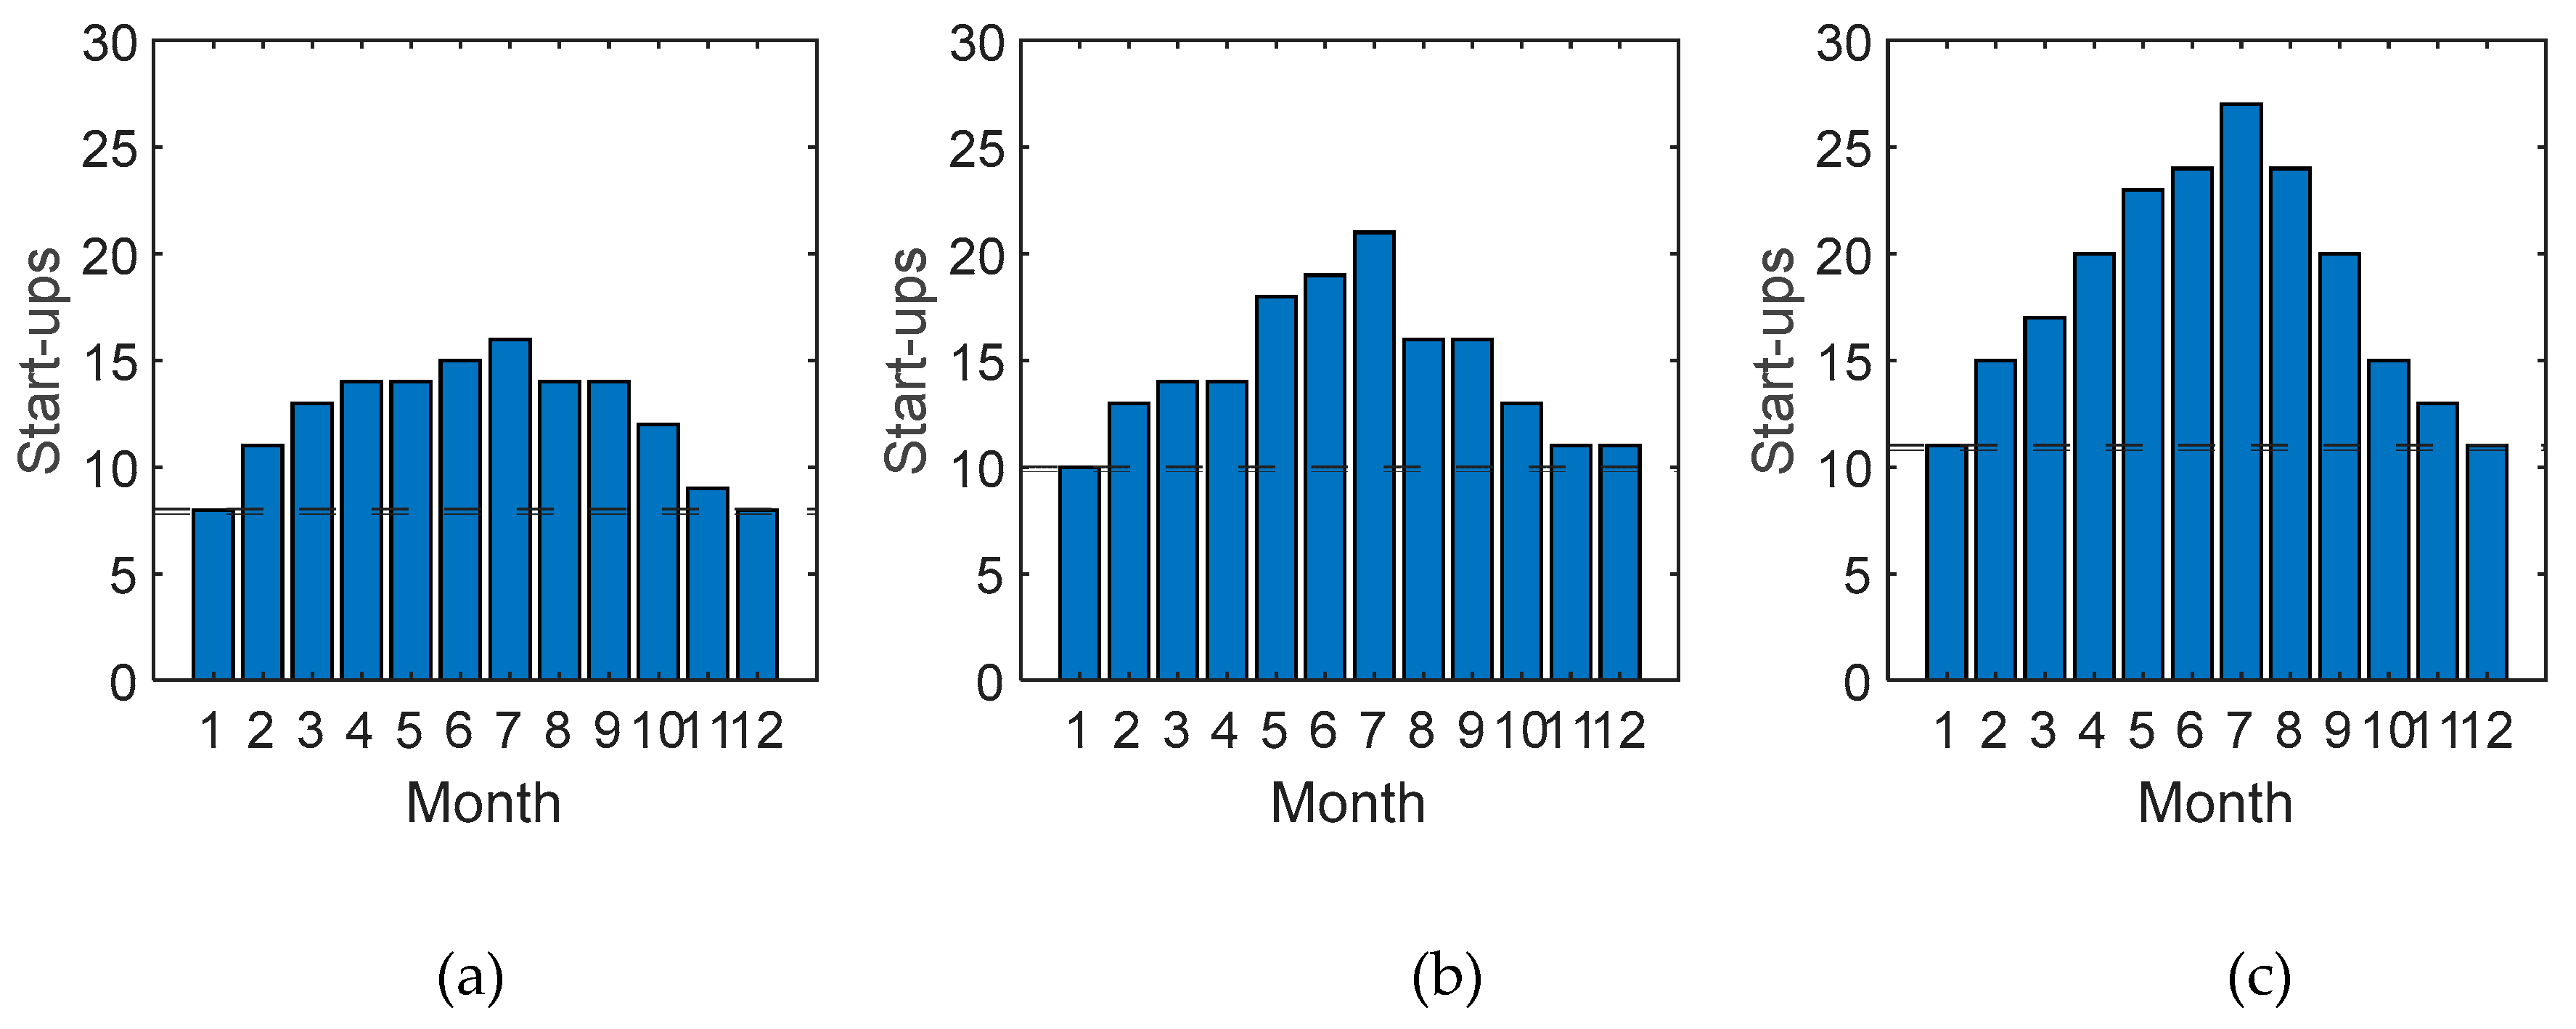
Figure 6(a-c) and the monthly number of start-ups is reported in
Figure 7(a-c). The cases of
Figure 6 and
Figure 7 are representative of a parameter configuration of
=55 MW(a),
=70 MW(b), and
=85 MW(c),
=10 h(a-c),
=5 h(a-c) and
=55 MW(a-c). As the PV size increases, a greater amount of energy can be stored. As a result, even if the monthly average discharge time
does not show a significant increase, the monthly maximum
and the number of start-ups of the turboexpander increase, resulting in the greater energy production shown in
Figure 5. It is interesting to notice that the average
is greater than
: therefore, these configurations of the H2-CAES plant are averagely able to provide a longer power generation profile with respect to the CH4-CAES one.
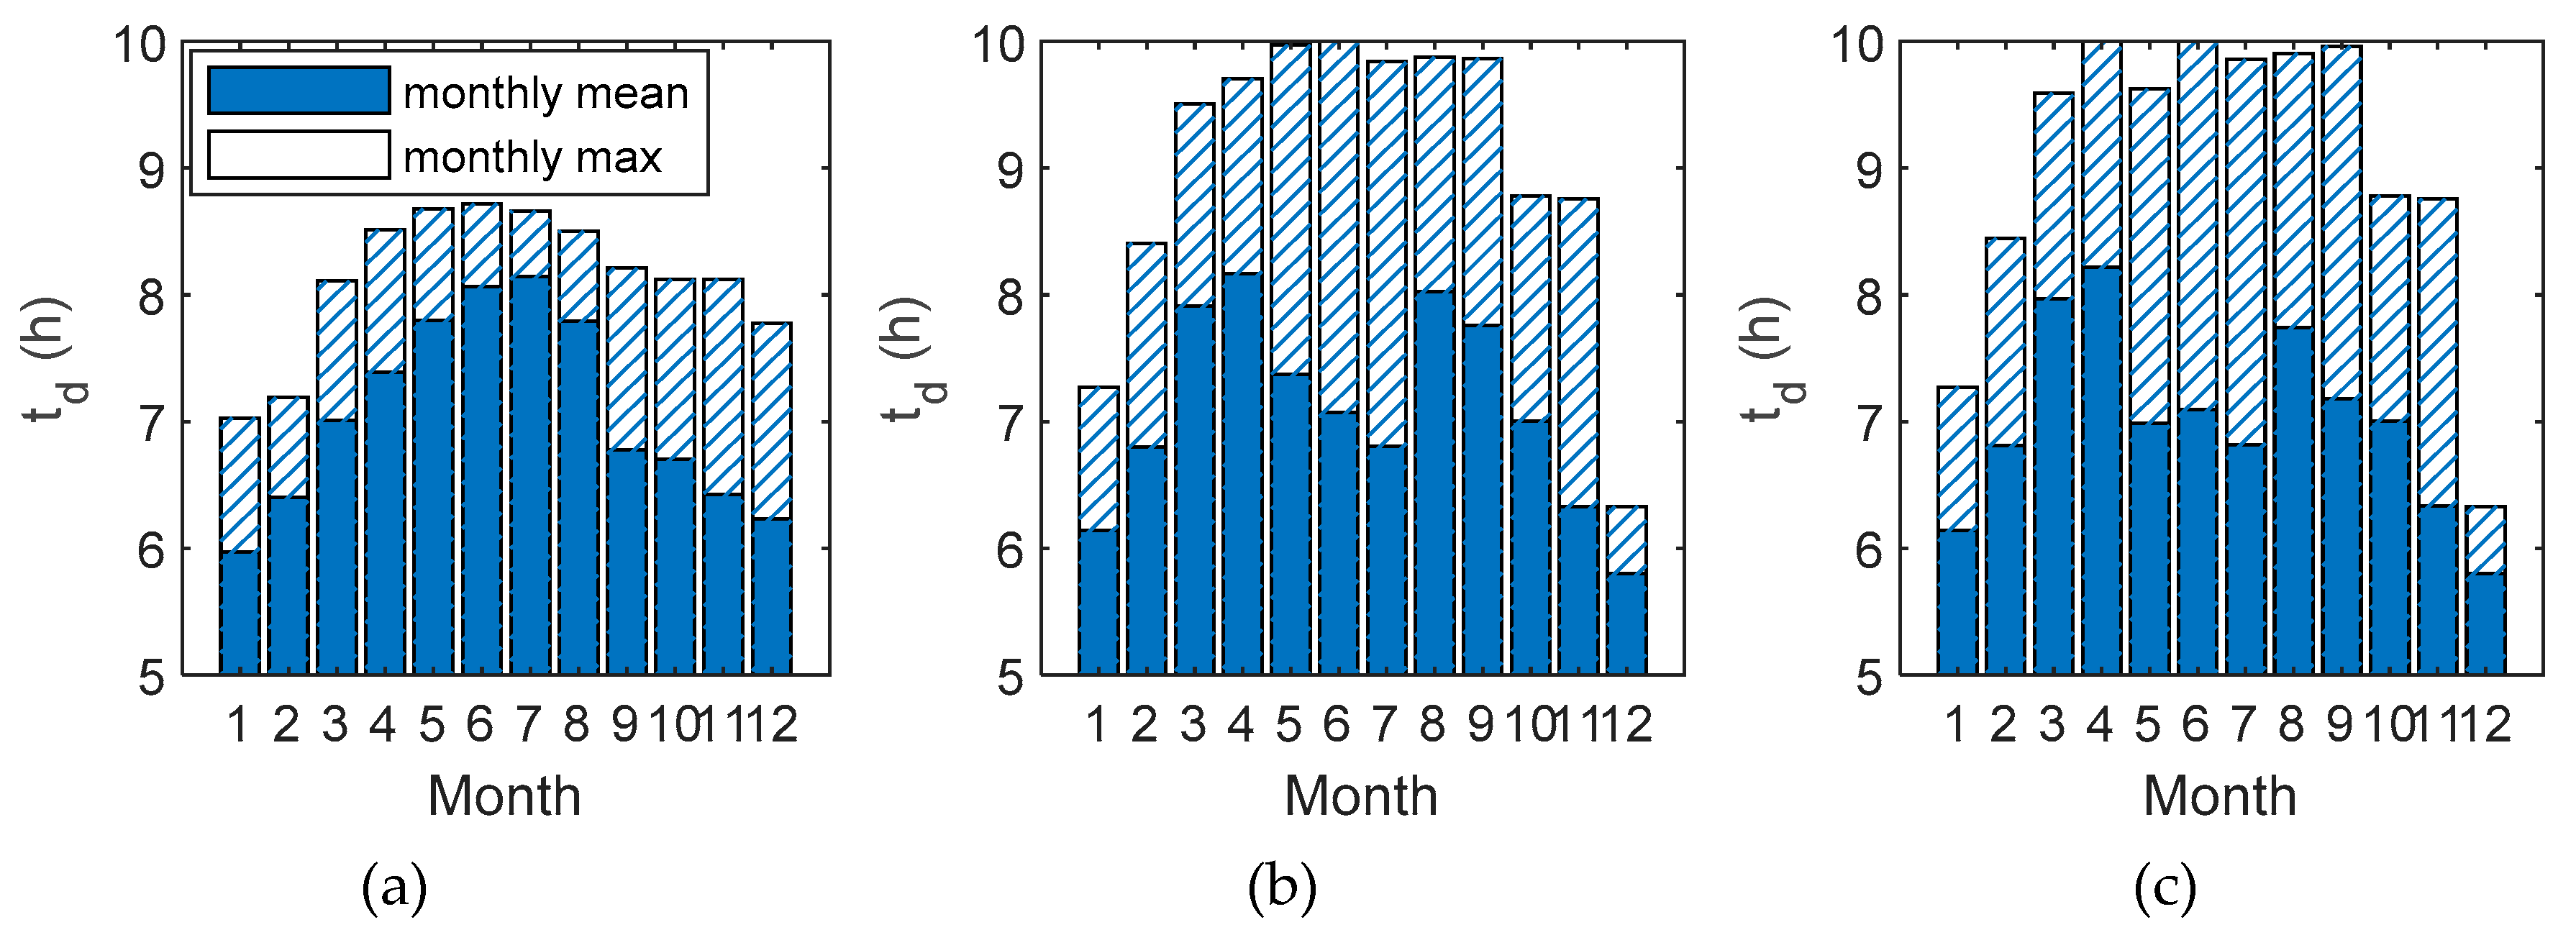
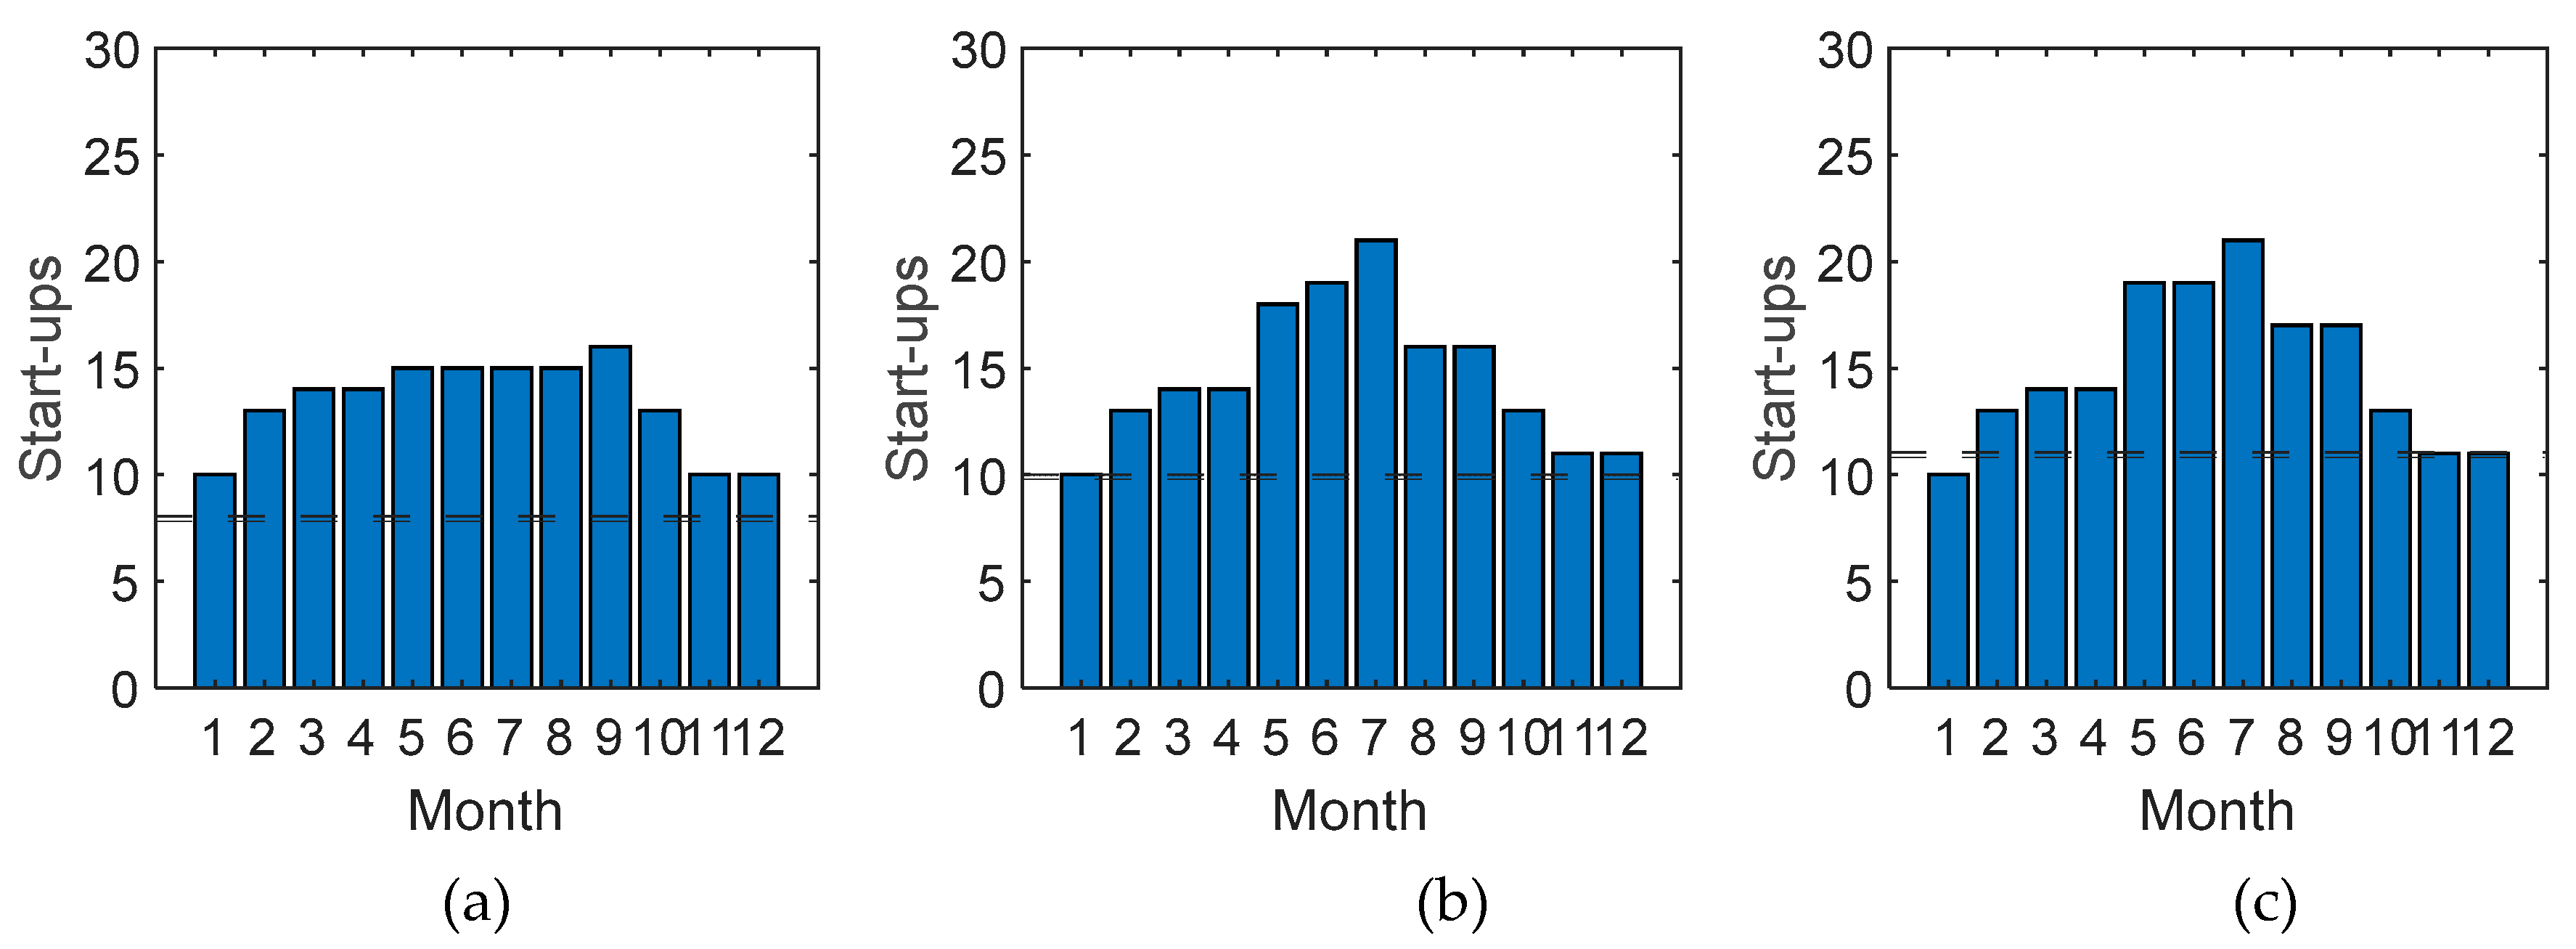
The influence of the PEM electrolyzer size on the average monthly discharge time and on the monthly number of start-ups was analyzed by fixing the maximum discharge time to =10 h, the minimum discharge time to =5 h and the nominal power of the PV plant =70 MW.
Figure 8(a-c) and
Figure 9(a-c) show the monthly average and maximum discharge time and the number of start-ups of the turboexpander per month, for
=40 MW,
=55 MW, and
=70 MW.
Increasing , it becomes evident that the number of start-ups rises, particularly during the summer months. Moreover, this affects the maximum discharge time, which increases as well. However, it is important to notice that the average per month, which is always greater than 5 h, does not increase significantly with the PEM nominal power. This behavior results in a general increase in the energy production of the H2-CAES, until the PEM reaches 55 MW.
3.4. Comparative results between CH4-CAES and H2-CAES
Table 4 illustrates the results of the comparison carried out between the CH4-CAES plant and the three H2-CAES configurations γ, δ and α of
Table 4, able to match the CH4-CAES energy output (
). Results are shown in terms of electric energy production during the discharge phase, energy consumption during the charge phase (air compression and hydrogen production), fuel consumption (hydrogen or natural gas), carbon dioxide emissions during operation and other energy performance indicators.
The compression train consumption (
) is the same for all cases, but the green hydrogen production system of the H2-CAES requires around 110 GWh/year of electricity from the PV plant (
), for all three H2-CAES configurations. Almost 100% of
is consumed by the PEM electrolyzer for the γ H2-CAES configuration, which produces on site 1,874 tons of hydrogen per year. The hydrogen production of the other δ and α configurations is almost the same. The natural gas consumption of the CH4-CAES plant is 2.4 times higher (4,538 t/year), due to the lower LHV. With reference to carbon dioxide emissions, calculated as suggested by Egware et al. [
38], the H2-CAES (γ, δ, α) avoid emitting 34,125 tons of CO2 per year. For the three H2-CAES configurations, the PEM to compressor energy ratio shows that the energy consumption of the PEM is 2.65 times higher than the energy consumption of the compressor train. The output to input electricity ratio, that is the ratio of the
and the sum of the electrical energy required by the compressor and the PEM, equals about 0.35, meaning that the H2-CAES plant is able to shift towards the night hours around 35% of the electricity it consumes.
4. Conclusions
In this study, a CO2-free diabatic Compressed Air Energy Storage (CAES) plant was proposed and analysed. The plant originates from the McIntosh diabatic CAES plant, downscaled by a factor of 2.62, where the natural gas required for combustion is replaced by green hydrogen, produced on site by a PEM electrolyzer powered by a PV plant. The H2-CAES compressor train is connected to the grid, while the hydrogen production system operation depends on the PV power profile. The plant’s components and its performances were analysed based on a yearly simulation, in order to maximize the self-consumption share of the PV energy production for the same energy production of the CH4-CAES plant. The components of the hydrogen production system were sized according to the maximum and minimum discharge times, and the influences of the size of the PV plant and the PEM electrolyzer were analysed in detail.
The H2-CAES configuration that minimizes the size of the hydrogen production system requires a 70 MW PV plant coupled to a 55 MW PEM electrolyzer, resulting in a minimum and maximum discharge times of 5 h and 10 h respectively. The comparison of the H2-CAES plant to the CH4-CAES plant demonstrates that the proposed configuration can match the performances of the conventional plant with no CO2 emissions, shifting about 35% of the electrical energy used during the charge phase by the air compressor train and by the PEM electrolyzer, towards the nighttime and utilizing about 100% of the available PV energy. Moreover, the study demonstrated how different configurations allow to provide diverse services to the grid, increasing the flexibility of the plant.
Funding
This paper forms part of a research project cofounded: under the National Recovery and Resilience Plan (NRRP), Mission 4 Component 2 Investment 1.3 - Call for tender No. 1561 of 11.10.2022 of Ministero dell’Università e della Ricerca (MUR); funded by the European Union – NextGenerationEU. Project code PE0000021, Concession Decree No. 1561 of 11.10.2022 adopted by Ministero dell’Università e della Ricerca (MUR), CUP F53C22000770007, according to attachment E of Decree No. 1561/2022, Project title “Network 4 Energy Sustainable Transition – NEST” and under the project entitled “Advanced Energy Storage Systems for Sustainable Communities”, funded by the University of Cagliari with financial support from Fondazione di Sardegna, Year 2019 (CUP F72F20000340007).
Conflicts of Interest
The authors declare no conflict of interest. The funders had no role in the design of the study; in the collection, analyses, or interpretation of data; in the writing of the manuscript; or in the decision to publish the results.
References
- Cevik, S. Climate Change and Energy Security: The Dilemma or Opportunity of the Century? IMF Working Papers. 2022, (2022). [CrossRef]
- REPowerEU: affordable, secure and sustainable energy for Europe. Available online: https://commission.europa.eu/strategy-and-policy/priorities-2019-2024/european-green-deal/repowereu-affordable-secure-and-sustainable-energy-europe_en.
- Global Energy Review 2021 – Analysis - IEA. Available online: https://www.iea.org/reports/global-energy-review-2021.
- International Renewable Energy Agency: Renewable energy statistics 2023. Available online: https://www.irena.org/Publications/2023/Jul/Renewable-energy-statistics-2023.
- International Energy Agency, I.: Renewable Energy Market Update - June 2023. (2023).
- O’Shaughnessy, E., Cruce, J.R., Xu, K.: Too much of a good thing? Global trends in the curtailment of solar PV. Solar Energy. 208, 1068–1077 (2020). [CrossRef]
- International Energy Agency: World Energy Outlook 2022. (2022).
- Jin, X. , Wu, Q., Jia, H.: Local flexibility markets: Literature review on concepts, models and clearing methods. Appl Energy. 261, 114387 (2020). [CrossRef]
- Gržanić, M. , Capuder, T.: Collaboration model between Distribution System Operator and flexible prosumers based on a unique dynamic price for electricity and flexibility. Appl Energy. 350, 121735 (2023). [CrossRef]
- Huang, S. , Wu, Q., Cheng, L., Liu, Z.: Optimal Reconfiguration-Based Dynamic Tariff for Congestion Management and Line Loss Reduction in Distribution Networks. IEEE Trans Smart Grid. 7, 1295–1303 (2016). [CrossRef]
- Li, R. , Wu, Q., Oren, S.S.: Distribution locational marginal pricing for optimal electric vehicle charging management. IEEE Transactions on Power Systems. 29, 203–211 (2014). [CrossRef]
- Tamang, S., Park, H.: An investigation on the thermal emission of hydrogen enrichment fuel in a gas turbine combustor. Int J Hydrogen Energy. (2023). [CrossRef]
- International Energy Agency (IEA): Gas - IEA. Available online: https://www.iea.org/energy-system/fossil-fuels/natural-gas.
- Park, S. , Choi, G.M., Tanahashi, M.: Combustion characteristics of syngas on scaled gas turbine combustor in pressurized condition: Pressure, H2/CO ratio, and N2 dilution of fuel. Fuel Processing Technology. 175, 104–112 (2018). [CrossRef]
- Wang, Q. , Hu, L., Yoon, S.H., Lu, S., Delichatsios, M., Chung, S.H.: Blow-out limits of nonpremixed turbulent jet flames in a cross flow at atmospheric and sub-atmospheric pressures. Combust Flame. 162, 3562–3568 (2015). [CrossRef]
- Koç, Y. , Yağlı, H., Görgülü, A., Koç, A.: Analysing the performance, fuel cost and emission parameters of the 50 MW simple and recuperative gas turbine cycles using natural gas and hydrogen as fuel. Int J Hydrogen Energy. 45, 22138–22147 (2020). [CrossRef]
- Skabelund, B.B. , Jenkins, C.D., Stechel, E.B., Milcarek, R.J.: Thermodynamic and emission analysis of a hydrogen/methane fueled gas turbine. Energy Conversion and Management: X. 19, (2023). [CrossRef]
- Banihabib, R., Lingstädt, T., Wersland, M., Kutne, P., Assadi, M.: Development and testing of a 100 kW fuel-flexible micro gas turbine running on 100% hydrogen. Int J Hydrogen Energy. (2023). [CrossRef]
- Kousksou, T. , Bruel, P., Jamil, A., El Rhafiki, T., Zeraouli, Y.: Energy storage: Applications and challenges. Solar Energy Materials and Solar Cells. 120, 59–80 (2014). [CrossRef]
- Budt, M. , Wolf, D., Span, R., Yan, J.: A review on compressed air energy storage: Basic principles, past milestones and recent developments. Appl Energy. 170, 250–268 (2016). [CrossRef]
- Zhao, P. , Xu, W., Liu, A., Wu, W., Wang, J., Wang, X.: Assessment the hydrogen-electric coupled energy storage system based on hydrogen-fueled CAES and power-to-gas-to-power device considering multiple time-scale effect and actual operation constraints. Int J Hydrogen Energy. 48, 9198–9218 (2023). [CrossRef]
- Alirahmi, S.M. , Razmi, A.R., Arabkoohsar, A.: Comprehensive assessment and multi-objective optimization of a green concept based on a combination of hydrogen and compressed air energy storage (CAES) systems. Renewable and Sustainable Energy Reviews. 142, 110850 (2021). [CrossRef]
- Bazdar, E. , Nasiri, F., Haghighat, F.: An improved energy management operation strategy for integrating adiabatic compressed air energy storage with renewables in decentralized applications. Energy Convers Manag. 286, 117027 (2023). [CrossRef]
- Grazzini, G. , Milazzo, A.: Thermodynamic analysis of CAES/TES systems for renewable energy plants. Renew Energy. 33, 1998–2006 (2008). [CrossRef]
- Jannelli, E. , Minutillo, M., Lubrano Lavadera, A., Falcucci, G.: A small-scale CAES (compressed air energy storage) system for stand-alone renewable energy power plant for a radio base station: A sizing-design methodology. Energy. 78, 313–322 (2014). [CrossRef]
- Llamas, B. , Laín, C., Castañeda, M.C., Pous, J.: Mini-CAES as a reliable and novel approach to storing renewable energy in salt domes. Energy. 144, 482–489 (2018). [CrossRef]
- Zhang, Y. , Davis, D., Brear, M.J.: The role of hydrogen in decarbonizing a coupled energy system. J Clean Prod. 346, 131082 (2022). [CrossRef]
- The Role of Low-Carbon Fuels in the Clean Energy Transitions of the Power Sector. The Role of Low-Carbon Fuels in the Clean Energy Transitions of the Power Sector. (2021). [CrossRef]
- Nakhamkin, M. , Andersson, L., Swensen, E., Howard, J., Meyer, R., Schainker, R., Pollak, R., Mehta, B.: Aec 110 mw caes plant: Status of project. J Eng Gas Turbine Power. 114, (1992). [CrossRef]
- Crotogino, F.: Huntorf CAES: More than 20 Years of Successful Operation. (2001).
- Energy Communities Repository - Homepage. Available online: https://energy-communities-repository.ec.europa.eu/index_en.
- The MathWorks Inc. (2023): MATLAB Version: (R2023a) Update 3. Available online: https://www.mathworks.com.
- Casey, M. , Robinson, C.: A Method to Estimate the Performance Map of a Centrifugal Compressor Stage. J Turbomach. 135, (2012). [CrossRef]
- Duffie, J.A. , Beckman, W.A., Worek, W.M.: Solar Engineering of Thermal Processes, 2nd ed. J Sol Energy Eng. 116, (1994). [CrossRef]
- Meteonorm: Meteonorm Features.
- Zhao, L. , Brouwer, J., Samuelsen, S.: Dynamic Analysis of a Self-Sustainable Renewable Hydrogen Fueling Station. ASME 2014 12th International Conference on Fuel Cell Science, Engineering and Technology, FUELCELL 2014 Collocated with the ASME 2014 8th International Conference on Energy Sustainability. (2014). [CrossRef]
- EUR-Lex - 32012L0027 - EN - EUR-Lex. Available online: https://eur-lex.europa.eu/eli/dir/2012/27/oj.
- Egware, H.O. , Kwasi-Effah, C.C.: A novel empirical model for predicting the carbon dioxide emission of a gas turbine power plant. Heliyon. 9, e14645 (2023). [CrossRef]
Figure 1.
Scheme of the proposed H2-CAES system.
Figure 1.
Scheme of the proposed H2-CAES system.
Figure 2.
Power output profile of the H2-CAES plant.
Figure 2.
Power output profile of the H2-CAES plant.
Figure 3.
(a) as a function of for different values of (=70 MW and =55MW); (b) as a function of for different values of (=70 MW and =55MW).
Figure 3.
(a) as a function of for different values of (=70 MW and =55MW); (b) as a function of for different values of (=70 MW and =55MW).
Figure 4.
SC as a function of and for =5h and =8h (a), =10 h(b) and =12h (c).
Figure 4.
SC as a function of and for =5h and =8h (a), =10 h(b) and =12h (c).
Figure 5.
as a function of and for =5h and =8h (a), =10 h(b) and =12h (c).
Figure 5.
as a function of and for =5h and =8h (a), =10 h(b) and =12h (c).
Figure 6.
Mean and maximum discharge time per month for =10 h, =5 h, =55 MW and a) =55 MW, b) =70 MW and c) =85 MW.
Figure 6.
Mean and maximum discharge time per month for =10 h, =5 h, =55 MW and a) =55 MW, b) =70 MW and c) =85 MW.
Figure 7.
Number of turbine start-ups per month for =10 h, =5 h, =55 MW and a) =55 MW, b) =70 MW and c) =85 MW.
Figure 7.
Number of turbine start-ups per month for =10 h, =5 h, =55 MW and a) =55 MW, b) =70 MW and c) =85 MW.
Figure 8.
Mean and maximum discharge time per month for =10 h, =5 h, =70 MW and a) =40 MW, b) =55 MW and c) =70 MW.
Figure 8.
Mean and maximum discharge time per month for =10 h, =5 h, =70 MW and a) =40 MW, b) =55 MW and c) =70 MW.
Figure 9.
Number of turbine start-ups per month for =10 h, =5 h, =70 MW and a) =40 MW, b) =55 MW and c) =70 MW.
Figure 9.
Number of turbine start-ups per month for =10 h, =5 h, =70 MW and a) =40 MW, b) =55 MW and c) =70 MW.
Table 1.
Original and downscaled McIntosh plant parameters.
Table 1.
Original and downscaled McIntosh plant parameters.
| Parameter |
Original |
Downscaled
“CH4-CAES” |
| Turboexpander power (MW) |
110 |
42 |
| Compressor power (MW) |
53 |
21 |
| Minimum cavern pressure (bar) |
46 |
46 |
| Maximum cavern pressure (bar) |
75 |
75 |
| HP turbine inlet temperature (°C) |
538 |
538 |
| HP turbine inlet pressure (bar) |
42 |
42 |
| LP turbine inlet temperature (°C) |
871 |
871 |
| LP turbine inlet pressure (bar) |
15 |
15 |
| Weekly discharge time |
24 |
24 |
| Average daily discharge time |
5 |
5 |
| Weekly discharge time |
40 |
40 |
| Energy output (MWh) |
2,640 |
1,008 |
| Compressor consumption (MWh) |
2,120 |
840 |
Table 2.
Design parameters of the reference H2-CAES plant configuration.
Table 2.
Design parameters of the reference H2-CAES plant configuration.
| Parameter |
Value |
| Minimum discharge time () (h) |
5 |
| Maximum discharge time () (h) |
10 |
| Photovoltaic system nominal power () (MW) |
70 |
| PEM electrolyzer nominal power () (MW) |
55 |
Table 3.
Different combinations of , , and SC for =52.5 GWh.
Table 3.
Different combinations of , , and SC for =52.5 GWh.
| Combination |
(MW) |
(MW) |
(h) |
SC |
| α |
100 |
40 |
8 |
0.69 |
| β |
70 |
70 |
10 |
1.00 |
| γ |
70 |
55 |
10 |
0.99 |
| δ |
85 |
40 |
10 |
0.82 |
| ε |
70 |
70 |
12 |
1.00 |
| ζ |
70 |
55 |
12 |
0.99 |
| ϑ |
85 |
40 |
12 |
0.82 |
Table 4.
Comparative results between CH4-CAES and H2-CAES.
Table 4.
Comparative results between CH4-CAES and H2-CAES.
| Case |
CH4-CAES |
H2-CAES (γ) |
H2-CAES (δ) |
H2-CAES (α) |
| PV plant nominal power (MW) |
- |
70 |
85 |
100 |
| PEM electrolyzer nominal power (MW) |
- |
55 |
40 |
40 |
|
) (h) |
5 |
5 |
5 |
5 |
|
) (h) |
24 |
10 |
10 |
8 |
|
) (GWh/year) |
- |
110.8 |
134.55 |
158.3 |
|
) (GWh/year) |
- |
110.4 |
110.8 |
109.5 |
| Self-consumption (SC) (%) |
- |
99.6 |
82.3 |
69.2 |
|
) (GWh/year) |
41.6 |
41.6 |
41.6 |
41.5 |
|
) (GWh/year) |
52.5 |
52.5 |
52.5 |
52.3 |
| Fuel consumption (t/year) |
4,538 |
1,874 |
1,878 |
1,868 |
| CO2 emissions during operation (tCO2,eq) |
34,125 |
0 |
0 |
0 |
| PEM to compressor energy ratio |
- |
2.65 |
2.66 |
2.64 |
| Output to compressor energy ratio |
1.26 |
1.26 |
1.26 |
1.26 |
| Output to PEM energy ratio |
- |
0.47 |
0.47 |
0.47 |
| Output to input electricity ratio |
- |
0.35 |
0.34 |
0.35 |
| Output to PV energy ratio |
- |
0.47 |
0.39 |
0.33 |
|
Disclaimer/Publisher’s Note: The statements, opinions and data contained in all publications are solely those of the individual author(s) and contributor(s) and not of MDPI and/or the editor(s). MDPI and/or the editor(s) disclaim responsibility for any injury to people or property resulting from any ideas, methods, instructions or products referred to in the content. |
© 2023 by the authors. Licensee MDPI, Basel, Switzerland. This article is an open access article distributed under the terms and conditions of the Creative Commons Attribution (CC BY) license (http://creativecommons.org/licenses/by/4.0/).
