
You are currently viewing a beta version of our website. If you spot anything unusual, kindly let us know.
Preprint
Article
Evolution of Intrinsic Disorder in Protein Loops
Altmetrics
Downloads
94
Views
35
Comments
0
A peer-reviewed article of this preprint also exists.


This version is not peer-reviewed
Abstract
Intrinsic disorder accounts for the flexibility of protein loops, molecular building blocks that are largely responsible for the processes and molecular functions of the living world. While loops likely represent early structural forms that served as intermediates in the emergence of protein structural domains, their origin and evolution remains poorly understood. Here, we conduct a phylogenomic survey of disorder in loop prototypes sourced from the ArchDB classification. Tracing prototypes associated with protein fold families along an evolutionary chronology revealed ancient prototypes tended to be more disordered than their derived counterparts, with ordered prototypes developing later in evolution. This highlights the central evolutionary role of disorder and flexibility. While mean disorder increased with time, a minority of ordered prototypes exist that emerged early in evolutionary history, possibly driven by the need to preserve specific molecular functions. We also revealed percolation of evolutionary constraints from higher to lower levels of organization. Percolation resulted in trade-offs between flexibility and rigidity that impacted prototype structure and geometry. Our findings provide a deep evolutionary view of the link between structure, disorder, flexibility and function, as well as insights into the evolutionary role of intrinsic disorder in loops and their contribution to protein structure and function.
Keywords:
Subject: Biology and Life Sciences - Biochemistry and Molecular Biology
1. Introduction
Intrinsically disordered regions (IDRs) are functionally important regions of proteins that lack stable structural integrity, are abundant in eukaryotic and viral proteomes, and are widely present in archaea and bacteria [1]. In addition to their deviant sequence behavior, IDRs display distinctive biophysical properties in terms of sequential, structural and spatiotemporal heterogeneity to qualify as ‘edge of chaos’ systems [2]. The flexibility of IDRs due to such heterogenous properties endows them with a functional advantage over their structured counterparts that enables participation in complex biological functions, such as recognition, regulation and signaling [3]. However, the behavior of these ‘edge of chaos’ systems is sensitive to environmental perturbations and mutations that can lead to misidentification and mis-signaling. Such dysfunction of IDRs has been observed to play a role in amyloidosis, cancer, cardiovascular disorders, and neurodegenerative diseases [3]. Therefore, evolutionary forces act on such ‘non- regular secondary structure regions’ to preserve biological function [4,5].
Remarkably, IDR dynamic behavior is evolutionarily conserved, despite low sequence conservation [5]. Furthermore, flexibility is conserved in proteins [6]. Thus, measuring intrinsic disorder can quantify the inherent flexibility of proteins. Protein loops, the major contributors to structural flexibility, are a source of functional heterogeneity and are therefore important to understanding the relationship between function and flexibility [7,8]. Furthermore, the functional activities of proteins have been proposed to be determined by the molecular functions of loops known as ‘elementary functional loops’ (EFLs) [9]. The EFLs are enriched in amino acid residues responsible for a specific function, with abundant sets of prototypes, including the p-loop prototype responsible for a majority of enzymatic functions [10]. EFLs have proven useful in studying evolution of protein function in archaeal organisms, suggesting the use of loop classification systems are a promising route to understanding functional innovation by the reuse of such components in different molecular contexts [11]. In fact, coupling EFLs with network science has provided evolutionary insights into the formation of complex protein structures through the recruitment of loops [12]. Disorder in proteins has been extensively studied at the proteomic level [13,14,15,16] and to a limited extent at the protein domain level [17]. However, disorder in loop structures, one of the most granular levels of the hierarchy of molecular structure, remains least explored despite being fundamental contributors to the flexibility in proteins.
A previous exploration of contact order in proteins, which is correlated to structural flexibility, showed that there are important evolutionary constraints acting on folding speed [18]. It showed folding speed increases in evolution. An evolutionary study of loops with network approaches that traced the birth of structural domains from loop structures has been conducted in a separate study [19]. Here, we investigate the evolution of disorder at the protein loop level, one of the lowest levels of organization in biological molecular systems. We surveyed thousands of loop prototypes derived from ArchDB [20] and traced their evolutionary history by mapping them to the history of the corresponding domains defined at the fold family (FF) level of structural abstraction of SCOP [21]. This evolutionary history is based on reliable phylogenomic reconstruction methods that are relatively robust to high mutation rates, horizontal gene transfer, and genetic mosaicism when compared to traditional sequence methods [22].
2. Materials and Methods
We performed intrinsic disorder analysis of loop structures associated with loop prototypes classified by the ArchDB database [20]. Loop prototypes (Figure 1) define the ArchDB classification based on a set of geometric properties, with the following naming scheme (Figure 1a): clustering method used, ‘type’ of bracing secondary structures (Table 1), length of the unstructured loop region between the bracing secondary structures, class and subclass [20]. Two types of clustering methods have been used for classification in ArchDB: Density Search (DS) and Markov Clustering (MCL). Both methods classify loop lengths differently. The DS algorithm is stringent with classification of loops because it allows only fixed ‘length’ of loops to be grouped together, while MCL allows for variation. A class clusters loops with the same conformation of the loop region, while a subclass groups loops with a common geometry (Figure 1b).
A loop structure is the region in a protein data bank (PDB) structure annotated with a loop prototype, named by its parent PDB structure, chain and location of its first residue in the parent structure; e.g., the loop in Figure 1b is part of chain A of PDB entry 4ETP, beginning at residue 448.
The loop structural dataset of ArchDB [20] holds 190,573 classified loop structures out of a total of 306,726 reported loops. The dataset associated with Density Search (DS) loop prototypes, which holds 125,824 loops, was filtered using mappings of FFs to loop prototypes at e-value < 0.001. This resulted in 88,321 loop structures corresponding to 7,110 unique DS prototypes. Note that each loop structure in ArchDB has one loop prototype annotation associated with it for a particular classification system (DS, in our case). However, many-to-many annotations exist between loop prototypes and SCOP FFs. We mapped the SCOP FFs from ArchDB to those in our phylogenomic timeline, followed by retaining loop prototypes mapped to only one SCOP FF. This resulted in 5,125 loop prototypes mapped to 1,965 FFs (Table S1). We then transferred times of origin of SCOP FFs to the associated loop prototypes as previously described [19]. These evolutionary ages were measured as node distances (nd) extracted from a published phylogenomic tree reconstructed from a genomic census of FFs in 8,127 proteomes belonging to the three superkingdoms of life and viruses [23], using thoroughly tested phylogenomic protocols [24,25]. Cellular organisms were represented by 139 archaeal, 1,734 bacterial, and 210 eukaryal proteomes. The virus supergroup was represented by 6,044 viral proteomes [26]. Figure S1 describes the general experimental workflow that was utilized to build the published phylogenomic tree and the annotated loop chronologies of this study.
Structural disorder was computed using a local copy of the IUPRED software with the ‘short’ disorder option [27]. A residue was categorized as disordered if it scored above a threshold of 0.5. Disorder of a loop structure was calculated as a fraction of the disordered residues to the total number of residues. The mean disorder for each loop prototype was the average of disorder scores for individual loop structures associated with each loop prototype:
A loop prototype was classified as ‘ordered’ if its mean disorder score was from 0 to 0.1, ‘moderate disorder’ with a mean disorder score from 0.1 to 0.3 and ‘high disorder’ with scores greater than 0.3.
3. Results
We conducted disorder analysis on 5,125 loop prototypes associated with 1,965 FFs. FFs were annotated with times of origin (evolutionary ages given as nd values) derived from a genomic census of 8,127 proteomes from the three superkingdoms and viruses. The evolutionary ages are based on phylogenomic methods benchmarked by well over a decade of research and experimentation [28,29,30,31,32,33,34]. We inspected disorder and various structural and geometric properties of loop prototypes in superkingdoms and viruses, indexed their associated molecular functions, and explored the evolutionary spread of prototypes in a phylogenomic timeline.
There appears to be a sharp decline in mean disorder scores with an increase in mean loop structure length (Figure 2a). However, while the median of mean disorder scores gradually increased with time of origin, the median of mean length of the loop structure was steady throughout the timeline (Figure 2b). As expected, loops with high disorder outnumbered those with moderate and low disorder as their accumulation rates increased and decreased in the timeline (Figure 2c). Interestingly, the medians of mean disorder score of loop prototypes in SCOP classes showed a general increase with age (Figure 2b). Following a rejection of the null hypothesis of all medians being the same by the Kruskal-Wallis H test [35], the Conover’s test of multiple comparisons [36] indicated that the pairwise comparison of the four major classes of domains in SCOP, namely, all-α, all-β, α+β, and α/β, showed a significant difference in medians (Table 2). Mean disorder increased according to the sequence: all-α < α+β < α/β < all-β (Figure 2d). Moreover, out of the 48 ‘ordered’ loop prototypes, 18 belonged to FFs from the α/β class, followed by 11 from all-α, 7 from α+β, 5 from all-β, and 7 belonging to rest of the classes (Table S2).
A four-set Venn diagram of loop prototypes in superkingdoms and viruses showed a high number of loop prototypes associated with the ABEV and ABE Venn groups (Figure 3a). The α-β type ‘HE’ claimed the highest percentages of loop types present in each superkingdom and the viral supergroup (Figure 3b). The distribution of loop types appeared to follow a similar trend for all superkingdoms and viruses.
A closer inspection of the distribution of loop prototypes belonging to FFs of each Venn group (Figure 4) along the evolutionary timeline revealed patterns of first origin matching those observed for FFs. As a general trend, ‘ordered’ prototypes (Table S2) appeared later than high and moderate disorder prototypes, with 39 ‘ordered’ prototypes appearing around and after nd = 0.4. Highly and moderately disordered prototypes appeared concurrently (roughly at a same time) for the ABEV, ABE, EV, and V groups. However, moderately disordered prototypes appeared earlier than highly disordered ones in the FFs of the BE group. Interestingly, the A Venn group had only high disorder loop prototypes. Evolutionary tracings also showed that while high disorder prototypes were present in all Venn groups (except AV), 24 of the 48 ‘ordered’ prototypes were only present in the FFs of the ABEV group, followed by 13 present in ABE, 4 in BEV, 2 in AB, 2 in BE, 2 in E and 1 in ABV (Table S2).
The distribution of loop structural ‘types’ along the evolutionary timeline showed that all types appeared very early in evolution. The ‘DS.EH.6.17.1’ and ‘DS.EH.7.6.1’ prototypes appeared the earliest together with the most ancient ‘ABC transporter ATPase domain-like’ FF (c.37.1.12) (Figure 5). Highly and moderately disordered prototype types α-α (HH) and β-α (EH) appeared approximately at the same time. Except for the helix 310-helix 310 (GG) prototypes, all other ‘types’ had both ordered and moderately disordered prototypes. For the remaining seven types, highly ordered prototypes appeared earlier than both moderately disordered and ordered prototypes. There were 13 ‘ordered’ prototypes associated with the HH type, followed by 9 with EH, 7 with BK, 6 with HE, 5 with EG, 4 with BN, 2 with GE, and 1 each with HG and GH.
The median values for mean disorder scores by structural type were the highest for the helix 310-containing GG, EG, and GE prototypes, with a left skew in their respective distributions (Figure 6a). To assess whether higher disorder scores for specific types were associated with the molecular function of the FFs they belong to, we inspected the distribution of structural types for each molecular function (Figure 6b). Some of the functional categories showed a preference for certain types of prototypes. The β-β hairpin (BN) type comprised the highest number of prototypes present in FFs belonging to the ‘Intracellular processes’, ‘Extracellular processes’, and ‘Other’ categories. The α-α (HH) type dominated the distribution in FFs in both ‘Information’ and ‘Regulation’. The FFs associated with the ‘General’ and ‘Metabolism’ functional categories were associated with a high number of EH and HE types, respectively.
The survey of loop prototypes by disorder categories in molecular function showed that ‘Information’ and ‘Other’ were the only categories with no associated ‘ordered’ prototypes (Figure 7). Out of the 48 ‘ordered’ prototypes, 29 belonged to ‘Metabolism’ FFs, followed by 7 to ‘Intracellular processes’ FFs, 6 to ‘General’ FFs, 5 to ‘Regulation’ FFs and 1 to ‘Extracellular processes’ FFs (Table 3). A Gene Ontology (GO) enrichment analysis of the FFs with ordered prototypes showed that these FFs are highly enriched in activities mainly related to metabolism, transport, and DNA transcription as well as pathogenesis and immune response (Table 3). Highly and moderately disordered prototypes appeared approximately at the same time in the FFs belonging to ‘Metabolism’ and ‘General’. For FFs with ‘Regulation’, ‘Intracellular processes’, and ‘Extracellular processes’ molecular functions, highly disordered prototypes appeared earlier than moderately disordered and ordered prototypes.
Loop prototypes with smaller lengths of the loop region, ranging 1–7, were widespread throughout evolutionary time, while longer prototypes were part of FFs that appeared relatively late in evolution (Figure 8a). The average length for N-terminus and C-terminus of prototypes showed consistent distribution with little variation throughout the timeline. Similarly, geometric properties of prototypes, namely, hoist (delta) and packing (theta) angles, and distance were spread consistently throughout evolutionary time. However, the median values for meridian (rho) angles showed an increase with time, while the Euclidean distance (D) between the boundaries of aperiodic structures showed a slight decrease (Figure 8b).
4. Discussion
Protein loops constitute a diverse group of molecular building blocks made of helix, strand, and coil segments that are largely responsible for the processes and molecular functions of the living world [37]. They can interact with solvent, ligand and other molecules, establishing a wide range of dynamic behaviors, from static to highly plastic. From an evolutionary perspective, loops likely represent prior structural states, intermediate evolutionary forms responsible for the emergence of structural domains in proteins [19]. Here we study loop flexibility by surveying intrinsic disorder and following its evolution. We focus on loop prototypes, supersecondary motifs bracing nonregular aperiodic regions sourced from the ArchDB database, a library that has sampled all loop geometries and should be considered essentially complete [38]. Two types of prototypes exist, those that are modular and are recruited throughout evolution, and those that are non-modular and are recruited into domains only once [19]. To offset the confounding effects of recruitment, we here focus on the latter. Our analysis revealed the central evolutionary role of disorder and flexibility, the unexpected evolutionary rise of structural order, and evolutionary constraints percolating from higher to lower levels of biological organization leading to trade-offs between flexibility and rigidity and impacts on the structure and geometry of prototypes.
4.1. The evolutionary centrality of loop disorder and flexibility
We find that loop prototypes of ancient FFs were always more disordered than their derived counterparts and that ordered prototypes developed later in evolution. These patterns were present when indexing timelines with Venn groups of prototype distribution in superkingdoms and viruses (Figure 4), types of bracing secondary structures (Figure 5), or annotated molecular functions (Figure 7). Furthermore, we find mean disorder increased in evolution (Figure 2b) and was widely present in prototypes throughout the timeline (Figure 2c). This was an expected outcome given that flexibility and intrinsic disorder are linked phenomena and that protein folding speed is correlated with flexibility and is evolutionarily optimized to increase in time [18]. However, significant differences in mean disorder distributions of the four major SCOP classes, namely the α/β, α+β, all-α and all-β proteins, were detected (Figure 2d), suggesting there are evolutionary constraints acting both across levels of biological organization and within systems. This is by no means surprising. SCOP classes are known to harbor deep phylogenomic signatures in their makeup (reviewed in [39]).
4.2. The unexpected evolutionary rise of order in loop structure
Remarkably, our analysis reveals the presence of a significant number of ‘ordered’ loop prototypes (Table S2) developing later than disordered prototypes but quite early in evolutionary history (Figure 4). The existence of ordered loops poses the question of the purpose of their existence. A potential explanation is the preservation of molecular functions that require a certain amount of structural integrity, which then becomes evolutionarily ‘canalized’ into conserved regions. As an example, consider two RIG-I-like receptors (RLRs), RIG-I and MDA5, which play a vital role in vertebrate antiviral defense [40]. Both receptors share high sequence similarity but perform nonredundant functions, as each receptor recognizes different types of double-stranded RNA (dsRNA) viruses [41]. Differential flexibility of a loop that is rigid in RIG-I, but highly disordered in MDA5, enables each receptor to perform its respective sensory functions. Remarkably, we see an enrichment of immune response biological processes in ordered prototypes (Table 3). Similarly, pathogenesis-related class 10 (PR10) proteins, found in plants in response to stress-inducing factors, are hypothesized to play a role in defense against plant pathogens [42]. The PR10 proteins possess a glycine-rich L4 loop, similar to the highly flexible P-loop present in many proteins. However, the L4 loop is found to have unusual rigidity, where it differs from the P-loop, despite its high glycine content [42].
4.3. Percolation of evolutionary constraints from higher to lower levels of organization
Eukaryotic and viral proteomes have relatively higher disorder than those belonging to archaea and bacteria [14]. To dissect patterns of sharing and spread of high disorder in loop prototypes we analyzed their association to FFs in superkingdoms and viruses. The presence of all structural types of prototypes in the ancient and universal core shared by all life (the ABEV Venn group), different patterns of prototype accumulation in Venn groups of superkingdoms and viruses (Figure 3), and patterns of accumulation along the evolutionary chronology of prototypes (Figure 4) have important implications to our understanding of evolution of intrinsic disorder. First, findings suggests that all ‘types’ of prototypes were abundant in ancient cells and viruses. A wide variety of prototype building blocks were therefore available in the early protein world to make more complex structure. Second, over time, some lineages appeared to have lost certain types of prototypes that were not useful to them. Instead, they favored and retained prototypes that provided them with an evolutionary advantage, most likely in terms of survival and reproduction. Indeed, short disordered regions in the ‘context’ of a protein enable or complement the function of a structured domain and sometimes, act as a separate functional modules [43]. Remarkably, the absence of certain structural types of prototypes in the A, ABV, AEV, BV and EV Venn groups coincides with the branching of major organismal lineages and viruses. It also suggests that evolutionary constraints at higher proteomic and structural domain levels are percolating at lower levels to impact the evolutionary spread of disorder. Likewise, ‘ordered’ prototypes, which developed later in time, served different purposes in prokaryotic microbes and viruses. Only prototypes shared by all life (ABEV), shared by cellular organisms (ABE), and shared by organisms with a same membrane phospholipid makeup (BE and BEV) developed ordered structures and did so late in evolution of their respective groups (Figure 4). Conversely, ordered prototypes were almost absent in prototypes specific to superkingdoms and viruses. In fact, only highly disordered prototypes were specific to Archaea, and most virus-specific and bacteria-specific prototypes showed only high or moderate disorder. This differential behavior appears to hold a strong historical signature that is indicative of constraints percolating from the organismal level to the loop structural level.
4.4. Evolutionary percolation and trade-offs between flexibility and rigidity in loop behavior
We note that there is considerable variation in the distribution of disorder in all ten structural types of loop prototypes (Figure 6). Flexibility is critical to the functioning of proteins [44]. It is therefore expected that the differential flexibility of types of prototypes will be differentially adopted by categories of molecular function. Indeed, some functional categories prefer loops bearing certain structural types (Figure 6). For example, prototypes associated with ‘Metabolism’ and ‘General’ possessed a high number of ordered prototypes (Figure 7). This observation can be reconciled with the finding that enzymes require a balance of structural rigidity and flexibility in order to carry out their functions [45]. High flexibility may lead to conformational states that hinder enzymatic activity, interfering with enzyme-substrate interactions. Conversely, FFs from ‘Extracellular processes’ have a greater number of flexible loops of types β-β hairpin (BN) and β-β link (BK). The FFs of the sampled prototypes associated with ‘Extracellular processes’ are mostly associated with immune response, toxins and defense enzymes, and cell adhesion. Viruses have evolved disorder as means of evading host immune responses and for mimicking host functions [46,47]. This variation in disorder for different functional categories also indicates varying speeds of the evolutionary clock, depending on the nature of the function [48].
The early evolutionary rise of high levels of disorder in loop prototypes contrasts with evolution of disorder in the structural domains of proteins. A parallel analysis of intrinsic disorder in ~3,800 FFs that were present in the same 8,127 proteomes of superkingdoms and viruses examined in this study revealed ancient FFs were ordered and that disorder of structural domains evolved as a benefit acquired later in evolution (Mughal and Caetano-Anollés, ms. in preparation). Thus, loop-associated ‘short’ and domain-associated ‘long’ regions of disorder evolve differently across different levels of protein organization. We note that different evolutionary constraints acting at different levels of biological complexity are also observed in evolving metabolic networks where higher and lower levels of metabolic organization are under stringent evolutionary constraints, while the intermediate levels add ‘noise’, thus driving innovation holistically [49]. In fact, the prototypes of the most ancient structural domain, the ABC transporter ATPase domain-like’ FF (c.37.1.12) illustrate this interplay of constraints. The highly ordered structure of the c.37.1.12 FF (Figure 5) harbors the highly flexible and glycine-rich, phosphate-binding loop, the ‘P-loop’ [50], which we recently showed catalyzes convergence towards folded structure of the emerging domain [19]. This suggests evolutionary constraints requiring both relatively rigid domains and highly disordered loops are necessary to carry out function. This is indicative of evolutionary constraints percolating from the structural domain level to the loop structural level.
Long disordered regions are context-dependent such that their disorder-to-order conformations depend on the presence of specific binding partners or environmental elements, such as pH, redox potential, or temperature [51,52]. Similarly, short disorder regions would be expected to be context dependent in terms of flanking structures and protein contacts. In fact, short disordered regions exhibit behavior similar to regular secondary structure and are more resilient to mutations when compared to regions of long disorder that are highly sensitive to mutations, demonstrating that in contrast with short disorder, maintaining long disorder is evolutionarily nontrivial [53].
4.5. Evolutionary impact on loop structure and geometry
Finally, tracing the history of structural and geometric properties of loop prototypes along the evolutionary timeline provides additional insights (Figure 8). Loop length appeared to be the major source of evolutionary variability when compared to the lengths of N- and C-terminal bracing loop structures. This shows that indeed flexible regions of proteins are chiefly responsible for functional heterogeneity [8]. There was also slight variation in hoist (delta) and packing (theta) angles and distance measures of the prototypes along the timeline. Packing density is correlated to evolutionary rates at the protein level, but it varies slightly in evolution in the case of protein loops [54]. This is suggestive of evolutionary constraints acting to maintain hoist and packing in protein fragments with little variation, whilst introducing novelty by varying meridian (rho) angles.
5. Conclusions
Our study does not exclusively address intrinsic disorder. Instead, it focuses on studying disorder as proxy for surveying protein flexibility, an approach taken by other recent studies [43]. Results provide a deeper evolutionary view of the link between structure, disorder, flexibility and function. First, ancient loop prototypes tended to be more disordered than their derived counterparts, with ordered prototypes developing later in evolution. This highlights the central evolutionary role of disorder and flexibility. Second, there was an unexpected emergence of ordered prototypes early in evolutionary history, possibly driven by the need to preserve specific molecular functions. Third, the study uncovered percolation of evolutionary constraints from higher to lower levels of biological organization. This percolation influenced the spread of disorder in prototypes. Fourth, the analysis revealed trade-offs between flexibility and rigidity in loop behavior, with different functional categories preferring specific structural types. Finally, tracing the evolution of structural and geometric properties of loops revealed variations in loop length and geometry along the evolutionary chronology of prototypes. These findings provide valuable insights into the role of protein loops in evolution and their contribution to protein structure and function.
We conclude by acknowledging some limitations of our study. First, the accuracy of the disorder analysis relies on the precision of the available software, which introduces the possibility of false negatives and false positives in our analyses. Second, biases within databases, such as the presence of disordered structures in the PDB and, consequently, in ArchDB, may also act as limiting factors. Lastly, there are many-to-many mappings between loop prototypes and FFs with varying degrees of e-values in ArchDB. In our study, we opted for a stringent e-value of < 0.001, resulting in prototypes being mapped to only one FF at this e-value. While this choice may lead to missing some hits, it helps mitigate issues that could arise from a high number of false positives. In the future, addressing these limitations can be achieved by expanding database knowledge and enhancing prediction software accuracy.
Supplementary Materials
The following supporting information can be downloaded at the website of this paper posted on Preprints.org. Figure S1: General phylogenomic workflow utilized in this study; Table S1: Prototypes and their structural, functional and phylogenomic annotations; Table S2: List of ‘ordered’ loop prototypes mapped to SCOP FFs represented by their SCOP concise classification strings (ccs).
Author Contributions
Conceptualization, F.M. and G.C.-A.; methodology, F.M. and G.C.-A.; validation, F.M.; formal analysis, F.M.; investigation, F.M. and G.C.-A.; data curation, F.M.; writing—original draft preparation, F.M.; writing—review and editing, F.M. and G.C.-A.; visualization F.M. and G.C.-A.; supervision, G.C.-A.; project administration, G.C.-A.; funding acquisition, G.C.-A.
Funding
This research was funded by grants from the National Science Foundation (MCB-0749836 and OISE-1132791) and the United States Department of Agriculture (ILLU-802-909 and ILLU-483-625) and supported by Blue Waters supercomputer allocations from the National Center for Supercomputing Applications (NCSA) to GCA.
Data Availability Statement
The data presented in this study are openly available in the ArchDB (http://sbi.imim.es/archdb/), SCOP (https://scop.mrc-lmb.cam.ac.uk) and SCOPe (https://scop.berkeley.edu) repositories. Other data and information supporting the findings of this study are available within the article and its Supplementary Materials.
Acknowledgments
We acknowledge supercomputer support from the Illinois Campus Cluster Program.
Conflicts of Interest
The authors declare no conflict of interest. The funders had no role in the design of the study; in the collection, analyses, or interpretation of data; in the writing of the manuscript; or in the decision to publish the results.
References
- Uversky, V.N. A decade and a half of protein intrinsic disorder: Biology still waits for physics. Protein Sci. 2013, 22, 693–724. [Google Scholar] [CrossRef]
- Uversky, V.N. Unusual biophysics of intrinsically disordered proteins. Biochim. Biophys. Acta - Proteins Proteomics 2013, 1834, 932–951. [Google Scholar] [CrossRef] [PubMed]
- Uversky, V.N.; Oldfield, C.J.; Dunker, A.K. Showing your ID: Intrinsic disorder as an ID for recognition, regulation and cell signaling. J. Mol. Recognition 2005, 18, 343–384. [Google Scholar] [CrossRef]
- Liu, J.; Tan, H.; Rost, B. Loopy proteins appear conserved in evolution. J. Mol. Biol. 2002, 322, 53–64. [Google Scholar] [CrossRef] [PubMed]
- Daughdrill, G.W.; Narayanaswami, P.; Gilmore, S.H.; Belczyk, A.; Brown, C.J. Dynamic behavior of an intrinsically unstructured linker domain is conserved in the face of negligible amino acid sequence conservation. J. Mol. Evol. 2007, 65, 277–288. [Google Scholar] [CrossRef] [PubMed]
- Marsh, J.A.; Teichmann, S.A. Protein flexibility facilitates quaternary structure assembly and evolution. PLoS Biol. 2014, 12, e1001870. [Google Scholar] [CrossRef]
- Feller, S.M.; Lewitzky, M. What’s in a loop? Cell Commun. Signal 2012, 10, 31. [Google Scholar] [CrossRef]
- Espadaler, J.; Querol, E.; Aviles, F.X.; Oliva, B. Identification of function-associated loop motifs and application to protein function prediction. Bioinformatics 2006, 22, 2237–43. [Google Scholar] [CrossRef]
- Berezovsky, I.N.; Grosberg, A.Y.; Trifonov, E.N. Closed loops of nearly standard size: Common basic element of protein structure. FEBS Lett. 2000, 466, 283–286. [Google Scholar] [CrossRef]
- Goncearenco, A.; Berezovsky, I.N. Prototypes of elementary functional loops unravel evolutionary connections between protein functions. Bioinformatics 2010, 26, i497–503. [Google Scholar] [CrossRef]
- Goncearenco, A.; Berezovsky, I.N. Exploring the evolution of protein function in Archaea. BMC Evol. Biol. 2012, 12, 1–14. [Google Scholar] [CrossRef]
- Aziz, M.F.; Caetano-Anollés, K.; Caetano-Anollés, G. The early history and emergence of molecular functions and modular scale-free network behavior. Sci. Rep. 2016, 6, 25058. [Google Scholar] [CrossRef]
- Schad, E.; Tompa, P.; Hegyi, H. The relationship between proteome size, structural disorder and organism complexity. Genome Biol. 2011, 12, R120. [Google Scholar] [CrossRef] [PubMed]
- Xue, B.; Dunker, A.K.; Uversky, V.N. Orderly order in protein intrinsic disorder distribution: Disorder in 3500 proteomes from viruses and the three domains of life. J. Biomol. Struct. Dyn. 2012, 30, 137–149. [Google Scholar] [CrossRef]
- Xue, B.; Williams, R.W.; Oldfield, C.J.; Dunker, A.K.; Uversky, V.N. Archaic chaos: Intrinsically disordered proteins in Archaea. BMC Syst. Biol. 2010, 4, S1. [Google Scholar] [CrossRef] [PubMed]
- Basile, W.; Salvatore, M.; Bassot, C.; Elofsson, A. Why do eukaryotic proteins contain more intrinsically disordered regions? PLoS Comput. Biol. 2019, 15, e1007186. [Google Scholar] [CrossRef]
- Chen, J.W.; Romero, P.; Uversky, V.N.; Dunker, A.K. Conservation of intrinsic disorder in protein domains and families: II. functions of conserved disorder. J. Proteome Res. 2006, 5, 888–98. [Google Scholar] [CrossRef]
- Debès, C.; Wang, M.; Caetano-Anollés, G.; Gräter, F. Evolutionary optimization of protein folding. PLoS Comput. Biol. 2013, 9, e1002861. [Google Scholar] [CrossRef] [PubMed]
- Aziz, M.F.; Mughal, F.; Caetano-Anollés, G. Tracing the birth of structural domains from loops during protein eolution. Sci. Rep. 2023, 13, 14688. [Google Scholar] [CrossRef]
- Bonet, J.; Planas-Iglesias, J.; Garcia-Garcia, J.; Marín-López, M.A.; Fernandez-Fuentes, N.; Oliva, B. ArchDB 2014: structural classification of loops in proteins. Nucleic Acids Res. 2014, 42, D315–9. [Google Scholar] [CrossRef]
- Conte, L.L.; Ailey, B.; Hubbard, T.J.; Brenner, S.E. , Murzin, A.G. SCOP: a structural classification of proteins database. Nucleic Acids Res. 2000, 28, 257–259. [Google Scholar] [CrossRef]
- Caetano-Anollés, G.; Nasir, A. Benefits of using molecular structure and abundance in phylogenomic analysis. Front. Genet. 2012, 3, 172. [Google Scholar] [CrossRef] [PubMed]
- Mughal, F.; Nasir, A.; Caetano-Anollés, G. The origin and evolution of viruses inferred from fold family structure. Arch. Virol. 2020, 165, 2177–2191. [Google Scholar] [CrossRef]
- Kim, K.M.; Caetano-Anollés, G. The evolutionary history of protein fold families and proteomes confirms that the archaeal ancestor is more ancient than the ancestors of other superkingdoms. BMC Evol. Biol. 2012, 12, 13. [Google Scholar] [CrossRef]
- Kim, K.M.; Qin, T.; Jiang Y-Y.; Chen, L.L.; Xiong, M., Caetano-Anollees, D.; Zhang, H-Y.; Caetano-Anollés, G. (2012) Protein domain structure uncovers the origin of aerobic metabolism and the rise of planetary oxygen. Structure 2012, 20, 67–76. [CrossRef]
- Bao, Y.; Federhen, S.; Leipe, D.; Pham, V.; Resenchuk, S.; Rozanov, M.; Tatusov, R.; Tatusova, T. (2004) National center for biotechnology information viral genomes project. J. Virol. 2004, 78, 7291–7298. [Google Scholar] [CrossRef] [PubMed]
- Dosztányi, Z. Prediction of protein disorder based on IUPred. Protein Sci. 2018, 27, 331–340. [Google Scholar] [CrossRef] [PubMed]
- Wang, M.; Yafremava, L.S.; Caetano-Anollés, D.; Mittenthal, J.E.; Caetano-Anollés, G. Reductive evolution of architectural repertoires in proteomes and the birth of the tripartite world. Genome Res. 2007, 17, 1572–85. [Google Scholar] [CrossRef]
- Nasir, A.; Caetano-Anollés, G. A phylogenomic data-driven exploration of viral origins and evolution. Sci. Adv. 2015, 1, e1500527. [Google Scholar] [CrossRef]
- Kim, K.M.; Nasir, A.; Hwang, K.; Caetano-Anollés, G. A tree of cellular life inferred from a genomic census of molecular functions. J. Mol. Evol. 2014, 79, 240–262. [Google Scholar] [CrossRef]
- Caetano-Anollés, G. , Caetano-Anollés, D. An evolutionarily structured universe of protein prototype. Genome Res. 2003, 13, 1563–71. [Google Scholar] [CrossRef]
- Wang, M.; Caetano-Anollés, G. The evolutionary mechanics of domain organization in proteomes and the rise of modularity in the protein world. Structure 2009, 17, 66–78. [Google Scholar] [CrossRef]
- Wang, M.; Jiang, Y-Y. ; Kim, K.M.; Qu, G.; Ji, H-F.; Mittenthal, J.E.; Zhang, H-Y.; Caetano-Anollés, G. A universal molecular clock of protein folds and its power in tracing the early history of aerobic metabolism and planet oxygenation. Mol. Biol. Evol. 2011, 28, 567–82. [Google Scholar] [CrossRef]
- Kim, K.M.; Caetano-Anollés, G. The evolutionary history of protein fold families and proteomes confirms that the archaeal ancestor is more ancient than the ancestors of other superkingdoms. BMC Evol. Biol. 2012, 12, 13. [Google Scholar] [CrossRef]
- Kruskal, W.H.; Wallis, W.A. Use of ranks in one-criterion variance analysis. J. Am. Stat. Assoc. 1952, 47, 583–621. [Google Scholar] [CrossRef]
- Conover, W.J. Rank tests for one sample, two samples, and k samples without the assumption of a continuous distribution function. Ann. Stat. 1973, 1, 1105–1125. [Google Scholar] [CrossRef]
- Papaleo, E.; Saladino, G.; Lambrughi, M., Lindorff-Larsen. The role of protein loops and linkers in conformational dynamics and allostery. Chem. Rev. 2016, 116(11), 6391–6423. [Google Scholar] [CrossRef]
- Fernandez-Fuentes, N.; Dybas, J. M.; Fiser, A. Structural characteristics of novel protein folds. PLoS Comput. Biol. 2010, 6, e1000750. [Google Scholar] [CrossRef] [PubMed]
- Caetano-Anollés, G.; Wang, M.; Caetano-Anollés, G.; Mittenthal, J.E. The origin, evolution and structure of the protein world. Biochem. J. 2009, 417, 621–637. [Google Scholar] [CrossRef] [PubMed]
- Goubau, D.; Deddouche, S.; Reis e Sousa, C. Cytosolic sensing of viruses. Immunity 2013, 38, 855–869. [Google Scholar] [CrossRef] [PubMed]
- Wu, B.; Peisley, A.; Richards, C.; Yao, H.; Zeng, X.; Lin, C.; Chu, F.; Walz, T.; Hur, S. Structural basis for dsRNA recognition, filament formation, and antiviral signal activation by MDA5. Cell 2013, 152, 276–289. [Google Scholar] [CrossRef]
- Biesiadka, J.; Bujacz, G.; Sikorski, M.M.; Jaskolski, M. Crystal structures of two homologous pathogenesis-related proteins from yellow lupine. J. Mol. Biol. 2002, 319, 1223–1234. [Google Scholar] [CrossRef]
- Van Der Lee, R. , Buljan, M., Lang, B., et al. Classification of intrinsically disordered regions and proteins. Chem. Rev. 2014, 114, 6589–6631. [Google Scholar] [CrossRef] [PubMed]
- Marsh, J.A.; Teichmann, S.A. Parallel dynamics and evolution: Protein conformational fluctuations and assembly reflect evolutionary changes in sequence and structure. BioEssays 2014, 36, 209–218. [Google Scholar] [CrossRef] [PubMed]
- Kempf, J.G.; Jung, J.-J.; Ragain, C.; Sampson, N.S.; Loria, J.P. Dynamic requirements for a functional protein hinge. J. Mol. Biol. 2007, 368, 131–149. [Google Scholar] [CrossRef] [PubMed]
- Goh, G.K.M.; Dunker, A.K.; Uversky, V.N. Protein intrinsic disorder toolbox for comparative analysis of viral proteins. BMC Genomics. 2008, 9, S4. [Google Scholar] [CrossRef]
- Marín, M.; Uversky, V.N.; Ott, T. (2013) Intrinsic disorder in pathogen effectors: Protein flexibility as an evolutionary hallmark in a molecular arms race. Plant Cell 2013, 25, 3153–3157. [Google Scholar] [CrossRef]
- Brown, C.J.; Takayama, S.; Campen, A.M. , Vise, P.; Marshall, T.W.; Oldfield, C.J.; Williams, C.J.; Dunker, A.K. Evolutionary rate heterogeneity in proteins with long disordered regions. J. Mol. Evol. 2002, 55, 104–110. [Google Scholar] [CrossRef]
- Mughal, F.; Caetano-Anollés, G. MANET 3.0: Hierarchy and modularity in evolving metabolic networks. PLoS One 2019, 14, e0224201. [Google Scholar] [CrossRef]
- Romero Romero, M.L. , Yang, F., Lin, Y-R., Tawfik, D.S. Simple yet functional phosphate-loop proteins. Proc. Natl. Acad. Sci. USA 2018, 115, E11943–E11950. [Google Scholar] [CrossRef]
- Mészáros, B.; Erdos, G.; Dosztányi, Z. (2018) IUPred2A: context-dependent prediction of protein disorder as a function of redox state and protein binding. Nucleic Acids Res. 2018, 46, W329–W337. [Google Scholar] [CrossRef]
- Mohan, A.; Sullivan, W.J.; Radivojac, P.; Dunker, A.K.; Uversky, V.N. Intrinsic disorder in pathogenic and non-pathogenic microbes: Discovering and analyzing the unfoldomes of early-branching eukaryotes. Mol. Biosystems 2008, 4, 328–340. [Google Scholar] [CrossRef] [PubMed]
- Schaefer, C.; Schlessinger, A.; Rost, B. Protein secondary structure appears to be robust under in silico evolution while protein disorder appears not to be. Bioinformatics 2010, 26, 625–31. [Google Scholar] [CrossRef] [PubMed]
- Yeh, S-W. , Liu, J-W., Yu, S-H., Shih, C-H.; Hwang, J-K.; Echave, J. Site-specific structural constraints on protein sequence evolutionary divergence: local packing density versus solvent exposure. Mol. Biol. Evol. 2014, 31, 135–9. [Google Scholar] [CrossRef] [PubMed]
- Zeng, C.; Zhan, W.; Deng, L. SDADB: A functional annotation database of protein structural domains. Database 2018, 2018, bay064. [Google Scholar] [CrossRef]
Figure 1.
Definition of a loop in ArchDB [19]. (a) Classification hierarchy denoted by a loop prototype designation. The prototype is defined by the clustering method used, bracing secondary structures of the loop (type), the number of residues forming the aperiodic structure, its conformation (ϕ and ψ backbone dihedral angles of the participating residues), and the geometry of the loop. Refer to Table 1 for structural “type” categories. (b) Geometric properties of a loop are given by a distance between the boundaries of bracing secondary structures (D) and delta (hoist), theta (packing) and rho (meridian) angles. For illustration, properties are annotated on the 4ETP_A_448 loop structure belonging to the DS.HE.4.8.3 prototype.
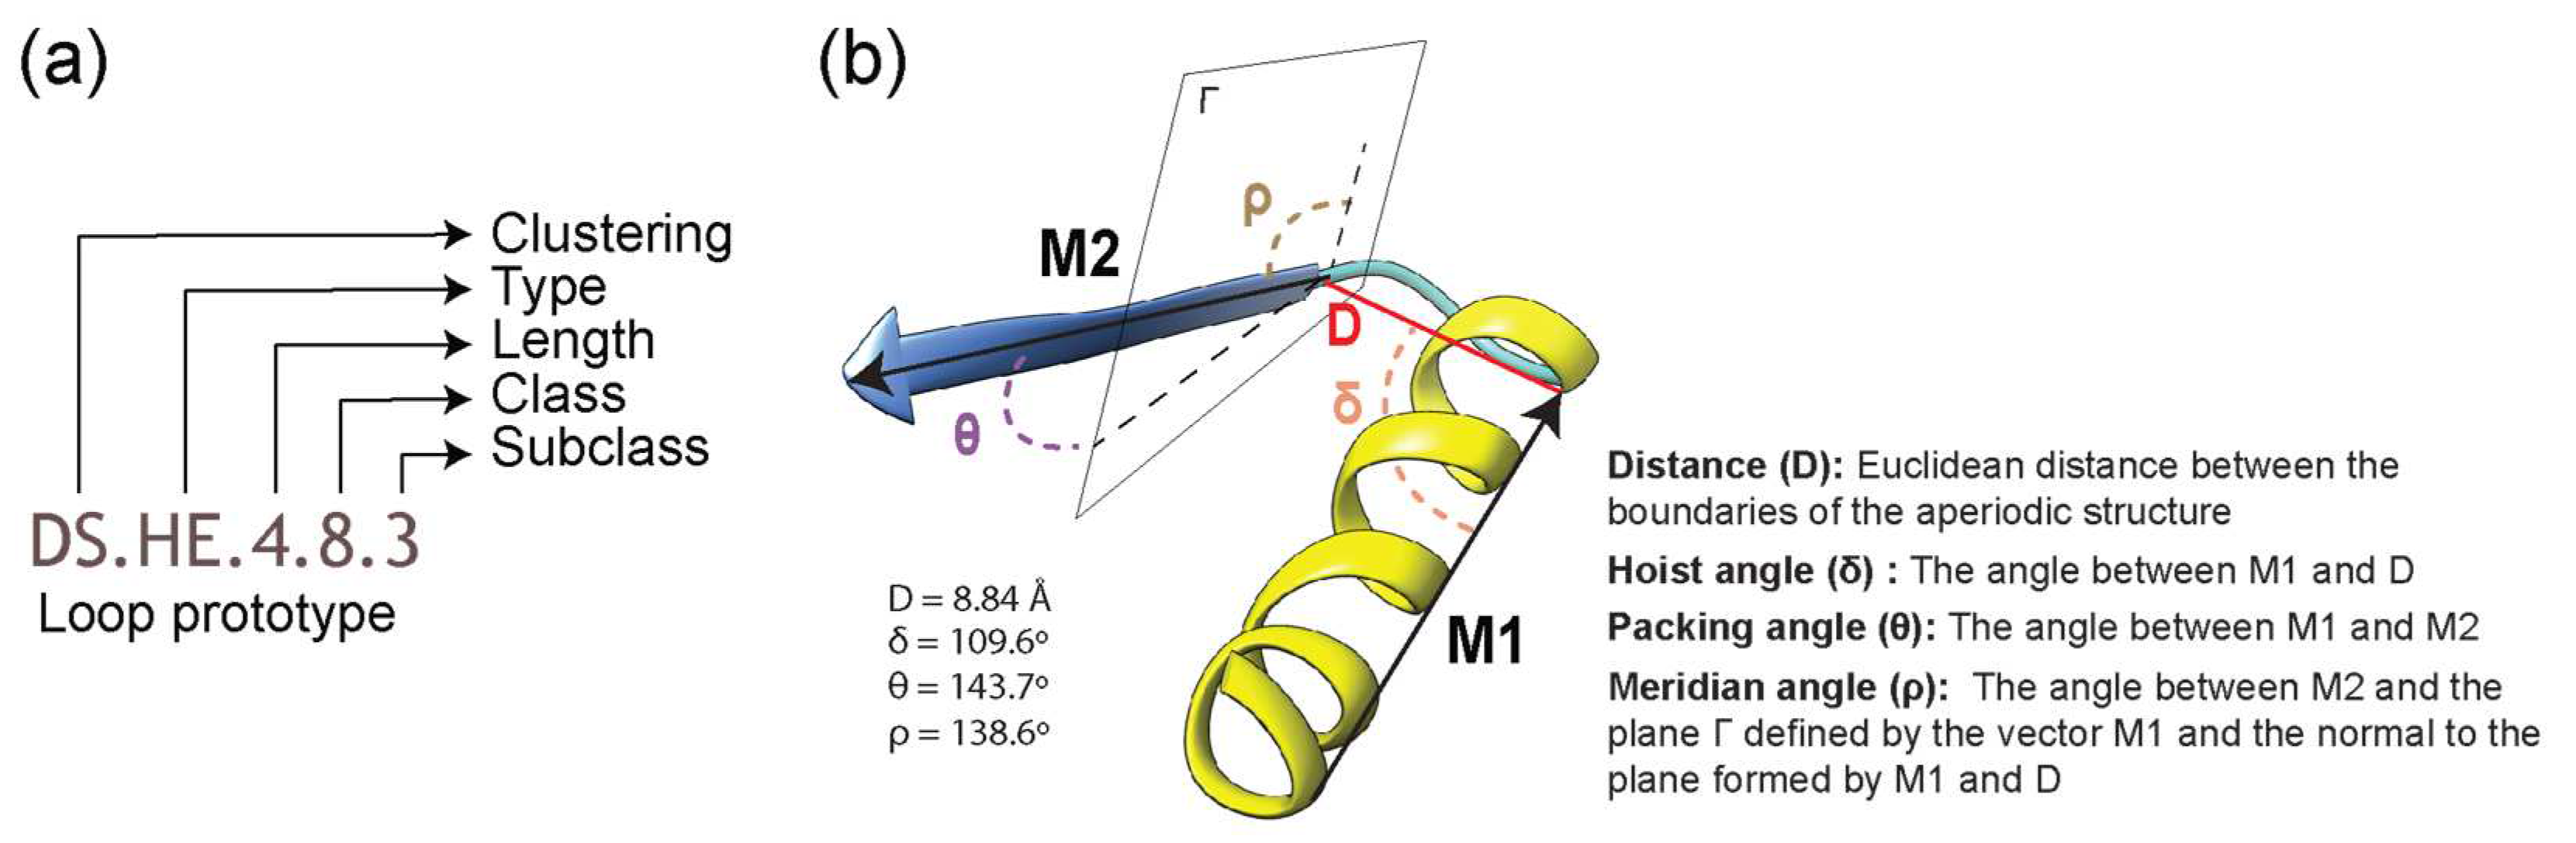
Figure 2.
Disorder in loop prototypes. (a) Mean disorder scores plotted against mean length of 5,125 protein loop prototypes. Correlations were significant (Spearman’s correlation coefficient = −0.736, p-value = 0). (b) Mean disorder and mean loop length of prototypes binned by times of origin measured as evolutionary age (nd) of corresponding SCOP fold families (FF). (c) Counts and cumulative counts of loop prototypes introduced via associated SCOP FFs in time represented by bins of evolutionary age (nd). (d) Mean disorder of loops mapping to domain in SCOP classes.

Figure 3.
Comparative genomic analysis of loop prototypes. (a) Venn diagram of prototypes distributed among superkingdoms of life and viruses. Taxonomic groups are mapped to loop prototypes through the SCOP FFs they belong to. (b) Slopegraph describing percentages of each loop type in each superkingdom and viral supergroup.
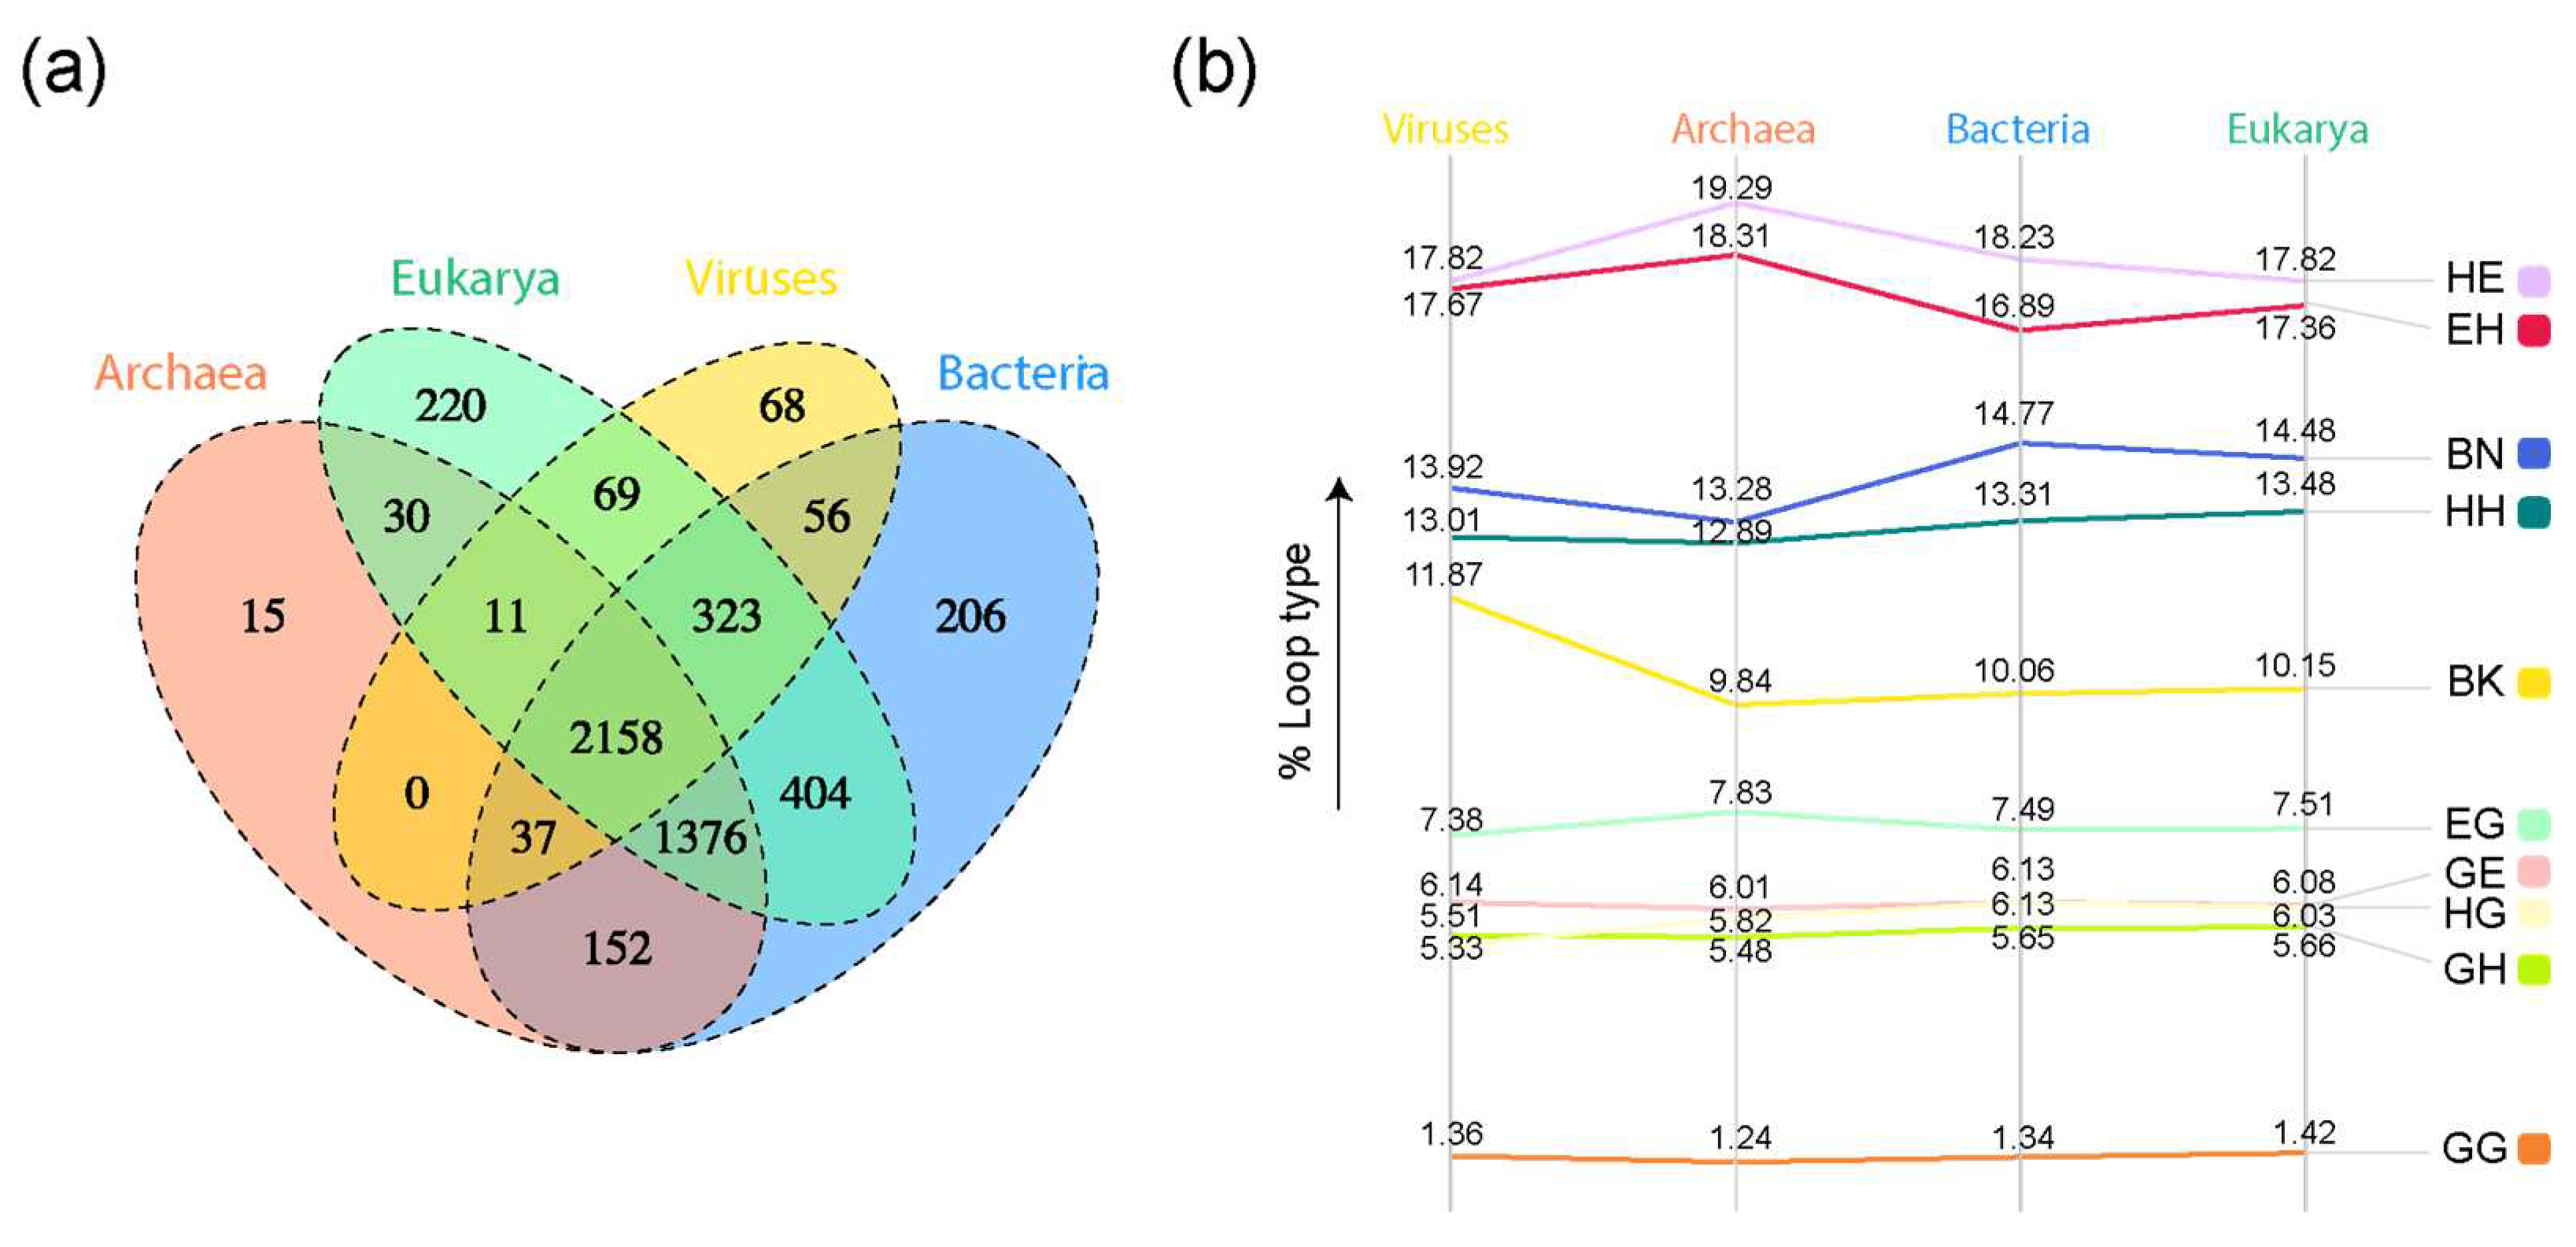
Figure 4.
A chronology of loop prototypes categorized by Venn group and magnitude of disorder. The time of origin of each prototype is given as an evolutionary age measured in node distance (nd) units. Note that the AV Venn group is absent (see Figure 3A). First prototypes appearing in each disorder category are annotated for the ABEV, ABE, BEV, and BE Venn groups.
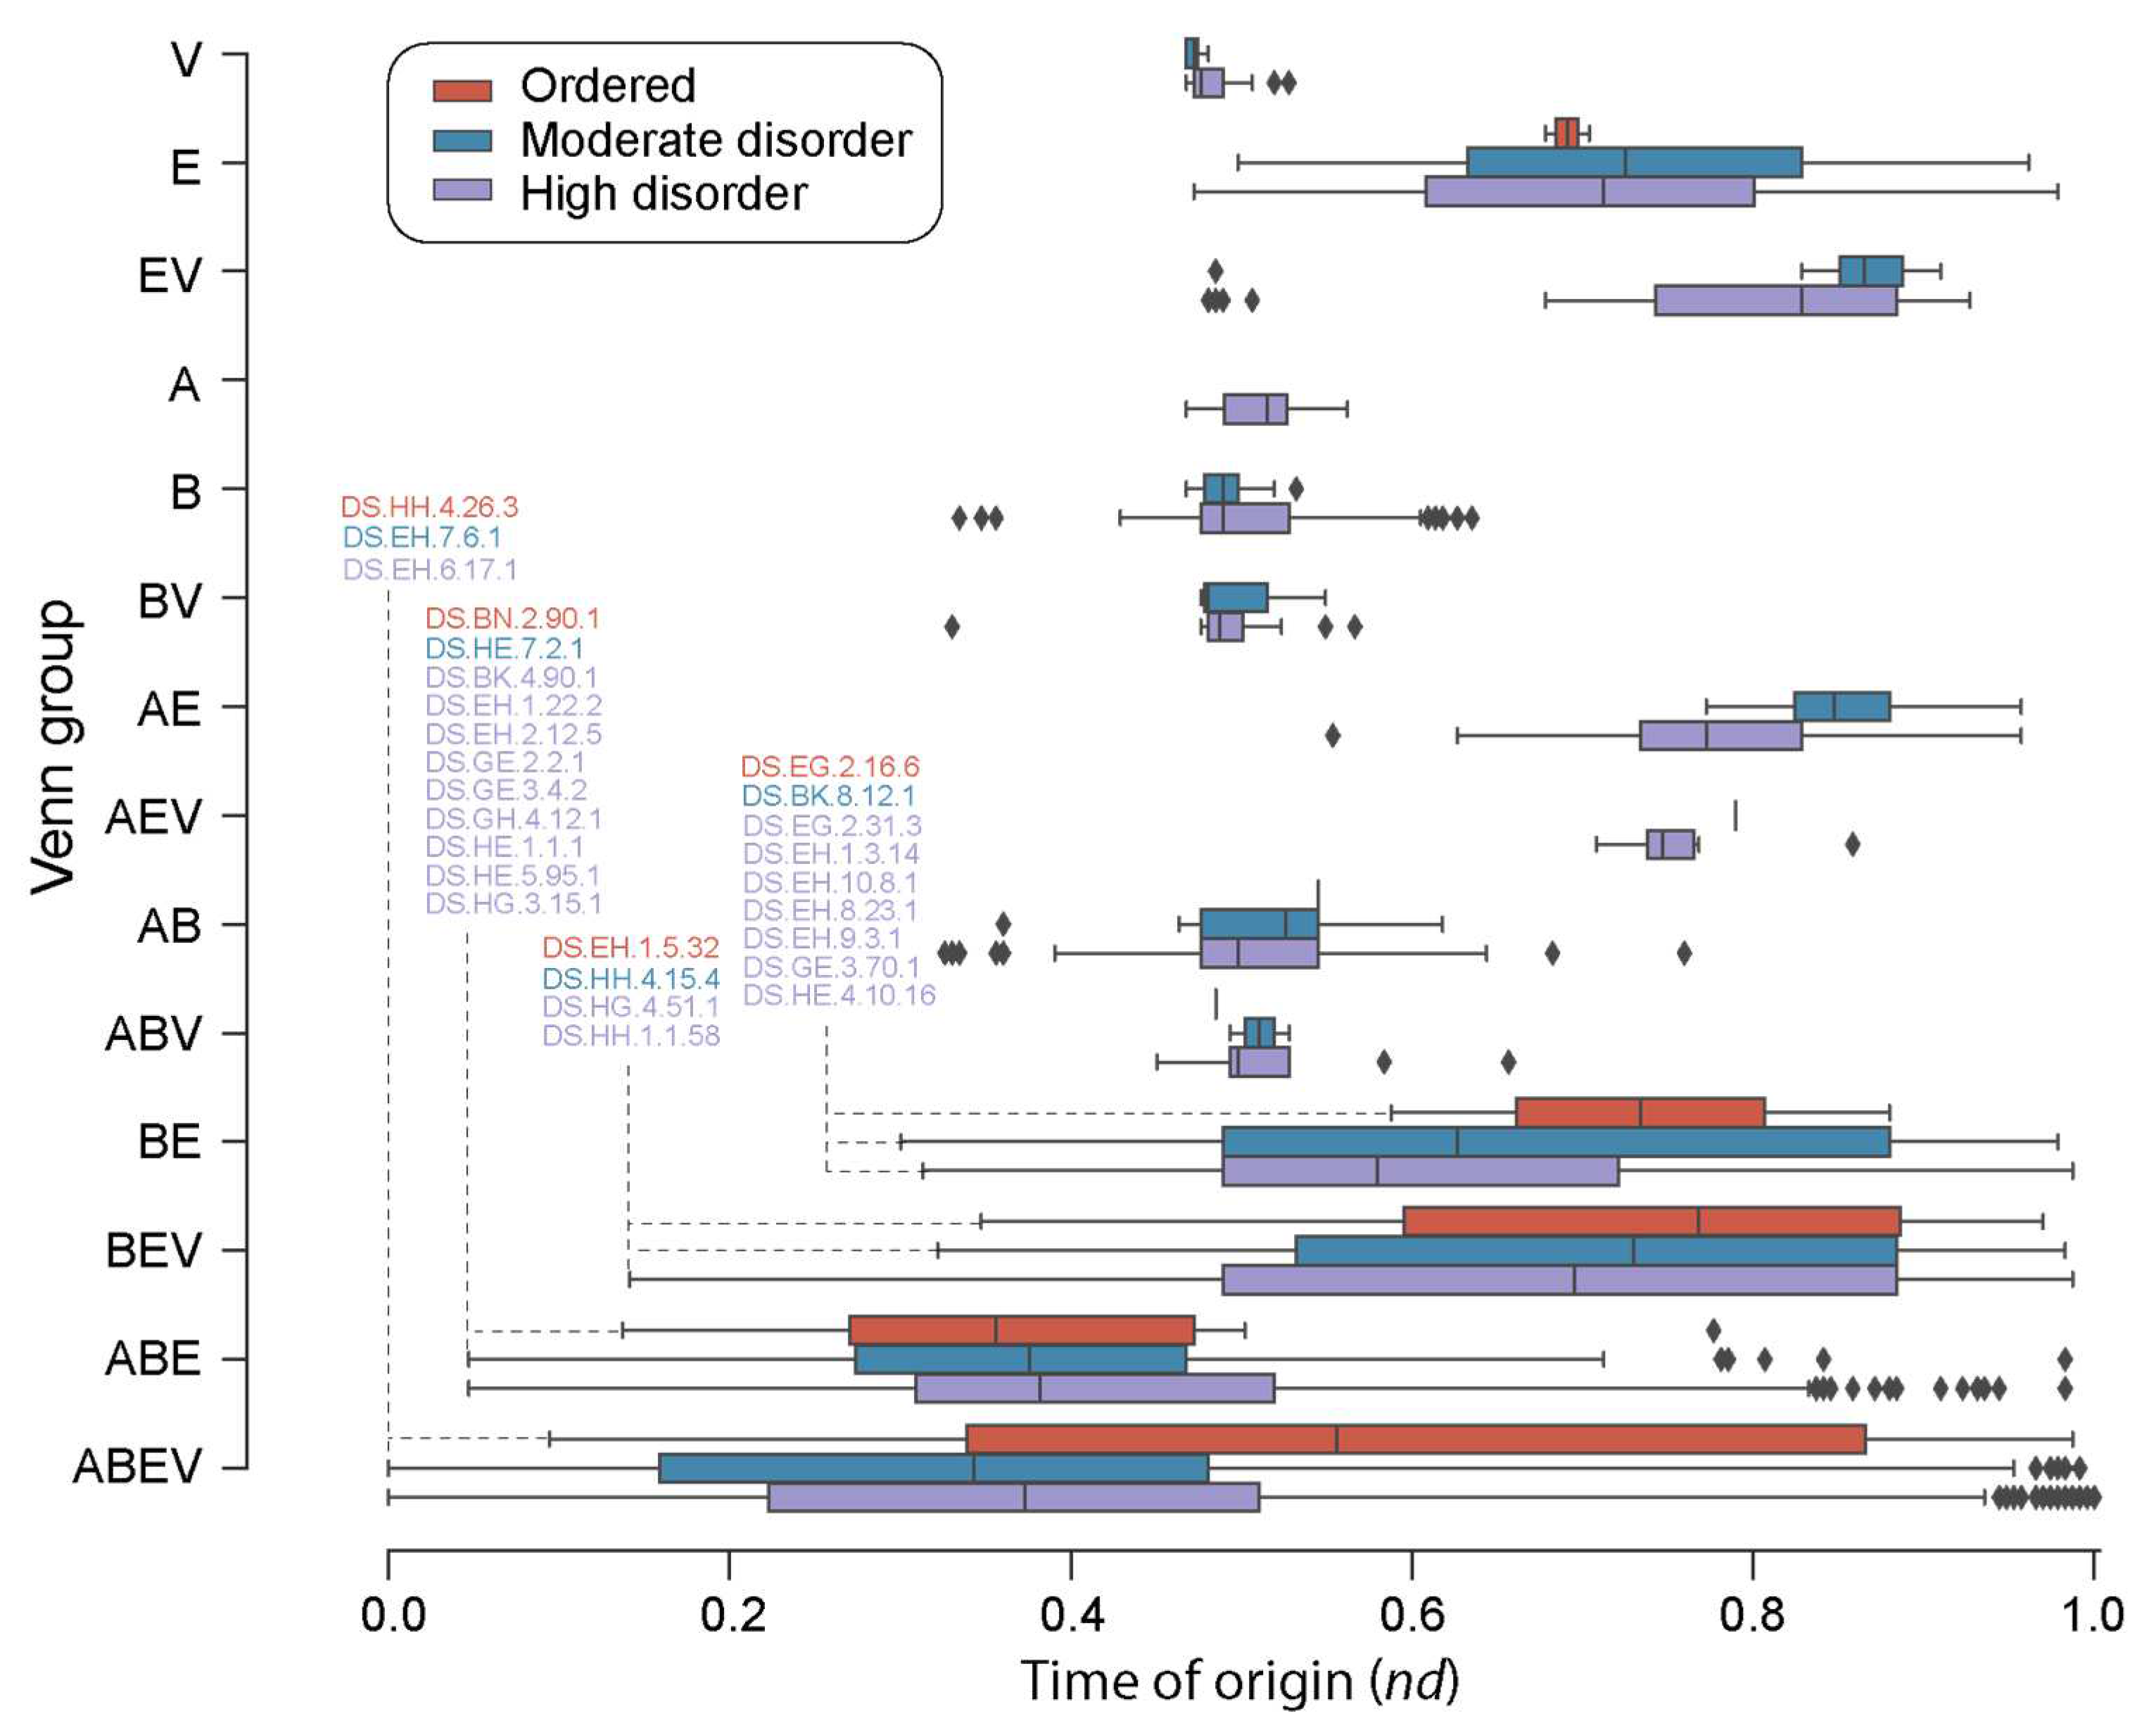
Figure 5.
A chronology of loop prototypes categorized by structural types and magnitude of disorder. The time of origin of each prototype is given as an evolutionary age measured in node distance (nd) units.
Figure 5.
A chronology of loop prototypes categorized by structural types and magnitude of disorder. The time of origin of each prototype is given as an evolutionary age measured in node distance (nd) units.

Figure 6.
Disorder in loop prototypes grouped on the basis of molecular function. (a) Distribution of mean disorder scores by loop type (Table 1). (b) Slopegraph describing percentages of each loop type in each molecular function in the sampled dataset. Molecular functions are mapped to loop architectures through their corresponding SCOP FFs.
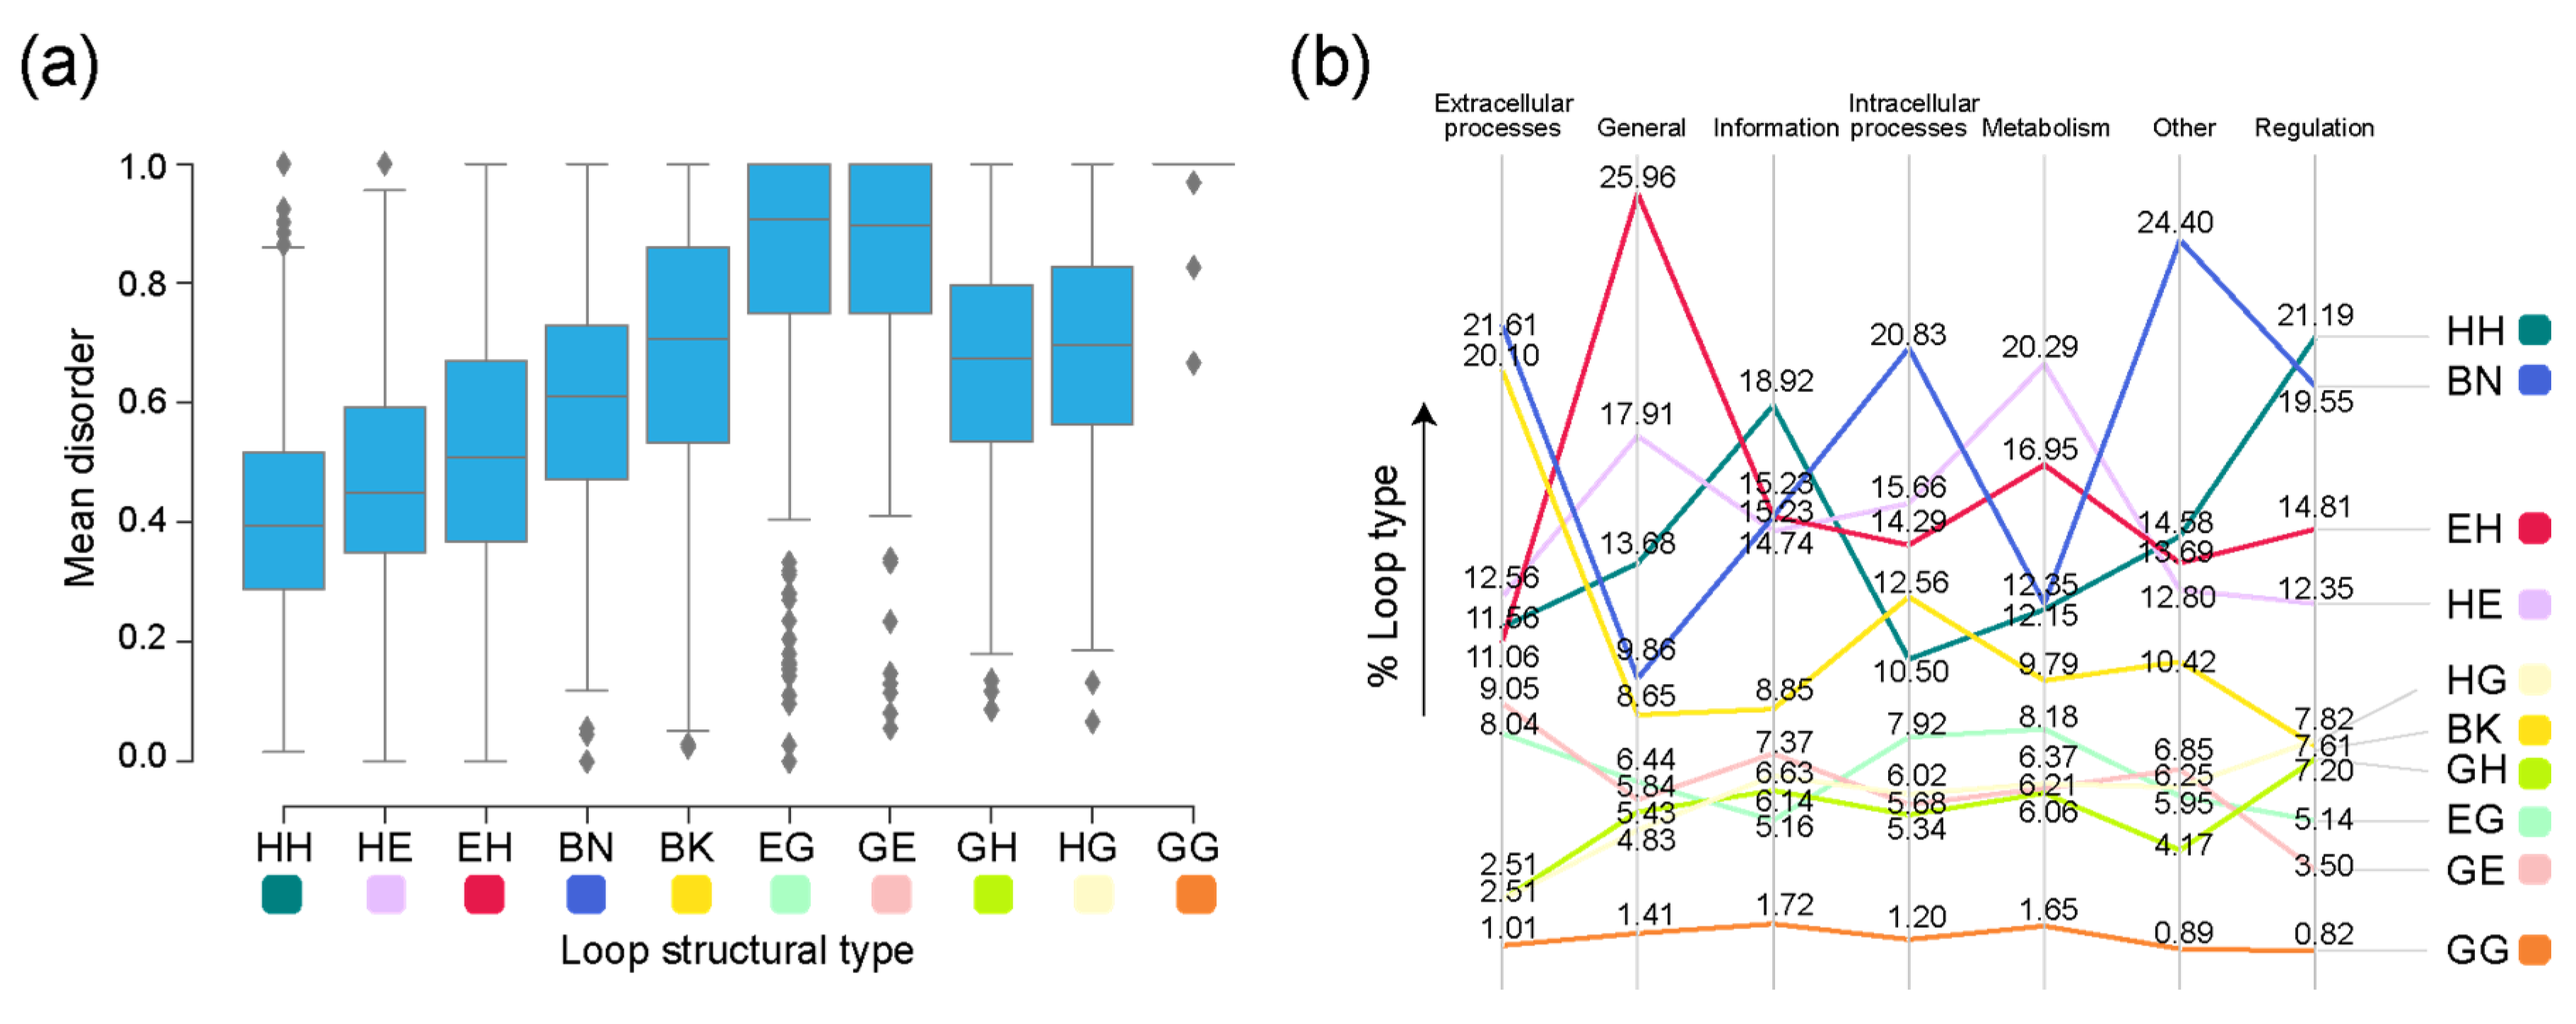
Figure 7.
A chronology of loop prototypes categorized by molecular function and magnitude of disorder. The time of origin of each prototype is given as an evolutionary age measured in node distance (nd) units.
Figure 7.
A chronology of loop prototypes categorized by molecular function and magnitude of disorder. The time of origin of each prototype is given as an evolutionary age measured in node distance (nd) units.
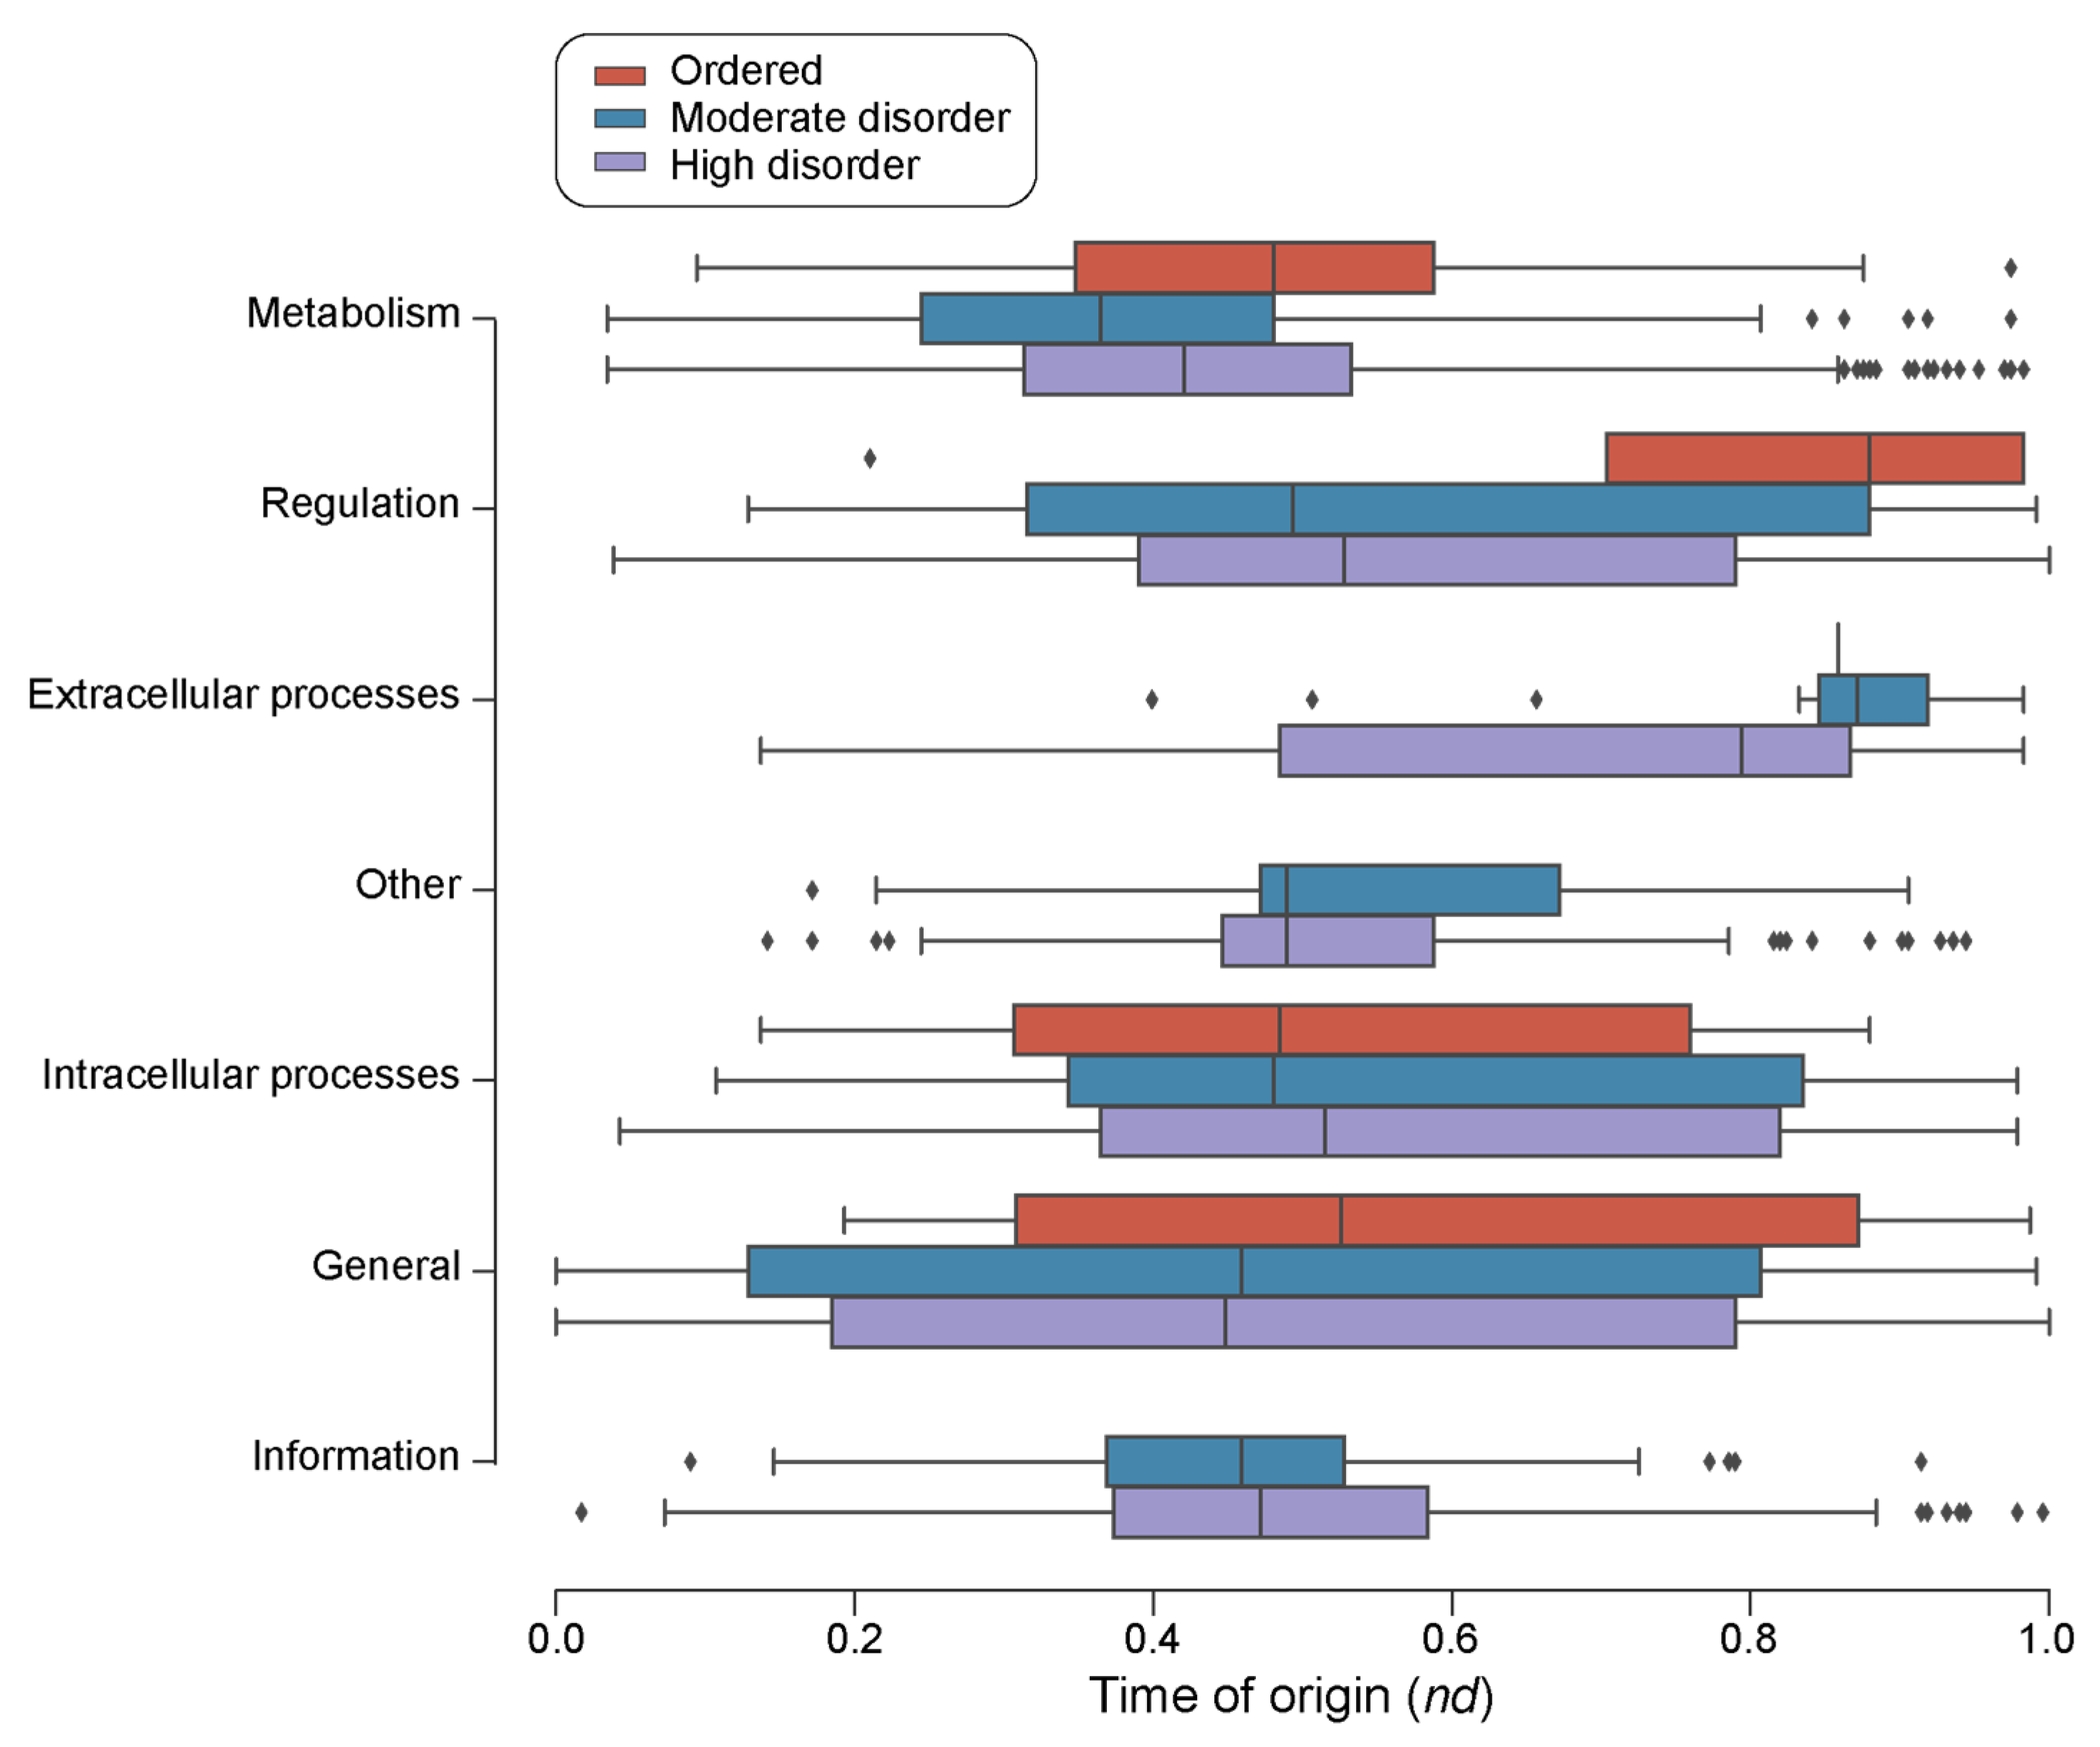
Figure 8.
An evolutionary chronology of the structural properties of loop prototypes. The time of origin of each prototype is given as an evolutionary age measured in node distance (nd) units. (a) Distribution of loop lengths along the evolutionary timeline. (b) Distribution of loop length, average N-terminus and C-terminus lengths in an architecture along the binned evolutionary timeline. Note that ArchDB classification has loop lengths of ‘zero’ that represent architectures with no aperiodic residues, representing shifts and transitions between different secondary structures [19]. (c) Distribution of average geometric measures of structures in a loop architecture in evolutionary time. Geometric measures include distance, and delta (hoist), theta (packing), and rho (meridian) angles (Figure 1B).


Table 1.
Structural types of loop prototypes in ArchDB [19].
Table 1.
Structural types of loop prototypes in ArchDB [19].
| Type | Bracing Secondary Structure |
|---|---|
| HH | alpha-alpha |
| HE | alpha-beta |
| EH | beta-alpha |
| BN | beta-beta hairpin |
| BK | beta-beta link |
| EG | beta-helix310 |
| GE | helix310-beta |
| GH | helix310-helix |
| HG | helix-helix310 |
| GG | helix310-helix310 |
Table 2.
P-values from Conover’s test for pairwise comparison (preceded by rejection of null hypothesis with the Kruskal-Wallis test at p-value = 6.045 × 10−45). CCP, coiled coil proteins; MCS, membrane and cell surface; MD, multi-domain (α and β); SP, small proteins.
Table 2.
P-values from Conover’s test for pairwise comparison (preceded by rejection of null hypothesis with the Kruskal-Wallis test at p-value = 6.045 × 10−45). CCP, coiled coil proteins; MCS, membrane and cell surface; MD, multi-domain (α and β); SP, small proteins.
| SCOP class | all-α | all-β | α+β | α/β | CCP | MCS | MD | SP |
|---|---|---|---|---|---|---|---|---|
| all-α | -1 | 3.45 × 10−44 | 1.76 × 10⁻²⁰ | 4.62 × 10⁻¹⁰ | 1 | 1 | 0.04501 | 4.66 × 10⁻⁵ |
| all-β | 3.45 × 10−44 | -1 | 1.21 × 10⁻⁸ | 4.36 × 10⁻²⁴ | 0.31539 | 0.00021 | 0.00023 | 1 |
| α+β | 1.76 × 10⁻²⁰ | 1.21 × 10⁻⁸ | -1 | 0.00038 | 1 | 0.32722 | 1 | 1 |
| α/β | 4.62 × 10⁻¹⁰ | 4.36 × 10⁻²⁴ | 0.00038 | -1 | 1 | 1 | 1 | 0.48768 |
| CCP | 1 | 0.31539 | 1 | 1 | -1 | 1 | 1 | 1 |
| MCS | 1 | 0.00021 | 0.32722 | 1 | 1 | -1 | 1 | 0.35386 |
| MD | 0.04501 | 0.00023 | 1 | 1 | 1 | 1 | -1 | 1 |
| SP | 4.66 × 10⁻⁵ | 1 | 1 | 0.48768 | 1 | 0.35386 | 1 | -1 |
Table 3.
Highly enriched GO “biological process” terms in FFs of 48 ‘ordered’ loop prototypes and a probability score equal to 1 in the Structural Domains Annotation Database (SDADB) [55].
Table 3.
Highly enriched GO “biological process” terms in FFs of 48 ‘ordered’ loop prototypes and a probability score equal to 1 in the Structural Domains Annotation Database (SDADB) [55].
| GO ID | GO description |
|---|---|
| GO:0000082 | G1/S transition of mitotic cell cycle |
| GO:0005975 | carbohydrate metabolic process |
| GO:0006099 | tricarboxylic acid cycle |
| GO:0006260 | DNA replication |
| GO:0006351 | transcription, DNA-templated |
| GO:0006355 | regulation of transcription, DNA-templated |
| GO:0006508 | proteolysis |
| GO:0006511 | ubiquitin-dependent protein catabolic process |
| GO:0006631 | fatty acid metabolic process |
| GO:0006633 | fatty acid biosynthetic process |
| GO:0006955 | immune response |
| GO:0007165 | signal transduction |
| GO:0009058 | biosynthetic process |
| GO:0009186 | deoxyribonucleoside diphosphate metabolic process |
| GO:0009405 | pathogenesis |
| GO:0015696 | ammonium transport |
| GO:0015976 | carbon utilization |
| GO:0019646 | aerobic electron transport chain |
| GO:0030245 | cellulose catabolic process |
| GO:0031388 | organic acid phosphorylation |
| GO:0043401 | steroid hormone mediated signaling pathway |
| GO:0055114 | oxidation-reduction process |
| GO:0072488 | ammonium transmembrane transport |
Disclaimer/Publisher’s Note: The statements, opinions and data contained in all publications are solely those of the individual author(s) and contributor(s) and not of MDPI and/or the editor(s). MDPI and/or the editor(s) disclaim responsibility for any injury to people or property resulting from any ideas, methods, instructions or products referred to in the content. |
© 2023 by the authors. Licensee MDPI, Basel, Switzerland. This article is an open access article distributed under the terms and conditions of the Creative Commons Attribution (CC BY) license (http://creativecommons.org/licenses/by/4.0/).
Copyright: This open access article is published under a Creative Commons CC BY 4.0 license, which permit the free download, distribution, and reuse, provided that the author and preprint are cited in any reuse.
supplementary.zip (1.42MB )
Submitted:
13 September 2023
Posted:
19 September 2023
You are already at the latest version
Alerts
A peer-reviewed article of this preprint also exists.
supplementary.zip (1.42MB )
This version is not peer-reviewed
Submitted:
13 September 2023
Posted:
19 September 2023
You are already at the latest version
Alerts
Abstract
Intrinsic disorder accounts for the flexibility of protein loops, molecular building blocks that are largely responsible for the processes and molecular functions of the living world. While loops likely represent early structural forms that served as intermediates in the emergence of protein structural domains, their origin and evolution remains poorly understood. Here, we conduct a phylogenomic survey of disorder in loop prototypes sourced from the ArchDB classification. Tracing prototypes associated with protein fold families along an evolutionary chronology revealed ancient prototypes tended to be more disordered than their derived counterparts, with ordered prototypes developing later in evolution. This highlights the central evolutionary role of disorder and flexibility. While mean disorder increased with time, a minority of ordered prototypes exist that emerged early in evolutionary history, possibly driven by the need to preserve specific molecular functions. We also revealed percolation of evolutionary constraints from higher to lower levels of organization. Percolation resulted in trade-offs between flexibility and rigidity that impacted prototype structure and geometry. Our findings provide a deep evolutionary view of the link between structure, disorder, flexibility and function, as well as insights into the evolutionary role of intrinsic disorder in loops and their contribution to protein structure and function.
Keywords:
Subject: Biology and Life Sciences - Biochemistry and Molecular Biology
1. Introduction
Intrinsically disordered regions (IDRs) are functionally important regions of proteins that lack stable structural integrity, are abundant in eukaryotic and viral proteomes, and are widely present in archaea and bacteria [1]. In addition to their deviant sequence behavior, IDRs display distinctive biophysical properties in terms of sequential, structural and spatiotemporal heterogeneity to qualify as ‘edge of chaos’ systems [2]. The flexibility of IDRs due to such heterogenous properties endows them with a functional advantage over their structured counterparts that enables participation in complex biological functions, such as recognition, regulation and signaling [3]. However, the behavior of these ‘edge of chaos’ systems is sensitive to environmental perturbations and mutations that can lead to misidentification and mis-signaling. Such dysfunction of IDRs has been observed to play a role in amyloidosis, cancer, cardiovascular disorders, and neurodegenerative diseases [3]. Therefore, evolutionary forces act on such ‘non- regular secondary structure regions’ to preserve biological function [4,5].
Remarkably, IDR dynamic behavior is evolutionarily conserved, despite low sequence conservation [5]. Furthermore, flexibility is conserved in proteins [6]. Thus, measuring intrinsic disorder can quantify the inherent flexibility of proteins. Protein loops, the major contributors to structural flexibility, are a source of functional heterogeneity and are therefore important to understanding the relationship between function and flexibility [7,8]. Furthermore, the functional activities of proteins have been proposed to be determined by the molecular functions of loops known as ‘elementary functional loops’ (EFLs) [9]. The EFLs are enriched in amino acid residues responsible for a specific function, with abundant sets of prototypes, including the p-loop prototype responsible for a majority of enzymatic functions [10]. EFLs have proven useful in studying evolution of protein function in archaeal organisms, suggesting the use of loop classification systems are a promising route to understanding functional innovation by the reuse of such components in different molecular contexts [11]. In fact, coupling EFLs with network science has provided evolutionary insights into the formation of complex protein structures through the recruitment of loops [12]. Disorder in proteins has been extensively studied at the proteomic level [13,14,15,16] and to a limited extent at the protein domain level [17]. However, disorder in loop structures, one of the most granular levels of the hierarchy of molecular structure, remains least explored despite being fundamental contributors to the flexibility in proteins.
A previous exploration of contact order in proteins, which is correlated to structural flexibility, showed that there are important evolutionary constraints acting on folding speed [18]. It showed folding speed increases in evolution. An evolutionary study of loops with network approaches that traced the birth of structural domains from loop structures has been conducted in a separate study [19]. Here, we investigate the evolution of disorder at the protein loop level, one of the lowest levels of organization in biological molecular systems. We surveyed thousands of loop prototypes derived from ArchDB [20] and traced their evolutionary history by mapping them to the history of the corresponding domains defined at the fold family (FF) level of structural abstraction of SCOP [21]. This evolutionary history is based on reliable phylogenomic reconstruction methods that are relatively robust to high mutation rates, horizontal gene transfer, and genetic mosaicism when compared to traditional sequence methods [22].
2. Materials and Methods
We performed intrinsic disorder analysis of loop structures associated with loop prototypes classified by the ArchDB database [20]. Loop prototypes (Figure 1) define the ArchDB classification based on a set of geometric properties, with the following naming scheme (Figure 1a): clustering method used, ‘type’ of bracing secondary structures (Table 1), length of the unstructured loop region between the bracing secondary structures, class and subclass [20]. Two types of clustering methods have been used for classification in ArchDB: Density Search (DS) and Markov Clustering (MCL). Both methods classify loop lengths differently. The DS algorithm is stringent with classification of loops because it allows only fixed ‘length’ of loops to be grouped together, while MCL allows for variation. A class clusters loops with the same conformation of the loop region, while a subclass groups loops with a common geometry (Figure 1b).
A loop structure is the region in a protein data bank (PDB) structure annotated with a loop prototype, named by its parent PDB structure, chain and location of its first residue in the parent structure; e.g., the loop in Figure 1b is part of chain A of PDB entry 4ETP, beginning at residue 448.
The loop structural dataset of ArchDB [20] holds 190,573 classified loop structures out of a total of 306,726 reported loops. The dataset associated with Density Search (DS) loop prototypes, which holds 125,824 loops, was filtered using mappings of FFs to loop prototypes at e-value < 0.001. This resulted in 88,321 loop structures corresponding to 7,110 unique DS prototypes. Note that each loop structure in ArchDB has one loop prototype annotation associated with it for a particular classification system (DS, in our case). However, many-to-many annotations exist between loop prototypes and SCOP FFs. We mapped the SCOP FFs from ArchDB to those in our phylogenomic timeline, followed by retaining loop prototypes mapped to only one SCOP FF. This resulted in 5,125 loop prototypes mapped to 1,965 FFs (Table S1). We then transferred times of origin of SCOP FFs to the associated loop prototypes as previously described [19]. These evolutionary ages were measured as node distances (nd) extracted from a published phylogenomic tree reconstructed from a genomic census of FFs in 8,127 proteomes belonging to the three superkingdoms of life and viruses [23], using thoroughly tested phylogenomic protocols [24,25]. Cellular organisms were represented by 139 archaeal, 1,734 bacterial, and 210 eukaryal proteomes. The virus supergroup was represented by 6,044 viral proteomes [26]. Figure S1 describes the general experimental workflow that was utilized to build the published phylogenomic tree and the annotated loop chronologies of this study.
Structural disorder was computed using a local copy of the IUPRED software with the ‘short’ disorder option [27]. A residue was categorized as disordered if it scored above a threshold of 0.5. Disorder of a loop structure was calculated as a fraction of the disordered residues to the total number of residues. The mean disorder for each loop prototype was the average of disorder scores for individual loop structures associated with each loop prototype:
A loop prototype was classified as ‘ordered’ if its mean disorder score was from 0 to 0.1, ‘moderate disorder’ with a mean disorder score from 0.1 to 0.3 and ‘high disorder’ with scores greater than 0.3.
3. Results
We conducted disorder analysis on 5,125 loop prototypes associated with 1,965 FFs. FFs were annotated with times of origin (evolutionary ages given as nd values) derived from a genomic census of 8,127 proteomes from the three superkingdoms and viruses. The evolutionary ages are based on phylogenomic methods benchmarked by well over a decade of research and experimentation [28,29,30,31,32,33,34]. We inspected disorder and various structural and geometric properties of loop prototypes in superkingdoms and viruses, indexed their associated molecular functions, and explored the evolutionary spread of prototypes in a phylogenomic timeline.
There appears to be a sharp decline in mean disorder scores with an increase in mean loop structure length (Figure 2a). However, while the median of mean disorder scores gradually increased with time of origin, the median of mean length of the loop structure was steady throughout the timeline (Figure 2b). As expected, loops with high disorder outnumbered those with moderate and low disorder as their accumulation rates increased and decreased in the timeline (Figure 2c). Interestingly, the medians of mean disorder score of loop prototypes in SCOP classes showed a general increase with age (Figure 2b). Following a rejection of the null hypothesis of all medians being the same by the Kruskal-Wallis H test [35], the Conover’s test of multiple comparisons [36] indicated that the pairwise comparison of the four major classes of domains in SCOP, namely, all-α, all-β, α+β, and α/β, showed a significant difference in medians (Table 2). Mean disorder increased according to the sequence: all-α < α+β < α/β < all-β (Figure 2d). Moreover, out of the 48 ‘ordered’ loop prototypes, 18 belonged to FFs from the α/β class, followed by 11 from all-α, 7 from α+β, 5 from all-β, and 7 belonging to rest of the classes (Table S2).
A four-set Venn diagram of loop prototypes in superkingdoms and viruses showed a high number of loop prototypes associated with the ABEV and ABE Venn groups (Figure 3a). The α-β type ‘HE’ claimed the highest percentages of loop types present in each superkingdom and the viral supergroup (Figure 3b). The distribution of loop types appeared to follow a similar trend for all superkingdoms and viruses.
A closer inspection of the distribution of loop prototypes belonging to FFs of each Venn group (Figure 4) along the evolutionary timeline revealed patterns of first origin matching those observed for FFs. As a general trend, ‘ordered’ prototypes (Table S2) appeared later than high and moderate disorder prototypes, with 39 ‘ordered’ prototypes appearing around and after nd = 0.4. Highly and moderately disordered prototypes appeared concurrently (roughly at a same time) for the ABEV, ABE, EV, and V groups. However, moderately disordered prototypes appeared earlier than highly disordered ones in the FFs of the BE group. Interestingly, the A Venn group had only high disorder loop prototypes. Evolutionary tracings also showed that while high disorder prototypes were present in all Venn groups (except AV), 24 of the 48 ‘ordered’ prototypes were only present in the FFs of the ABEV group, followed by 13 present in ABE, 4 in BEV, 2 in AB, 2 in BE, 2 in E and 1 in ABV (Table S2).
The distribution of loop structural ‘types’ along the evolutionary timeline showed that all types appeared very early in evolution. The ‘DS.EH.6.17.1’ and ‘DS.EH.7.6.1’ prototypes appeared the earliest together with the most ancient ‘ABC transporter ATPase domain-like’ FF (c.37.1.12) (Figure 5). Highly and moderately disordered prototype types α-α (HH) and β-α (EH) appeared approximately at the same time. Except for the helix 310-helix 310 (GG) prototypes, all other ‘types’ had both ordered and moderately disordered prototypes. For the remaining seven types, highly ordered prototypes appeared earlier than both moderately disordered and ordered prototypes. There were 13 ‘ordered’ prototypes associated with the HH type, followed by 9 with EH, 7 with BK, 6 with HE, 5 with EG, 4 with BN, 2 with GE, and 1 each with HG and GH.
The median values for mean disorder scores by structural type were the highest for the helix 310-containing GG, EG, and GE prototypes, with a left skew in their respective distributions (Figure 6a). To assess whether higher disorder scores for specific types were associated with the molecular function of the FFs they belong to, we inspected the distribution of structural types for each molecular function (Figure 6b). Some of the functional categories showed a preference for certain types of prototypes. The β-β hairpin (BN) type comprised the highest number of prototypes present in FFs belonging to the ‘Intracellular processes’, ‘Extracellular processes’, and ‘Other’ categories. The α-α (HH) type dominated the distribution in FFs in both ‘Information’ and ‘Regulation’. The FFs associated with the ‘General’ and ‘Metabolism’ functional categories were associated with a high number of EH and HE types, respectively.
The survey of loop prototypes by disorder categories in molecular function showed that ‘Information’ and ‘Other’ were the only categories with no associated ‘ordered’ prototypes (Figure 7). Out of the 48 ‘ordered’ prototypes, 29 belonged to ‘Metabolism’ FFs, followed by 7 to ‘Intracellular processes’ FFs, 6 to ‘General’ FFs, 5 to ‘Regulation’ FFs and 1 to ‘Extracellular processes’ FFs (Table 3). A Gene Ontology (GO) enrichment analysis of the FFs with ordered prototypes showed that these FFs are highly enriched in activities mainly related to metabolism, transport, and DNA transcription as well as pathogenesis and immune response (Table 3). Highly and moderately disordered prototypes appeared approximately at the same time in the FFs belonging to ‘Metabolism’ and ‘General’. For FFs with ‘Regulation’, ‘Intracellular processes’, and ‘Extracellular processes’ molecular functions, highly disordered prototypes appeared earlier than moderately disordered and ordered prototypes.
Loop prototypes with smaller lengths of the loop region, ranging 1–7, were widespread throughout evolutionary time, while longer prototypes were part of FFs that appeared relatively late in evolution (Figure 8a). The average length for N-terminus and C-terminus of prototypes showed consistent distribution with little variation throughout the timeline. Similarly, geometric properties of prototypes, namely, hoist (delta) and packing (theta) angles, and distance were spread consistently throughout evolutionary time. However, the median values for meridian (rho) angles showed an increase with time, while the Euclidean distance (D) between the boundaries of aperiodic structures showed a slight decrease (Figure 8b).
4. Discussion
Protein loops constitute a diverse group of molecular building blocks made of helix, strand, and coil segments that are largely responsible for the processes and molecular functions of the living world [37]. They can interact with solvent, ligand and other molecules, establishing a wide range of dynamic behaviors, from static to highly plastic. From an evolutionary perspective, loops likely represent prior structural states, intermediate evolutionary forms responsible for the emergence of structural domains in proteins [19]. Here we study loop flexibility by surveying intrinsic disorder and following its evolution. We focus on loop prototypes, supersecondary motifs bracing nonregular aperiodic regions sourced from the ArchDB database, a library that has sampled all loop geometries and should be considered essentially complete [38]. Two types of prototypes exist, those that are modular and are recruited throughout evolution, and those that are non-modular and are recruited into domains only once [19]. To offset the confounding effects of recruitment, we here focus on the latter. Our analysis revealed the central evolutionary role of disorder and flexibility, the unexpected evolutionary rise of structural order, and evolutionary constraints percolating from higher to lower levels of biological organization leading to trade-offs between flexibility and rigidity and impacts on the structure and geometry of prototypes.
4.1. The evolutionary centrality of loop disorder and flexibility
We find that loop prototypes of ancient FFs were always more disordered than their derived counterparts and that ordered prototypes developed later in evolution. These patterns were present when indexing timelines with Venn groups of prototype distribution in superkingdoms and viruses (Figure 4), types of bracing secondary structures (Figure 5), or annotated molecular functions (Figure 7). Furthermore, we find mean disorder increased in evolution (Figure 2b) and was widely present in prototypes throughout the timeline (Figure 2c). This was an expected outcome given that flexibility and intrinsic disorder are linked phenomena and that protein folding speed is correlated with flexibility and is evolutionarily optimized to increase in time [18]. However, significant differences in mean disorder distributions of the four major SCOP classes, namely the α/β, α+β, all-α and all-β proteins, were detected (Figure 2d), suggesting there are evolutionary constraints acting both across levels of biological organization and within systems. This is by no means surprising. SCOP classes are known to harbor deep phylogenomic signatures in their makeup (reviewed in [39]).
4.2. The unexpected evolutionary rise of order in loop structure
Remarkably, our analysis reveals the presence of a significant number of ‘ordered’ loop prototypes (Table S2) developing later than disordered prototypes but quite early in evolutionary history (Figure 4). The existence of ordered loops poses the question of the purpose of their existence. A potential explanation is the preservation of molecular functions that require a certain amount of structural integrity, which then becomes evolutionarily ‘canalized’ into conserved regions. As an example, consider two RIG-I-like receptors (RLRs), RIG-I and MDA5, which play a vital role in vertebrate antiviral defense [40]. Both receptors share high sequence similarity but perform nonredundant functions, as each receptor recognizes different types of double-stranded RNA (dsRNA) viruses [41]. Differential flexibility of a loop that is rigid in RIG-I, but highly disordered in MDA5, enables each receptor to perform its respective sensory functions. Remarkably, we see an enrichment of immune response biological processes in ordered prototypes (Table 3). Similarly, pathogenesis-related class 10 (PR10) proteins, found in plants in response to stress-inducing factors, are hypothesized to play a role in defense against plant pathogens [42]. The PR10 proteins possess a glycine-rich L4 loop, similar to the highly flexible P-loop present in many proteins. However, the L4 loop is found to have unusual rigidity, where it differs from the P-loop, despite its high glycine content [42].
4.3. Percolation of evolutionary constraints from higher to lower levels of organization
Eukaryotic and viral proteomes have relatively higher disorder than those belonging to archaea and bacteria [14]. To dissect patterns of sharing and spread of high disorder in loop prototypes we analyzed their association to FFs in superkingdoms and viruses. The presence of all structural types of prototypes in the ancient and universal core shared by all life (the ABEV Venn group), different patterns of prototype accumulation in Venn groups of superkingdoms and viruses (Figure 3), and patterns of accumulation along the evolutionary chronology of prototypes (Figure 4) have important implications to our understanding of evolution of intrinsic disorder. First, findings suggests that all ‘types’ of prototypes were abundant in ancient cells and viruses. A wide variety of prototype building blocks were therefore available in the early protein world to make more complex structure. Second, over time, some lineages appeared to have lost certain types of prototypes that were not useful to them. Instead, they favored and retained prototypes that provided them with an evolutionary advantage, most likely in terms of survival and reproduction. Indeed, short disordered regions in the ‘context’ of a protein enable or complement the function of a structured domain and sometimes, act as a separate functional modules [43]. Remarkably, the absence of certain structural types of prototypes in the A, ABV, AEV, BV and EV Venn groups coincides with the branching of major organismal lineages and viruses. It also suggests that evolutionary constraints at higher proteomic and structural domain levels are percolating at lower levels to impact the evolutionary spread of disorder. Likewise, ‘ordered’ prototypes, which developed later in time, served different purposes in prokaryotic microbes and viruses. Only prototypes shared by all life (ABEV), shared by cellular organisms (ABE), and shared by organisms with a same membrane phospholipid makeup (BE and BEV) developed ordered structures and did so late in evolution of their respective groups (Figure 4). Conversely, ordered prototypes were almost absent in prototypes specific to superkingdoms and viruses. In fact, only highly disordered prototypes were specific to Archaea, and most virus-specific and bacteria-specific prototypes showed only high or moderate disorder. This differential behavior appears to hold a strong historical signature that is indicative of constraints percolating from the organismal level to the loop structural level.
4.4. Evolutionary percolation and trade-offs between flexibility and rigidity in loop behavior
We note that there is considerable variation in the distribution of disorder in all ten structural types of loop prototypes (Figure 6). Flexibility is critical to the functioning of proteins [44]. It is therefore expected that the differential flexibility of types of prototypes will be differentially adopted by categories of molecular function. Indeed, some functional categories prefer loops bearing certain structural types (Figure 6). For example, prototypes associated with ‘Metabolism’ and ‘General’ possessed a high number of ordered prototypes (Figure 7). This observation can be reconciled with the finding that enzymes require a balance of structural rigidity and flexibility in order to carry out their functions [45]. High flexibility may lead to conformational states that hinder enzymatic activity, interfering with enzyme-substrate interactions. Conversely, FFs from ‘Extracellular processes’ have a greater number of flexible loops of types β-β hairpin (BN) and β-β link (BK). The FFs of the sampled prototypes associated with ‘Extracellular processes’ are mostly associated with immune response, toxins and defense enzymes, and cell adhesion. Viruses have evolved disorder as means of evading host immune responses and for mimicking host functions [46,47]. This variation in disorder for different functional categories also indicates varying speeds of the evolutionary clock, depending on the nature of the function [48].
The early evolutionary rise of high levels of disorder in loop prototypes contrasts with evolution of disorder in the structural domains of proteins. A parallel analysis of intrinsic disorder in ~3,800 FFs that were present in the same 8,127 proteomes of superkingdoms and viruses examined in this study revealed ancient FFs were ordered and that disorder of structural domains evolved as a benefit acquired later in evolution (Mughal and Caetano-Anollés, ms. in preparation). Thus, loop-associated ‘short’ and domain-associated ‘long’ regions of disorder evolve differently across different levels of protein organization. We note that different evolutionary constraints acting at different levels of biological complexity are also observed in evolving metabolic networks where higher and lower levels of metabolic organization are under stringent evolutionary constraints, while the intermediate levels add ‘noise’, thus driving innovation holistically [49]. In fact, the prototypes of the most ancient structural domain, the ABC transporter ATPase domain-like’ FF (c.37.1.12) illustrate this interplay of constraints. The highly ordered structure of the c.37.1.12 FF (Figure 5) harbors the highly flexible and glycine-rich, phosphate-binding loop, the ‘P-loop’ [50], which we recently showed catalyzes convergence towards folded structure of the emerging domain [19]. This suggests evolutionary constraints requiring both relatively rigid domains and highly disordered loops are necessary to carry out function. This is indicative of evolutionary constraints percolating from the structural domain level to the loop structural level.
Long disordered regions are context-dependent such that their disorder-to-order conformations depend on the presence of specific binding partners or environmental elements, such as pH, redox potential, or temperature [51,52]. Similarly, short disorder regions would be expected to be context dependent in terms of flanking structures and protein contacts. In fact, short disordered regions exhibit behavior similar to regular secondary structure and are more resilient to mutations when compared to regions of long disorder that are highly sensitive to mutations, demonstrating that in contrast with short disorder, maintaining long disorder is evolutionarily nontrivial [53].
4.5. Evolutionary impact on loop structure and geometry
Finally, tracing the history of structural and geometric properties of loop prototypes along the evolutionary timeline provides additional insights (Figure 8). Loop length appeared to be the major source of evolutionary variability when compared to the lengths of N- and C-terminal bracing loop structures. This shows that indeed flexible regions of proteins are chiefly responsible for functional heterogeneity [8]. There was also slight variation in hoist (delta) and packing (theta) angles and distance measures of the prototypes along the timeline. Packing density is correlated to evolutionary rates at the protein level, but it varies slightly in evolution in the case of protein loops [54]. This is suggestive of evolutionary constraints acting to maintain hoist and packing in protein fragments with little variation, whilst introducing novelty by varying meridian (rho) angles.
5. Conclusions
Our study does not exclusively address intrinsic disorder. Instead, it focuses on studying disorder as proxy for surveying protein flexibility, an approach taken by other recent studies [43]. Results provide a deeper evolutionary view of the link between structure, disorder, flexibility and function. First, ancient loop prototypes tended to be more disordered than their derived counterparts, with ordered prototypes developing later in evolution. This highlights the central evolutionary role of disorder and flexibility. Second, there was an unexpected emergence of ordered prototypes early in evolutionary history, possibly driven by the need to preserve specific molecular functions. Third, the study uncovered percolation of evolutionary constraints from higher to lower levels of biological organization. This percolation influenced the spread of disorder in prototypes. Fourth, the analysis revealed trade-offs between flexibility and rigidity in loop behavior, with different functional categories preferring specific structural types. Finally, tracing the evolution of structural and geometric properties of loops revealed variations in loop length and geometry along the evolutionary chronology of prototypes. These findings provide valuable insights into the role of protein loops in evolution and their contribution to protein structure and function.
We conclude by acknowledging some limitations of our study. First, the accuracy of the disorder analysis relies on the precision of the available software, which introduces the possibility of false negatives and false positives in our analyses. Second, biases within databases, such as the presence of disordered structures in the PDB and, consequently, in ArchDB, may also act as limiting factors. Lastly, there are many-to-many mappings between loop prototypes and FFs with varying degrees of e-values in ArchDB. In our study, we opted for a stringent e-value of < 0.001, resulting in prototypes being mapped to only one FF at this e-value. While this choice may lead to missing some hits, it helps mitigate issues that could arise from a high number of false positives. In the future, addressing these limitations can be achieved by expanding database knowledge and enhancing prediction software accuracy.
Supplementary Materials
The following supporting information can be downloaded at the website of this paper posted on Preprints.org. Figure S1: General phylogenomic workflow utilized in this study; Table S1: Prototypes and their structural, functional and phylogenomic annotations; Table S2: List of ‘ordered’ loop prototypes mapped to SCOP FFs represented by their SCOP concise classification strings (ccs).
Author Contributions
Conceptualization, F.M. and G.C.-A.; methodology, F.M. and G.C.-A.; validation, F.M.; formal analysis, F.M.; investigation, F.M. and G.C.-A.; data curation, F.M.; writing—original draft preparation, F.M.; writing—review and editing, F.M. and G.C.-A.; visualization F.M. and G.C.-A.; supervision, G.C.-A.; project administration, G.C.-A.; funding acquisition, G.C.-A.
Funding
This research was funded by grants from the National Science Foundation (MCB-0749836 and OISE-1132791) and the United States Department of Agriculture (ILLU-802-909 and ILLU-483-625) and supported by Blue Waters supercomputer allocations from the National Center for Supercomputing Applications (NCSA) to GCA.
Data Availability Statement
The data presented in this study are openly available in the ArchDB (http://sbi.imim.es/archdb/), SCOP (https://scop.mrc-lmb.cam.ac.uk) and SCOPe (https://scop.berkeley.edu) repositories. Other data and information supporting the findings of this study are available within the article and its Supplementary Materials.
Acknowledgments
We acknowledge supercomputer support from the Illinois Campus Cluster Program.
Conflicts of Interest
The authors declare no conflict of interest. The funders had no role in the design of the study; in the collection, analyses, or interpretation of data; in the writing of the manuscript; or in the decision to publish the results.
References
- Uversky, V.N. A decade and a half of protein intrinsic disorder: Biology still waits for physics. Protein Sci. 2013, 22, 693–724. [Google Scholar] [CrossRef]
- Uversky, V.N. Unusual biophysics of intrinsically disordered proteins. Biochim. Biophys. Acta - Proteins Proteomics 2013, 1834, 932–951. [Google Scholar] [CrossRef] [PubMed]
- Uversky, V.N.; Oldfield, C.J.; Dunker, A.K. Showing your ID: Intrinsic disorder as an ID for recognition, regulation and cell signaling. J. Mol. Recognition 2005, 18, 343–384. [Google Scholar] [CrossRef]
- Liu, J.; Tan, H.; Rost, B. Loopy proteins appear conserved in evolution. J. Mol. Biol. 2002, 322, 53–64. [Google Scholar] [CrossRef] [PubMed]
- Daughdrill, G.W.; Narayanaswami, P.; Gilmore, S.H.; Belczyk, A.; Brown, C.J. Dynamic behavior of an intrinsically unstructured linker domain is conserved in the face of negligible amino acid sequence conservation. J. Mol. Evol. 2007, 65, 277–288. [Google Scholar] [CrossRef] [PubMed]
- Marsh, J.A.; Teichmann, S.A. Protein flexibility facilitates quaternary structure assembly and evolution. PLoS Biol. 2014, 12, e1001870. [Google Scholar] [CrossRef]
- Feller, S.M.; Lewitzky, M. What’s in a loop? Cell Commun. Signal 2012, 10, 31. [Google Scholar] [CrossRef]
- Espadaler, J.; Querol, E.; Aviles, F.X.; Oliva, B. Identification of function-associated loop motifs and application to protein function prediction. Bioinformatics 2006, 22, 2237–43. [Google Scholar] [CrossRef]
- Berezovsky, I.N.; Grosberg, A.Y.; Trifonov, E.N. Closed loops of nearly standard size: Common basic element of protein structure. FEBS Lett. 2000, 466, 283–286. [Google Scholar] [CrossRef]
- Goncearenco, A.; Berezovsky, I.N. Prototypes of elementary functional loops unravel evolutionary connections between protein functions. Bioinformatics 2010, 26, i497–503. [Google Scholar] [CrossRef]
- Goncearenco, A.; Berezovsky, I.N. Exploring the evolution of protein function in Archaea. BMC Evol. Biol. 2012, 12, 1–14. [Google Scholar] [CrossRef]
- Aziz, M.F.; Caetano-Anollés, K.; Caetano-Anollés, G. The early history and emergence of molecular functions and modular scale-free network behavior. Sci. Rep. 2016, 6, 25058. [Google Scholar] [CrossRef]
- Schad, E.; Tompa, P.; Hegyi, H. The relationship between proteome size, structural disorder and organism complexity. Genome Biol. 2011, 12, R120. [Google Scholar] [CrossRef] [PubMed]
- Xue, B.; Dunker, A.K.; Uversky, V.N. Orderly order in protein intrinsic disorder distribution: Disorder in 3500 proteomes from viruses and the three domains of life. J. Biomol. Struct. Dyn. 2012, 30, 137–149. [Google Scholar] [CrossRef]
- Xue, B.; Williams, R.W.; Oldfield, C.J.; Dunker, A.K.; Uversky, V.N. Archaic chaos: Intrinsically disordered proteins in Archaea. BMC Syst. Biol. 2010, 4, S1. [Google Scholar] [CrossRef] [PubMed]
- Basile, W.; Salvatore, M.; Bassot, C.; Elofsson, A. Why do eukaryotic proteins contain more intrinsically disordered regions? PLoS Comput. Biol. 2019, 15, e1007186. [Google Scholar] [CrossRef]
- Chen, J.W.; Romero, P.; Uversky, V.N.; Dunker, A.K. Conservation of intrinsic disorder in protein domains and families: II. functions of conserved disorder. J. Proteome Res. 2006, 5, 888–98. [Google Scholar] [CrossRef]
- Debès, C.; Wang, M.; Caetano-Anollés, G.; Gräter, F. Evolutionary optimization of protein folding. PLoS Comput. Biol. 2013, 9, e1002861. [Google Scholar] [CrossRef] [PubMed]
- Aziz, M.F.; Mughal, F.; Caetano-Anollés, G. Tracing the birth of structural domains from loops during protein eolution. Sci. Rep. 2023, 13, 14688. [Google Scholar] [CrossRef]
- Bonet, J.; Planas-Iglesias, J.; Garcia-Garcia, J.; Marín-López, M.A.; Fernandez-Fuentes, N.; Oliva, B. ArchDB 2014: structural classification of loops in proteins. Nucleic Acids Res. 2014, 42, D315–9. [Google Scholar] [CrossRef]
- Conte, L.L.; Ailey, B.; Hubbard, T.J.; Brenner, S.E. , Murzin, A.G. SCOP: a structural classification of proteins database. Nucleic Acids Res. 2000, 28, 257–259. [Google Scholar] [CrossRef]
- Caetano-Anollés, G.; Nasir, A. Benefits of using molecular structure and abundance in phylogenomic analysis. Front. Genet. 2012, 3, 172. [Google Scholar] [CrossRef] [PubMed]
- Mughal, F.; Nasir, A.; Caetano-Anollés, G. The origin and evolution of viruses inferred from fold family structure. Arch. Virol. 2020, 165, 2177–2191. [Google Scholar] [CrossRef]
- Kim, K.M.; Caetano-Anollés, G. The evolutionary history of protein fold families and proteomes confirms that the archaeal ancestor is more ancient than the ancestors of other superkingdoms. BMC Evol. Biol. 2012, 12, 13. [Google Scholar] [CrossRef]
- Kim, K.M.; Qin, T.; Jiang Y-Y.; Chen, L.L.; Xiong, M., Caetano-Anollees, D.; Zhang, H-Y.; Caetano-Anollés, G. (2012) Protein domain structure uncovers the origin of aerobic metabolism and the rise of planetary oxygen. Structure 2012, 20, 67–76. [CrossRef]
- Bao, Y.; Federhen, S.; Leipe, D.; Pham, V.; Resenchuk, S.; Rozanov, M.; Tatusov, R.; Tatusova, T. (2004) National center for biotechnology information viral genomes project. J. Virol. 2004, 78, 7291–7298. [Google Scholar] [CrossRef] [PubMed]
- Dosztányi, Z. Prediction of protein disorder based on IUPred. Protein Sci. 2018, 27, 331–340. [Google Scholar] [CrossRef] [PubMed]
- Wang, M.; Yafremava, L.S.; Caetano-Anollés, D.; Mittenthal, J.E.; Caetano-Anollés, G. Reductive evolution of architectural repertoires in proteomes and the birth of the tripartite world. Genome Res. 2007, 17, 1572–85. [Google Scholar] [CrossRef]
- Nasir, A.; Caetano-Anollés, G. A phylogenomic data-driven exploration of viral origins and evolution. Sci. Adv. 2015, 1, e1500527. [Google Scholar] [CrossRef]
- Kim, K.M.; Nasir, A.; Hwang, K.; Caetano-Anollés, G. A tree of cellular life inferred from a genomic census of molecular functions. J. Mol. Evol. 2014, 79, 240–262. [Google Scholar] [CrossRef]
- Caetano-Anollés, G. , Caetano-Anollés, D. An evolutionarily structured universe of protein prototype. Genome Res. 2003, 13, 1563–71. [Google Scholar] [CrossRef]
- Wang, M.; Caetano-Anollés, G. The evolutionary mechanics of domain organization in proteomes and the rise of modularity in the protein world. Structure 2009, 17, 66–78. [Google Scholar] [CrossRef]
- Wang, M.; Jiang, Y-Y. ; Kim, K.M.; Qu, G.; Ji, H-F.; Mittenthal, J.E.; Zhang, H-Y.; Caetano-Anollés, G. A universal molecular clock of protein folds and its power in tracing the early history of aerobic metabolism and planet oxygenation. Mol. Biol. Evol. 2011, 28, 567–82. [Google Scholar] [CrossRef]
- Kim, K.M.; Caetano-Anollés, G. The evolutionary history of protein fold families and proteomes confirms that the archaeal ancestor is more ancient than the ancestors of other superkingdoms. BMC Evol. Biol. 2012, 12, 13. [Google Scholar] [CrossRef]
- Kruskal, W.H.; Wallis, W.A. Use of ranks in one-criterion variance analysis. J. Am. Stat. Assoc. 1952, 47, 583–621. [Google Scholar] [CrossRef]
- Conover, W.J. Rank tests for one sample, two samples, and k samples without the assumption of a continuous distribution function. Ann. Stat. 1973, 1, 1105–1125. [Google Scholar] [CrossRef]
- Papaleo, E.; Saladino, G.; Lambrughi, M., Lindorff-Larsen. The role of protein loops and linkers in conformational dynamics and allostery. Chem. Rev. 2016, 116(11), 6391–6423. [Google Scholar] [CrossRef]
- Fernandez-Fuentes, N.; Dybas, J. M.; Fiser, A. Structural characteristics of novel protein folds. PLoS Comput. Biol. 2010, 6, e1000750. [Google Scholar] [CrossRef] [PubMed]
- Caetano-Anollés, G.; Wang, M.; Caetano-Anollés, G.; Mittenthal, J.E. The origin, evolution and structure of the protein world. Biochem. J. 2009, 417, 621–637. [Google Scholar] [CrossRef] [PubMed]
- Goubau, D.; Deddouche, S.; Reis e Sousa, C. Cytosolic sensing of viruses. Immunity 2013, 38, 855–869. [Google Scholar] [CrossRef] [PubMed]
- Wu, B.; Peisley, A.; Richards, C.; Yao, H.; Zeng, X.; Lin, C.; Chu, F.; Walz, T.; Hur, S. Structural basis for dsRNA recognition, filament formation, and antiviral signal activation by MDA5. Cell 2013, 152, 276–289. [Google Scholar] [CrossRef]
- Biesiadka, J.; Bujacz, G.; Sikorski, M.M.; Jaskolski, M. Crystal structures of two homologous pathogenesis-related proteins from yellow lupine. J. Mol. Biol. 2002, 319, 1223–1234. [Google Scholar] [CrossRef]
- Van Der Lee, R. , Buljan, M., Lang, B., et al. Classification of intrinsically disordered regions and proteins. Chem. Rev. 2014, 114, 6589–6631. [Google Scholar] [CrossRef] [PubMed]
- Marsh, J.A.; Teichmann, S.A. Parallel dynamics and evolution: Protein conformational fluctuations and assembly reflect evolutionary changes in sequence and structure. BioEssays 2014, 36, 209–218. [Google Scholar] [CrossRef] [PubMed]
- Kempf, J.G.; Jung, J.-J.; Ragain, C.; Sampson, N.S.; Loria, J.P. Dynamic requirements for a functional protein hinge. J. Mol. Biol. 2007, 368, 131–149. [Google Scholar] [CrossRef] [PubMed]
- Goh, G.K.M.; Dunker, A.K.; Uversky, V.N. Protein intrinsic disorder toolbox for comparative analysis of viral proteins. BMC Genomics. 2008, 9, S4. [Google Scholar] [CrossRef]
- Marín, M.; Uversky, V.N.; Ott, T. (2013) Intrinsic disorder in pathogen effectors: Protein flexibility as an evolutionary hallmark in a molecular arms race. Plant Cell 2013, 25, 3153–3157. [Google Scholar] [CrossRef]
- Brown, C.J.; Takayama, S.; Campen, A.M. , Vise, P.; Marshall, T.W.; Oldfield, C.J.; Williams, C.J.; Dunker, A.K. Evolutionary rate heterogeneity in proteins with long disordered regions. J. Mol. Evol. 2002, 55, 104–110. [Google Scholar] [CrossRef]
- Mughal, F.; Caetano-Anollés, G. MANET 3.0: Hierarchy and modularity in evolving metabolic networks. PLoS One 2019, 14, e0224201. [Google Scholar] [CrossRef]
- Romero Romero, M.L. , Yang, F., Lin, Y-R., Tawfik, D.S. Simple yet functional phosphate-loop proteins. Proc. Natl. Acad. Sci. USA 2018, 115, E11943–E11950. [Google Scholar] [CrossRef]
- Mészáros, B.; Erdos, G.; Dosztányi, Z. (2018) IUPred2A: context-dependent prediction of protein disorder as a function of redox state and protein binding. Nucleic Acids Res. 2018, 46, W329–W337. [Google Scholar] [CrossRef]
- Mohan, A.; Sullivan, W.J.; Radivojac, P.; Dunker, A.K.; Uversky, V.N. Intrinsic disorder in pathogenic and non-pathogenic microbes: Discovering and analyzing the unfoldomes of early-branching eukaryotes. Mol. Biosystems 2008, 4, 328–340. [Google Scholar] [CrossRef] [PubMed]
- Schaefer, C.; Schlessinger, A.; Rost, B. Protein secondary structure appears to be robust under in silico evolution while protein disorder appears not to be. Bioinformatics 2010, 26, 625–31. [Google Scholar] [CrossRef] [PubMed]
- Yeh, S-W. , Liu, J-W., Yu, S-H., Shih, C-H.; Hwang, J-K.; Echave, J. Site-specific structural constraints on protein sequence evolutionary divergence: local packing density versus solvent exposure. Mol. Biol. Evol. 2014, 31, 135–9. [Google Scholar] [CrossRef] [PubMed]
- Zeng, C.; Zhan, W.; Deng, L. SDADB: A functional annotation database of protein structural domains. Database 2018, 2018, bay064. [Google Scholar] [CrossRef]
Figure 1.
Definition of a loop in ArchDB [19]. (a) Classification hierarchy denoted by a loop prototype designation. The prototype is defined by the clustering method used, bracing secondary structures of the loop (type), the number of residues forming the aperiodic structure, its conformation (ϕ and ψ backbone dihedral angles of the participating residues), and the geometry of the loop. Refer to Table 1 for structural “type” categories. (b) Geometric properties of a loop are given by a distance between the boundaries of bracing secondary structures (D) and delta (hoist), theta (packing) and rho (meridian) angles. For illustration, properties are annotated on the 4ETP_A_448 loop structure belonging to the DS.HE.4.8.3 prototype.
Figure 1.
Definition of a loop in ArchDB [19]. (a) Classification hierarchy denoted by a loop prototype designation. The prototype is defined by the clustering method used, bracing secondary structures of the loop (type), the number of residues forming the aperiodic structure, its conformation (ϕ and ψ backbone dihedral angles of the participating residues), and the geometry of the loop. Refer to Table 1 for structural “type” categories. (b) Geometric properties of a loop are given by a distance between the boundaries of bracing secondary structures (D) and delta (hoist), theta (packing) and rho (meridian) angles. For illustration, properties are annotated on the 4ETP_A_448 loop structure belonging to the DS.HE.4.8.3 prototype.
Figure 2.
Disorder in loop prototypes. (a) Mean disorder scores plotted against mean length of 5,125 protein loop prototypes. Correlations were significant (Spearman’s correlation coefficient = −0.736, p-value = 0). (b) Mean disorder and mean loop length of prototypes binned by times of origin measured as evolutionary age (nd) of corresponding SCOP fold families (FF). (c) Counts and cumulative counts of loop prototypes introduced via associated SCOP FFs in time represented by bins of evolutionary age (nd). (d) Mean disorder of loops mapping to domain in SCOP classes.
Figure 3.
Comparative genomic analysis of loop prototypes. (a) Venn diagram of prototypes distributed among superkingdoms of life and viruses. Taxonomic groups are mapped to loop prototypes through the SCOP FFs they belong to. (b) Slopegraph describing percentages of each loop type in each superkingdom and viral supergroup.
Figure 4.
A chronology of loop prototypes categorized by Venn group and magnitude of disorder. The time of origin of each prototype is given as an evolutionary age measured in node distance (nd) units. Note that the AV Venn group is absent (see Figure 3A). First prototypes appearing in each disorder category are annotated for the ABEV, ABE, BEV, and BE Venn groups.
Figure 5.
A chronology of loop prototypes categorized by structural types and magnitude of disorder. The time of origin of each prototype is given as an evolutionary age measured in node distance (nd) units.
Figure 5.
A chronology of loop prototypes categorized by structural types and magnitude of disorder. The time of origin of each prototype is given as an evolutionary age measured in node distance (nd) units.
Figure 6.
Disorder in loop prototypes grouped on the basis of molecular function. (a) Distribution of mean disorder scores by loop type (Table 1). (b) Slopegraph describing percentages of each loop type in each molecular function in the sampled dataset. Molecular functions are mapped to loop architectures through their corresponding SCOP FFs.
Figure 7.
A chronology of loop prototypes categorized by molecular function and magnitude of disorder. The time of origin of each prototype is given as an evolutionary age measured in node distance (nd) units.
Figure 7.
A chronology of loop prototypes categorized by molecular function and magnitude of disorder. The time of origin of each prototype is given as an evolutionary age measured in node distance (nd) units.
Figure 8.
An evolutionary chronology of the structural properties of loop prototypes. The time of origin of each prototype is given as an evolutionary age measured in node distance (nd) units. (a) Distribution of loop lengths along the evolutionary timeline. (b) Distribution of loop length, average N-terminus and C-terminus lengths in an architecture along the binned evolutionary timeline. Note that ArchDB classification has loop lengths of ‘zero’ that represent architectures with no aperiodic residues, representing shifts and transitions between different secondary structures [19]. (c) Distribution of average geometric measures of structures in a loop architecture in evolutionary time. Geometric measures include distance, and delta (hoist), theta (packing), and rho (meridian) angles (Figure 1B).
Table 1.
Structural types of loop prototypes in ArchDB [19].
Table 1.
Structural types of loop prototypes in ArchDB [19].
| Type | Bracing Secondary Structure |
|---|---|
| HH | alpha-alpha |
| HE | alpha-beta |
| EH | beta-alpha |
| BN | beta-beta hairpin |
| BK | beta-beta link |
| EG | beta-helix310 |
| GE | helix310-beta |
| GH | helix310-helix |
| HG | helix-helix310 |
| GG | helix310-helix310 |
Table 2.
P-values from Conover’s test for pairwise comparison (preceded by rejection of null hypothesis with the Kruskal-Wallis test at p-value = 6.045 × 10−45). CCP, coiled coil proteins; MCS, membrane and cell surface; MD, multi-domain (α and β); SP, small proteins.
Table 2.
P-values from Conover’s test for pairwise comparison (preceded by rejection of null hypothesis with the Kruskal-Wallis test at p-value = 6.045 × 10−45). CCP, coiled coil proteins; MCS, membrane and cell surface; MD, multi-domain (α and β); SP, small proteins.
| SCOP class | all-α | all-β | α+β | α/β | CCP | MCS | MD | SP |
|---|---|---|---|---|---|---|---|---|
| all-α | -1 | 3.45 × 10−44 | 1.76 × 10⁻²⁰ | 4.62 × 10⁻¹⁰ | 1 | 1 | 0.04501 | 4.66 × 10⁻⁵ |
| all-β | 3.45 × 10−44 | -1 | 1.21 × 10⁻⁸ | 4.36 × 10⁻²⁴ | 0.31539 | 0.00021 | 0.00023 | 1 |
| α+β | 1.76 × 10⁻²⁰ | 1.21 × 10⁻⁸ | -1 | 0.00038 | 1 | 0.32722 | 1 | 1 |
| α/β | 4.62 × 10⁻¹⁰ | 4.36 × 10⁻²⁴ | 0.00038 | -1 | 1 | 1 | 1 | 0.48768 |
| CCP | 1 | 0.31539 | 1 | 1 | -1 | 1 | 1 | 1 |
| MCS | 1 | 0.00021 | 0.32722 | 1 | 1 | -1 | 1 | 0.35386 |
| MD | 0.04501 | 0.00023 | 1 | 1 | 1 | 1 | -1 | 1 |
| SP | 4.66 × 10⁻⁵ | 1 | 1 | 0.48768 | 1 | 0.35386 | 1 | -1 |
Table 3.
Highly enriched GO “biological process” terms in FFs of 48 ‘ordered’ loop prototypes and a probability score equal to 1 in the Structural Domains Annotation Database (SDADB) [55].
Table 3.
Highly enriched GO “biological process” terms in FFs of 48 ‘ordered’ loop prototypes and a probability score equal to 1 in the Structural Domains Annotation Database (SDADB) [55].
| GO ID | GO description |
|---|---|
| GO:0000082 | G1/S transition of mitotic cell cycle |
| GO:0005975 | carbohydrate metabolic process |
| GO:0006099 | tricarboxylic acid cycle |
| GO:0006260 | DNA replication |
| GO:0006351 | transcription, DNA-templated |
| GO:0006355 | regulation of transcription, DNA-templated |
| GO:0006508 | proteolysis |
| GO:0006511 | ubiquitin-dependent protein catabolic process |
| GO:0006631 | fatty acid metabolic process |
| GO:0006633 | fatty acid biosynthetic process |
| GO:0006955 | immune response |
| GO:0007165 | signal transduction |
| GO:0009058 | biosynthetic process |
| GO:0009186 | deoxyribonucleoside diphosphate metabolic process |
| GO:0009405 | pathogenesis |
| GO:0015696 | ammonium transport |
| GO:0015976 | carbon utilization |
| GO:0019646 | aerobic electron transport chain |
| GO:0030245 | cellulose catabolic process |
| GO:0031388 | organic acid phosphorylation |
| GO:0043401 | steroid hormone mediated signaling pathway |
| GO:0055114 | oxidation-reduction process |
| GO:0072488 | ammonium transmembrane transport |
Disclaimer/Publisher’s Note: The statements, opinions and data contained in all publications are solely those of the individual author(s) and contributor(s) and not of MDPI and/or the editor(s). MDPI and/or the editor(s) disclaim responsibility for any injury to people or property resulting from any ideas, methods, instructions or products referred to in the content. |
© 2023 by the authors. Licensee MDPI, Basel, Switzerland. This article is an open access article distributed under the terms and conditions of the Creative Commons Attribution (CC BY) license (http://creativecommons.org/licenses/by/4.0/).
Copyright: This open access article is published under a Creative Commons CC BY 4.0 license, which permit the free download, distribution, and reuse, provided that the author and preprint are cited in any reuse.
Low Complexity Induces Structure in Protein Regions Predicted as Intrinsically Disordered
Mariane Gonçalves-Kulik
et al.
Biomolecules,
2022
Relative Stabilities of Conserved and Non-Conserved Structures in the OB-Fold Superfamily
Kaitlyn Guardino
et al.
IJMS,
2009
The Repeating, Modular Architecture of the HtrA Proteases
Matthew Merski
et al.
Biomolecules,
2022


MDPI Initiatives
Important Links
© 2024 MDPI (Basel, Switzerland) unless otherwise stated