1. Introduction
Pipeline transportation is the main form of transportation in natural gas extraction industry at present. However, due to the low temperature and high pressure environment in the deep sea, it is easy to lead to the formation of natural gas hydrate [
1]. Attention was paid to this problem after Hammer Schmidt published data in 1934 on the blockage of gas pipelines caused by hydrates. With the gradual development of natural gas industry, natural gas has been widely used, and the phenomenon of gas hydrate forming and blocking pipelines in the process of natural gas transportation often occurs. Due to the complex and lengthy operation of pipeline freezing and blockage caused by hydrate, which seriously affects the normal production of natural gas and may cause serious safety hazards, the study on the formation process of natural gas hydrate has become a key research direction in the process of offshore oil and gas transportation [
2,
3].
In recent years, the hydrate slurry pipe flow technology, which allows a certain amount of gas hydrate particles to be formed in the pipeline and can make it flow smoothly along the pipeline with the fluid, has attracted attention. This technology can be applied to the prevention and control of hydrate blocked pipelines, and provides a new development direction for ensuring the safety of natural gas transmission pipelines [
4,
5].Based on this, Wang Shuli research group put forward a method to ensure the safe flow of hydrate slurry by using spiral flow transportation [
6]. Pipe spiral flow is a kind of flow form in which the fluid in the pipe has axial velocity and tangential velocity by changing the flow boundary of the pipe and thereby changing its flow direction by installing a spinning device in the pipe [
7]. The axial velocity provides the power for the fluid carrying hydrate particles to move forward continuously, while the tangential velocity enables the particles to maintain a "suspended" state. This makes it difficult for the hydrate to accumulate and deposit at the bottom of the pipeline after its formation, expanding the safe flow range [
8,
9] of the hydrate and ensuring the safe transportation of natural gas. By studying the spiral flow with twisted belt or impeller as the spinning device, Wang Shuli et al. summarized the flow pattern changes in the gas-liquid two-phase flow process, obtained the law of the flow pattern conversion boundary [
10,
11,
12,
13], and invented a new spiral flow gas hydrate transportation method in pipelines, which can effectively avoid pipeline clogging and improve the safety and economy of natural gas transportation [
14].
Researchers at home and abroad have also done a lot of research on curved pipe multiphase flow, especially on particle transport. Kuang Shibo [
14] used DEM to study the gas-solid two-phase flow in horizontal pipe and vertical pipe section with bend transition, and discussed the relationship between the material plug in horizontal steady state and the particles in settlement layer, the unsteady movement of the horizontal material plug, and the flow of the bulk material in vertical pneumatic transportation. Zhou Jing [
15] studied the different flow states of bending pipes with the same inner diameter and different curvature radii under a certain mixing rate of ash and gas, as well as the wear degree of conveying materials to the bending pipe and the pressure loss of conveying gas in the bending pipe, and suggested that the rate of curvature radius of bending pipe to the bending pipe diameter should be 4 ~ 5. Cai Haifeng et [
16] al. simulated the particle flow in a horizontal bending pipe for high-pressure dense phase pneumatic conveying in a horizontal bending pipe, and found that after particles entered the bending pipe from the upstream horizontal pipe, a high concentration area gradually formed near the outer wall of the pipe, and the friction stress between particles and the shear stress between particles and the wall increased rapidly. Sun Xian et [
17] al. studied the transport process of hydrate slurry in the curved pipe system, and found that the larger the hydrate particle size, the faster the maximum volume fraction of hydrate rises. With the increase of flow velocity, the influence on the maximum volume fraction of hydrate is less. Wu Xiao nan et [
18] al., taking the migration of deposited naphthalene in gas pipeline as the research object, simulated and analyzed the migration law of deposited naphthalene in horizontal bending pipe and other pipe types, and studied the effects of particle size, airflow velocity, temperature and pressure on the migration of deposited naphthalene under different pipe diameters, bending pipe rate and diameter rate. Lv Tong et [
19] al. studied the transport characteristics of large particles in the solid-liquid two-phase flow in the U-shaped Bending pipe by simulation analysis, obtained the distribution and movement characteristics of particles and flow field in the U-shaped Bending pipe, and found that the secondary flow in the Bending pipe also had a certain influence on the movement and distribution of particles. Gao Hui et [
20] al. measured the spiral pipe flow field of the gas-water-sand three-phase flow in the combined bending pipe with particle image velosimeter (PIV). They found that the area of uniform distribution of the mainstream velocity is concentrated at the bottom of the pipe section. During the process of flowing through the bending pipe, the particles will shift to the outside of the bending pipe due to the role of centrifugal force; The flow in the rising section is hindered by gravity, and the mainstream speed is reduced compared with the flat section at the bottom, the centrifugal force is weakened, and the average radial velocity of particles is low. By using computational fluid dynamics software, Zhai Yin ping [
21] et al. simulated the spiral flow in a 90° Bending pipe and studied the variation rule of spiral flow intensity. The results showed that the tangential flow velocity reached its maximum when the tangential inlet Angle was 60°, which was conducive to removing deposited impurities in the Bending pipe.
Karino et [
22] al. studied the flow of particles in the curved pipe and recorded the flow process of particles, finding that particles in a large main vortex in a spiral flow, some particles then pass above or below the main stream into the side pipe and through the side vortex, and there is a double helix flow downstream of the side vortex. Sato et [
23] al numerically simulated the thinning of the pipe wall at the mouth of a swirl bending pipe, and the results showed that a swirl with a certain level of swirl strength would produce a spiral motion downstream of the bending pipe, and maintain a longer distance than a bending pipe flow without swirl. This type of non-axisymmetric flow can trigger a strong bias at the orifice. Takano et [
24] al. studied the non-axisymmetric mass transfer of a curved tube swirl and found that the combined effect of secondary flow and swirl in a long bending pipe produces non-axisymmetric mass transfer. Kalpakli et [
25] al. studied the turbulent flow downstream of a 90° bending pipe tube by using 3D particle image velodrometry technology, and compared the effects of swirl and non-swirl on the flow. Kadyirov [
26] carried out a numerical study on the flow of carboxymethyl cellulose in a curved tube, and found that after entering the curve, the vortex formed two complex vortices of different sizes, among which the largest vortices appeared on the inside of the curve, and these vortices were carried to the outside of the curved channel due to the inertia force generated in the curved pipe. Chang et [
27] al. used the particle image velocity measurement method to study the flow of rotating particles in a 90-degree circular tube, as well as the distribution of time-mean velocity and time-mean turbulence intensity on the longitudinal cross section under different Reynolds numbers.
At present, studies on spiral particle flow in gas pipelines dominated by gas phase are mainly in straight pipes, while relatively few studies on hydrate particle flow in curved sections. Therefore, it is of great significance to study the deposition law of gas hydrate particles in curved pipes to ensure the safe and stable operation of pipelines.
2. Numerical simulation method
2.1. Physical Model
2.1.1. Geometric model
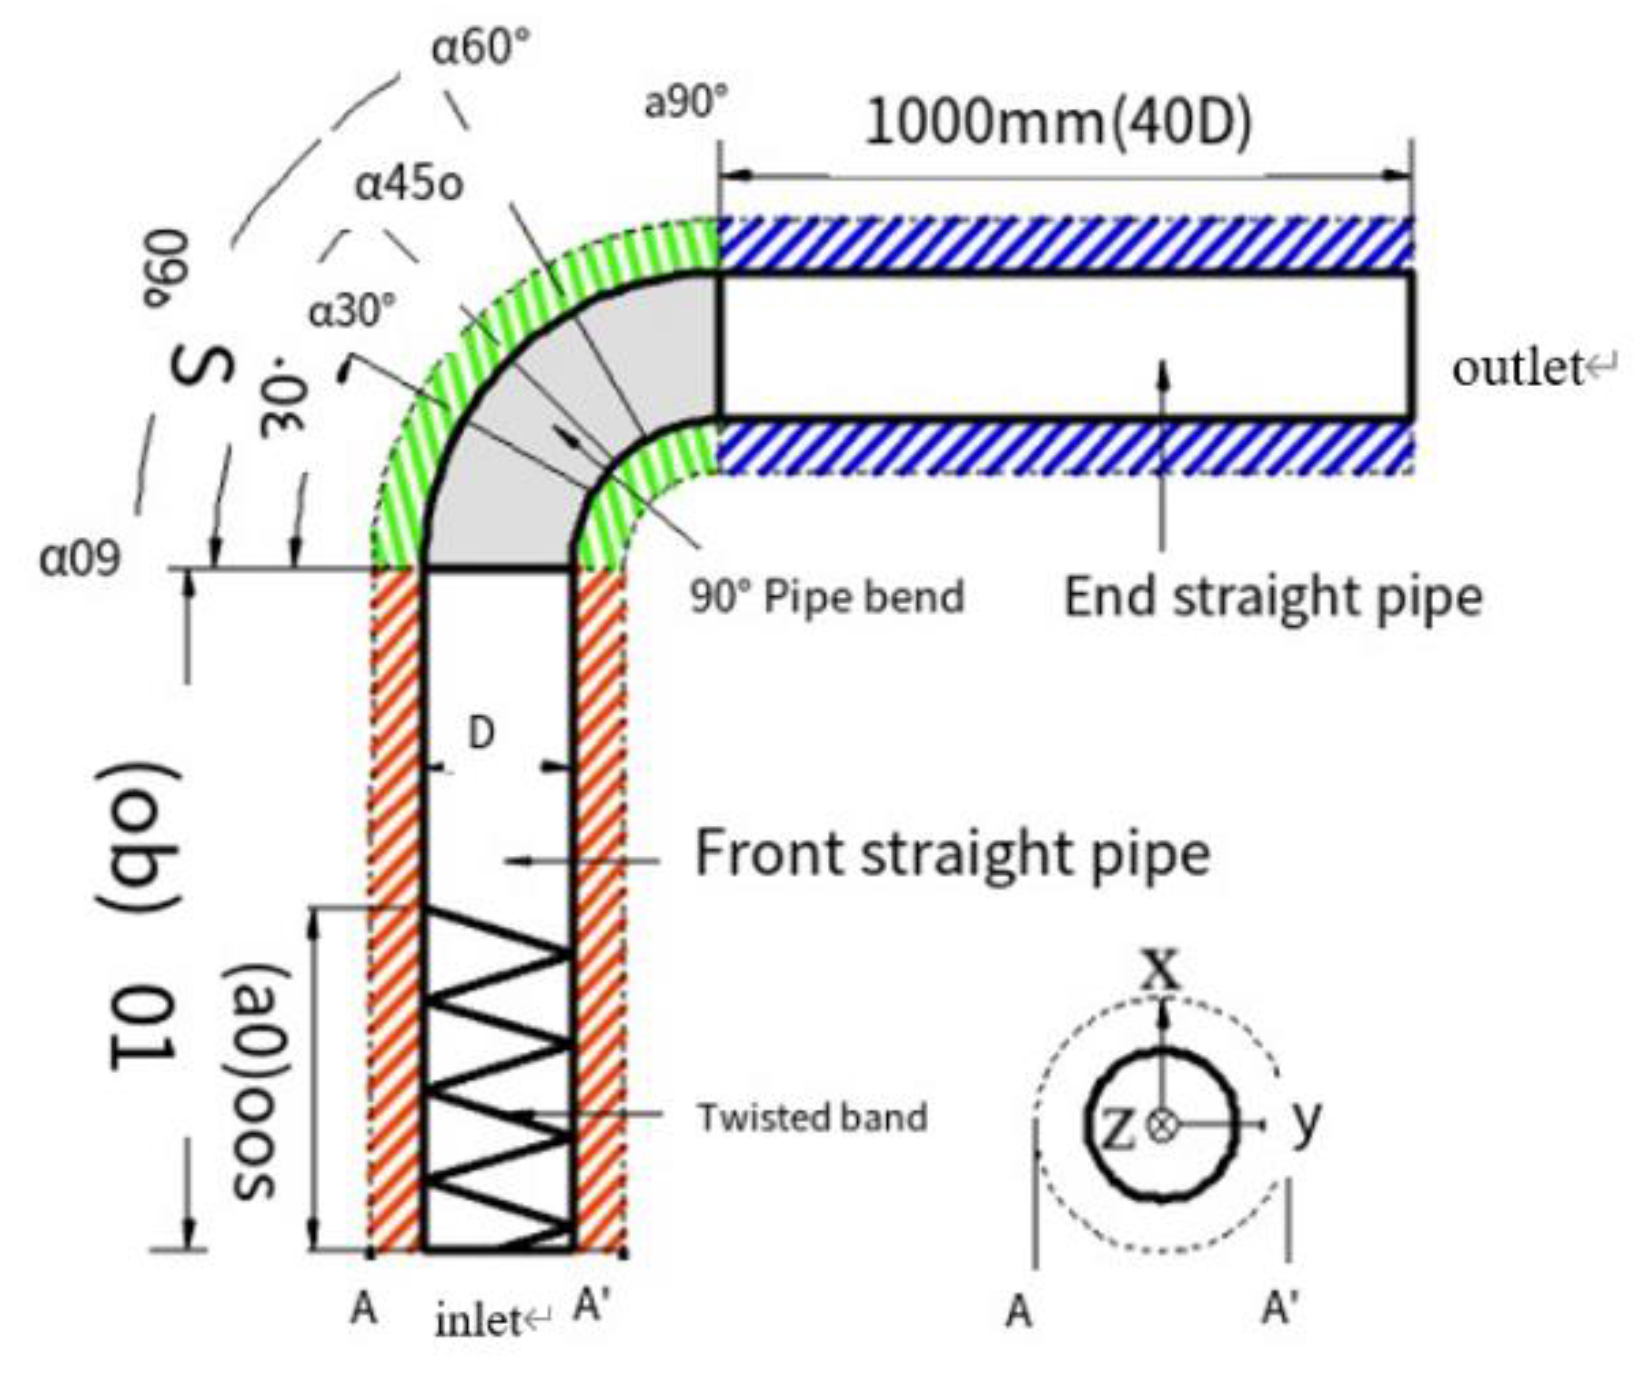
The physical model of the pipeline is established by SolidWorks with an inner diameter of 25mm. The front and tail segments of the pipeline are long straight pipes, and the middle segment is a bending pipe. The pipe model with a 90° bend pipe is shown in
Figure 1 below.
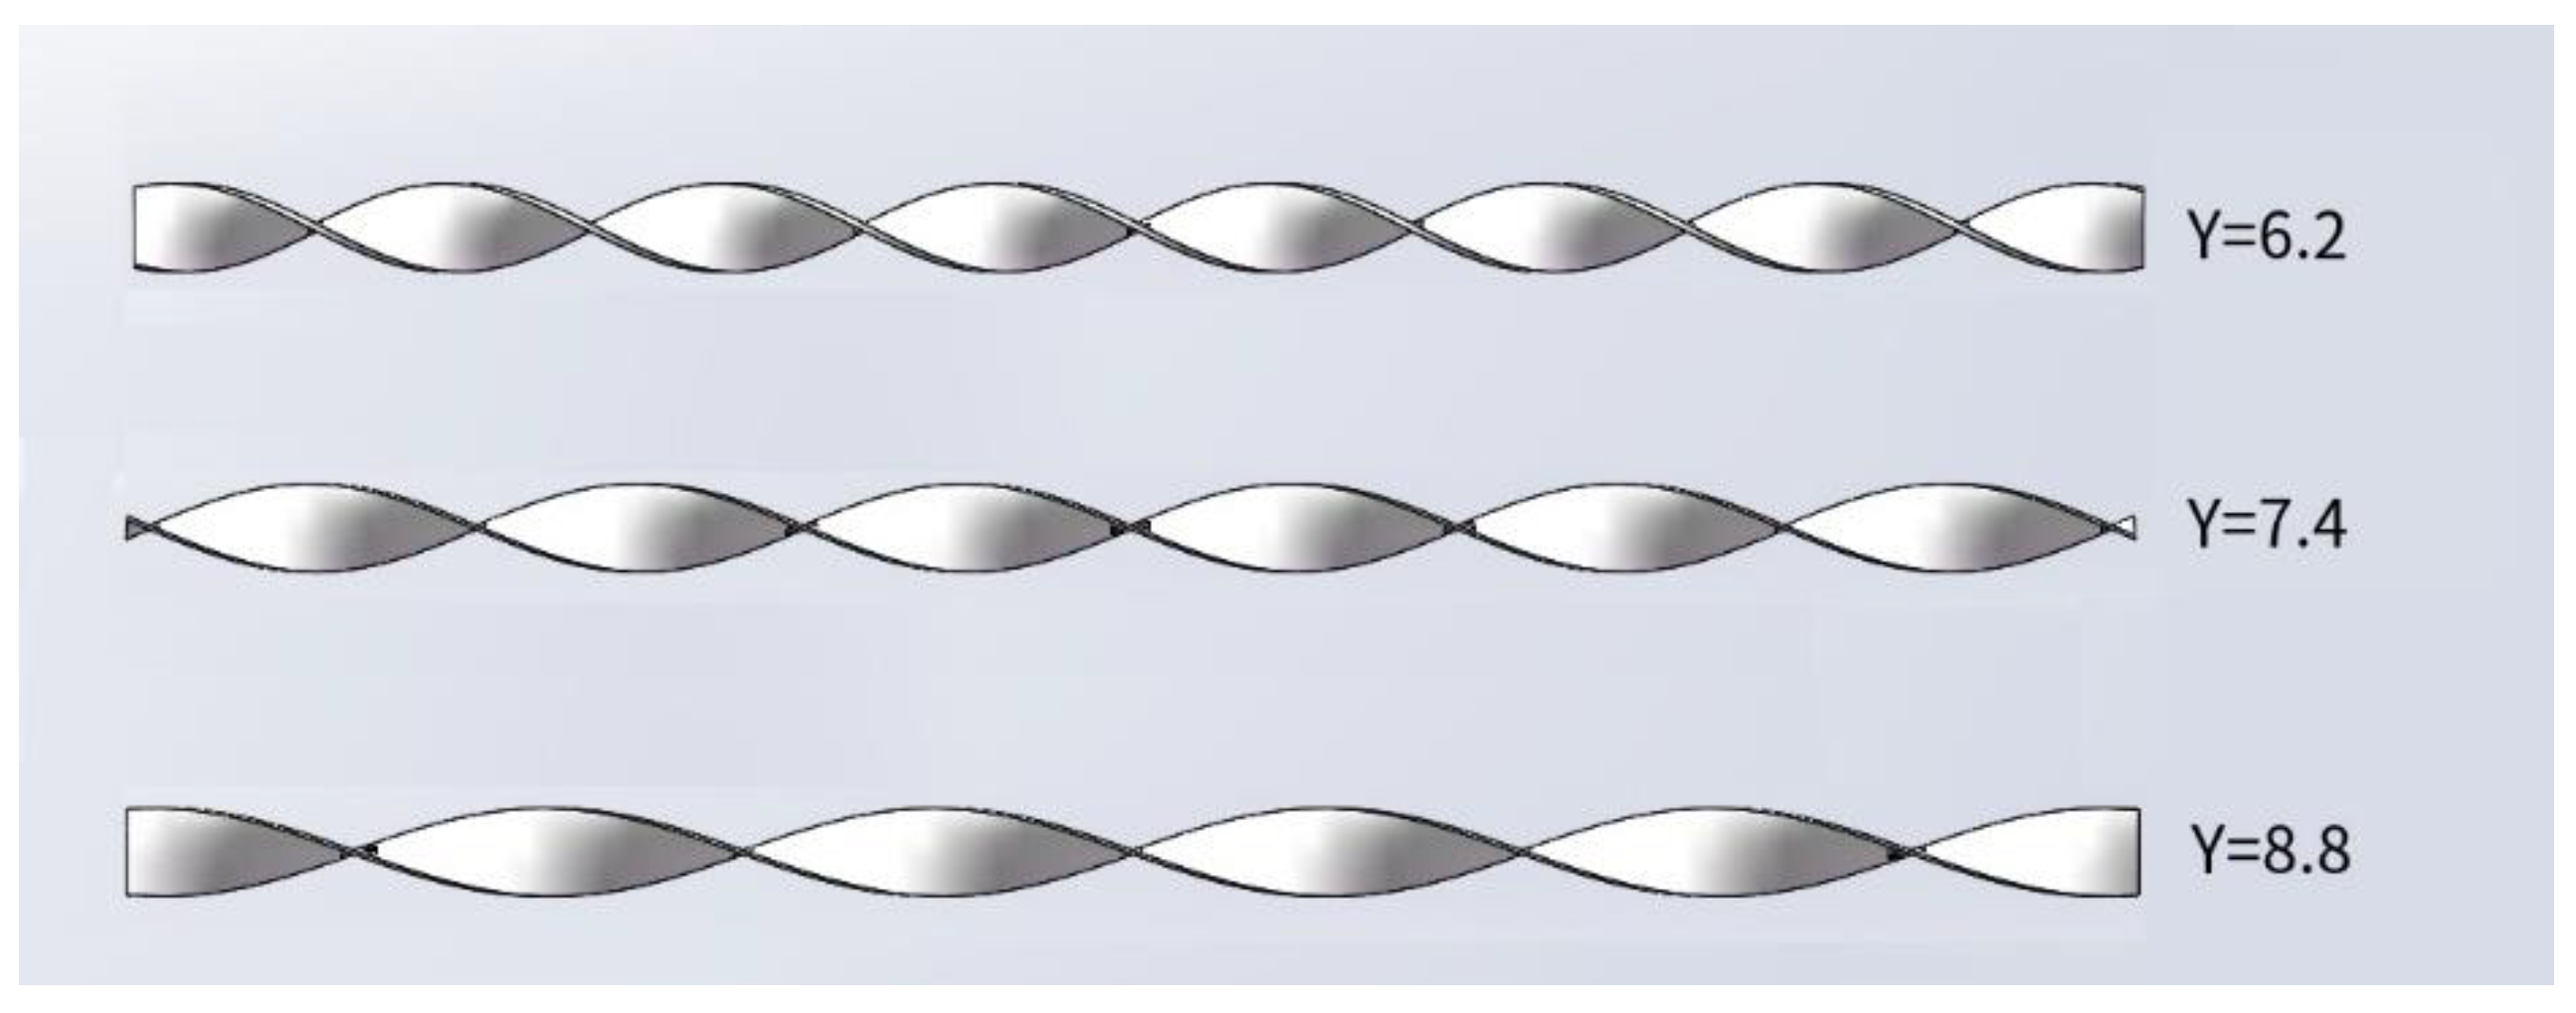
A twist belt as a spinning device is installed at the entrance of the pipe, with a length of 0.5m. Three twist belts with different twist rates Y (the rate of length H of 360° twist belt to width D of twist belt) are used in the model for research, which are 6.2, 7.4 and 8.8 respectively. The effects of wall thickness and other factors are considered according to the actual situation, so that the results can reflect the movement of gas-solid phase in the pipeline more truly and accurately. The model diagram of the twisted belt and the schematic diagram of the twisted rate are shown in
Figure 2 and
Figure 3 below.
2.1.2. Boundary conditions
The inlet boundary adopts the velocity inlet condition. The gas phase is natural gas, the solid phase is hydrate particles, and the particle mass flow rate is 10-6kg/s. The particles are produced continuously at the inlet position. Reynolds numbers Re=5,000,10000,20000 were selected for comparative analysis at the inlet. The outlet boundary was pressure outlet. The wall condition of the pipe adopts a fixed wall without slip, considering the influence of gravity.
2.1.3. Physical property conditions
This paper mainly simulates the flow and settlement of gas-solid two-phase flow under the action of spiral flow produced by twisted belt. The gas phase uses methane (CH
4) as the medium, and the solid phase uses natural gas hydrate as the medium. The natural gas hydrate particles are set as homogeneous spheres with the same particle size. The basic Settings are shown in
Table 1. ρ
g represents the gas phase density;
ρs represents solid phase density;
μg represents the gas phase dynamic viscosity. Other basic physical property parameters are set according to the parameters under standard conditions.
2.2. Grid Division
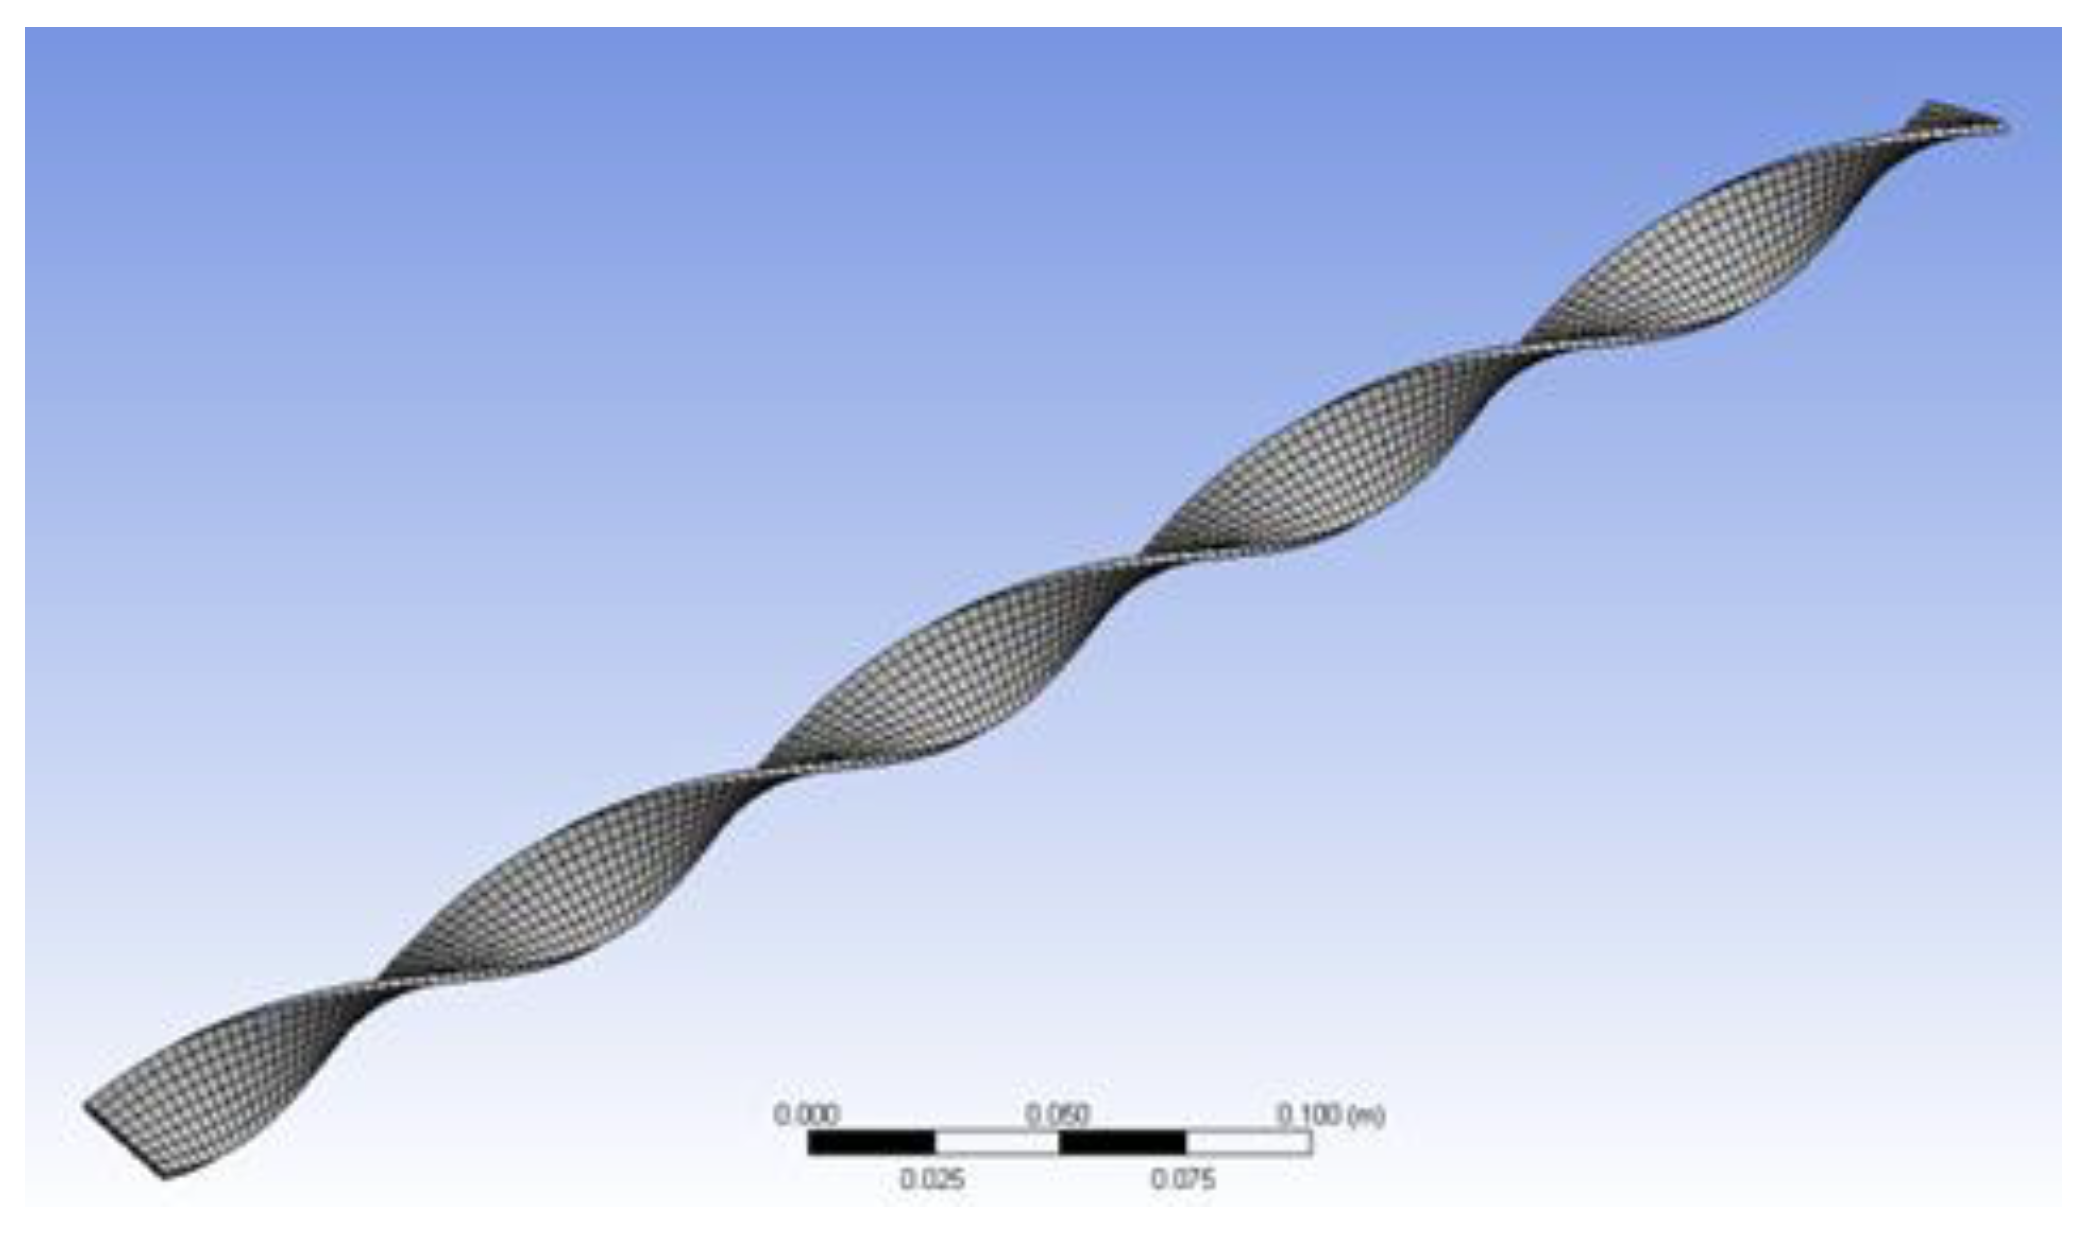
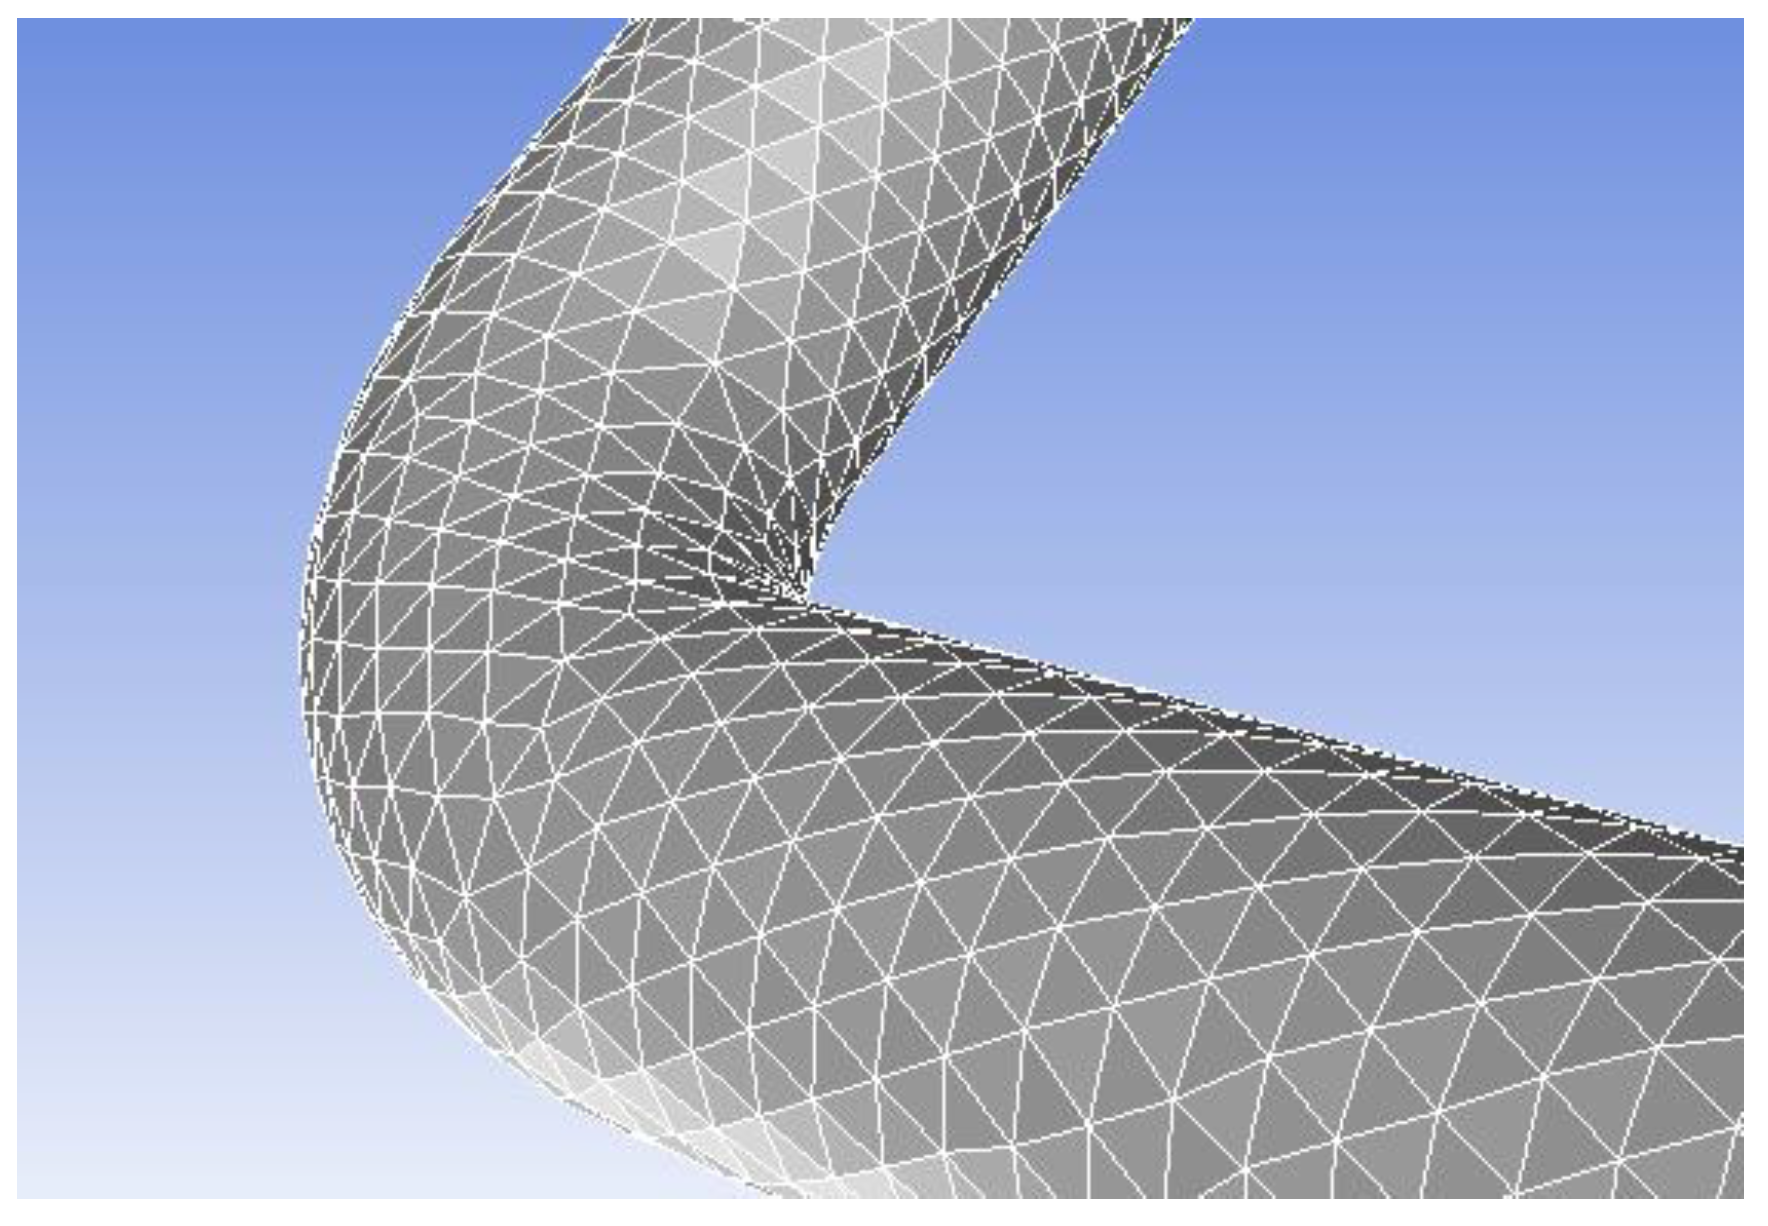
During the meshing process, the model can be divided into two parts, one is the area where the twist tape is located, and the other is the space (watershed) where the twist tape is formed with the inner wall of the pipe. The structured grid method is used to divide the twisted belt. The structured grid has high mesh quality, relatively small calculation amount and high calculation efficiency. And for the watershed part, the shape and structure of this part of the space are more complicated due to the existence of twisted belt, and the unstructured grid has better adaptability to complex models, so the division method of unstructured grid is adopted. However, this method is relatively large in computation. The twisted tape mesh, mesh quality and the mesh at the bending pipe are shown in
Figure 4,
Figure 5,
Figure 6.
2.3. Mathematical Model
2.3.1. Physical property conditions
Among, ρ- gas density; u - velocity; p - static pressure; τij- viscous stress tensor; t - time.
2.3.2. Equation of turbulent motion
RNG k-Ɛ model is adopted for turbulent flow model. Compared with the standard K-Ɛ model, RNG K-Ɛ model has better performance in the flow field with rotation, bending pipe or vortex. In the swirl dominated flow mode, RNG model can better deal with high strain rate and flow with a relatively large degree of streamline bending, such as spiral flow, with high accuracy.
In the K-Ɛ model, the equation is as follows:
Among them, Gb- turbulent kinetic energy generation term;
Gk- buoyancy generation term;
k- turbulent kinetic energy;
ε - Turbulent energy dissipation rate, which is the turbulent kinetic energy generated due to the laminar velocity gradient;
YM- Fluctuations due to diffusion in compressible flows;
Sk,Sε-custom parameters;
Among them .

,
η0 ≈ 4.38,
β = 0.012,
α0 = 1
Effective viscosity
μeff, the equation is as follows:
Among them.

2.3.3. Discrete phase model
Discrete phase model (DPM) was adopted to simulate the gas-solid two-phase spiral flow. Based on Euler-Lagrange method, the discrete phase model took the fluid as the continuous phase and the solid particles as the discrete phase. The flow field distribution was obtained by solving the Navier-Stokes equation. By calculating the coupling between particles and fluid, the trajectories of a certain number of particles are tracked and described in the Euler coordinate system. The dispersion phase solid particle concentration is generally less than 10%.
When the particles are suspended, the forces on them in the fluid balance each other, and the equation of motion of the particles is:
Among them, mi- i particle mass;
μi- particle velocity;
(ΣF)i- the resultant force on the particle.
The resultant force on particles in the flow process includes the additional mass force, inertia force, gravity, pressure gradient force, drag force, buoyancy force, and Safman lift force. According to ideal (non-viscous) fluid mechanics, the additional mass force is equal to half of the mass of the fluid displaced by the solid particles when they flow, so the additional mass force can be expressed as:
Inertial force means that when the object is accelerated, the inertia of the object will make the object have a tendency to maintain the original state of motion. This force acting in the opposite direction is called inertial force, which can be expressed as:
When the solid particles move, they will also be affected by their own gravity. Since the hydrate particles are regarded as uniform spheres in the simulation, this force can be expressed as:
When solid particles flow in the pipeline, there is a pressure gradient along the flow direction, so that the particles receive their force, called the pressure gradient force, which can be expressed as:
The force exerted by the fluid on the solid with relative speed is called drag force. The composition of drag force is more complex and involves more factors, which is difficult to be expressed in a fixed formula. Therefore, the concept of drag coefficient is introduced, expressed as:
So, the drag force can be expressed as the following formula:
Buoyancy refers to the difference (resultant force) of fluid pressure on each surface of an object in a fluid, which can be expressed as:
Saffman lift is the lift force from low velocity to high velocity caused by the velocity difference between the particle and the surrounding fluid when the velocity gradient of the fluid is perpendicular to the direction of motion of the particle, but its magnitude can often be neglected in turbulent flow. This force can be expressed as:
2.4. Calculation Method
When numerical simulation is used to solve practical problems, different models and parameter Settings will lead to different simulation results. Therefore, how to set models and parameters is very important to whether the simulation results can reflect the actual situation correctly. Numerical simulation generally consists of three parts: pre-processing, calculation and post-processing. The purpose of pre-processing is to convert the specific problem into a form acceptable to the computer solver, which is mainly reflected in the establishment of the model and the division of the grid. The number and quality of the grid have a great impact on the calculation amount, calculation efficiency and the correctness of the calculation results. The calculation mainly includes the checking of the calculation domain and the setting of the boundary conditions, the setting of the solver, the setting of the model, the setting of the physical property parameters, etc. Whether the calculation process is reasonable or not has a great impact on the degree of agreement between the calculation results and the actual situation. The post-processing process processes the calculation results to obtain intuitive data and charts. Commonly used post-processing software include CFD-Post, Techplot, origin and so on.
The discrete phase model is selected in the calculation, and the pressure base and implicit solver are used to simulate the gas-solid two-phase three-dimensional spiral flow in the gas hydrate pipeline. The RNG k-Ɛ model is used as the turbulence model in the simulation calculation. The k-Ɛ model represents the turbulent stress as a function of turbulent viscosity through the introduction of turbulent viscosity. The RNG K-Ɛ model adds additional terms to the Ɛ equation on the basis of the k-Ɛ model, which improves the adaptability to rotating flow field and ensures higher accuracy of the calculation results. The particle motion model adopts the DPM model, and the physical property parameters, velocity and mass flow rate of the particles can be changed by parameter setting. The momentum component, the turbulent kinetic energy component and the dissipation rate all adopt the second-order upwind interpolation scheme with second-order precision. The SIMPLEC algorithm is used for pressure and velocity coupling. When the absolute value of the residual is less than 1×10⁻⁶, the convergence condition is reached and the calculation ends.
2.5. Grid independence verification
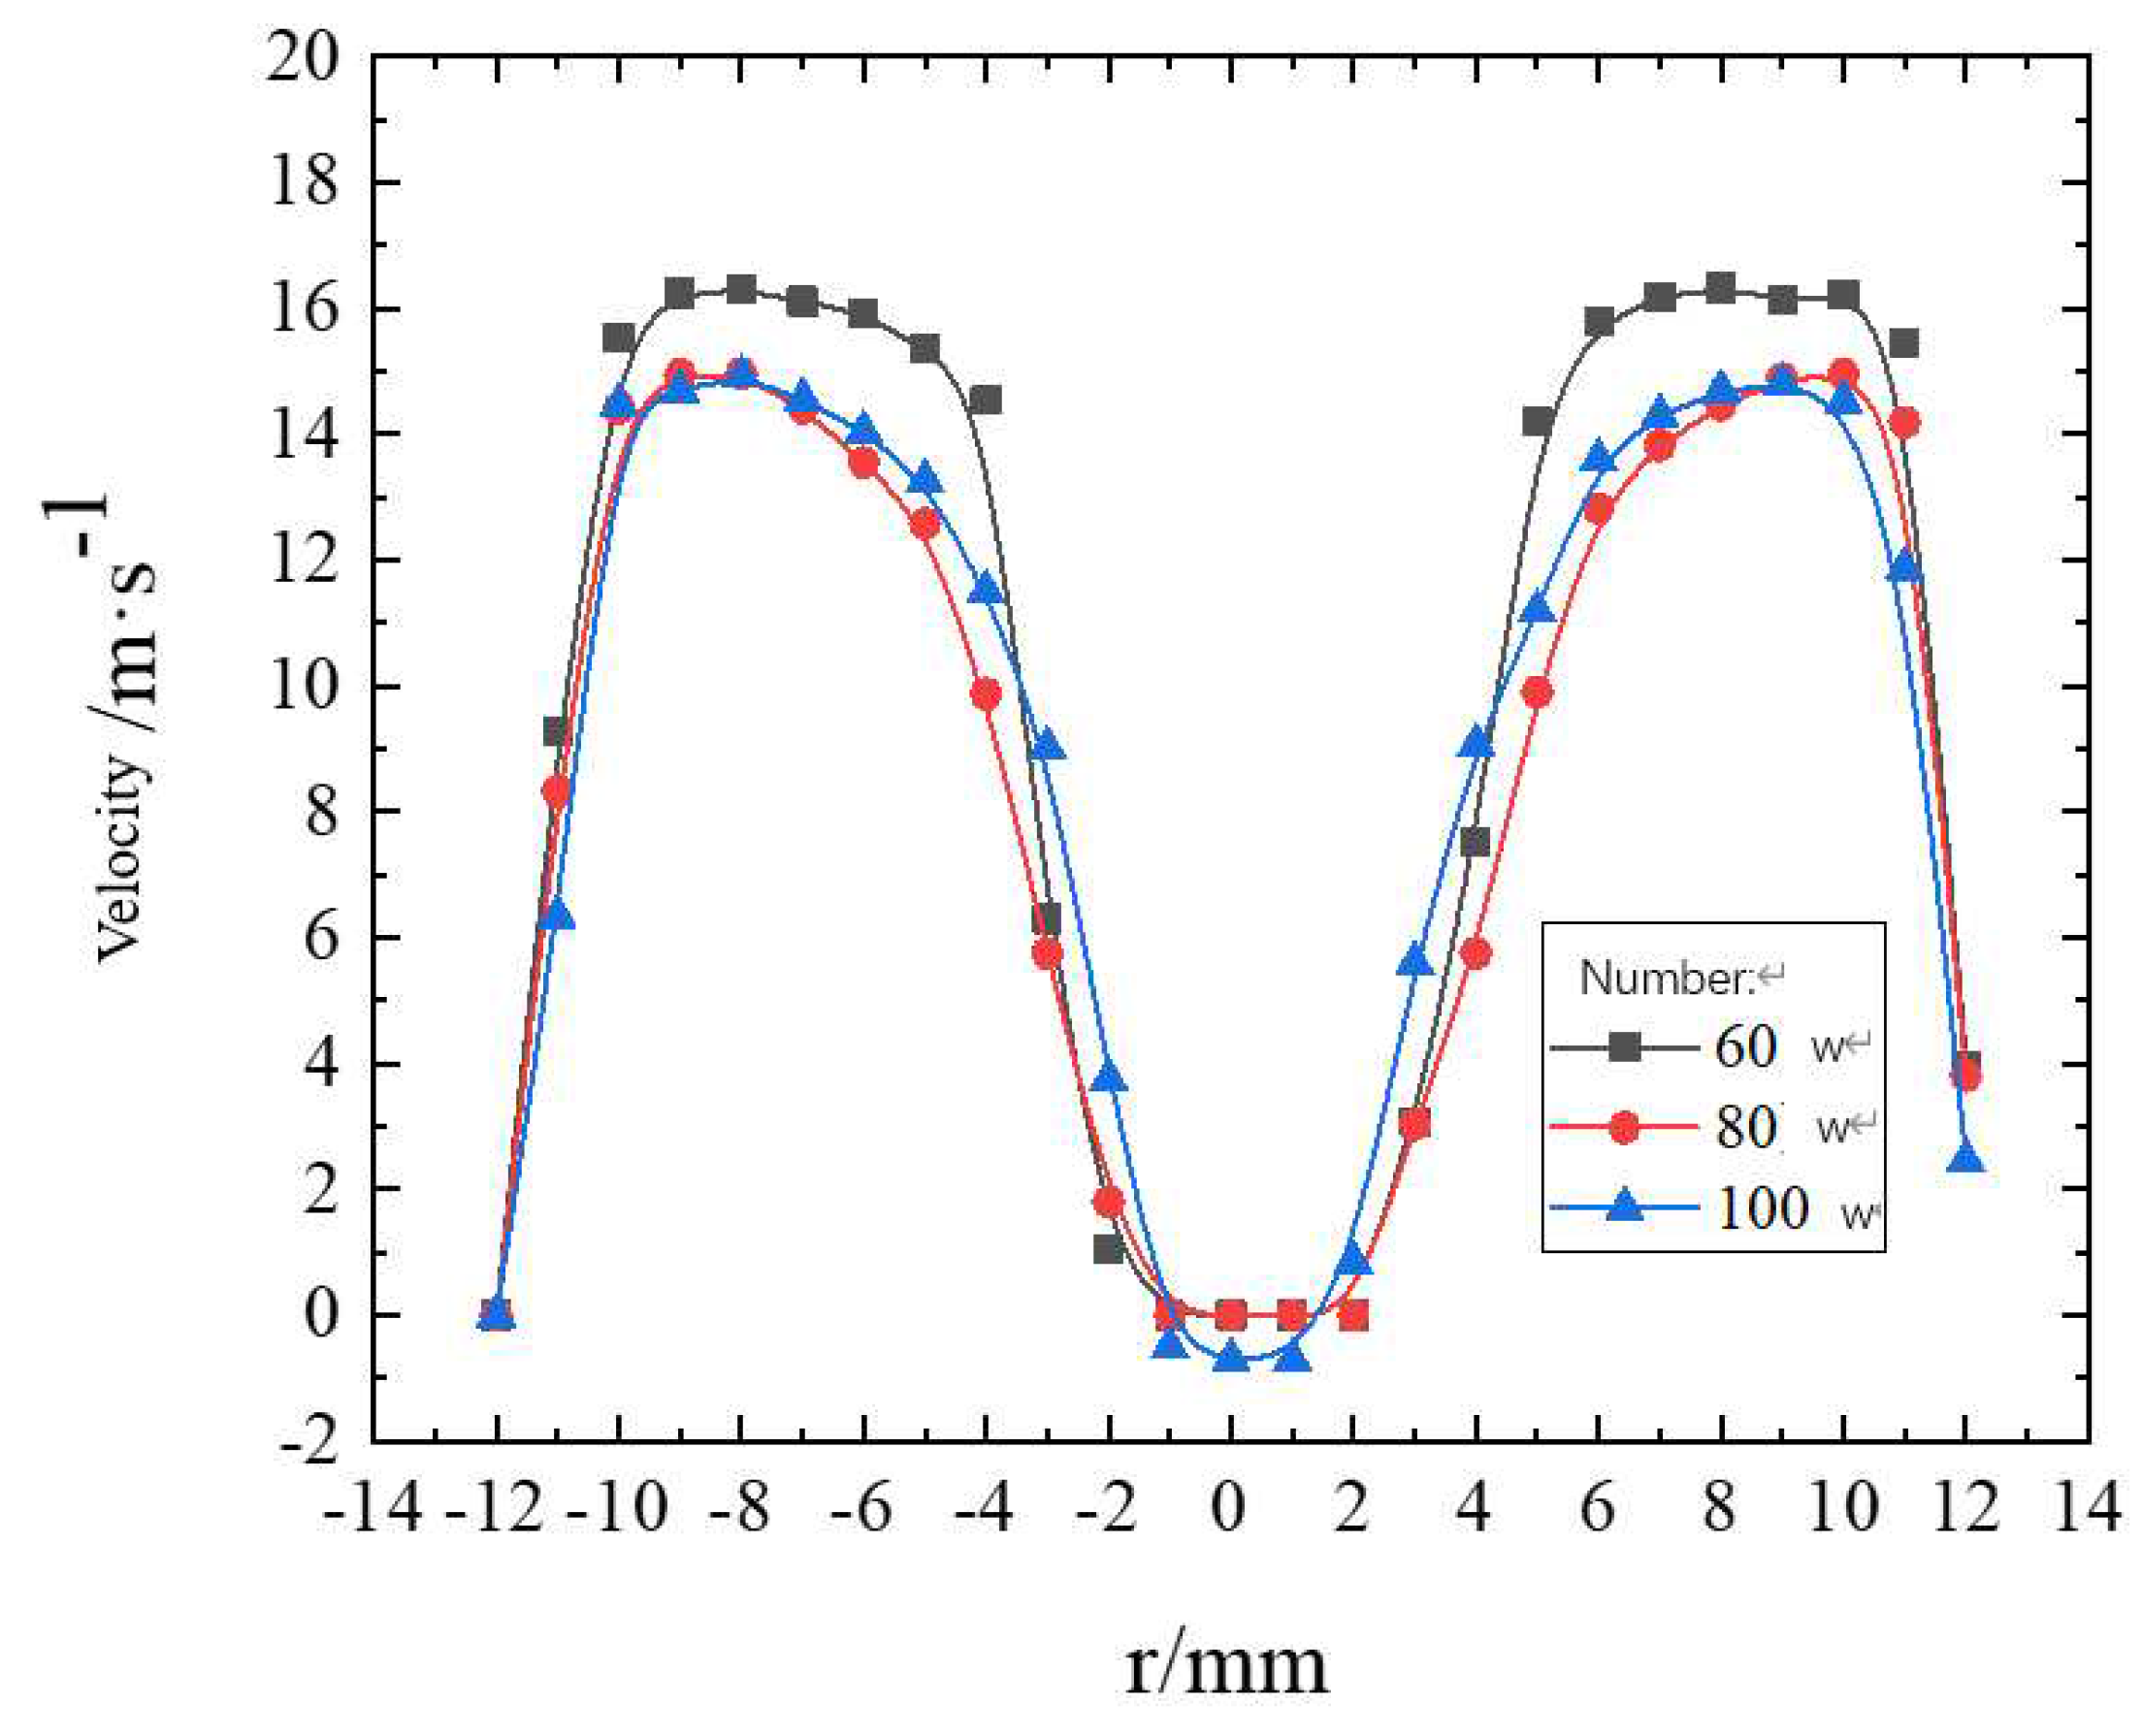
Grid division is an important part of the pre-processing process. In a certain range, the improvement of the number of grids is helpful for the improvement of the calculation accuracy, but too many grids will occupy a lot of computing resources and prolong the calculation time. Moreover, when the number of grids increases to a certain extent, the rounding error will increase due to the influence of the computer storage word length. May lead to an increase in the calculation error, so the appropriate number of grids is very important. In the process of numerical calculation, in order to eliminate the influence of the number of grids on the calculation results, it is usually necessary to calculate several sets of grids with different numbers, compare the calculation results, and evaluate the deviation of the calculation results. This process is called grid independence test. In this paper, three kinds of grids of 600,000, 800,000 and 1,000,000 are selected to verify the grid independence. In addition to the number of grids, other parameters are set the same during calculation. Select the velocity distribution at the center of the cross section 8D away from the entrance for comparison, as shown in
Figure 7 below. As can be seen from the velocity comparison diagram, the velocity variation trend of the three groups of grids is similar, which indicates that the simulation results can be mutually verified. However, when the number of grids is 600,000, the velocity variation error is relatively larger than that of the other two groups of grids, which indicates that there are still major deficiencies in the precision division of this grid compared with the other two groups, and the data accuracy is low. The comparison error of the data obtained through the other two sets of grids is relatively small, but the time spent on 1 million grids is larger than that on 800,000 grids, so it is more appropriate to use the grid with 800,000 grids for calculation.
2.6. Model feasibility verification
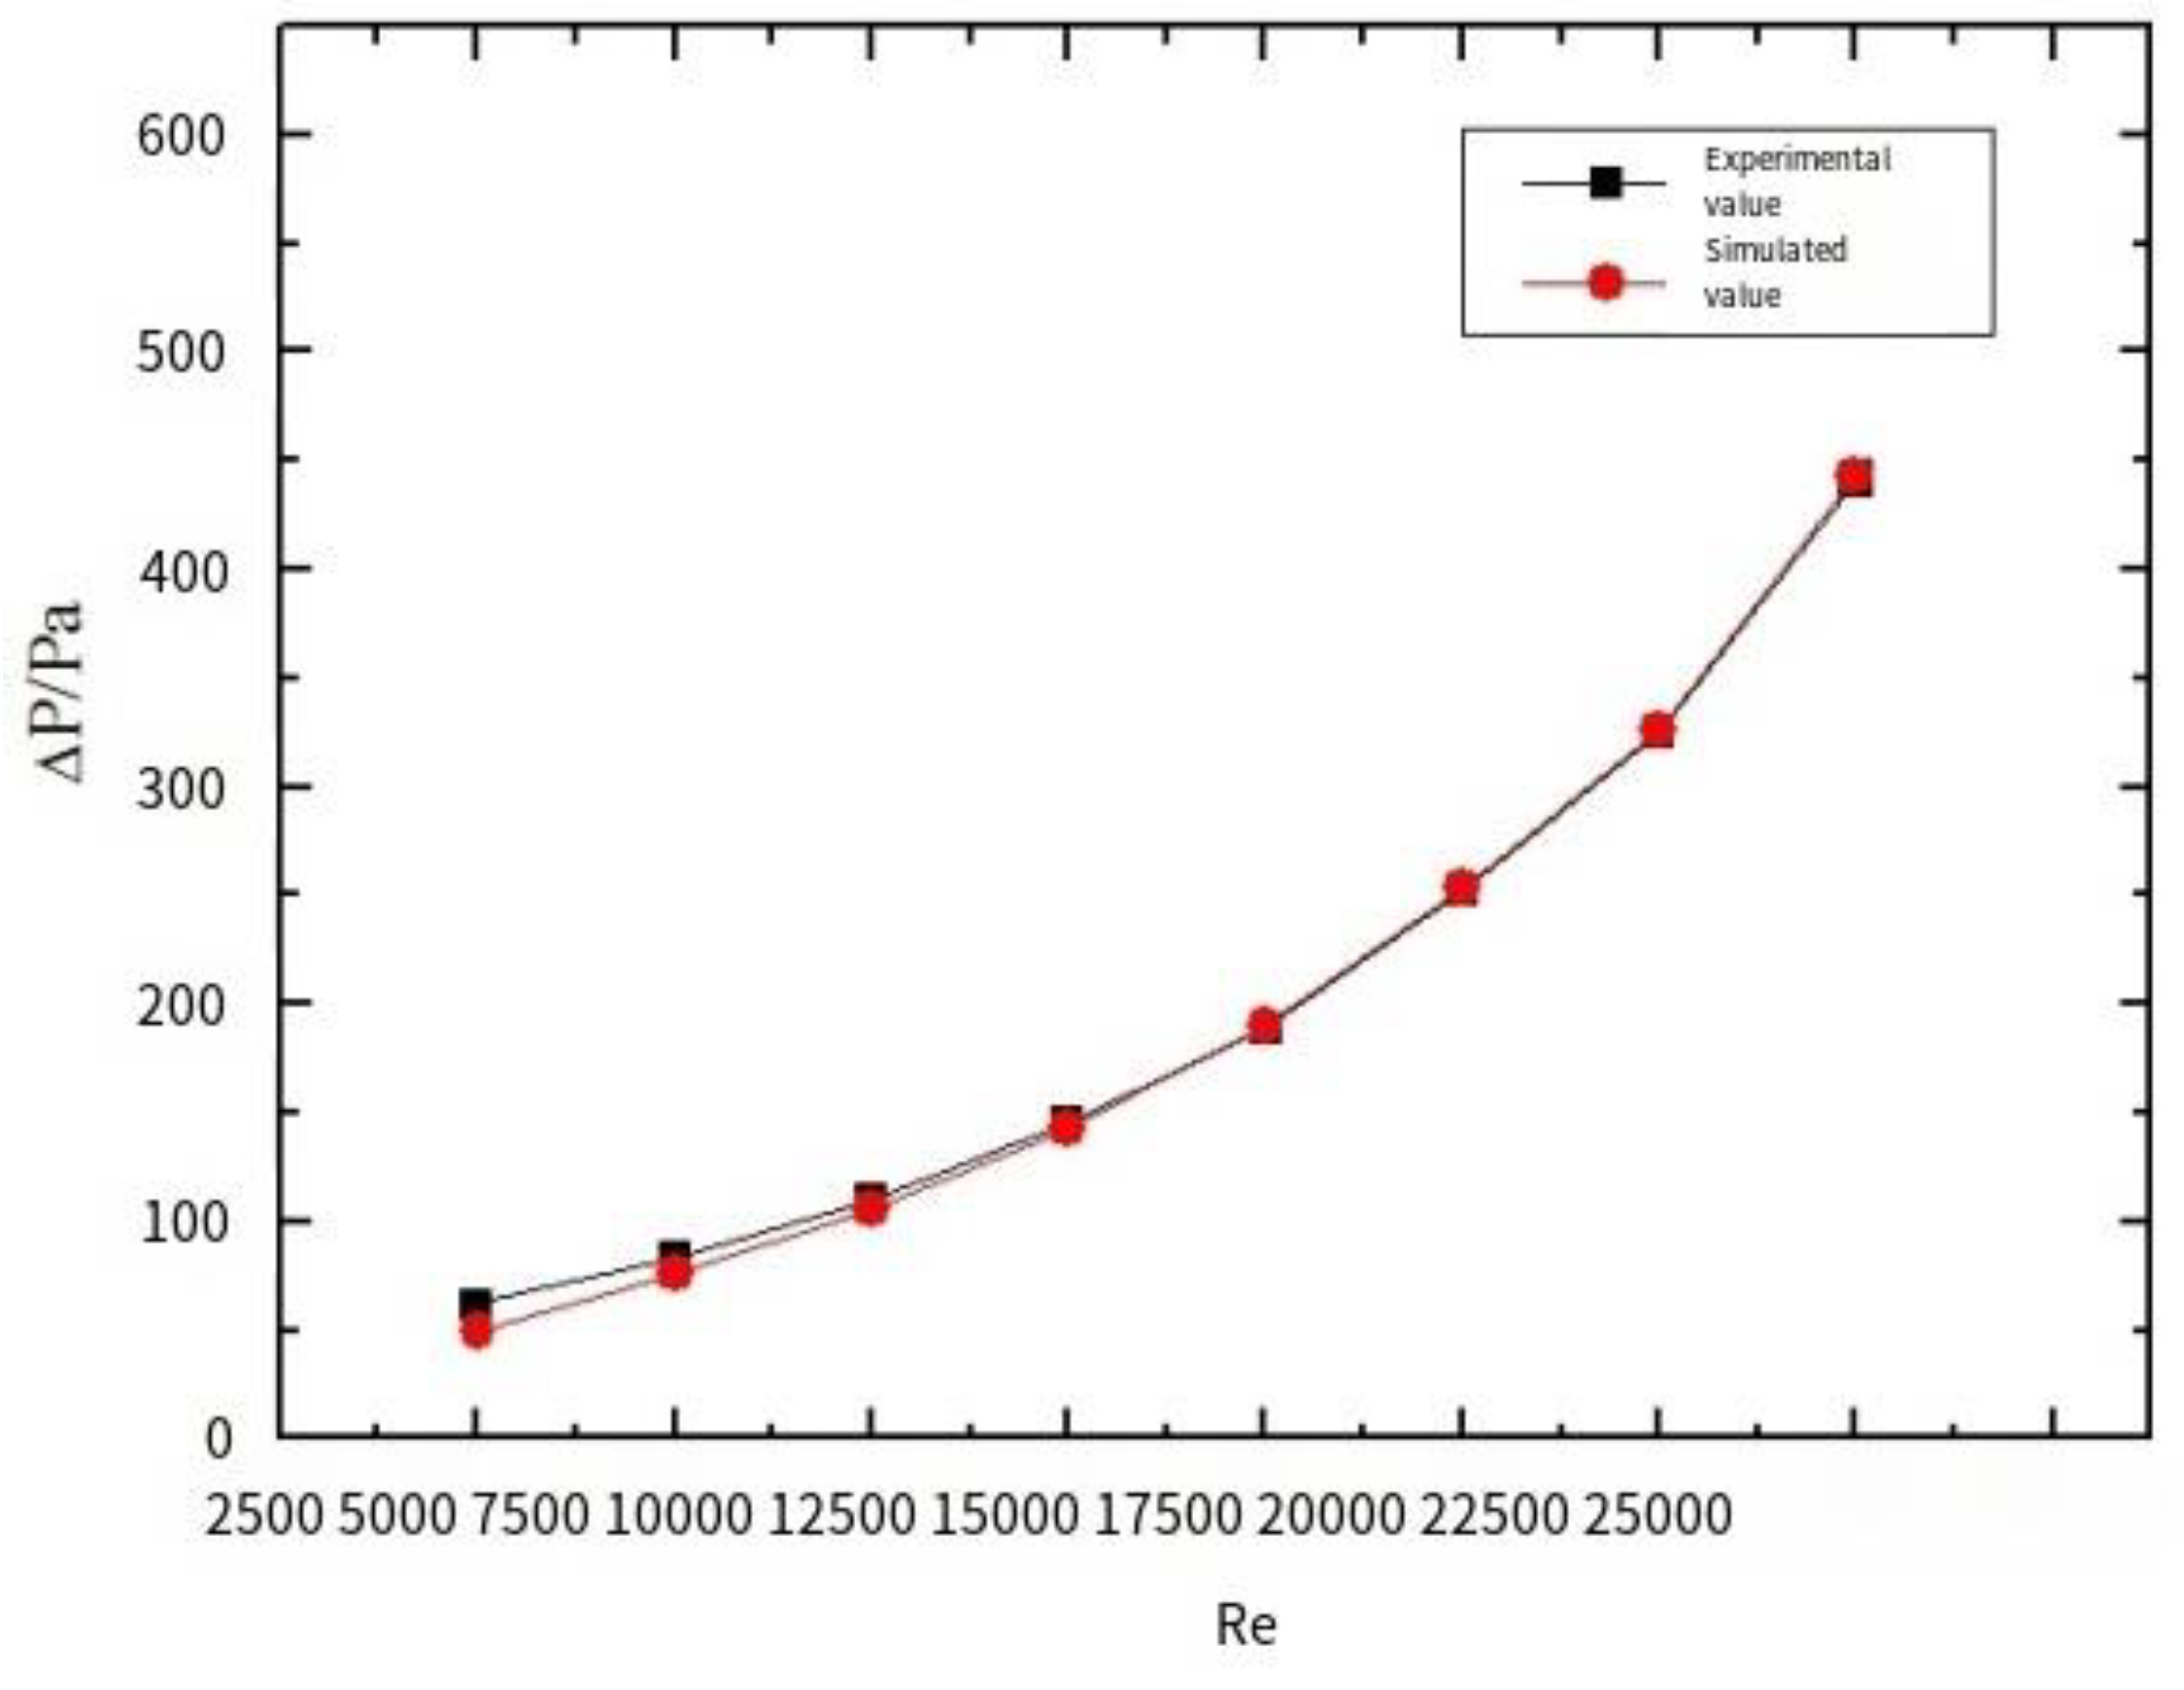
In order to verify the reliability of the model, a pipeline with a length of 1.2m and an inner diameter of 25mm was set up in the experiment. Colored sand particles with particle size of 0.06mm were used to replace hydrate particles to flow in the pipeline with gas. The experiment was carried out at normal temperature and pressure. The experimental results were compared with the simulation results. The comparison results are shown as the curve of pressure drop (ΔP) changing with Reynolds number (Re) in the figure below. Re is calculated by
Re=
vdρ/μ, where
v is the average velocity of the flow,
d is the diameter of the pipe, ρ is the density, and
μ is the dynamic viscosity. As can be seen from
Figure 8, the error of results is small in the Reynolds number range of experimental and simulated conditions, so the model can be used to simulate the transportation of natural gas containing hydrate particles.
3. Results and discussion
By means of numerical simulation, spiral flow attenuation and hydrate particle deposition law of spiral flow transportation of hydrate particles in curved pipe section under the action of different bending pipe Angle, different bending pipe diameter rate, different Reynolds number and different torsion rate were simulated and studied, and the change of swirl number, residence time, concentration distribution and deposition law of hydrate particles were mainly studied, so as to expand the safe transportation distance. It is of great significance to ensure the safety of the pipeline.
3.1. The change rule of swirl number
Swirl number is an important physical quantity that represents the flow characteristics of spiral flow and an important parameter to measure the strength of spiral flow. Swirl number of spiral flow is defined as the rate of dimensionless tangential momentum to axial momentum, and its formula is as follows:
Among R is the inner diameter of the pipe, ρ is the density of the fluid, u is the axial velocity of the fluid, w is the tangential velocity of the fluid, A is the cross-sectional area of the spiral pipe, and the speed is considered to be the average time velocity.
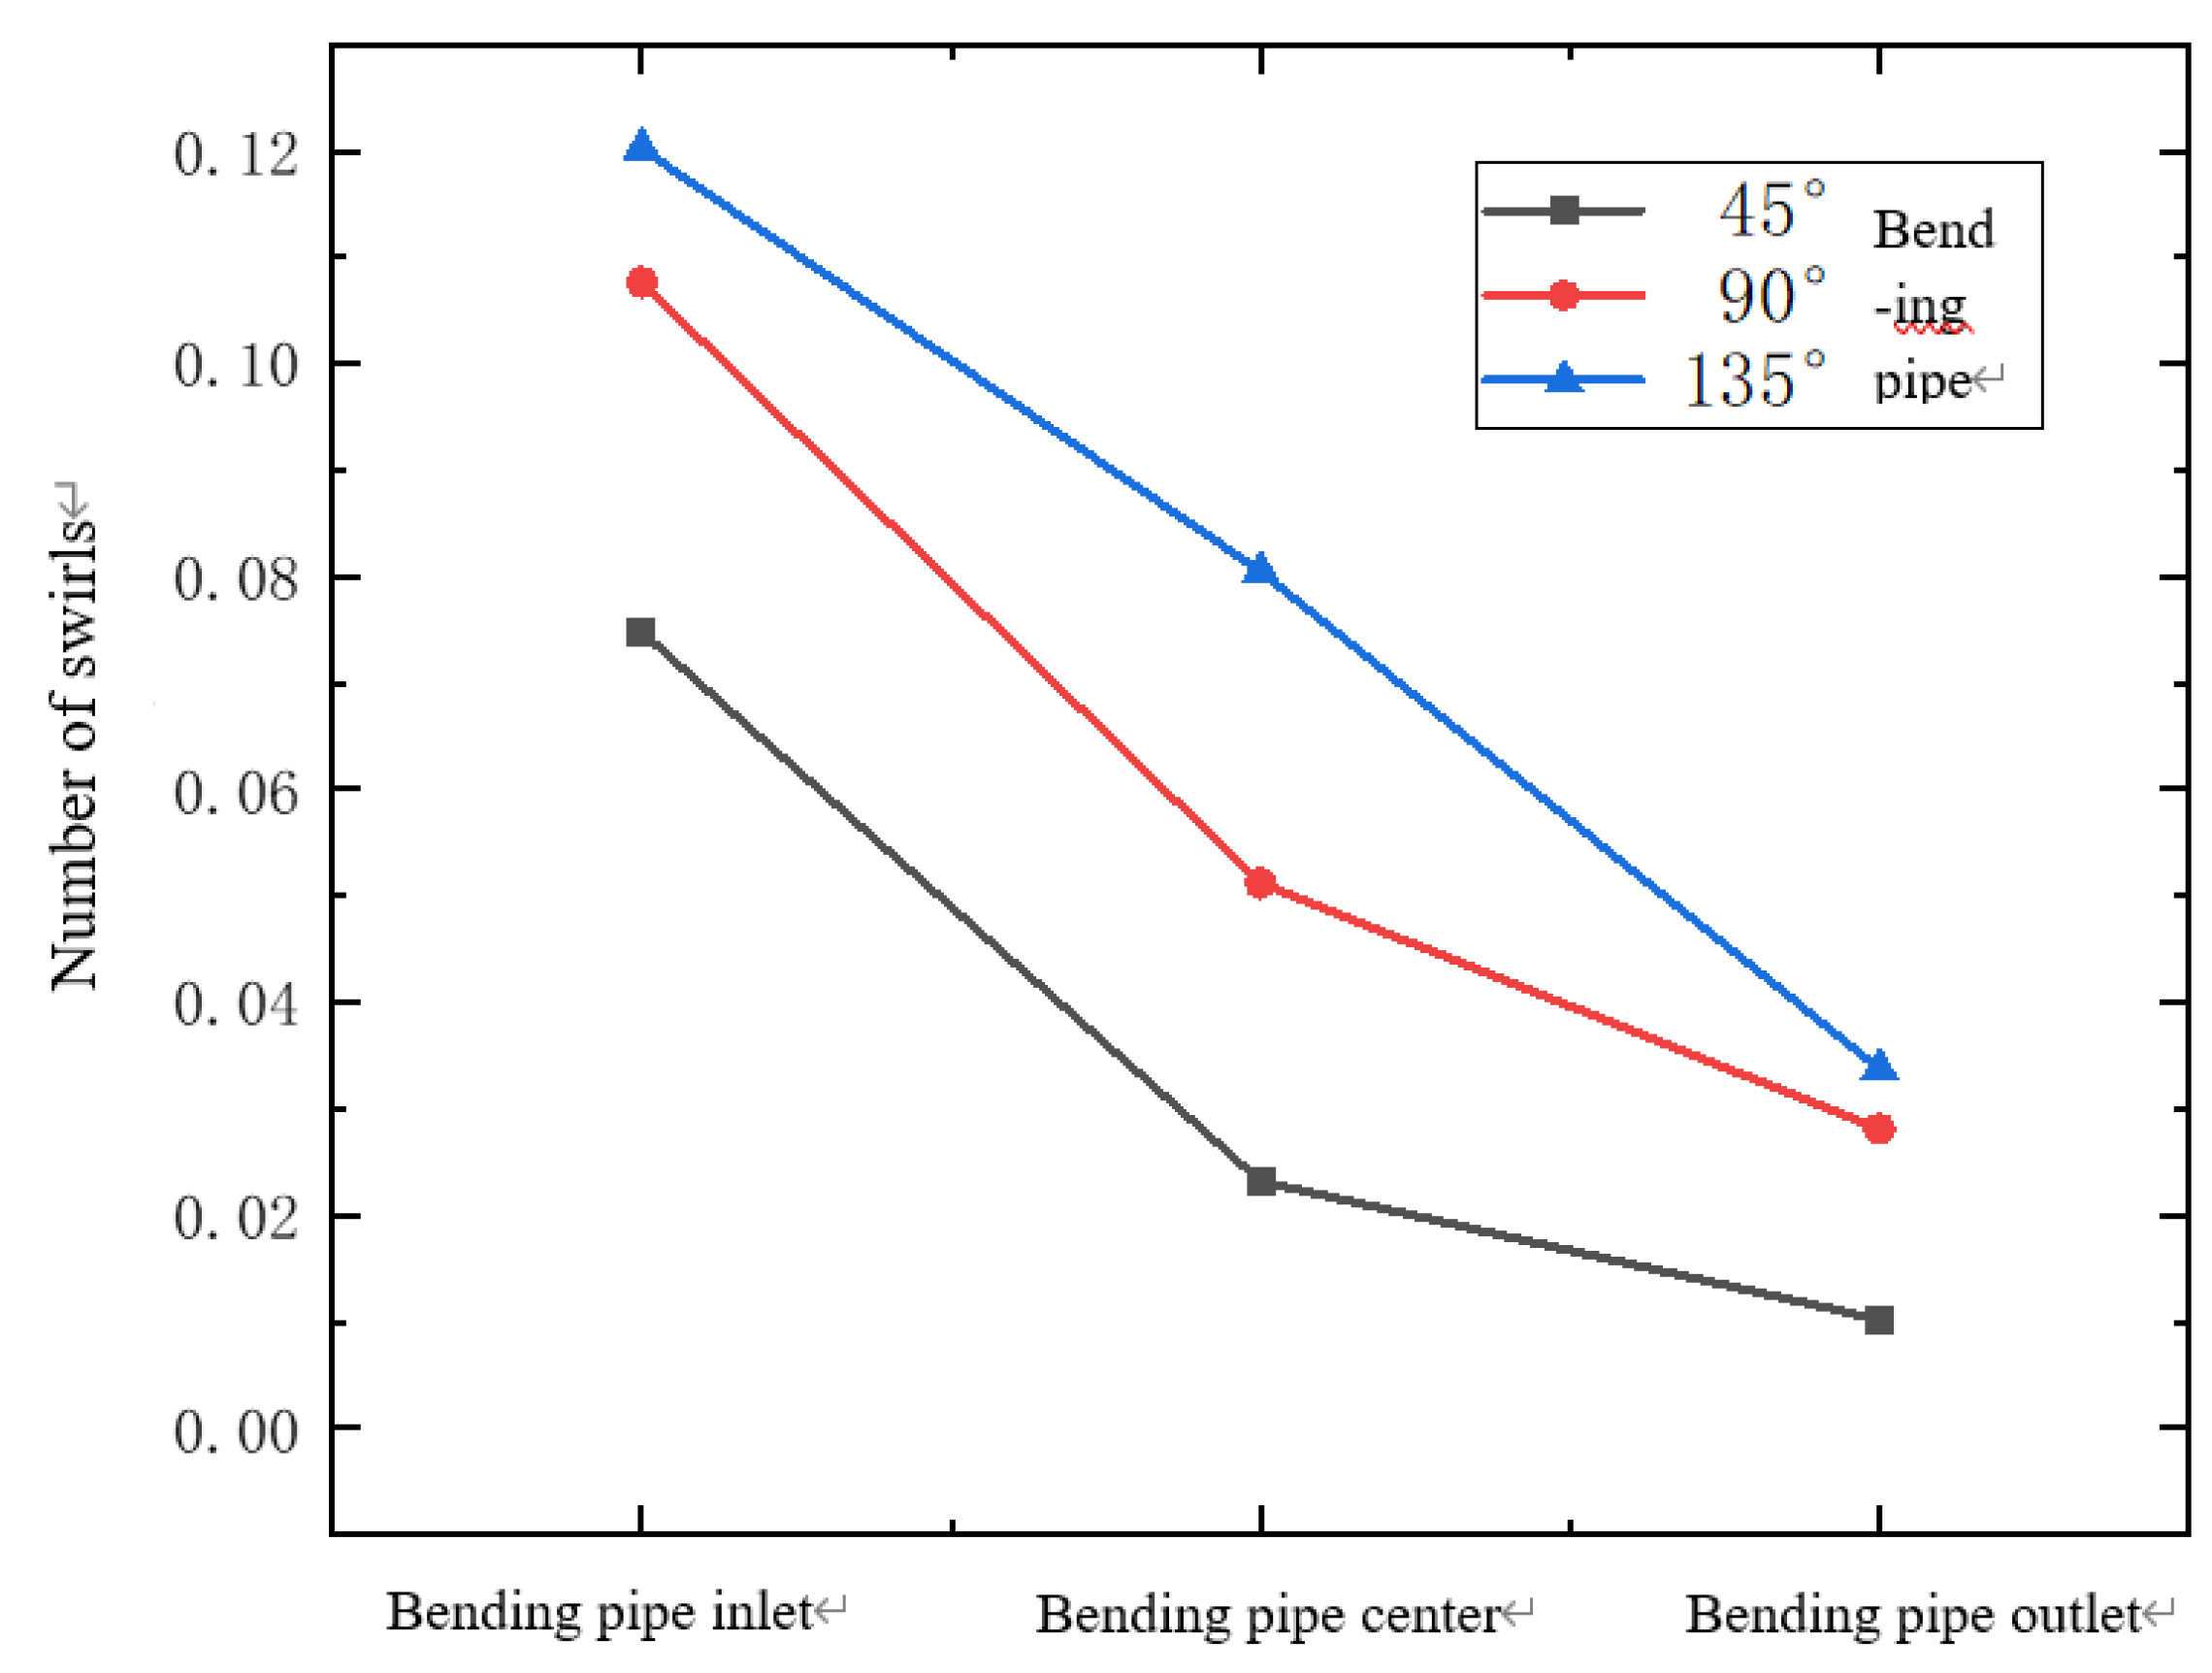
Figure 9 shows the change of swirl number at the inlet, middle and outlet positions of the Bending pipe with different bending pipe angles under the same flow conditions. It can be seen from the figure that the number of swirling flow into the bending pipe is different with different bending pipe angles. Among them, the larger the Angle of the bend, the larger the number of swirls when entering the bend, indicating the stronger the strength of the spiral flow. However, As the fluid flows through the bending pipe, the swirl number continues to decrease and the intensity of the spiral flow continues to weaken, but the larger the Angle of the bend, the larger the swirl number at the same position.
The following
Table 2 statistics the swirl number and total swirl number of different positions of the bend pipe with different bend diameter ratio. It can be seen that swirl number decreases continuously when the fluid flows through the Bending pipe, and the larger the bending pipe diameter rate, the greater the change of total swirl number. Different rate of bending pipe to diameter leads to different lengths of bending pipe sections, while spiral flow decays with length, so the change of swirl number per unit length was calculated respectively. The calculation results show that the larger the rate of bending pipe to diameter, the slower the change of swirl number, indicating that spiral flow decays more slowly, but the weaker the intensity when flowing out.
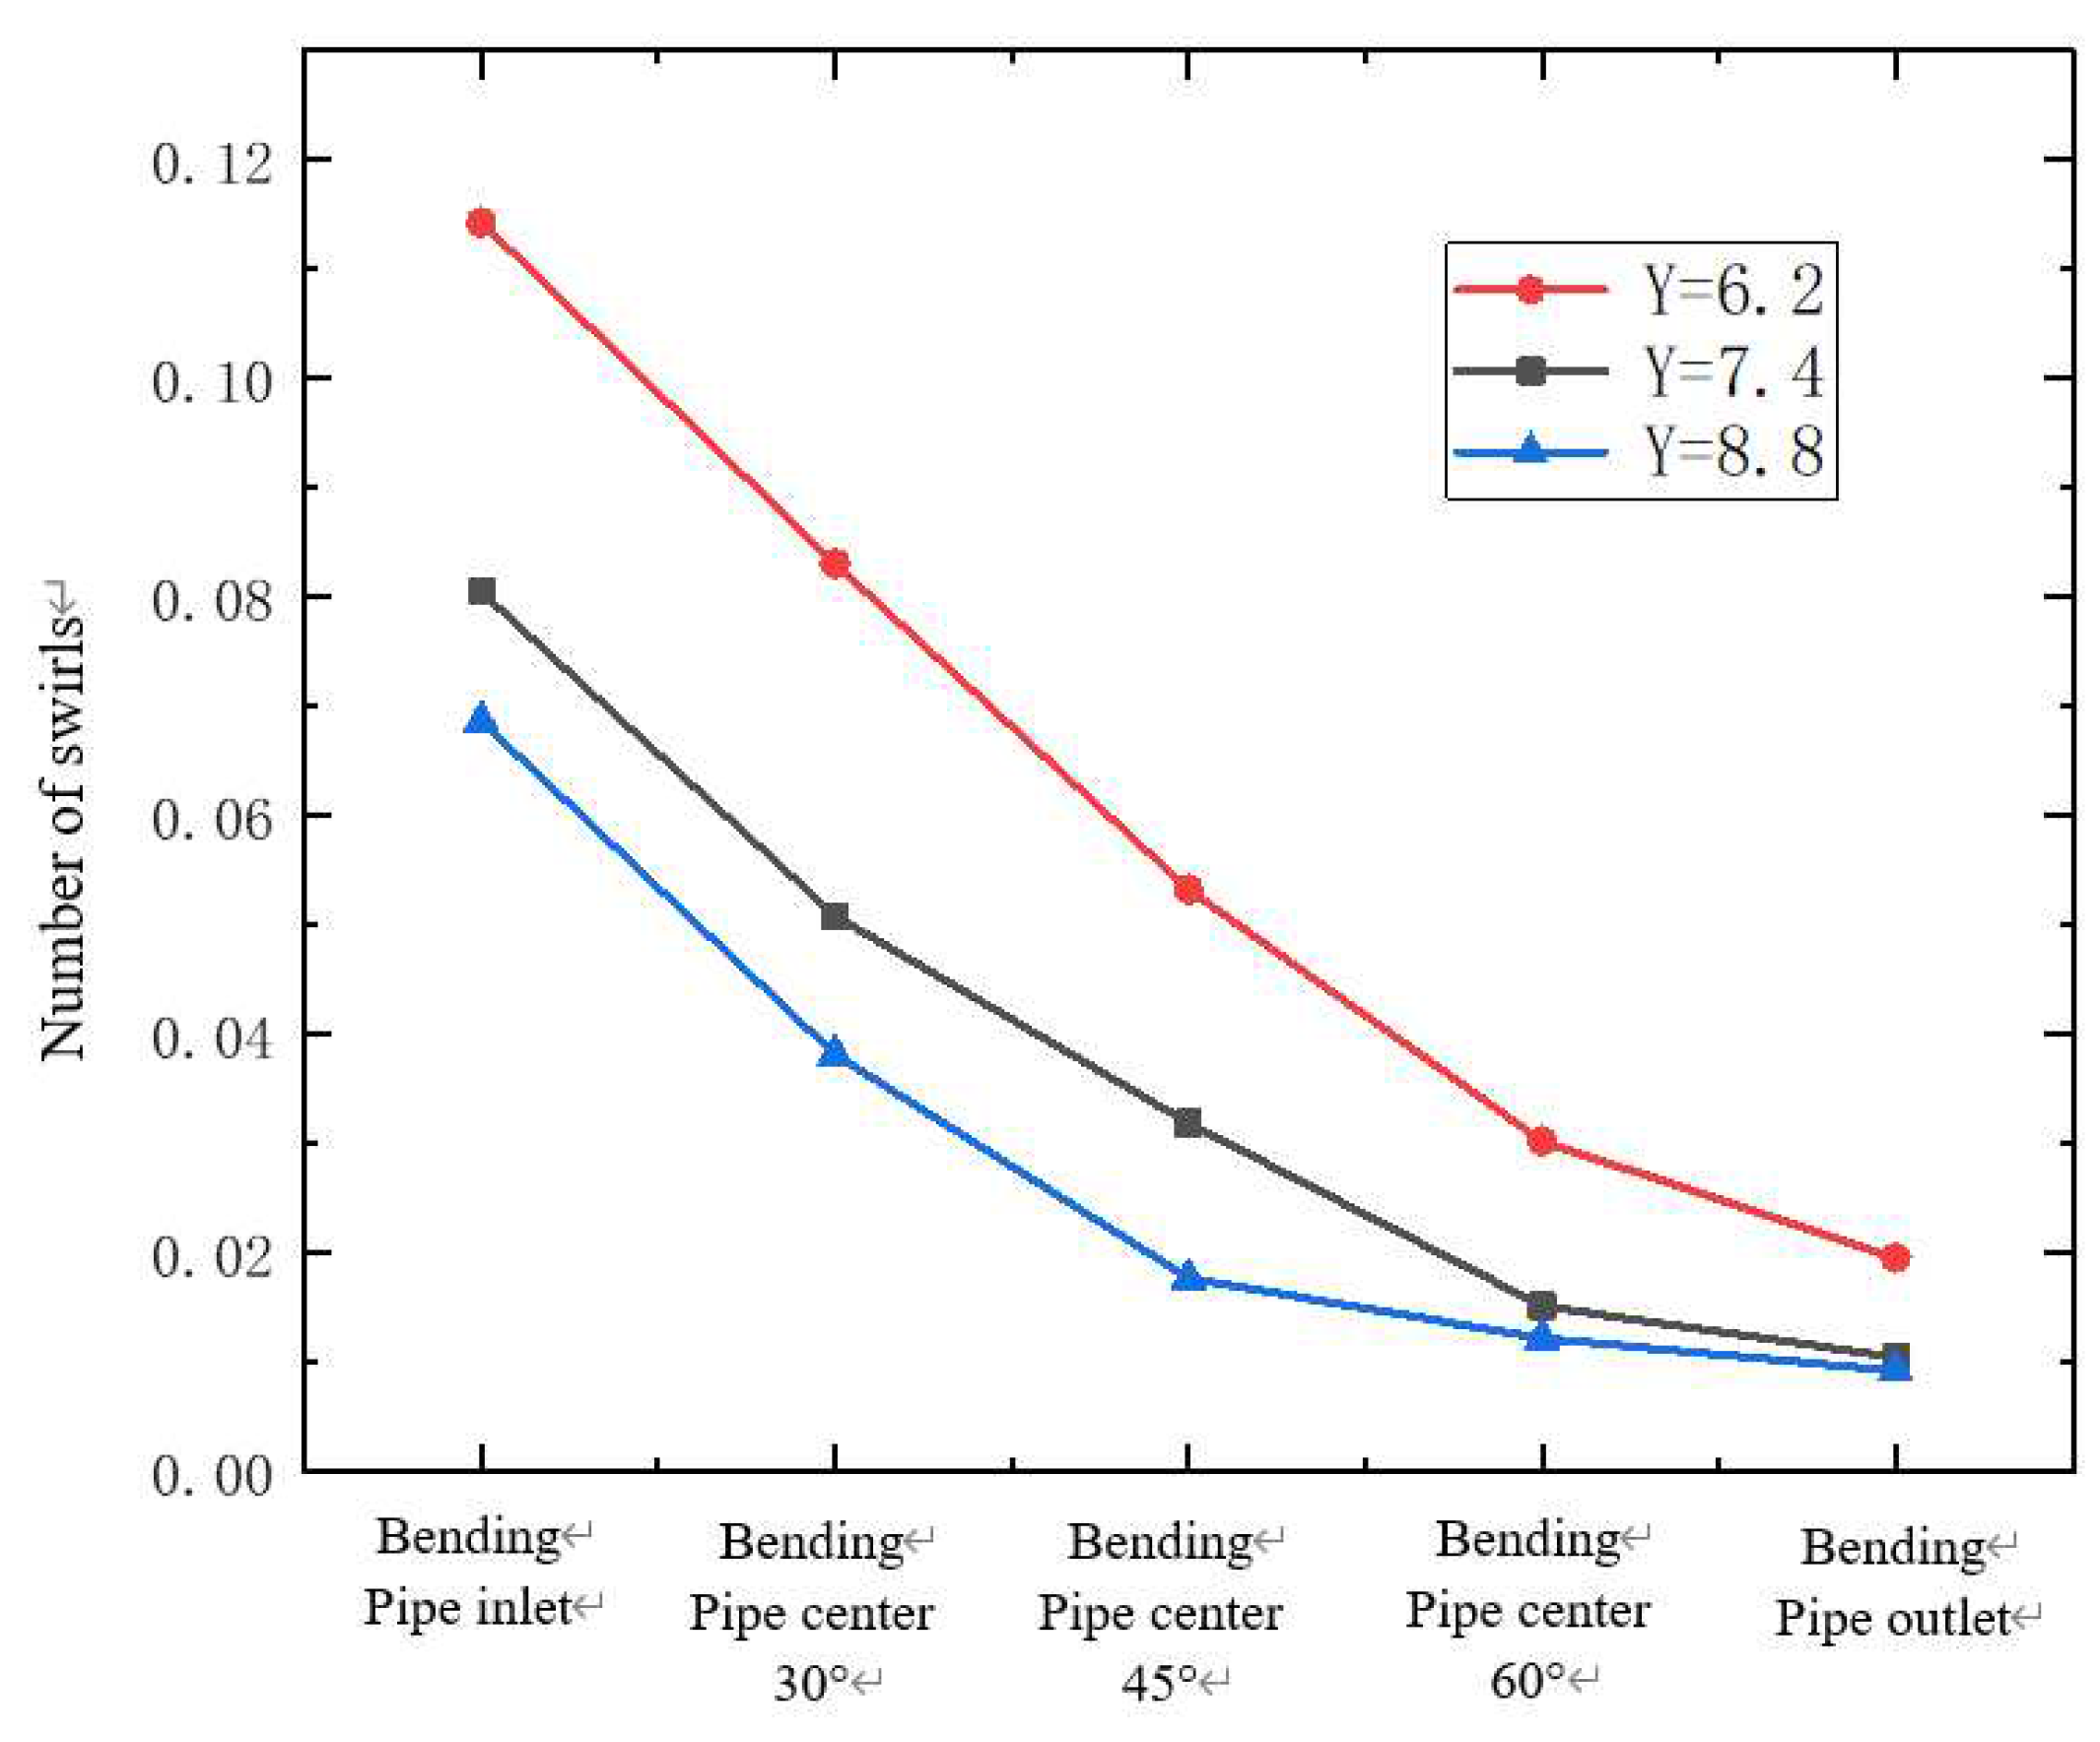
Figure 10 shows the change of swirl number at different positions of the bending pipe under different torsion rates. It can be seen from the figure that the smaller the torsion rate, the larger the swirl number when entering the bending pipe, and the larger the swirl number at the same position as the fluid continues to flow. This shows that the smaller the torsional ratio is, the larger the initial swirl number is, the stronger the intensity of the spiral flow is, and the longer the flow distance is maintained.
Figure 11 shows swirl number variation of curved pipe at different positions under different Reynolds number conditions. The greater the Reynolds number, the greater the swirl number when the fluid enters the bending pipe, and the greater the swirl number at the same position as the fluid continues to flow. The Reynolds number is mainly reflected in the flow velocity during the flow process. The Reynolds number is larger , so the flow velocity is larger. After the action of the torsional belt, the relatively larger the tangential velocity obtained by the flow, and the larger the swirl number, indicating that the increase of Reynolds number is conducive to the maintenance of the spiral flow strength.
3.2. Residence time distribution of hydrate particles
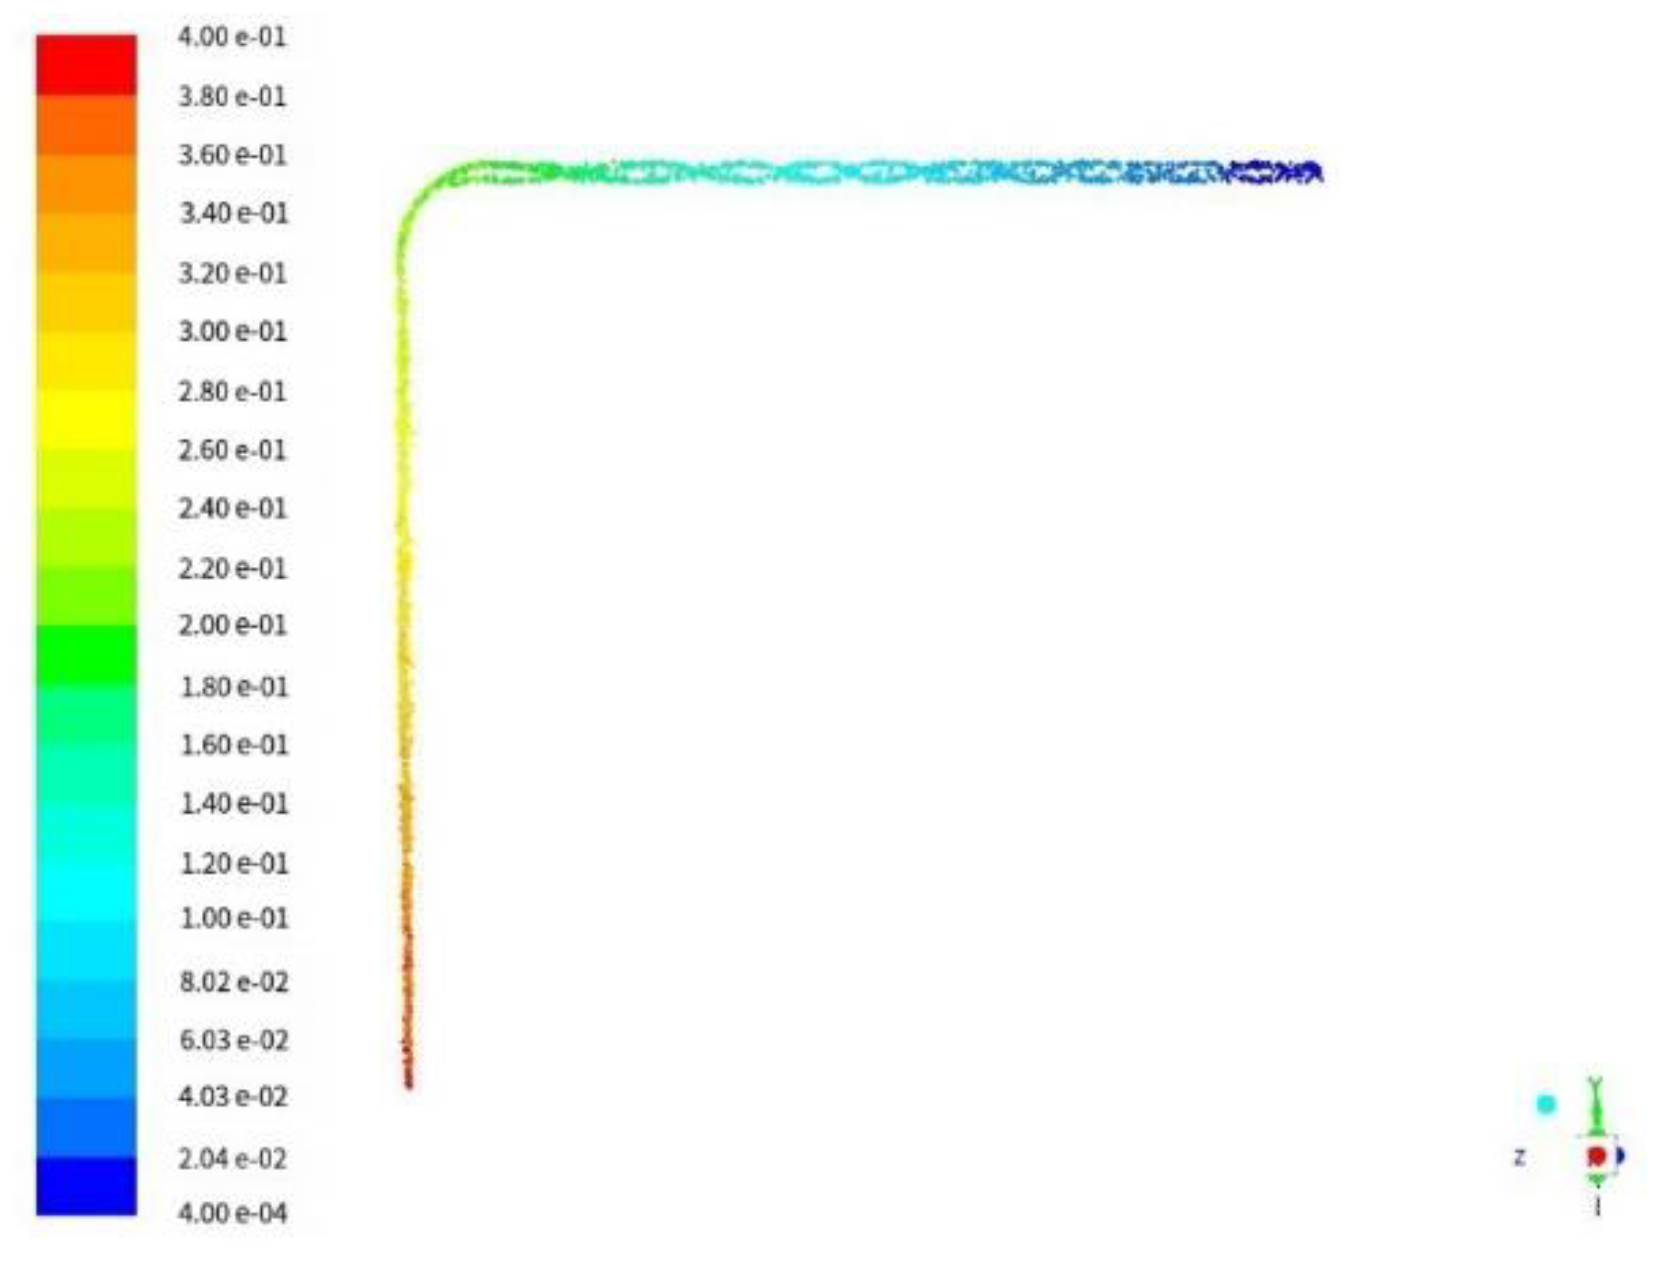
As shown in the following figure, the residence time distribution of hydrate particles after stable flow under the condition of torsional rate of 6.2 and Reynolds number of 10,000 is shown for a 90° bending pipe with bend to diameter ratio of 4. It can be seen from the figure that the particles can maintain long distance spiral flow in the pipe after flowing through the twisted zone. At the entrance of the pipe, the particles continue to flow in the form of spiral flow due to the action of twisted band and high Reynolds number, and the particles stay for a short time. Hydrate particles move spirally along the pipe, and the strength of spiral flow attenuates due to the resistance along the pipe. After exiting the bending pipe, the spiral flow of particles gradually disappears under the action of centrifugal force and gravity, and the residence time of hydrate particles is obviously prolonged. When they flow to the exit of the pipeline, the retention time of the particles is more than 1.5 times that at the bending pipe, and deposition occurs, which is not conducive to safe transportation.
Figure 12.
Residual time distribution of hydrate particles.
Figure 12.
Residual time distribution of hydrate particles.
3.3. Residual distribution of hydrate particles
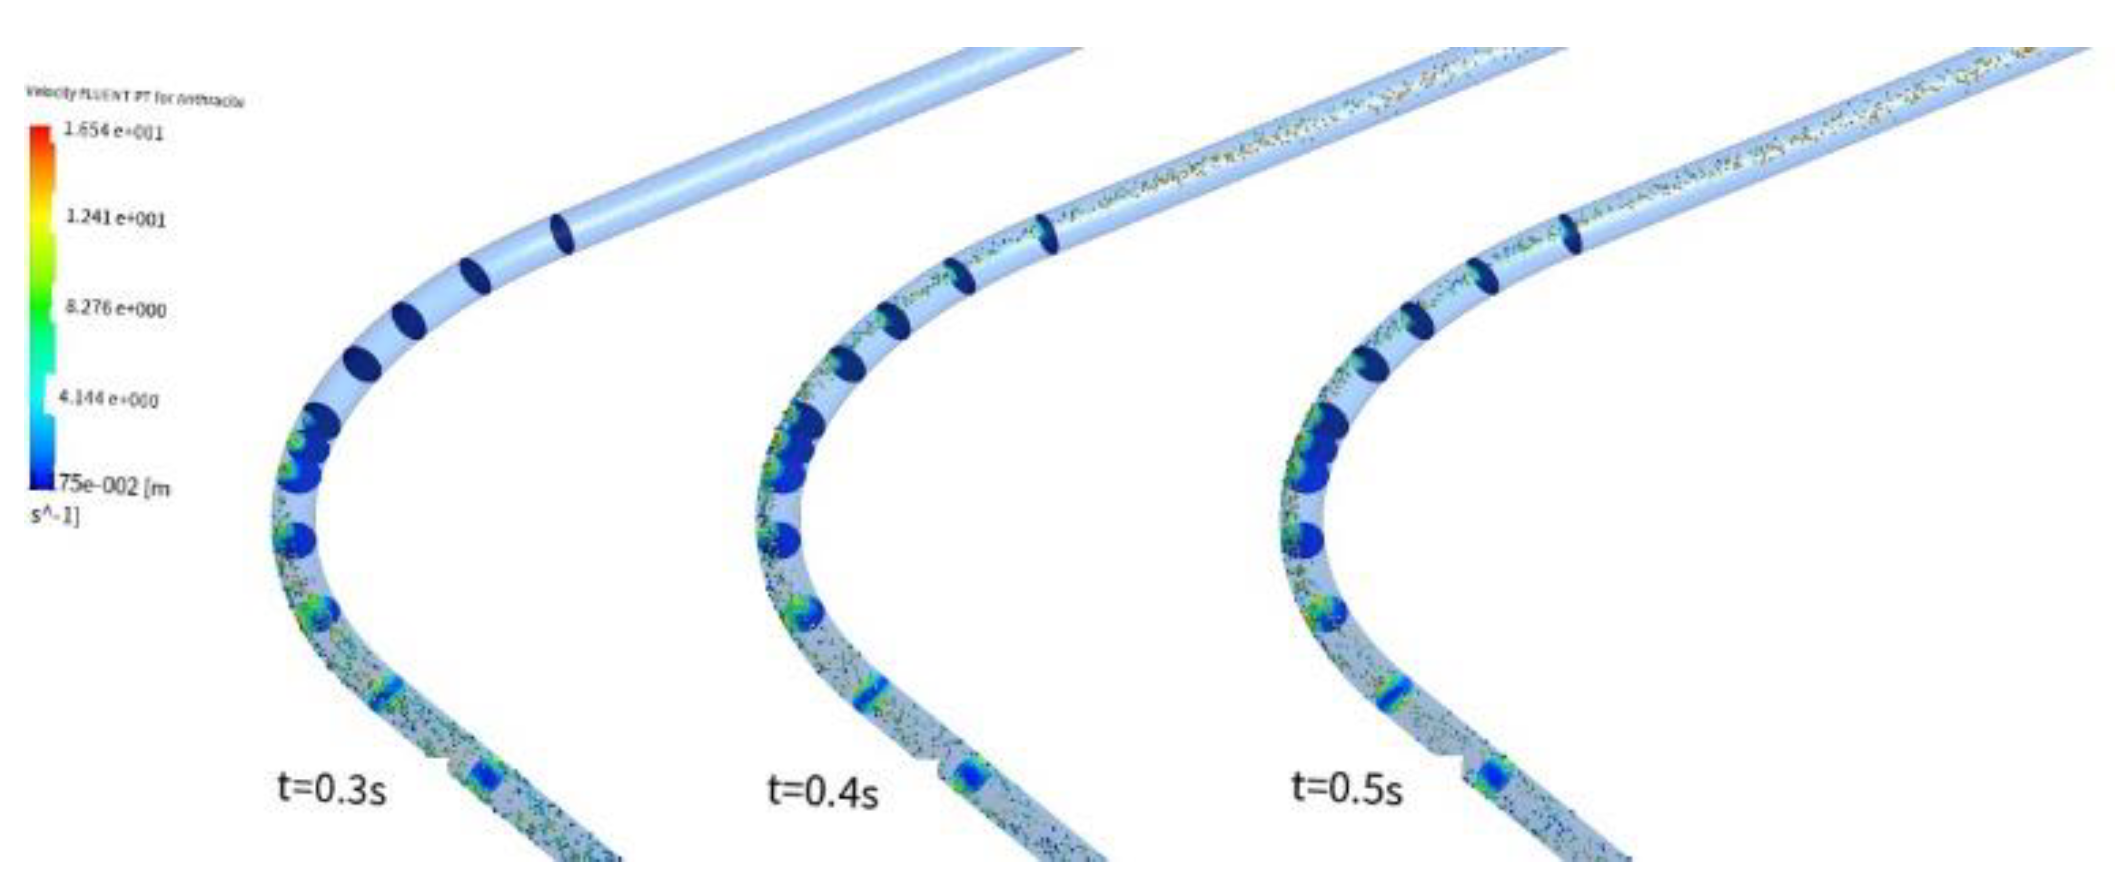
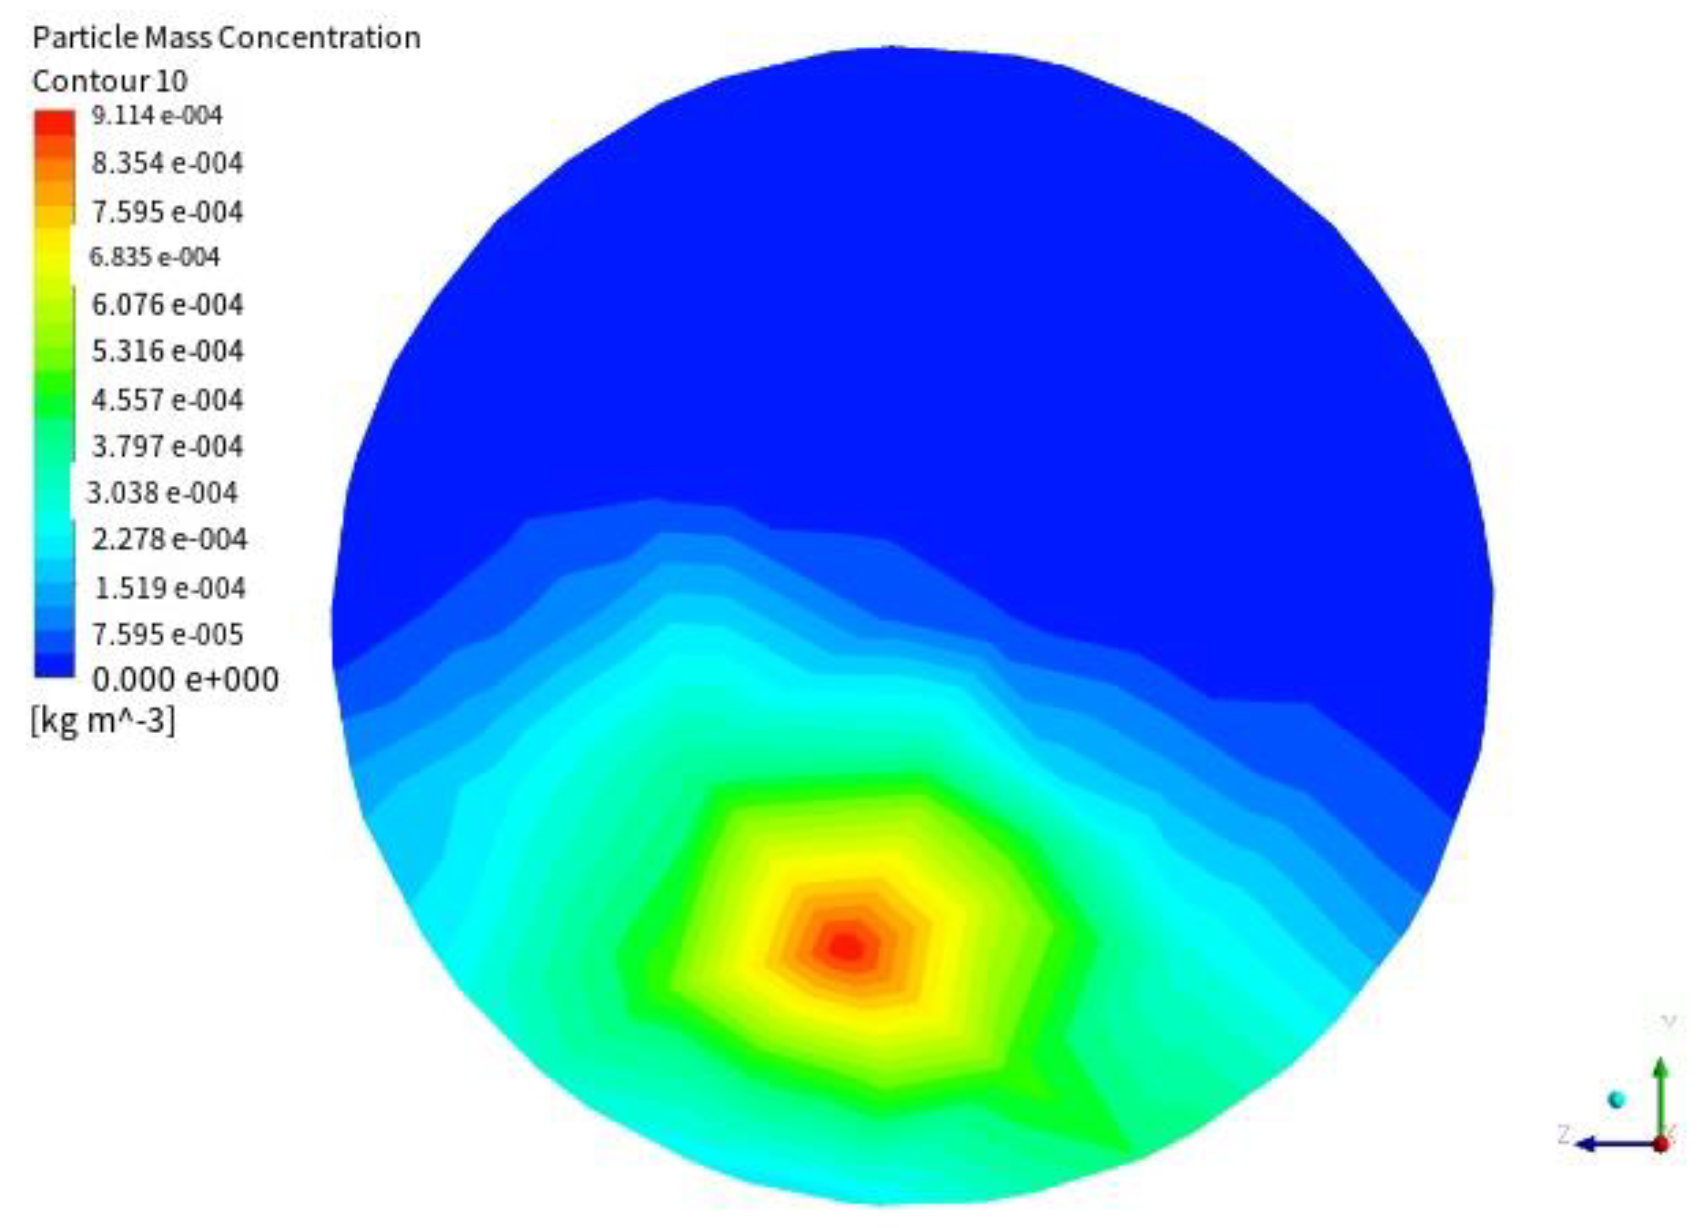
Figure 13 shows the position and mass concentration distribution of particles in different sections of curves at different time points. It can be seen from the figure that under the action of high flow rate and strong spiral flow, when the fluid carries particles into the bending pipe, the maximum mass concentration is distributed near the wall, and the concentration in the center of the pipe is relatively low. This is because spiral flow is a kind of movement with tangential velocity and axial velocity. The tangential velocity makes the particles rotate highly under the carrying of the fluid and are evenly dispersed, while the axial velocity ensures that the fluid can continue to flow forward. This swirling floating characteristic makes it have a stronger carrying capacity for solid particles and is not easy to deposit. When the particles flow into the bending pipe, due to the effect of spiral flow and the centrifugal force of the bending pipe, the particles are concentrated on the upper outer side of the pipe at a higher speed, and accompanied by the fluid continues to move forward. With the increase of the flow distance, the spiral flow gradually attenuates. After the particles flow out of the bending pipe, they concentrate in the lower part of the pipe due to the action of gravity. Under the action of high flow rate, they eventually flow out of the pipe with the fluid, as shown in
Figure 14.
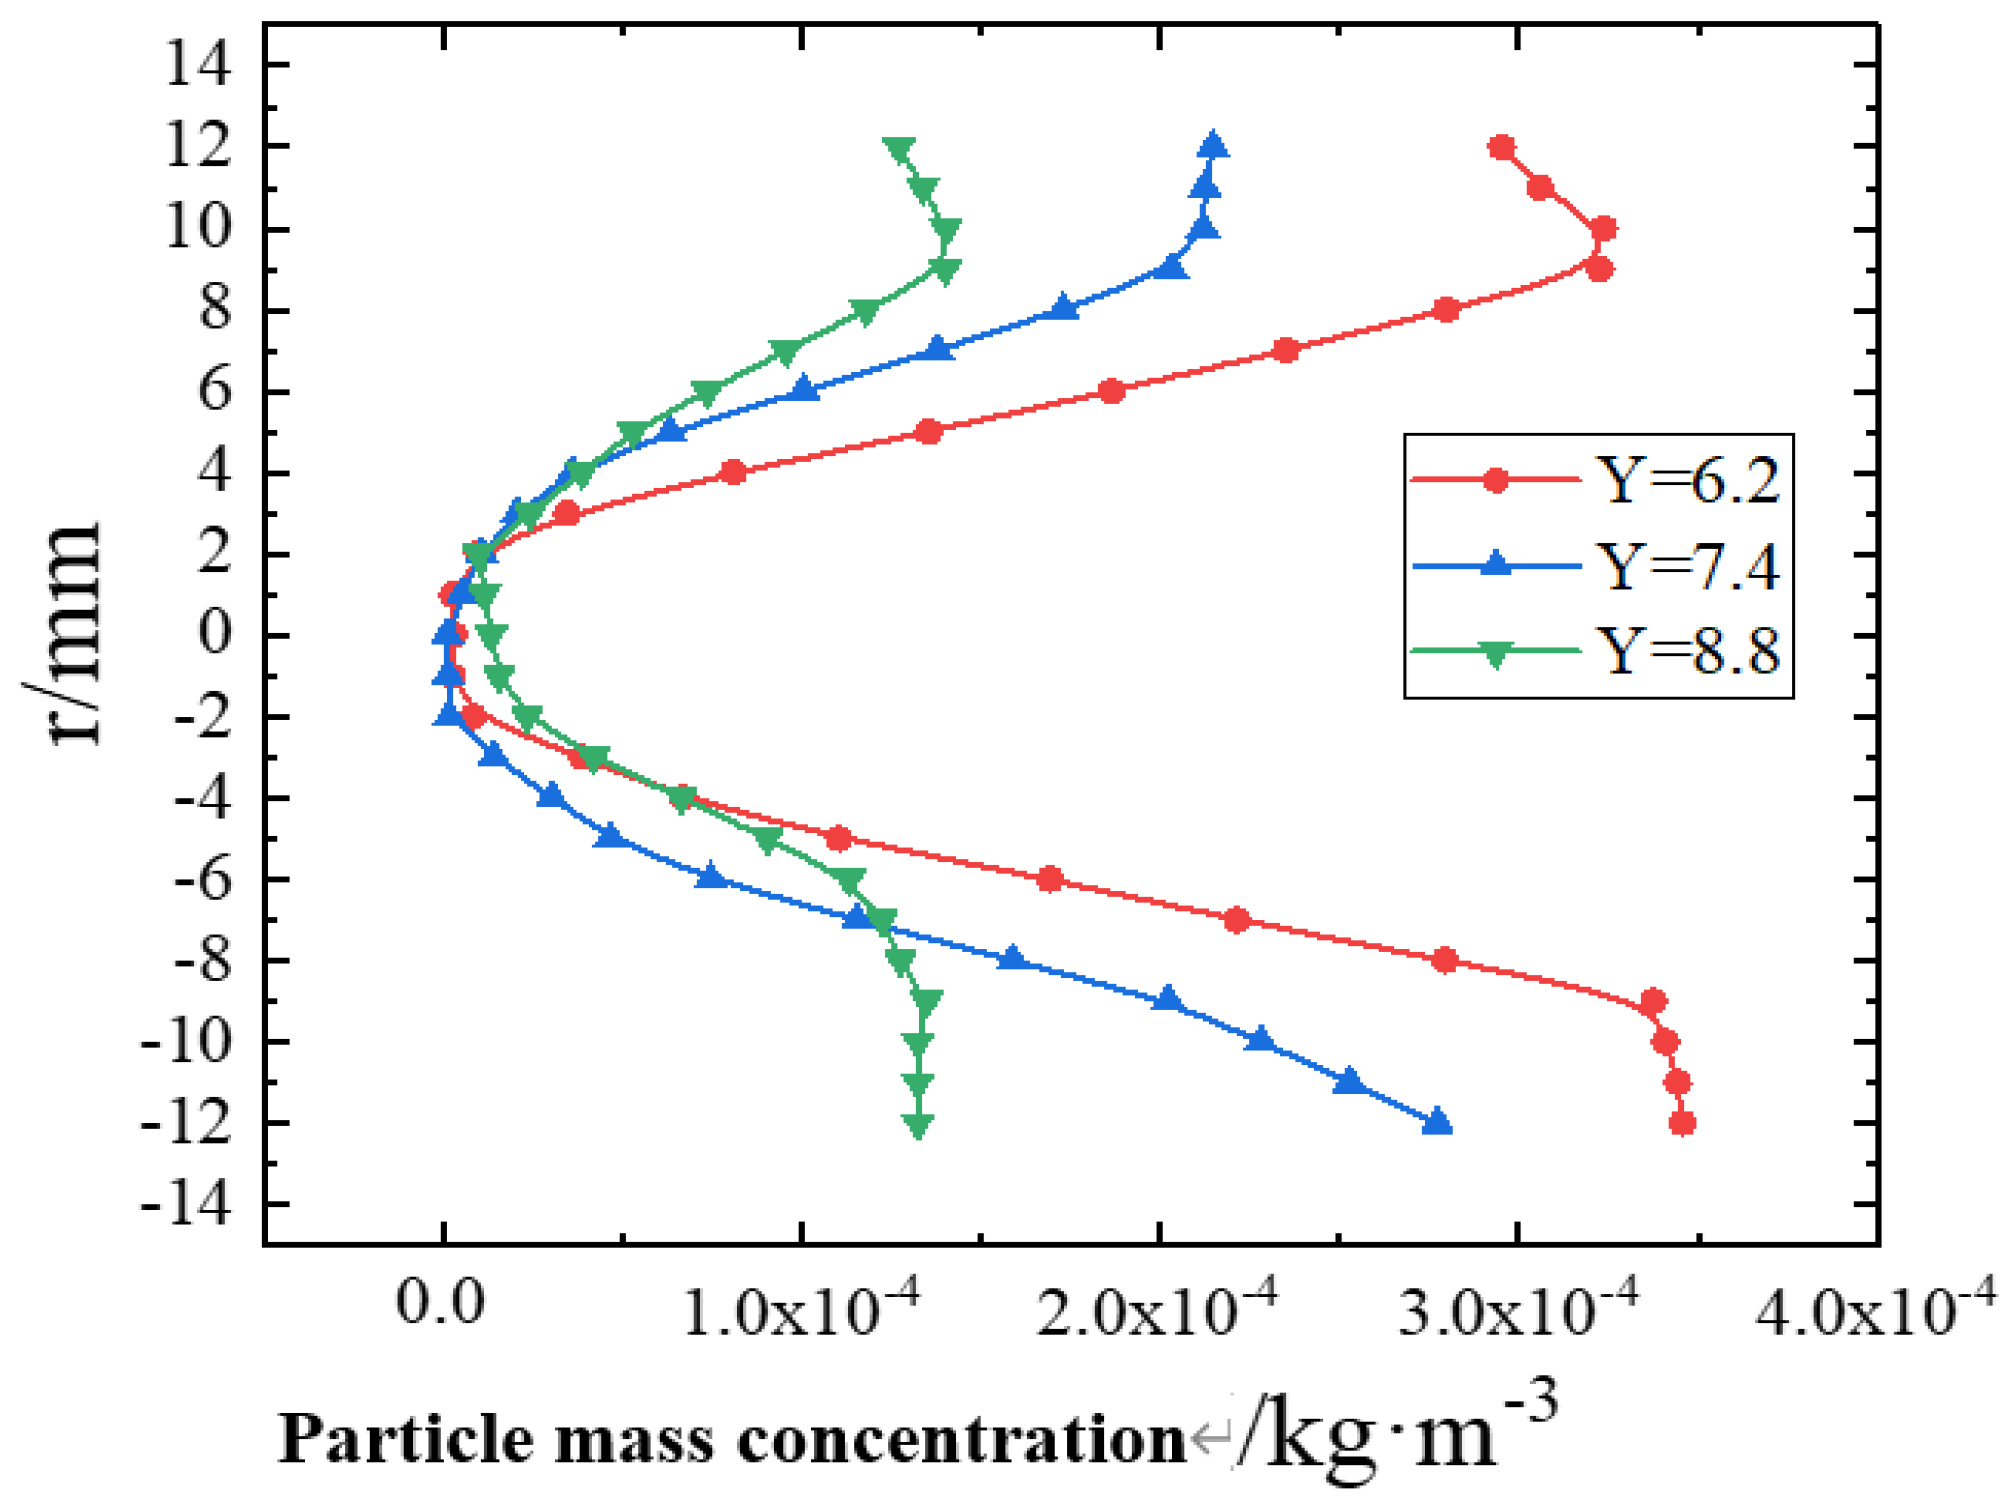
Figure 13 shows the distribution of particle mass concentration on the center line of the section of the pipe at different positions under different torsion rates. Due to the action of gravity and centrifugal force, particles are squeezed on the pipe wall with the fluid, resulting in the loss of part of the kinetic energy. At medium and low flow rate, particles are difficult to be picked up, and deposition will occur. Under the effect of spiral flow produced by the twisted belt, the particles are evenly dispersed near the wall before flowing into the bending pipe, and the mass concentration in the center is low, showing a bend structure distribution, and the smaller the torsion rate, the more obvious the effect of spiral flow. With the increase of the flow distance, the tangential force generated by the spiral flow on the particles gradually weakens under the action of gravity and centrifugal force, the effect of the spiral flow gradually weakens, the particles begin to gather to the center, and the dispersion effect gradually disappears. The smaller the torsion rate of the twisted belt, the lower the particle concentration when the particles flow out of the bending pipe, indicating that a large number of particles flow out of the bending pipe with the fluid. It can be seen that the addition of twisted belt can prevent particles from depositing on the wall of the pipe, improve the conveying capacity of the fluid to the particles, and it is beneficial to the safe operation of the transmission pipeline.
3.4. hydrate particle deposition law
In order to study the deposition of hydrate particles in the pipeline, the parameter of particle deposition rate was introduced through the reference of relevant literature [
28,
29], which refers to the percentage of particles deposited in the pipeline per unit time to particles entering the pipe section per unit time. The expression is as follows:
Among, Ndep is the number of particles deposited in the pipe; Nin is the number of particles entering the pipe.
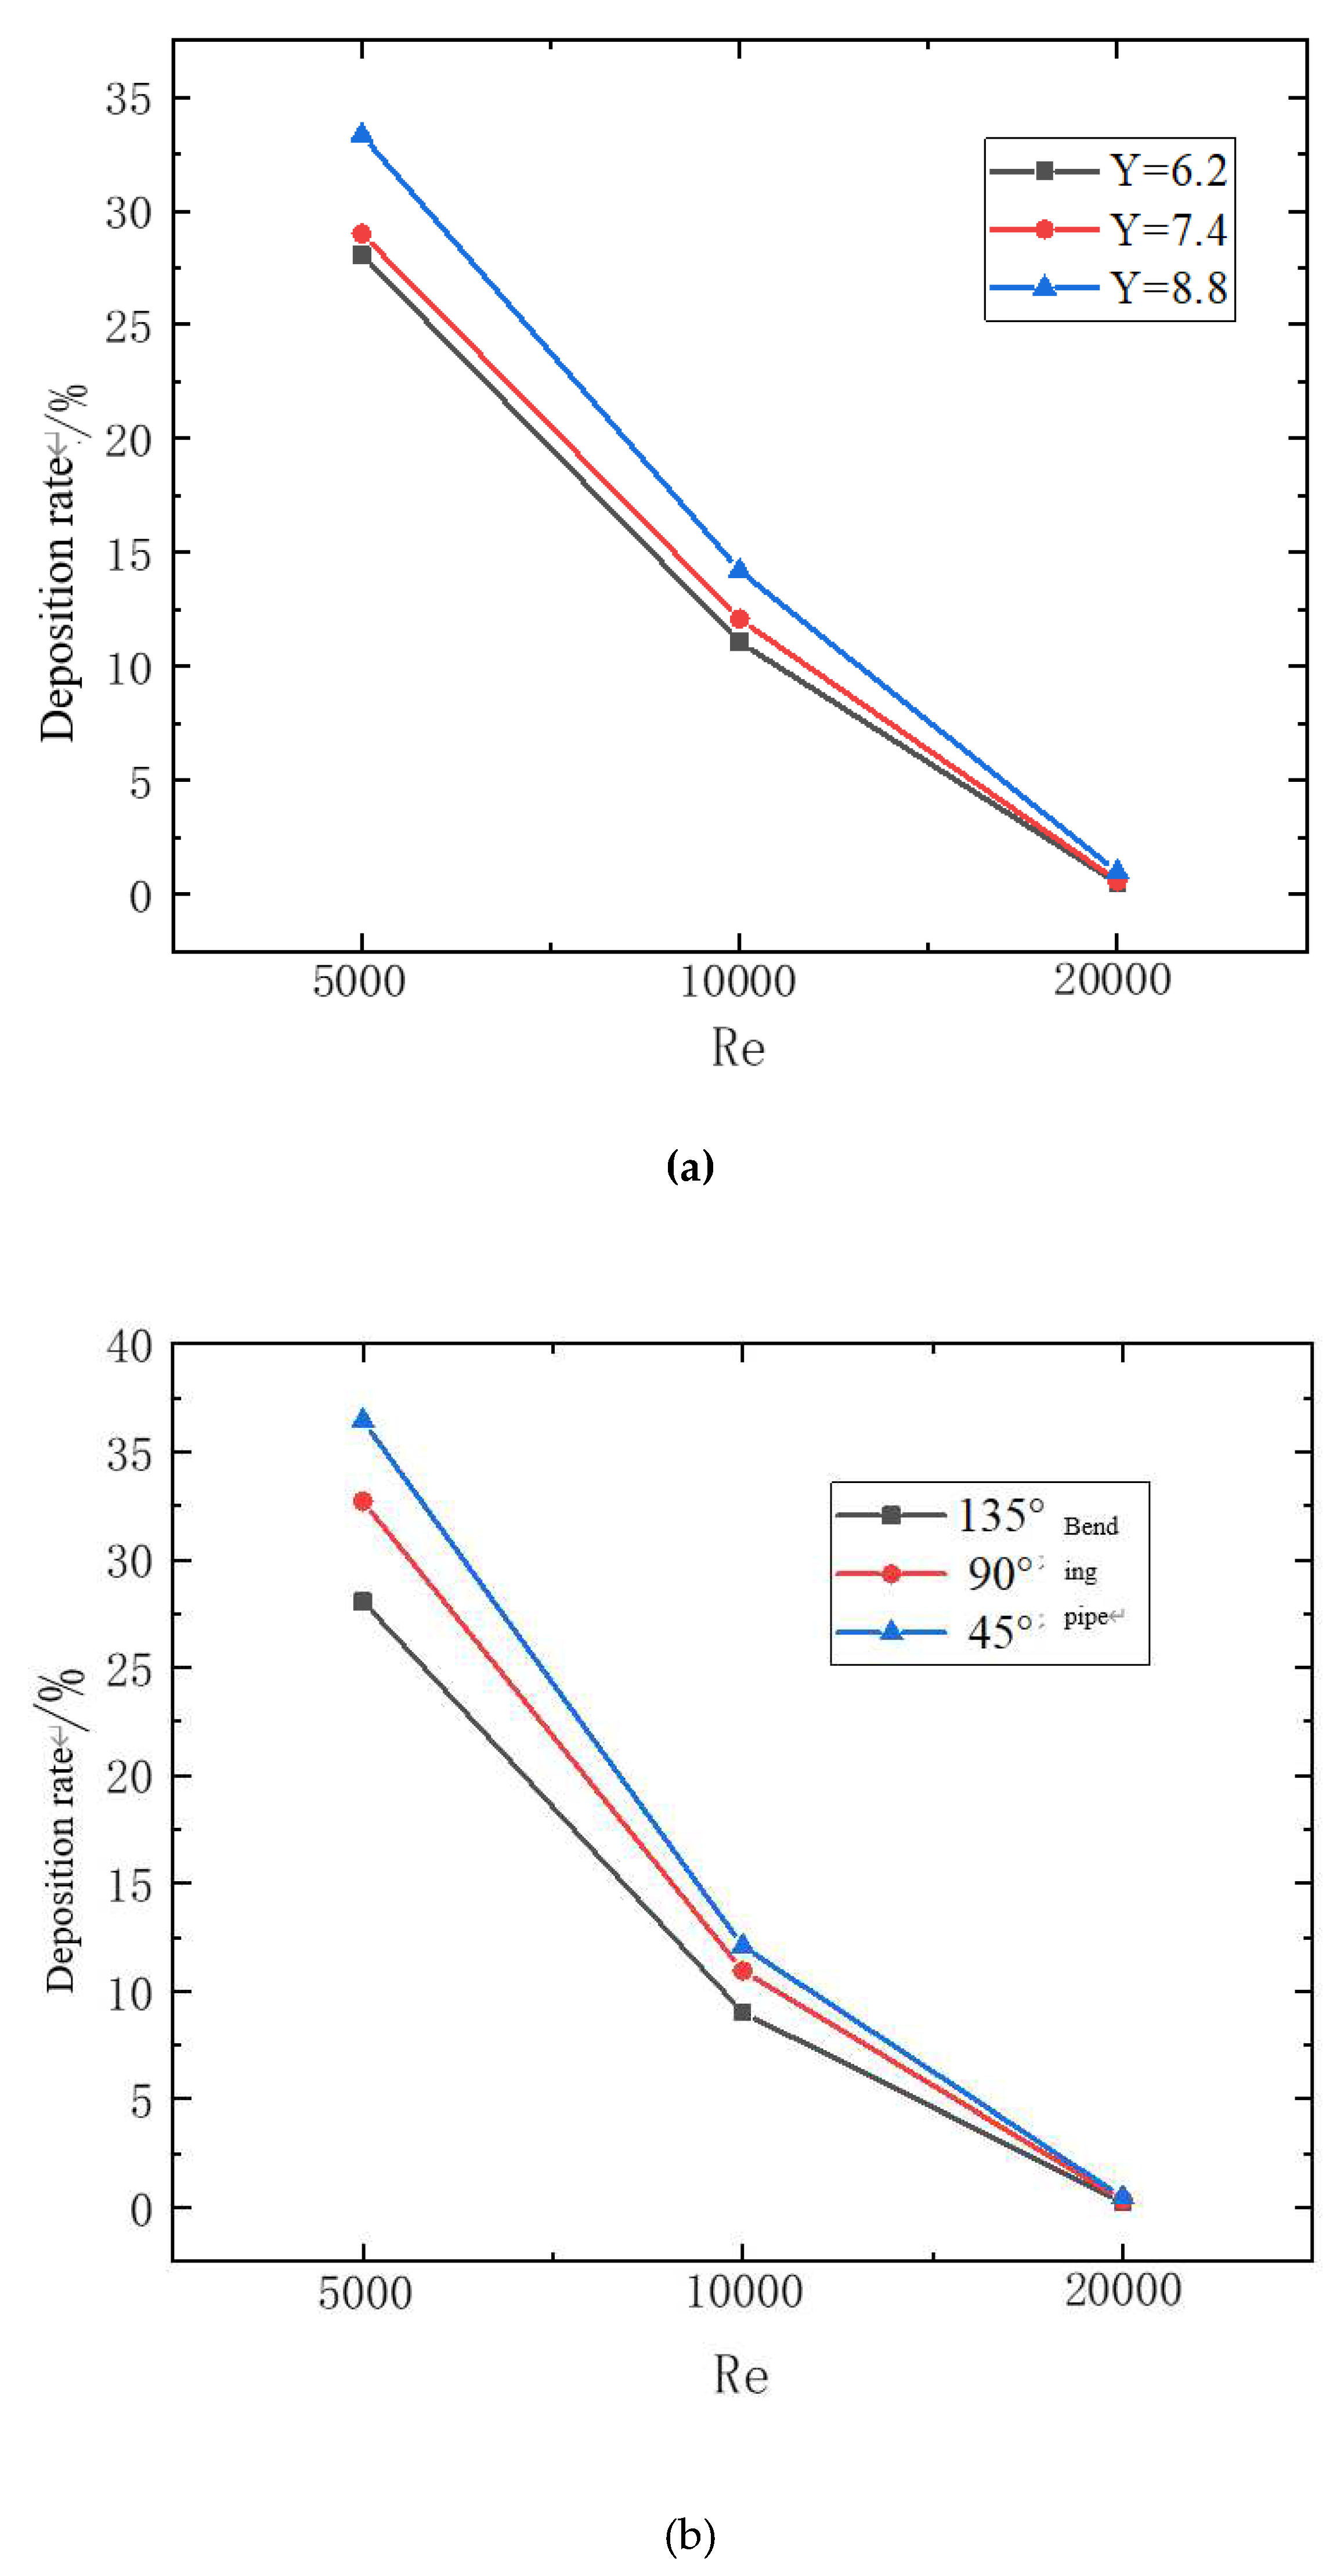
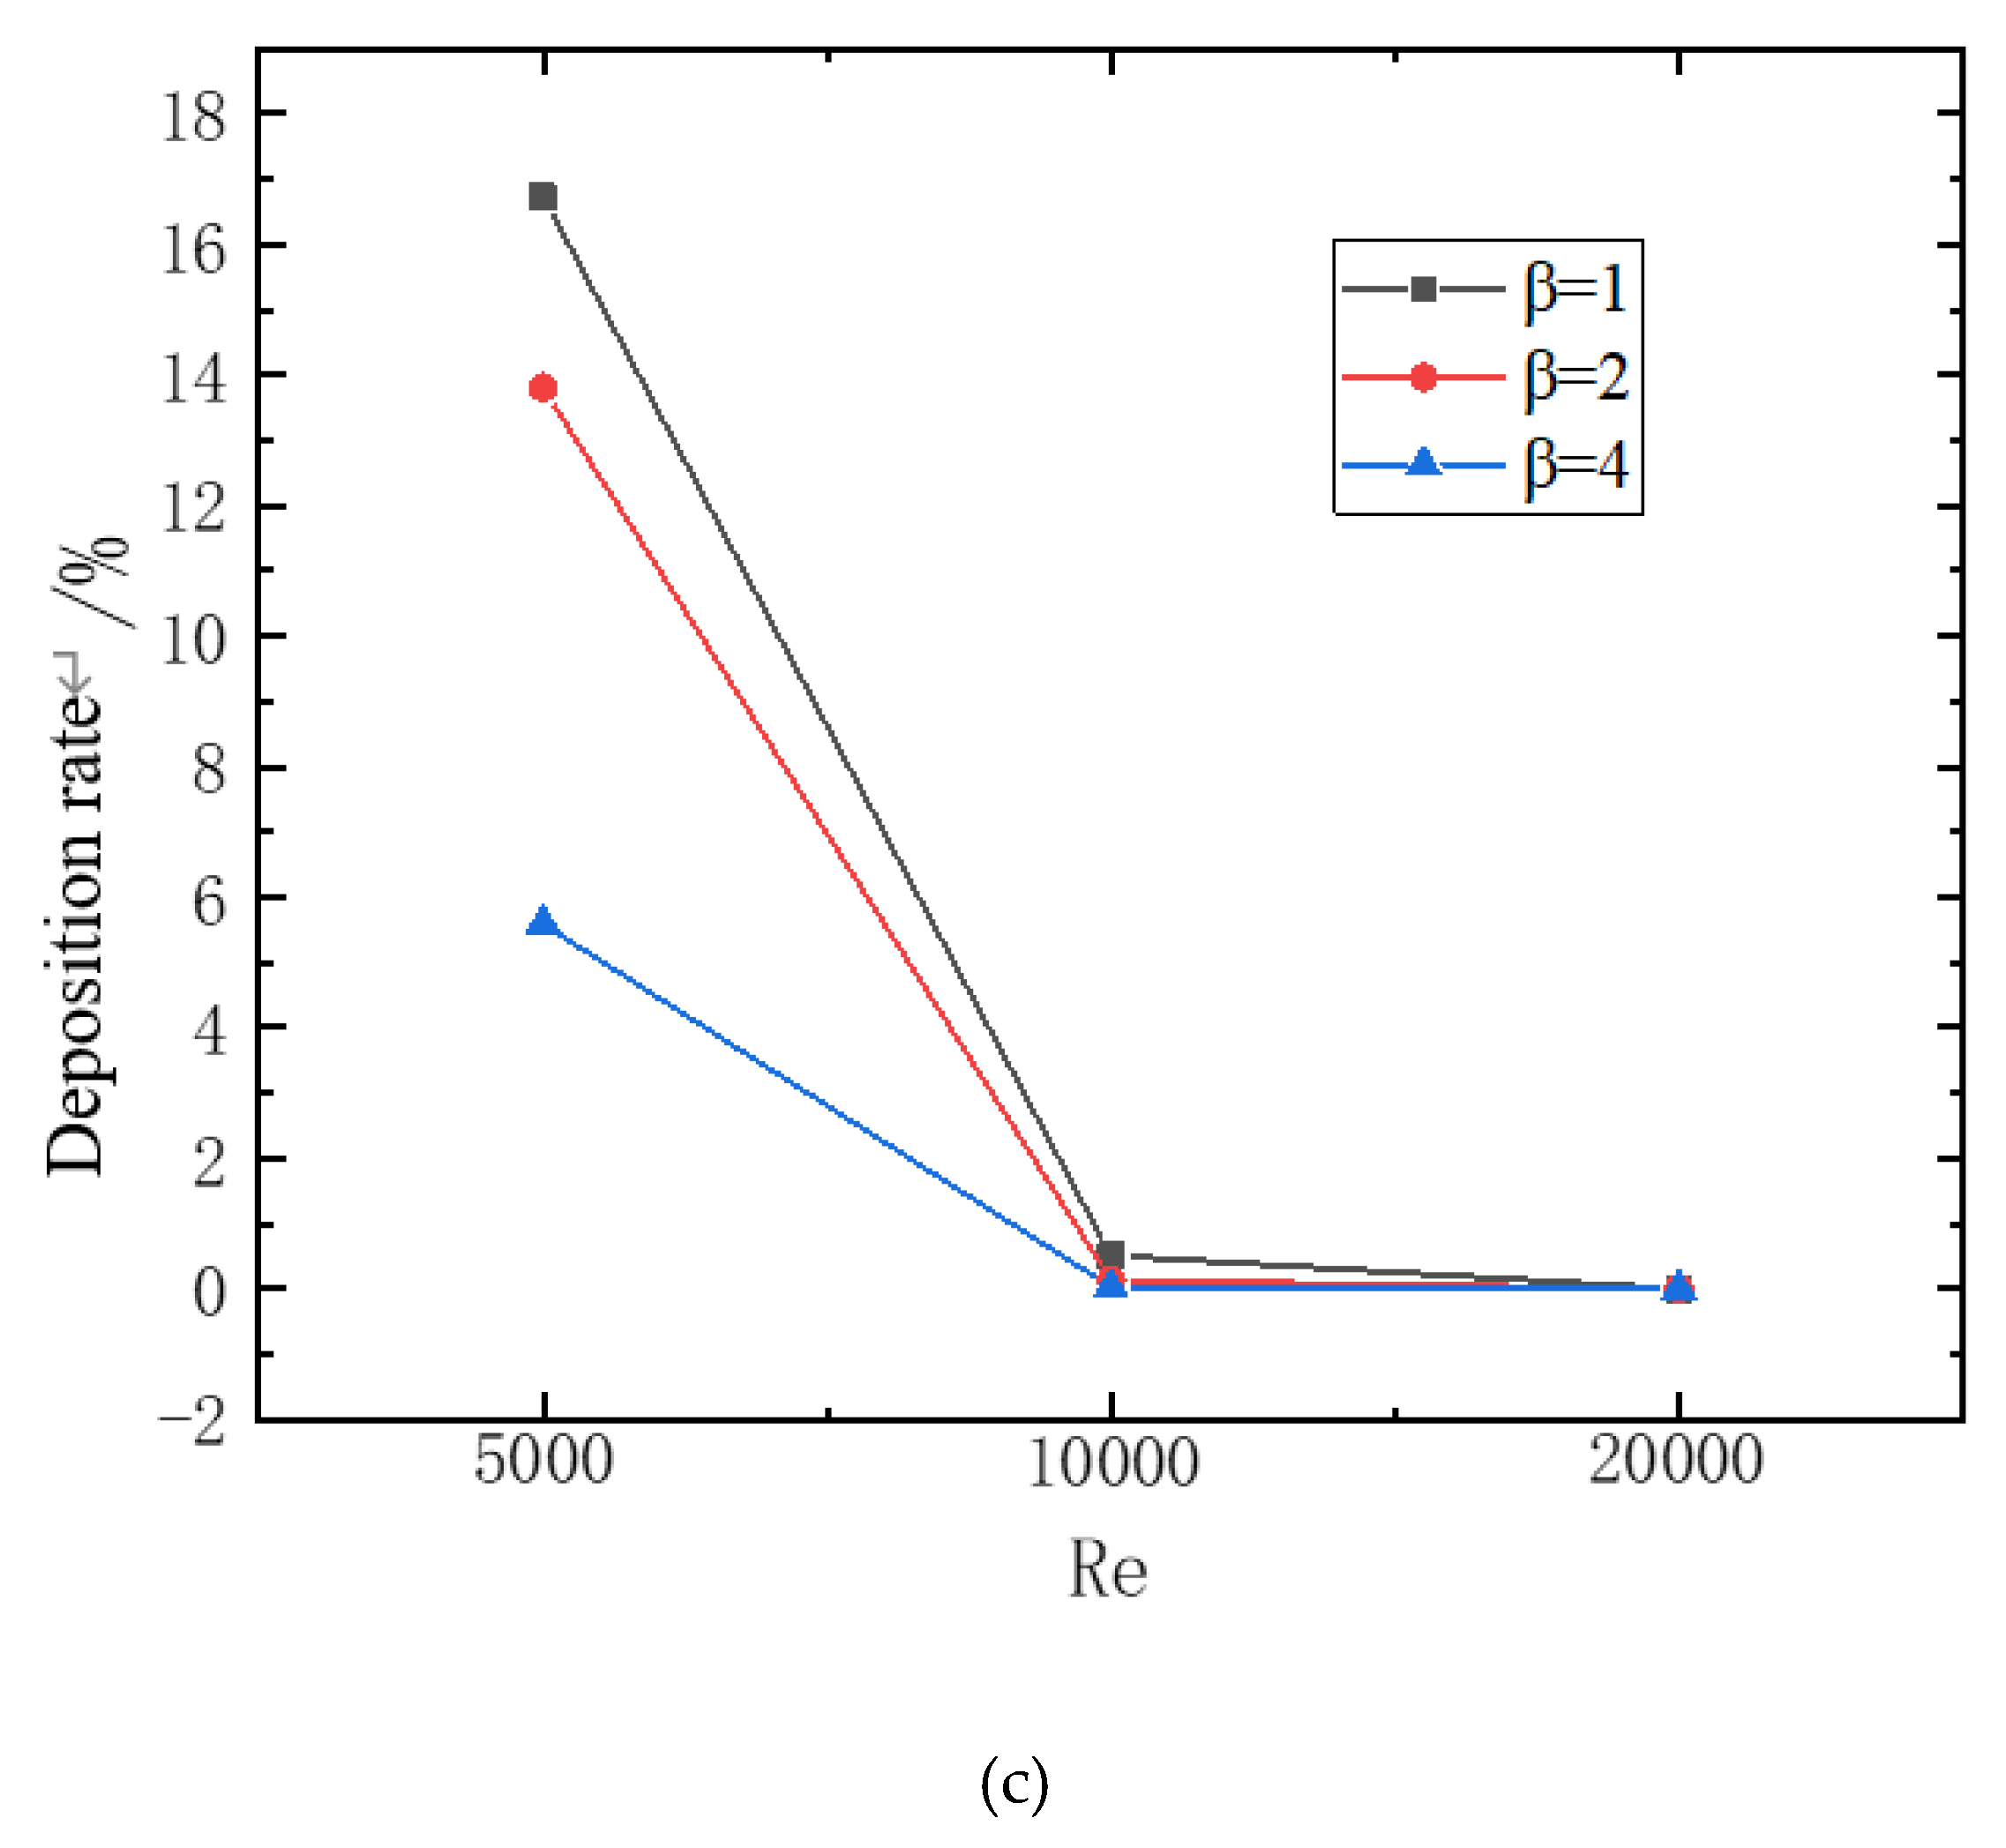
According to the numerical simulation scheme, the deposition law of particles in the bending pipe under different influencing factors (bending pipe Angle, bending pipe diameter rate, torsion rate, Reynolds number) was analyzed. The variation curve of particle deposition rate under different influencing factors is shown in
Figure 16 below.
Figure 16-a shows the relationship between deposition rate and Reynolds number and torsion rate. It can be found from the figure that the deposition rate decreases rapidly with the increase of Reynolds number. When the Reynolds number is 20000, the deposition rate is all below 1%. However, with the decrease of the torsional rate, the deposition rate gradually decreases. With the increase of Reynolds number, the strength of spiral flow increases. When other factors are the same, the greater the strength of spiral flow, the more the flow can overcome the influence of gravity on deposition. Therefore, the larger the Reynolds number, the smaller the deposition rate. However, the decrease of the torsional rate enables the fluid to obtain greater helical flow strength, and the particles are not easy to deposit under the action of helical flow shear force, which reduces the deposition rate.
Figure 16-b shows the relationship between the deposition rate and the bending pipe Angle. The larger the bending pipe Angle, the lower the deposition rate. This is because with the increase of the bending pipe Angle, the velocity changes more gently when flowing through the bending pipe, and the loss of fluid velocity and helical flow strength after passing through the bending pipe is smaller. Hydrate particles are more likely to flow out of the pipe carried by gas. Moreover, when the Angle is larger, the particles can be dispersed and are not easily concentrated on the outside of the pipe wall and deposition occurs.
Figure 16-c shows the relationship between the deposition rate and the bending pipe diameter rate. The larger the bending pipe diameter rate, the smaller the deposition rate, and at low Reynolds number, the difference in deposition rate caused by the difference in bending pipe diameter rate is large, and as the Reynolds number increases, the difference in deposition rate caused by the difference in bending pipe diameter rate gradually decreases. This is because with the increase of the bending pipe diameter rate, the change degree of bending pipe shape is relatively gentle, the particle velocity loss is relatively small, and after exiting the bending pipe, the velocity recovers faster, enabling it to flow out smoothly and the deposition rate is low. At low Reynolds number, due to the low kinetic energy obtained by the fluid, the smaller the bending pipe to diameter rate, the more particles tend to gather on the outside of the pipe wall when flowing, reducing the flow area. The velocity changes sharply when flowing through the fluid, and the loss is more obvious. However, with the increase of Reynolds number, the fluid carrying particles can quickly pass through at a higher speed, which attenuates the difference in deposition rate caused by different curved-diameter rate.
4. Conclusions
By means of numerical simulation, spiral flow attenuation and hydrate particle deposition in the curved pipe under different bending pipe angles, different bending pipe diameter rates, different Reynolds number and different torsion rates were studied, and the following conclusions were drawn:
(1) Swirl number is an important parameter indicating the strength of spiral flow. When the fluid enters the bending pipe, the larger the Angle of the bending pipe, the larger the swirl number when entering the bending pipe; The larger the rate of bending pipe to diameter, the greater the change of the total swirl number, the weaker the outflow strength, but the slower the swirl number changes, indicating the slower the spiral flow attenuation; The smaller the twist rate, the larger the initial swirl number and the stronger the spiral flow intensity. The larger the Reynolds number, the larger the swirl number when the fluid reaches the bending pipe after the action of the twisted strip, and the larger the swirl number at the same position, which is conducive to the maintenance of the spiral flow strength.
(2) During the flow of hydrate particles, with the increase of flow distance, the spiral flow intensity gradually weakens, and the residence time of hydrate particles gradually increases. After passing through the Bending pipe, the form of spiral flow gradually disappears due to the action of pipe resistance, centrifugal force and gravity, and the residence time of hydrate particles is obviously prolonged. The retention time of particles at the outlet of the pipe is more than 1.5 times that at the bending pipe.
(3) Under the action of high flow rate and strong spiral flow, when entering the bending pipe, the maximum mass concentration is distributed near the wall, and the concentration in the center of the pipeline is low, showing a "(" shape structure distribution; After flowing into the bending pipe, due to the effect of spiral flow and the centrifugal force of the bending pipe, the particles are concentrated on the upper outer side of the pipe at a higher speed, and accompanied by the continuous forward movement of the fluid. With the increase of the flow distance, the spiral flow gradually attenuates. After the particles flow out of the bending pipe, they are concentrated in the lower part of the pipe due to the action of gravity. Under the action of high flow rate, they eventually flow out of the pipe with the fluid.
(4) By introducing the sedimentation rate parameter to represent the deposition of hydrate particles, it is found that the larger the bending pipe Angle, the larger the bending pipe diameter rate, the smaller the torsion rate and the larger the Reynolds number, the smaller the deposition rate of particles after flowing through the pipe. Therefore, the spiral flow strength can be maintained through the above appropriate ways to reduce the occurrence of deposition.
Author Contributions
Conceptualization, Y.C. Rao and L. Zheng; methodology, S.L. Wang; software, S.H. Zhao; validation, S.D. Zhou, Y.C. Rao and L. Zheng; formal analysis, S.L. Wang; investigation, S.H. Zhao; resources, S.D. Zhou; data curation, Y.C. Rao; writing—original draft preparation, L. Zheng; writing—review and editing, Y.C. Rao; visualization, L. Zheng; supervision, Y.C. Rao; project administration, L. Zheng; funding acquisition, S.L. Wang.
Funding
This work was supported by the National Nature Science Foundation of China (No.51574045 & 51974037), the General Project of Natural Science Research in Jiangsu Universities (No.22KJB440002), the Project of Emission Peak and Carbon Neutrality of Jiangsu Province (No. BE2022001-5), Quanzhou Science and Technology Planning Project (No.2022N045), and Open Project of Collaborative Innovation Center for Clean Energy Application Technology (Quanzhou Vocational and Technical University) (No. QJNY22-06, QJNY22-01, and QJNY22-04).
Conflicts of Interest
The authors declare no competing financial interest.
References
- Matthews, P.N.; Notz, P.K.; Widener, M.W.; et al. Flow Loop Experiments Determine Hydrate Plugging Tendencies in the Field[J]. Annals of the New York Academy of Sciences 2010, 912, 330–338. [Google Scholar] [CrossRef]
- Li, Y.X.; Feng, S.C. A method for determining the formation of natural gas hydrate in pipelines. Natural Gas Industry 1999, (2), 116-119+16. [Google Scholar]
- Fan, Y.H.; Pu, C.S. Research on gas hydrate plugging prediction technology [J]. Oil & Gas Chemical Industry 2001, (1), 9–11+3. [Google Scholar]
- Gong, J.; Shi, B.; Lv, X.F. Hydrate formation and slurry transport in multi-phase mixed transport pipeline [J]. Journal of China University of Petroleum (Edition of Natural Science) 2013, 37, 163–167. [Google Scholar]
- Rao, Y.C.; Li, L.J.; Wang, S.L.; et al. Numerical Simulation Study on Flow Laws and Heat Transfer of Gas Hydrate in the Swirl Flow Pipeline with Long Twisted Band[J]. Entropy 2021, 23, 489. [Google Scholar] [CrossRef]
- Rao, Y.C.; Liu, Z.H.; Wang, S.L.; et al. Numerical Simulation of Swirl Flow Characteristics of CO2 Hydrate Slurry by Short Twisted Band[J]. Entropy 2021, 23, 913. [Google Scholar] [CrossRef]
- Rao, Y.C.; Wang, S.L.; Yang, Y.; et al. Experimental study and chemical affinity model on the inhibition of CO2 gas hydrate formation [J]. Chemical Engineering Science 2023, 281, 119158. [Google Scholar] [CrossRef]
- Li, J.M.; Wang, S.L.; Rao, Y.C.; et al. Effect of surfactants on flow characteristics of gas-liquid two-phase spiral pipe flow [J]. Hydrodynamics Research and Progress 2015, 30, 18–23. [Google Scholar]
- Cai, Y.Y.; Li, B.B.; Rao, Y.C.; et al. Numerical simulation of flow characteristics of hydrate slurry with long twist belt spinning [J]. China Petroleum Machinery 2018, 46, 106–113. [Google Scholar]
- Rao, Y.C.; Sun, Y.; Wang, S.L.; et al. Numerical Simulation Study on the Law of Attenuation of Hydrate Particles in a Gas Transmission Pipeline [J]. Energies 2019, 12, 58. [Google Scholar]
- Wang, S.L.; Rao, Y.C.; Wei, M.J.; et al. Experimental study on pressure drop of gas-liquid two-phase spiral flow in horizontal tube [J]. Science Technology and Engineering 2013, 13, 659–663. [Google Scholar]
- Rao, Y.C.; Liu, Z.H.; Wang, S.L.; et al. Numerical Simulation of the Flow Pattern of Spiral Annular Flow with a Guide Strip by Spiral On-Way[J]. ACS Omega 2022, 7, 31961−31973. [Google Scholar] [CrossRef] [PubMed]
- Li, J.M.; Wang, S.L.; Rao, Y.C.; et al. Effect of surfactants on flow characteristics of gas-liquid two-phase spiral pipe flow [J]. Hydrodynamics Research and Progress 2015, (1), 18–23. [Google Scholar]
- Rao, Y.C. , Wang Z.W., Wang S.L., et al. Investigation on Gas Hydrate Slurry Pressure Drop Properties in a Spiral Flow Loop [J]. Energies 2018, 11, 1384. [Google Scholar] [CrossRef]
- Kuang, S.B. Research on Numerical Simulation of Pneumatic Conveying based on discrete element method [D]. Northeastern University, 2009. [Google Scholar]
- Zhou, J. Numerical study of dense phase conveying in horizontal bending pipe [J]. Metallurgical Power 2019, (10), 16–18. [Google Scholar]
- Cai, H.F.; Xiong, Y.Y.; Zhou, H.J. Numerical simulation of high pressure dense phase Pneumatic conveying with horizontal bending pipe [J]. Journal of Southeast University (Natural Science Edition) 2019, 49, 154–163. [Google Scholar]
- Sun, X.; Liu, D.J.; Wang, W.W.; et al. Analysis of slurry flow in pipe bending pipe system [J]. Chemical Engineering 2019, 47, 58–63. [Google Scholar]
- Sun, X.; Wang, L.; Ren, Z.Q. Safety analysis of hydrate slurry flow in horizontal pipe [J]. Chemical Engineering 2018, 46, 45–50. (in Chinese). [Google Scholar]
- Wu, X.N.; Li, Q.; Gou, J.Y.; et al. Migraten law of deposited naphthalene particles in urban gas pipelines [J]. Natural Gas Industry 2019, 39, 104–112. [Google Scholar]
- Lv, T.; Hu, Q.; Xiao, H.; et al. Research on transport characteristics of large-particle solid-liquid two-phase flow in U-shaped pipe [J]. Mining and Metallurgy Engineering 2019, 39, 6–10. [Google Scholar]
- Gao, H.; Guo, L.J.; Zhao, B.Q.; et al. PIV measurement of liquid film flow field in gas-liquid-solid three-phase flow in a bending pipe [J]. Chinese Journal of Engineering Thermophysics 2004, (02), 255–258. [Google Scholar]
- Zhai, Y.P.; Wang, S.L. Numerical Simulation of spiral flow in 90° curved pipe [J]. Journal of Changzhou University (Natural Science) 2011, 23, 36–39. [Google Scholar]
- Karino, T.; Kwong, H.H.; Goldsmith, H.L. Particle flow behaviour in models of branching vessels: I. Vortices in 90° T-junctions[J]. Biorheology 1979, 16, 231–248. [Google Scholar] [CrossRef] [PubMed]
- Yamagata, T.; Ishizuka, A.; Fujisawa, N. Numerical study on non-axisymmetric wall thinning in pipelines with swirling flow[J]. Annals of Nuclear Energy 2017, 101, 196–202. [Google Scholar] [CrossRef]
- Takano, T.; Yamagata, T.; Sato, Y.; et al. Non-axisymmetric mass transfer phenomenon behind an orifice in a curved swirling flow[J]. Journal of Flow Control, Measurement & Visualization 2013, 01, 1–5. [Google Scholar]
- Kalpakli, A.; Örlü, R. Turbulent pipe flow downstream a 90° pipe bending pipe with and without superimposed swirl[J]. International Journal of Heat and Fluid Flow 2013, 41. [Google Scholar] [CrossRef]
- Kadyirov, A. Nume Chang rical investigation of swirl flow in curved tube with various curvature rate[C]. In Proceedings of the 2013 COMSOL Conference in Rotterdam; 2013. [Google Scholar]
- Chang, T.H.; Lee, H.S. An experimental study on swirling flow in a 90 degree circular tube by using particle image velocimetry[J]. Journal of visualization 2003, 6, 343–352. [Google Scholar] [CrossRef]
|
Disclaimer/Publisher’s Note: The statements, opinions and data contained in all publications are solely those of the individual author(s) and contributor(s) and not of MDPI and/or the editor(s). MDPI and/or the editor(s) disclaim responsibility for any injury to people or property resulting from any ideas, methods, instructions or products referred to in the content. |
© 2023 by the authors. Licensee MDPI, Basel, Switzerland. This article is an open access article distributed under the terms and conditions of the Creative Commons Attribution (CC BY) license (http://creativecommons.org/licenses/by/4.0/).


 , η0 ≈ 4.38, β = 0.012, α0 = 1


