Submitted:
14 September 2023
Posted:
19 September 2023
You are already at the latest version
Abstract
Keywords:
1. Introduction
2. Materials and Methods
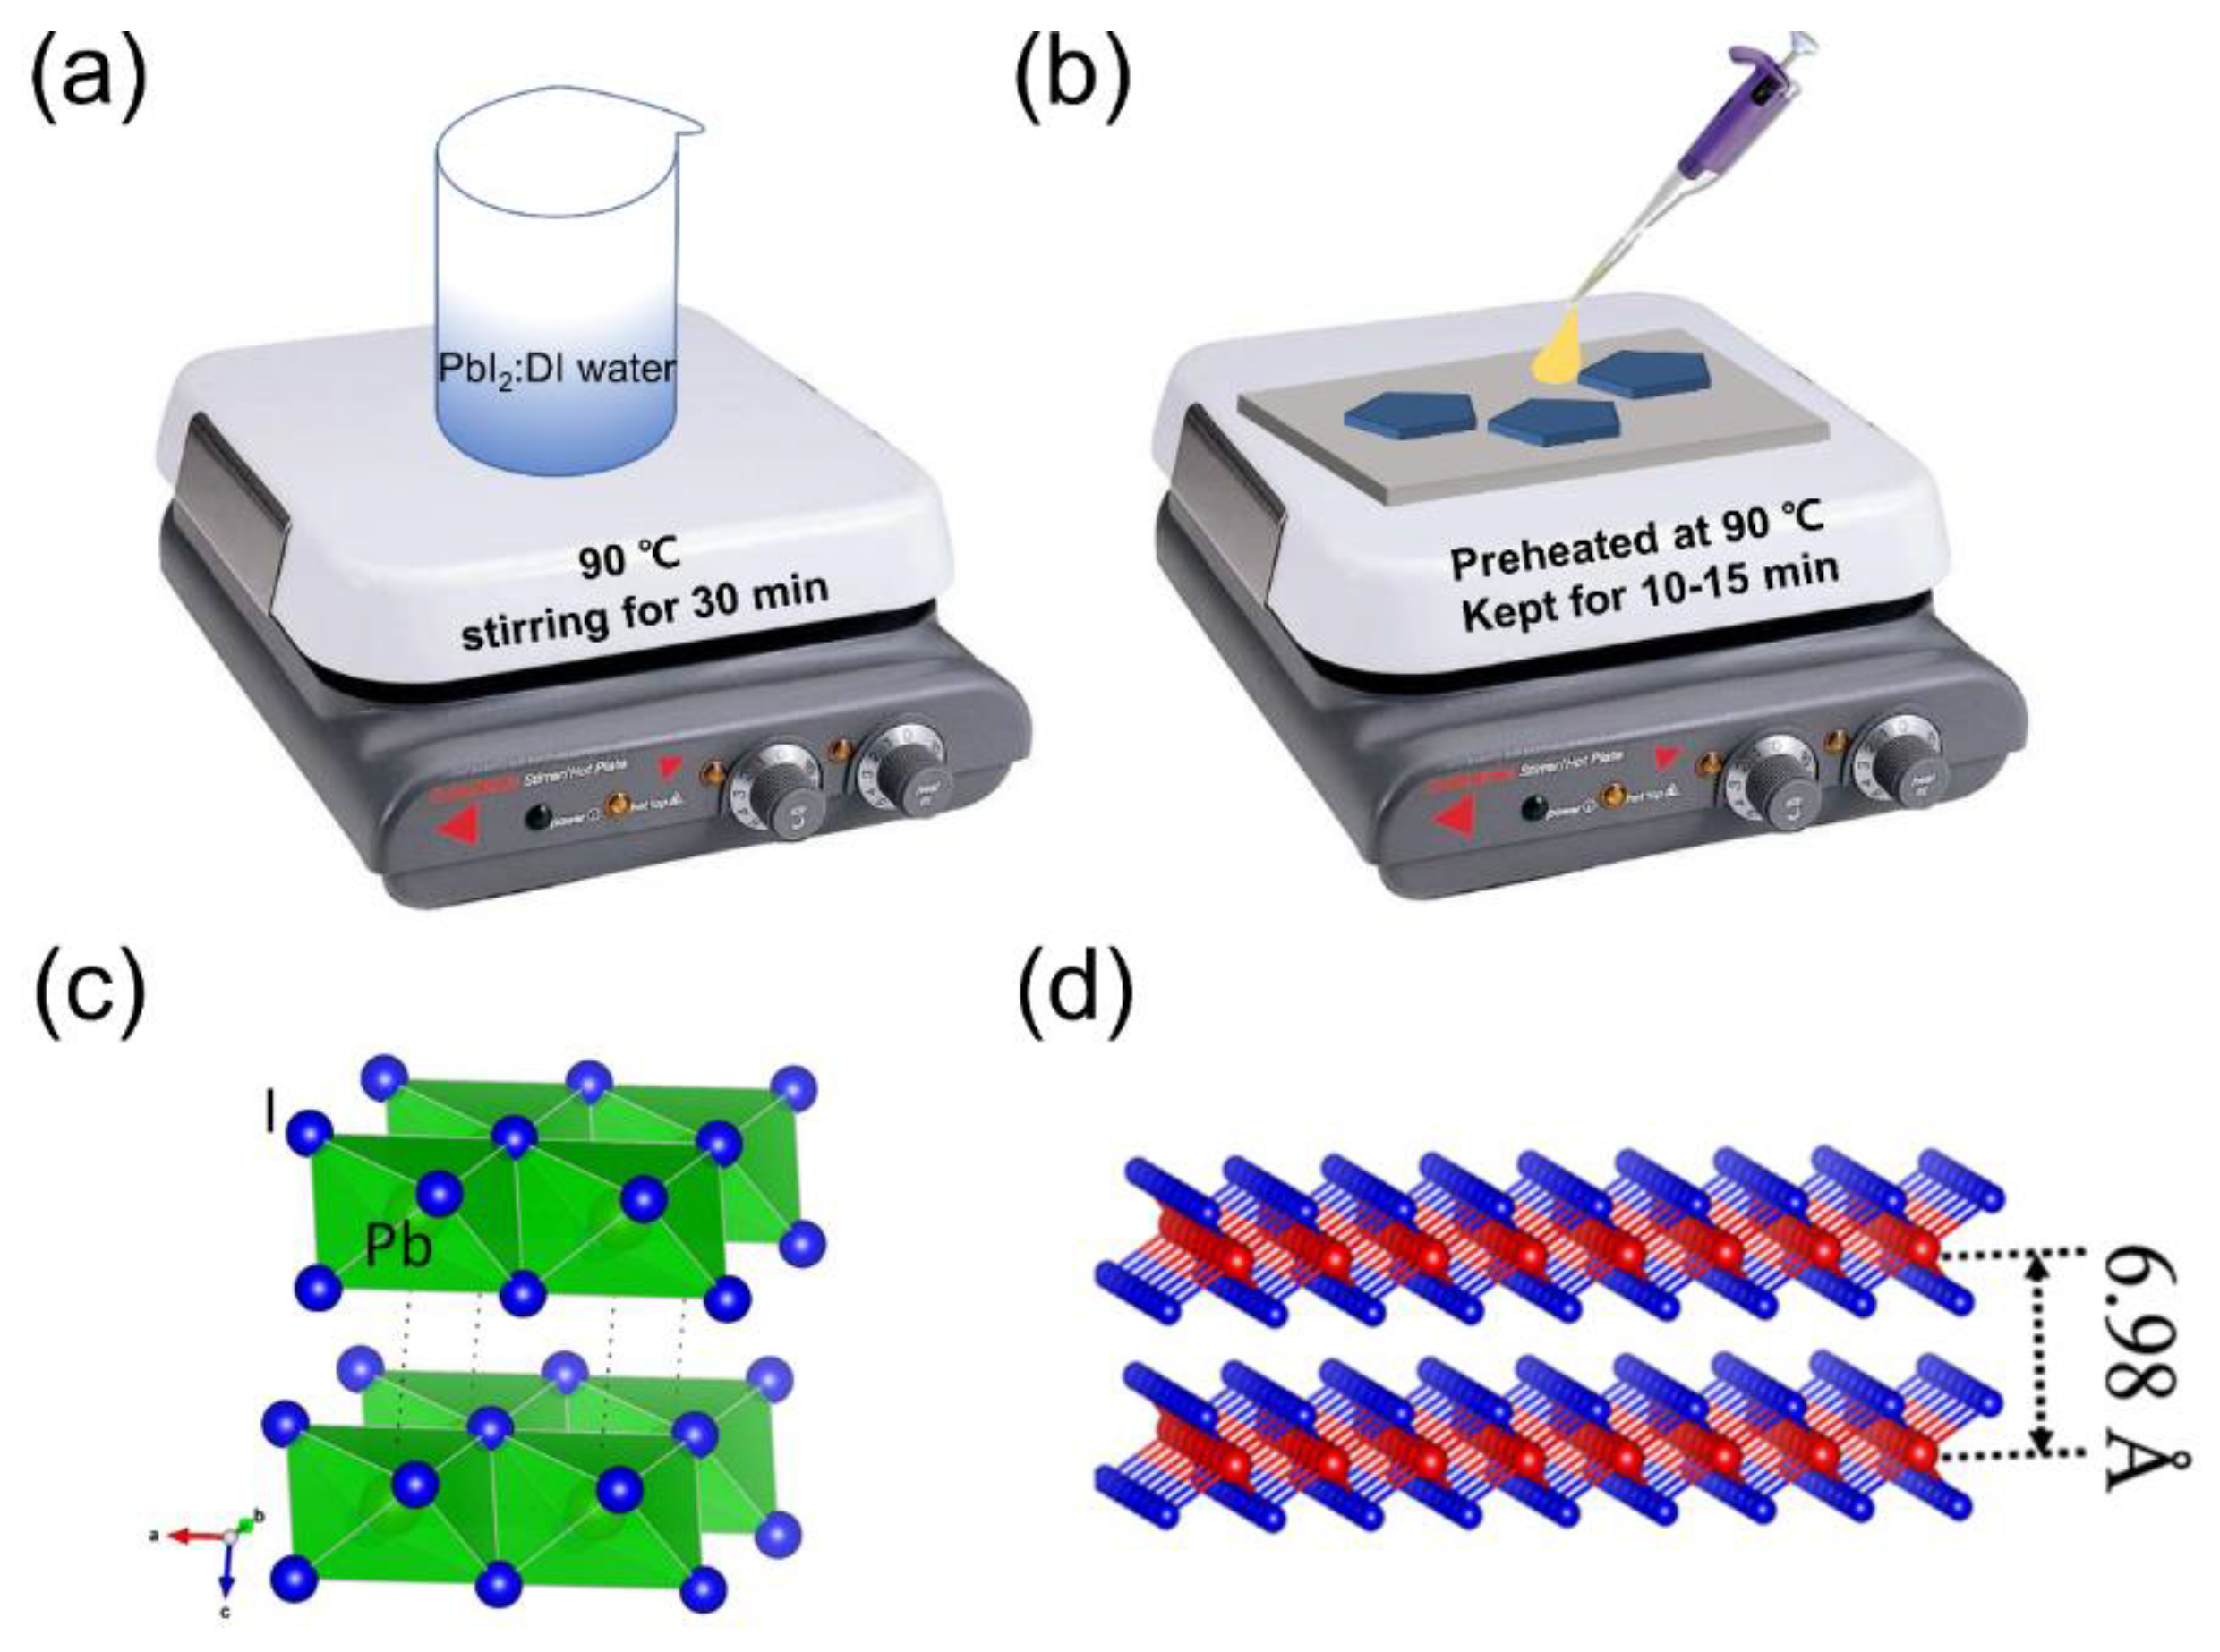
2.1. Synthesis of 2D PbI2 Nanoplates
2.2. Device Fabrication
2.3. Characterizations
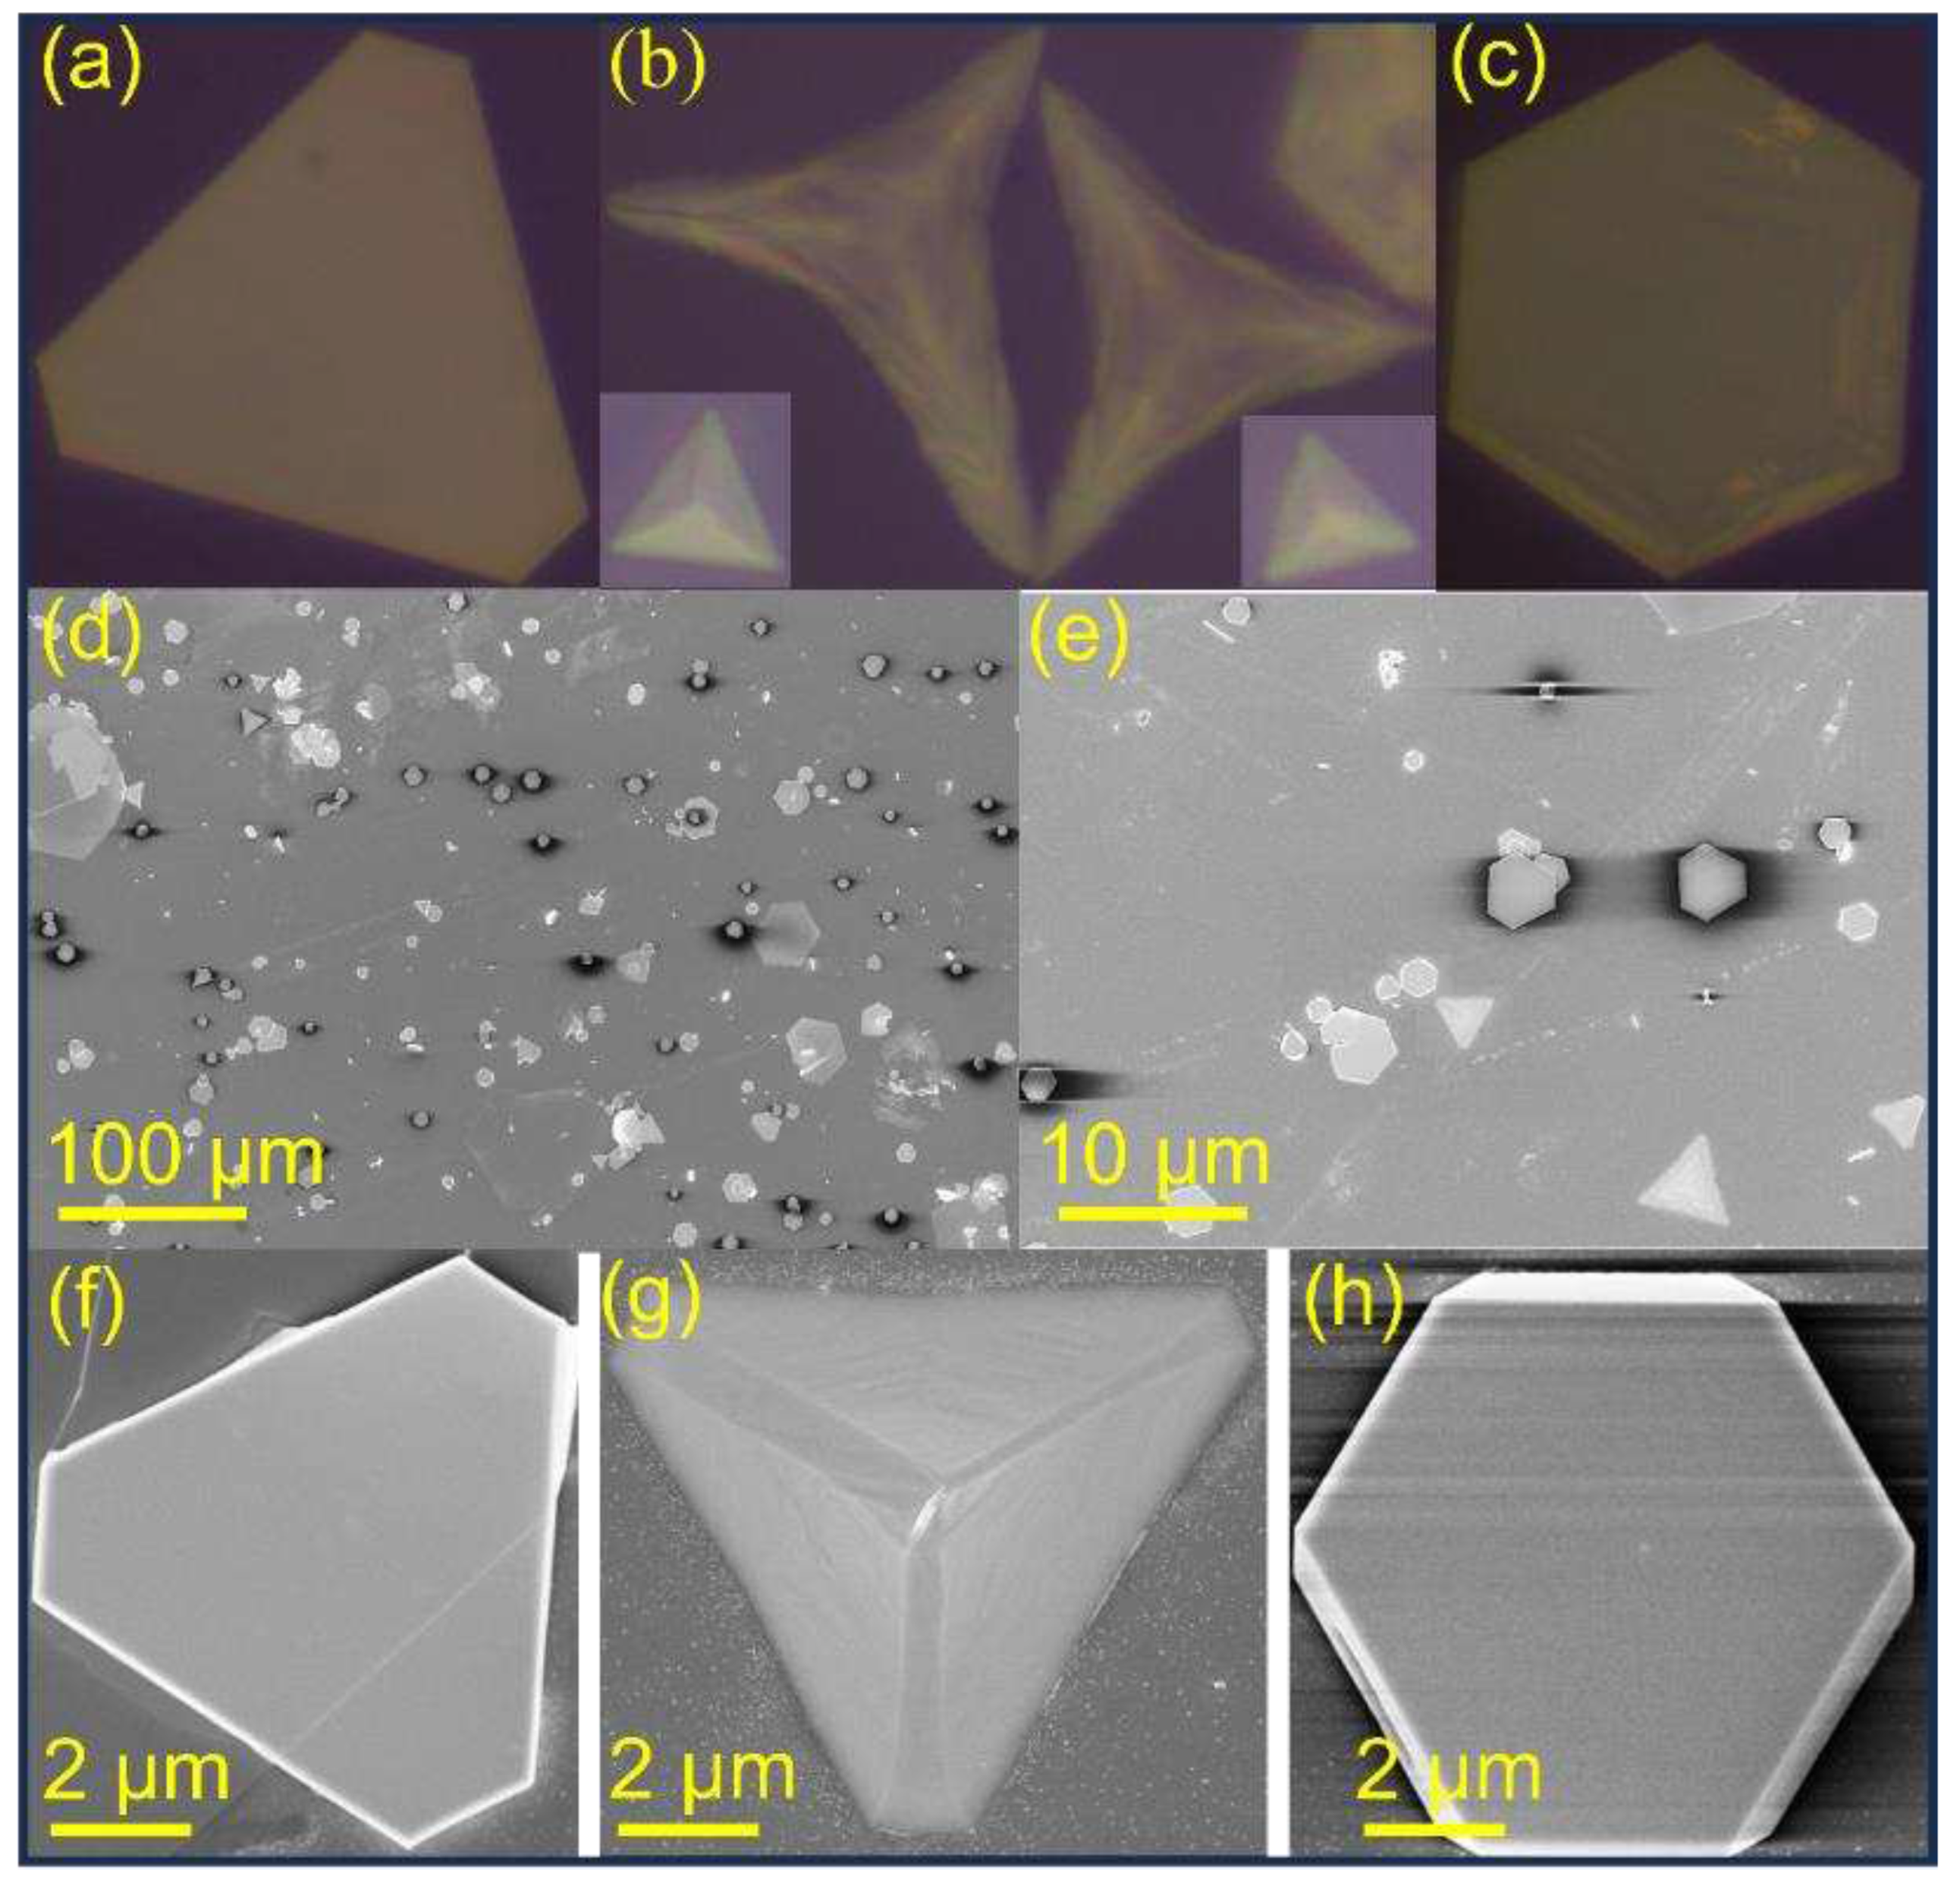
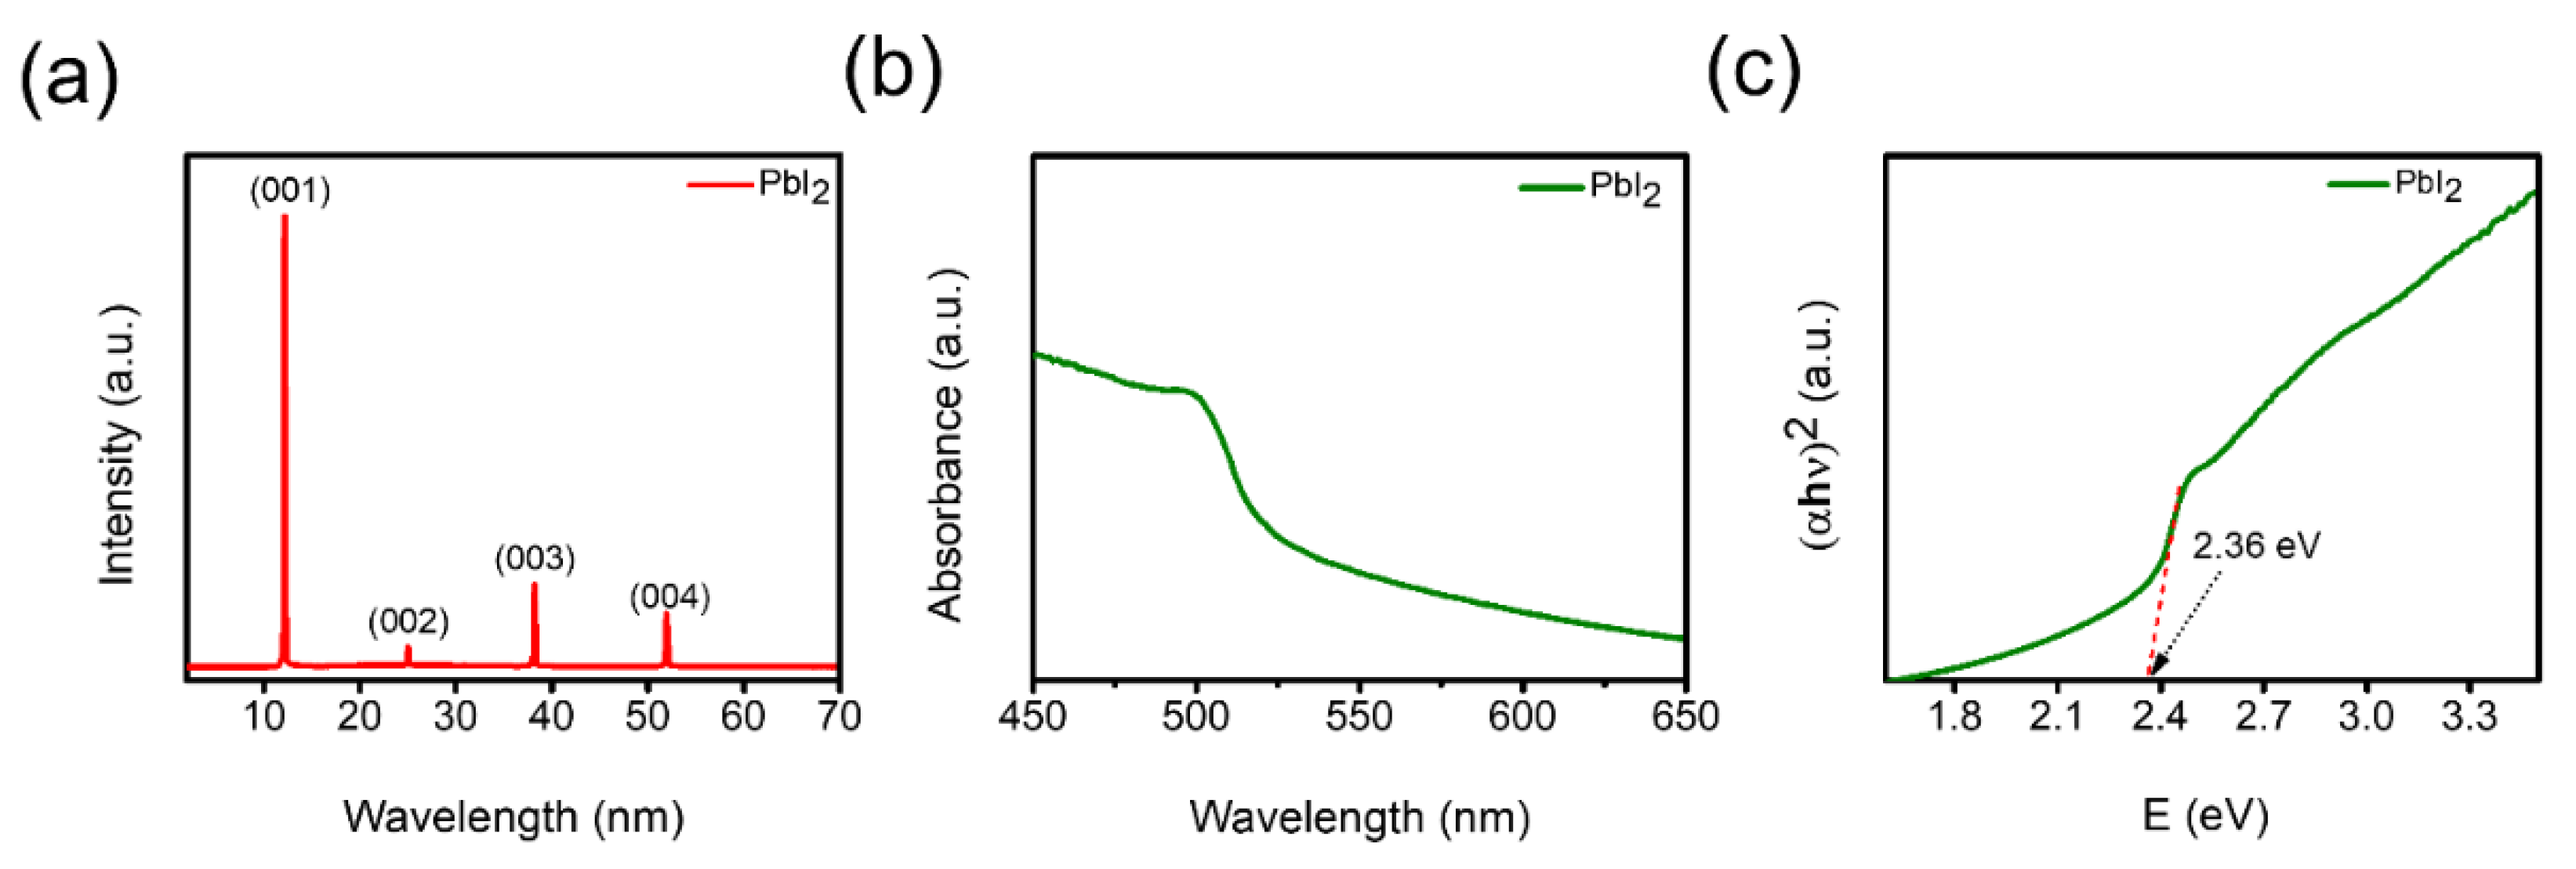
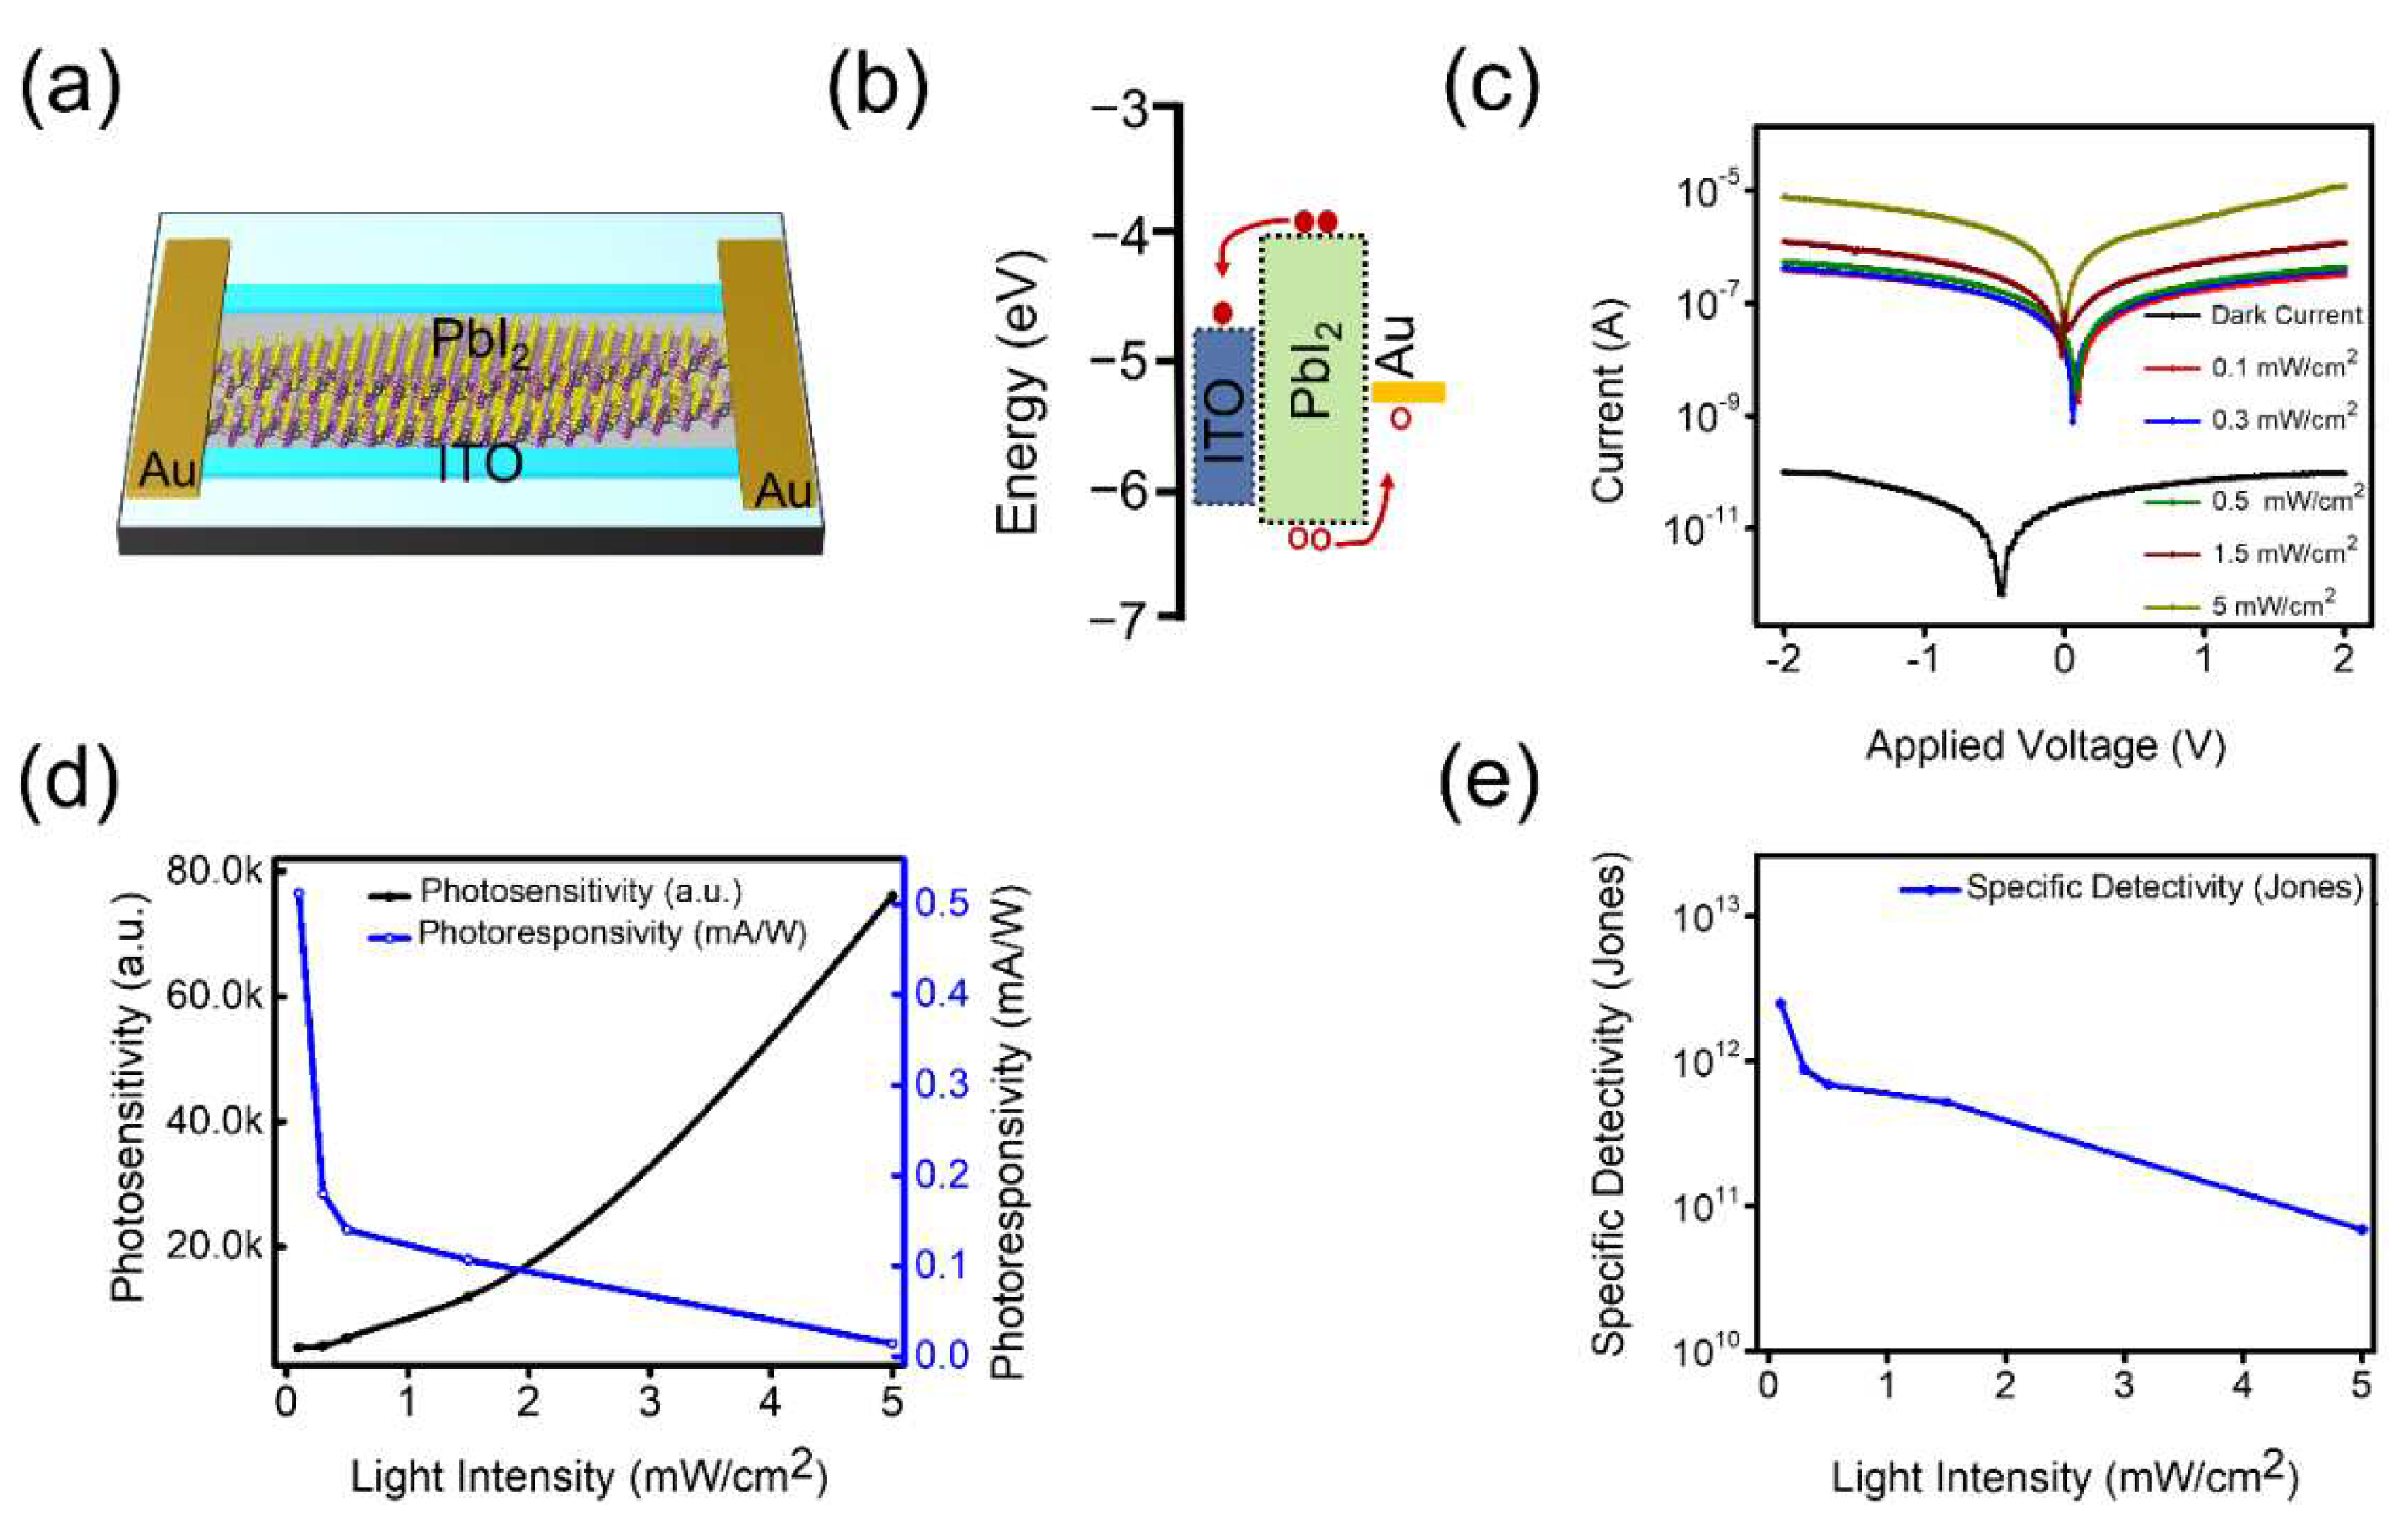
3. Results


4. Conclusions
Author Contributions
Funding
Data Availability Statement
Conflicts of Interest
References
- Proppe, A.H.; Berkinsky, D.B.; Zhu, H.; Šverko, T.; Kaplan, A.E.K.; Horowitz, J.R.; Kim, T.; Chung, H.; Jun, S.; Bawendi, M.G. Highly stable and pure single-photon emission with 250 ps optical coherence times in InP colloidal quantum dots. Nat. Nanotechnol. 2023, 18, 993–999. [Google Scholar] [CrossRef]
- Septianto, R.D.; Miranti, R.; Kikitsu, T.; Hikima, T.; Hashizume, D.; Matsushita, N.; Iwasa, Y.; Bisri, S.Z. Enabling metallic behaviour in two-dimensional superlattice of semiconductor colloidal quantum dots. Nat. Commun. 2023, 14, 1–10. [Google Scholar] [CrossRef]
- Ahn, N.; Livache, C.; Pinchetti, V.; Jung, H.; Jin, H.; Hahm, D.; Park, Y.-S.; Klimov, V.I. Electrically driven amplified spontaneous emission from colloidal quantum dots. Nature 2023, 617, 79–85. [Google Scholar] [CrossRef]
- Chen, X.; Lin, X.; Zhou, L.; Sun, X.; Li, R.; Chen, M.; Yang, Y.; Hou, W.; Wu, L.; Cao, W.; et al. Blue light-emitting diodes based on colloidal quantum dots with reduced surface-bulk coupling. Nat. Commun. 2023, 14, 1–9. [Google Scholar] [CrossRef]
- Protesescu, L.; Yakunin, S.; Bodnarchuk, M.I.; Krieg, F.; Caputo, R.; Hendon, C.H.; Yang, R.X.; Walsh, A.; Kovalenko, M.V. Nanocrystals of Cesium Lead Halide Perovskites (CsPbX3, X = Cl, Br, and I): Novel Optoelectronic Materials Showing Bright Emission with Wide Color Gamut. Nano Lett. 2015, 15, 3692–3696. [Google Scholar] [CrossRef]
- Lee, J.W.; Kim, D.Y.; Baek, S.; Yu, H.; So, F. Inorganic UV–Visible–SWIR Broadband Photodetector Based on Monodisperse PbS Nanocrystals. Small 2016, 12, 1328–1333. [Google Scholar] [CrossRef]
- Singh, D.K.; Verma, D.K.; Singh, Y.; Hasan, S.H. Preparation of CuO nanoparticles using Tamarindus indica pulp extract for removal of As(III): Optimization of adsorption process by ANN-GA. J. Environ. Chem. Eng. 2017, 5, 1302–1318. [Google Scholar] [CrossRef]
- Nassar, N.N.; Husein, M.M. Effect of microemulsion variables on copper oxide nanoparticle uptake by AOT microemulsions. J. Colloid Interface Sci. 2007, 316, 442–450. [Google Scholar] [CrossRef]
- Cheng, Z.; Zhao, T.; Zeng, H. 2D Material-Based Photodetectors for Infrared Imaging. Small Sci. 2021, 2, 2100051. [Google Scholar] [CrossRef]
- Liu, C.; Guo, J.; Yu, L.; Li, J.; Zhang, M.; Li, H.; Shi, Y.; Dai, D. Silicon/2D-material photodetectors: from near-infrared to mid-infrared. Light. Sci. Appl. 2021, 10, 1–21. [Google Scholar] [CrossRef]
- Long, M.; Wang, P.; Fang, H.; Hu, W. Progress, Challenges, and Opportunities for 2D Material Based Photodetectors. Adv. Funct. Mater. 2018, 29. [Google Scholar] [CrossRef]
- Ezhilmaran, B.; Patra, A.; Benny, S.; R. , S.M.; V., A.V.; Bhat, S.V.; Rout, C.S. Recent developments in the photodetector applications of Schottky diodes based on 2D materials. J. Mater. Chem. C 2021, 9, 6122–6150. [Google Scholar] [CrossRef]
- Li, F.; Zheng, J.; Yao, Q.; Bie, Y.-Q. Recent progress of silicon integrated light emitters and photodetectors for optical communication based on two-dimensional materials. Opt. Mater. Express 2021, 11, 3298–3320. [Google Scholar] [CrossRef]
- Zhang, J.; Huang, Y.; Tan, Z.; Li, T.; Zhang, Y.; Jia, K.; Lin, L.; Sun, L.; Chen, X.; Li, Z.; et al. Low-Temperature Heteroepitaxy of 2D PbI2/Graphene for Large-Area Flexible Photodetectors. Adv. Mater. 2018, 30, e1803194. [Google Scholar] [CrossRef]
- Sun, Y.; Zhou, Z.; Huang, Z.; Wu, J.; Zhou, L.; Cheng, Y.; Liu, J.; Zhu, C.; Yu, M.; Yu, P.; et al. Band Structure Engineering of Interfacial Semiconductors Based on Atomically Thin Lead Iodide Crystals. Adv. Mater. 2019, 31, e1806562. [Google Scholar] [CrossRef]
- Zhong, M.; Zhang, S.; Huang, L.; You, J.; Wei, Z.; Liu, X.; Li, J. Large-scale 2D PbI2monolayers: experimental realization and their indirect band-gap related properties. Nanoscale 2017, 9, 3736–3741. [Google Scholar] [CrossRef]
- Wang, R.; Li, S.; Wang, P.; Xiu, J.; Wei, G.; Sun, M.; Li, Z.; Liu, Y.; Zhong, M. PbI2 Nanosheets for Photodetectors via the Facile Cooling Thermal Supersaturation Solution Method. J. Phys. Chem. C 2019, 123, 9609–9616. [Google Scholar] [CrossRef]
- Wang, Y.; Gan, L.; Chen, J.; Yang, R.; Zhai, T. Achieving highly uniform two-dimensional PbI 2 flakes for photodetectors via space confined physical vapor deposition. Sci. Bull. 2017, 62, 1654–1662. [Google Scholar] [CrossRef]
- Zhong, M.; Huang, L.; Deng, H.-X.; Wang, X.; Li, B.; Wei, Z.; Li, J. Flexible photodetectors based on phase dependent PbI2 single crystals. J. Mater. Chem. C 2016, 4, 6492–6499. [Google Scholar] [CrossRef]
- Liu, D.; Chen, R.; Liu, F.; Zhang, J.; Zhuang, X.; Yin, Y.; Wang, M.; Sa, Z.; Wang, P.; Sun, L.; et al. Flexible Omnidirectional Self-Powered Photodetectors Enabled by Solution-Processed Two-Dimensional Layered PbI2 Nanoplates. ACS Appl. Mater. Interfaces 2022, 14, 46748–46755. [Google Scholar] [CrossRef]
- Li, C.; Li, W.; Cheng, M.; Yang, W.; Tan, Q.; Wang, Q.; Liu, Y. High Sensitive and Broadband Photodetectors Based on Hybrid PbI2 Nanosheet/CdSe Nanobelt. Adv. Opt. Mater. 2021, 9, 2100927. [Google Scholar] [CrossRef]
- Saleem, M.I.; Yang, S.; Zhi, R.; Li, H.; Sulaman, M.; Chandrasekar, P.V.; Zhang, Z.; Batool, A.; Zou, B. Self-powered, all-solution processed, trilayer heterojunction perovskite-based photodetectors. Nanotechnology 2020, 31, 254001. [Google Scholar] [CrossRef] [PubMed]
- Saleem, M.I.; Yang, S.; Zhi, R.; Sulaman, M.; Chandrasekar, P.V.; Jiang, Y.; Tang, Y.; Batool, A.; Zou, B. Surface Engineering of All-Inorganic Perovskite Quantum Dots with Quasi Core−Shell Technique for High-Performance Photodetectors. Adv. Mater. Interfaces 2020, 7. [Google Scholar] [CrossRef]
- Sulaman, M.; Yang, S.; Bukhtiar, A.; Tang, P.; Zhang, Z.; Song, Y.; Imran, A.; Jiang, Y.; Cui, Y.; Tang, L.; et al. Hybrid Bulk-Heterojunction of Colloidal Quantum Dots and Mixed-Halide Perovskite Nanocrystals for High-Performance Self-Powered Broadband Photodetectors. Adv. Funct. Mater. 2022, 32. [Google Scholar] [CrossRef]
- Saleem, M.I.; Yang, S.; Batool, A.; Sulaman, M.; Veeramalai, C.P.; Jiang, Y.; Tang, Y.; Cui, Y.; Tang, L.; Zou, B. CsPbI3 nanorods as the interfacial layer for high-performance, all-solution-processed self-powered photodetectors. J. Mater. Sci. Technol. 2020, 75, 196–204. [Google Scholar] [CrossRef]
- Saleem, M.I.; Sulaman, M.; Batool, A.; Bukhtiar, A.; Khalid, S. Suppression of Mid-Gap Trap State in CsPbBr3 Nanocrystals with Br-Passivation for Self-Powered Photodetector. Energy Technol. 2023, 11. [Google Scholar] [CrossRef]
- Sulaman, M.; Song, Y.; Yang, S.; Saleem, M.I.; Li, M.; Veeramalai, C.P.; Zhi, R.; Jiang, Y.; Cui, Y.; Hao, Q.; et al. Interlayer of PMMA Doped with Au Nanoparticles for High-Performance Tandem Photodetectors: A Solution to Suppress Dark Current and Maintain High Photocurrent. ACS Appl. Mater. Interfaces 2020, 12, 26153–26160. [Google Scholar] [CrossRef]
- Sulaman, M.; Yang, S.; Imran, A.; Zhang, Z.; Bukhtiar, A.; Ge, Z.; Song, Y.; Sun, F.; Jiang, Y.; Tang, L.; et al. Two Bulk-Heterojunctions Made of Blended Hybrid Nanocomposites for High-Performance Broadband, Self-Driven Photodetectors. ACS Appl. Mater. Interfaces 2023, 15, 25671–25683. [Google Scholar] [CrossRef]
- Sun, L.; Wang, C.; Xu, L.; Wang, J.; Liu, X.; Chen, X.; Yi, G.-C. SbSI whisker/PbI2 flake mixed-dimensional van der Waals heterostructure for photodetection. CrystEngComm 2019, 21, 3779–3787. [Google Scholar] [CrossRef]
- Lan, C.; Dong, R.; Zhou, Z.; Shu, L.; Li, D.; Yip, S.; Ho, J.C. Large-Scale Synthesis of Freestanding Layer-Structured PbI2 and MAPbI3 Nanosheets for High-Performance Photodetection. Adv. Mater. 2017, 29. [Google Scholar] [CrossRef]
- Qi, Z.; Yang, T.; Li, D.; Li, H.; Wang, X.; Zhang, X.; Li, F.; Zheng, W.; Fan, P.; Zhuang, X.; et al. High-responsivity two-dimensional p-PbI2/n-WS2 vertical heterostructure photodetectors enhanced by photogating effect. Mater. Horizons 2019, 6, 1474–1480. [Google Scholar] [CrossRef]
- Sun, L.; Wang, C.; Xu, L.; Wang, J.; Chen, X.; Yi, G.-C. Millimeter-sized PbI2 flakes and Pb5S2I6 nanowires for flexible photodetectors. J. Mater. Chem. C 2018, 6, 7188–7194. [Google Scholar] [CrossRef]
- Han, M.; Sun, J.; Bian, L.; Wang, Z.; Zhang, L.; Yin, Y.; Gao, Z.; Li, F.; Xin, Q.; He, L.; et al. Two-step vapor deposition of self-catalyzed large-size PbI2 nanobelts for high-performance photodetectors. J. Mater. Chem. C 2018, 6, 5746–5753. [Google Scholar] [CrossRef]

| Device Configuration | Growth Mechanism | Light Intensity | Photosensitivity$(K) | Responsivity$(R) | Detectivity$D* (Jones) | Rise/Fall Time (sec) | Ref. |
|---|---|---|---|---|---|---|---|
| ITO/PbI2/Au | Solution-process | 0.1 mW/cm2 | 3.9×10³ | 0.5 mA/W | 2.5×10¹² | 0.21/0.38 s | This Work |
| ITO/PbI2/Ni | Solution-process | 1.14 mW/mm2 | - | 0.65 A/W | 0.95×10¹³ | 2/3 ms | [20] |
| SiO2/Si/PbI2/Au | PVD-grown† | 40 mW/cm2 | - | - | - | 18/22 ms | [16] |
| PET/Graphene/PbI2/ Graphene | PVD-grown | 5 µW/cm2 | - | 45 A/W | - | 35/20 µs | [14] |
| SiO2/Si/SbSI/PbI2/Ag | Hydrothermal method | 0.1 mW/cm2 | - | 26.3 mA/W | - | 12/8 ms | [29] |
| Ti/Au/PbI2/Au | Solution-process | 0.17 mW/cm2 | - | 40 mA/W | 3.31×10¹⁰ | 161.7/192 ms | [17] |
| Si/PbI2-MAPbI2/Ti/Au | PVD-grown | - | - | 410 mA/V | 3.1×10¹¹ | 1.4/0.9 s | [30] |
| Au/PbI2/Au | PVD-grown | 3.4 mW/cm2 | - | 147.6 40 A/W | 2.56×10¹² | 18/25 ms | [19] |
| SiO2/Si/WS2/PbI2/Au | PVD-grown | 0.01$mW/cm2 | - | 7.1 × 10⁴ A/W | - | 26.4/28.9 ms | [31] |
| Polyimide/PbI2/Au | Hydrothermal method | - | - | 5 mA/W | - | 30 ms | [32] |
| Si/SiO2/PbI2/Au | PVD-process | - | - | 13 mA/W | - | 425/41 ms | [33] |
Disclaimer/Publisher’s Note: The statements, opinions and data contained in all publications are solely those of the individual author(s) and contributor(s) and not of MDPI and/or the editor(s). MDPI and/or the editor(s) disclaim responsibility for any injury to people or property resulting from any ideas, methods, instructions or products referred to in the content. |
© 2023 by the authors. Licensee MDPI, Basel, Switzerland. This article is an open access article distributed under the terms and conditions of the Creative Commons Attribution (CC BY) license (http://creativecommons.org/licenses/by/4.0/).


