1. Introduction
There are times when it is beneficial for an engineer to be able to estimate the relative density of a soil deposit sampled during a field investigation. One reason that knowing the relative density of a soil deposit can be beneficial is that the relative density of a soil is one of the best predictors of shear strength, with soils having high relative density general being stronger than soils with lower relative densities. Another situation where knowing the relative density of a soil can be useful is when one is evaluating the liquefaction susceptibility of the deposit. Soils that have high relative densities are more likely to be dilative and therefore are less likely to liquefy and if they do they typically will undergo less catastrophic cyclic mobility or limited liquefaction failures. Conversely, soils having low relative densities are more likely to be contractive and are far more susceptible to catastrophic flow liquefaction failures. Knowing the relative density of the soil gives the engineer a first criterion to help decide whether further investigations and analyses are warranted.
In order to calculate a soils relative density, three things must be known: the soil’s current void ratio, e, the soil’s maximum index void ratio, e
max, and the soil’s minimum index void ratio, e
min. The soil’s current (typically in-situ) void ratio can be obtained from samples collected during the field investigation or through correlations to SPT blow counts or CPT tip resistances. While different standards for determining e
max and e
min may apply in different countries, most are similar ASTM D4254 [
1] and ASTM D4253 [
2], respectively.
If the soil deposit consists solely of a clean sand or a pure silt, the number of maximum and minimum density tests that need be performed, and thus the cost of performing them, is relatively low. However if the deposit consists of mixtures of sand and silt at various silt contents, either maximum and minimum density tests must be performed at each silt content or some means of estimating the maximum and minimum index densities must be employed.
While numerous methods have been developed for estimating the maximum and minimum index void ratios of a clean sand, few methods exist for estimating these parameters for mixtures of sand and non-plastic silt. One of the more commonly used methods was developed by Chang, Wang and Ge [
3], who developed a series of equations for estimating the maximum and minimum index void ratios (
emax and
emin) for mixtures of sand and silt based on binary packing. Implementing their methodology requires five common soil parameters and four empirical constants.
The soil parameters required can be obtained by performing maximum and minimum index density tests on both the pure sand (i.e. the sand with all of the silt removed) and on the pure silt (i.e. the silt with all the sand removed). The silt content, defined as the fraction of the sample that is silt, must also be known.
The four empirical constants that must be determined are amax and bmax the filling coefficient and the embedment coefficients, respectively, for estimating the maximum index void ratio, and amin and bmin the filling coefficient and the embedment coefficients, respectively, for estimating the minimum index void ratio.
One means of obtaining the filling and embedment coefficients is to perform a series of maximum and minimum index density tests over a range of silt contents and estimate the coefficients from the test results. If the intent of the user is to estimate the index void ratios for a soil with a specific silt content, the need to run multiple index density tests at various silt contents negates the main advantage of using the equations, which is to reduce the number of laboratory tests performed. For this reason, the author developed a series of correlations for estimating the filling and embedment coefficients based on the median grain sizes of the sand and the silt, parameters that are easily obtained from a standard grain-size analysis.
A study was performed to develop simple correlations for estimating the filling and embedment coefficients, and thereby the maximum and minimum index void ratios, using easily obtained laboratory data. The author has previously developed correlations for estimating the filling and embedment coefficients [
4], however, for this study, a larger data set was compiled, thus increasing the range of soils evaluated. The data set compiled for this contained 60 sand-silt combinations which consisted of 524 pairs of
emax and
emin values.
2. Terminology
For the sake of clarity and brevity, five terms are defined below as they are used within this article:
- 1)
“Silt” is used to describe a fine-grained, non-plastic material
- 2)
“Sand-silt combinations” refers to the pairing of one specific sand with one specific silt and is independent of the amount of each soil present
- 3)
“Sand-silt mixture” refers to the pairing of one specific sand with one specific silt at some specific ratio of the two materials (e.g. a silt content of 17%)
- 4)
“Main data set” refers to the data set consisting of maximum and minimum index void ratio values at various silt contents for the 60 silt-sand combinations. This data was used for developing the correlations.
- 5)
“Independent sand-silt combinations” refers to the three sand-silt combinations that were not included in the main data set. This data was used for validating the correlations.
3. Background
In this section, two topics will be briefly reviewed as a familiarity with them is necessary an understanding of the study and its results. These two topics discussed are threshold fines content and equations for estimating index void ratios.
3.1. Threshold Fines Content
As increasing amounts of non-plastic silt are added to a sand, the classification of the soil mixture transitions from sand to silty sand to sandy silt and eventually to silt. This transition leads to a fundamental change in the soil behavior from sand-like to silt-like, with a corresponding increase in compressibility and decrease in both shear strength and resistance to liquefaction. Numerous studies have shown that this change in behavior occurs over a relatively narrow range of silt contents.
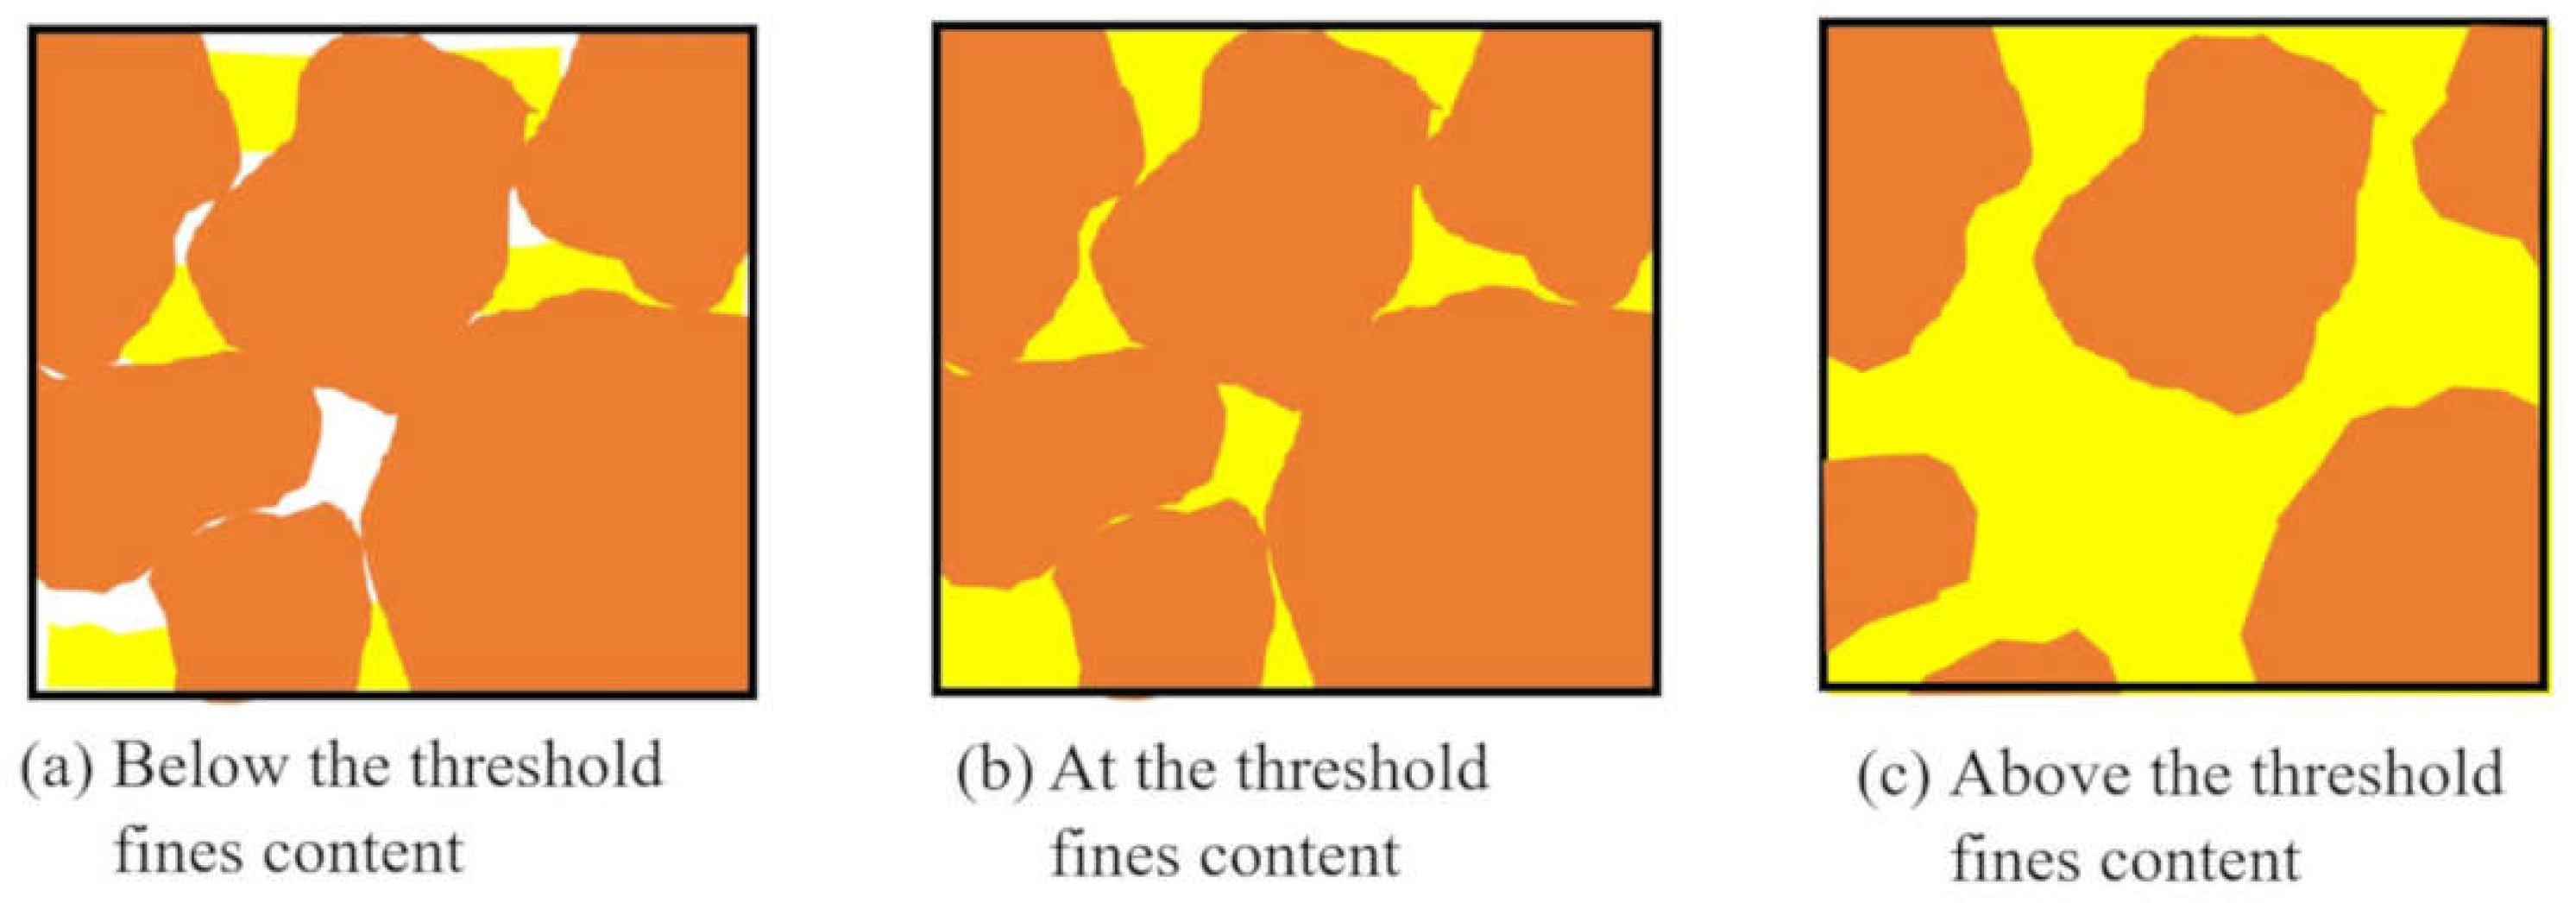
The threshold fines content represents the silt content at which the soil begins to transform from a sand matrix, with silt particles entirely contained in the voids between the sand grains, to a silt matrix that contains isolated sand grains. Below the threshold fines content, the soil behaves essentially as a sand; above the threshold fines content the soil behaves essentially as a silt.
For mixtures of sand and silt, there are several different methodologies for calculating the fines content at which the soil transforms from being sand-controlled to silt controlled [
5,
6,
7,
8,
9]. Each methodology utilizes a different equation, yet they all return the same value of threshold fines content [
9].
The threshold fines content can be calculated for a given sand and silt using Equation 1 (after [
7]):
where: G
ss is the specific gravity of the sand; G
sf is the specific gravity of the fines; e
s is the maximum index void ratio of the sand; and e
f is the void ratio of the fines.
Figure 1 provides visual representations of sand-silt mixtures that are (a) below, (b) at and (c) above the threshold fines content.
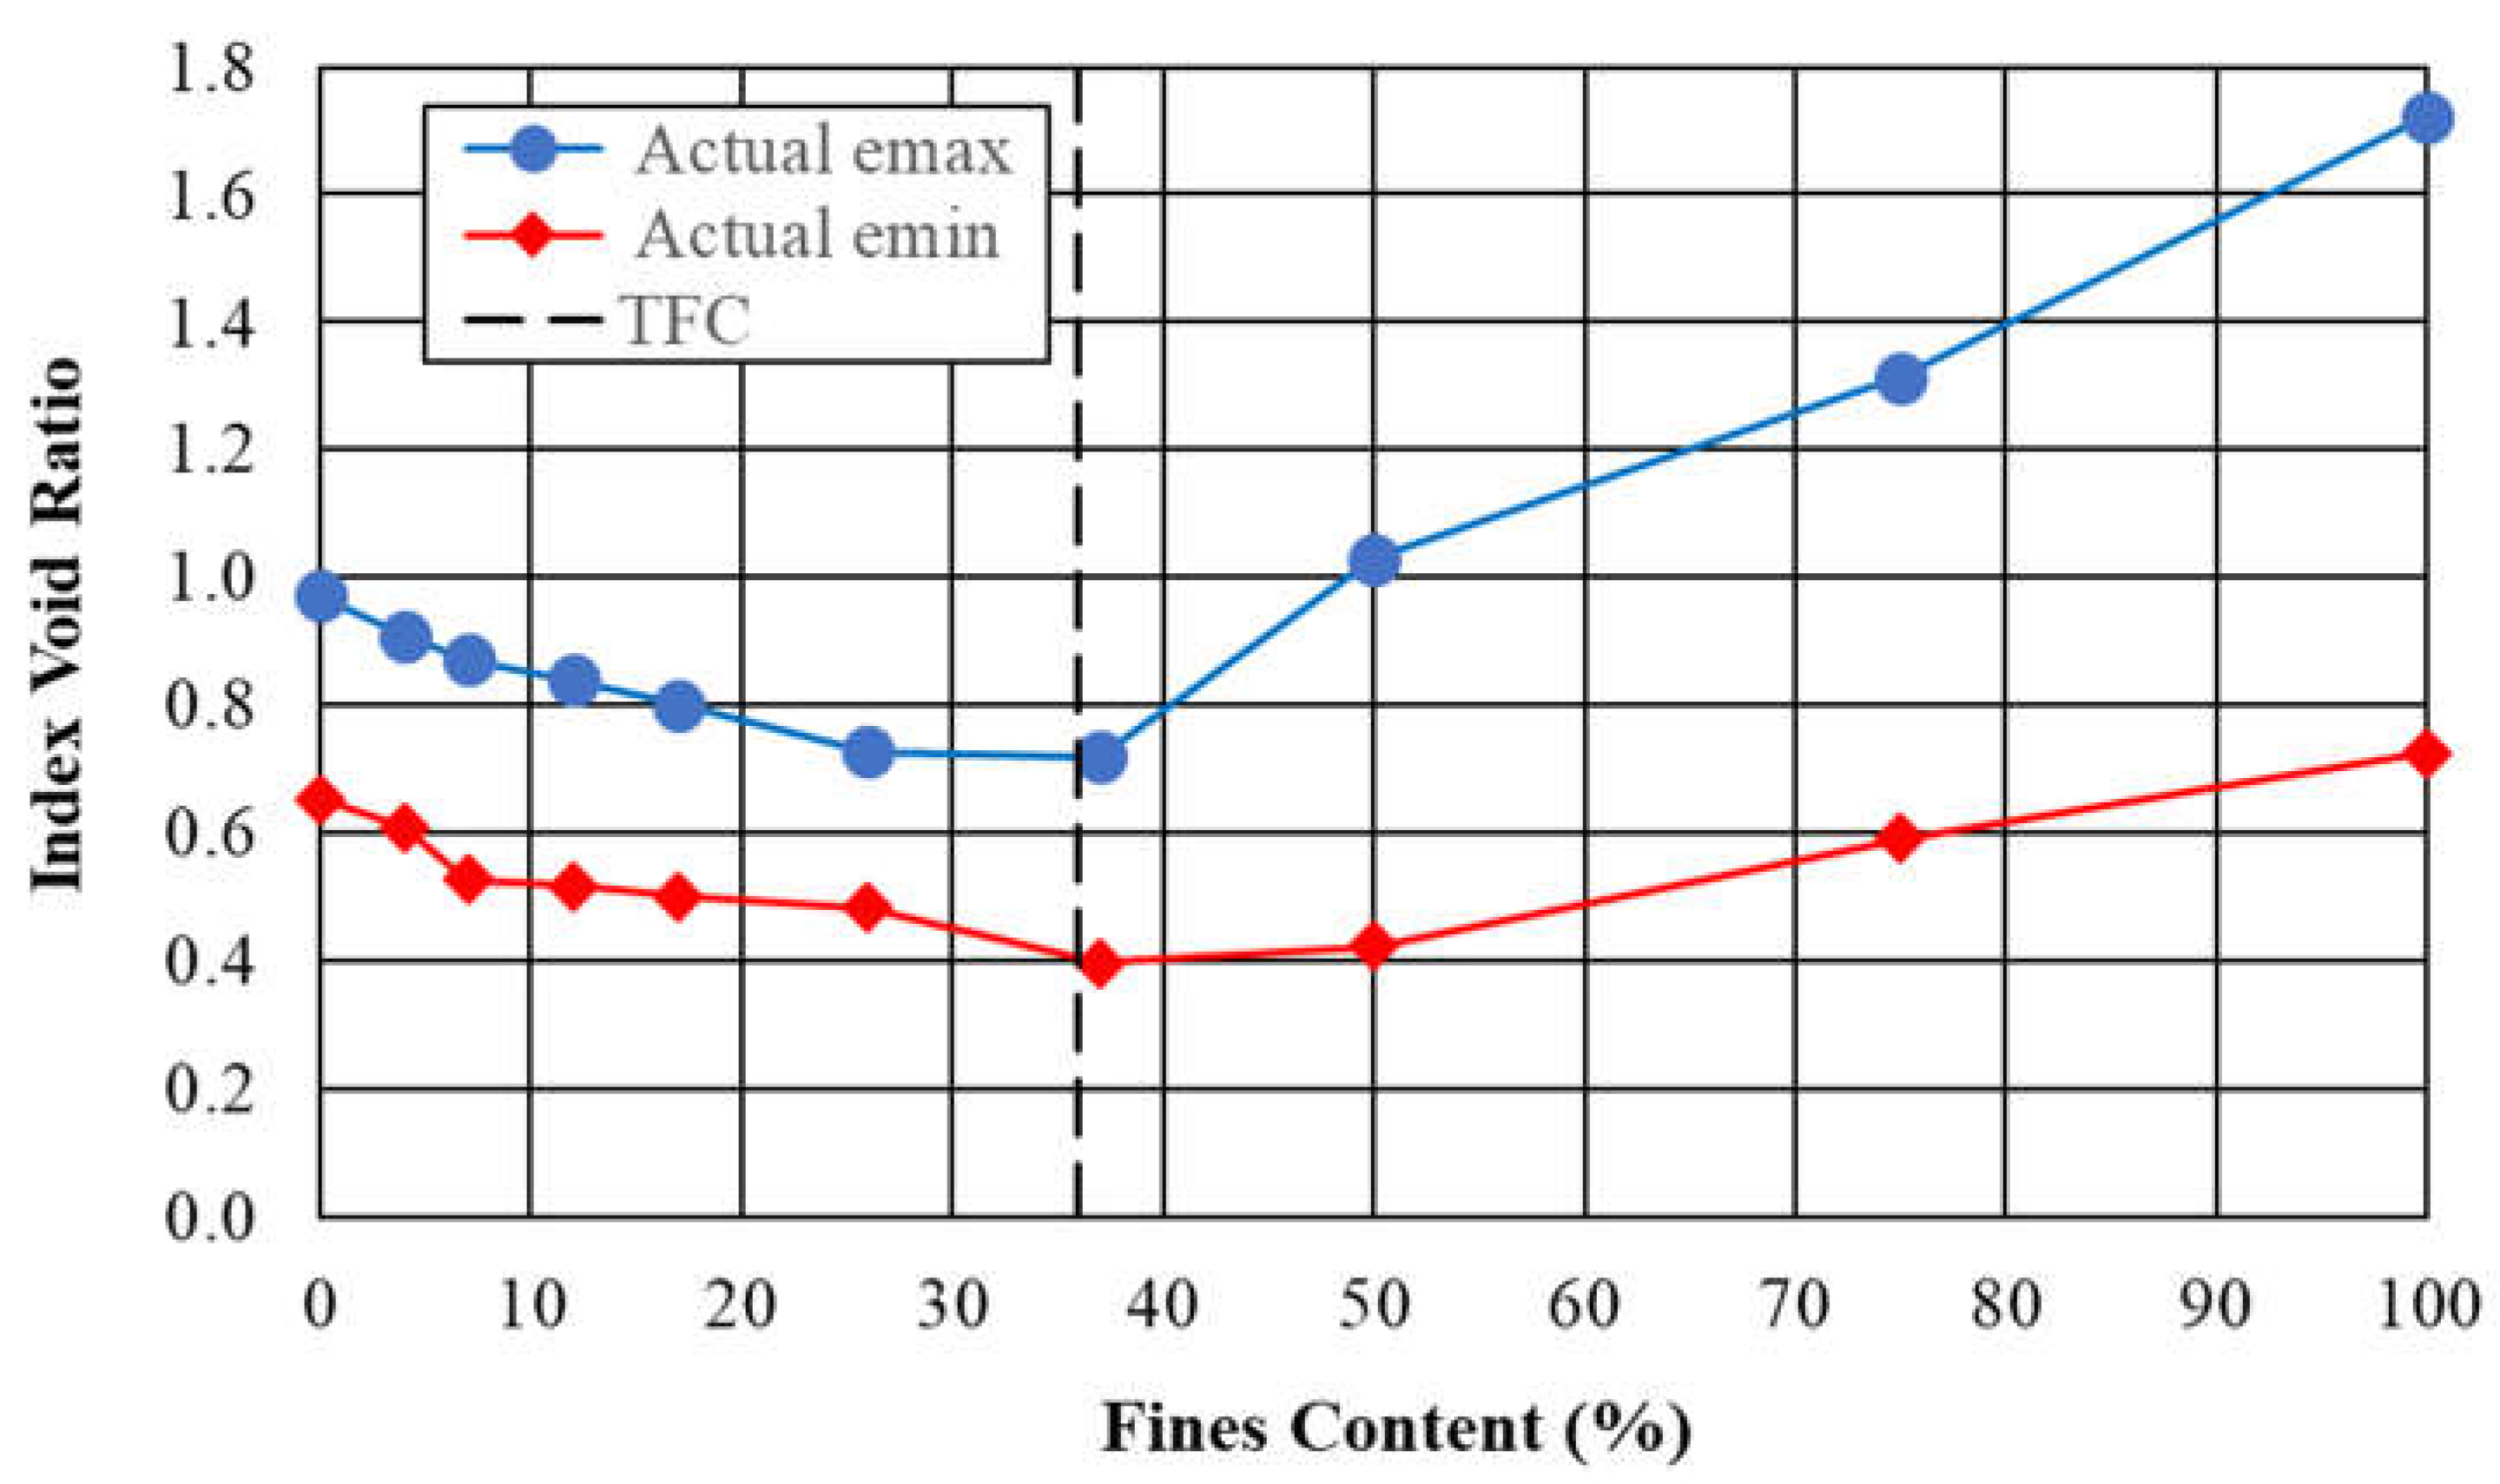
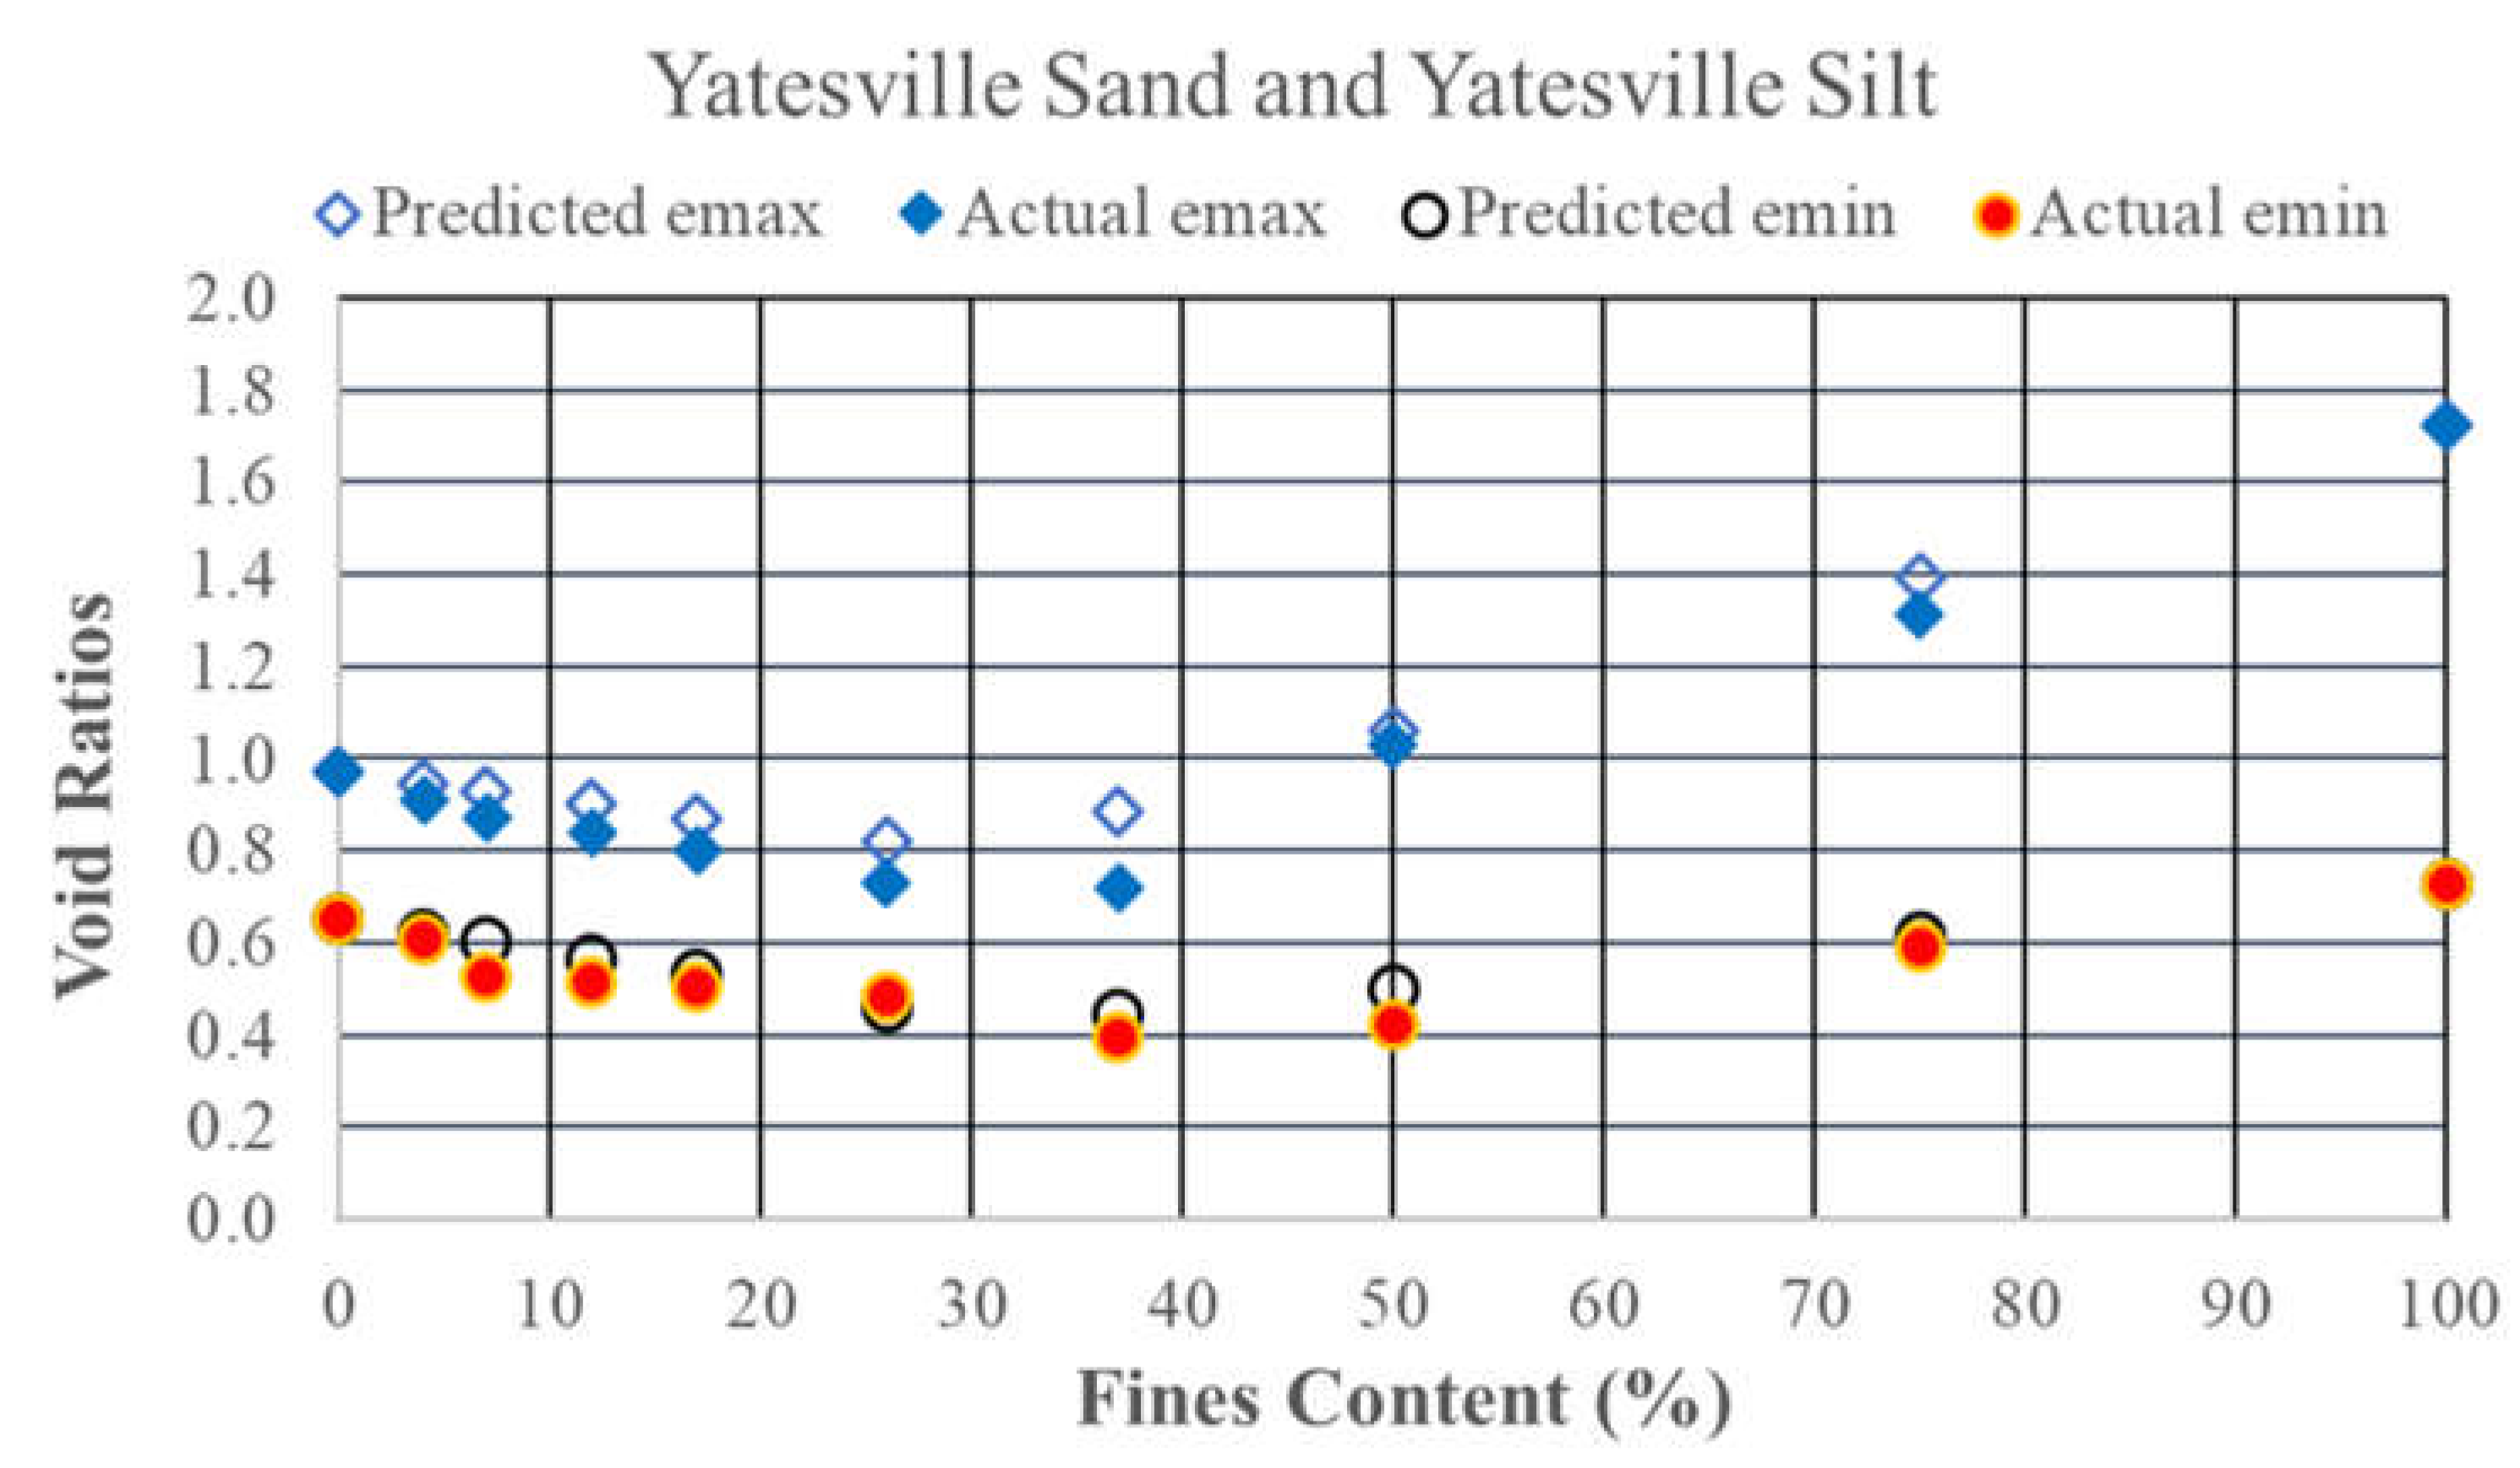
For soils with silt contents below the threshold fines content, as silt particles are added to the sand the ensuing mixture’s index void ratios decrease. These trends continue until the threshold fines content is reached. At silt contents above the threshold fines content, as the silt content increases, the index void ratios increase until the soil is a silt containing no coarse-grained material. These changes can be modeled as a bilinear envelope when plotting the maximum and minimum index void ratios versus silt content. These trends are may be seen in
Figure 2, which presents data for mixtures of Yatesville sand and Yatesville silt [
6], which have a threshold fines content of approximately 36%. In the figure, it can be seen that the lowest index void ratios occur near the threshold fines content.
For both the emax and emin equations, the values of the filling coefficient, a, and the embedment coefficient, b, vary between zero and one. The filling coefficient, a, is a material property related to the slope of the line connecting the index void ratios at silt contents less than the threshold fines content. As previously noted, the threshold fines content corresponds to the condition where the silt grains and the voids between them have completely filled the voids in the sand matrix but have not yet begun to force the sand grains apart.
The value of the embedment coefficient, b, can be thought of as the fraction of the voids within the silt matrix that are caused by the presence of a sand grain. When the soil is at the threshold fines content, the embedment coefficient equals one. When there is no sand embedded in the silt matrix, the embedment coefficient equals zero.
3.2. Equations for Estimating Index Void Ratios
Based on binary packing theory, Chang, Wang and Ge [
3] developed a series of four equations for estimating the maximum and minimum index void ratios for sand-silt mixtures. These equations are different for sand-silt mixtures below the threshold fines content (where the soil matrix is predominately sand grains with silt particles contained in the voids between the sand grains) and above the threshold fines content (where the soil matrix is predominately silt particles with non-contiguous sand particles). These equations are presented below as Equations 2 through 5 (after [
3]). For this article, some variable names have been adjusted from those used in the original publication in order to improve clarity.
For sand-controlled soils, whose silt content is less than the threshold fines content, the maximum index void ratio,
, and minimum index void ratio,
, may be calculated using Equation 2 and Equation 3 respectively:
For silt-controlled soils, whose silt content is greater than the threshold fines content, the maximum index void ratio,
, and minimum index void ratio,
, may be calculated using Equation 4 and Equation 5 respectively:
where:
are the maximum and minimum index void ratios of the sand;
are the maximum and minimum index void ratios of the silt;
y1 is the fraction of the sand-silt mixture that is sand; Similarly,
y2 is the fraction of the sand-silt mixture that is silt. The sum of
y1 and
y2 is always unity; lastly
amax and
bmax are the filling coefficient and the embedment coefficients for the maximum index void ratio, while
amin and
bmin are the filling coefficient and the embedment coefficients for the minimum index void ratio.
4. Methodology for Developing the Correlations for Estimating a and b
The goal of the current study was to develop simple correlations for estimating the filling and embedment coefficients for any sand-silt combination. This was done by first finding the best-fit values of the filling and embedment coefficients for each of the 60 combinations of sand and silt in the main data set. Following a description of the two data sets used to develop and validate the correlations and a discussion of the methodology used for determining the correlation, the validation process for the correlations developed will be presented.
4.1. Data Sets Used
The main data set consisted of the maximum and minimum void ratios at various silt contents for 60 combinations of sand and silt gathered from the literature ([
3,
5,
8,
11,
12,
13,
14,
15,
16,
17,
18]). Each of these sand-silt combinations had data for between four and seventeen silt contents with a median of nine silt contents. Overall, 564 pairs of
emax and
emin were used in developing the correlations. In addition to the maximum and minimum index void ratios for each sand-silt pairing, the maximum and minimum index void ratios, the specific gravities and the median grain sizes for the clean sand and the pure silt were also known.
In addition to the main data set, data for three sand-silt combinations was set aside for use in validating the models. These sand-silt combinations were Yatesville sand and Yatesville silt with ten silt contents [
6], Monterey #0/30 sand and Yatesville silt with ten silt contents [
6] and Ottawa C-109 sand with #6 Sil-Co-Sil silt with nine silt contents [
10]. Both Yatesville silt and #6 Sil-Co-Sil silt are non-plastic.
4.2. Development of the Correlations
Once the main data set had been compiled, a computer script was used to calculate the best-fit (i.e. optimal) values of the filling and embedment coefficients for the maximum index void ratio (amax and bmax) and separately for the minimum index void ratio (amin and bmin) for each of the 60 sand-silt combinations. First, the filling coefficient was varied from 0.00 to 1.00 in increments of 0.01. For each increment of the filling coefficient used, the embedment coefficient was also varied from 0.00 to 1.00 in increments of 0.01. This yield 10,201 combinations of the filling and embedment coefficients for each index void ratio for each of the 60 sand-silt combinations.
For each pair of filling and embedment coefficients evaluated, the maximum or minimum index void ratios were calculated at each silt content for that sand-silt combination. The estimated values of emax or emin were then compared to the corresponding laboratory-determined values. For each combination of filling and embedment coefficients evaluated, the coefficient of determination, R2, was calculated for that sand-silt combination. The combination of the filling and embedment coefficients that yielded the highest R2 value, and thus produced the most accurate match to the laboratory-determined data for that sand-silt combination, was chosen as the best-fit values of the filling and embedment coefficients these values of a and b were subsequently used in the regression analyses.
Once the best-fit values of the filling and embedment coefficients had been determined for each of the 60 sand-silt combinations, linear regression analyses were performed and correlations for estimating the filling and embedment coefficients were developed.
The filling coefficients,
amax and
amin, and the embedment coefficients,
bmax and
bmin, can be estimated using Equations 6 through 9.
where:
amax and
bmax are the filling and embedment coefficients for the maximum index void ratio;
amin and
bmin are the filling and embedment coefficients for the minimum index void ratio;
D50 is the median grain size in millimeters for the sand fraction of the sand-silt mixture; and
d50 is the median grain size in millimeters for the silt fraction of the sand-silt mixture.
4.3. Equation Validation
The correlations developed for estimating the filling and embedment coefficients were validated using a two-step process. The first step consisted of using Equations 6 through 9 to estimate the filling and embedment coefficients for each of the 60 sand-silt combinations in the main data set. These coefficients were then used to estimate the maximum and minimum index void ratios for that sand-silt combination at silt contents corresponding the laboratory-determined values for that sand-silt combination data.
From these predictions, 60 R2 values were determined for the emax values, one for each of the 60 sand-silt combinations. This R2 value reflects how closely the estimated values of emax matched the laboratory-determined values of emax for the silt contents reported for that sand-silt combination. Similarly, an R2 value was determined for the emin values for each of the 60 sand-silt combinations; this R2 served to measure how closely a and b were estimated by the regression equations.
The second step in the equation validation process consisted of using the correlations to estimate the filling and embedment coefficients for each of three sand-silt combinations that were not included in the main data set used for the regression analyses. The coefficients estimated for each sand-silt combination were then used to estimate the maximum and minimum index void ratios at each of the silt contents for each of the three sand-silt combinations and R2 values were determined.
5. Results
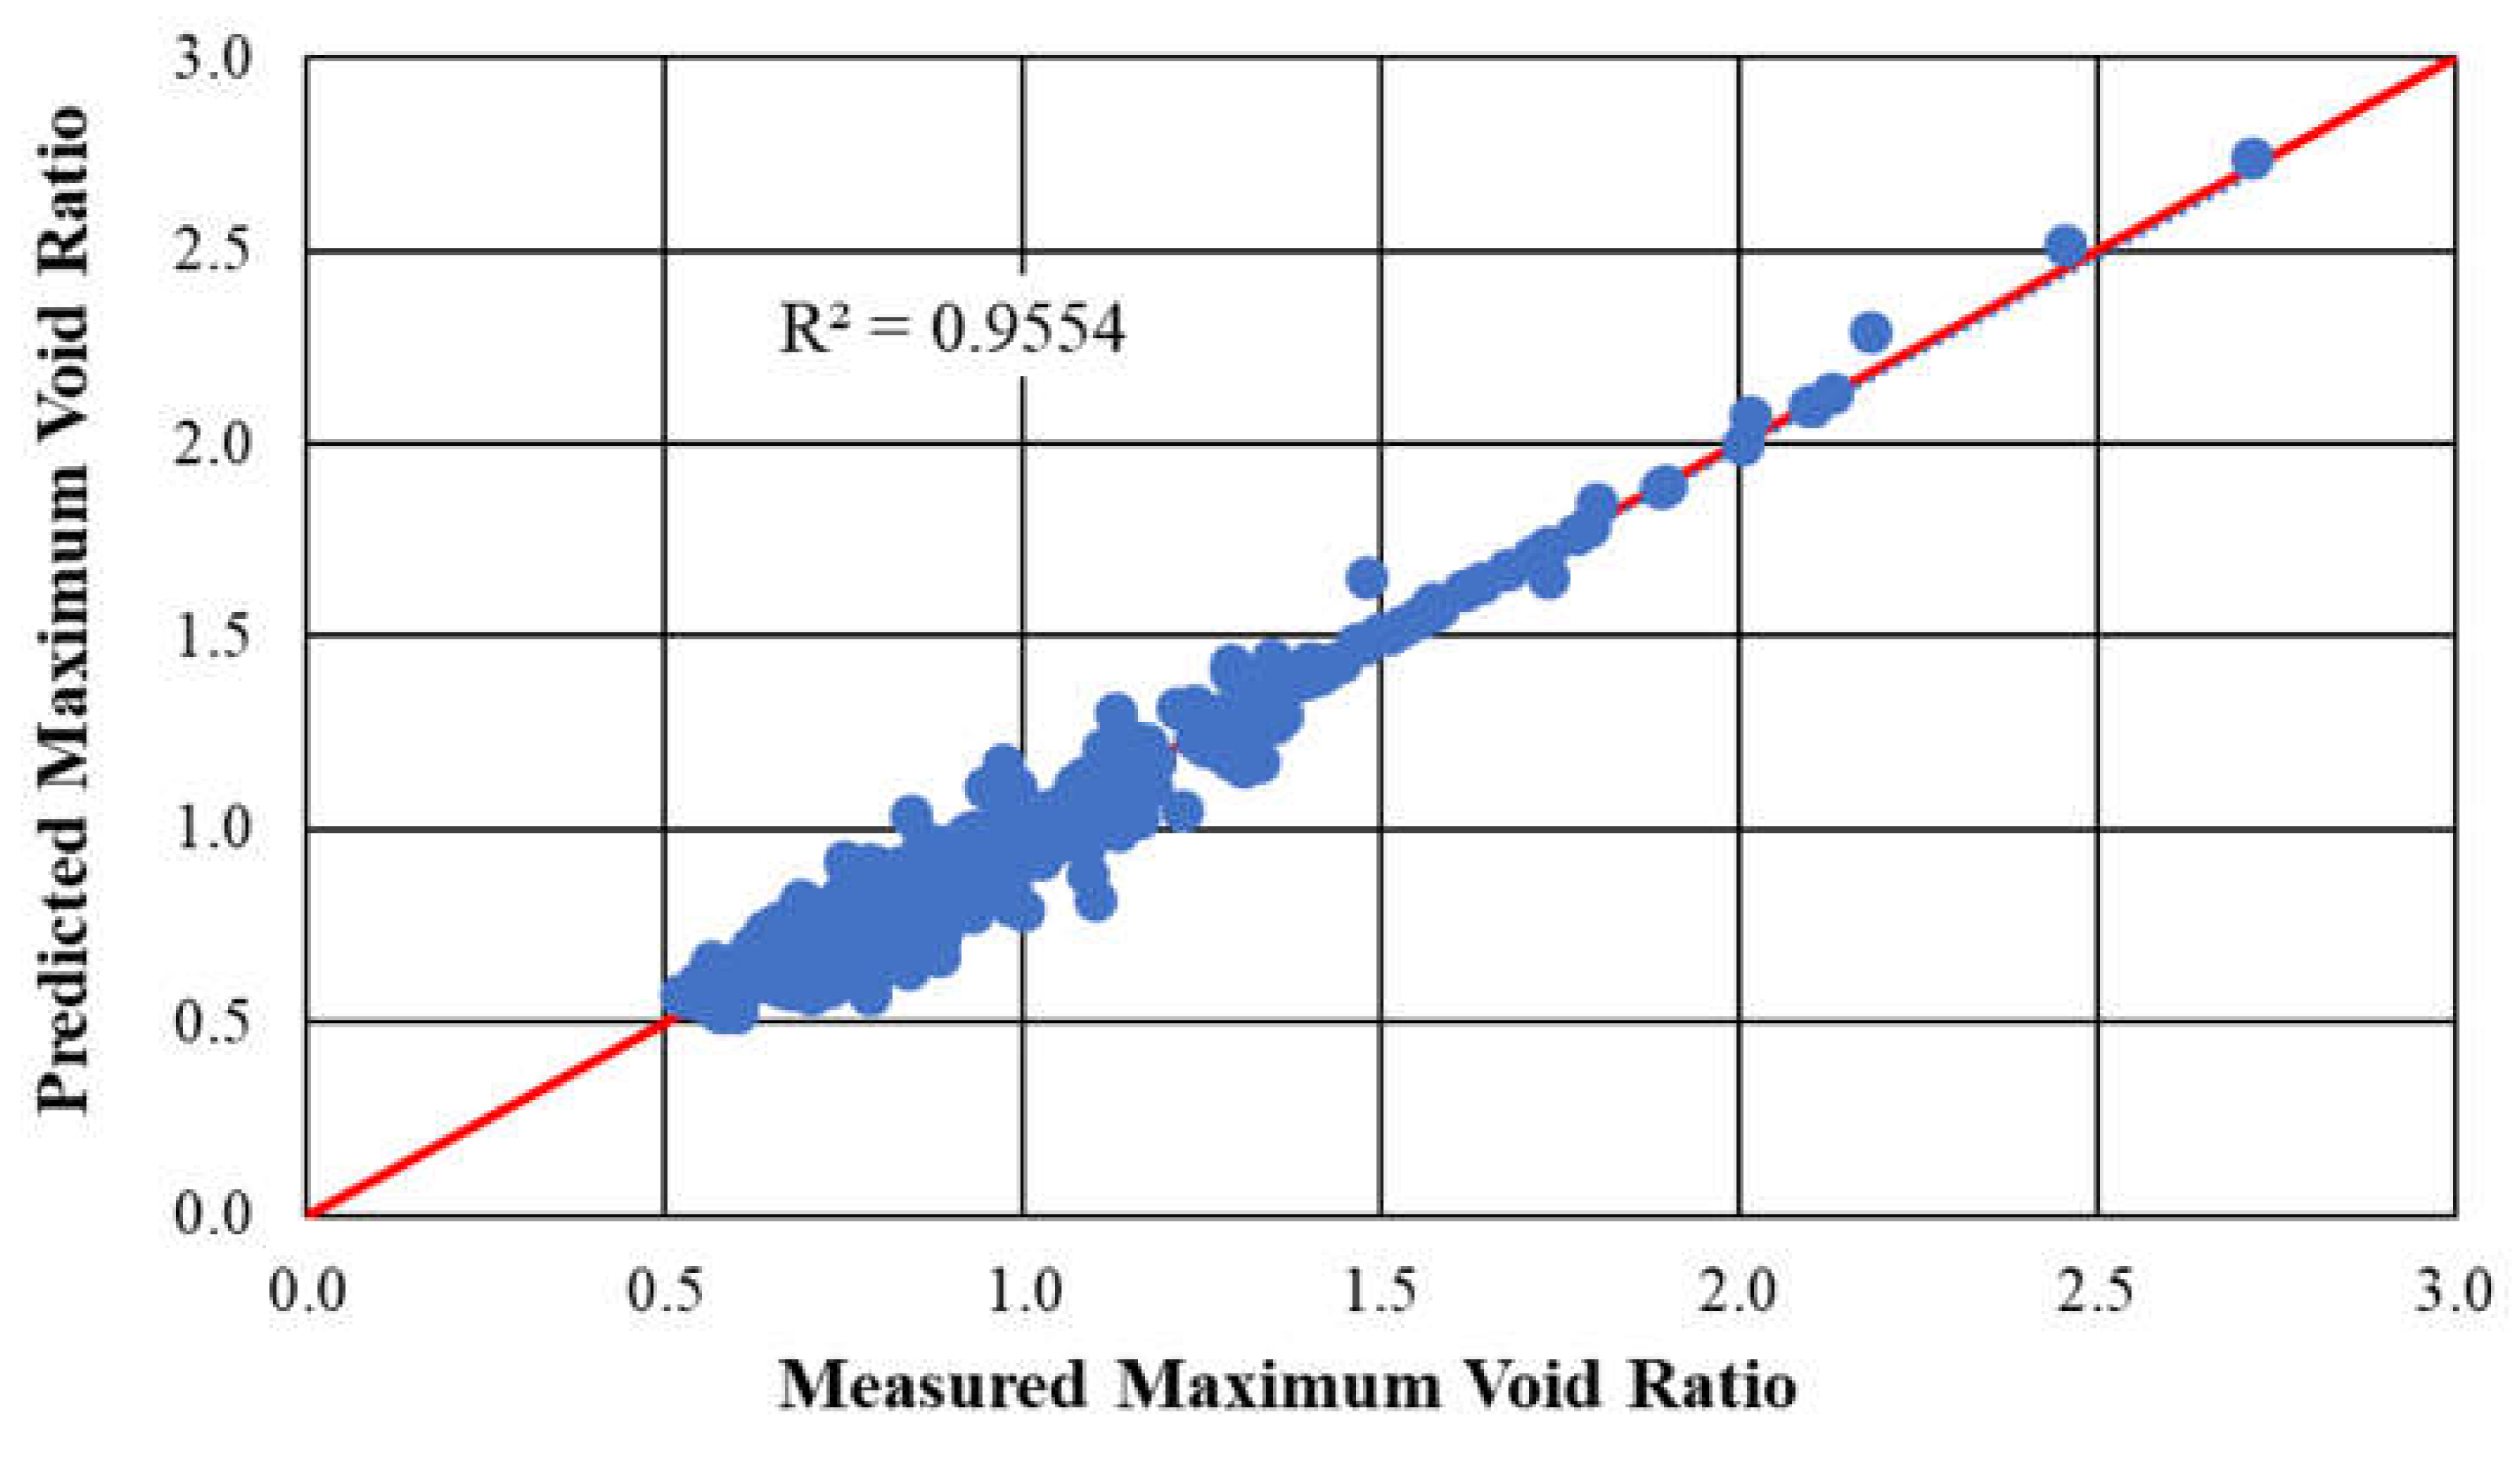
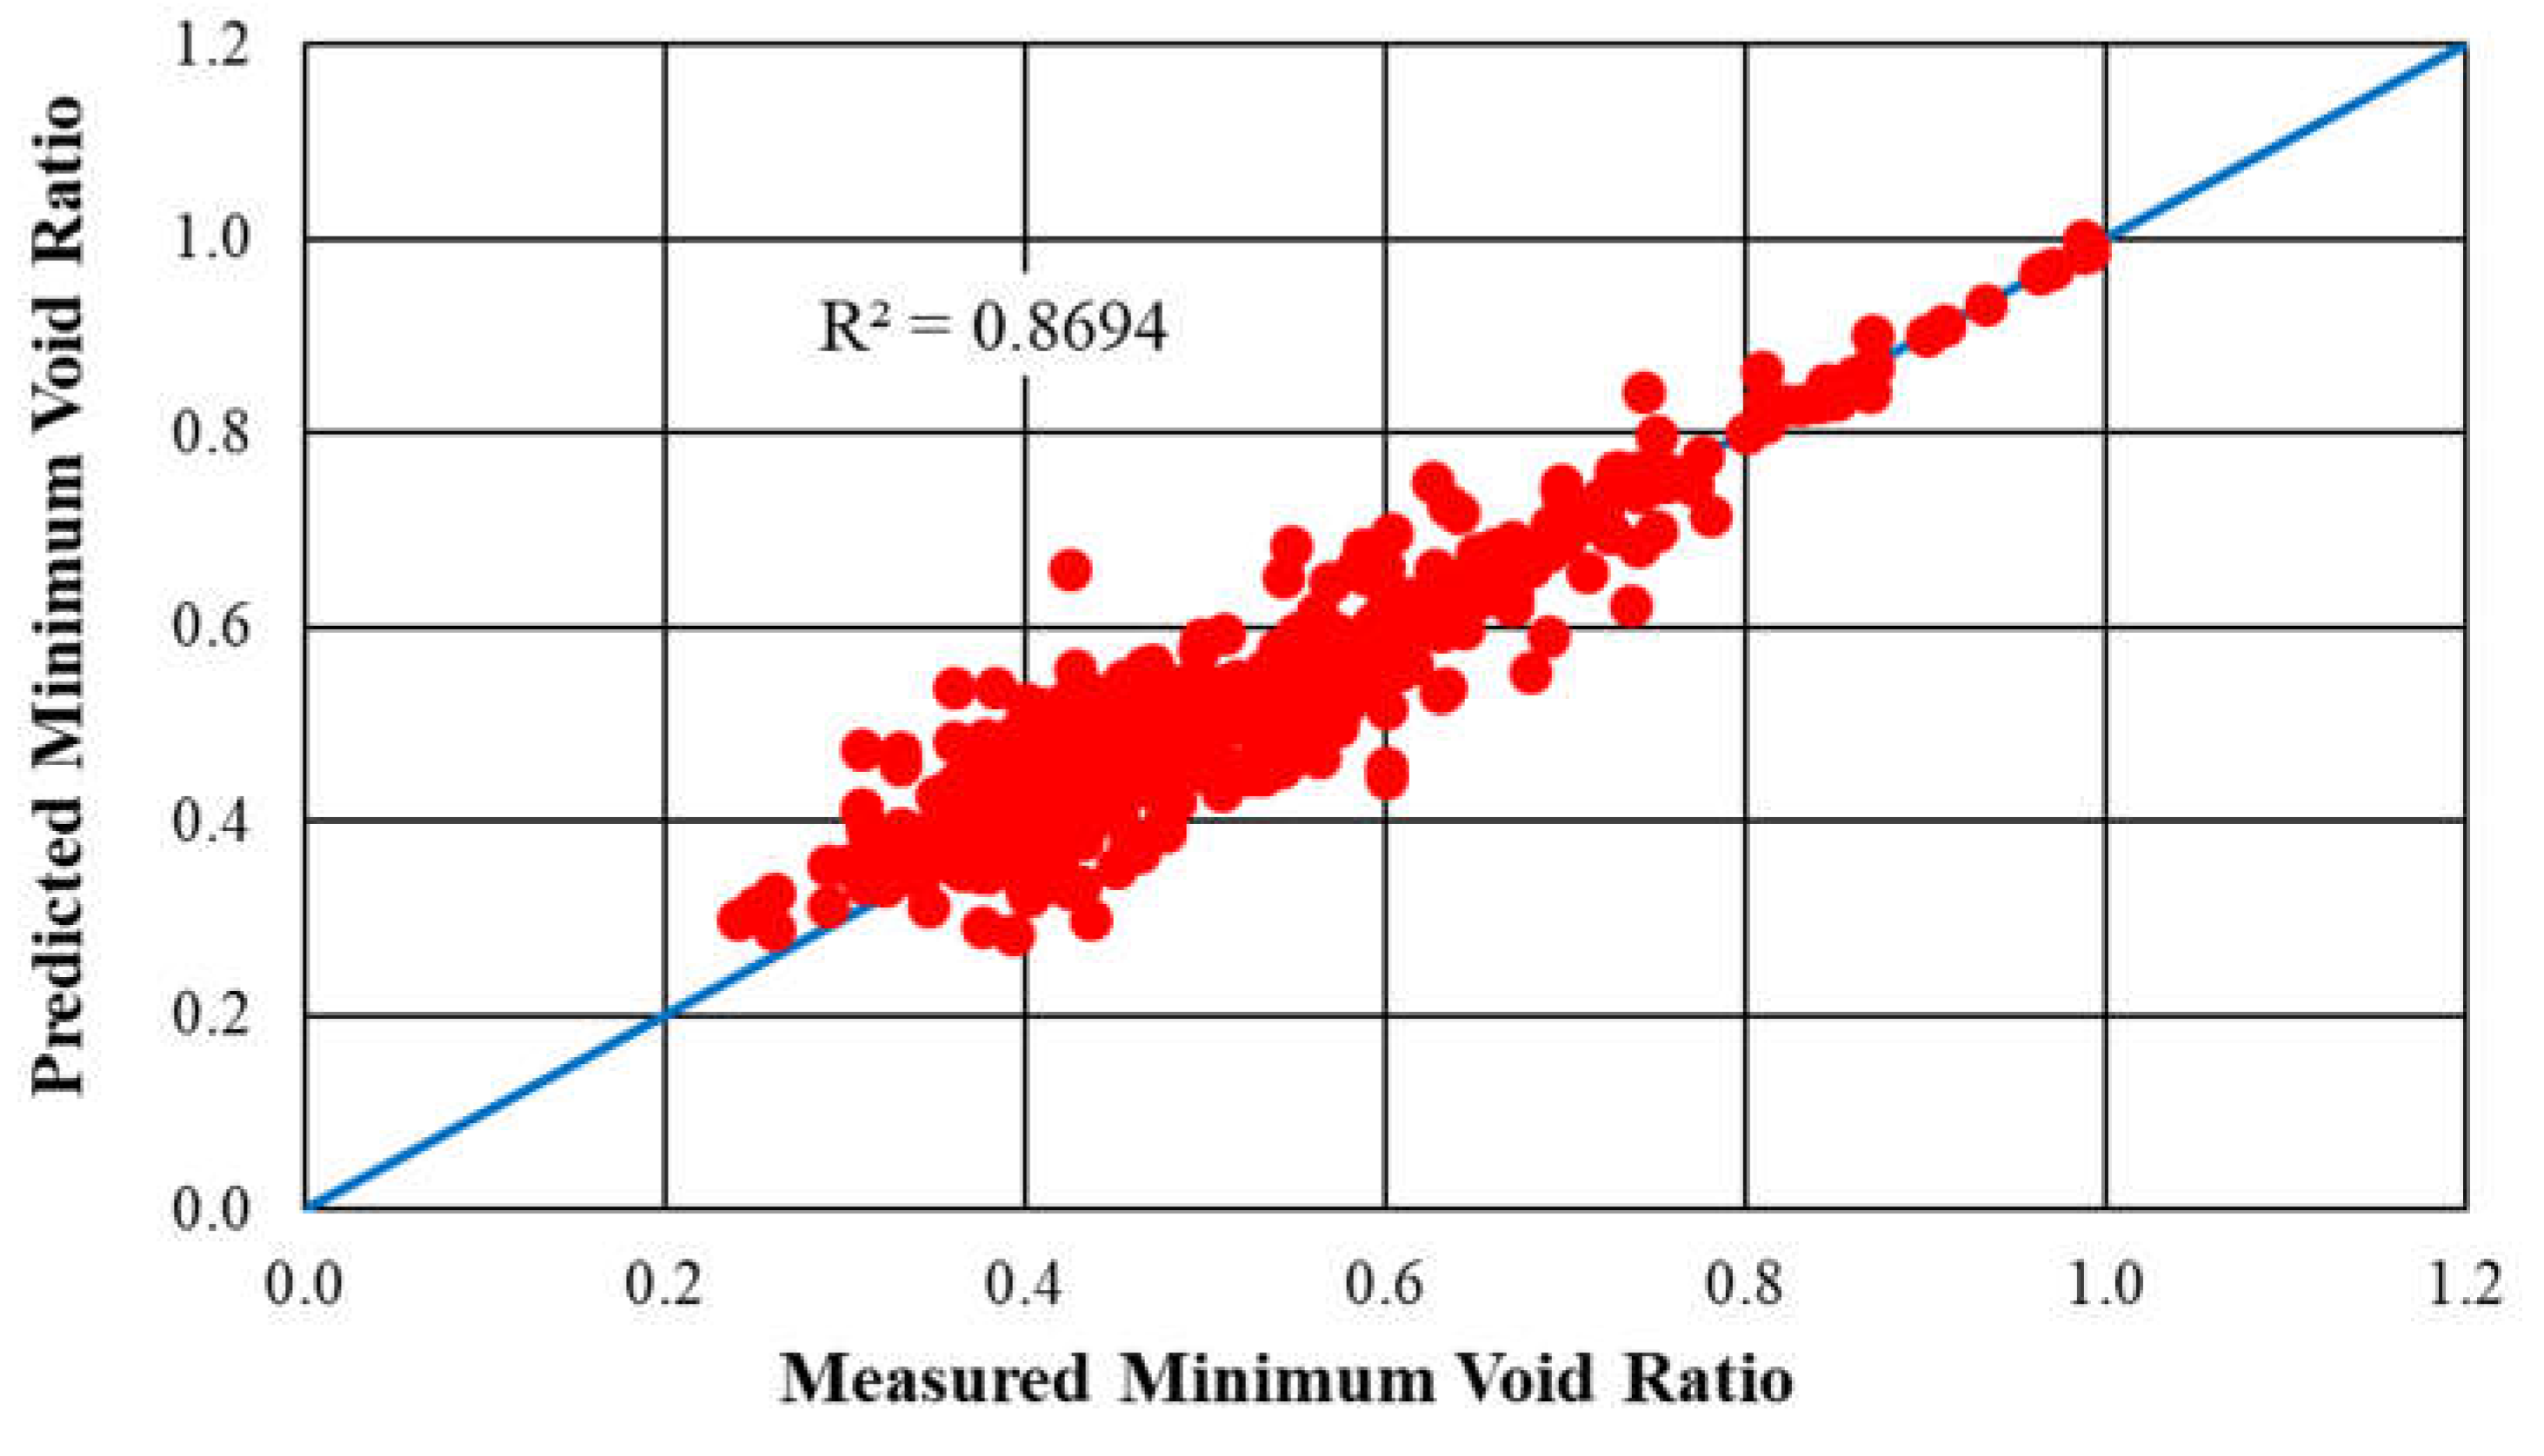
The results of the first stage of the analyses performed may be seen in
Figure 3 and
Figure 4.
Figure 3 plots the 524 values of
emax determined using the estimated values of the filling and embedment coefficients on the y-axis and the values of
emax measured in the laboratory on the x-axis. Also plotted is a trend line inclined at 45
o to the x-axis, which represents the case where the predicted void ratio is equal to the void ratio determined in the laboratory. The comparison of the actual and predicted maximum index void ratios produced an R
2 value of 0.956, indicating that the maximum index void ratios predicted by the correlations and equations closely matched the laboratory data.
Similar to
Figure 3,
Figure 4 plots the 524 values of e
min determined using the estimated values of the filling and embedment coefficients on the y-axis and the values of e
min measured in the laboratory on the x-axis. As in
Figure 3, a trend line inclined at 45
o to the x-axis was plotted. The comparison of the actual and predicted minimum index void ratios produced an R
2 value of 0.884, indicating that the minimum index void ratios predicted by the correlations and equations closely matched the laboratory data.
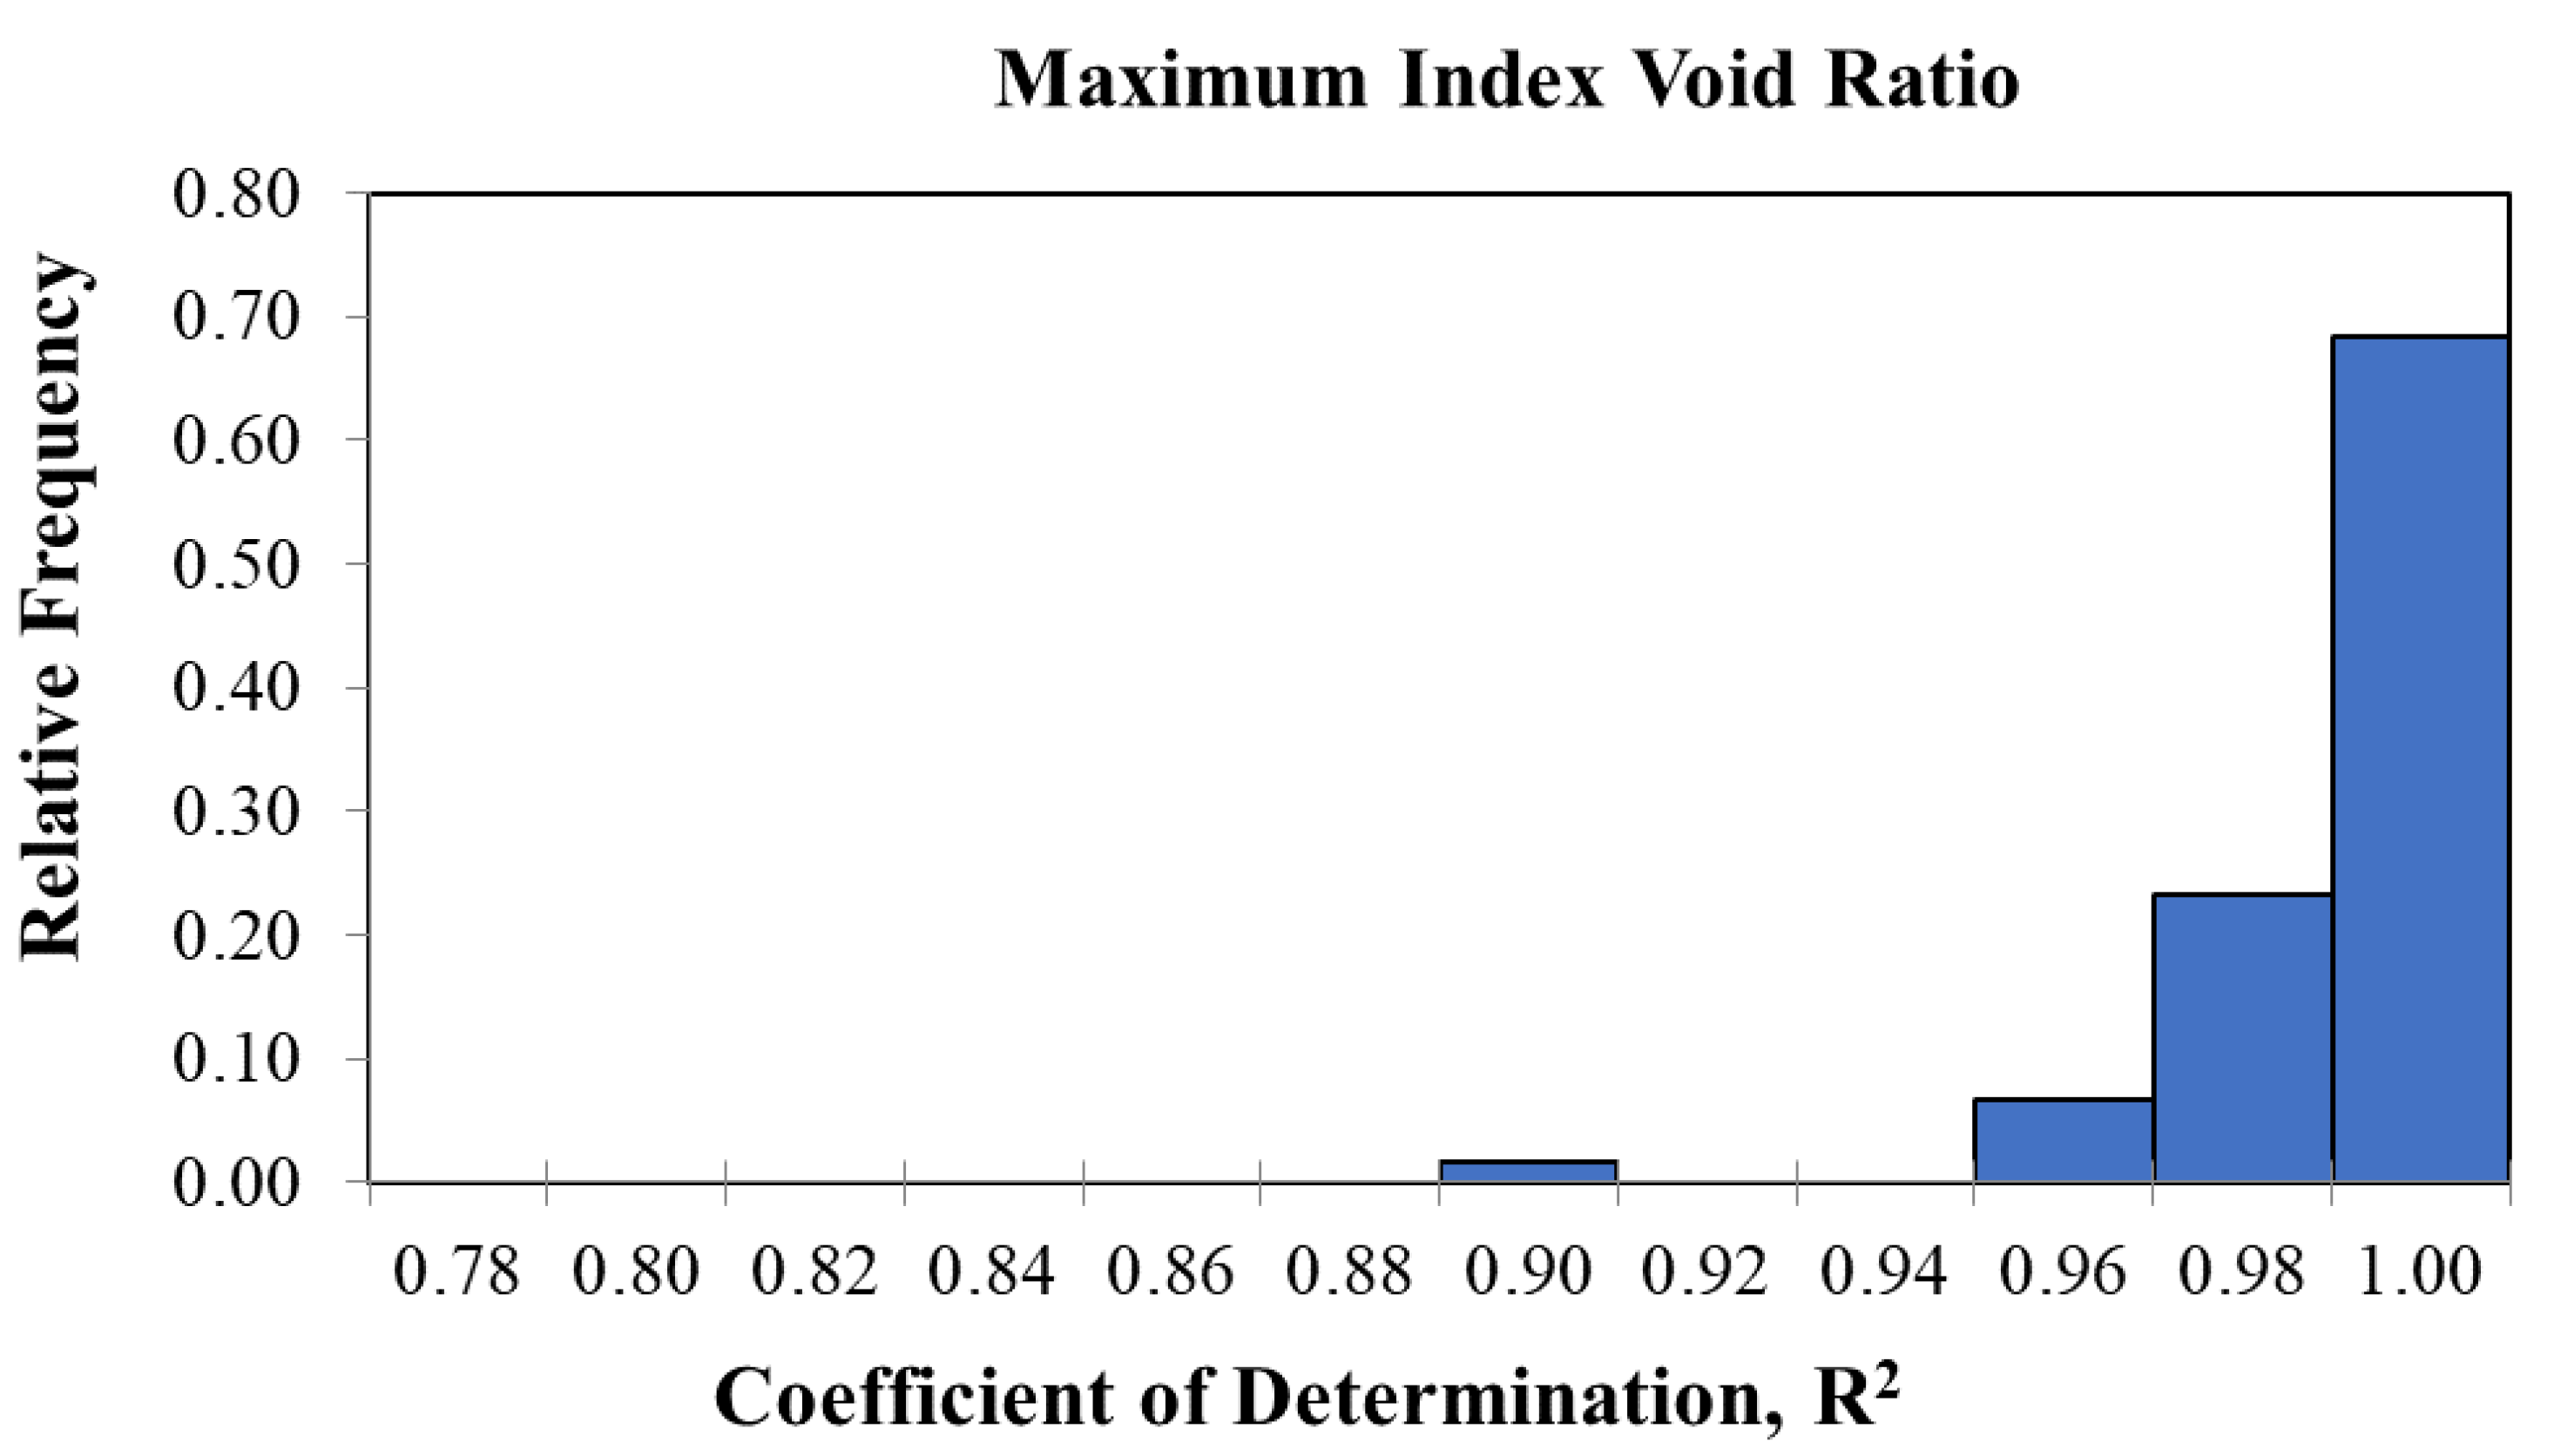
Figure 5 presents a histogram of the relative frequencies of the R
2 values determined for the maximum index void ratios for the 60 sand-silt combinations based on the filling and embedment coefficients developed using Equations 6 through 9. This analysis resulted in R
2 values for the 60 soil combinations ranging from 0.899 to 0.999 with a mean of 0.983 and a median of 0.988. For the maximum index void ratio, 59 out of 60 sand-silt combinations (98%) had R
2 values greater than 0.94.
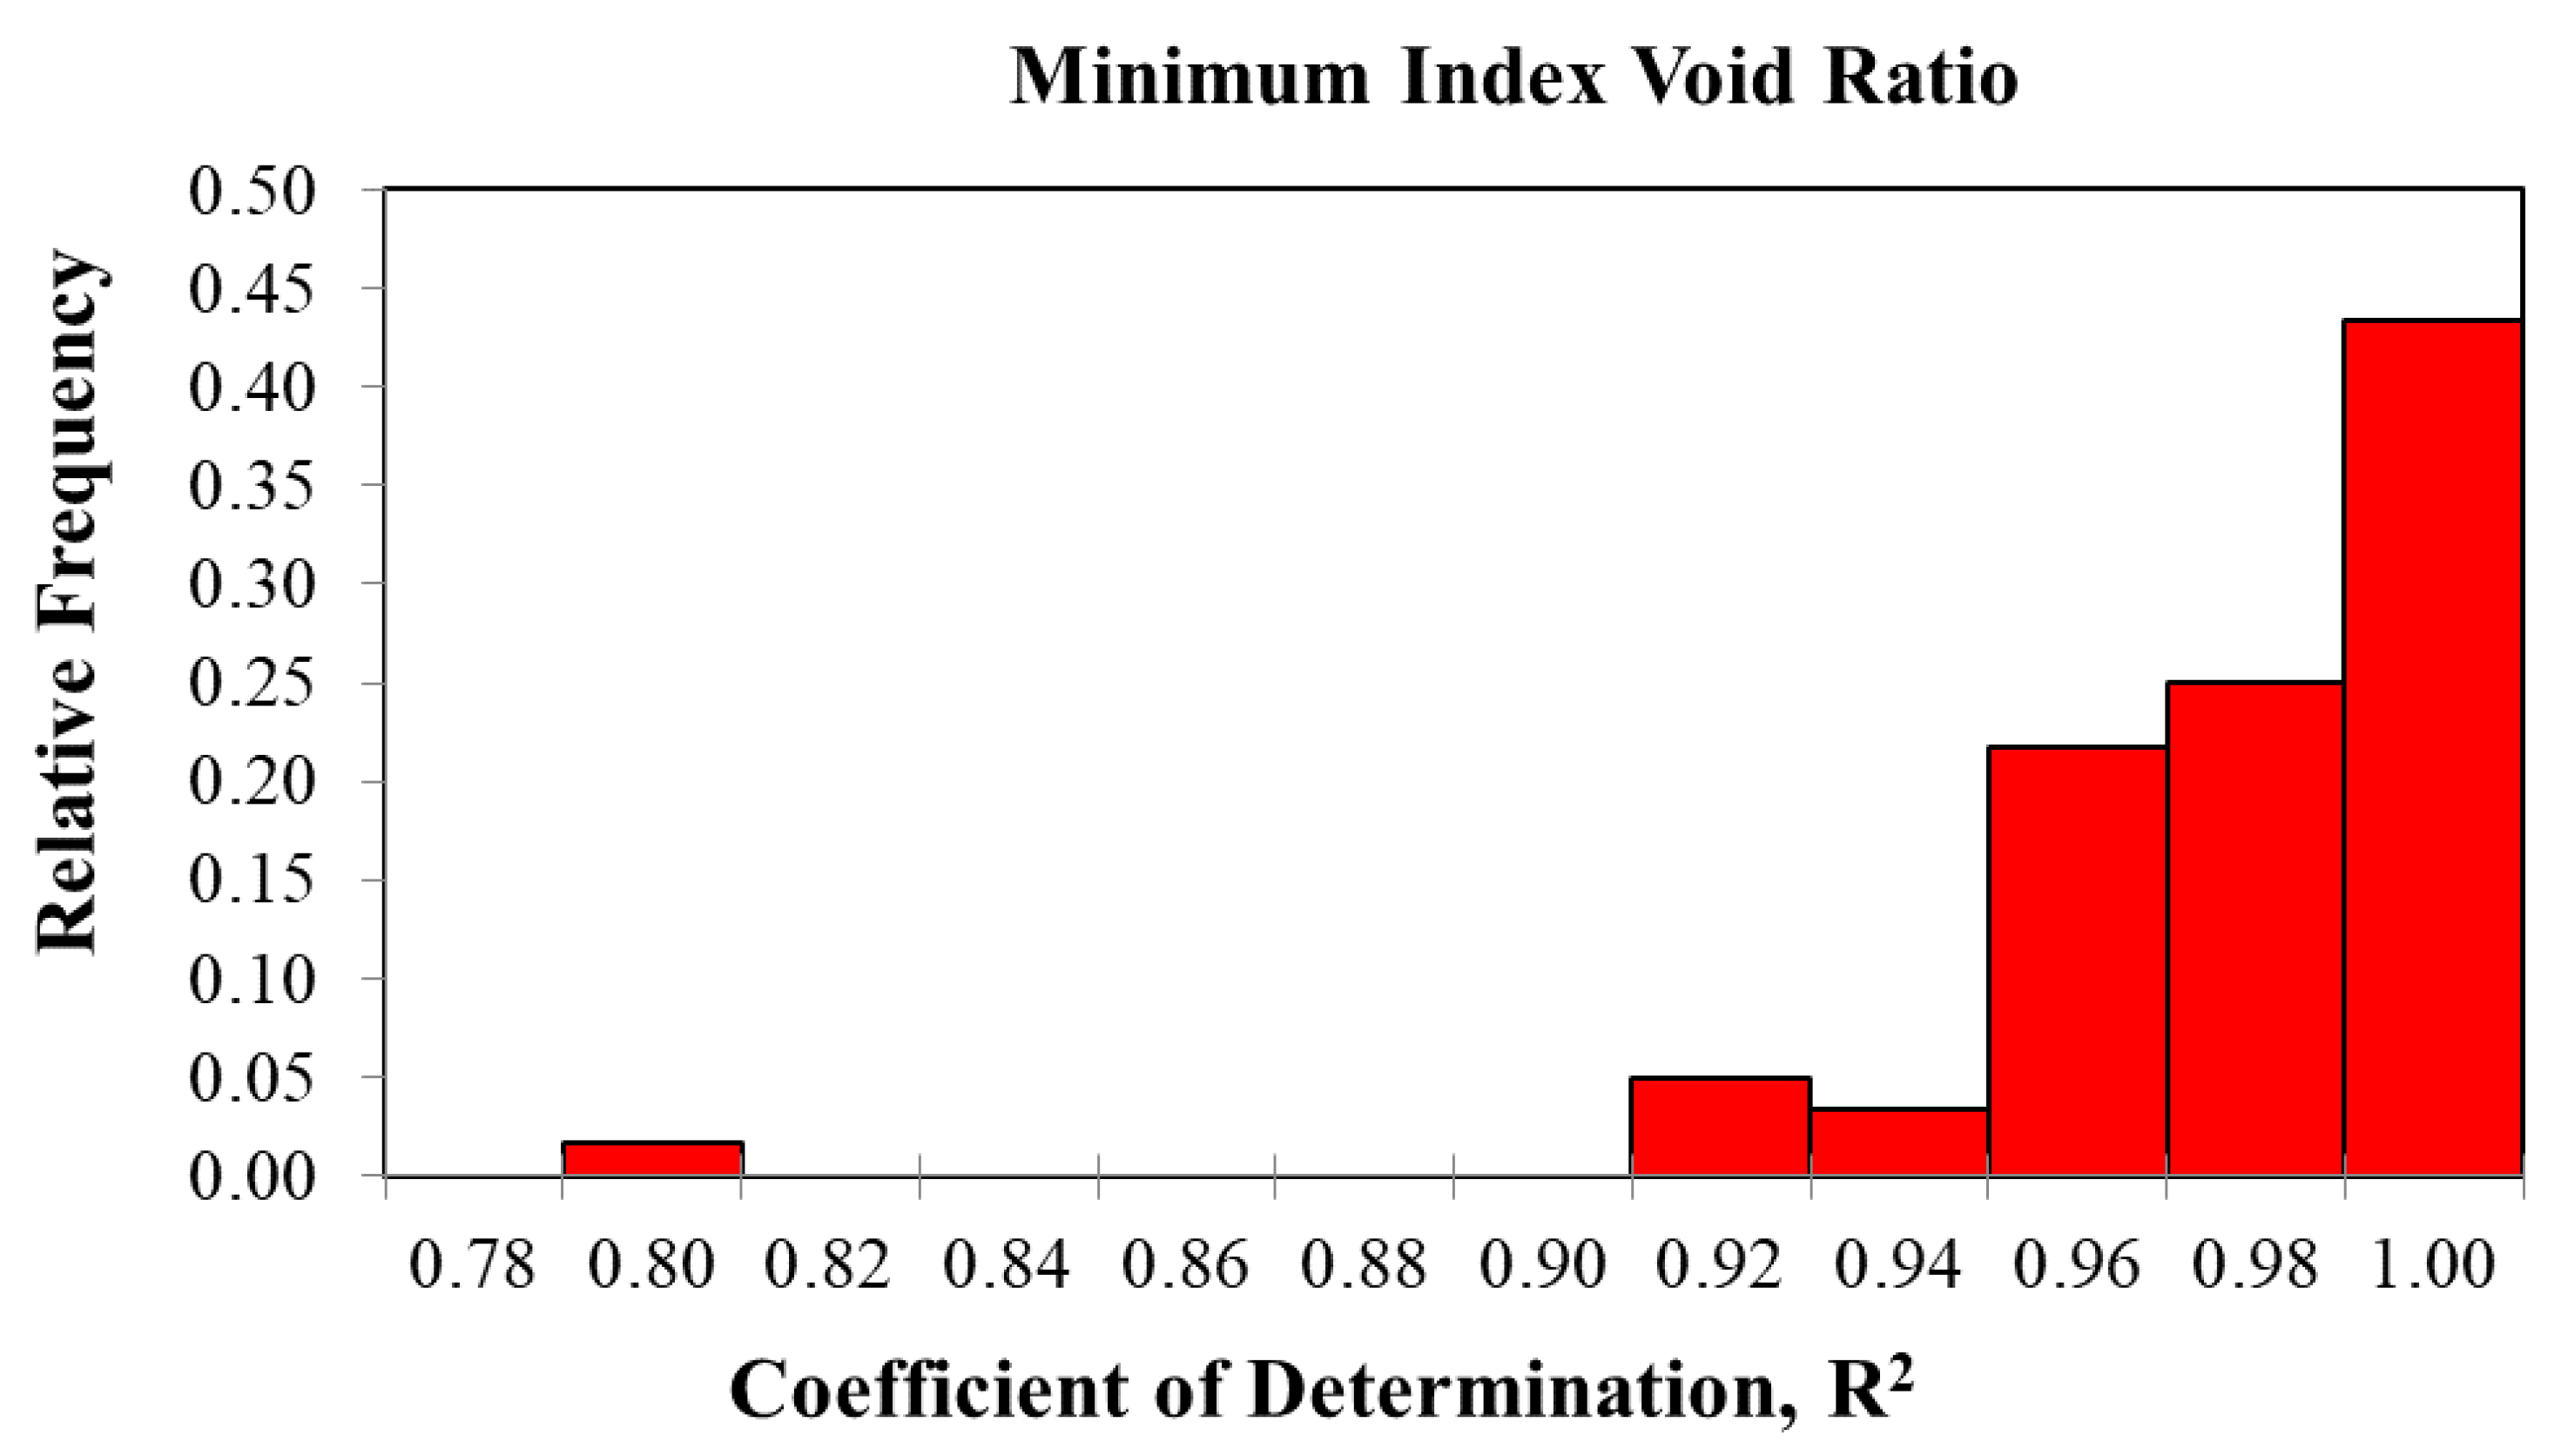
Figure 6 presents a histogram of the relative frequencies of the R
2 values determined for the minimum index void ratios for the 60 sand-silt combinations based on the filling and embedment coefficients developed using
Equations 6 through 9. This analysis resulted in R2 values for the 60 soil combinations ranging from 0.789 to 0.999 with a mean of 0.968 and a median of 0.973. For the minimum index void ratio, 54 out of 60 sand-silt combinations (90%) had R2 values greater than 0.94.
While this analysis is not truly statistically rigorous because it uses the data set that the models were derived from to validate the derived models, the high values of R2 achieved by the analyses indicates that Equations 6 through 9 yield values of the filling and embedment coefficients that produce accurate values of emax and emin.
The second and more statistically rigorous step in validating the correlations consisted of using the correlations to estimate the necessary coefficients for each of the three sand-silt combinations that were not included in the main data set. These coefficients were then used to estimate the maximum and minimum index void ratios at each of the silt contents for each of the three sand-silt combinations.
For the maximum index void ratios, analysis of the three, independent sand-silt combinations resulted in R
2 values ranging from 0.963 to 0.994 with a mean of 0.978 and a median of 0.979. For the minimum index void ratios, this analysis resulted in R
2 values ranging from 0.906 to 0.991 with a mean of 0.944 and a median of 0.936. Typical results from the analysis are presented in
Figure 7 for mixtures of Yatesville sand and Yatesville silt, which had an R
2 value of 0.979 for
emax and an R
2 value of 0.906 for
emin. A more detailed breakdown of the coefficients of determination obtained is provided in
Table 1. Additionally, the corresponding R
2 values for the main data set previously discussed are included in
Table 1 for comparison.
Given that each of the six R2 values is above 0.905 for the three independent data sets, it can be concluded that Equations 6 through 9 yielded values of filling and embedment coefficients that did an excellent job of estimating the maximum and minimum void ratios at the various silt content for all three sand-silt combinations examined.
6. Conclusions
In conclusion, the four correlations developed for estimating the filling and embedment coefficients led to accurate values of maximum and minimum index void ratios for sand-silt mixtures when used in the Chang et al. equations. The predictions generally had R2 values greater than 0.90. The true strength of these correlations lies in their simplicity and their ability to accurately estimate values of the filling and embedment coefficients while requiring only data from simple, common laboratory tests.
Data availability
The datasets developed and analyzed in the course of the current study are available from the author upon request.
Declaration of interest
The author has no conflicts of interest to declare. There is no financial interest to report.
Acknowledgments
The author would like to thank Valparaiso University for the financial support provided through the Alfred W. Sieving Chair of Engineering.
List of symbols
a Generalized filling coefficient
amax Filling coefficient for estimating the maximum index void ratio
amin Filling coefficient for estimating the minimum index void ratio
b Generalized embedment coefficient
bmax Filling coefficient for estimating the maximum index void ratio
bmin Embedment coefficient for estimating the minimum index void ratio
d50 Median grain size in mm for silt
emax Maximum index void ratio
Maximum index void ratio of the sand fraction of a sand-silt combination
Maximum index void ratio of the sand fraction of a sand-silt combination
Maximum index void ratio of a soil below the threshold fines content
Maximum index void ratio of a soil above the threshold fines content
emin Minimum index void ratio
Minimum index void ratio of the sand fraction of a sand-silt combination
Minimum index void ratio of the silt fraction of a sand-silt combination
Minimum index void ratio of a soil below the threshold fines content
Maximum index void ratio of a soil above the threshold fines content
y1 Fraction of the sand-silt mixture that is sand
y2 Fraction of the sand-silt mixture that is silt
D50 Median grain size in mm for sand
M1 Silt content of a soil below the threshold fines content
M2 Silt content of a soil above the threshold fines content
References
- ASTM D 4253-00, 2000a, Standard test methods for maximum index density and unit weight of soils using vibratory table. ASTM International, West Conshohocken, PA, 2014, www.astm.org.
- ASTM D 4254-00, 2000b. Standard test methods for minimum index density and unit weight of soils and calculation of relative density. ASTM International, West Conshohocken, PA, 2014, www.astm.org.
- Chang, C.; Wang, L.; Ge, L. Maximum and minimum void ratios for sand-silt mixtures. Engineering Geology, 2016, 211, 7–18. [Google Scholar] [CrossRef]
- Polito, C. Regression models for estimating parameters a and b for Chang, Wang and Ge’s maximum and minimum void ratio models. In Proceedings of the GeoNiagra September 26 to 29, 2021.
- Thevanayagam, S.; Shenthan, T.; Mohan, S.; Liang, J. Undrained fragility of clean sands, silty sands, and sandy silts. Journal of Geotechnical and Geoenvironmental Engineering 2002, 128, 849–859. [Google Scholar] [CrossRef]
- Polito, C. The effects of non-plastic and plastic fines on the liquefaction of sandy soils. PhD Thesis, . Virginia Polytechnic Institute and State University, VA, 10 December 1999. [Google Scholar]
- Hazirbaba, K. Pore Pressure Generation Characteristics of Sands and Silty Sands: A Strain Approach. PhD Thesis, University of Texas at Austin, 2005. [Google Scholar]
- Yang, S.; Lacasse, S.; Sandven, R. Determination of the transitional fines content of mixtures of sand and non-plastic fines. Geotechnical Testing Journal, 2006, 29, 102–107. [Google Scholar]
- Kokusho, T. (2007). “Liquefaction Strengths of Poorly-Graded and Well-Graded Granular Soils Investigated By Lab Tests,” In Proceedings of 4th International Conference on Earthquake Geotechnical Engineering-Invited Lectures, Springer, 2007, 6, 159–184.
- Polito, C.; Sibley, E. Threshold fines content and the behavior of sands with non-plastic silts. Canadian Geotechnical Journal, 2020, 57, 462–465. [Google Scholar] [CrossRef]
- Belkhatir, M.; Schanz, T.; Arab, A. Effect of fines content and void ratio on the saturated hydraulic conductivity and undrained shear strength of sand–silt mixtures. Environmental Earth Science 2013, 70, 2469–2479. [Google Scholar] [CrossRef]
- Bensoula, M.; Missoum, H.; Bendani, K. Critical undrained shear strength of sand-silt mixtures under monotonic loading. International Journal of Civil Engineering and Technology 2018, 9, 447–455. [Google Scholar] [CrossRef]
- Fourie, A.; Blight, G.E.; Papageorgiou, G. Static liquefaction as a possible explanation for the Merriespruit tailings dam failure. Canadian Geotechnical Journal 2001, 38, 707–719. [Google Scholar] [CrossRef]
- Hazirbaba, K.; Rathje, E. M. Pore pressure generation of silty sands due to induced cyclic shear strains. Journal of Geotechnical and Geoenvironmental Engineering 2009, 135, 1892–1905. [Google Scholar] [CrossRef]
- Khan, M. A., Khan, M. Z., Khan, M. B. Experimental approach for assessment of liquefaction in fine sand and silty sand. International Journal of Engineering Science Invention 2016, 5, 68–72.
- Lade, P. V.; Liggio, C. D.; Jr., Yamamuro, J. A. Effects of non-plastic fines on minimum and maximum void ratios of sand. Geotechnical Testing Journal 1998, 21, 336–347. [CrossRef]
- Teng, J.; Araki, K.; Yasufuku, N.; Ikeda, H. Experimental study on void ratio characteristics of sand-fines mixture. Proceedings of The 66th Annual Scientific Lecture Meeting of the Japan Society of Civil Engineers, 2011, 66, 785–786. [Google Scholar]
- Yilmaz, Y.; Mollamahmutoglu, M. Characterization of liquefaction susceptibility of sands by means of extreme void ratios and/or void ratio range. Journal of Geotechnical and Geoenvironmental Engineering 2009, 135, 1986–1990. [Google Scholar] [CrossRef]
|
Disclaimer/Publisher’s Note: The statements, opinions and data contained in all publications are solely those of the individual author(s) and contributor(s) and not of MDPI and/or the editor(s). MDPI and/or the editor(s) disclaim responsibility for any injury to people or property resulting from any ideas, methods, instructions or products referred to in the content. |
© 2023 by the authors. Licensee MDPI, Basel, Switzerland. This article is an open access article distributed under the terms and conditions of the Creative Commons Attribution (CC BY) license (http://creativecommons.org/licenses/by/4.0/).
