1. Introduction
In the search for increasing or maintaining oil production in mature fields, several techniques for reenergizing reservoirs and readjusting the physical properties of oil (viscosity, surface tension, ...) have been developed throughout the industry’s history. Among them, the water injection technique was one of the first to be studied and disseminated, being the most used today [
1].
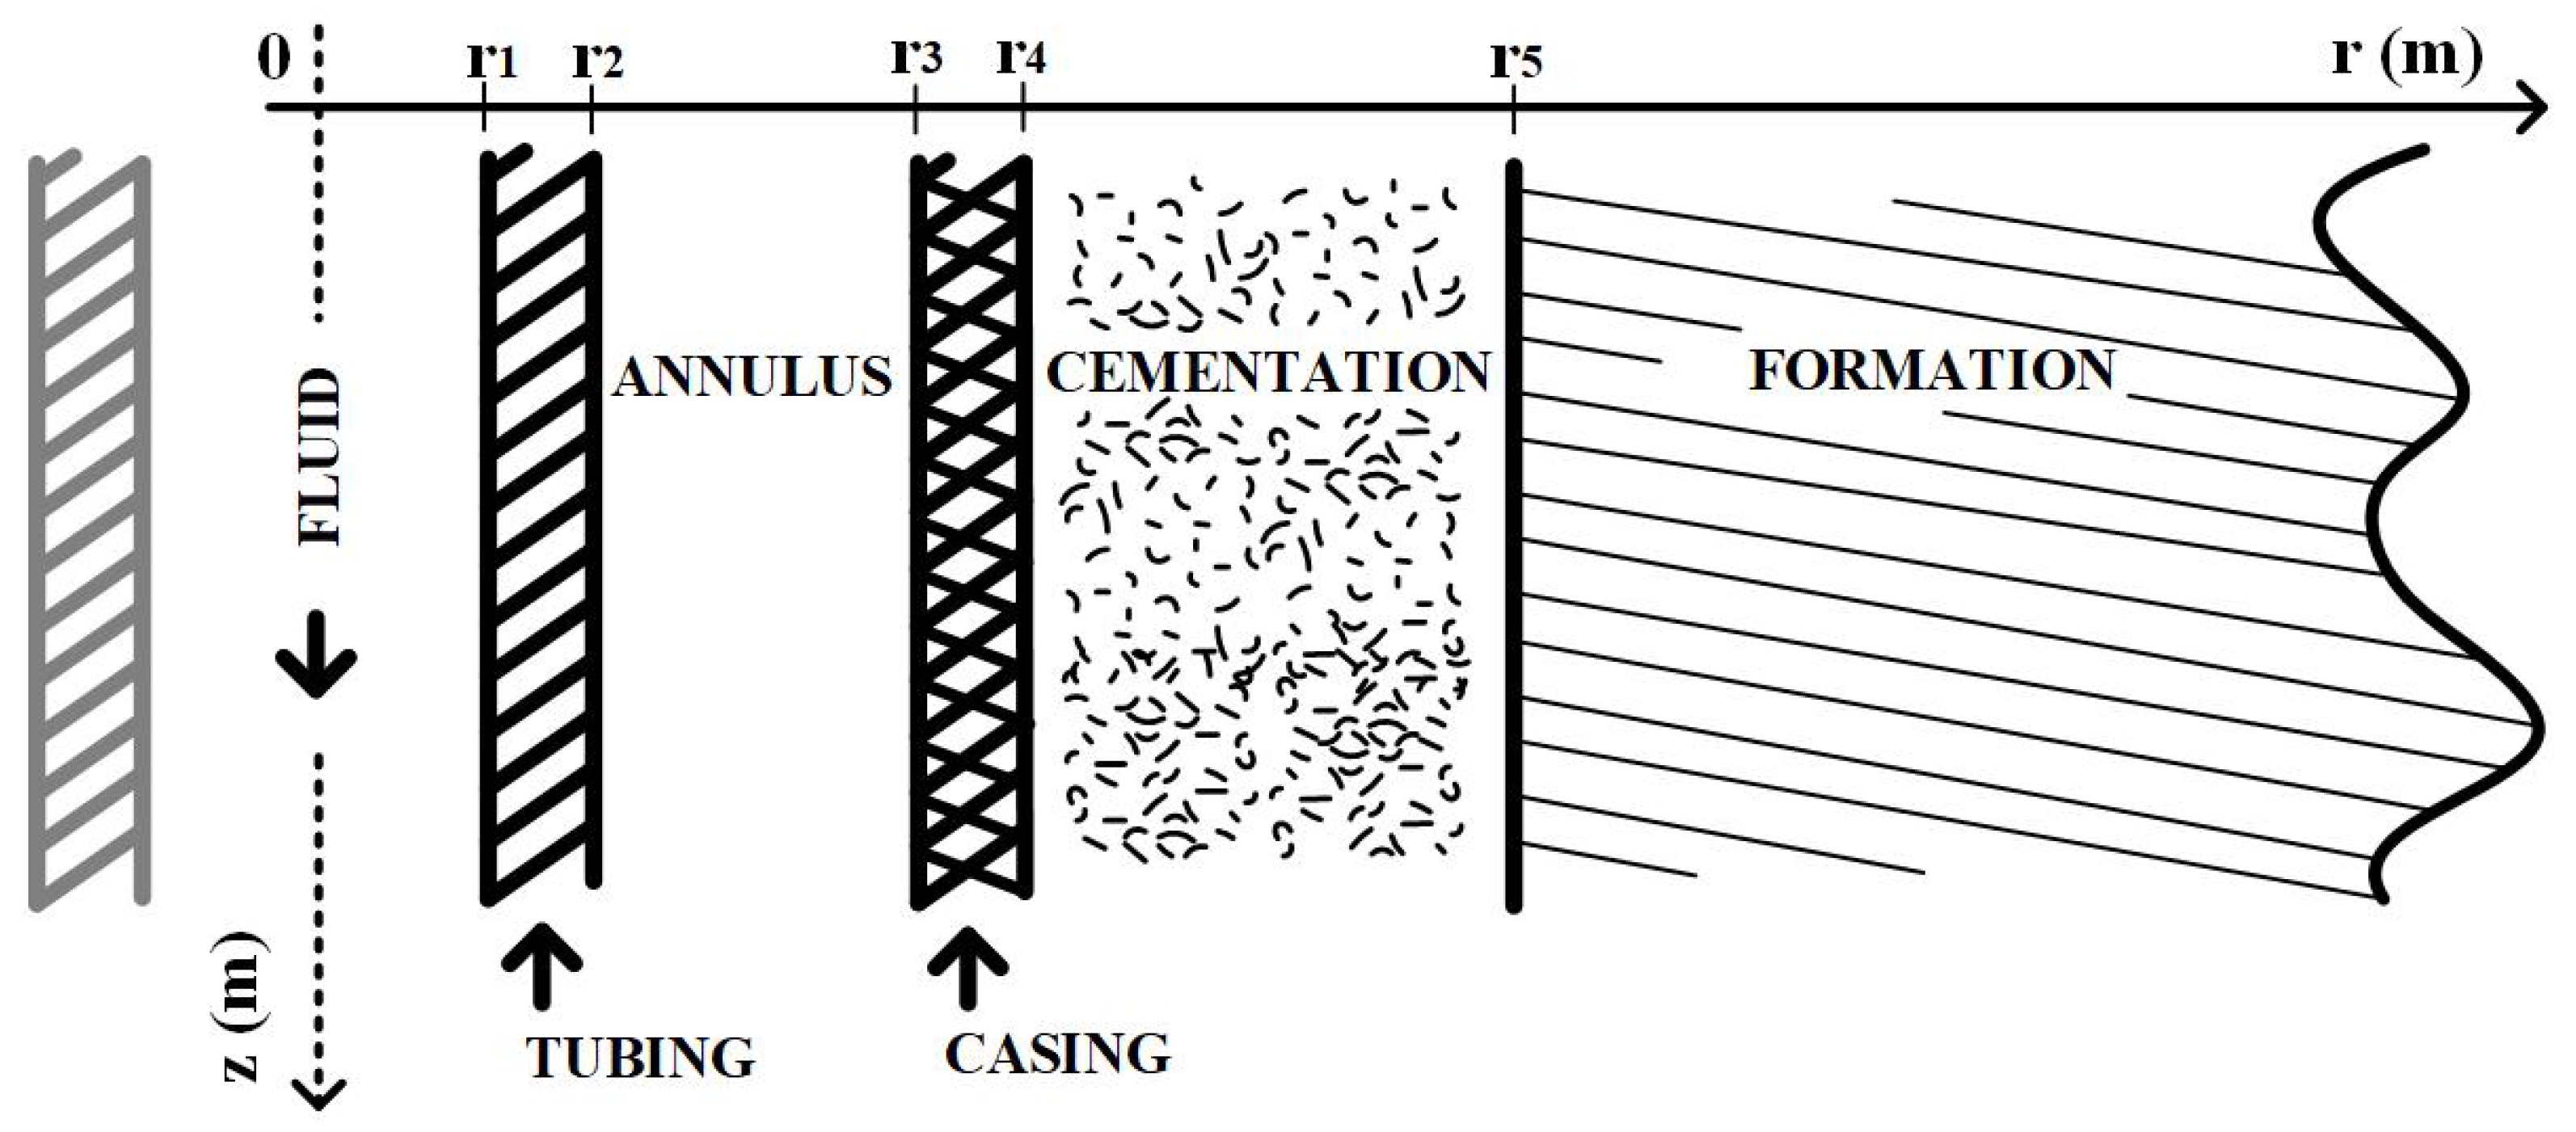
Wells intended for the injection of fluids, called injection wells, are distinguished from wells intended for oil extraction, called producing wells. The fluid used is called injection fluid. They generally have the same type of completion (tubing, annulus, casing, and cementing), as represented in the schematic in
Figure 1.
Measuring the injected flow rate is crucial for the excellent performance of any injection method. With this information, it is possible to detect deviations from the designed flow rates caused by failures in the mechanical flow regulators and the damage existing to the formation [
2]. When adopting multiple injection zones, in which fluid is simultaneously injected into several sections along the injection well, the quality of this measurement is more critical, given the risk of greater deviation from the designed flow.
Flow measurement using thermal profiles depends on the existence of a temperature gradient and, consequently, two thermal profiles. In the case of injection wells, the thermal profile established in the injection fluid and the geothermal profile, established naturally in the formation, have been used. The first has a defined location, in the middle of the pipe. The second has an undefined location, tending to infinity, in accordance with the progression of the thermal disturbance. With the knowledge of these two profiles, the flow rate will be completely defined, if the physical properties (conductivity, thermal capacity, etc.), the operating time, the initial conditions, and the well boundary conditions are known.
Given the impossibility of physically accessing all points of the well and reservoir to collect the physical properties and initial condition, the following conceptual simplifications have been adopted in the literature since the first studies [
3]:
- (a)
formation with infinite extension;
- (b)
linear, time-invariant geothermal profile;
- (c)
unidirectional and constant injection flow rate;
- (d)
constant fluid temperature at the surface;
- (e)
zero vertical heat flow;
- (f)
homogeneous, isotropic, and time-invariant physical properties;
- (g)
initial temperatures equal to the geothermal profile.
As a result of the simplifications listed, which have been adopted in whole or in large part in all of the technical texts referenced in this article, the solutions developed have low accuracy in the first moments of an injection well’s operation. In particular, the quasi-static methods, which include the original Ramey [
4] solution, require weeks to obtain a meaningful reading. The analytical methods studied, Wu & Pruess [
3] and Assmann [
5], because they do not take into account the transient nature of heat transfer in the completion, also suffer from low accuracy in flow measurement in the first few moments.
2. Preliminaries
Consider an idle injection well in thermal equilibrium with the formation, as shown in
Figure 1. Assume that a new injection process starts at
. Also, assume that the injection fluid has no phase change, is incompressible, and is colder than the reservoir. As the fluid moves through the pipe, it gains thermal energy, and its temperature increases, creating a thermal profile along the pipe. The established profile is directly related to the flow rate in the pipe.
To calculate the flow rate for
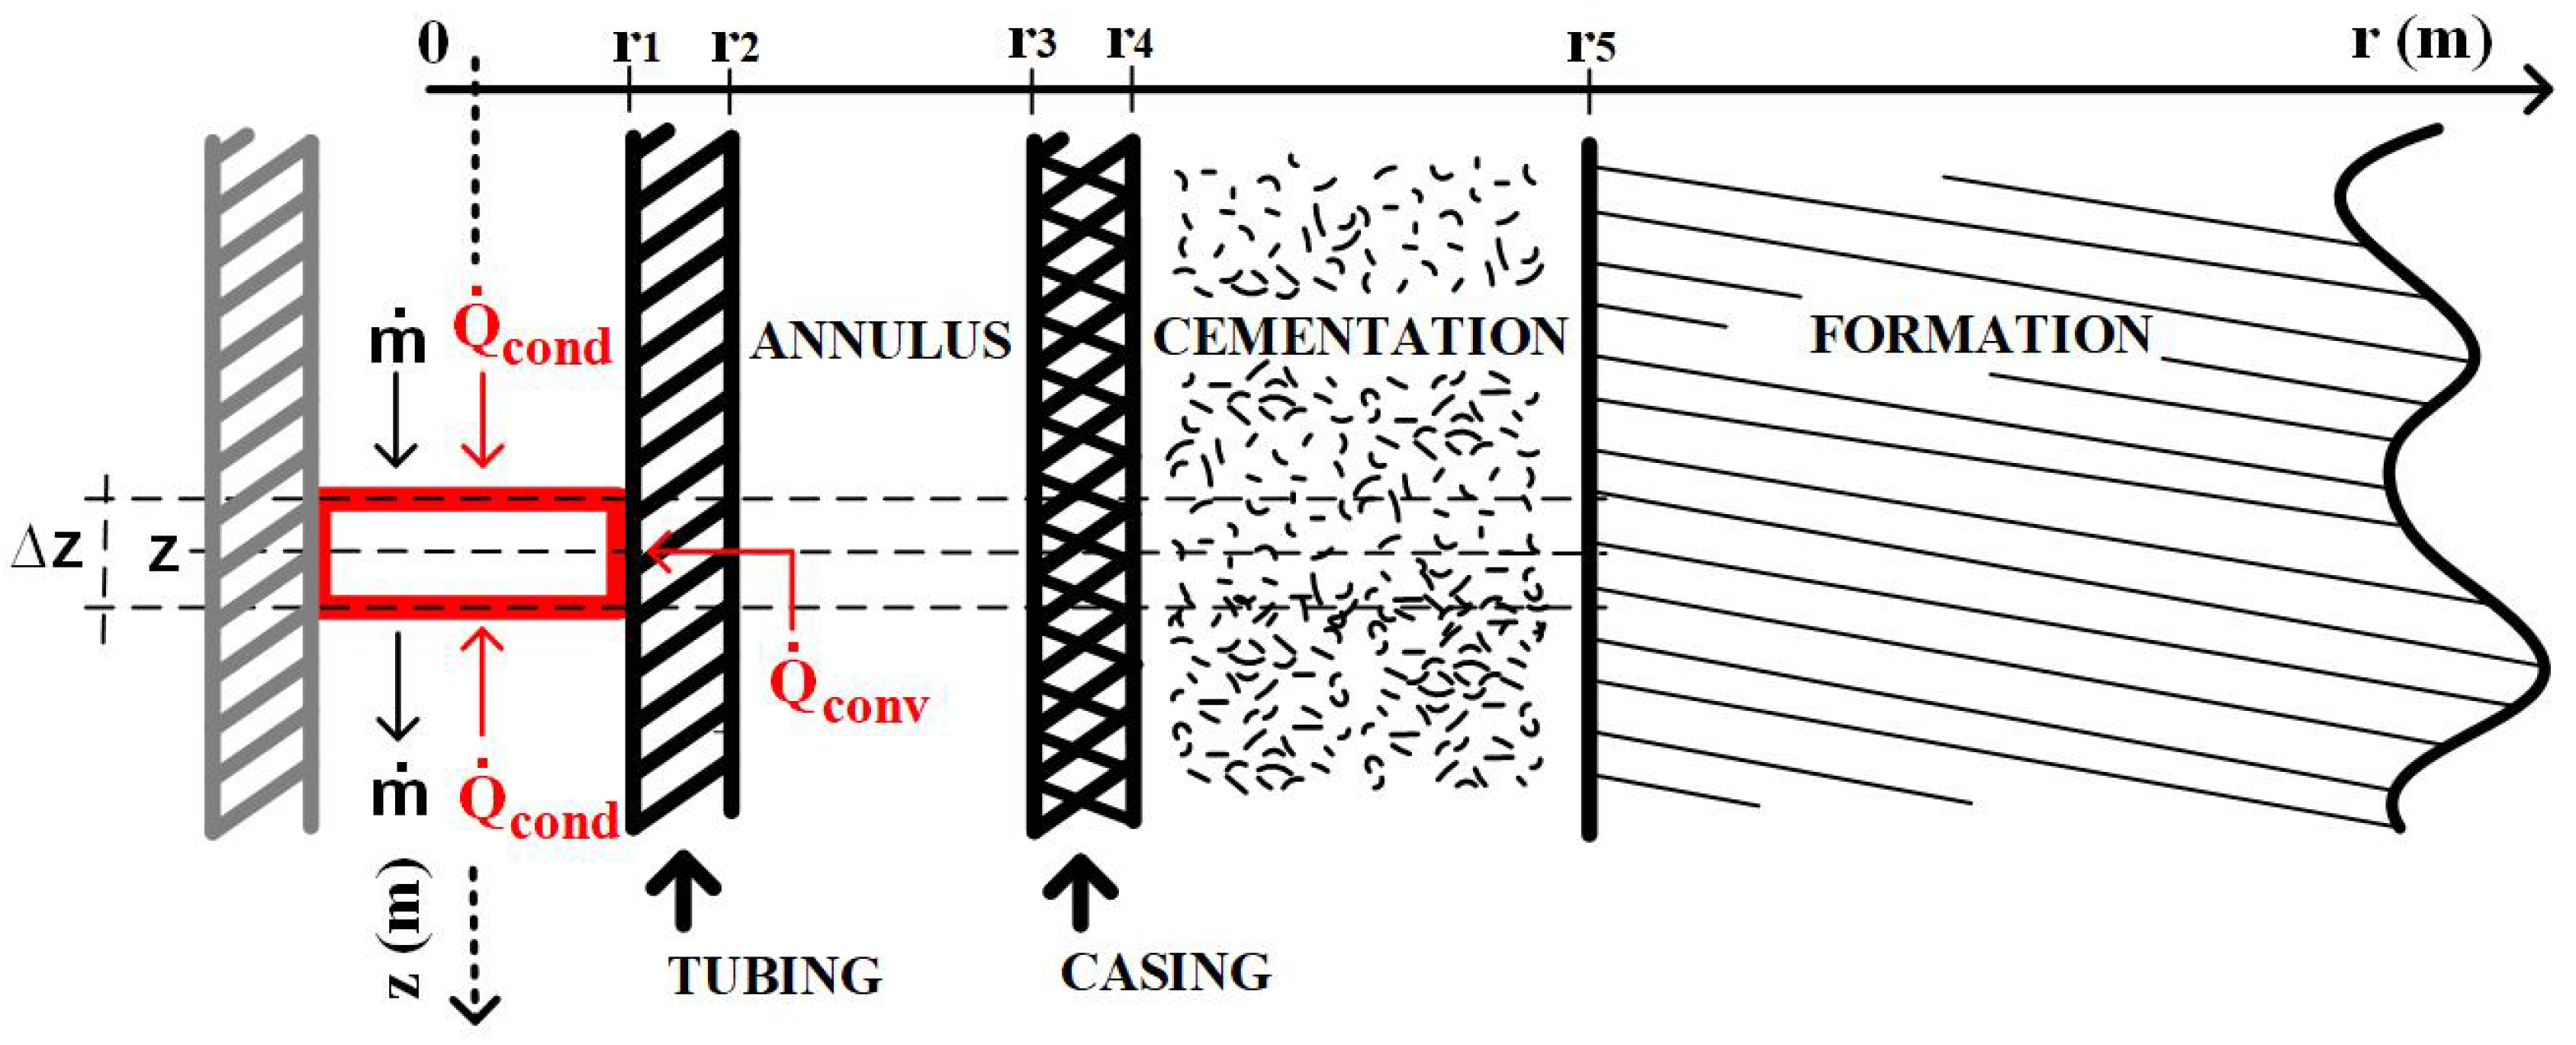
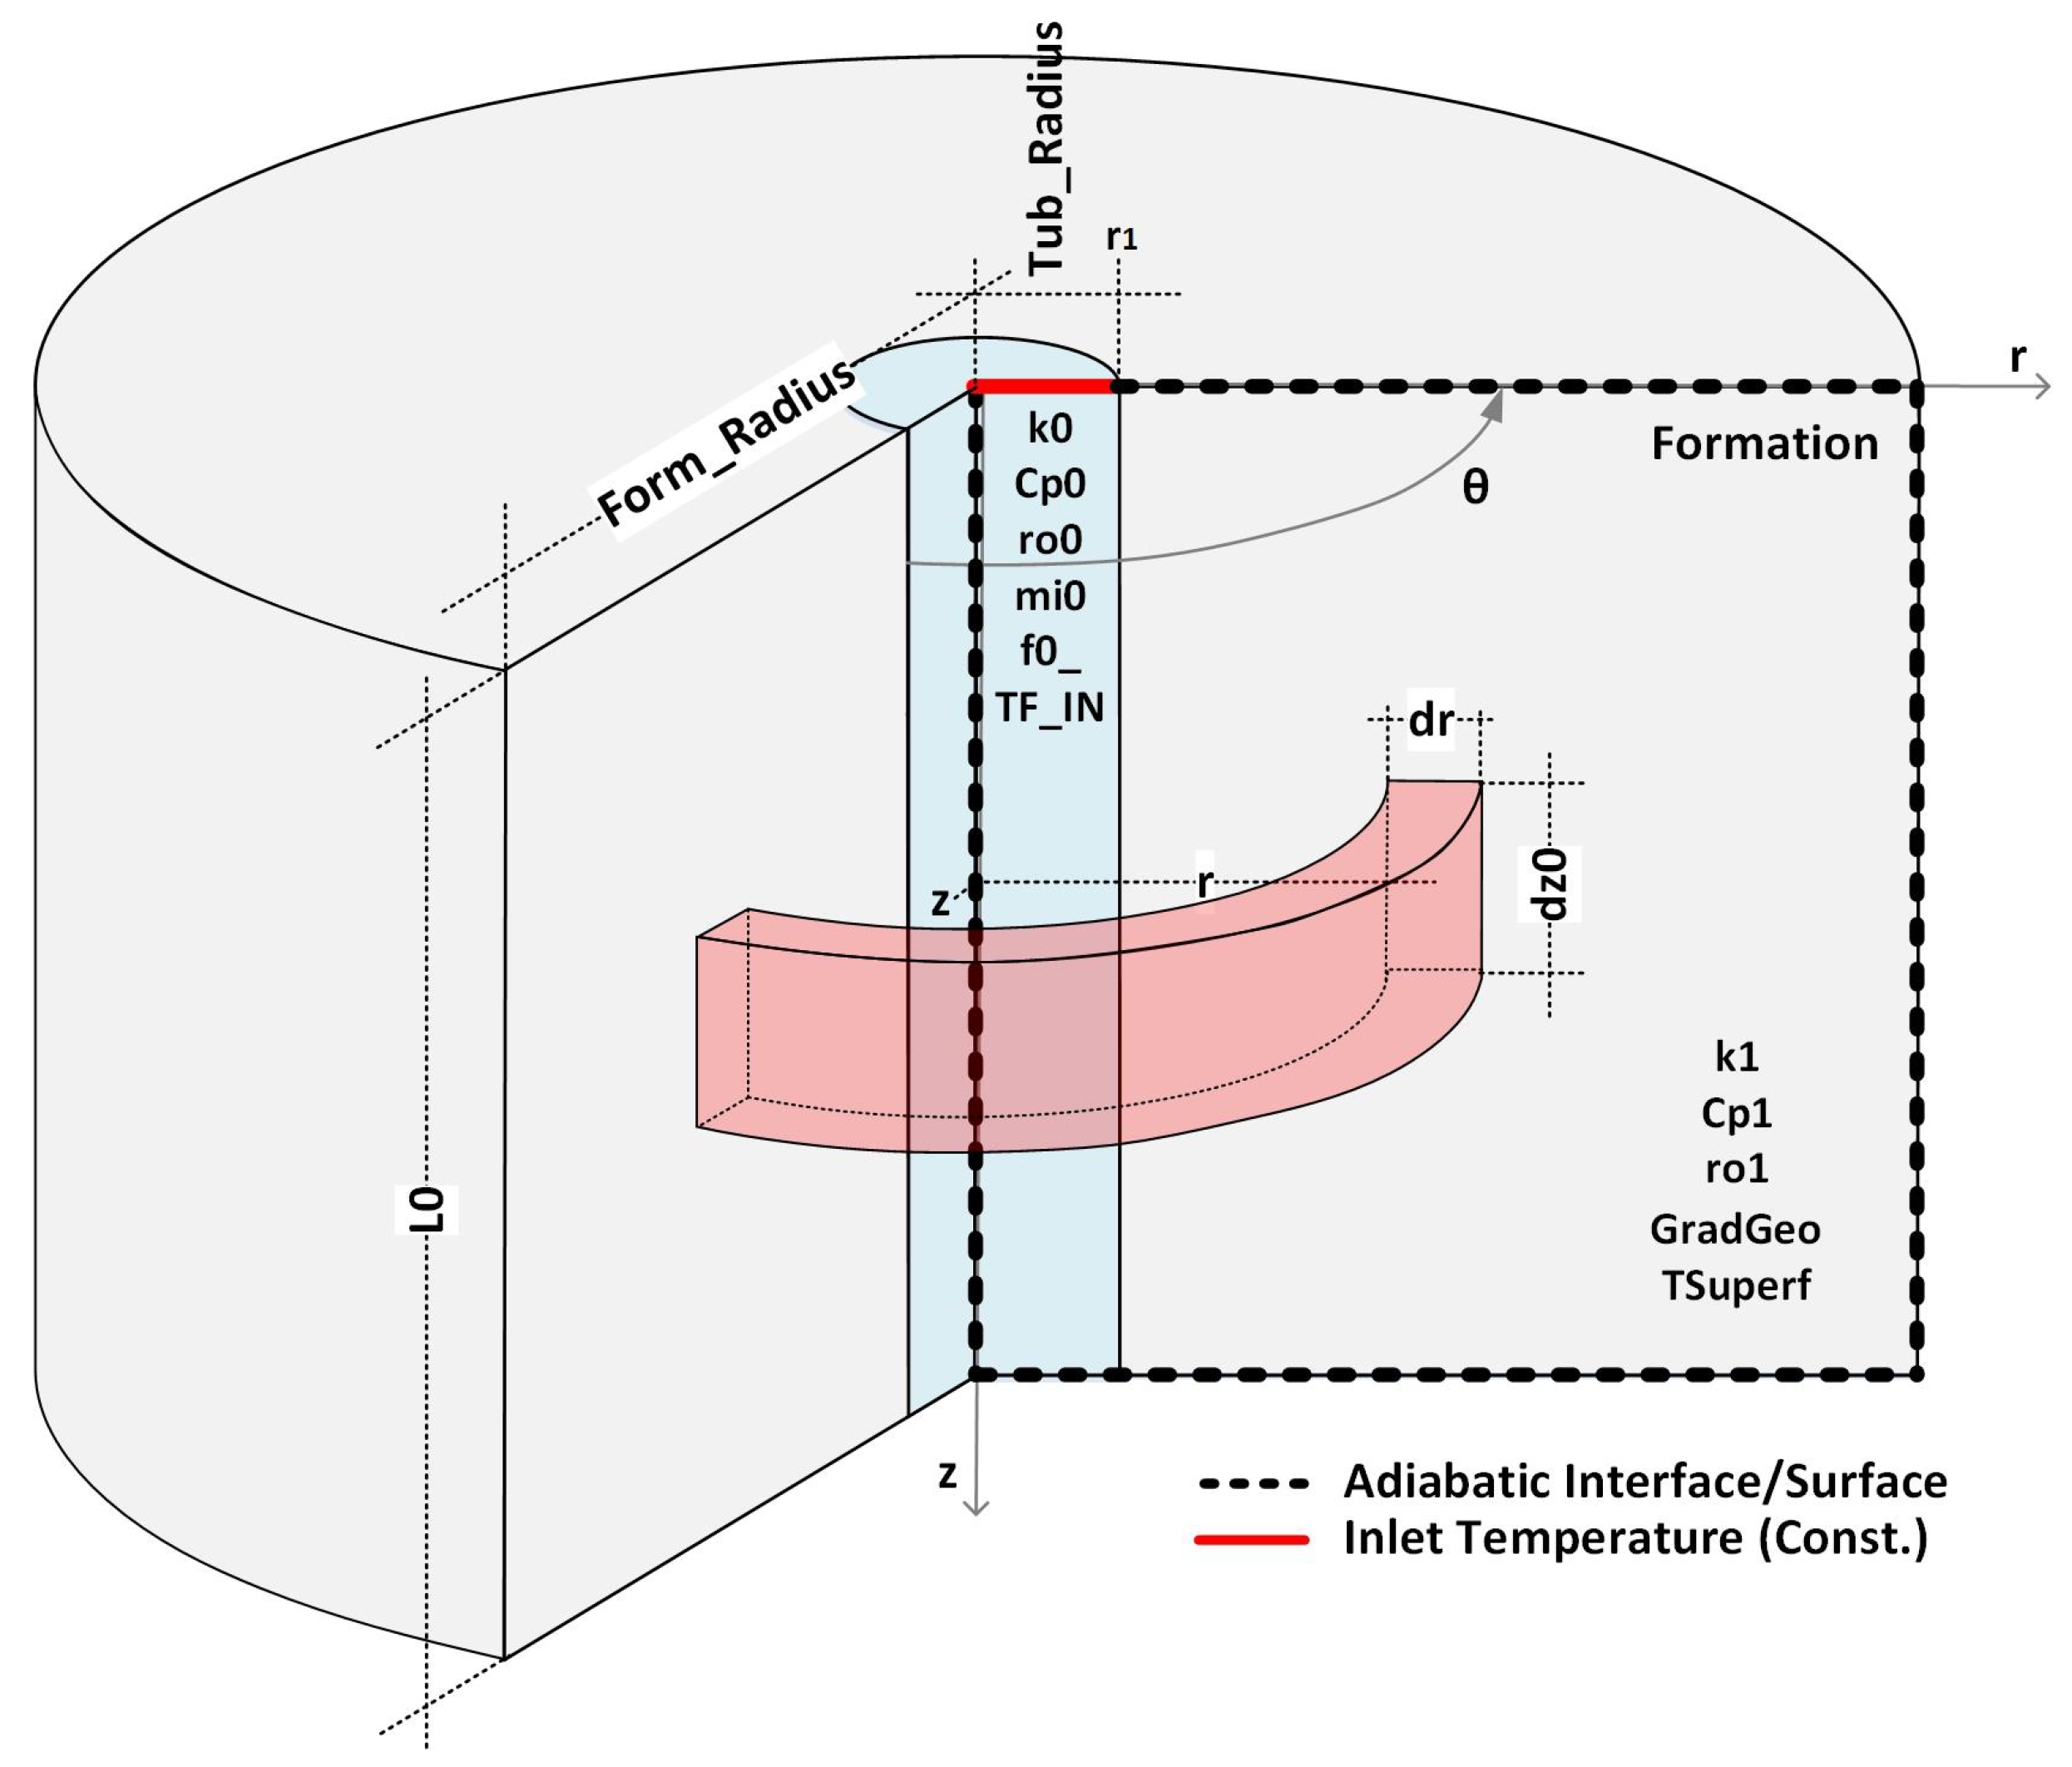
, after the well operation’s start, consider the principle’s energy and mass conservation application in the Control Volume highlighted in
Figure 2. Assume that vertical heat flow can be neglected and that all thermal properties of the well, formation, and fluid, as well as all initial and boundary conditions, are known. Also, assume that the flow rate is constant and the flow pattern is turbulent. Due to this last characteristic, the fluid can be addressed as an agglomerated system, in which the transience of heat transfer in the fluid can be disregarded, given the slowness of transfer mechanisms in your neighborhood. Consider also that the thermal properties are isotropic, homogeneous, and invariant over time and that there is no heat generation due to the fluid viscosity.
As a result, there is [
3,
6]:
where
is the Global Heat Transfer Coefficient, with
as a reference. It encompasses all thermal resistance to heat propagation, from convection on the pipe’s internal surface, at
, through pipe conduction and natural convection in the annulus, to the radial limit of thermal disturbance caused by transporting the fluid at a colder temperature.
The calculation of the flow rate,
, as can be deduced from Equation (
1), depends on knowing the value of
, which in turn, as it results from the thermal disturbance carried out, depends on understanding the convection coefficient on the internal surface of the pipe, which depends on the flow rate you want to measure. In other words, calculating the flow rate will depend on solving the following system of non-linear equations:
where:
is the Prandtl number,
is the Reynolds number,
f is the friction factor,
h is the convection coefficient,
is the global average heat transfer coefficient in the interval [
,
] and
is the desired mass flow rate. The variables
,
c,
k, and
are, respectively, the absolute viscosity, the specific heat capacity, the thermal conductivity, and the specific mass, all properties relative to the fluid in flow.
The equation (
4) corresponds to Petukhov’s first explicit equation for calculating the friction factor in smooth tubes. It is valid for
([
7]).
The equation (
5) corresponds to the Gnielinski equation for calculating the convection coefficient in forced turbulent flow inside pipes. It is valid for
and
[
7].
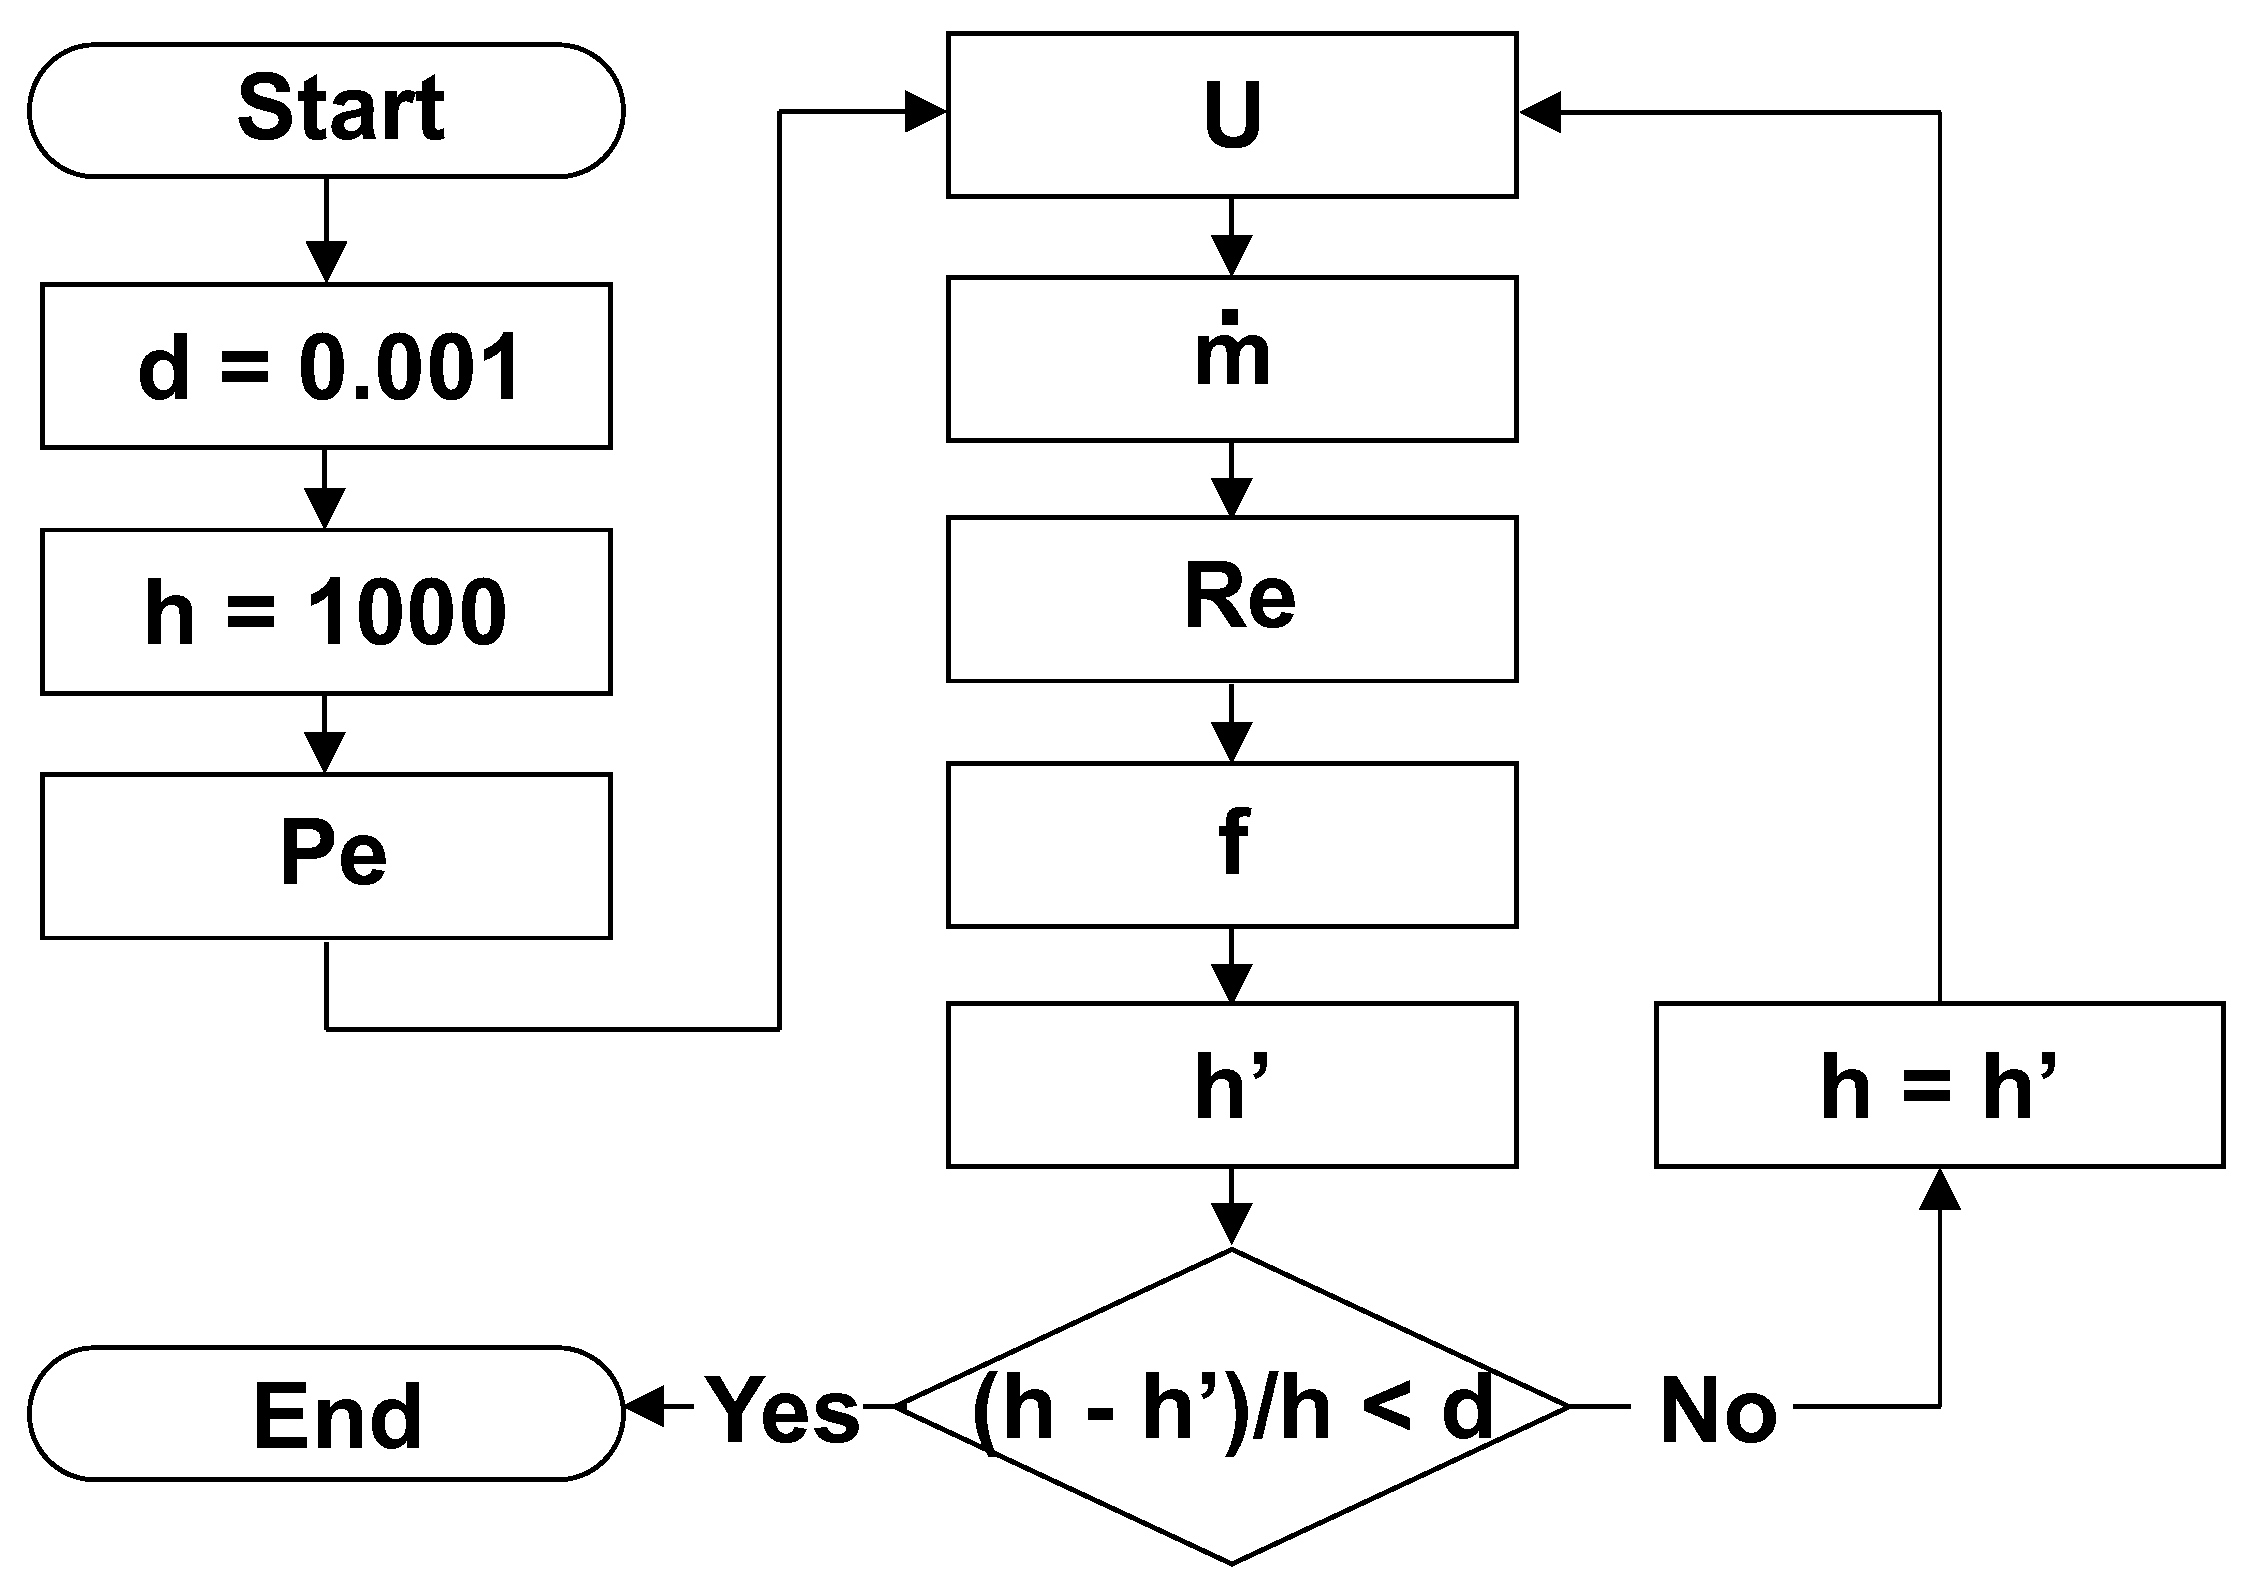
The system resulting from equations (
2) to (
7) can be solved, among other methods in the literature, by executing the algorithm shown in
Figure 3.
The approach chosen for calculating will define its applicability and the intensity of the corresponding systematic error. This article will present two approaches: a) the quasi-static approach, in which it is assumed that the thermal processes are already slow enough to be considered in thermal equilibrium, and b) the purely analytical approach, in which the solution is sought by solving the differential heat transfer equations.
3. Quasi-Static Approach
Given the small radius of the completion compared to the formation and the long operating times of the injector and producer wells, the quasi-static solutions disregard all thermal transience in the fluid and the completion (tubing, annulus, casing, and cementing). As a result, still taking
Figure 2 as a reference, the Global Heat Transfer Coefficient and the Mass Flow will be given by:
where
is the Transient Function for heat propagation in the formation up to the thermal perturbation limit [
4]. This function encompasses the entire time dependence of heat propagation in the formation. It is the primary variable to be determined in this methodology. It is defined by:
In Equation (
10),
is the temperature at the interface with the formation,
is the geothermal temperature at depth
z and
is the heat rate transferred to the formation by the depth element
[
4].
In 1962, Ramey proposed the following approximation for times longer than a week [
4]:
with
being the thermal diffusivity of the formation and
t being the time measured in days.
In 1967, Mattews & Russell, assuming that the fluid inside the pipe could be considered a linear geometric heat source (
line source), given the small radius of the pipe compared to the radius of the formation, came up with the following approximation for the transient function [
9]:
with
corresponding to the dimensionless Fourier time for formation, i.e:
In 1994, Hasan & Kabir proposed the following approximation for the transient function referring to the condition of constant heat flow at the interface with the formation, in
[
8]:
In 2004, Hagoort proposed an approximate function for the constant temperature boundary condition at the internal interface of the formation. This is [
10]:
In general, the transient functions for boundary conditions of the type “constant temperature at
”, “constant flow at
” and “fluid with constant temperature and radiation boundary condition at
” are given, respectively, by:
where
and
are the Bessel functions of the second kind and order 0 and 1, respectively, and
is the Biot number for the formation [
7], i.e:
with
being the Global Heat Transfer Coefficient up to the interface with the formation, given by:
The derivation of the listed equations, i.e., the solution of the system of differential equations for the mentioned boundary conditions, can be found in the work of [
6].
4. Analitical Approach
Wu & Pruess in 1990 [
3], Assmann [
5] in 1993, and Haggort in 2004 [
10] presented analytical solutions for calculating the temperature of the fluid inside the pipe. Using the concept of the global heat transfer coefficient to synthesize the thermal resistances up to the formation, they all disregarded the transience in completion. In addition, the work by Wu & Pruess presented data on the relationship between vertical and radial gradients, justifying the assumption of zero vertical heat flow.
Although the results obtained by Wu & Pruess, Assmann, and Hagoort, among others, show good results after the well has been in operation for some time, disregarding the transience of heat transfer in the completion, as well as the variation in the internal energy of the fluid (second part of Equation (
7), makes it impossible to obtain better results for times around the transit time of the fluid in the pipe, which corresponds to the time required for the fluid to travel all the way through the pipe to the depth under analysis.
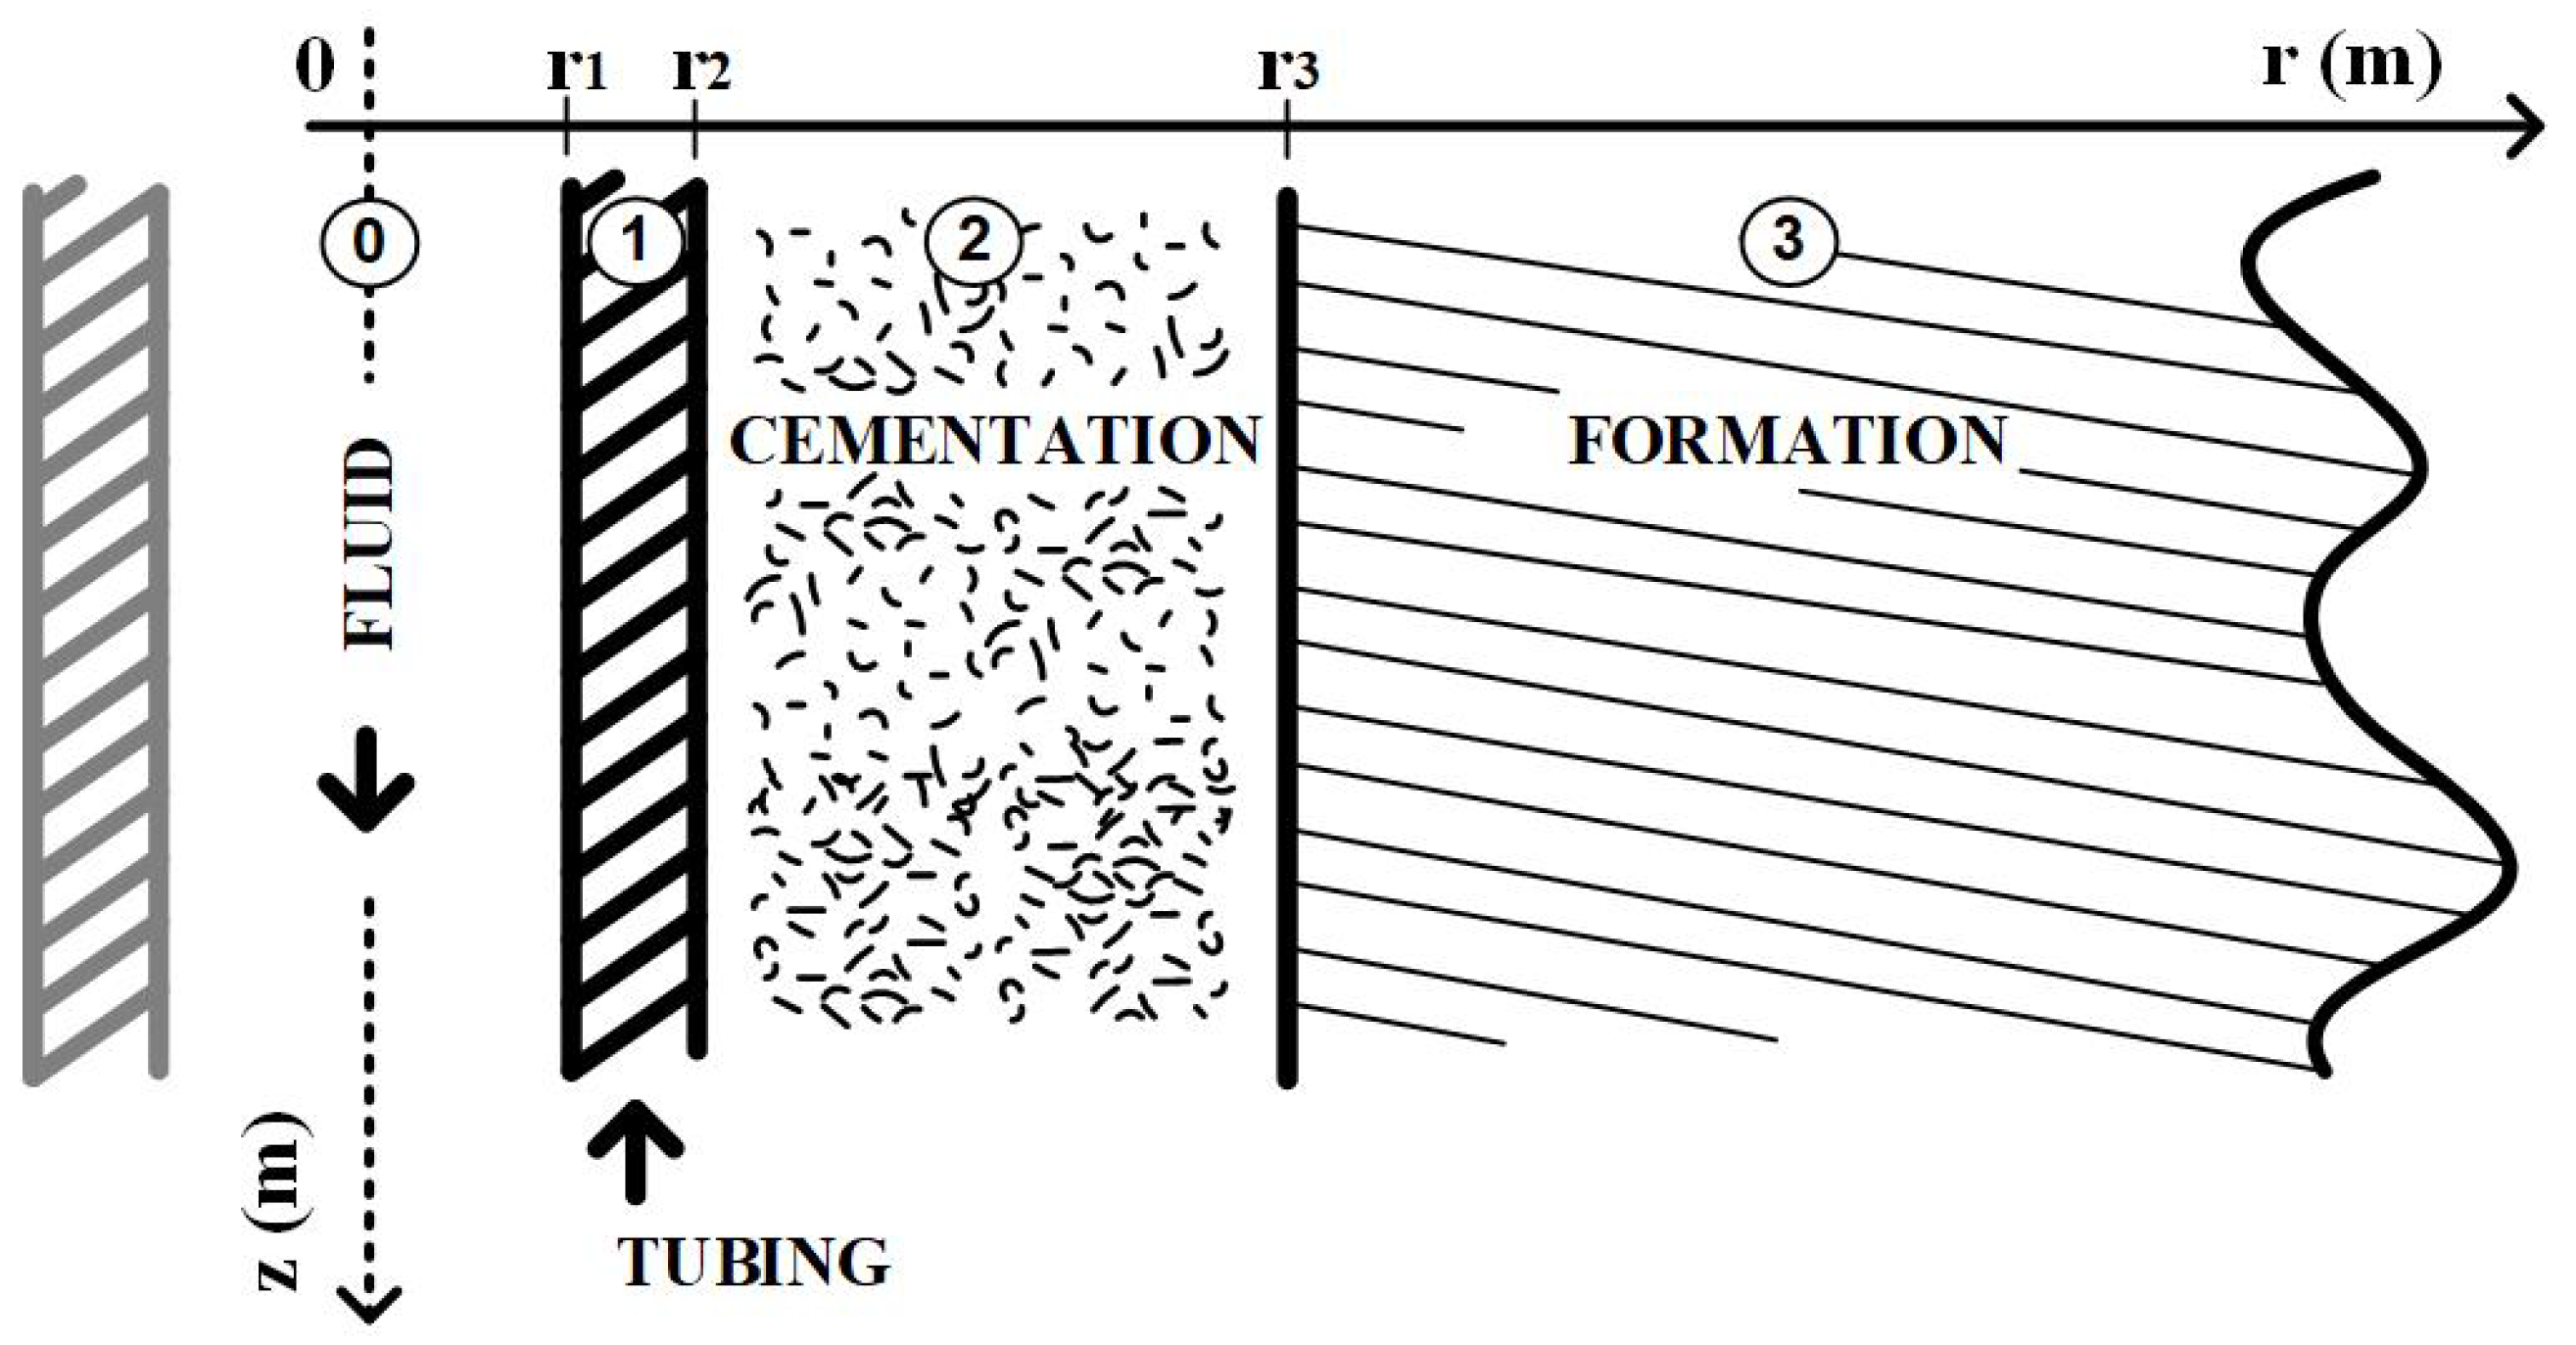
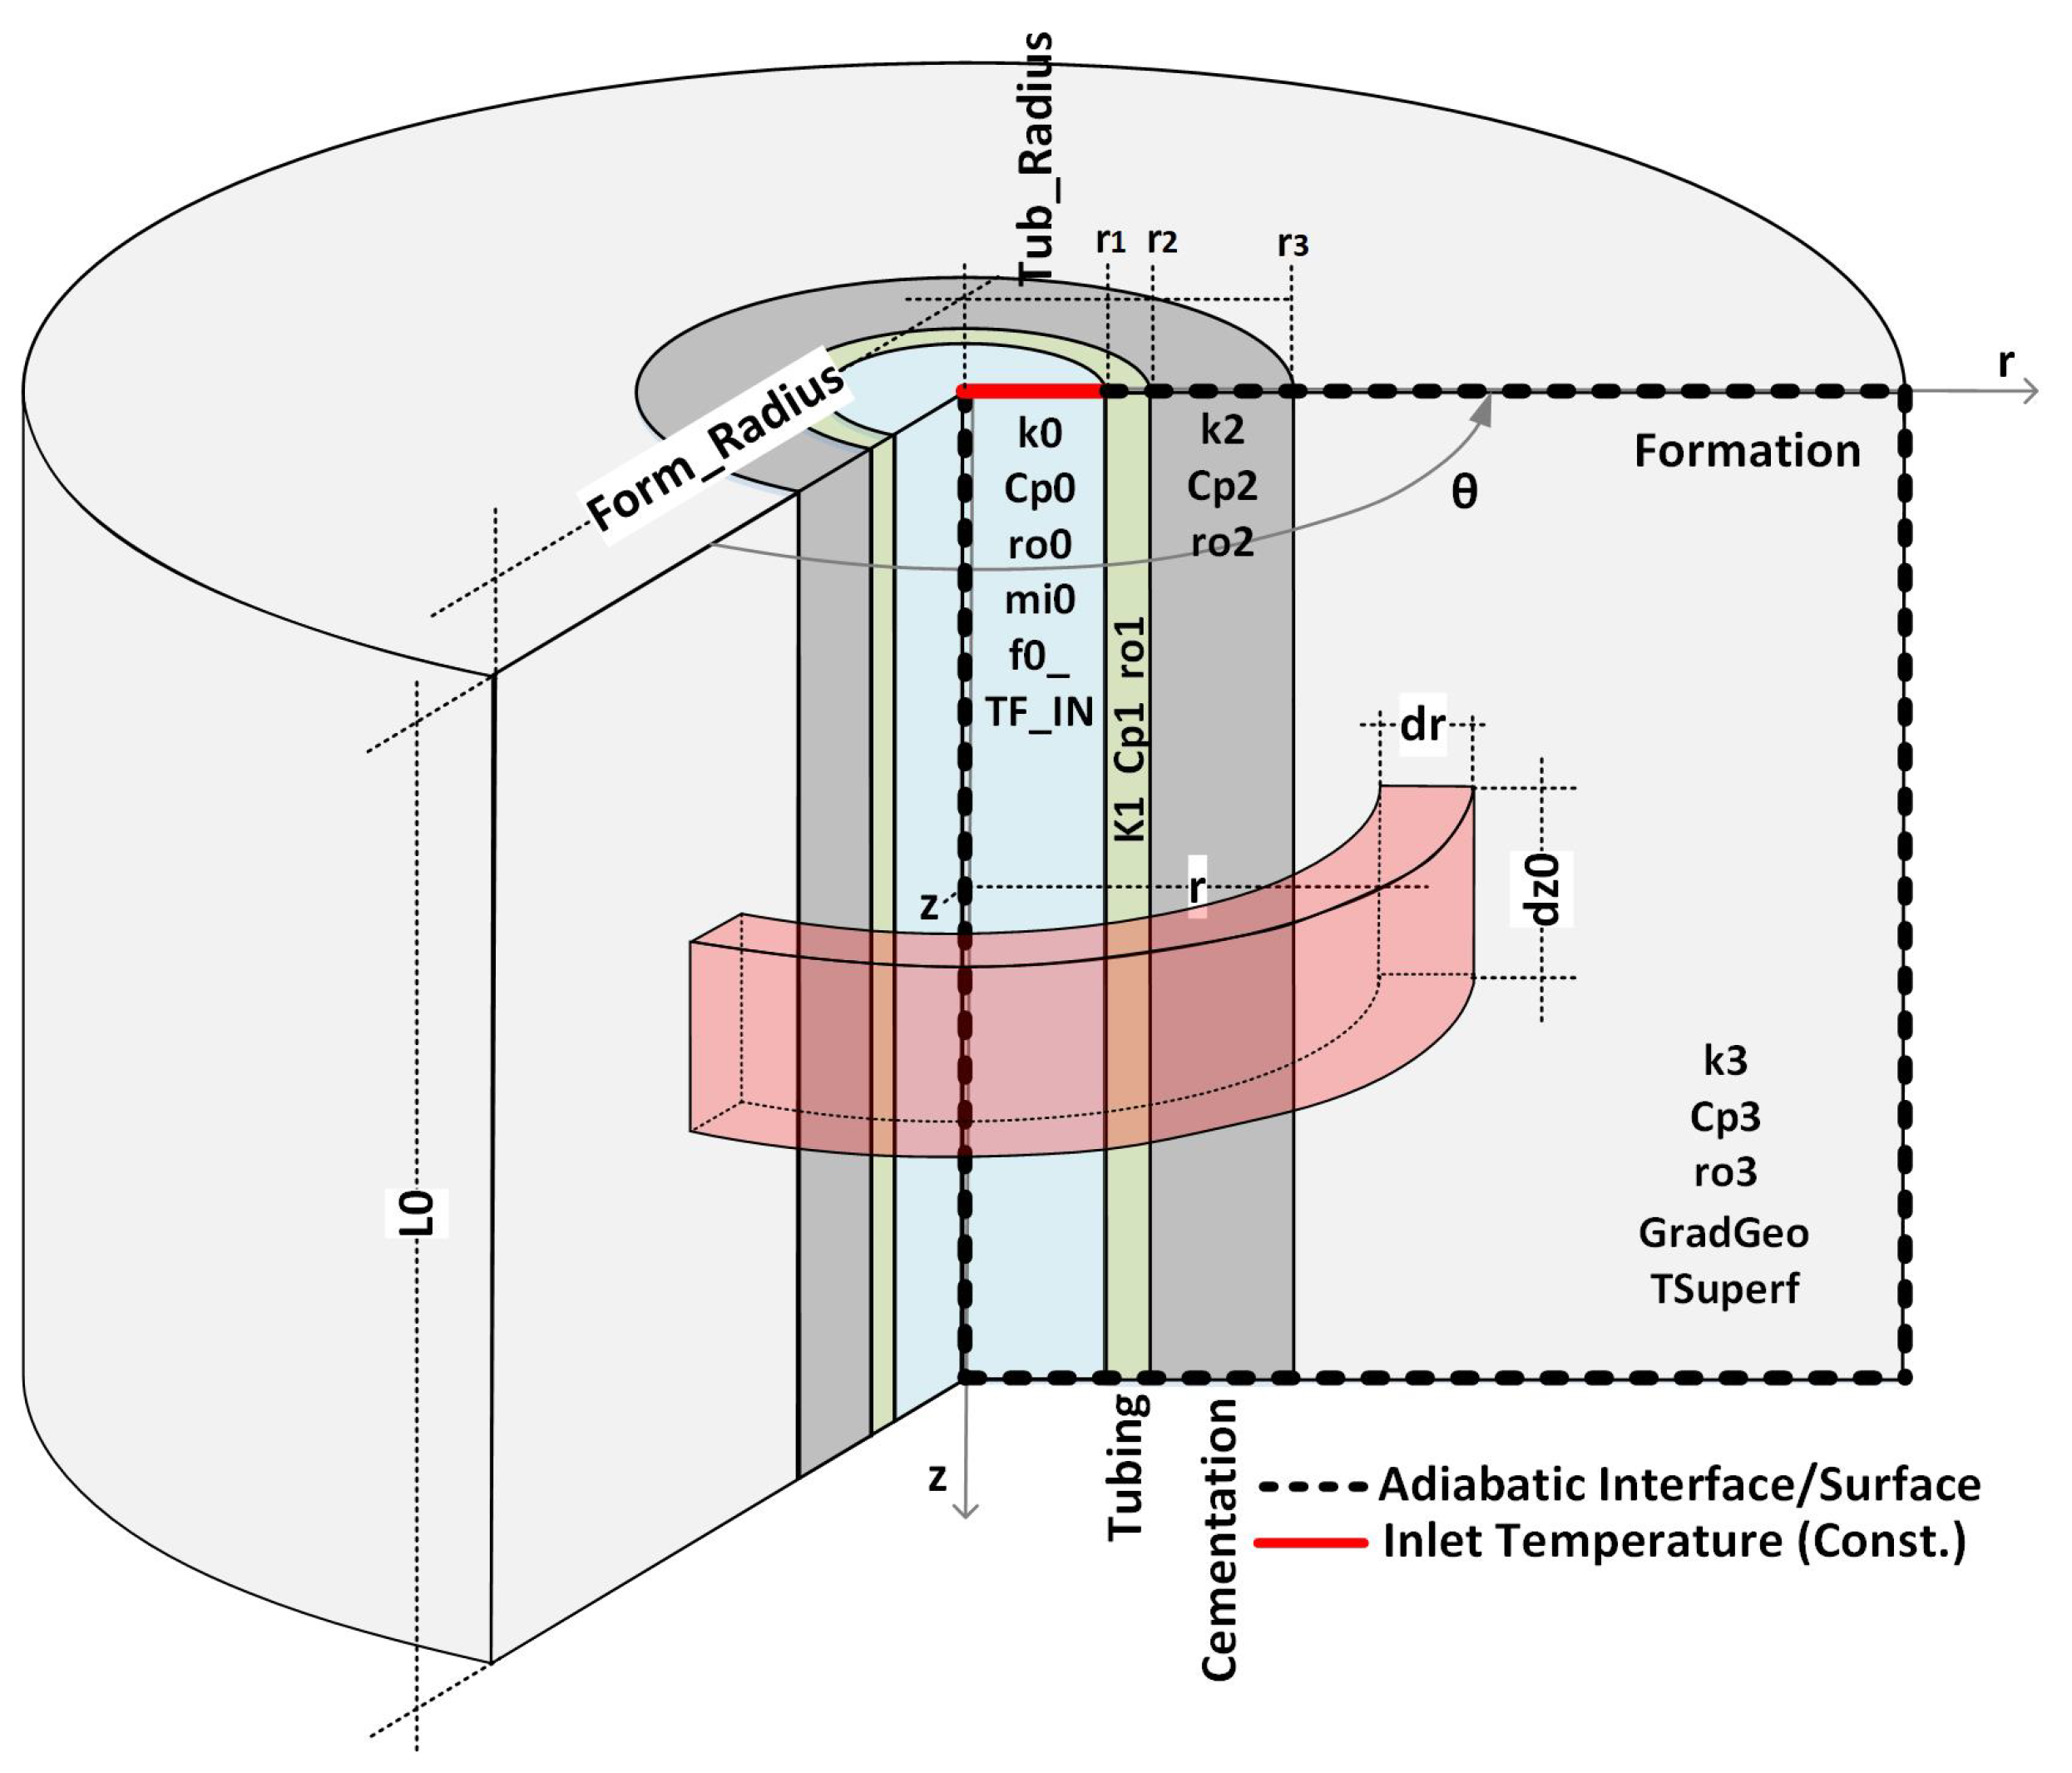
Consider the simplified completion shown in
Figure 4, where the annulus has been ignored to illustrate the methodology. The layers of the well have been numbered to facilitate the naming of properties and variables.
As we have seen so far, calculating the flow rate depends on knowing the value of the overall heat transfer coefficient, which in turn depends on the convection coefficient, the fluid temperature, the geothermal temperature, and the temperature of the internal pipe interface. Consider the following dimensionless temperatures for the fluid and the internal pipe interface:
Since the heat flow by convection at the internal interface of the pipe must be equal to the heat flow at the same interface due to the use of the global heat coefficient, we have:
and, consequently:
Considering that the vertical thermal gradient, and consequently the heat flow in the same direction, is only significant when compared to the intensity of the radial flow at the thermal disturbance front, which occurs during the fluid’s transit time in the pipe, it will be disregarded in this analysis [
3]. Thus, excluding the vertical heat flow, assuming that the flow regime inside the pipe is turbulent and applying the principles of conservation of energy and mass, we arrive at the system of partial differential equations described in
Table 1 [
6].
The deduction of the equations and the solution of the resulting system can be found in Appendix A of the work by Lima [
6]. The estimates for the temperature of the fluid and the temperature of the internal surface of the pipe are given by:
and
where:
such that:
The function
is used to simplify the notation. The functions
and
are known in the literature as modified Bessel functions of the first and second kind, respectively, both of zero order. The variables
and
are functions in the Laplace domain, independent of the radial coordinate,
r, and related to the
mean 1 of the completion under study, taken as a reference in the process of dimensioning the variables. Their values are given by the system of linear functions in the Laplace domain, which is a consequence of the boundary conditions of the problem. See [
6] for more information.
In equations (
28) and (
29),
is the dimensionless time,
w is the dimensionless vertical coordinate,
is the dimensionless temperature of the fluid at
,
is the geothermal gradient related to the dimensionless coordinate
w and
is the linear coefficient of the dimensionless geothermal temperature. The values of
,
w,
and
are given, respectively, by:
The dimensionless variables represented by the Equations (
24), (
25), (
33) and (
34) are consequences of the algebraic manipulations that attempt to reduce the mathematical complexity of the system of partial differential equations. Among them, the dimensionless time variable (
) is known in the literature as dimensionless Fourier time.
Thus, in addition to equation (
27), the global heat coefficient can be rewritten as:
The inverse Laplace transforms of Equation (
37) can be calculated numerically using the Gaver-Stehfest algorithm [
11], which was adopted in this article, or other methods available in the literature.
As seen, it is possible to use a standard script for both approaches by continuing to use the global heat transfer coefficient as the basis for calculating the flow rate. However, unlike the previous quasi-static approach, the calculation of the global coefficient given by Equation (
37) also takes into account the thermal transience in the layers of the well.
5. Computer Simulation
Given the very specific operating conditions, with data collection and storage in the first moments of injection, in a reservoir with original initial conditions, the possibility of the existence of real, unmotivated data, from the operation of a well in production under the conditions listed has proved to be nil up to the date of completion of this article, making it considerably difficult to evaluate the proposed analytical solution.
As a countermeasure to the lack of data for validation, a computerized well simulator was designed and developed to generate the temporal evolution of the thermal profile of the injection fluid along the pipe.
Due to its widespread use in the scientific community, the finite difference method was used as a numerical tool in the simulator code development. In this method, the central idea is to replace the differential equations with algebraic equations, exchanging the derivatives for difference approximations and applying the resulting equations to each subdivision of the problem’s physical space, referred to in this article as the Control Volume (CV). The result is an algebraic equation for each subdivision, making up a system of linear equations [
7].
The code was developed in Phyton, using the Jupyter Notebook editor, version
, from Anaconda Navigator, version
See the code at [
6].
6. Results
Two computer simulations were carried out to evaluate the proposed method. The first simulation aimed to verify the alignment of the proposed solution with the classical quasi-static solutions proposed by Ramey and his successors. To this end, a schematic of a well without completion was adopted, aligning it with the reference model used to calculate the transient functions. The second simulation aimed to verify the proposed analytical solution in a well with simplified completion (with tubing and cementing) and compare its performance with quasi-static solutions.
6.1. Simulation 1: Well without Completion
In this first analysis, the data generated in the simulation of a well without completion is processed, as shown in
Figure 5. This configuration is a good representation of the prototype well installed at UFRN. Although the prototype has a tubing, its high thermal conductivity means that its presence does not make a noticeable difference in the fluid temperature evolution, as will be seen below.
The well shown in
Figure 5 cannot be used as a real-world model. However, by processing the fluid temperature evolution for this configuration, it is possible to evaluate the contribution of the transient functions to the flow measurement, since these functions were derived from a similar schematic of the well. Furthermore, considering that water injection wells operate for months, sometimes years, heat conduction in the formation is the dominant thermal process in flow measurement. Under these conditions, after the first two weeks of operation, any thermal transient in the completion that could influence the flow inference becomes insignificant [
4]. In this way, a simulation without completion provides indications and trends for the behavior of the flow to be measured.
6.2. Simulation 1: Simulation Data
Table 2 shows the variables and values used in the simulation of the well shown in
Figure 5. The other variables used in the simulation are functions of the values shown in the table.
6.3. Simulation 1: General Results
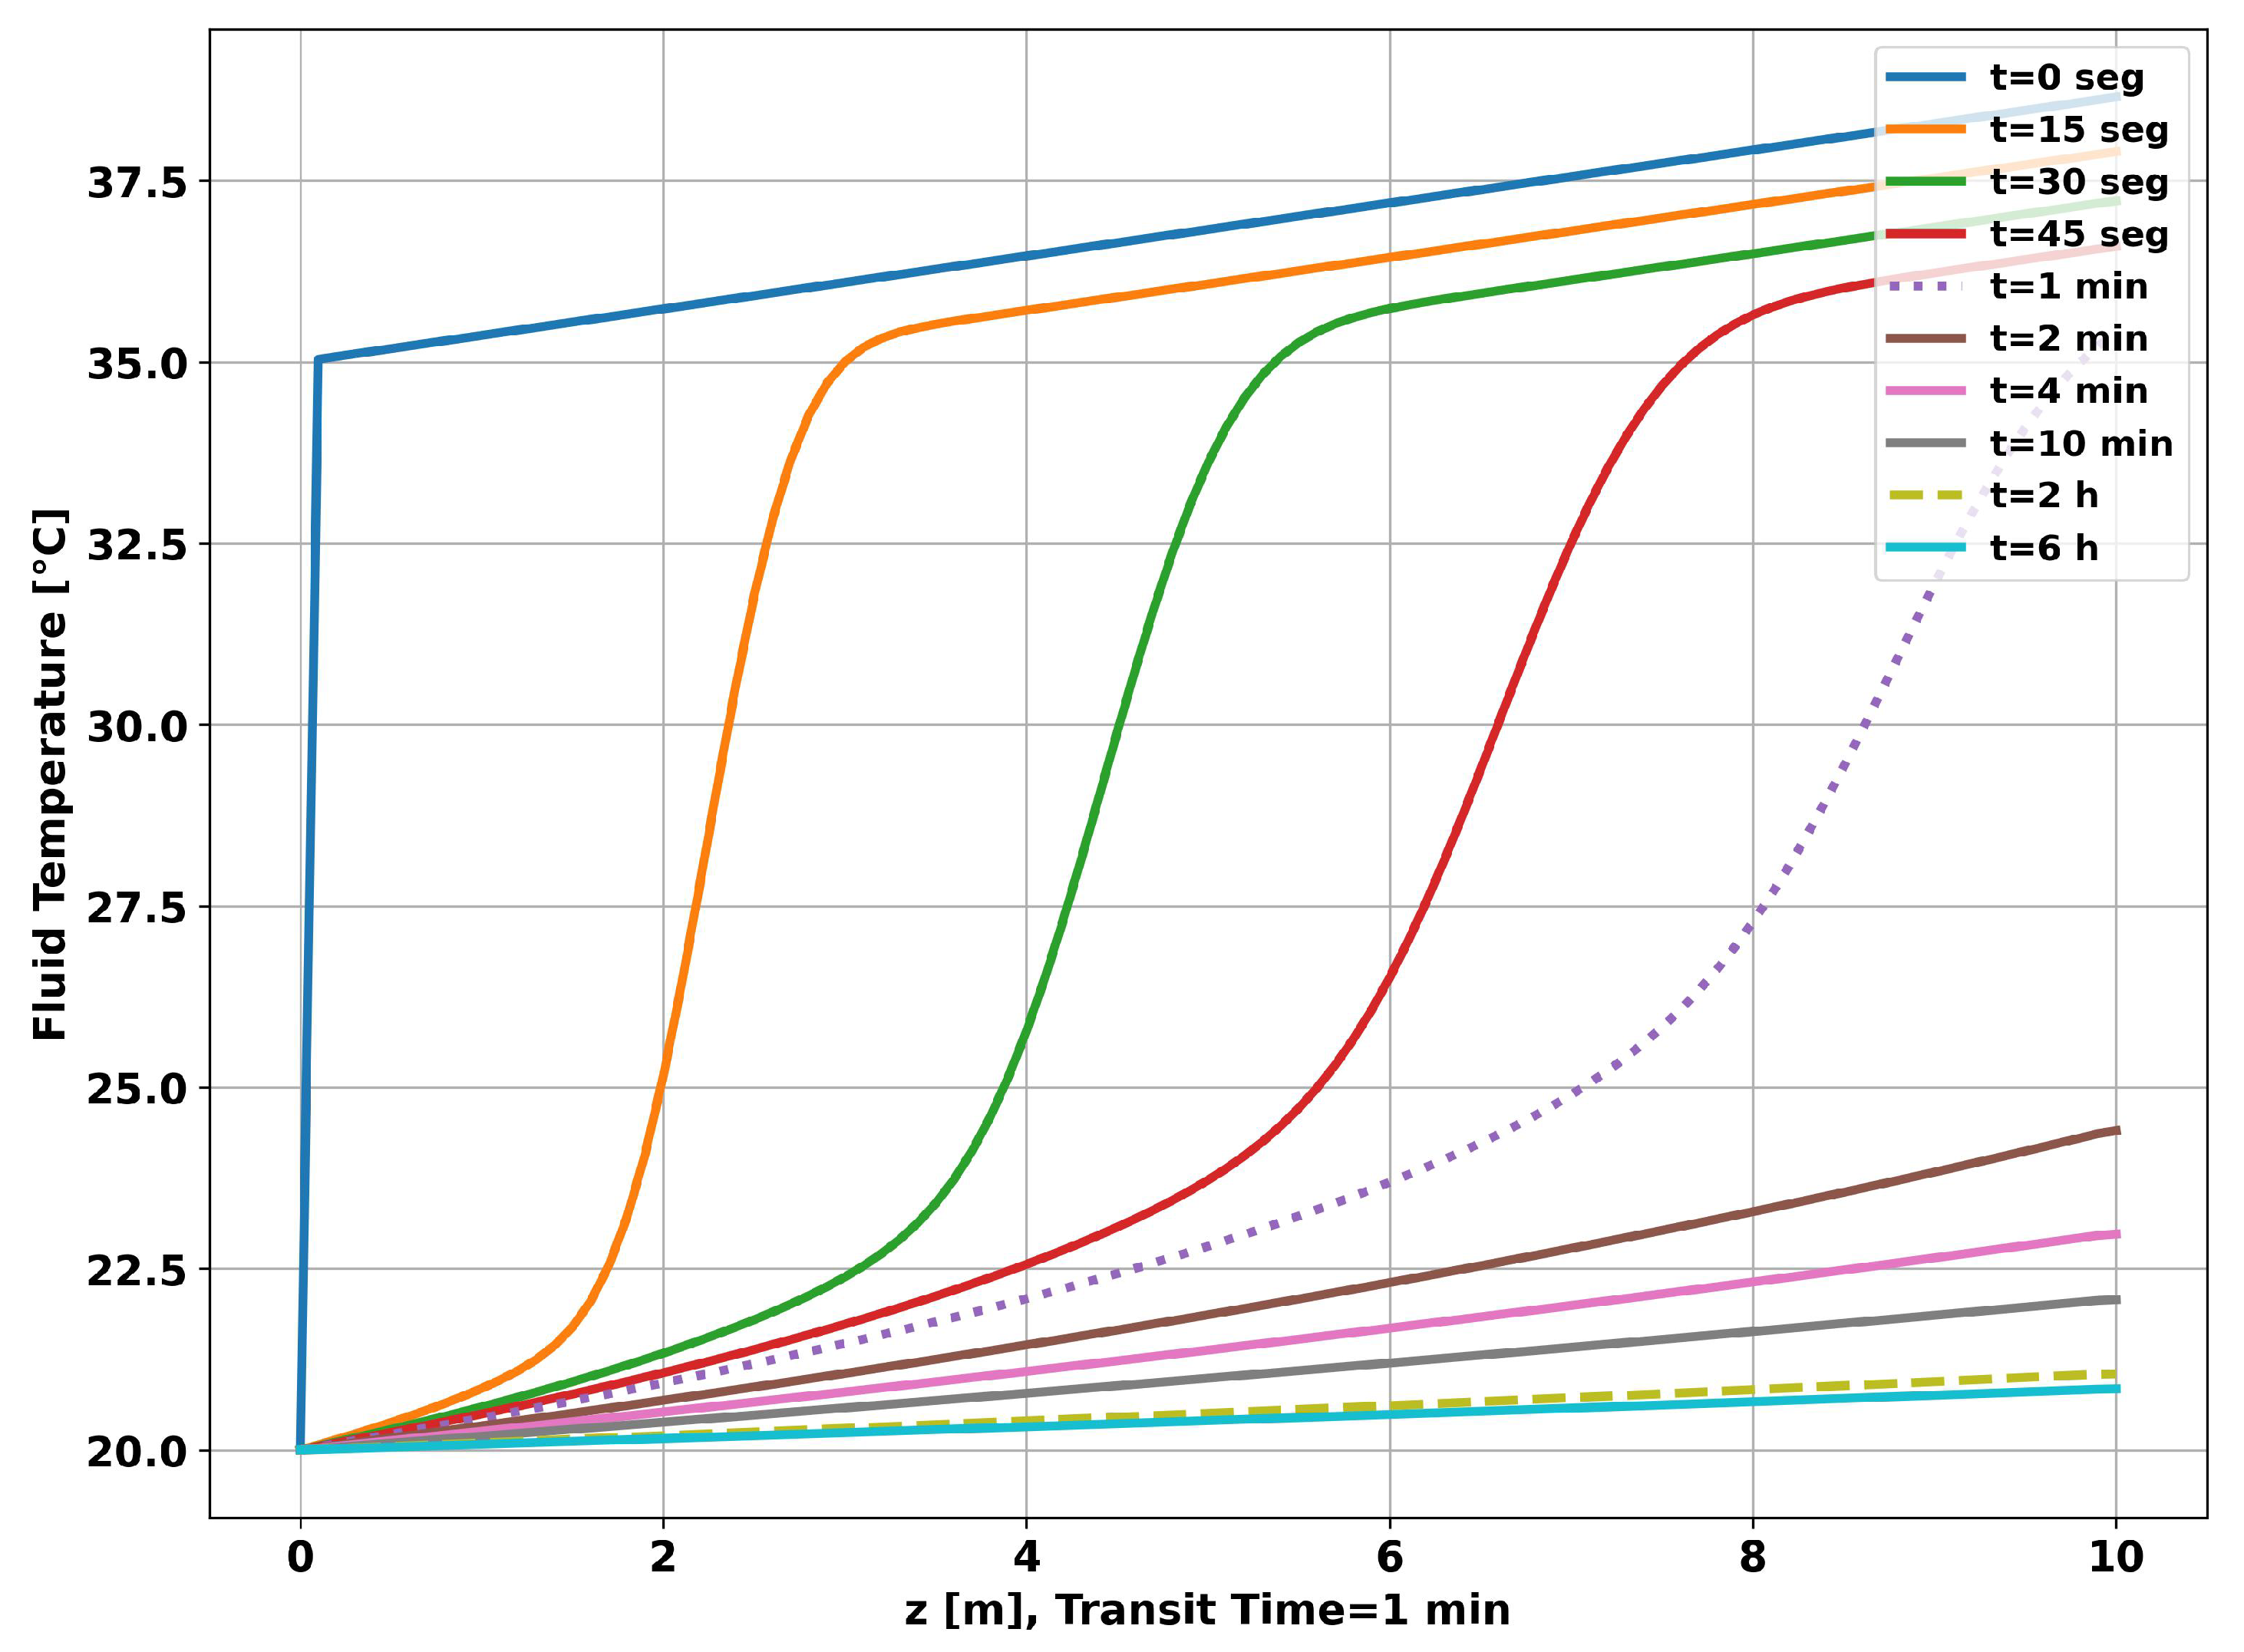
Figure 6, on page 12, shows the time evolution of the fluid temperature along the pipe. It can be seen that the dynamic change in the curve slows down as the operating time increases. In particular, the curve for 2 hours differs little from the curve for 6 hours.
Figure 7, on page 13, shows the time evolution of the radial temperature at a depth of 5 meters. As can be seen in the graph, after 6 hours, the thermal disturbance was approximately restricted to a distance of 50 centimeters from the center of the pipe, validating the external radius of the reservoir used in the simulation (1 meter). Given the simulation time considered (6 hours), using a small value for the outer radius of the reservoir (Reserv_Radius) would result in overheating/undercooling of the well, saturating the simulation and making the data generated unrepresentative of a real situation.
Therefore, for the prototype installed at UFRN, which has an outer radius of approximately 30 centimeters, we recommend adopting 2 hours as the maximum operating time. After this time, the prototype will overheat, and the data generated will no longer be valid.
6.4. Simulation 1: Inferred Flow
The graph in
Figure 8, on page 14, shows the evolution of the flow measurement for the methods and functions presented in this work. As can be seen, all the methods tend to converge to the reference flow used in the simulation (
). However, the methods derived from the constant temperature assumption show better results, i.e., constant temperature at
(curve
Constant Temp), constant fluid temperature with radiation condition at
(curve
Radiation Condition) and the Hagoort approximations (curve
Hagoort). This greater accuracy of the constant temperature methods is a consequence of the short transit time of the fluid in the pipe, equal to 1 minute, which means that the fluid temperature at the point of measurement has a small time variation compared to the time variation of the heat flow.
The graph in
Figure 9, on page 14, shows the evolution of the flow measurement error. As expected, the choice of transient function will result in a greater or lesser intensity systematic error. Applying the proposed analytical solution results in a significantly lower systematic error for the entire simulated operating time.
6.5. Simulation 2: Well with Simplified Completion
This second simulation aims to verify the impact of transient heat transfer in the well completion on the inference of flow rate using the methods and formulations outlined in this article. To achieve this, consider the well completion represented in
Figure 10. This completion technique, which involves only tubing and cementation, is widely utilized in real injector and producer wells.
As in the previous simulation, adiabatic boundaries were used at the edges of the simulated well, making it easy to detect saturation. A constant temperature condition was also used at the inlet of the injection column (tubing).
6.6. Simulation 2: Simulation Data
Table 3 shows the variables and values used in this topic. Following the same approach as the previous simulation, the other variables used are functions of the values presented.
6.7. Simulation 2: General Results
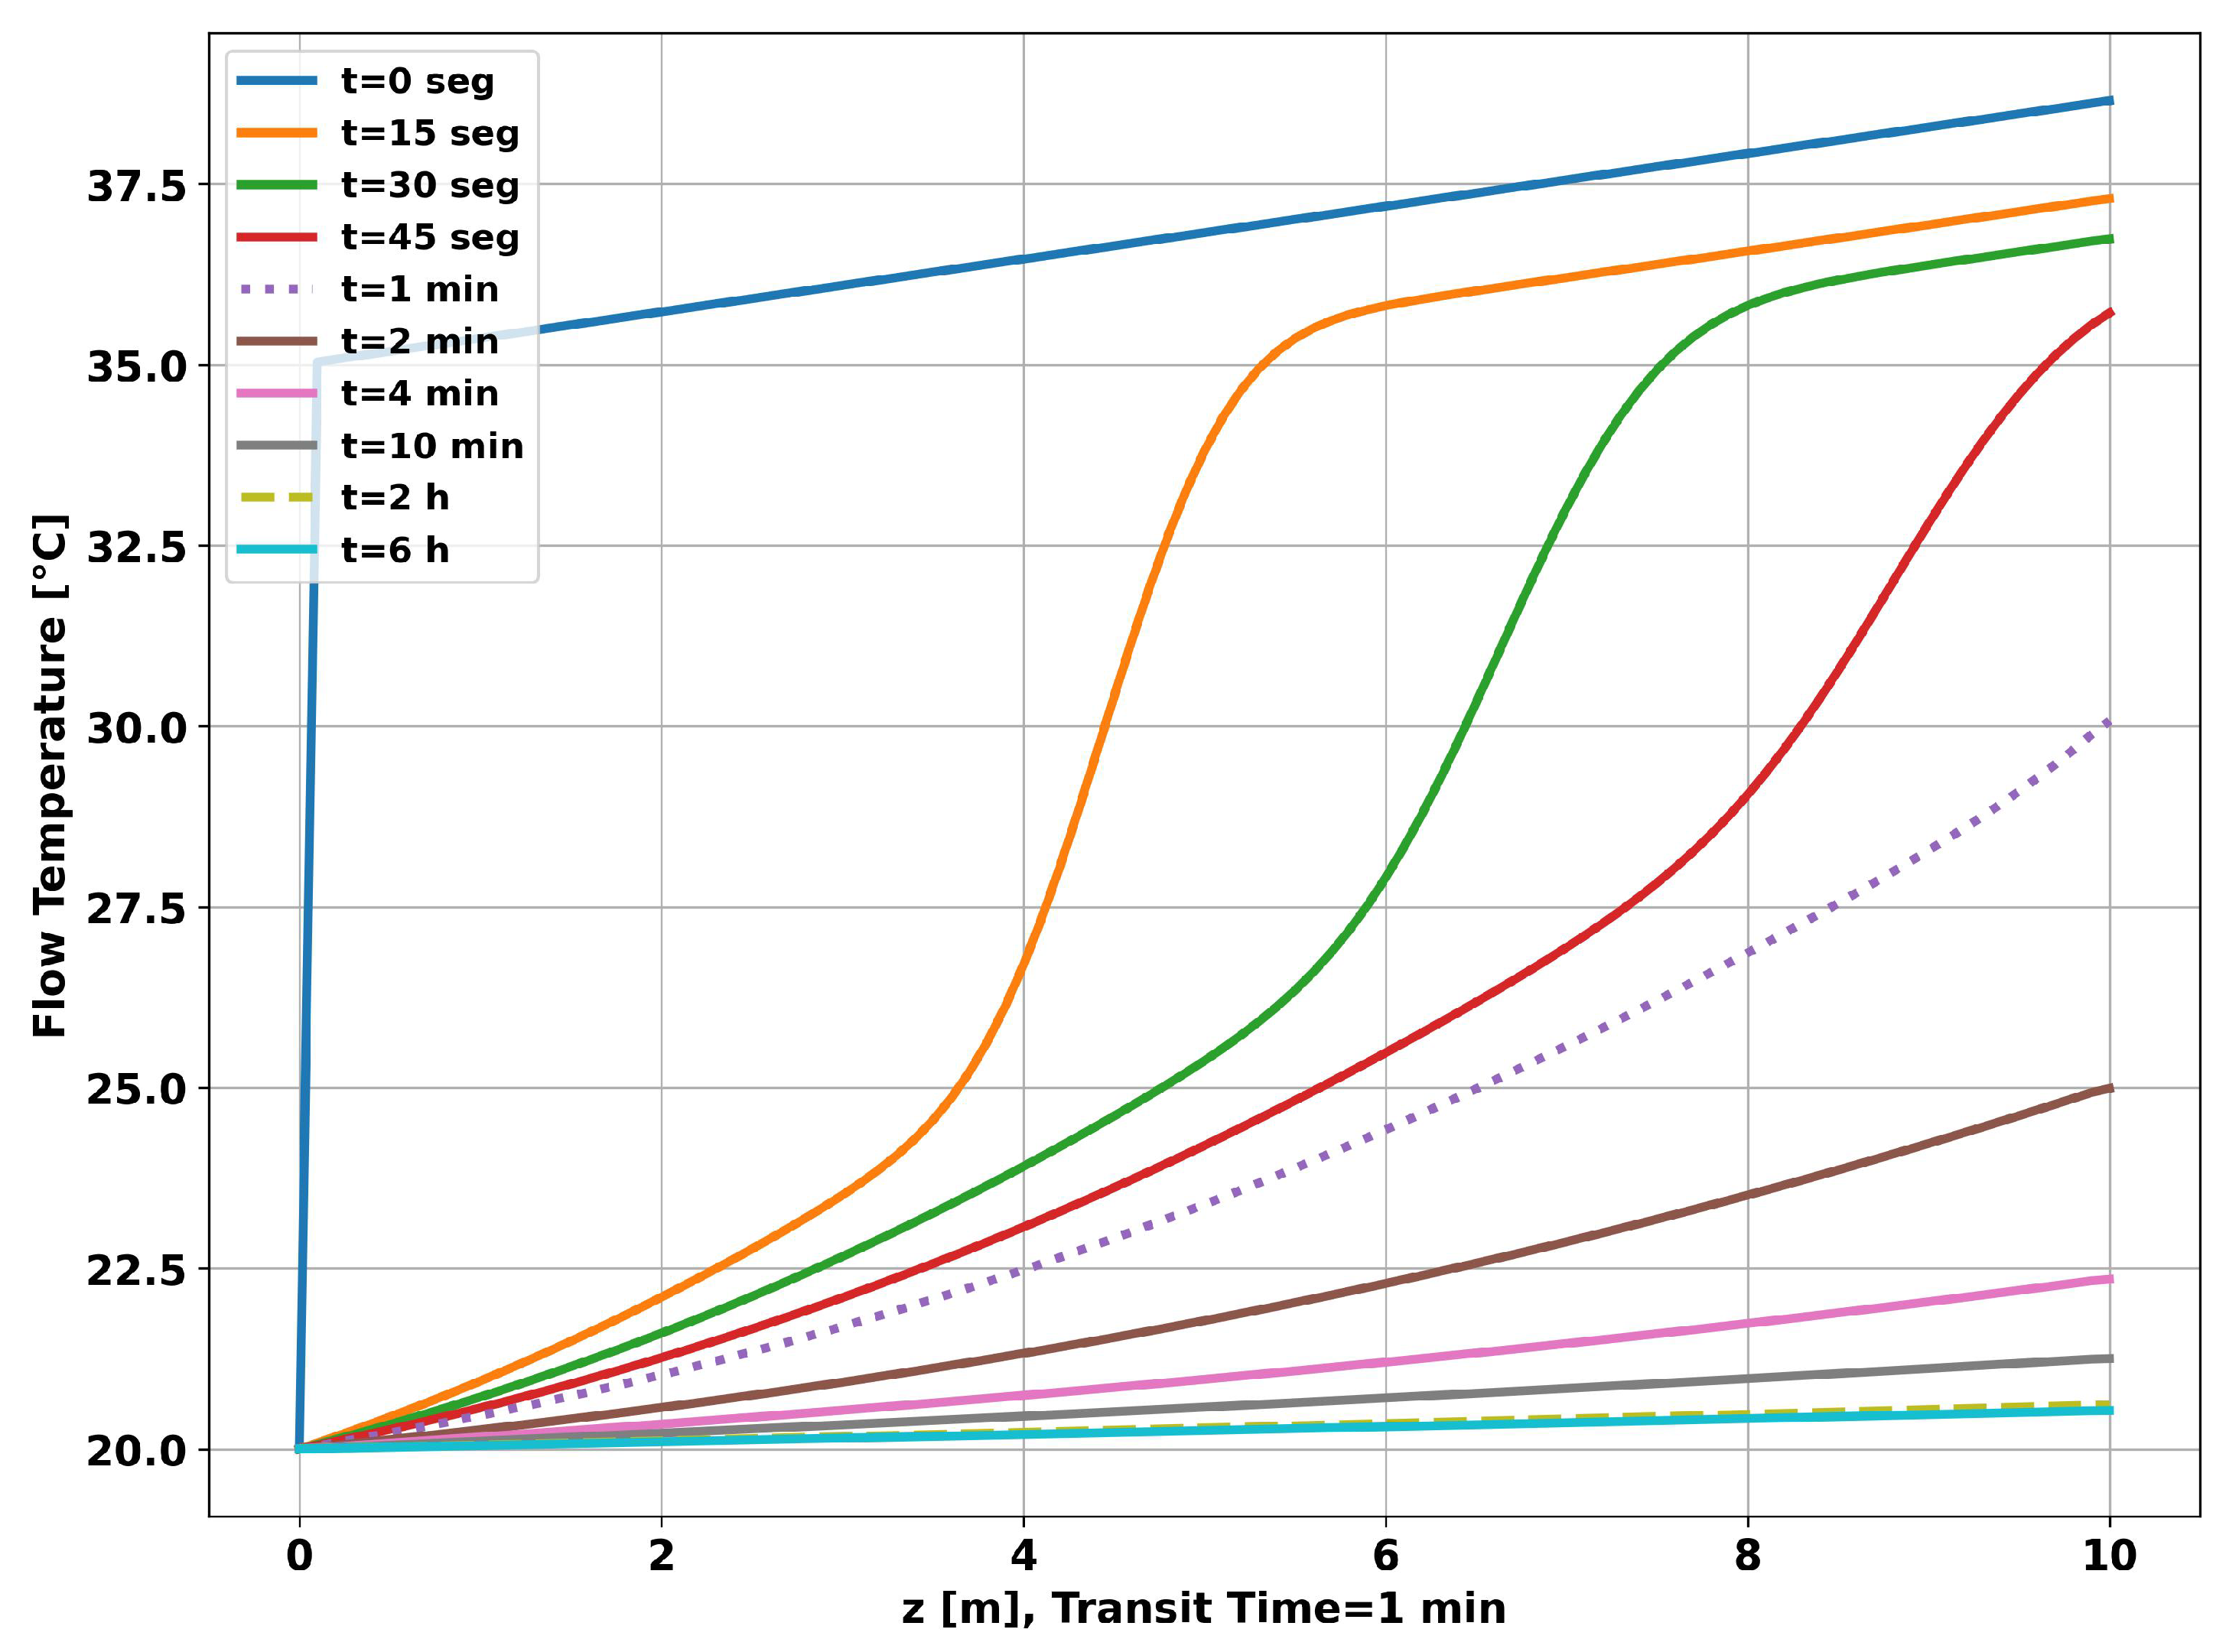
The graph in
Figure 11, on page 17, shows the time evolution of the fluid temperature along the pipe. As in the previous simulation, it can be seen that the dynamics of the change in the curve lose speed as time progresses, but with less intensity, resulting in higher temperatures at the end of each measurement time. As observed in the previous simulation, the fluid temperature curve for 2 hours of operation differs little from the curve for 6 hours.
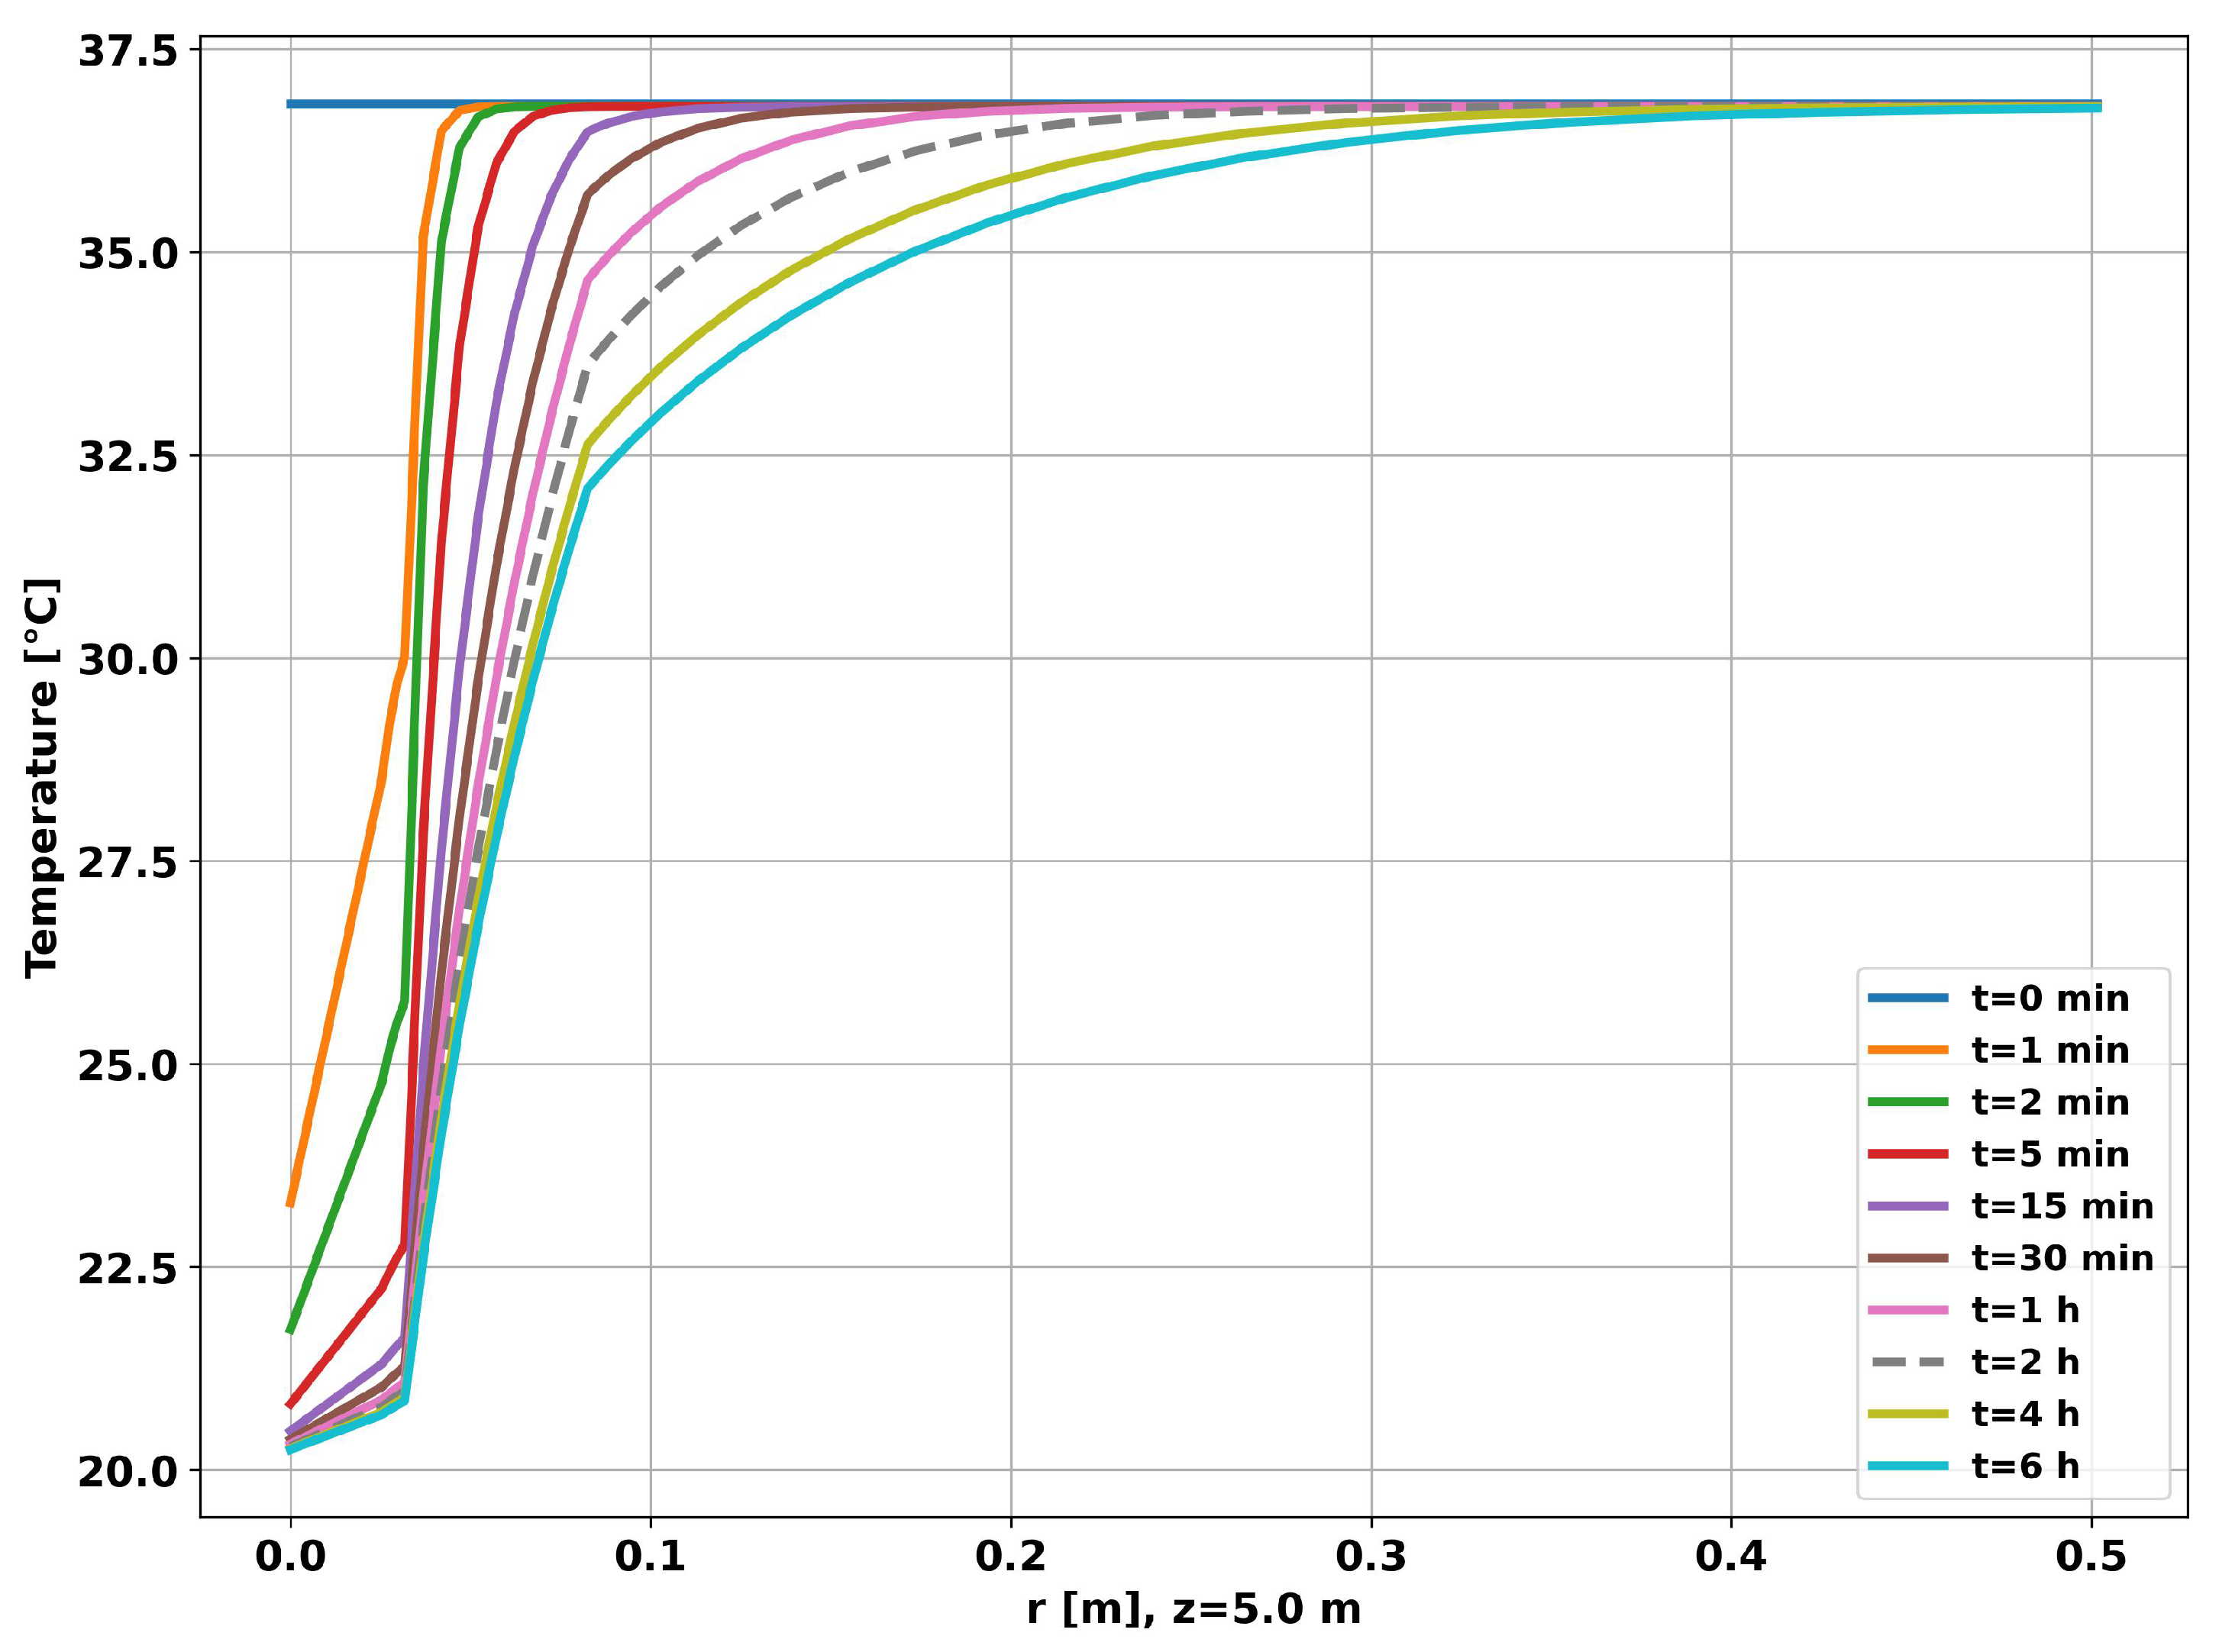
The graph in
Figure 12, also on page 17, shows the time evolution of the radial temperature at a depth of 5 meters, half the length of the pipe. After 6 hours, the thermal disturbance was restricted to a distance of 50 centimeters from the center of the pipe, which shows that the simulation was not saturated for the time considered.
6.8. Simulation 2: Inferred Flow
When flow was measured using classical methods, simplifications were made in the calculation of the global heat transfer coefficient, i.e. the transient of heat transfer through the completion (tubing and cementing) was not considered. When measured using the proposed analytical method, only the transient effects of the tubing were ignored due to its high thermal conductivity when compared to the other layers of the well (cementing and formation).
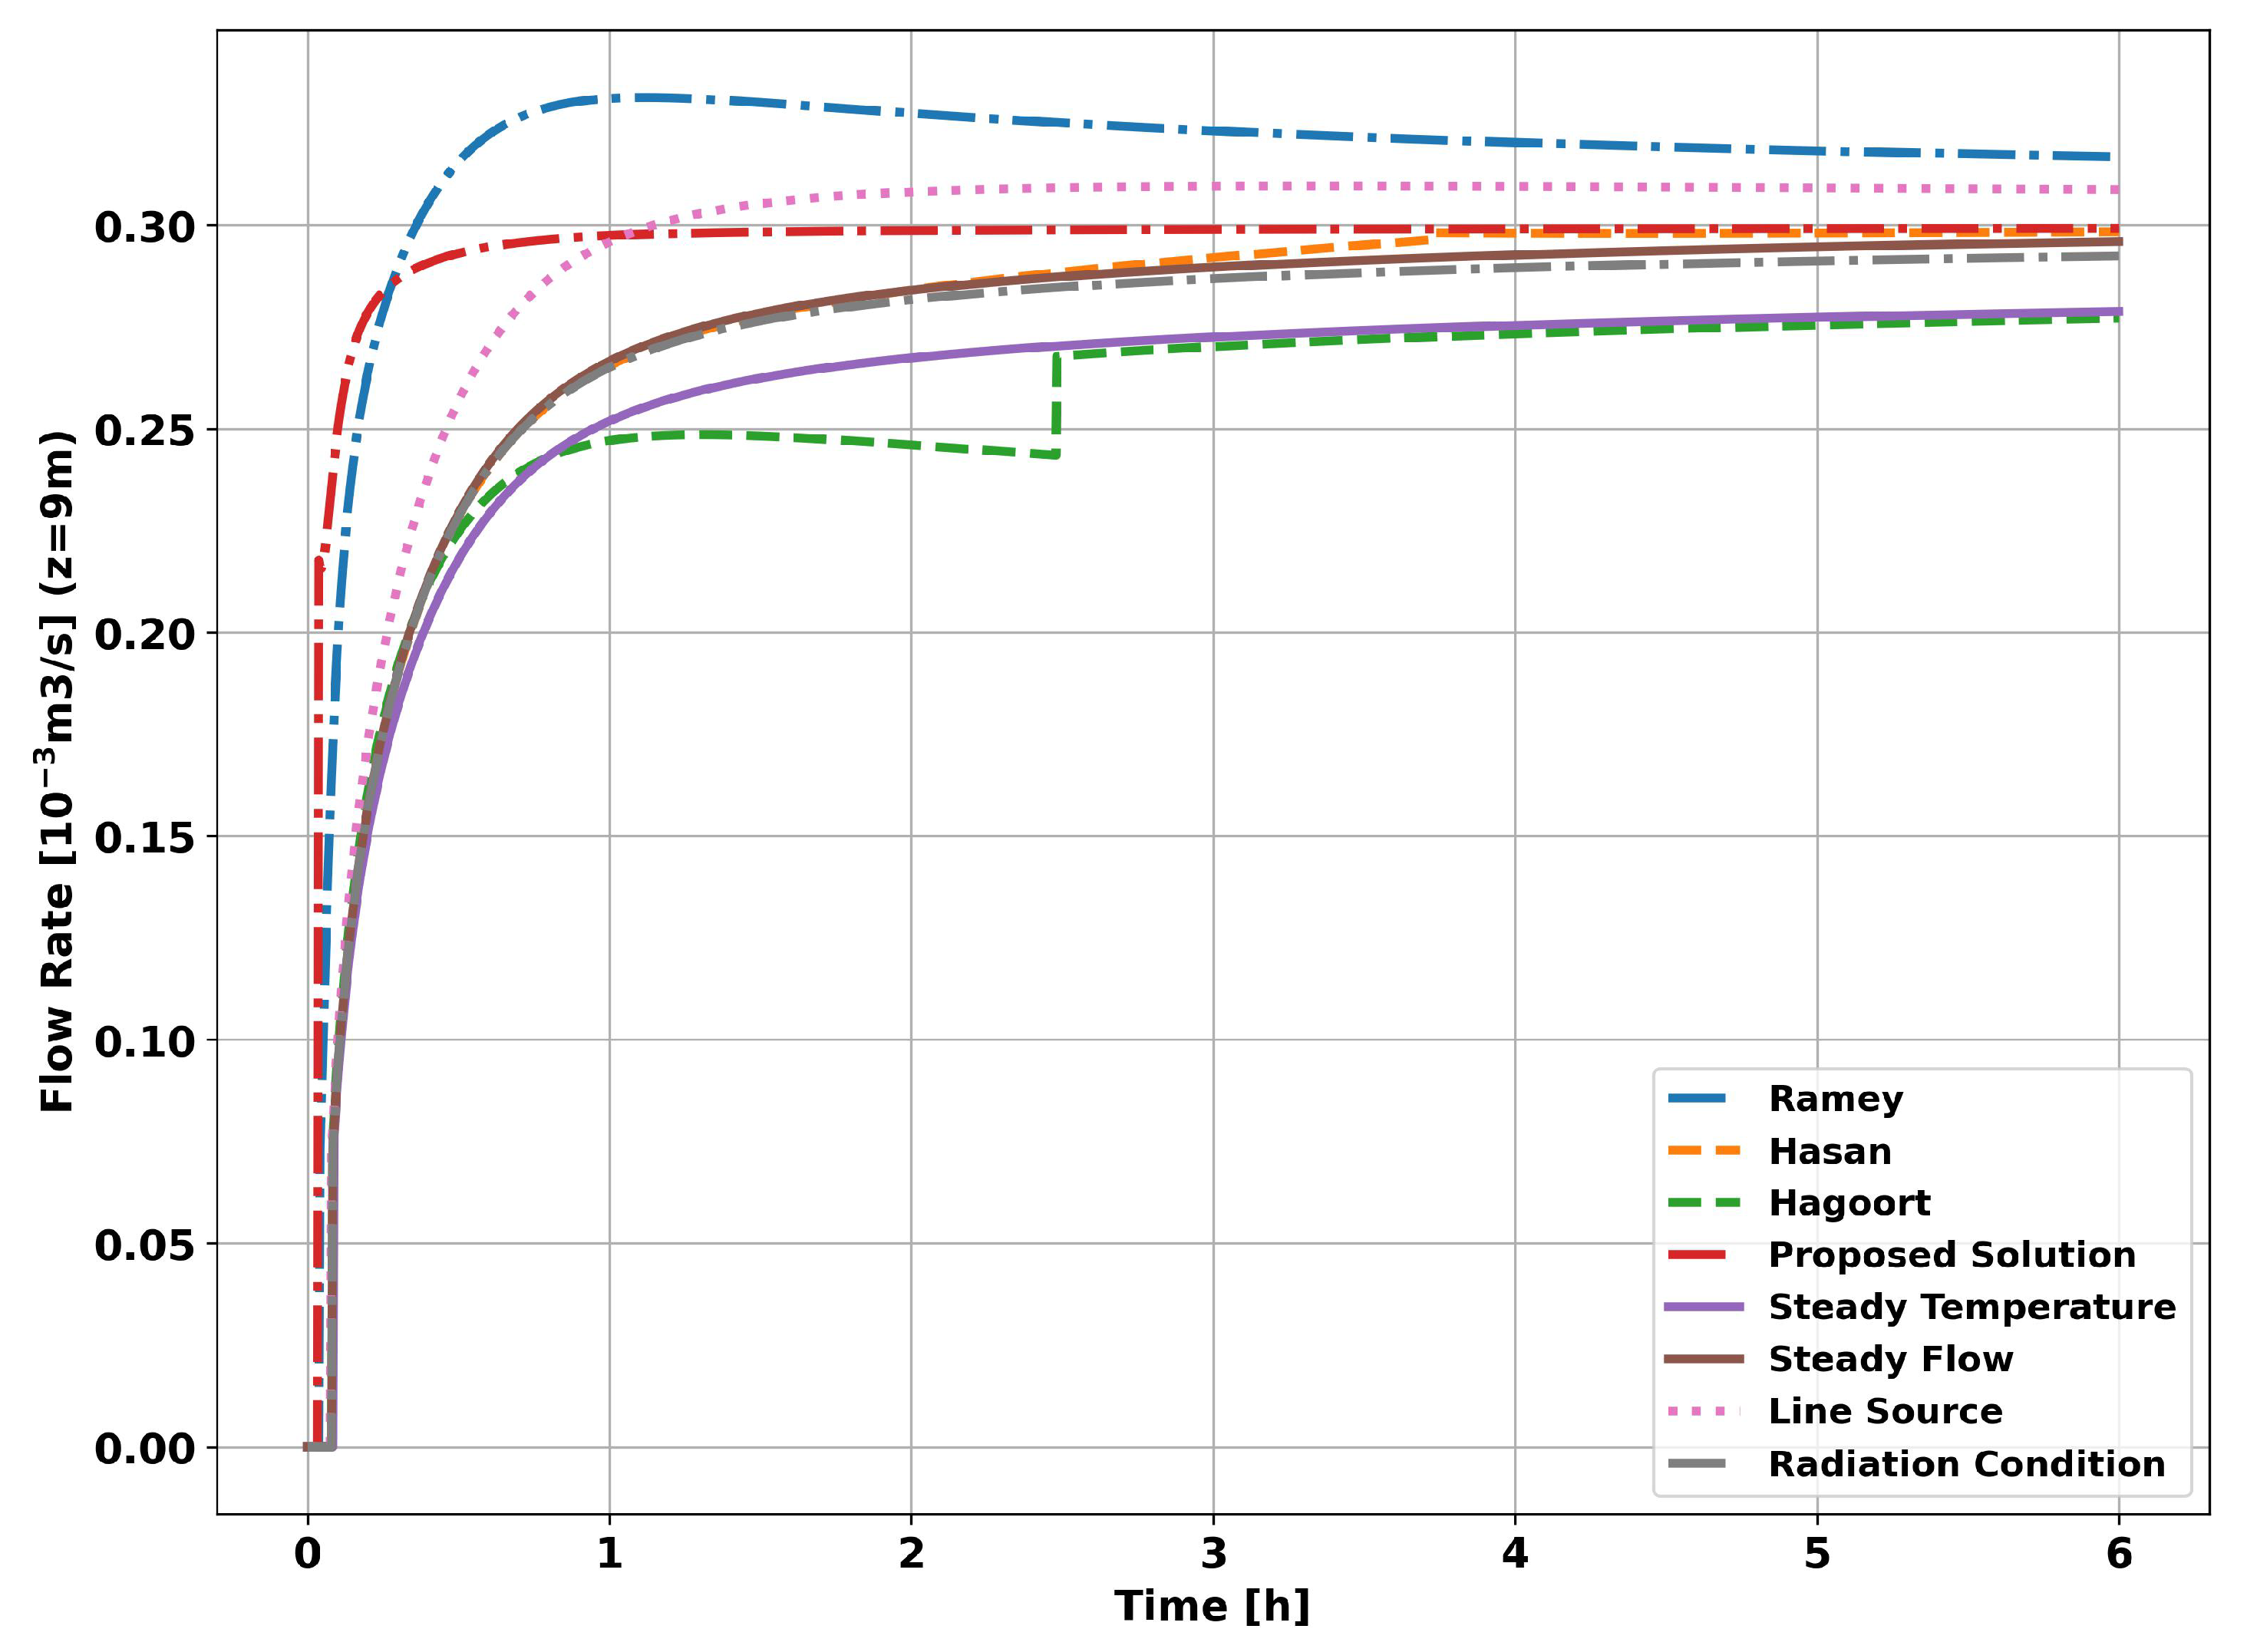
The graph in
Figure 13, on page 18, shows the evolution of flow measurement for the methods and transient functions presented in this article.
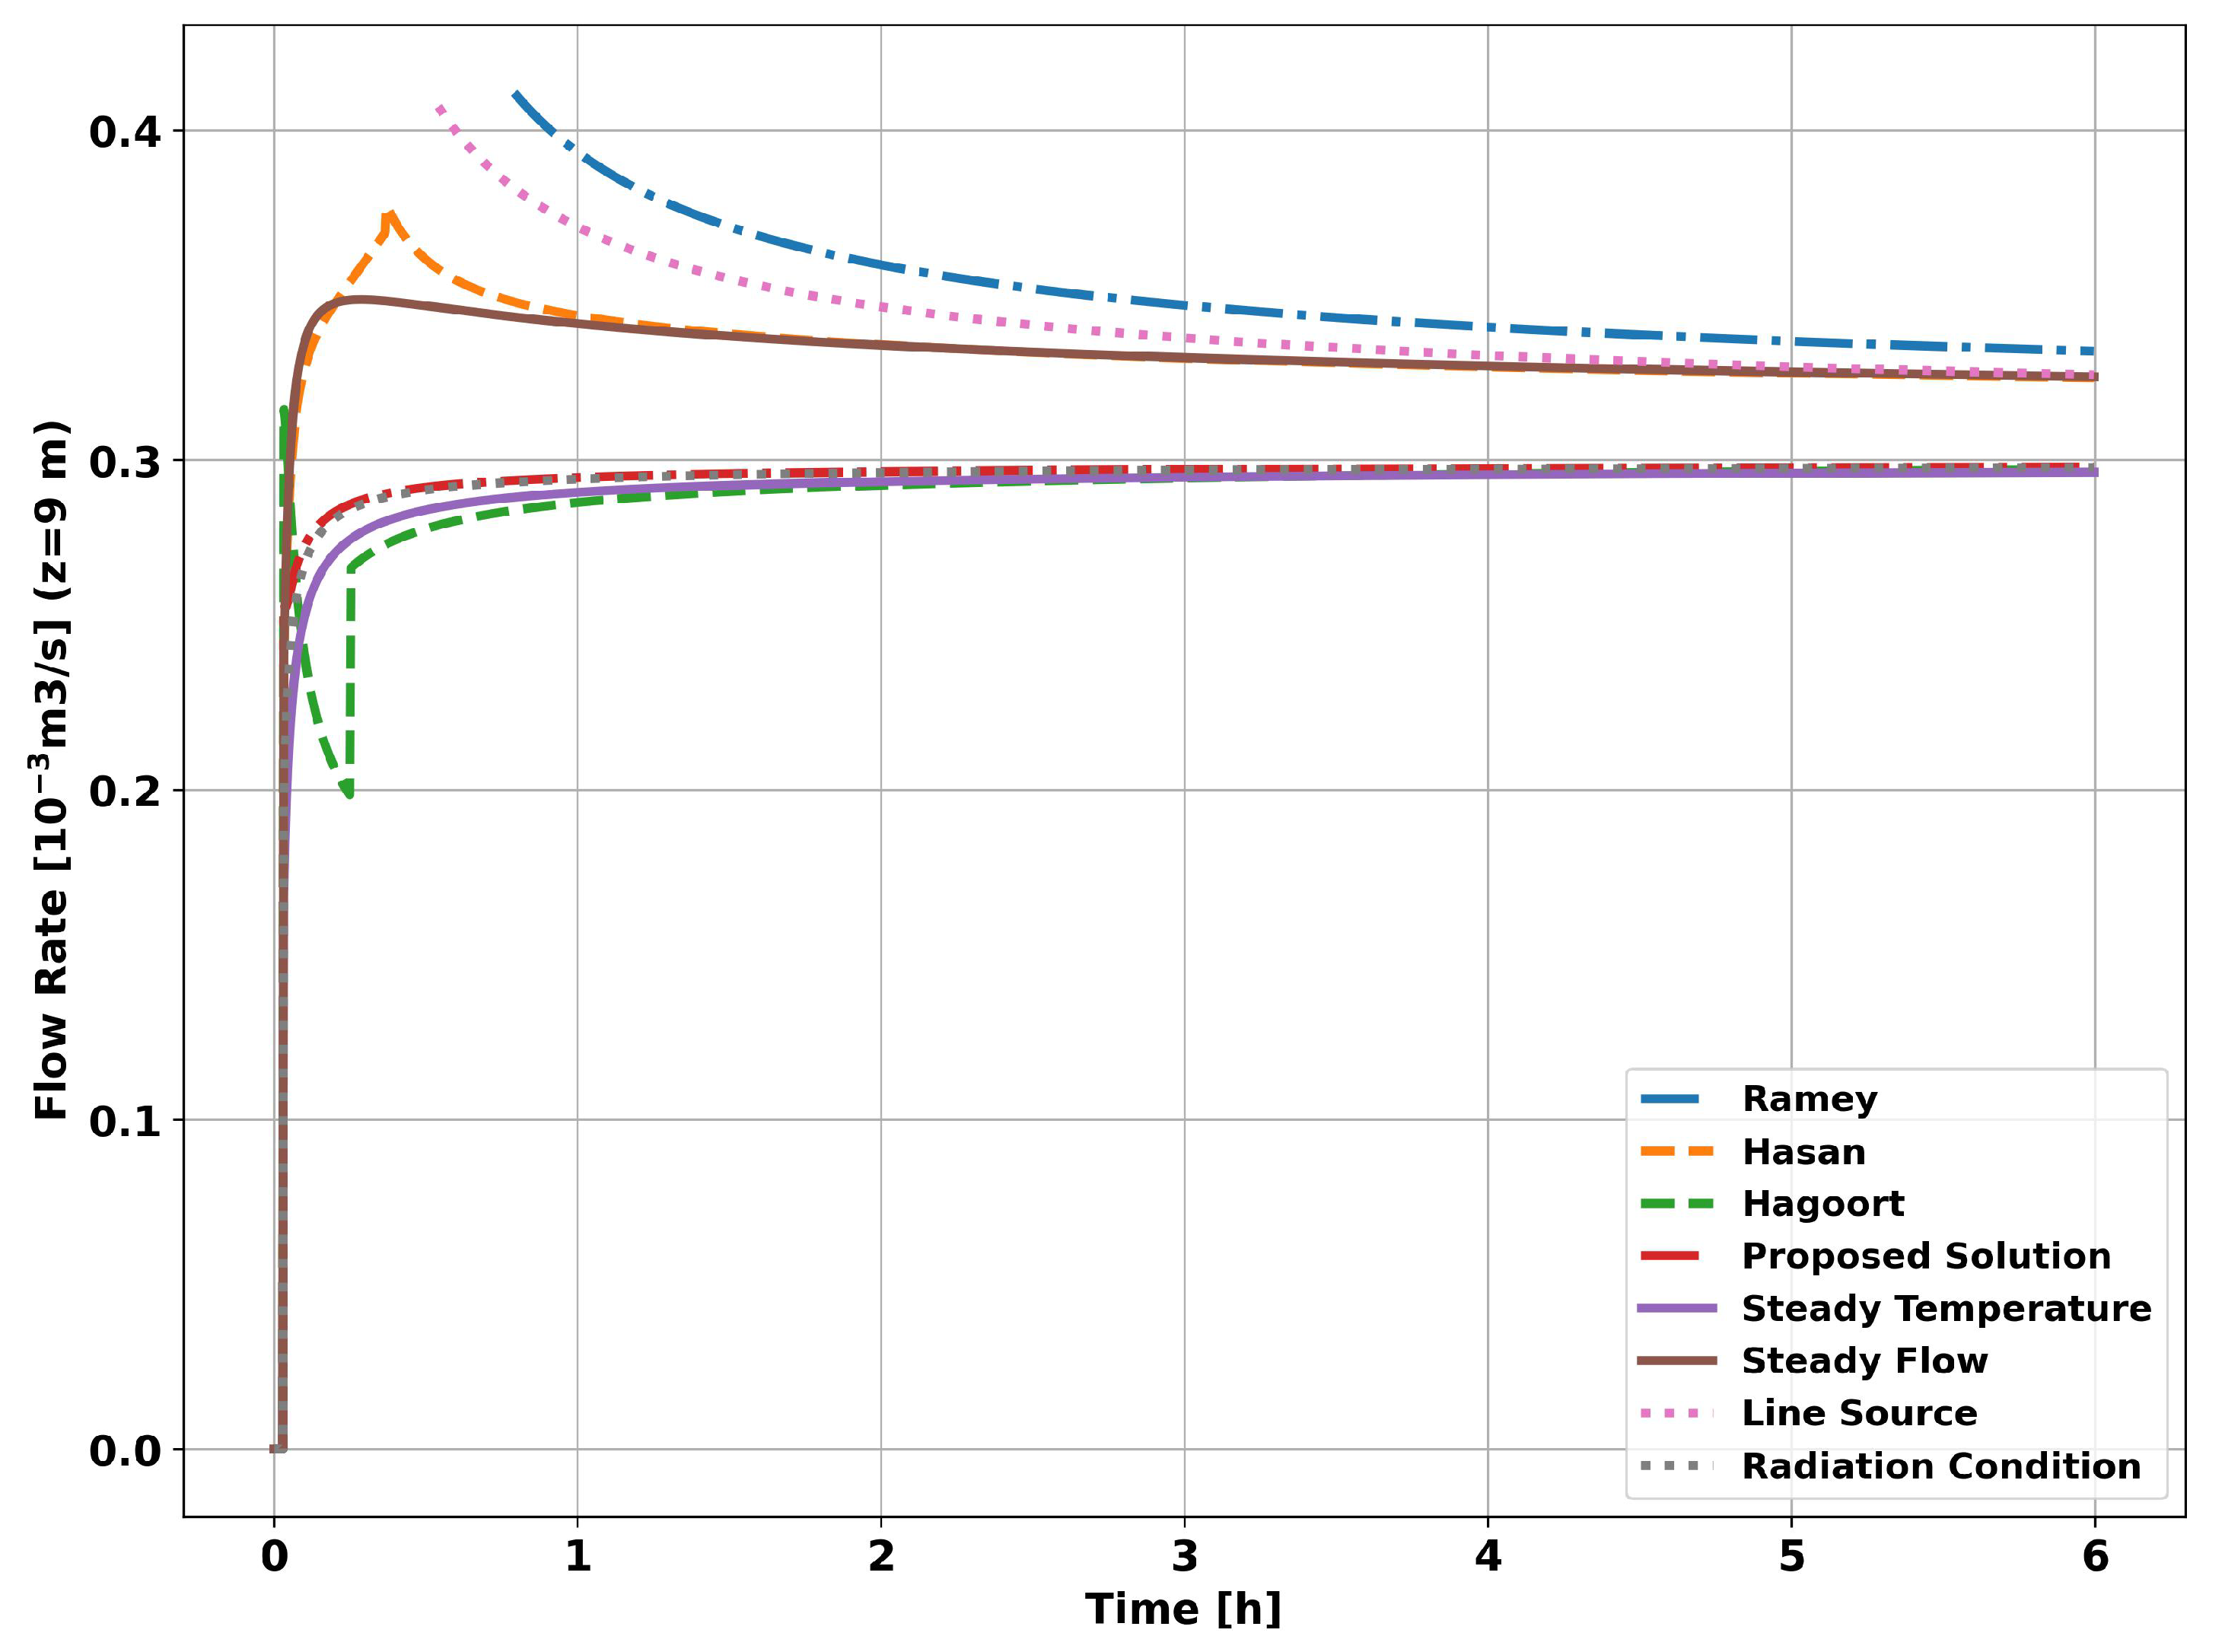
As can be seen in the
Figure 13, as in the previous simulation, all the methods tended to converge to the reference flow rate (
). However, unlike the previous simulation, the methods derived from the assumption of constant heat flow, i.e., constant heat flow at
(curve
Constant Flow) and the Hasan & Kabir approximations (curve
Hasan), showed better results. The method based on applying the radiation boundary condition in conjunction with the assumption of constant fluid temperature (
Radiation Condition curve) showed good results in both simulations, given its flexibility in dealing with heat flow into the reservoir. In the same sense, the proposed analytical solution (curve
Proposed Solution) gave flexibility to the fluid temperature and showed visibly better results than all the other methods studied.
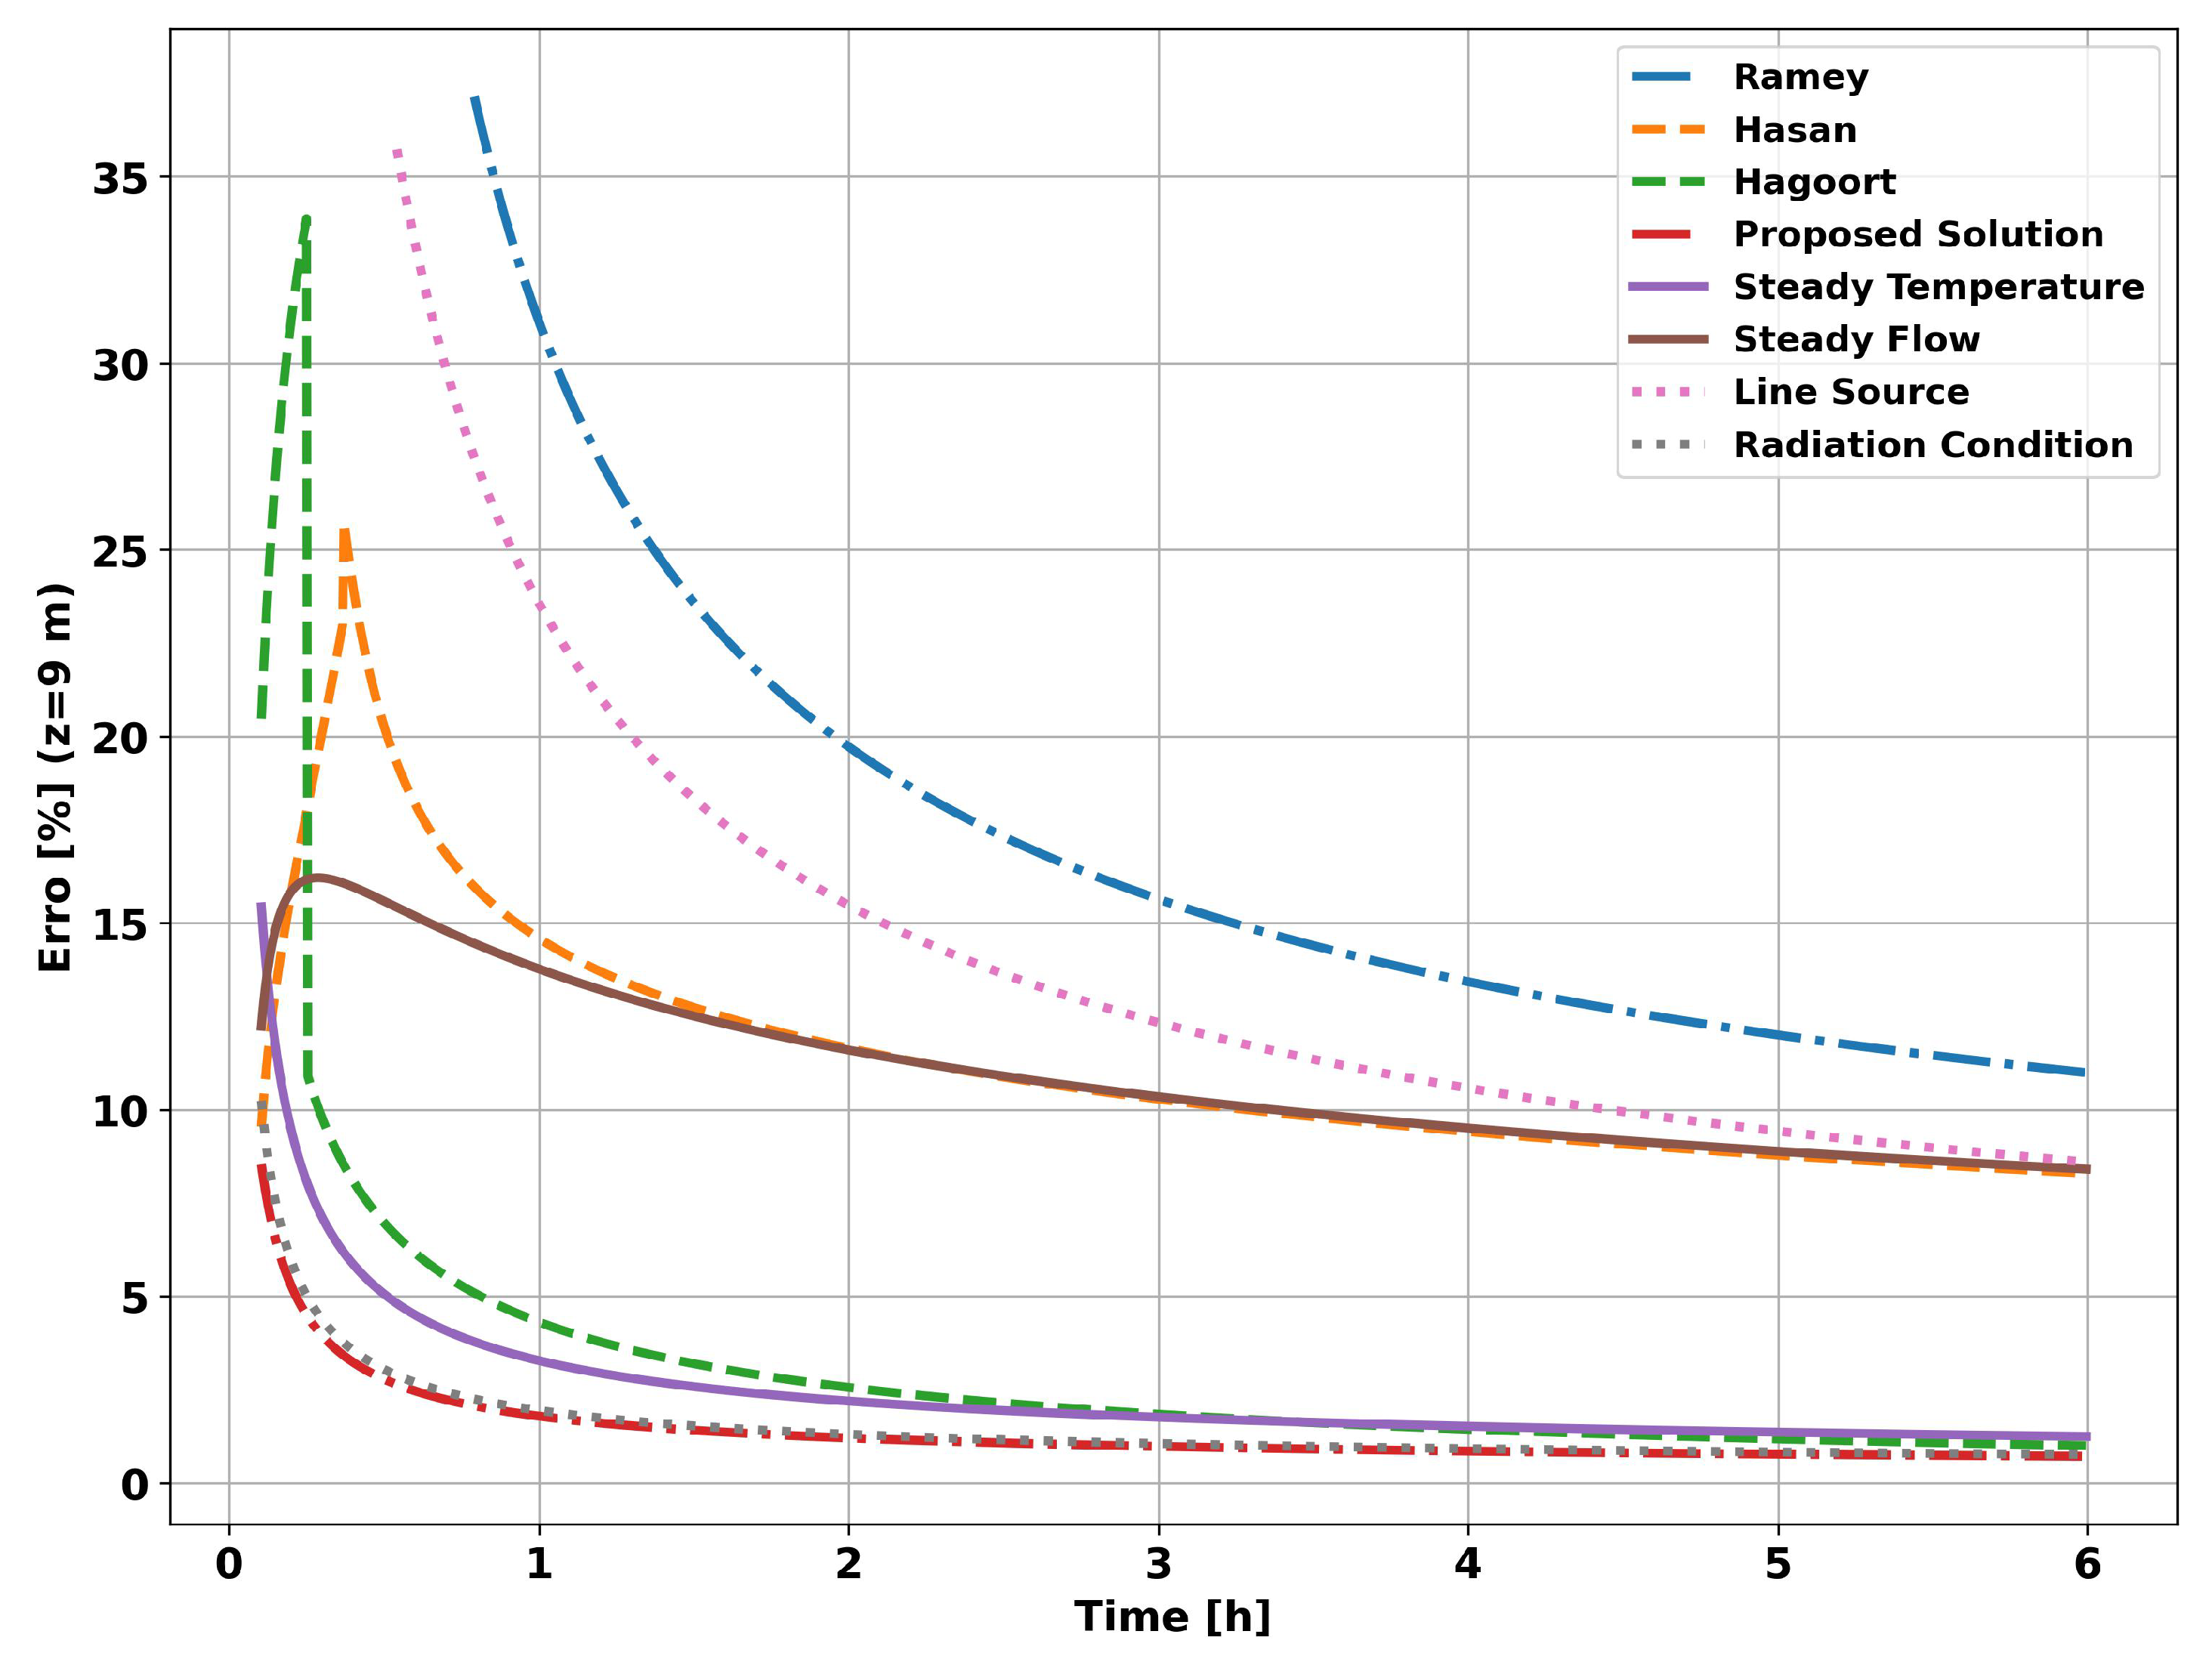
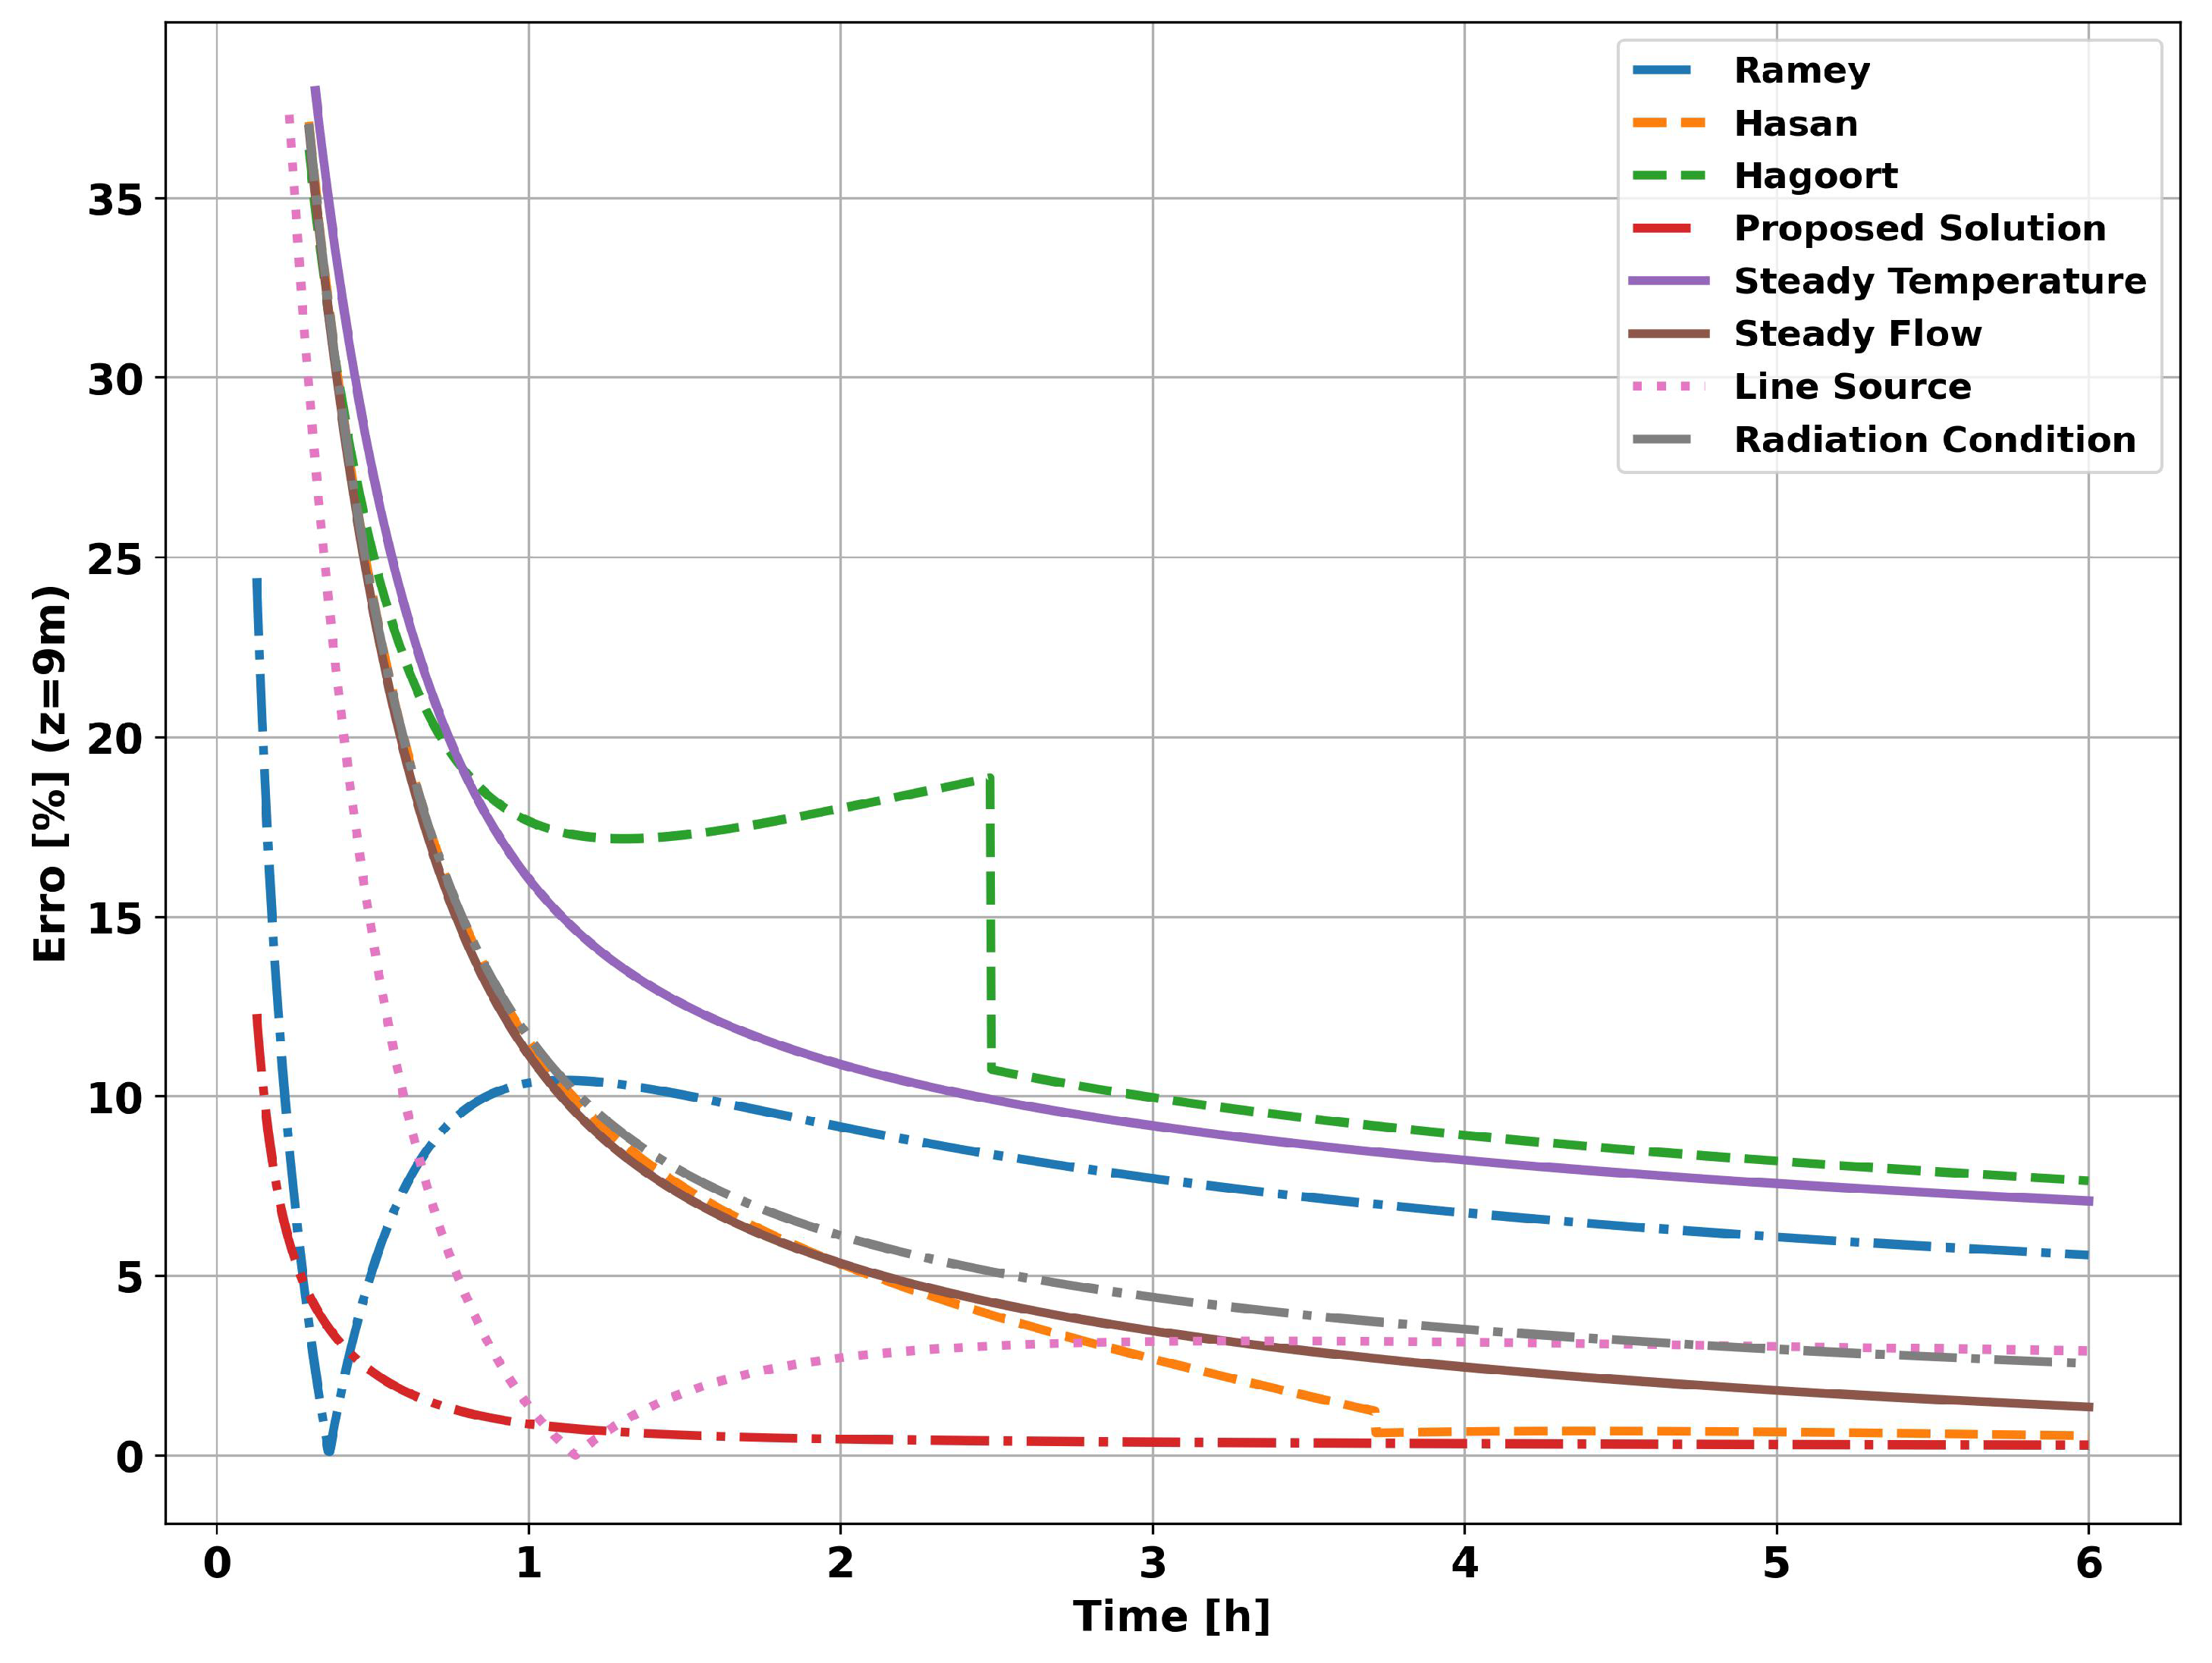
The graph in
Figure 14 shows the evolution of the systematic error in flow measurement. The systematic error resulting from applying the proposed analytical method (curve
Proposed Solution) tends to be less than 1% in the first moments of the simulation, unlike the other methods, which require hours or days of operation. The systematic error in the first instants of the analytical approach is a consequence of neglecting the heat flow in the vertical direction, which is significant in the first instants in the vicinity of the well, and of not taking into account the effects of the pipe on heat propagation in the system as a whole.
7. Conclusions and Future Work
As we have seen, the quasi-static methods have a systematic error inherent to the methodology, which results from ignoring the variation of the internal energy of the fluid in the tubing and, above all, from ignoring the transience of the heat transfer in the completion. For the first few hours of well operation, this systematic error can be higher than 20%, depending on the completion and the transient function chosen. On the other hand, considering a simplified completion (tubing and cementing), the proposed analytical approach, which is the result of solving the heat transfer differential equations, shows a systematic error of <1% in the first two hours of operation.
In terms of methodology, the results of this study demonstrated a mathematical and computational way to improve the quality of flow measurement in injection wells in the early stages of operation. For this purpose, it was necessary to take into account the transient nature of the heat propagation in the completion as well as the temporal variation of the fluid temperature.
As a complement to the research carried out in this paper on reducing systematic error in flow measurement in injection wells, the following studies and actions can be developed in future work:
- (a)
to model and to solve the system of differential equations for the standard completion (tubing, annulus, casing and cementation);
- (b)
to model and to develop the computer code to include the effects of combined convection (natural convection and radiation) in the annulus;
- (c)
to study the effects of vertical heat flow in the completion, if we are looking for greater anticipation in the convergence of the calculated flow values;
- (d)
to research and to develop techniques to minimize the dependence on initial conditions.
Author Contributions
V. S. L., C. W. S. d. P. M. and A.O.S. conceived and designed the study; V. S. L., C. W. S. d. P. M. and G. A. E. E., were responsible for the methodology; V. S. L., G. P. d. O., D. A. d. M. F. and W. L. A. d. S. performed the simulations and experiments; V. S. L., E.R.L.V., G. P. d. O., D. A. d. M. F. and W. L. A. d. S. reviewed the manuscript and provided valuable suggestions; V. S. L., E.R.L.V., G. P. d. O., D. A. d. M. F. and W. L. A. d. S. wrote the paper; G. A. E. E., C. W. S. d. P. M., and A.O.S. were responsible for supervision. All authors have read and agreed to the published version of the manuscript.
Funding
This research was funded in part by Universidad Nacional de San Agustin de Arequipa (UNSA), and supported by the Coordenação de Aperfeiçoamento de Pessoal de Nível Superior—Brasil (CAPES)—Finance Code 001 and Conselho Nacional de Desenvolvimento Científico e Tecnológico (CNPq).
Conflicts of Interest
The authors declare no conflict of interest.
Abbreviations
The following abbreviations are used in this manuscript:
|
Thermal diffusivity
|
|
Thermal diffusivity of medium 1
|
|
Thermal diffusivity of medium 2
|
|
Thermal diffusivity of medium 3
|
|
Biot number relative to the medium 1 |
|
Relative Biot number of the formation |
|
Absolute viscosity
|
|
Dimensionless temperature of the medium 1 |
|
Dimensionless temperature of medium 1 in the Laplace domain |
|
Dimensionless injection fluid temperature |
|
Dimensionless temperature of the injection fluid in the Laplace domain |
|
Mass density
|
|
Mass density of the medium 0
|
|
Mass density of the medium 1
|
|
Mass density of the medium 2
|
|
Mass density of the medium 3
|
|
Mass density of the formation
|
|
Shear stress
|
|
Dimensionless Fourier time |
|
Angular coefficient of geothermal temperature with respect to w
|
|
Linear coefficient of geothermal temperature with respect to w
|
| c |
Specific heat
|
|
Specific heat of the medium 0
|
|
Specific heat of the medium 1
|
|
Specific heat of the medium 2
|
|
Specific heat of the medium 3
|
|
Specific heat of formation
|
| f |
Friction factor |
|
Transient formation function |
| h |
Heat convection coefficient
|
|
Combined heat transfer coefficient
|
|
Modified Bessel function of first type and order 0 |
| k |
Thermal conductivity
|
|
Thermal conductivity of the medium 0
|
|
Thermal conductivity of the medium 1
|
|
Thermal conductivity of the medium 2
|
|
Thermal conductivity of the medium 3
|
|
Thermal conductivity of cementation
|
|
Thermal conductivity of the formation
|
|
Pipe thermal conductivity
|
|
Casing thermal conductivity
|
|
Modified Bessel function of second type and order 0 |
| L |
Length (depth) of the well
|
|
Mass flow
|
| r |
Radial coordinate
|
|
Pipe inner radius
|
|
Pipe external radius
|
|
Casing inner radius
|
|
Casing outer radius
|
|
Cementation external radius
|
|
Dimensionless Reynolds number |
|
Prandtl dimensionless number |
|
Heat transfer rate
|
| s |
Transformation variable for the Laplace domain |
| t |
Time
|
| T |
Temperature
|
|
Average fluid temperature
|
|
Geothermal temperature
|
| U |
Overall heat transfer coefficient
|
|
Average overall heat transfer coefficient
|
|
Average velocity of the fluid velocity profile
|
| w |
Dimensionless vertical coordinate |
| z |
Vertical coordinate
|
|
Initial vertical coordinate of the region under analysis
|
|
Final vertical coordinate of the region under analysis
|
|
Average vertical coordinate
|
References
- Thomas, J. E. et al. Fundamentos de engenharia de petróleo. 2. ed. Rio de Janeiro: Interciência, 2001.(In Portuguese).
- Reges, J. E. O.; Salazar, A. O.; Maitelli, C. W. S. P.; Carvalho, L. G.; Britto, U. J. B. Flow Rates Measurement and Uncertainty Analysis in Multiple-Zone Water-Injection Wells from Fluid Temperature Profiles. Sensors 2016, 16(07), 1077. [Google Scholar] [CrossRef] [PubMed]
- Wu, Y. S.; Pruess, K. An analytical solution for wellbore heat transmission in layered formations. SPE Reservoir Engineering 1990, 05(04), 531–538. [Google Scholar] [CrossRef]
- Ramey Jr, H.; Henry, J. Wellbore heat transmission. Journal of petroleum Technology 1962, 14(04), 427–435. [Google Scholar] [CrossRef]
- Assmann, B. W. Previsão do comportamento de pressão e temperatura transitorios em poços de petroleo e oleodutos. Dissertação (Mestrado) - Universidade Estadual de Campinas. Campinas: UNICAMP, 1993. xii, 128 p.(In Portuguese).
- Lima, V. S. Perfis térmicos em poços injetores d’água: redução do erro sistemático na medição de vazão durante o regime transitório. Ph.D. Thesis, UFRN University, Natal, Brazil, 2019. (In Portuguese). [Google Scholar]
- Çengel, Y. A.; Ghajar, A. J. Tranferência de calor e massa: uma abordagem prática. 4. ed. Porto Alegre: AMGH, 2012. xxii, 904 p.(In Portuguese).
- Hasan, A. R.; Kabir, C. S. Aspects of wellbore heat transfer during two-phase flow. SPE Production & Facilities 1994, 9, 211–216. [Google Scholar]
- Matthews, C. S.; Russell, D. G. Pressure buildup and flow tests in wells. New York: Henry L. Doherty Memorial Fund of AIME New York, 1967. v. 1.
- Hagoort, J. Ramey’s wellbore heat transmission revisited. SPE journal, Society of Petroleum Engineers 2004, 9, 465–474. [Google Scholar] [CrossRef]
- Jacquot, R.; Steadman, J.; Rhodine, C. The gaver-stehfest algorithm for approximate inversion of laplace transforms. IEEE Circuits & Systems Magazine 1983, 5, 4–8. [Google Scholar]
|
Disclaimer/Publisher’s Note: The statements, opinions and data contained in all publications are solely those of the individual author(s) and contributor(s) and not of MDPI and/or the editor(s). MDPI and/or the editor(s) disclaim responsibility for any injury to people or property resulting from any ideas, methods, instructions or products referred to in the content. |
© 2023 by the authors. Licensee MDPI, Basel, Switzerland. This article is an open access article distributed under the terms and conditions of the Creative Commons Attribution (CC BY) license (http://creativecommons.org/licenses/by/4.0/).
