
You are currently viewing a beta version of our website. If you spot anything unusual, kindly let us know.
Preprint
Article
Iron Chelation in Patients with Myelodysplastic Syndromes and Myeloproliferative Neoplasms—Real-World Data from the German Non- Interventional Study EXCALIBUR
Altmetrics
Downloads
88
Views
25
Comments
0
A peer-reviewed article of this preprint also exists.

This version is not peer-reviewed
Abstract
Myelodysplastic syndromes and myeloproliferative neoplasms both represent hematologic diseases associated with bone marrow failure often resulting in anemia. For those patients, transfusion of red blood cell (RBC) units is essential, but results in iron overload (IOL) that may affect various organ functions. Therefore, iron chelation therapy plays a major role in anemic patients, not only because it reduces IOL, but also because it may improve hematopoietic function by increasing hemoglobin or diminishing requirement of RBC transfusions. To assess the utility, efficacy and safety of the different iron chelation medication approved in Germany as well as to examine the effect of chelation on hematopoietic insufficiency, a prospective, multicenter, non-interventional study named EXCALIBUR was designed. In total, 502 patients from 106 German hospitals and medical practices were enrolled. A large proportion of patients switched from deferasirox dispersible tablet to deferasirox film-coated tablet, mainly due to more convenient application which was reflected in the treatment satisfaction questionnaire for medication scores. Iron chelation was effective in lowering serum ferritin levels, with the observed adverse drug reactions being in line with the known safety profile. Hematologic response occurred in a few patients, comparable to other studies that examined hematologic improvement in patients with MDS.
Keywords:
Subject: Medicine and Pharmacology - Hematology
1. Introduction
Myelodysplastic syndromes (MDS) and myeloproliferative neoplasms (MPN) both represent hematologic diseases associated with bone marrow failure eventually resulting in cytopenia. Clinically, anemia is one of the leading problems in MDS and in part MPN patients, and transfusion of red blood cell (RBC) units is essential but results in iron overload (IOL). Physiologically, the human body requires a certain amount of iron for important cellular processes such as energy acquisition or oxygen transport [1]. Unfortunately, no physiological mechanism exists to dispose of excess iron. Iron overload increases the level of oxidative stress via an increase of chronic exposure to non-transferrin-bound iron, leading to damage of macromolecules like DNA, proteins, or lipids [2]. In MDS patients, IOL is already present before patients become transfusion dependent because ineffective erythropoiesis suppresses the production of hepcidin in the liver, resulting in unregulated iron uptake in the intestine [3,4]. Nonetheless, chronic transfusion therapy is the most important cause of iron overload in patients with MDS [5]. Each unit of red blood cell concentrates leads to the substitution of 200 mg of iron. As an example, this causes an intake of about 20 g of iron within 2 years in patients receiving four RBC units per months [5]. As anemia leads to a significantly increased risk of death due to cardiac complications in patients with MDS, transfusion therapy is vital [5]. Because transfusion therapy is accompanied by higher iron levels and IOL means an additional cardiac risk factor, this represents the vicious circle of every anemic hematologic patient with MDS or MPN, and in general for any patient with chronic transfusion need, e.g. due to thalassemia. However, not only cardiac iron overload is detectable after transfusion of multiple RBC units, but other organs are affected from iron overload as well, such as the liver and the endocrine glands. Thus, IOL may cause heart failure and arrhythmias as well as liver fibrosis and cirrhosis, diabetes mellitus and hypothyroidism [1]. Furthermore, IOL might result in genomic instability, thereby possibly encouraging clonal evolution towards leukemia [5]. Therefore, iron chelation therapy (ICT) plays a major role in anemic patients, not only because it reduces IOL, but also because it may improve hematopoietic function by increasing hemoglobin or diminishing requirement of RBC transfusions [2]. There are different iron chelators available in Germany, concomitant with different ways of application. For several decades, only intravenous or subcutaneous deferoxamin (Desferal®) was available, followed by deferasirox (Exjade®) as a dispersible tablet (DT) with the need to disperse into a suspension prior to consumption. During the course of the study discussed here, deferasirox became available as a film-coated tablet (FCT) formulation that just needs to be swallowed [6], which is meanwhile the only formulation of deferasirox available in Germany. For patients with thalassaemia major, the iron chelator deferiprone (Ferriprox®) is available as FCT or solution for oral administration, as a monotherapy or in combination with another iron chelator. Deferiprone is used in exceptional cases (e.g., if there is a contra-indication for deferasirox) in other relevant indications, such as MDS, too. All of these drugs may lead to a decrease in serum ferritin levels via elevated elimination of iron through feces while showing a favorable profile of side effects. The exact percentage distribution of the choice of treatment in Germany is unknown. Quantification of IOL in clinical daily practice is measured via patients’ serum ferritin and treatment is mostly initiated when serum ferritin levels are higher than 1000 µg/l and repetitive RBC transfusions are necessary. A dose-dependent impact of IOL on overall survival of patients has been demonstrated for this serum ferritin threshold, observing a 30% higher risk of death for each 500 µg/l increase in serum ferritin above 1000 µg/l [7]. Furthermore, a large retrospective analysis showed that IOL was a significant prognostic factor not only for OS, but also for leukemia-free survival in MDS [8]. To assess the utility, efficacy and safety of the iron chelation medication approved in Germany, a prospective, multicenter, non-interventional study producing real-world data named EXCALIBUR was designed (NCT05440487; CICL670ADE14; funded by Novartis). Additionally, the effect of chelation on hematopoietic insufficiency was examined.
2. Materials and Methods
EXCALIBUR was a prospective, multicenter, non-interventional study assessing iron chelation therapy in patients with chronic iron overload. Male and female adult patients suffering from chronic iron overload who never received an iron chelator, who received an iron chelation therapy for less than 6 months, or who interrupted an iron chelation therapy for longer than 6 months were included. In total, 502 patients from 106 German hospitals and medical practices for hematology and oncology, who met the inclusion criteria and signed the written informed consent, were enrolled. The entire duration of the study was approximately 6 years. Treatment with iron chelators did not follow a pre-defined protocol, but was administered according to routine medical practice. The observation period was 24 months for patients without a change of iron chelator and was extended by 24 months if the iron chelator was changed. Follow-up visits were documented after 1, 3, 6, 9, 12 and 18 months, with a final visit after 24 months or at the end of the observation phase, whichever occurred first. In- and exclusion criteria were based on the summary of product characteristics of the respective iron chelator, i.e. deferasirox DT, deferasirox FCT, and deferoxamine. Patients’ general satisfaction with all approved iron chelators in everyday life was assessed using the treatment satisfaction questionnaire for medication (TSQM-14), after approx. 1 and 3 months. Data were collected via an eCRF by the treating physician or authorized personnel. Statistical analyses were performed using the software package SAS release 9.4. Continuous data were described by the number of patients in the respective population, non-missing and missing values, mean, standard deviation, median, and interquartile range. Categorical data including categories of continuous data were presented in frequency tables containing absolute and relative frequencies. For the hematological response analyses, patients’ cumulative incidences of the respective response were estimated considering death without response as a competing risk. Analysis of hematological response regarding erythroid, platelet and neutrophil response followed the criteria of the international working group (IWG) [9]. Those patients who had already fulfilled the response criteria at baseline or who were not evaluable at that time were excluded from hematological response analyses. For the analyses of changes in hematological parameters, mixed linear regression models were estimated.
3. Results
Overall, 502 patients were enrolled in the study database, with 418 patients in the safety analysis set (SAF), 403 patients in the full analysis set (FAS), and 266 patients in the hematological response analysis set (HRAS). Reasons for exclusion from the different analysis sets are shown in Figure 1. Of the 106 registered study sites, 101 sites had at least one patient included in the SAF and 98 sites had at least one patient included in the FAS. Median age of patients at baseline was 75 years (ranging from 24 to 92) with a higher proportion of males (59.6%). Patient demographics and disease characteristics are shown in Table 1. The most common hematologic diagnosis was MDS (61.0%), followed by MPN (16.1%). Subtypes of MDS and MPN diagnoses are shown in Table 2, with MDS with multilineage dysplasia (MDS-MLD, 19.5%), MDS with excess of blasts I (MDS-EB I, 13%), and MDS with single lineage dysplasia and ringsideroblasts (MDS-SLD-RS, 12.2%) being the most frequent subtypes of MDS, and primary myelofibrosis for MPN (63.1% of MPN patients). The median time from first diagnosis to current iron chelation therapy was 21.6 months (with an interquartile range of 8.6 to 50 months), and only 5.2% of patients had iron chelation therapy prior to study inclusion. The vast majority of patients had concomitant diseases like hypertension (50.4%), coronary artery disease (11.9%) or diabetes (10.2%), as well as concomitant medication (94.0%). The median time from primary diagnosis to receiving transfusions was 2.8 months (interquartile range 8.6 to 50 months), and the median time from start of transfusions to start of current iron chelation therapy was 12.1 months. More than 95% of patients had received at least one red blood cell transfusion prior to study entry, while most of the patients had received less than 20 erythrocyte concentrates (47.3%) prior to study entry.
3.1. Use and switching of iron chelators
267 patients started with deferasirox FCT (66.3%), while 111 patients received deferasirox DT (27.5%), and 25 patients received deferoxamine (6.2%). During the entire observation period, 310 patients were treated with deferasirox FCT (76.9%), 116 patients with deferasirox DT (28.8%), and 30 patients with deferoxamine (7.4%). The mean time to premature discontinuation of treatment was approximately 9 months, and 77.9% of patients discontinued prematurely. This was similar for patients who were last treated with deferasirox FCT and deferoxamine. Notably, 93.2% of the 74 patients who were last treated with deferasirox DT discontinued their treatment prematurely. The main reasons for premature discontinuation were AEs (29.9%) and death (28.3%) with a median time to premature discontinuation of 200 days. Reason for treatment initiation was a high serum ferritin value of more than 1000 ng/ml in 90.8% of cases followed by transfusion of more than 20 red blood cell units in 30.3% of patients. The frequencies of treatment changes are shown in Table 3. Overall, 11.9% of patients had treatment changed once, most of them from deferasirox DT to deferasirox FCT. Only four patients changed iron chelator twice. The most commonly reported reason for treatment change was intricate application (48.8%). After end of study, all 89 patients without premature discontinuation continued the same treatment. The mean ± SD initial daily dose of the start treatment deferasirox DT was 11.7 ± 6.29 mg/kg, while for deferasirox FCT it was 13.1 ± 6.77 mg/kg. The initial daily dose of deferoxamine was 25.6 ± 10.22 mg/kg. The mean ± SD difference of initial vs. last dose of start treatment was +1.3 ± 4.13 mg/kg for deferasirox DT, +0.7 ± 5.77 mg/kg for deferasirox FCT, and +6.2 ± 15.36 mg/kg for deferoxamine. The mean ± SD number of dosage adjustments per patient was 0.8 ± 1.38 (n=116) for deferasirox DT, 1.1 ± 1.41 (n=310) for deferasirox FCT, and 1.2 ± 1.76 (n=30) for deferoxamine.
3.2. General satisfaction with iron chelation treatment
The general satisfaction with iron chelation treatment was measured with the standardized patient questionnaire TSQM-14, which consisted of 14 questions assigned to 4 subscales. The questionnaire was answered at month 1 and month 3 of the initial treatment, and again at month 1 and month 3 after treatment change, if applicable. The median (IQR) overall satisfaction score was 68.1 (50.0-77.8) points (n=224) at month 1, and 63.9 (50.0-77.8) points (n=181) at month 3 of the initial treatment. After treatment change, the score reached 73.6 (52.8-87.5) points (n=16) at month 1 and 80.6 (47.2-91.7) points (n=18) at month 3. The differences show a tendency towards a higher satisfaction after treatment change and even higher satisfaction after two months following the change, but this was statistically not relevant.
3.3. Safety
The vast majority of patients experienced AEs (92.6%) and around two-thirds of patients experienced serious AEs (SAEs). For around 50% of patients, non-serious events were assessed to have a suspected causal relationship with the respective treatment, thus they were classified as adverse drug reactions (ADRs), and 20.6% of patients had serious ADRs (SADRs) (Table 4). Overall, the most common non-serious AEs (nsAEs) were fatigue (12.1% of patients with nsAEs), dizziness, and nausea (10.2% each). The most common serious AEs (SAEs) were pneumonia (12.6% of patients with SAEs) and general physical health deterioration (9.3%). The most common non-serious adverse drug reactions (nsADRs) were diarrhoea (25.9% of patients with nsADRs), increase of blood creatinine (13.2%), and nausea (10.0%). The most common serious adverse drug reactions (SADRs) were renal failure (11.6% of patients with SADRs) and increase of blood creatinine (8.1%). Detailed listing of the most common patient based (S)AEs and (S)ADRs are shown in Table 5.
3.4. Effectiveness and transfusion dependence
The median serum ferritin value decreased notably throughout treatment, with 1802.50 µg/l at baseline and 1240.50 µg/l at month 24. The median change from baseline at month 24 was -458.0 µg/l, the change from baseline throughout treatment is shown in Figure 2. At baseline, patients had received a median of 4 (IQR: 3-8) erythrocyte concentrates within the last 8 weeks. At all subsequent visits throughout the initial treatment, patients had received a median of 6 erythrocyte concentrates within the last 8 weeks.
3.5. Hematological Response
Changes in blood parameters were estimated based on mixed linear models using the time as independent variable and the patient as random. Cumulative incidence at 24 months for hemoglobin response was 15.2% (95%CI: 9.6-22.0%) for MDS patients and 9.3% (95%CI: 2.3-22.4%) for MPN patients with increasing mean hemoglobin values from 8.3 (95% CI: 8.2-8.5) to 8.9 (95% CI: 8.5-9.2) g/dl for MDS patients, and from 8.3 (95% CI: 8.0-8.7) to 8.9 (95% CI: 8.4-9.3) g/dl for MPN patients. Cumulative incidence at 24 months for transfusion response was 16.3% (95%CI: 9.4-24.8%) for MDS patients and 23.1% (95%CI: 6.4-45.9%) for MPN patients. Mean platelet values decreased from 145.4 (95% CI: 127-166) to 103.4 (95% CI: 85-125) x 103/µl for MDS patients and from 112.7 (95% CI: 84-151) to 80.2 (95% CI: 58-111) x 103/µl for MPN patients. Nonetheless, 24-month cumulative incidences of platelet response were 18.9% (95%CI: 9.1-31.5%) for MDS patients and 31.2% (95%CI: 7.6-59.1%) for MPN patients. Cumulative incidence at 24 months for neutrophil response was 30.0% (95%CI: 11.4-51.3%) for MDS patients, while none was observed in the MPN patients, with mean neutrophil values that increased from 3.0 (95% CI: 2.8-3.3) to 3.4 (95% CI: 2.9-3.9) x 103/µl for MDS patients, and from 5.3 (95% CI: 4.3-6.5) to 5.9 (95% CI: 4.7-7.5) x 103/µl for MPN patients (Table 6). Cumulative incidences of hematological responses as well as cumulative incidence curves regarding time to hematological response are shown in Table 6 and Figure 3. We observed 30 responses regarding hemoglobin, of whom six were lost during the observation time. 8 out of 19 patients who showed transfusion response lost that response during the course of the study, while 3 out of 13 patients lost their response regarding transfusions. All patients who showed neutrophil response maintained that response until the end of the observational period.
4. Discussion
EXCALIBUR was a prospective, non-interventional study that was performed under conditions of clinical daily practice in Germany, thereby allowing the enrollment of a heterogeneous patient population with regard to demographic and disease characteristics. The inclusion of patients with various diagnoses treated with three different iron chelators represented a realistic population and the observational design of the study allowed the collection of real-life data without influencing the physicians’ treatment decisions. To minimize possible study site effects, a large number of different hospitals and medical practices were enrolled, depicting a geographically representative selection of German sites. As the study was only conducted in Germany, the generalizability of the results for other countries may be limited. Due to the observational aspect of the study, there are associated limitations like the lack of blinding and randomization, as well as a relevant amount of missing or inconsistent data. However, the overall data quality reflects a typical MDS population as well as a real-life treatment situation and provides information regarding clinical practice and patient behavior that randomized clinical trials do not obtain.
EXCALIBUR evaluated the use and application of all approved iron chelators with respect to safety, tolerability and patient satisfaction, including treatment switches as well as the effectiveness of iron chelation therapy and the hematological response in MDS/MPN patients. As the treating physician decided on the prescription of medication and inclusion of the patient in this NIS, there was a potential aspect of influencing the patients’ decisions and course of treatment, herewith introducing bias. To account for the effect of premature withdrawals and treatment changes, the data for all patients at the last completed visit were summarized in the form of a “last visit” in the analyses. The patient characteristics within the study were in line with previous studies conducted in Germany, for example the 2-year prospective observational study that aimed at describing the routine use of DFX in patients with hematological malignancies by Nolte et al. [10].
One main objective of our study was to assess the use of approved iron chelators in Germany under real-life conditions. Deferasirox DT was released in Germany in 2006 as a more convenient alternative to deferoxamine, which had to be administered parenterally. However, some subjective burden remained as deferasirox DT had to be dispersed in a relatively time-consuming procedure, taken on an empty stomach and was associated with relevant gastrointestinal side effects [11,12]. Therefore, the film-coated tablet formulation was introduced in 2016. Within EXCALIBUR, Deferasirox FCT was prescribed as initial treatment for the majority of patients, followed by deferasirox DT and deferoxamine. Deferiprone, the fourth approved iron chelator in Germany, is indicated for the treatment of iron overload in patients with thalassaemia major when current chelation therapy is contraindicated or inadequate. Due to this specific indication, only two patients had deferiprone as starting treatment and were therefore excluded from further analyses. Most patients with a documented treatment change switched from deferasirox DT to deferasirox FCT (83.3%). The main reason for this treatment change was the intricate application of deferasirox DT. Later on, deferasirox DT was no longer available, thus requiring all patients to switch.
With the TSQM-14 questionnaire, convenience was assessed with a slightly lower score by patients with deferasirox DT as starting treatment compared to the overall population. These results indicated that patients indeed preferred deferasirox FCT over deferasirox DT and deferoxamine due to the changed formulation, which is in line with the ECLIPSE study that could show consistently greater adherence and higher satisfaction for deferasirox FCT compared to deferasirox DT [13]. Patient’s satisfaction measured by the TSQM-14 questionnaire ranged between 59 and 86 points for the different subscales and start treatment groups, with the maximum score being 100 points. The overall satisfaction ranged between 61 and 72 points. There was a slight tendency towards decreasing scores from month 1 to month 3, and towards increasing scores after treatment change. Effectiveness and side effects were assessed with slightly higher scores for deferoxamine compared to the overall population, however smaller patient numbers should be considered.
The ADRs observed in this study were in line with the known safety profiles of deferasirox and deferoxamine [14,15]. Overall, the most common nsADRs were diarrhea (25.9% of patients with nsADRs) and increase of blood creatinine (13.2%). The most common SADRs were renal failure (11.6% of patients with SADRs) and again increase of blood creatinine (8.1%). This was similar for patients treated with deferasirox DT and deferasirox FCT and, in general, matches the results of the TELESTO trial, a randomized trial that assessed iron chelation in transfusion-dependent patients with low- to intermediate-1-risk myelodysplastic syndromes [16].
The main reason for initiation of iron chelation was a serum ferritin value of >1000 ng/ml. To assess the effectiveness of iron chelation therapy, serum ferritin values were repeatedly measured throughout the study. The median serum ferritin value decreased from 1802.50 µg/l at baseline to 1240.50 µg/l at month 24, the median change from baseline at month 24 was -458.0 µg/l. Persistence of elevated serum ferritin levels is most likely due to continuing transfusion dependence of the patient cohort. In the phase IIIb EPIC study, patients with MDS showed comparatively larger decreases between -115 µg/l and -976 µg/l after 1 year of treatment with deferasirox [11]. However, the comparability is limited due to different study designs and underlying patient populations. A 3-year, prospective, multicenter trial that assessed the safety and efficacy of deferasirox in low- or intermediate-1-risk MDS by List et al. documented a median serum ferritin decrease of 36.7% in patients who completed 2 years which is approximately in line with our results of EXCALIBUR [17].
For patients with MDS and MPN, hematological response was determined according to IWG criteria. In this competing risks setting, death without prior response usually had a higher probability than the achievement of a response. At 24 months, the probability of hemoglobin response was 15.2% for MDS patients and 9.3% for MPN patients. At that time, the probability of transfusion response was 16.3% for MDS and 23.1% for MPN patients. At 24 months, we estimated that 18.9% of MDS patients and 31.2% of MPN patients reached platelet response and for 30.0% of MDS patients, but for none of the MPN patients, a neutrophil response could be documented. When performing literature research, there are more than ten studies assessing the rates of hematologic improvement in patients with MDS receiving iron chelation therapy between 2012 and 2019 [18]. Compared to the post-hoc analysis of the EPIC trial for example, in which 21.5% of patients responded regarding hemoglobin, 13.0% of patients responded regarding platelets and 22% when it came to neutrophils [19], results were similar to ours except for hemoglobin response. Compared to the results of the GIMEMA MDS0306 Trial, a prospective, open-label, single-arm, multicenter trial of transfusion-dependent patients with IPSS low- or intermediate-1-risk MDS assessing the safety and efficacy of deferasirox, we could document a higher amount of neutrophil response (3% within GIMEMA), but almost the same incidence of erythroid and platelet response (11% and 15%) [20]. Within a 'real-world' report from two regional Italian registries, Maurillo et al. assessed deferasirox chelation therapy in patients with transfusion-dependent MDS with an erythroid response of 17.6% (with a 7.1% rate of RBC transfusion independence), a neutrophil response of 7.1% and a platelet response of 5.9% [21]. In summary, compared to other pro- and retrospective analyses, the results of EXCALIBUR regarding hematologic improvement/response seemed to be representative. While a matched pair analysis from the Düsseldorf MDS registry showed an improved survival in patients receiving iron chelation therapy [22], we could not give evidence concerning survival of our study population due to the observation period of only six years.
5. Conclusions
EXCALIBUR provided valuable insights into the utilization, effectiveness, safety, and patients’ satisfaction of iron chelation therapy in clinical daily practice, while additionally documenting change of iron chelator medication over time. The observational design of the study allowed the enrollment of a heterogeneous patient population with regard to demographic and disease characteristics, thereby collecting real-life data without influencing the physicians’ treatment decisions. The prospective documentation in a broad patient population with various diagnoses treated with three different iron chelators led to a high representativeness of a realistic patient population. A large proportion of patients switched from deferasirox DT to deferasirox FCT, mainly due to more convenient application being also reflected in the TSQM-14 scores. Iron chelation was effective in lowering serum ferritin levels, with the observed ADRs being in line with the known safety profile. Hematologic response occurred in a small number of patients, comparable to other studies that examined hematologic improvement in patients with MDS.
Author Contributions
Conceptualization: Ulrich Germing, Nora Schulte, Michael Lauseker and Felicitas Schulz. Methodology: Michael Lauseker. Software: Software package SAS release 9.4. Formal analysis: Michael Lauseker. Resources: Nora Schulte. Data acquisition: Sandra Ketzler-Henkel, Ulrich Hauch, Eyck van der Heyde and Michael Koenigsmann. Writing, review and editing: Felicitas Schulz, Michael Lauseker and Ulrich Germing. Project administration: Nora Schulte. All authors have read and agreed to the published version of the manuscript.
Funding
The study was funded by Novartis.
Institutional Review Board Statement
This study was conducted in accordance with the guidelines on good pharmacoepidemiological practice (GPP) of the international society for pharmacoepidemiology (ISPE 2008), the STROBE guidelines (strengthening the reporting of observational studies in epidemiology), the joint recommendation(s) of BfArM and PEI for planning, conducting and evaluating post-marketing surveillance studies, the VFA recommendations for improving the quality and transparency of non-interventional studies, the FSA Code on cooperation with healthcare professionals and with the ethical principles of the declaration of Helsinki. This study was approved by the Ethics Committee of medical faculty of Heinrich-Heine University (5222, date of approval 22.10.2019.
Informed Consent Statement
Written informed consent was obtained from all subjects involved in the study.
Data Availability Statement
The datasets used and analyzed during the current study are available from the corresponding author on reasonable request. The data are not publicly available due to ethical restrictions.
Conflicts of Interest
Ulrich Germing received speakers’ honoraria by Novartis. The other authors declare no conflicts of interest.
References
- Gattermann N, Muckenthaler MU, Kulozik AE, Metzgeroth G, Hastka J. The Evaluation of Iron Deficiency and Iron Overload. Dtsch Arztebl Int. 2021, 118, 847–856. [Google Scholar] [CrossRef]
- Steensma DP, Gattermann N. When is iron overload deleterious, and when and how should iron chelation therapy be administered in myelodysplastic syndromes? Best Pract Res Clin Haematol. 2013, 26, 431–444. [Google Scholar] [CrossRef] [PubMed]
- Santini V, Girelli D, Sanna A, Martinelli N, Duca L, Campostrini N, Cortelezzi A, Corbella M, Bosi A, Reda G, Olivieri O, Cappellini MD. Hepcidin levels and their determinants in different types of myelodysplastic syndromes. PLoS One 2011, 6, e23109. [Google Scholar] [CrossRef]
- Zipperer E, Post JG, Herkert M, Kündgen A, Fox F, Haas R, Gattermann N, Germing U. Serum hepcidin measured with an improved ELISA correlates with parameters of iron metabolism in patients with myelodysplastic syndrome. Ann Hematol. 2013, 92, 1617–1623. [Google Scholar] [CrossRef] [PubMed]
- Gattermann, N. Iron overload in myelodysplastic syndromes (MDS). Int J Hematol. 2018, 107, 55–63. [Google Scholar] [CrossRef] [PubMed]
- Taher AT, Origa R, Perrotta S, Kourakli A, Ruffo GB, Kattamis A, Goh AS, Cortoos A, Huang V, Weill M, Merino Herranz R, Porter JB. New film-coated tablet formulation of deferasirox is well tolerated in patients with thalassemia or lower-risk MDS: Results of the randomized, phase II ECLIPSE study. Am J Hematol. 2017, 92, 420–428. [Google Scholar] [CrossRef] [PubMed]
- Malcovati L, Della Porta MG, Strupp C, Ambaglio I, Kuendgen A, Nachtkamp K, Travaglino E, Invernizzi R, Pascutto C, Lazzarino M, Germing U, Cazzola M. Impact of the degree of anemia on the outcome of patients with myelodysplastic syndrome and its integration into the WHO classification-based Prognostic Scoring System (WPSS). Haematologica 2011, 96, 1433–1440. [Google Scholar] [CrossRef] [PubMed]
- Leitch, HA. Improving clinical outcome in patients with myelodysplastic syndrome and iron overload using iron chelation therapy. Leuk Res. 2007, 31, S7–S9. [Google Scholar] [CrossRef] [PubMed]
- Cheson BD, Greenberg PL, Bennett JM, Lowenberg B, Wijermans PW, Nimer SD, Pinto A, Beran M, de Witte TM, Stone RM, Mittelman M, Sanz GF, Gore SD, Schiffer CA, Kantarjian H. Clinical application and proposal for modification of the International Working Group (IWG) response criteria in myelodysplasia. Blood 2006, 108, 419–425. [Google Scholar] [CrossRef] [PubMed]
- Nolte F, Nückel H, Schmidt B, Geer T, Rubanov O, Hebart H, Jarisch A, Albrecht S, Johr C, Schumann C, Hofmann WK. Tolerability and efficacy of deferasirox in patients with transfusional iron overload: results from a German 2-year non-interventional study. J Cancer Res Clin Oncol. 2018, 144, 1531–1538. [Google Scholar] [CrossRef] [PubMed]
- Gattermann N, Finelli C, Porta MD, Fenaux P, Ganser A, Guerci-Bresler A, Schmid M, Taylor K, Vassilieff D, Habr D, Domokos G, Roubert B, Rose C; EPIC study investigators. Deferasirox in iron-overloaded patients with transfusion-dependent myelodysplastic syndromes: Results from the large 1-year EPIC study. Leuk Res. 2010, 34, 1143–1150. [Google Scholar] [CrossRef] [PubMed]
- Nolte F, Angelucci E, Beris P, Macwhannell A, Selleslag D, Schumann C, Xicoy B, Almeida A, Guerci-Bresler A, Sliwa T, Muus P, Porter J, Hofmann WK. Clinical management of gastrointestinal disturbances in patients with myelodysplastic syndromes receiving iron chelation treatment with deferasirox. Leuk Res. 2011, 35, 1131–1135. [Google Scholar] [CrossRef] [PubMed]
- Taher AT, Origa R, Perrotta S, Kourakli A, Ruffo GB, Kattamis A, Goh AS, Cortoos A, Huang V, Weill M, Merino Herranz R, Porter JB. New film-coated tablet formulation of deferasirox is well tolerated in patients with thalassemia or lower-risk MDS: Results of the randomized, phase II ECLIPSE study. Am J Hematol. 2017, 92, 420–428. [Google Scholar] [CrossRef] [PubMed]
- https://www.ema.europa.eu/en/medicines/human/EPAR/exjade.
- https://klinischeforschung.novartis.de/dokumente/fachinformationen-desferal/.
- Angelucci E, Li J, Greenberg P, Wu D, Hou M, Montano Figueroa EH, Rodriguez MG, Dong X, Ghosh J, Izquierdo M, Garcia-Manero G; TELESTO Study Investigators. Iron Chelation in Transfusion-Dependent Patients With Low- to Intermediate-1-Risk Myelodysplastic Syndromes: A Randomized Trial. Ann Intern Med. 2020, 172, 513–522. [Google Scholar] [CrossRef] [PubMed]
- List AF, Baer MR, Steensma DP, Raza A, Esposito J, Martinez-Lopez N, Paley C, Feigert J, Besa E. Deferasirox reduces serum ferritin and labile plasma iron in RBC transfusion-dependent patients with myelodysplastic syndrome. J Clin Oncol. 2012, 30, 2134–2139. [Google Scholar] [CrossRef] [PubMed]
- Leitch HA, Gattermann N. Hematologic improvement with iron chelation therapy in myelodysplastic syndromes: Clinical data, potential mechanisms, and outstanding questions. Crit Rev Oncol Hematol. 2019, 141, 54–72. [Google Scholar] [CrossRef] [PubMed]
- Gattermann N, Finelli C, Della Porta M, Fenaux P, Stadler M, Guerci-Bresler A, Schmid M, Taylor K, Vassilieff D, Habr D, Marcellari A, Roubert B, Rose C. Hematologic responses to deferasirox therapy in transfusion-dependent patients with myelodysplastic syndromes. Haematologica 2012, 97, 1364–1371. [Google Scholar] [CrossRef] [PubMed]
- Angelucci E, Santini V, Di Tucci AA, Quaresmini G, Finelli C, Volpe A, Quarta G, Rivellini F, Sanpaolo G, Cilloni D, Salvi F, Caocci G, Molteni A, Vallisa D, Voso MT, Fenu S, Borin L, Latte G, Alimena G, Storti S, Piciocchi A, Fazi P, Vignetti M, Tura S. Deferasirox for transfusion-dependent patients with myelodysplastic syndromes: safety, efficacy, and beyond (GIMEMA MDS0306 Trial). Eur J Haematol. 2014, 92, 527–536. [Google Scholar] [CrossRef] [PubMed]
- Maurillo L, Breccia M, Buccisano F, Voso MT, Niscola P, Trapè G, Tatarelli C, D'Addosio A, Latagliata R, Fenu S, Piccioni AL, Fragasso A, Aloe Spiriti MA, Refrigeri M, Criscuolo M, Musto P, Venditti A. Deferasirox chelation therapy in patients with transfusion-dependent MDS: a 'real-world' report from two regional Italian registries: Gruppo Romano Mielodisplasie and Registro Basilicata. Eur J Haematol. 2015. [CrossRef]
- Neukirchen J, Fox F, Kündgen A, Nachtkamp K, Strupp C, Haas R, Germing U, Gattermann N. Improved survival in MDS patients receiving iron chelation therapy - a matched pair analysis of 188 patients from the Düsseldorf MDS registry. Leuk Res. 2012, 36, 1067–1070. [Google Scholar] [CrossRef] [PubMed]
Figure 1.
Analysis sets. Abbreviations: FAS = Full analysis set, HRAS = Hematological response analysis set, SAF = Safety analysis set.
Figure 1.
Analysis sets. Abbreviations: FAS = Full analysis set, HRAS = Hematological response analysis set, SAF = Safety analysis set.
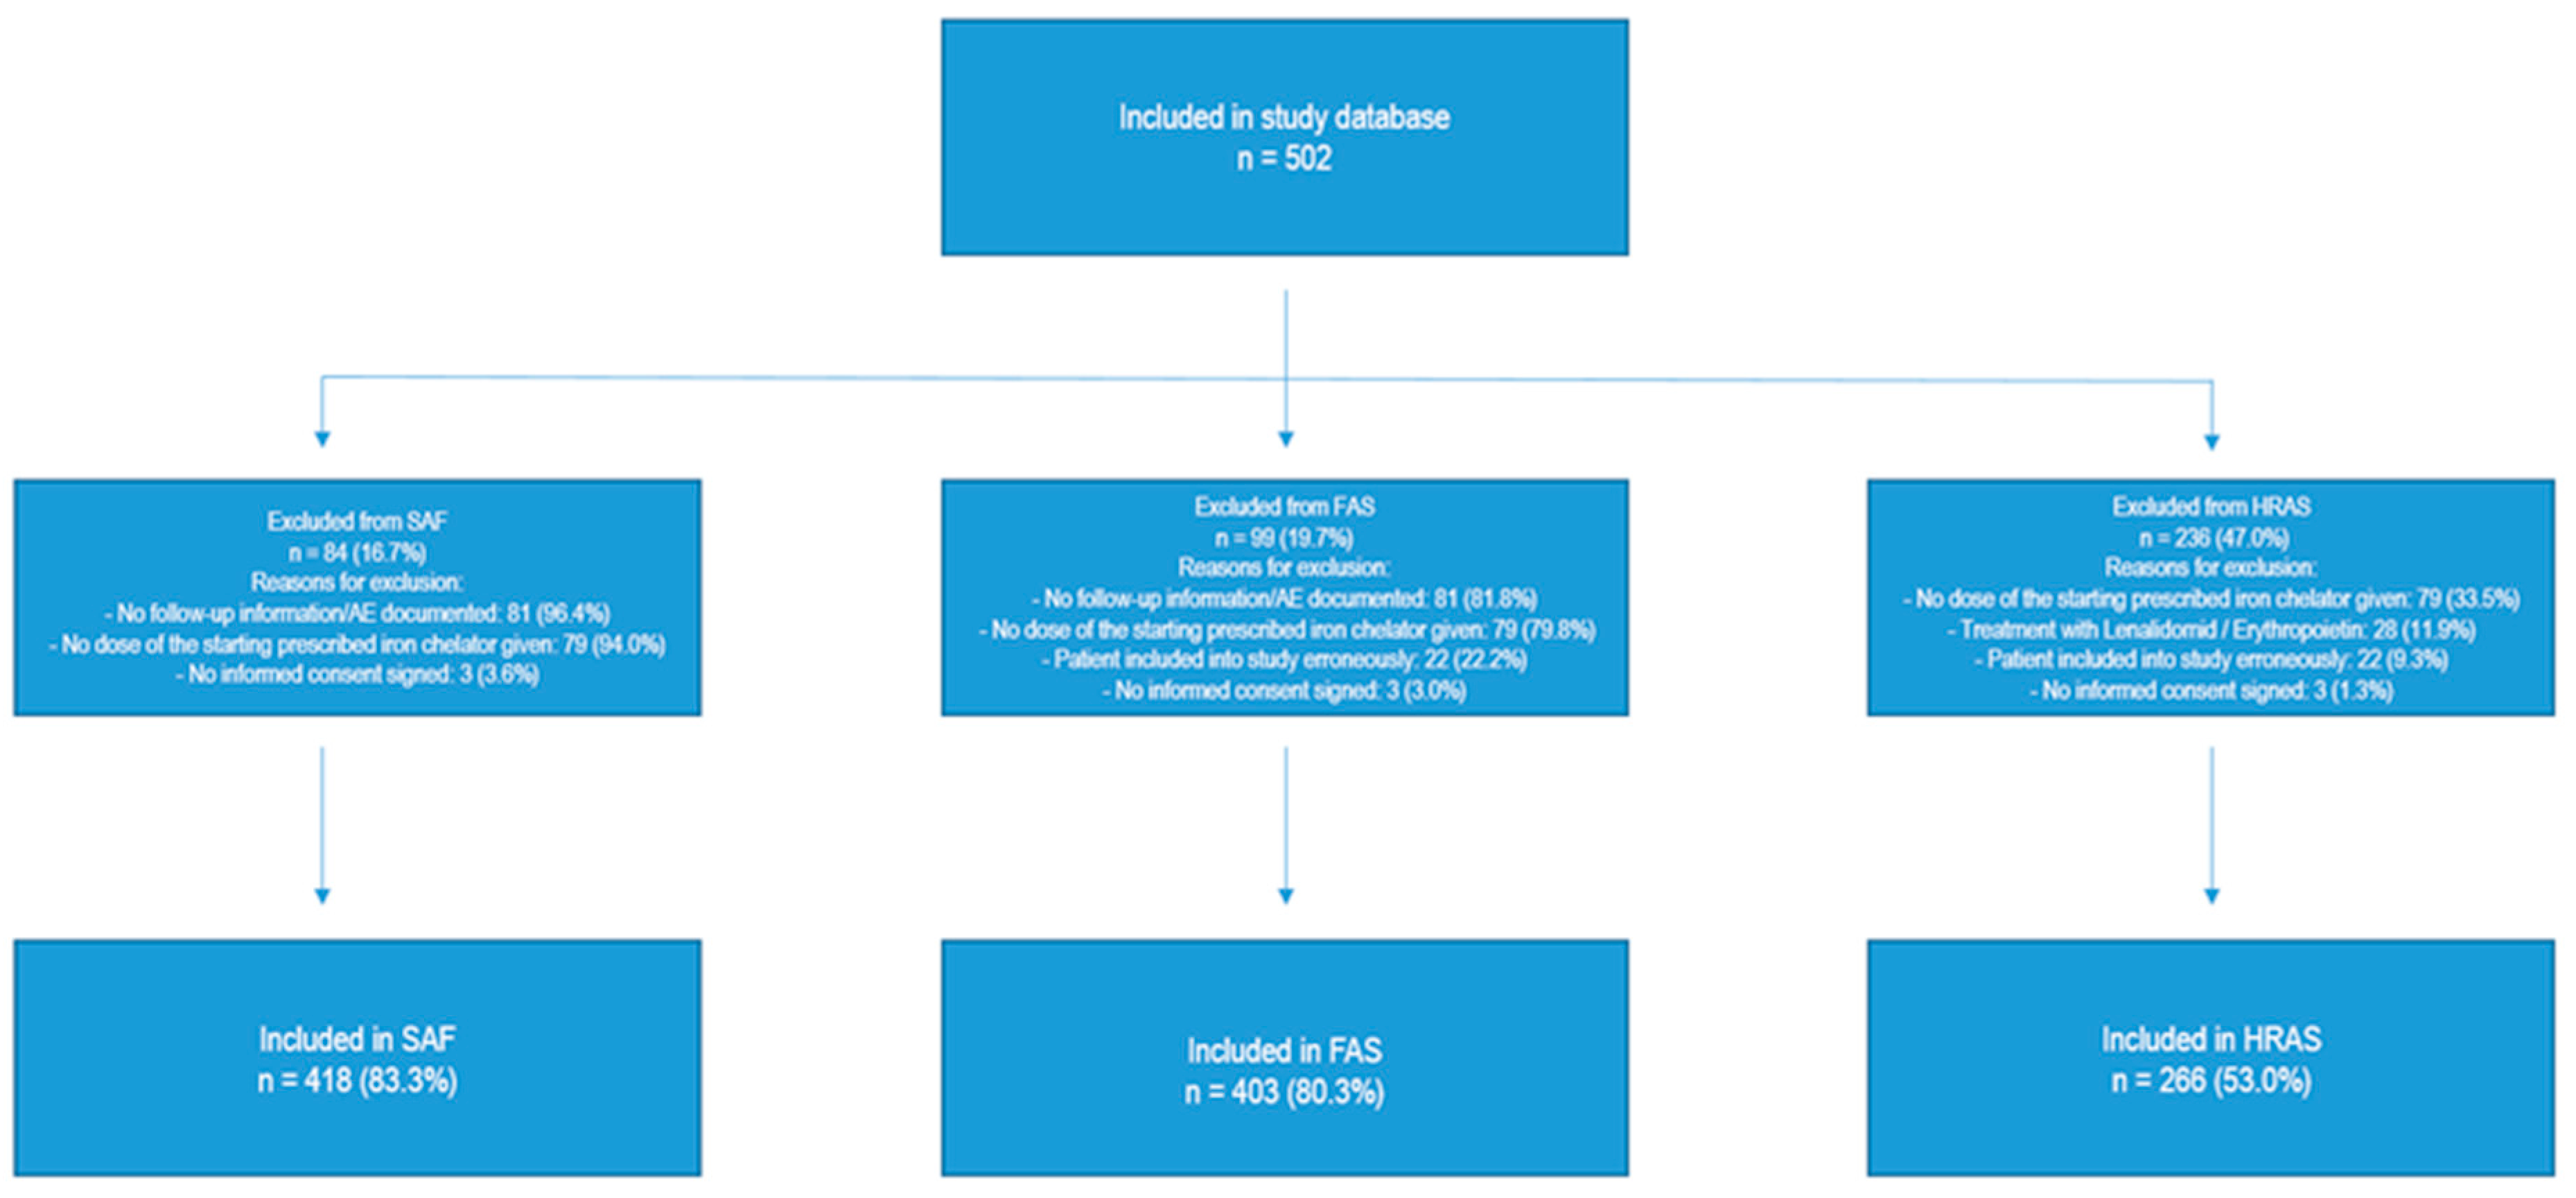
Figure 2.
Course of serum ferritin values by study months (M1-M24). Gray area shows IQR. Abbreviations: IQR: Interquartile range, M: Month, n: Number of patients with observation.
Figure 2.
Course of serum ferritin values by study months (M1-M24). Gray area shows IQR. Abbreviations: IQR: Interquartile range, M: Month, n: Number of patients with observation.
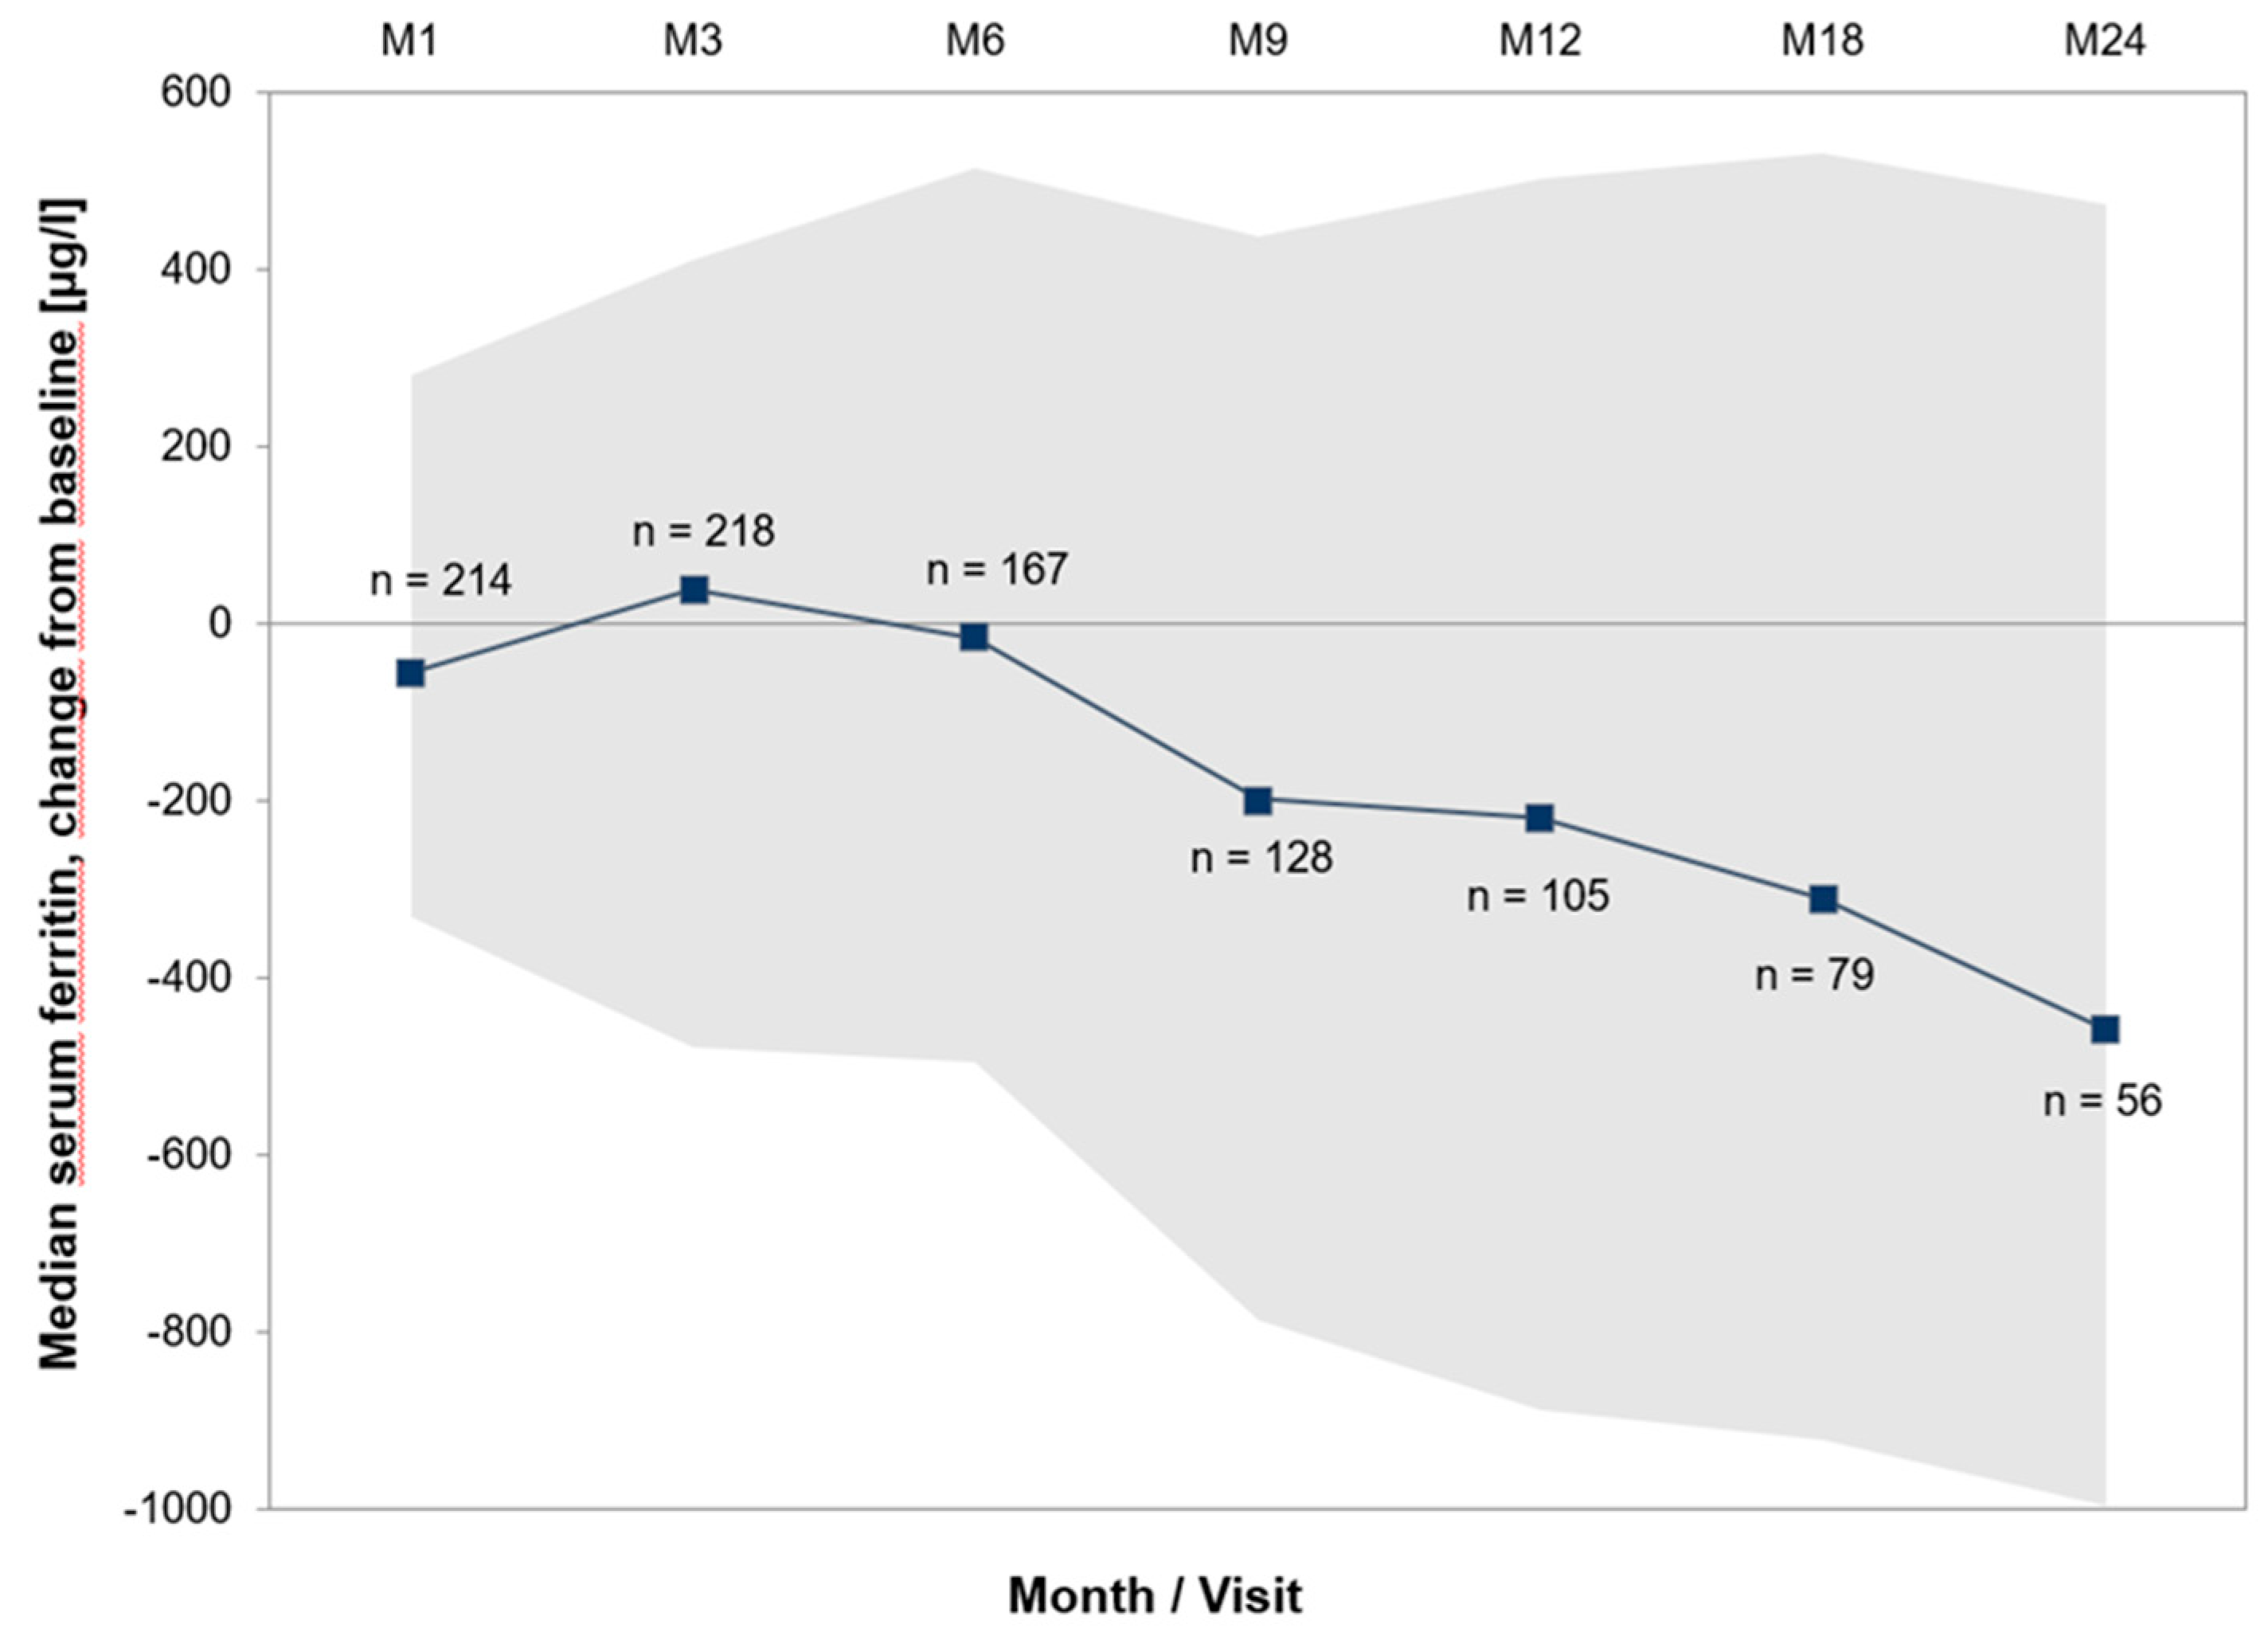
Figure 3.
Course Time to hematological response (cumulative incidence curves) of hemoglobin, transfusions, platelets and neutrophils by study months (M1-M24). Coloured areas show IQR.
Figure 3.
Course Time to hematological response (cumulative incidence curves) of hemoglobin, transfusions, platelets and neutrophils by study months (M1-M24). Coloured areas show IQR.
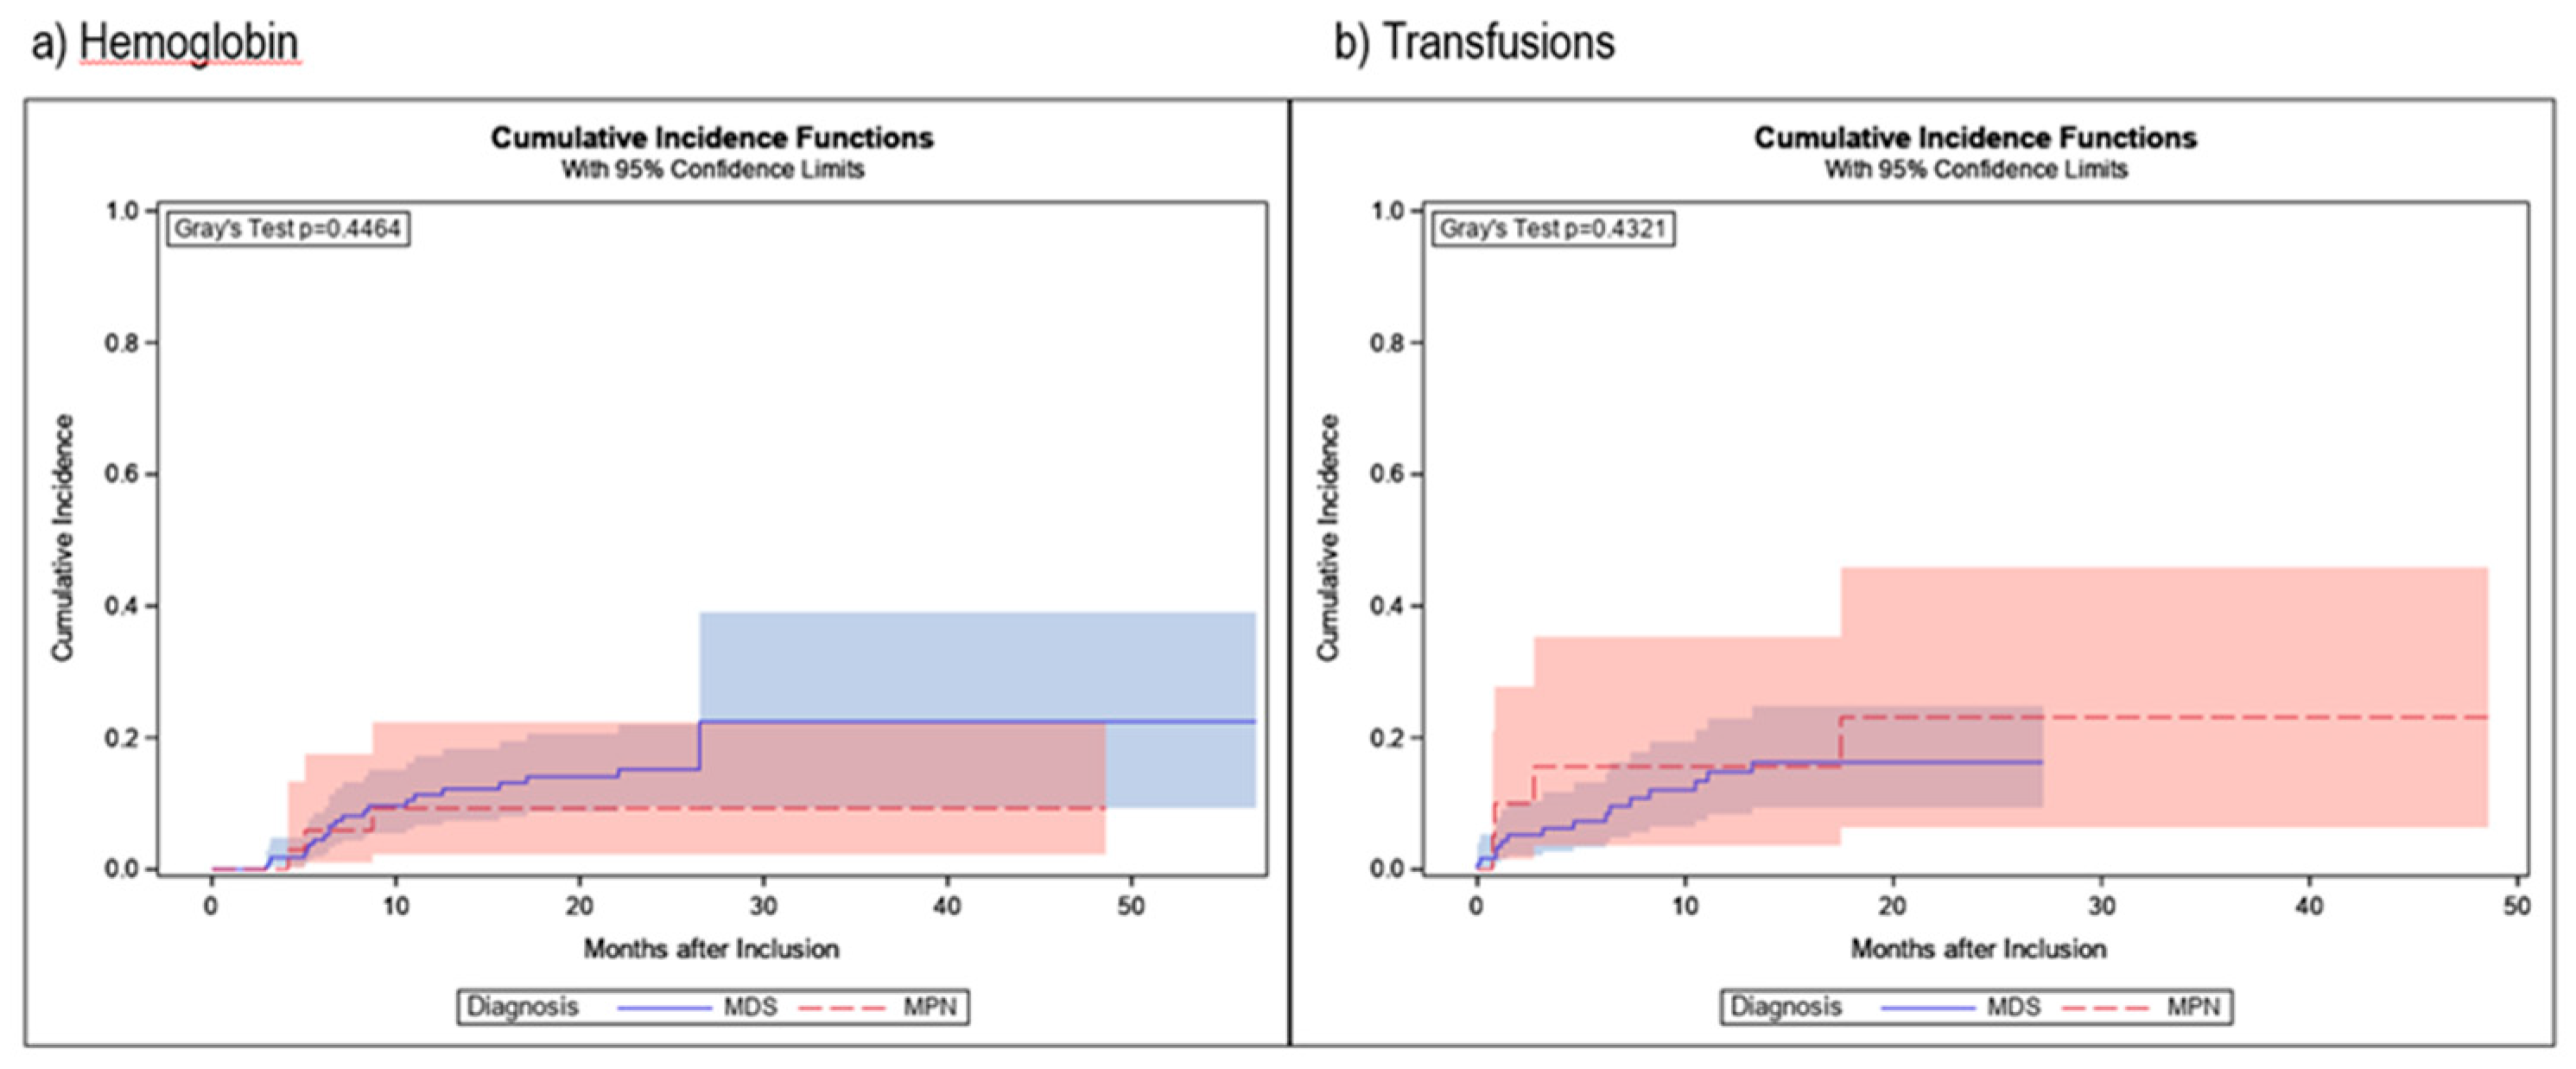
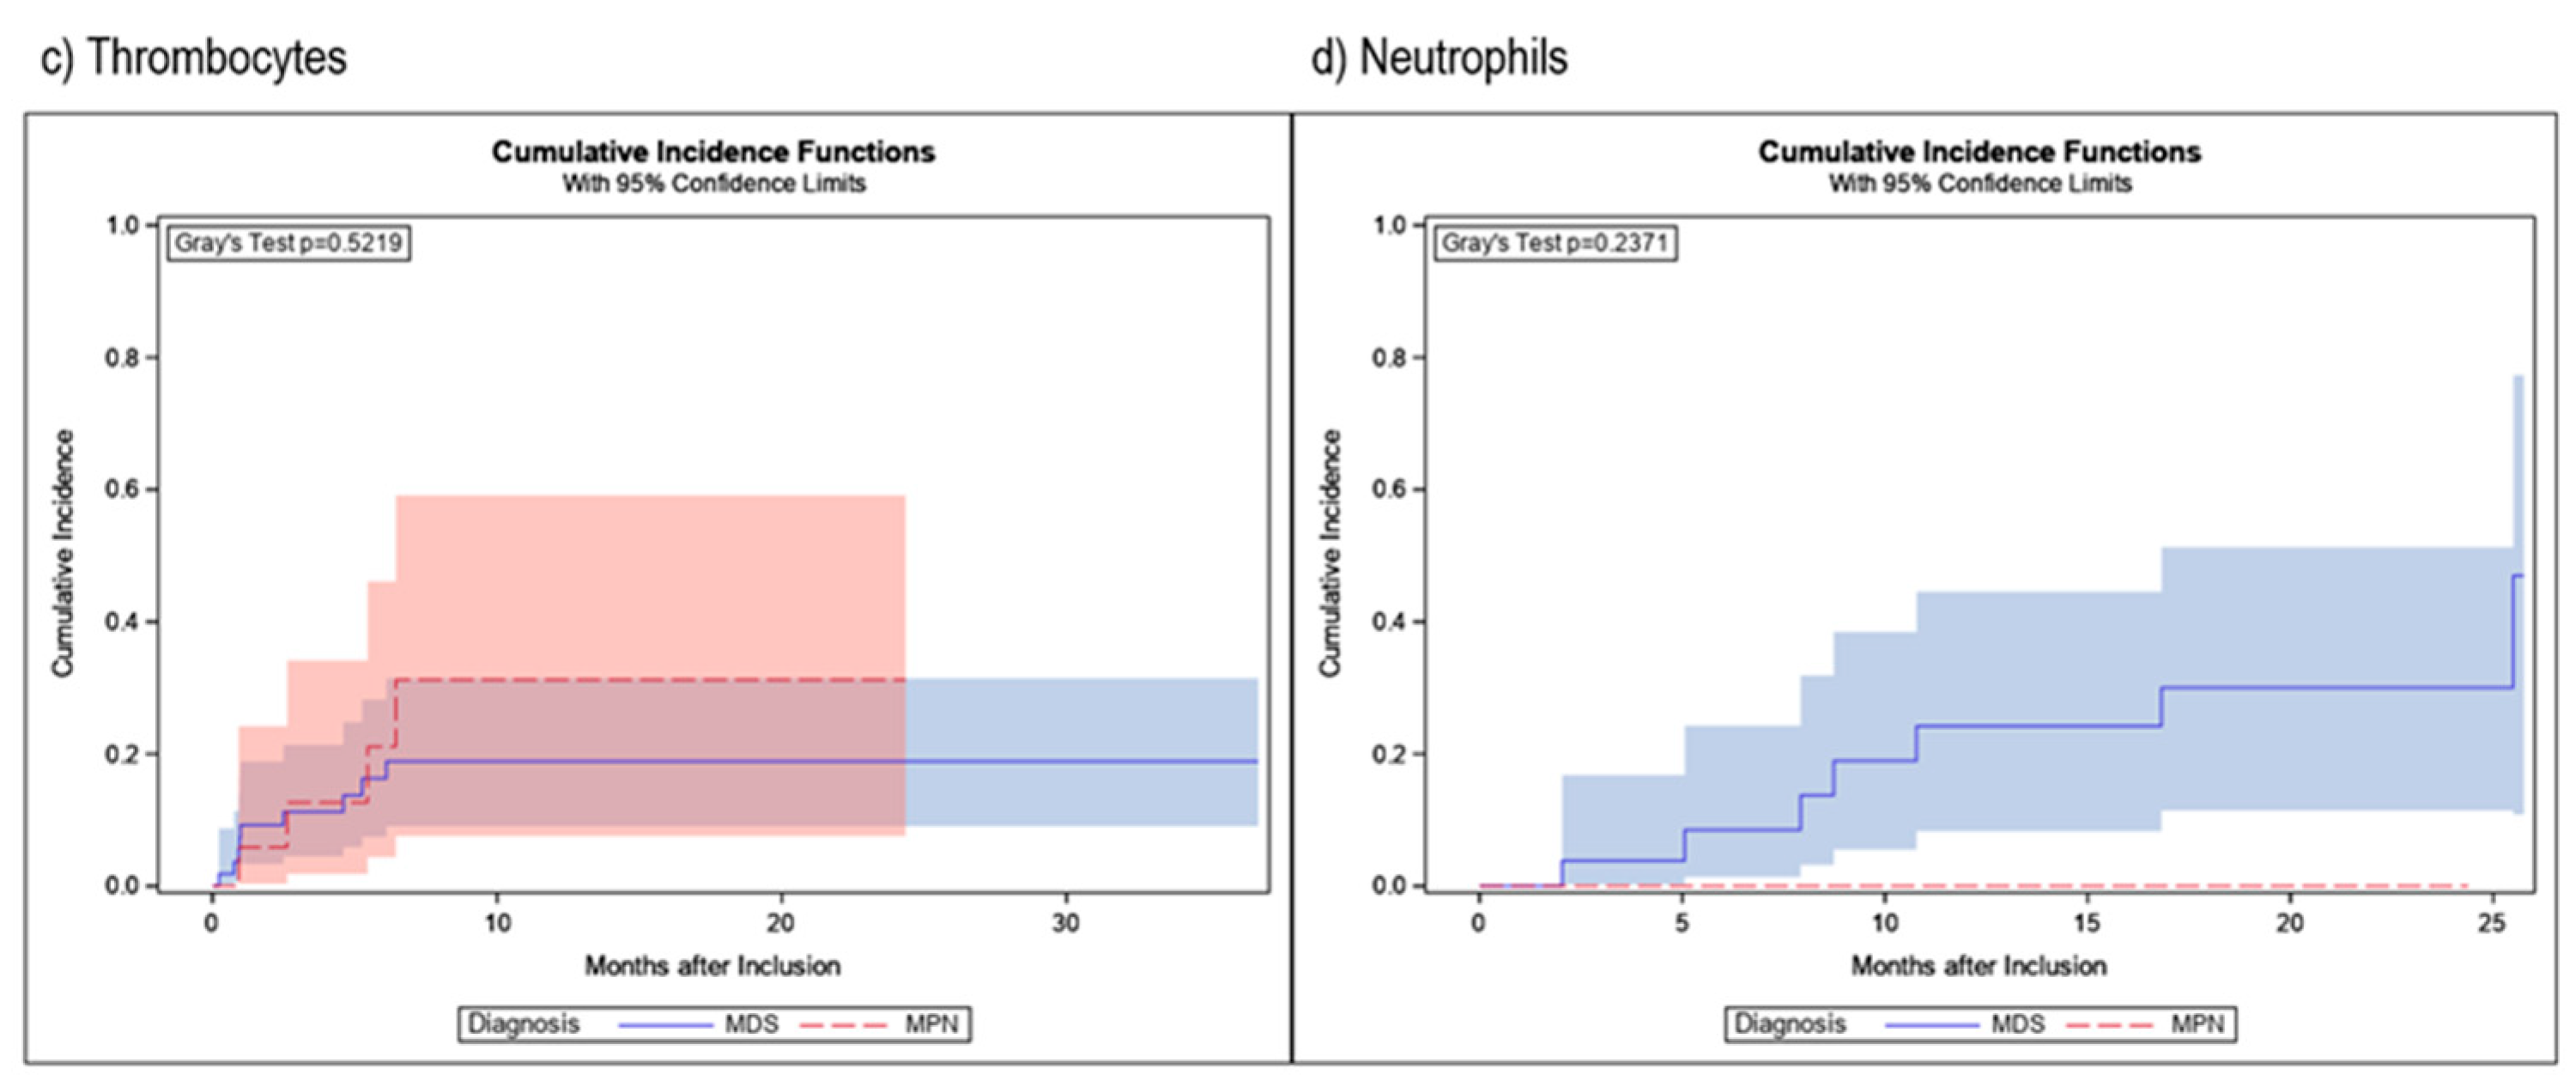

Table 1.
Patient demographics and disease characteristics.
| n=403 | |
|---|---|
| Sex | |
| Male | 240 (59.6%) |
| Female | 163 (40.4%) |
| Median age at baseline in years (range) | 75 (24 – 92) |
| Primary diagnosis | |
| MDS | 246 (61.0%) |
| MPN | 65 (16.1%) |
| Acute Leukemia | 20 (5.0%) |
| Acute myeloid leukemia (AML) | 19 (95.0%) |
| Acute lymphatic leukemia (ALL) | 1 (5.0%) |
| Lymphoma | 24 (6.0%) |
| Multiple myeloma | 10 (41.7%) |
| Non-Hodgkin lymphoma | 9 (37.5%) |
| Chronic lymphatic leukemia (CLL) | 5 (20.8%) |
| Hemoglobinopathies | 6 (1.5%) |
| Thalassemia | 5 (83.3%) |
| Sickle-cell anemia | 1 (16.7%) |
| Anemia, NOS (not MDS-related) | 16 (4.0%) |
| Solid tumor | 14 (3.5%) |
| Condition after stem cell transplantation/(radio-)chemotherapy | 6 (1.5%) |
| Other | 6 (1.5%) |
| Median time from first diagnosis to current iron chelation therapy in months (IQR) | 21.6 (8.6-50.0) |
| Patients with prior iron chelation therapy | 21 (5.2%) |
| Patients with concomitant diseases | 364 (90.3%) |
| Patients with concomitant medication | 379 (94.0%) |
| Transfusions | |
| Receipt of any transfusions before NIS entry | 400 (99.3%) |
| Median time from primary diagnosis to transfusions in months (IQR) | 2.8 (0.2-22.3) |
| Median time from start of transfusions to start of current iron chelation therapy in months (IQR) | 12.1 (5.7-24.3) |
| Number of erythrocyte concentrates since primary diagnosis until study entry | |
| 0 | 2 (0.5%) |
| <20 | 189 (46.9%) |
| 20 – 39 | 109 (27.0%) |
| 40 – 59 | 49 (12.2%) |
| 60 – 79 | 15 (3.7%) |
| ≥80 | 22 (5.5%) |
| Unknown | 17 (4.2%) |
Abbreviations: IQR: Interquartile range, MDS: Myelodysplastic syndrome, MPN: Myeloproliferative neoplasm, NIS: Non-interventional study, SD: Standard deviation.
Table 2.
Specification of MDS/MPN.
| Specification of MDS | n=246 |
|---|---|
| MDS-SLD | 17 (6.9%) |
| MDS-SLD-RS | 30 (12.2%) |
| MDS-MLD | 48 (19.5%) |
| MDS-MLD-RS | 20 (8.1%) |
| MDS del(5q) | 10 (4.1%) |
| MDS-EB I | 32 (13.0%) |
| MDS-EB II | 24 (9.8%) |
| MDS-U | 30 (12.2%) |
| CMML | 9 (3.7%) |
| MDS/MPN | 19 (7.7%) |
| MDS/MPN-RS | 7 (2.8%) |
| Specification of MPN | n=65 |
| PMF | 41 (63.1%) |
| MPN-U | 14 (21.5%) |
| ET | 10 (15.4%) |
Abbreviations: Abbreviations: EB: Excess blasts, ET: Essential thrombocythemia, MDS: Myelodysplastic syndrome, MLD: Multi-lineage dysplasia, MPN: Myeloproliferative neoplasm, PMF: Primary myelofibrosis, RS: Ring sideroblasts, SLD: Single-lineage dysplasia, U: Unclassifiable.
Table 3.
Treatment changes.
| n=403 | |
|---|---|
| Number of patients with one treatment change | 48 (11.9%) |
| deferasirox DT to deferasirox FCT | 40 (83.3%) |
| deferasirox FCT to deferasirox DT | 3 (6.3%) |
| deferasirox FCT to deferoxamine | 3 (6.3%) |
| deferoxamine to deferasirox DT | 1 (2.1%) |
| deferoxamine to deferasirox FCT | 1 (2.1%) |
| Number of patients with two treatment changes | 4 (1.0%) |
Abbreviations: DT: Dispersible tablet, FCT: Film coated tablet.
Table 4.
Incidences of AEs/SAEs/SADRs.
| n=418 | |
|---|---|
| Patients with AEs | 387 (92.6%) |
| Patients with non-serious AEs | 256 (61.2%) |
| Patients without AEs | 31 (7.4%) |
| Patients with SAEs | 270 (64.6%) |
| Patients with non-serious ADRs | 220 (52.6%) |
| Patients with SADRs | 86 (20.6%) |
AE: Adverse event, ADR: Adverse drug reaction, SADR: Serious adverse drug reaction, SAE: Serious adverse event.
Table 5.
Most common patient based (S)AEs and (S)ADRs.
| Total | nsAE | SAE | nsADR | SADR | |
|---|---|---|---|---|---|
| n=418 | n=256 | n=270 | n=220 | n=86 | |
| General disorders and administration site conditions | 202 (48.3%) | 109 (42.6%) | 82 (30.4%) | 53 (24.1%) | 11 (12.8%) |
|
51 (12.2%) | 17 (6.6%) | 25 (9.3%) | 7 (3.2%) | 3 (3.5%) |
|
41 (9.8%) | 31 (12.1%) | 2 (0.7%) | 8 (3.6%) | 1 (1.2%) |
|
36 (8.6%) | 16 (6.3%) | 18 (6.7%) | 4 (1.8%) | 0 (0.0%) |
|
23 (5.5%) | 17 (6.6%) | 2 (0.7%) | 4 (1.8%) | 0 (0.0%) |
|
19 (4.5%) | 0 (0.0%) | 16 (5.9%) | 0 (0.0%) | 3 (3.5%) |
| Gastrointestinal disorders | 187 (44.7%) | 80 (31.3%) | 44 (16.3%) | 113 (51.4%) | 16 (18.6%) |
|
82 (19.6%) | 22 (8.6%) | 4 (1.5%) | 57 (25.9%) | 6 (7.0%) |
|
50 (12.0%) | 26 (10.2%) | 3 (1.1%) | 22 (10.0%) | 3 (3.5%) |
|
28 (6.7%) | 12 (4.7%) | 1 (0.4%) | 14 (6.4%) | 1 (1.2%) |
| Infections and infestations | 151 (36.1%) | 71 (27.7%) | 105 (38.9%) | 5 (2.3%) | 7 (8.1%) |
|
34 (8.1%) | 0 (0.0%) | 34 (12.6%) | 0 (0.0%) | 0 (0.0%) |
|
26 (6.2%) | 12 (4.7%) | 17 (6.3%) | 0 (0.0%) | 0 (0.0%) |
|
23 (5.5%) | 21 (8.2%) | 2 (0.7%) | 0 (0.0%) | 0 (0.0%) |
| Investigations | 141 (33.7%) | 43 (16.8%) | 44 (16.3%) | 72 (32.7%) | 25 (29.1%) |
|
41 (9.8%) | 7 (2.7%) | 0 (0.0%) | 29 (13.2%) | 7 (8.1%) |
|
36 (8.6%) | 7 (2.7%) | 21 (7.8%) | 7 (3.2%) | 6 (7.0%) |
|
17 (4.1%) | 2 (0.8%) | 0 (0.0%) | 14 (6.4%) | 1 (1.2%) |
| Respiratory, thoracic and mediastinal disorders | 93 (22.2%) | 67 (26.2%) | 31 (11.5%) | 6 (2.7%) | 3 (3.5%) |
|
32 (7.7%) | 25 (9.8%) | 7 (2.6%) | 1 (0.5%) | 0 (0.0%) |
|
24 (5.7%) | 18 (7.0%) | 5 (1.9%) | 1 (0.5%) | 0 (0.0%) |
| Musculoskeletal and connective tissue disorders | 74 (17.7%) | 52 (20.3%) | 15 (5.6%) | 11 (5.0%) | 0 (0.0%) |
|
15 (3.6%) | 13 (5.1%) | 2 (0.7%) | 0 (0.0%) | 0 (0.0%) |
| Neoplasms benign, malignant and unspecified | 73 (17.5%) | 1 (0.4%) | 68 (25.2%) | 0 (0.0%) | 6 (7.0%) |
|
24 (5.7%) | 0 (0.0%) | 23 (8.5%) | 0 (0.0%) | 1 (1.2%) |
|
24 (5.7%) | 0 (0.0%) | 20 (7.4%) | 0 (0.0%) | 4 (4.7%) |
|
19 (4.5%) | 0 (0.0%) | 17 (6.3%) | 0 (0.0%) | 2 (2.3%) |
| Nervous system disorders | 70 (16.7%) | 39 (15.2%) | 24 (8.9%) | 16 (7.3%) | 3 (3.5%) |
|
39 (9.3%) | 26 (10.2%) | 4 (1.5%) | 10 (4.5%) | 2 (2.3%) |
| Blood and lymphatic system disorders | 66 (15.8%) | 15 (5.9%) | 43 (15.9%) | 6 (2.7%) | 12 (14.0%) |
|
25 (6.0%) | 0 (0.0%) | 19 (7.0%) | 0 (0.0%) | 6 (7.0%) |
| Skin and subcutaneous tissue disorders | 60 (14.4%) | 30 (11.7%) | 6 (2.2%) | 22 (10.0%) | 7 (8.1%) |
| Injury, poisoning and procedural complications | 50 (12.0%) | 21 (8.2%) | 22 (8.1%) | 10 (4.5%) | 2 (2.3%) |
| Renal and urinary disorders | 49 (11.7%) | 9 (3.5%) | 20 (7.4%) | 8 (3.6%) | 15 (17.4%) |
|
14 (3.3%) | 0 (0.0%) | 4 (1.5%) | 0 (0.0%) | 10 (11.6%) |
| Cardiac disorders | 45 (10.8%) | 3 (1.2%) | 41 (15.2%) | 3 (1.4%) | 3 (3.5%) |
| Metabolism and nutrition disorders | 43 (10.3%) | 26 (10.2%) | 12 (4.4%) | 8 (3.6%) | 2 (2.3%) |
| Vascular disorders | 36 (8.6%) | 20 (7.8%) | 17 (6.3%) | 2 (0.9%) | 0 (0.0%) |
| Psychiatric disorders | 23 (5.5%) | 19 (7.4%) | 4 (1.5%) | 1 (0.5%) | 0 (0.0%) |
| Hepatobiliary disorders | 17 (4.1%) | 3 (1.2%) | 9 (3.3%) | 0 (0.0%) | 6 (7.0%) |
AE: Adverse event, nsADR: non-serious adverse drug reaction, nsAE: non-serious adverse event, SADR: Serious adverse drug reaction, SAE: Serious adverse event.
Table 6.
Hematologic response in patients evaluable for analyses.
| MDS | MPN | |
|---|---|---|
| Hemoglobin | ||
| Patients analyzed | 213 | 45 |
| Response | 21 | 3 |
|
6 | 0 |
| Death without response | 46 | 11 |
| Transfusions | ||
| Patients analyzed | 124 | 21 |
| Response | 15 | 4 |
|
7 | 1 |
| Death without response | 30 | 5 |
| Platelets | ||
| Patients analyzed | 58 | 18 |
| Response | 9 | 4 |
|
3 | 0 |
| Death without response | 18 | 5 |
| Neutrophils | ||
| Patients analyzed | 30 | 4 |
| Response | 7 | 0 |
|
0 | 0 |
| Death without response | 8 | 1 |
Abbreviations: MDS: Myelodysplastic syndrome, MLD: Multi-lineage dysplasia, MPN: Myeloproliferative neoplasm.
Disclaimer/Publisher’s Note: The statements, opinions and data contained in all publications are solely those of the individual author(s) and contributor(s) and not of MDPI and/or the editor(s). MDPI and/or the editor(s) disclaim responsibility for any injury to people or property resulting from any ideas, methods, instructions or products referred to in the content. |
© 2023 by the authors. Licensee MDPI, Basel, Switzerland. This article is an open access article distributed under the terms and conditions of the Creative Commons Attribution (CC BY) license (http://creativecommons.org/licenses/by/4.0/).
Copyright: This open access article is published under a Creative Commons CC BY 4.0 license, which permit the free download, distribution, and reuse, provided that the author and preprint are cited in any reuse.
Submitted:
18 September 2023
Posted:
20 September 2023
You are already at the latest version
Alerts
A peer-reviewed article of this preprint also exists.
This version is not peer-reviewed
Submitted:
18 September 2023
Posted:
20 September 2023
You are already at the latest version
Alerts
Abstract
Myelodysplastic syndromes and myeloproliferative neoplasms both represent hematologic diseases associated with bone marrow failure often resulting in anemia. For those patients, transfusion of red blood cell (RBC) units is essential, but results in iron overload (IOL) that may affect various organ functions. Therefore, iron chelation therapy plays a major role in anemic patients, not only because it reduces IOL, but also because it may improve hematopoietic function by increasing hemoglobin or diminishing requirement of RBC transfusions. To assess the utility, efficacy and safety of the different iron chelation medication approved in Germany as well as to examine the effect of chelation on hematopoietic insufficiency, a prospective, multicenter, non-interventional study named EXCALIBUR was designed. In total, 502 patients from 106 German hospitals and medical practices were enrolled. A large proportion of patients switched from deferasirox dispersible tablet to deferasirox film-coated tablet, mainly due to more convenient application which was reflected in the treatment satisfaction questionnaire for medication scores. Iron chelation was effective in lowering serum ferritin levels, with the observed adverse drug reactions being in line with the known safety profile. Hematologic response occurred in a few patients, comparable to other studies that examined hematologic improvement in patients with MDS.
Keywords:
Subject: Medicine and Pharmacology - Hematology
1. Introduction
Myelodysplastic syndromes (MDS) and myeloproliferative neoplasms (MPN) both represent hematologic diseases associated with bone marrow failure eventually resulting in cytopenia. Clinically, anemia is one of the leading problems in MDS and in part MPN patients, and transfusion of red blood cell (RBC) units is essential but results in iron overload (IOL). Physiologically, the human body requires a certain amount of iron for important cellular processes such as energy acquisition or oxygen transport [1]. Unfortunately, no physiological mechanism exists to dispose of excess iron. Iron overload increases the level of oxidative stress via an increase of chronic exposure to non-transferrin-bound iron, leading to damage of macromolecules like DNA, proteins, or lipids [2]. In MDS patients, IOL is already present before patients become transfusion dependent because ineffective erythropoiesis suppresses the production of hepcidin in the liver, resulting in unregulated iron uptake in the intestine [3,4]. Nonetheless, chronic transfusion therapy is the most important cause of iron overload in patients with MDS [5]. Each unit of red blood cell concentrates leads to the substitution of 200 mg of iron. As an example, this causes an intake of about 20 g of iron within 2 years in patients receiving four RBC units per months [5]. As anemia leads to a significantly increased risk of death due to cardiac complications in patients with MDS, transfusion therapy is vital [5]. Because transfusion therapy is accompanied by higher iron levels and IOL means an additional cardiac risk factor, this represents the vicious circle of every anemic hematologic patient with MDS or MPN, and in general for any patient with chronic transfusion need, e.g. due to thalassemia. However, not only cardiac iron overload is detectable after transfusion of multiple RBC units, but other organs are affected from iron overload as well, such as the liver and the endocrine glands. Thus, IOL may cause heart failure and arrhythmias as well as liver fibrosis and cirrhosis, diabetes mellitus and hypothyroidism [1]. Furthermore, IOL might result in genomic instability, thereby possibly encouraging clonal evolution towards leukemia [5]. Therefore, iron chelation therapy (ICT) plays a major role in anemic patients, not only because it reduces IOL, but also because it may improve hematopoietic function by increasing hemoglobin or diminishing requirement of RBC transfusions [2]. There are different iron chelators available in Germany, concomitant with different ways of application. For several decades, only intravenous or subcutaneous deferoxamin (Desferal®) was available, followed by deferasirox (Exjade®) as a dispersible tablet (DT) with the need to disperse into a suspension prior to consumption. During the course of the study discussed here, deferasirox became available as a film-coated tablet (FCT) formulation that just needs to be swallowed [6], which is meanwhile the only formulation of deferasirox available in Germany. For patients with thalassaemia major, the iron chelator deferiprone (Ferriprox®) is available as FCT or solution for oral administration, as a monotherapy or in combination with another iron chelator. Deferiprone is used in exceptional cases (e.g., if there is a contra-indication for deferasirox) in other relevant indications, such as MDS, too. All of these drugs may lead to a decrease in serum ferritin levels via elevated elimination of iron through feces while showing a favorable profile of side effects. The exact percentage distribution of the choice of treatment in Germany is unknown. Quantification of IOL in clinical daily practice is measured via patients’ serum ferritin and treatment is mostly initiated when serum ferritin levels are higher than 1000 µg/l and repetitive RBC transfusions are necessary. A dose-dependent impact of IOL on overall survival of patients has been demonstrated for this serum ferritin threshold, observing a 30% higher risk of death for each 500 µg/l increase in serum ferritin above 1000 µg/l [7]. Furthermore, a large retrospective analysis showed that IOL was a significant prognostic factor not only for OS, but also for leukemia-free survival in MDS [8]. To assess the utility, efficacy and safety of the iron chelation medication approved in Germany, a prospective, multicenter, non-interventional study producing real-world data named EXCALIBUR was designed (NCT05440487; CICL670ADE14; funded by Novartis). Additionally, the effect of chelation on hematopoietic insufficiency was examined.
2. Materials and Methods
EXCALIBUR was a prospective, multicenter, non-interventional study assessing iron chelation therapy in patients with chronic iron overload. Male and female adult patients suffering from chronic iron overload who never received an iron chelator, who received an iron chelation therapy for less than 6 months, or who interrupted an iron chelation therapy for longer than 6 months were included. In total, 502 patients from 106 German hospitals and medical practices for hematology and oncology, who met the inclusion criteria and signed the written informed consent, were enrolled. The entire duration of the study was approximately 6 years. Treatment with iron chelators did not follow a pre-defined protocol, but was administered according to routine medical practice. The observation period was 24 months for patients without a change of iron chelator and was extended by 24 months if the iron chelator was changed. Follow-up visits were documented after 1, 3, 6, 9, 12 and 18 months, with a final visit after 24 months or at the end of the observation phase, whichever occurred first. In- and exclusion criteria were based on the summary of product characteristics of the respective iron chelator, i.e. deferasirox DT, deferasirox FCT, and deferoxamine. Patients’ general satisfaction with all approved iron chelators in everyday life was assessed using the treatment satisfaction questionnaire for medication (TSQM-14), after approx. 1 and 3 months. Data were collected via an eCRF by the treating physician or authorized personnel. Statistical analyses were performed using the software package SAS release 9.4. Continuous data were described by the number of patients in the respective population, non-missing and missing values, mean, standard deviation, median, and interquartile range. Categorical data including categories of continuous data were presented in frequency tables containing absolute and relative frequencies. For the hematological response analyses, patients’ cumulative incidences of the respective response were estimated considering death without response as a competing risk. Analysis of hematological response regarding erythroid, platelet and neutrophil response followed the criteria of the international working group (IWG) [9]. Those patients who had already fulfilled the response criteria at baseline or who were not evaluable at that time were excluded from hematological response analyses. For the analyses of changes in hematological parameters, mixed linear regression models were estimated.
3. Results
Overall, 502 patients were enrolled in the study database, with 418 patients in the safety analysis set (SAF), 403 patients in the full analysis set (FAS), and 266 patients in the hematological response analysis set (HRAS). Reasons for exclusion from the different analysis sets are shown in Figure 1. Of the 106 registered study sites, 101 sites had at least one patient included in the SAF and 98 sites had at least one patient included in the FAS. Median age of patients at baseline was 75 years (ranging from 24 to 92) with a higher proportion of males (59.6%). Patient demographics and disease characteristics are shown in Table 1. The most common hematologic diagnosis was MDS (61.0%), followed by MPN (16.1%). Subtypes of MDS and MPN diagnoses are shown in Table 2, with MDS with multilineage dysplasia (MDS-MLD, 19.5%), MDS with excess of blasts I (MDS-EB I, 13%), and MDS with single lineage dysplasia and ringsideroblasts (MDS-SLD-RS, 12.2%) being the most frequent subtypes of MDS, and primary myelofibrosis for MPN (63.1% of MPN patients). The median time from first diagnosis to current iron chelation therapy was 21.6 months (with an interquartile range of 8.6 to 50 months), and only 5.2% of patients had iron chelation therapy prior to study inclusion. The vast majority of patients had concomitant diseases like hypertension (50.4%), coronary artery disease (11.9%) or diabetes (10.2%), as well as concomitant medication (94.0%). The median time from primary diagnosis to receiving transfusions was 2.8 months (interquartile range 8.6 to 50 months), and the median time from start of transfusions to start of current iron chelation therapy was 12.1 months. More than 95% of patients had received at least one red blood cell transfusion prior to study entry, while most of the patients had received less than 20 erythrocyte concentrates (47.3%) prior to study entry.
3.1. Use and switching of iron chelators
267 patients started with deferasirox FCT (66.3%), while 111 patients received deferasirox DT (27.5%), and 25 patients received deferoxamine (6.2%). During the entire observation period, 310 patients were treated with deferasirox FCT (76.9%), 116 patients with deferasirox DT (28.8%), and 30 patients with deferoxamine (7.4%). The mean time to premature discontinuation of treatment was approximately 9 months, and 77.9% of patients discontinued prematurely. This was similar for patients who were last treated with deferasirox FCT and deferoxamine. Notably, 93.2% of the 74 patients who were last treated with deferasirox DT discontinued their treatment prematurely. The main reasons for premature discontinuation were AEs (29.9%) and death (28.3%) with a median time to premature discontinuation of 200 days. Reason for treatment initiation was a high serum ferritin value of more than 1000 ng/ml in 90.8% of cases followed by transfusion of more than 20 red blood cell units in 30.3% of patients. The frequencies of treatment changes are shown in Table 3. Overall, 11.9% of patients had treatment changed once, most of them from deferasirox DT to deferasirox FCT. Only four patients changed iron chelator twice. The most commonly reported reason for treatment change was intricate application (48.8%). After end of study, all 89 patients without premature discontinuation continued the same treatment. The mean ± SD initial daily dose of the start treatment deferasirox DT was 11.7 ± 6.29 mg/kg, while for deferasirox FCT it was 13.1 ± 6.77 mg/kg. The initial daily dose of deferoxamine was 25.6 ± 10.22 mg/kg. The mean ± SD difference of initial vs. last dose of start treatment was +1.3 ± 4.13 mg/kg for deferasirox DT, +0.7 ± 5.77 mg/kg for deferasirox FCT, and +6.2 ± 15.36 mg/kg for deferoxamine. The mean ± SD number of dosage adjustments per patient was 0.8 ± 1.38 (n=116) for deferasirox DT, 1.1 ± 1.41 (n=310) for deferasirox FCT, and 1.2 ± 1.76 (n=30) for deferoxamine.
3.2. General satisfaction with iron chelation treatment
The general satisfaction with iron chelation treatment was measured with the standardized patient questionnaire TSQM-14, which consisted of 14 questions assigned to 4 subscales. The questionnaire was answered at month 1 and month 3 of the initial treatment, and again at month 1 and month 3 after treatment change, if applicable. The median (IQR) overall satisfaction score was 68.1 (50.0-77.8) points (n=224) at month 1, and 63.9 (50.0-77.8) points (n=181) at month 3 of the initial treatment. After treatment change, the score reached 73.6 (52.8-87.5) points (n=16) at month 1 and 80.6 (47.2-91.7) points (n=18) at month 3. The differences show a tendency towards a higher satisfaction after treatment change and even higher satisfaction after two months following the change, but this was statistically not relevant.
3.3. Safety
The vast majority of patients experienced AEs (92.6%) and around two-thirds of patients experienced serious AEs (SAEs). For around 50% of patients, non-serious events were assessed to have a suspected causal relationship with the respective treatment, thus they were classified as adverse drug reactions (ADRs), and 20.6% of patients had serious ADRs (SADRs) (Table 4). Overall, the most common non-serious AEs (nsAEs) were fatigue (12.1% of patients with nsAEs), dizziness, and nausea (10.2% each). The most common serious AEs (SAEs) were pneumonia (12.6% of patients with SAEs) and general physical health deterioration (9.3%). The most common non-serious adverse drug reactions (nsADRs) were diarrhoea (25.9% of patients with nsADRs), increase of blood creatinine (13.2%), and nausea (10.0%). The most common serious adverse drug reactions (SADRs) were renal failure (11.6% of patients with SADRs) and increase of blood creatinine (8.1%). Detailed listing of the most common patient based (S)AEs and (S)ADRs are shown in Table 5.
3.4. Effectiveness and transfusion dependence
The median serum ferritin value decreased notably throughout treatment, with 1802.50 µg/l at baseline and 1240.50 µg/l at month 24. The median change from baseline at month 24 was -458.0 µg/l, the change from baseline throughout treatment is shown in Figure 2. At baseline, patients had received a median of 4 (IQR: 3-8) erythrocyte concentrates within the last 8 weeks. At all subsequent visits throughout the initial treatment, patients had received a median of 6 erythrocyte concentrates within the last 8 weeks.
3.5. Hematological Response
Changes in blood parameters were estimated based on mixed linear models using the time as independent variable and the patient as random. Cumulative incidence at 24 months for hemoglobin response was 15.2% (95%CI: 9.6-22.0%) for MDS patients and 9.3% (95%CI: 2.3-22.4%) for MPN patients with increasing mean hemoglobin values from 8.3 (95% CI: 8.2-8.5) to 8.9 (95% CI: 8.5-9.2) g/dl for MDS patients, and from 8.3 (95% CI: 8.0-8.7) to 8.9 (95% CI: 8.4-9.3) g/dl for MPN patients. Cumulative incidence at 24 months for transfusion response was 16.3% (95%CI: 9.4-24.8%) for MDS patients and 23.1% (95%CI: 6.4-45.9%) for MPN patients. Mean platelet values decreased from 145.4 (95% CI: 127-166) to 103.4 (95% CI: 85-125) x 103/µl for MDS patients and from 112.7 (95% CI: 84-151) to 80.2 (95% CI: 58-111) x 103/µl for MPN patients. Nonetheless, 24-month cumulative incidences of platelet response were 18.9% (95%CI: 9.1-31.5%) for MDS patients and 31.2% (95%CI: 7.6-59.1%) for MPN patients. Cumulative incidence at 24 months for neutrophil response was 30.0% (95%CI: 11.4-51.3%) for MDS patients, while none was observed in the MPN patients, with mean neutrophil values that increased from 3.0 (95% CI: 2.8-3.3) to 3.4 (95% CI: 2.9-3.9) x 103/µl for MDS patients, and from 5.3 (95% CI: 4.3-6.5) to 5.9 (95% CI: 4.7-7.5) x 103/µl for MPN patients (Table 6). Cumulative incidences of hematological responses as well as cumulative incidence curves regarding time to hematological response are shown in Table 6 and Figure 3. We observed 30 responses regarding hemoglobin, of whom six were lost during the observation time. 8 out of 19 patients who showed transfusion response lost that response during the course of the study, while 3 out of 13 patients lost their response regarding transfusions. All patients who showed neutrophil response maintained that response until the end of the observational period.
4. Discussion
EXCALIBUR was a prospective, non-interventional study that was performed under conditions of clinical daily practice in Germany, thereby allowing the enrollment of a heterogeneous patient population with regard to demographic and disease characteristics. The inclusion of patients with various diagnoses treated with three different iron chelators represented a realistic population and the observational design of the study allowed the collection of real-life data without influencing the physicians’ treatment decisions. To minimize possible study site effects, a large number of different hospitals and medical practices were enrolled, depicting a geographically representative selection of German sites. As the study was only conducted in Germany, the generalizability of the results for other countries may be limited. Due to the observational aspect of the study, there are associated limitations like the lack of blinding and randomization, as well as a relevant amount of missing or inconsistent data. However, the overall data quality reflects a typical MDS population as well as a real-life treatment situation and provides information regarding clinical practice and patient behavior that randomized clinical trials do not obtain.
EXCALIBUR evaluated the use and application of all approved iron chelators with respect to safety, tolerability and patient satisfaction, including treatment switches as well as the effectiveness of iron chelation therapy and the hematological response in MDS/MPN patients. As the treating physician decided on the prescription of medication and inclusion of the patient in this NIS, there was a potential aspect of influencing the patients’ decisions and course of treatment, herewith introducing bias. To account for the effect of premature withdrawals and treatment changes, the data for all patients at the last completed visit were summarized in the form of a “last visit” in the analyses. The patient characteristics within the study were in line with previous studies conducted in Germany, for example the 2-year prospective observational study that aimed at describing the routine use of DFX in patients with hematological malignancies by Nolte et al. [10].
One main objective of our study was to assess the use of approved iron chelators in Germany under real-life conditions. Deferasirox DT was released in Germany in 2006 as a more convenient alternative to deferoxamine, which had to be administered parenterally. However, some subjective burden remained as deferasirox DT had to be dispersed in a relatively time-consuming procedure, taken on an empty stomach and was associated with relevant gastrointestinal side effects [11,12]. Therefore, the film-coated tablet formulation was introduced in 2016. Within EXCALIBUR, Deferasirox FCT was prescribed as initial treatment for the majority of patients, followed by deferasirox DT and deferoxamine. Deferiprone, the fourth approved iron chelator in Germany, is indicated for the treatment of iron overload in patients with thalassaemia major when current chelation therapy is contraindicated or inadequate. Due to this specific indication, only two patients had deferiprone as starting treatment and were therefore excluded from further analyses. Most patients with a documented treatment change switched from deferasirox DT to deferasirox FCT (83.3%). The main reason for this treatment change was the intricate application of deferasirox DT. Later on, deferasirox DT was no longer available, thus requiring all patients to switch.
With the TSQM-14 questionnaire, convenience was assessed with a slightly lower score by patients with deferasirox DT as starting treatment compared to the overall population. These results indicated that patients indeed preferred deferasirox FCT over deferasirox DT and deferoxamine due to the changed formulation, which is in line with the ECLIPSE study that could show consistently greater adherence and higher satisfaction for deferasirox FCT compared to deferasirox DT [13]. Patient’s satisfaction measured by the TSQM-14 questionnaire ranged between 59 and 86 points for the different subscales and start treatment groups, with the maximum score being 100 points. The overall satisfaction ranged between 61 and 72 points. There was a slight tendency towards decreasing scores from month 1 to month 3, and towards increasing scores after treatment change. Effectiveness and side effects were assessed with slightly higher scores for deferoxamine compared to the overall population, however smaller patient numbers should be considered.
The ADRs observed in this study were in line with the known safety profiles of deferasirox and deferoxamine [14,15]. Overall, the most common nsADRs were diarrhea (25.9% of patients with nsADRs) and increase of blood creatinine (13.2%). The most common SADRs were renal failure (11.6% of patients with SADRs) and again increase of blood creatinine (8.1%). This was similar for patients treated with deferasirox DT and deferasirox FCT and, in general, matches the results of the TELESTO trial, a randomized trial that assessed iron chelation in transfusion-dependent patients with low- to intermediate-1-risk myelodysplastic syndromes [16].
The main reason for initiation of iron chelation was a serum ferritin value of >1000 ng/ml. To assess the effectiveness of iron chelation therapy, serum ferritin values were repeatedly measured throughout the study. The median serum ferritin value decreased from 1802.50 µg/l at baseline to 1240.50 µg/l at month 24, the median change from baseline at month 24 was -458.0 µg/l. Persistence of elevated serum ferritin levels is most likely due to continuing transfusion dependence of the patient cohort. In the phase IIIb EPIC study, patients with MDS showed comparatively larger decreases between -115 µg/l and -976 µg/l after 1 year of treatment with deferasirox [11]. However, the comparability is limited due to different study designs and underlying patient populations. A 3-year, prospective, multicenter trial that assessed the safety and efficacy of deferasirox in low- or intermediate-1-risk MDS by List et al. documented a median serum ferritin decrease of 36.7% in patients who completed 2 years which is approximately in line with our results of EXCALIBUR [17].
For patients with MDS and MPN, hematological response was determined according to IWG criteria. In this competing risks setting, death without prior response usually had a higher probability than the achievement of a response. At 24 months, the probability of hemoglobin response was 15.2% for MDS patients and 9.3% for MPN patients. At that time, the probability of transfusion response was 16.3% for MDS and 23.1% for MPN patients. At 24 months, we estimated that 18.9% of MDS patients and 31.2% of MPN patients reached platelet response and for 30.0% of MDS patients, but for none of the MPN patients, a neutrophil response could be documented. When performing literature research, there are more than ten studies assessing the rates of hematologic improvement in patients with MDS receiving iron chelation therapy between 2012 and 2019 [18]. Compared to the post-hoc analysis of the EPIC trial for example, in which 21.5% of patients responded regarding hemoglobin, 13.0% of patients responded regarding platelets and 22% when it came to neutrophils [19], results were similar to ours except for hemoglobin response. Compared to the results of the GIMEMA MDS0306 Trial, a prospective, open-label, single-arm, multicenter trial of transfusion-dependent patients with IPSS low- or intermediate-1-risk MDS assessing the safety and efficacy of deferasirox, we could document a higher amount of neutrophil response (3% within GIMEMA), but almost the same incidence of erythroid and platelet response (11% and 15%) [20]. Within a 'real-world' report from two regional Italian registries, Maurillo et al. assessed deferasirox chelation therapy in patients with transfusion-dependent MDS with an erythroid response of 17.6% (with a 7.1% rate of RBC transfusion independence), a neutrophil response of 7.1% and a platelet response of 5.9% [21]. In summary, compared to other pro- and retrospective analyses, the results of EXCALIBUR regarding hematologic improvement/response seemed to be representative. While a matched pair analysis from the Düsseldorf MDS registry showed an improved survival in patients receiving iron chelation therapy [22], we could not give evidence concerning survival of our study population due to the observation period of only six years.
5. Conclusions
EXCALIBUR provided valuable insights into the utilization, effectiveness, safety, and patients’ satisfaction of iron chelation therapy in clinical daily practice, while additionally documenting change of iron chelator medication over time. The observational design of the study allowed the enrollment of a heterogeneous patient population with regard to demographic and disease characteristics, thereby collecting real-life data without influencing the physicians’ treatment decisions. The prospective documentation in a broad patient population with various diagnoses treated with three different iron chelators led to a high representativeness of a realistic patient population. A large proportion of patients switched from deferasirox DT to deferasirox FCT, mainly due to more convenient application being also reflected in the TSQM-14 scores. Iron chelation was effective in lowering serum ferritin levels, with the observed ADRs being in line with the known safety profile. Hematologic response occurred in a small number of patients, comparable to other studies that examined hematologic improvement in patients with MDS.
Author Contributions
Conceptualization: Ulrich Germing, Nora Schulte, Michael Lauseker and Felicitas Schulz. Methodology: Michael Lauseker. Software: Software package SAS release 9.4. Formal analysis: Michael Lauseker. Resources: Nora Schulte. Data acquisition: Sandra Ketzler-Henkel, Ulrich Hauch, Eyck van der Heyde and Michael Koenigsmann. Writing, review and editing: Felicitas Schulz, Michael Lauseker and Ulrich Germing. Project administration: Nora Schulte. All authors have read and agreed to the published version of the manuscript.
Funding
The study was funded by Novartis.
Institutional Review Board Statement
This study was conducted in accordance with the guidelines on good pharmacoepidemiological practice (GPP) of the international society for pharmacoepidemiology (ISPE 2008), the STROBE guidelines (strengthening the reporting of observational studies in epidemiology), the joint recommendation(s) of BfArM and PEI for planning, conducting and evaluating post-marketing surveillance studies, the VFA recommendations for improving the quality and transparency of non-interventional studies, the FSA Code on cooperation with healthcare professionals and with the ethical principles of the declaration of Helsinki. This study was approved by the Ethics Committee of medical faculty of Heinrich-Heine University (5222, date of approval 22.10.2019.
Informed Consent Statement
Written informed consent was obtained from all subjects involved in the study.
Data Availability Statement
The datasets used and analyzed during the current study are available from the corresponding author on reasonable request. The data are not publicly available due to ethical restrictions.
Conflicts of Interest
Ulrich Germing received speakers’ honoraria by Novartis. The other authors declare no conflicts of interest.
References
- Gattermann N, Muckenthaler MU, Kulozik AE, Metzgeroth G, Hastka J. The Evaluation of Iron Deficiency and Iron Overload. Dtsch Arztebl Int. 2021, 118, 847–856. [Google Scholar] [CrossRef]
- Steensma DP, Gattermann N. When is iron overload deleterious, and when and how should iron chelation therapy be administered in myelodysplastic syndromes? Best Pract Res Clin Haematol. 2013, 26, 431–444. [Google Scholar] [CrossRef] [PubMed]
- Santini V, Girelli D, Sanna A, Martinelli N, Duca L, Campostrini N, Cortelezzi A, Corbella M, Bosi A, Reda G, Olivieri O, Cappellini MD. Hepcidin levels and their determinants in different types of myelodysplastic syndromes. PLoS One 2011, 6, e23109. [Google Scholar] [CrossRef]
- Zipperer E, Post JG, Herkert M, Kündgen A, Fox F, Haas R, Gattermann N, Germing U. Serum hepcidin measured with an improved ELISA correlates with parameters of iron metabolism in patients with myelodysplastic syndrome. Ann Hematol. 2013, 92, 1617–1623. [Google Scholar] [CrossRef] [PubMed]
- Gattermann, N. Iron overload in myelodysplastic syndromes (MDS). Int J Hematol. 2018, 107, 55–63. [Google Scholar] [CrossRef] [PubMed]
- Taher AT, Origa R, Perrotta S, Kourakli A, Ruffo GB, Kattamis A, Goh AS, Cortoos A, Huang V, Weill M, Merino Herranz R, Porter JB. New film-coated tablet formulation of deferasirox is well tolerated in patients with thalassemia or lower-risk MDS: Results of the randomized, phase II ECLIPSE study. Am J Hematol. 2017, 92, 420–428. [Google Scholar] [CrossRef] [PubMed]
- Malcovati L, Della Porta MG, Strupp C, Ambaglio I, Kuendgen A, Nachtkamp K, Travaglino E, Invernizzi R, Pascutto C, Lazzarino M, Germing U, Cazzola M. Impact of the degree of anemia on the outcome of patients with myelodysplastic syndrome and its integration into the WHO classification-based Prognostic Scoring System (WPSS). Haematologica 2011, 96, 1433–1440. [Google Scholar] [CrossRef] [PubMed]
- Leitch, HA. Improving clinical outcome in patients with myelodysplastic syndrome and iron overload using iron chelation therapy. Leuk Res. 2007, 31, S7–S9. [Google Scholar] [CrossRef] [PubMed]
- Cheson BD, Greenberg PL, Bennett JM, Lowenberg B, Wijermans PW, Nimer SD, Pinto A, Beran M, de Witte TM, Stone RM, Mittelman M, Sanz GF, Gore SD, Schiffer CA, Kantarjian H. Clinical application and proposal for modification of the International Working Group (IWG) response criteria in myelodysplasia. Blood 2006, 108, 419–425. [Google Scholar] [CrossRef] [PubMed]
- Nolte F, Nückel H, Schmidt B, Geer T, Rubanov O, Hebart H, Jarisch A, Albrecht S, Johr C, Schumann C, Hofmann WK. Tolerability and efficacy of deferasirox in patients with transfusional iron overload: results from a German 2-year non-interventional study. J Cancer Res Clin Oncol. 2018, 144, 1531–1538. [Google Scholar] [CrossRef] [PubMed]
- Gattermann N, Finelli C, Porta MD, Fenaux P, Ganser A, Guerci-Bresler A, Schmid M, Taylor K, Vassilieff D, Habr D, Domokos G, Roubert B, Rose C; EPIC study investigators. Deferasirox in iron-overloaded patients with transfusion-dependent myelodysplastic syndromes: Results from the large 1-year EPIC study. Leuk Res. 2010, 34, 1143–1150. [Google Scholar] [CrossRef] [PubMed]
- Nolte F, Angelucci E, Beris P, Macwhannell A, Selleslag D, Schumann C, Xicoy B, Almeida A, Guerci-Bresler A, Sliwa T, Muus P, Porter J, Hofmann WK. Clinical management of gastrointestinal disturbances in patients with myelodysplastic syndromes receiving iron chelation treatment with deferasirox. Leuk Res. 2011, 35, 1131–1135. [Google Scholar] [CrossRef] [PubMed]
- Taher AT, Origa R, Perrotta S, Kourakli A, Ruffo GB, Kattamis A, Goh AS, Cortoos A, Huang V, Weill M, Merino Herranz R, Porter JB. New film-coated tablet formulation of deferasirox is well tolerated in patients with thalassemia or lower-risk MDS: Results of the randomized, phase II ECLIPSE study. Am J Hematol. 2017, 92, 420–428. [Google Scholar] [CrossRef] [PubMed]
- https://www.ema.europa.eu/en/medicines/human/EPAR/exjade.
- https://klinischeforschung.novartis.de/dokumente/fachinformationen-desferal/.
- Angelucci E, Li J, Greenberg P, Wu D, Hou M, Montano Figueroa EH, Rodriguez MG, Dong X, Ghosh J, Izquierdo M, Garcia-Manero G; TELESTO Study Investigators. Iron Chelation in Transfusion-Dependent Patients With Low- to Intermediate-1-Risk Myelodysplastic Syndromes: A Randomized Trial. Ann Intern Med. 2020, 172, 513–522. [Google Scholar] [CrossRef] [PubMed]
- List AF, Baer MR, Steensma DP, Raza A, Esposito J, Martinez-Lopez N, Paley C, Feigert J, Besa E. Deferasirox reduces serum ferritin and labile plasma iron in RBC transfusion-dependent patients with myelodysplastic syndrome. J Clin Oncol. 2012, 30, 2134–2139. [Google Scholar] [CrossRef] [PubMed]
- Leitch HA, Gattermann N. Hematologic improvement with iron chelation therapy in myelodysplastic syndromes: Clinical data, potential mechanisms, and outstanding questions. Crit Rev Oncol Hematol. 2019, 141, 54–72. [Google Scholar] [CrossRef] [PubMed]
- Gattermann N, Finelli C, Della Porta M, Fenaux P, Stadler M, Guerci-Bresler A, Schmid M, Taylor K, Vassilieff D, Habr D, Marcellari A, Roubert B, Rose C. Hematologic responses to deferasirox therapy in transfusion-dependent patients with myelodysplastic syndromes. Haematologica 2012, 97, 1364–1371. [Google Scholar] [CrossRef] [PubMed]
- Angelucci E, Santini V, Di Tucci AA, Quaresmini G, Finelli C, Volpe A, Quarta G, Rivellini F, Sanpaolo G, Cilloni D, Salvi F, Caocci G, Molteni A, Vallisa D, Voso MT, Fenu S, Borin L, Latte G, Alimena G, Storti S, Piciocchi A, Fazi P, Vignetti M, Tura S. Deferasirox for transfusion-dependent patients with myelodysplastic syndromes: safety, efficacy, and beyond (GIMEMA MDS0306 Trial). Eur J Haematol. 2014, 92, 527–536. [Google Scholar] [CrossRef] [PubMed]
- Maurillo L, Breccia M, Buccisano F, Voso MT, Niscola P, Trapè G, Tatarelli C, D'Addosio A, Latagliata R, Fenu S, Piccioni AL, Fragasso A, Aloe Spiriti MA, Refrigeri M, Criscuolo M, Musto P, Venditti A. Deferasirox chelation therapy in patients with transfusion-dependent MDS: a 'real-world' report from two regional Italian registries: Gruppo Romano Mielodisplasie and Registro Basilicata. Eur J Haematol. 2015. [CrossRef]
- Neukirchen J, Fox F, Kündgen A, Nachtkamp K, Strupp C, Haas R, Germing U, Gattermann N. Improved survival in MDS patients receiving iron chelation therapy - a matched pair analysis of 188 patients from the Düsseldorf MDS registry. Leuk Res. 2012, 36, 1067–1070. [Google Scholar] [CrossRef] [PubMed]
Figure 1.
Analysis sets. Abbreviations: FAS = Full analysis set, HRAS = Hematological response analysis set, SAF = Safety analysis set.
Figure 1.
Analysis sets. Abbreviations: FAS = Full analysis set, HRAS = Hematological response analysis set, SAF = Safety analysis set.
Figure 2.
Course of serum ferritin values by study months (M1-M24). Gray area shows IQR. Abbreviations: IQR: Interquartile range, M: Month, n: Number of patients with observation.
Figure 2.
Course of serum ferritin values by study months (M1-M24). Gray area shows IQR. Abbreviations: IQR: Interquartile range, M: Month, n: Number of patients with observation.
Figure 3.
Course Time to hematological response (cumulative incidence curves) of hemoglobin, transfusions, platelets and neutrophils by study months (M1-M24). Coloured areas show IQR.
Figure 3.
Course Time to hematological response (cumulative incidence curves) of hemoglobin, transfusions, platelets and neutrophils by study months (M1-M24). Coloured areas show IQR.
Table 1.
Patient demographics and disease characteristics.
| n=403 | |
|---|---|
| Sex | |
| Male | 240 (59.6%) |
| Female | 163 (40.4%) |
| Median age at baseline in years (range) | 75 (24 – 92) |
| Primary diagnosis | |
| MDS | 246 (61.0%) |
| MPN | 65 (16.1%) |
| Acute Leukemia | 20 (5.0%) |
| Acute myeloid leukemia (AML) | 19 (95.0%) |
| Acute lymphatic leukemia (ALL) | 1 (5.0%) |
| Lymphoma | 24 (6.0%) |
| Multiple myeloma | 10 (41.7%) |
| Non-Hodgkin lymphoma | 9 (37.5%) |
| Chronic lymphatic leukemia (CLL) | 5 (20.8%) |
| Hemoglobinopathies | 6 (1.5%) |
| Thalassemia | 5 (83.3%) |
| Sickle-cell anemia | 1 (16.7%) |
| Anemia, NOS (not MDS-related) | 16 (4.0%) |
| Solid tumor | 14 (3.5%) |
| Condition after stem cell transplantation/(radio-)chemotherapy | 6 (1.5%) |
| Other | 6 (1.5%) |
| Median time from first diagnosis to current iron chelation therapy in months (IQR) | 21.6 (8.6-50.0) |
| Patients with prior iron chelation therapy | 21 (5.2%) |
| Patients with concomitant diseases | 364 (90.3%) |
| Patients with concomitant medication | 379 (94.0%) |
| Transfusions | |
| Receipt of any transfusions before NIS entry | 400 (99.3%) |
| Median time from primary diagnosis to transfusions in months (IQR) | 2.8 (0.2-22.3) |
| Median time from start of transfusions to start of current iron chelation therapy in months (IQR) | 12.1 (5.7-24.3) |
| Number of erythrocyte concentrates since primary diagnosis until study entry | |
| 0 | 2 (0.5%) |
| <20 | 189 (46.9%) |
| 20 – 39 | 109 (27.0%) |
| 40 – 59 | 49 (12.2%) |
| 60 – 79 | 15 (3.7%) |
| ≥80 | 22 (5.5%) |
| Unknown | 17 (4.2%) |
Abbreviations: IQR: Interquartile range, MDS: Myelodysplastic syndrome, MPN: Myeloproliferative neoplasm, NIS: Non-interventional study, SD: Standard deviation.
Table 2.
Specification of MDS/MPN.
| Specification of MDS | n=246 |
|---|---|
| MDS-SLD | 17 (6.9%) |
| MDS-SLD-RS | 30 (12.2%) |
| MDS-MLD | 48 (19.5%) |
| MDS-MLD-RS | 20 (8.1%) |
| MDS del(5q) | 10 (4.1%) |
| MDS-EB I | 32 (13.0%) |
| MDS-EB II | 24 (9.8%) |
| MDS-U | 30 (12.2%) |
| CMML | 9 (3.7%) |
| MDS/MPN | 19 (7.7%) |
| MDS/MPN-RS | 7 (2.8%) |
| Specification of MPN | n=65 |
| PMF | 41 (63.1%) |
| MPN-U | 14 (21.5%) |
| ET | 10 (15.4%) |
Abbreviations: Abbreviations: EB: Excess blasts, ET: Essential thrombocythemia, MDS: Myelodysplastic syndrome, MLD: Multi-lineage dysplasia, MPN: Myeloproliferative neoplasm, PMF: Primary myelofibrosis, RS: Ring sideroblasts, SLD: Single-lineage dysplasia, U: Unclassifiable.
Table 3.
Treatment changes.
| n=403 | |
|---|---|
| Number of patients with one treatment change | 48 (11.9%) |
| deferasirox DT to deferasirox FCT | 40 (83.3%) |
| deferasirox FCT to deferasirox DT | 3 (6.3%) |
| deferasirox FCT to deferoxamine | 3 (6.3%) |
| deferoxamine to deferasirox DT | 1 (2.1%) |
| deferoxamine to deferasirox FCT | 1 (2.1%) |
| Number of patients with two treatment changes | 4 (1.0%) |
Abbreviations: DT: Dispersible tablet, FCT: Film coated tablet.
Table 4.
Incidences of AEs/SAEs/SADRs.
| n=418 | |
|---|---|
| Patients with AEs | 387 (92.6%) |
| Patients with non-serious AEs | 256 (61.2%) |
| Patients without AEs | 31 (7.4%) |
| Patients with SAEs | 270 (64.6%) |
| Patients with non-serious ADRs | 220 (52.6%) |
| Patients with SADRs | 86 (20.6%) |
AE: Adverse event, ADR: Adverse drug reaction, SADR: Serious adverse drug reaction, SAE: Serious adverse event.
Table 5.
Most common patient based (S)AEs and (S)ADRs.
| Total | nsAE | SAE | nsADR | SADR | |
|---|---|---|---|---|---|
| n=418 | n=256 | n=270 | n=220 | n=86 | |
| General disorders and administration site conditions | 202 (48.3%) | 109 (42.6%) | 82 (30.4%) | 53 (24.1%) | 11 (12.8%) |
|
51 (12.2%) | 17 (6.6%) | 25 (9.3%) | 7 (3.2%) | 3 (3.5%) |
|
41 (9.8%) | 31 (12.1%) | 2 (0.7%) | 8 (3.6%) | 1 (1.2%) |
|
36 (8.6%) | 16 (6.3%) | 18 (6.7%) | 4 (1.8%) | 0 (0.0%) |
|
23 (5.5%) | 17 (6.6%) | 2 (0.7%) | 4 (1.8%) | 0 (0.0%) |
|
19 (4.5%) | 0 (0.0%) | 16 (5.9%) | 0 (0.0%) | 3 (3.5%) |
| Gastrointestinal disorders | 187 (44.7%) | 80 (31.3%) | 44 (16.3%) | 113 (51.4%) | 16 (18.6%) |
|
82 (19.6%) | 22 (8.6%) | 4 (1.5%) | 57 (25.9%) | 6 (7.0%) |
|
50 (12.0%) | 26 (10.2%) | 3 (1.1%) | 22 (10.0%) | 3 (3.5%) |
|
28 (6.7%) | 12 (4.7%) | 1 (0.4%) | 14 (6.4%) | 1 (1.2%) |
| Infections and infestations | 151 (36.1%) | 71 (27.7%) | 105 (38.9%) | 5 (2.3%) | 7 (8.1%) |
|
34 (8.1%) | 0 (0.0%) | 34 (12.6%) | 0 (0.0%) | 0 (0.0%) |
|
26 (6.2%) | 12 (4.7%) | 17 (6.3%) | 0 (0.0%) | 0 (0.0%) |
|
23 (5.5%) | 21 (8.2%) | 2 (0.7%) | 0 (0.0%) | 0 (0.0%) |
| Investigations | 141 (33.7%) | 43 (16.8%) | 44 (16.3%) | 72 (32.7%) | 25 (29.1%) |
|
41 (9.8%) | 7 (2.7%) | 0 (0.0%) | 29 (13.2%) | 7 (8.1%) |
|
36 (8.6%) | 7 (2.7%) | 21 (7.8%) | 7 (3.2%) | 6 (7.0%) |
|
17 (4.1%) | 2 (0.8%) | 0 (0.0%) | 14 (6.4%) | 1 (1.2%) |
| Respiratory, thoracic and mediastinal disorders | 93 (22.2%) | 67 (26.2%) | 31 (11.5%) | 6 (2.7%) | 3 (3.5%) |
|
32 (7.7%) | 25 (9.8%) | 7 (2.6%) | 1 (0.5%) | 0 (0.0%) |
|
24 (5.7%) | 18 (7.0%) | 5 (1.9%) | 1 (0.5%) | 0 (0.0%) |
| Musculoskeletal and connective tissue disorders | 74 (17.7%) | 52 (20.3%) | 15 (5.6%) | 11 (5.0%) | 0 (0.0%) |
|
15 (3.6%) | 13 (5.1%) | 2 (0.7%) | 0 (0.0%) | 0 (0.0%) |
| Neoplasms benign, malignant and unspecified | 73 (17.5%) | 1 (0.4%) | 68 (25.2%) | 0 (0.0%) | 6 (7.0%) |
|
24 (5.7%) | 0 (0.0%) | 23 (8.5%) | 0 (0.0%) | 1 (1.2%) |
|
24 (5.7%) | 0 (0.0%) | 20 (7.4%) | 0 (0.0%) | 4 (4.7%) |
|
19 (4.5%) | 0 (0.0%) | 17 (6.3%) | 0 (0.0%) | 2 (2.3%) |
| Nervous system disorders | 70 (16.7%) | 39 (15.2%) | 24 (8.9%) | 16 (7.3%) | 3 (3.5%) |
|
39 (9.3%) | 26 (10.2%) | 4 (1.5%) | 10 (4.5%) | 2 (2.3%) |
| Blood and lymphatic system disorders | 66 (15.8%) | 15 (5.9%) | 43 (15.9%) | 6 (2.7%) | 12 (14.0%) |
|
25 (6.0%) | 0 (0.0%) | 19 (7.0%) | 0 (0.0%) | 6 (7.0%) |
| Skin and subcutaneous tissue disorders | 60 (14.4%) | 30 (11.7%) | 6 (2.2%) | 22 (10.0%) | 7 (8.1%) |
| Injury, poisoning and procedural complications | 50 (12.0%) | 21 (8.2%) | 22 (8.1%) | 10 (4.5%) | 2 (2.3%) |
| Renal and urinary disorders | 49 (11.7%) | 9 (3.5%) | 20 (7.4%) | 8 (3.6%) | 15 (17.4%) |
|
14 (3.3%) | 0 (0.0%) | 4 (1.5%) | 0 (0.0%) | 10 (11.6%) |
| Cardiac disorders | 45 (10.8%) | 3 (1.2%) | 41 (15.2%) | 3 (1.4%) | 3 (3.5%) |
| Metabolism and nutrition disorders | 43 (10.3%) | 26 (10.2%) | 12 (4.4%) | 8 (3.6%) | 2 (2.3%) |
| Vascular disorders | 36 (8.6%) | 20 (7.8%) | 17 (6.3%) | 2 (0.9%) | 0 (0.0%) |
| Psychiatric disorders | 23 (5.5%) | 19 (7.4%) | 4 (1.5%) | 1 (0.5%) | 0 (0.0%) |
| Hepatobiliary disorders | 17 (4.1%) | 3 (1.2%) | 9 (3.3%) | 0 (0.0%) | 6 (7.0%) |
AE: Adverse event, nsADR: non-serious adverse drug reaction, nsAE: non-serious adverse event, SADR: Serious adverse drug reaction, SAE: Serious adverse event.
Table 6.
Hematologic response in patients evaluable for analyses.
| MDS | MPN | |
|---|---|---|
| Hemoglobin | ||
| Patients analyzed | 213 | 45 |
| Response | 21 | 3 |
|
6 | 0 |
| Death without response | 46 | 11 |
| Transfusions | ||
| Patients analyzed | 124 | 21 |
| Response | 15 | 4 |
|
7 | 1 |
| Death without response | 30 | 5 |
| Platelets | ||
| Patients analyzed | 58 | 18 |
| Response | 9 | 4 |
|
3 | 0 |
| Death without response | 18 | 5 |
| Neutrophils | ||
| Patients analyzed | 30 | 4 |
| Response | 7 | 0 |
|
0 | 0 |
| Death without response | 8 | 1 |
Abbreviations: MDS: Myelodysplastic syndrome, MLD: Multi-lineage dysplasia, MPN: Myeloproliferative neoplasm.
Disclaimer/Publisher’s Note: The statements, opinions and data contained in all publications are solely those of the individual author(s) and contributor(s) and not of MDPI and/or the editor(s). MDPI and/or the editor(s) disclaim responsibility for any injury to people or property resulting from any ideas, methods, instructions or products referred to in the content. |
© 2023 by the authors. Licensee MDPI, Basel, Switzerland. This article is an open access article distributed under the terms and conditions of the Creative Commons Attribution (CC BY) license (http://creativecommons.org/licenses/by/4.0/).
Copyright: This open access article is published under a Creative Commons CC BY 4.0 license, which permit the free download, distribution, and reuse, provided that the author and preprint are cited in any reuse.
Overview of Current Chelation Practices
Y. Aydinok
Thalassemia Reports,
2011
A Systematic Literature Review of the Relationship between Serum Ferritin and Outcomes in Myelodysplastic Syndromes
Esther Oliva
et al.
JCM,
2022
Combination Therapies in Iron Chelation
Raffaella Origa
Thalassemia Reports,
2014


MDPI Initiatives
Important Links
© 2024 MDPI (Basel, Switzerland) unless otherwise stated