Preprint
Article

From Divide to Debate: A Methodological Approach to Dismantling Polarization in Social Networks

Altmetrics

Downloads

171

Views

60

Comments

0

Submitted:

19 September 2023

Posted:

20 September 2023

You are already at the latest version

Alerts
Abstract
Social media platforms are not serving only as tools of communication rather they are acting like intricate systems managing our interactions. A major setback to our interactions occur when the flow of information in these networks gets distorted through polarization. It resembles a society where every debate turns into divide. Our research focuses exclusively on quantifying polarization as well as solving this issue head-on. In order to accurately gauge polarization, we’ve developed a new method that takes into consideration majority of its influencing factors. This helps us in correctly quantifying the polarization value of a given network and then by proposing it as an optimization problem we are attempting to maximally decrease polarization while staying within the set budget. We test our method on synthetic and real-world data sets, and find out that polarization is declining, and diversity is increasing. This proves that our recommendation engine has a penchant for finding the ideal connections between the nodes to start a dialogue. Our research presents a successful tactic to quantifying and reducing polarization in social media networks. The results indicate that our novel metric and intervention technique are effective in dismantling echo chambers, thereby promoting diversity in these networks.
Keywords: 
Subject: Computer Science and Mathematics  -   Computer Networks and Communications

1. Introduction

The popularity of Social Networking Services (SNS) platforms in the current digital era is indisputable, with online traffic experiencing an unprecedented rise. These websites, which were formerly only tools for sharing and conversing, have developed into massive repositories of user information that reveal the subtleties of human behavior. The vast majority of this information may be divided into two categories: apparent, such as the "likes" and "ratings" we leave, and implicit, which records our nuanced online interactions and behaviors [1].
The lifeblood of today’s recommender systems is this data. These technological instruments examine our internet footprints to make recommendations for stuff that matches our preferences. It’s interesting to note that many recommendation algorithms heavily rely on implicit data to determine our preferences [2], When they integrate explicit and implicit data, the true magic happens. With the help of previous interactions, communication patterns, and responses to proposed information, this combination provides a deeper understanding of user preferences [3,4,5,6,7,8,9]. Despite the enormous progress made in the last ten years, more can be done. Making these systems smarter and more responsive to individual users is the current objective [9,10,11,12,13].The problem is that these algorithms frequently show us more of the things we already like, thereby forming echo chambers. This pattern is a major cause of polarization on social media, which results in isolated information bubbles. The notorious Cambridge Analytica controversy [14] is a striking reminder of the way in which such information can be used to influence public opinion. This research will examine solutions to promote a more diverse and inclusive online community.

1.1. Problem of Polarization

Social media has changed the way we communicate, bridging divides and promoting cross-cultural dialogue [15]. Social media networks might resemble complex signal systems if we were to compare them to the field of electronic engineering. Social networks feature elements like link density, polarization levels, and information spread speed, just as signals have different components. By adopting this novel viewpoint, we may use the concepts of electronic networks to solve problems in the social media space. Our objective is to comprehend obstacles to smooth information flow, particularly those brought on by filter bubbles and polarization, and then devise solutions to them. Not content with only theorizing, we test our hypotheses to see if they hold up in both theory and practice. And we’re doing it all efficiently, using algorithm that produces the best outcome without taxing the capabilities of the system.

1.2. Effects of Polarization

Social media has two sides to it. While technology fosters diversity of thought and offers the voiceless a voice, it can also trap users in echo chambers, reaffirming preconceived notions and disseminating false information [16]. It is commonly known that diversity has power. Often, diverse groups outperform their more homogeneous counterparts, particularly in areas like invention and decision-making [17]. In order to ensure a balanced online ecosystem, we want to develop a complete framework that identifies and quantifies polarization, and subsequently mitigates its consequences.

1.3. Solution Space

Fighting polarization is a societal issue as much as a digital one. In order to foster diversity and close gaps, societies have throughout time implemented programs like student outreach efforts and cultural exchanges [18]. In the online world, recommendation algorithms frequently hold the answers, especially in fields like collaborative filtering and serendipity. Collaborative filtering is all about identifying patterns in user activity, while serendipity focuses on surprising users with novel content [19,20,21,22,23,24]. We must first comprehend the causes of polarization in order to develop remedies that are based on this knowledge.

1.4. Proposed Solution

The two primary stops on our research trip are developing a metric to gauge polarization and developing strategies to lessen it. The Polarization Pointer b e t a is a statistic that we are presenting that is sensitive enough to pick up even slight changes in a network’s dynamics. To maximize impact while maintaining within budgetary restrictions, our intervention technique is focused, concentrating on important nodes. The potential of our method is seen in Figure 1 and Figure 2, which provide a visual comparison of polarized and non-polarized networks.
In Figure 1 and Figure 2, it can be seen that the blue and green nodes are highly polarized and divided into two separate communities whereas, in Figure 2, the important nodes of both communities are intervened. This will bring about a decrease in overall polarization. Results show that our recommended intervention reduces polarization more than any other established method.

1.5. How This Work is Different From Others

Substantial work has already been done in this domain as we’ll discuss in Literature Review. However, our work stands out in the sense that our focus is on quantifying and minimizing polarization after taking into account majority of the factors that are influencing it. Apart from this we focus on the content that an individual is exposed to and argue that an individual’s opinion doesn’t stay constant over time rather changes on basis of the opinion of the connections it has.

1.6. Datasets

We use many sources to procure and generate specific datasets which will be used for this research. We explored the dataset collection method on various levels and attempted to use synthetic data as well as real-world dataset for validation of our claims. This extensive testing on various kinds of data helped us evaluate results in different network situations and configurations to get rid of any potential biases. We have stated the limitation and scope of the datasets where required. For example, the number of nodes in the selected dataset versus the practical size of the social media platforms. After working on the detection and quantification of the polarization problem, we finalized the following sources.
1) Karate:
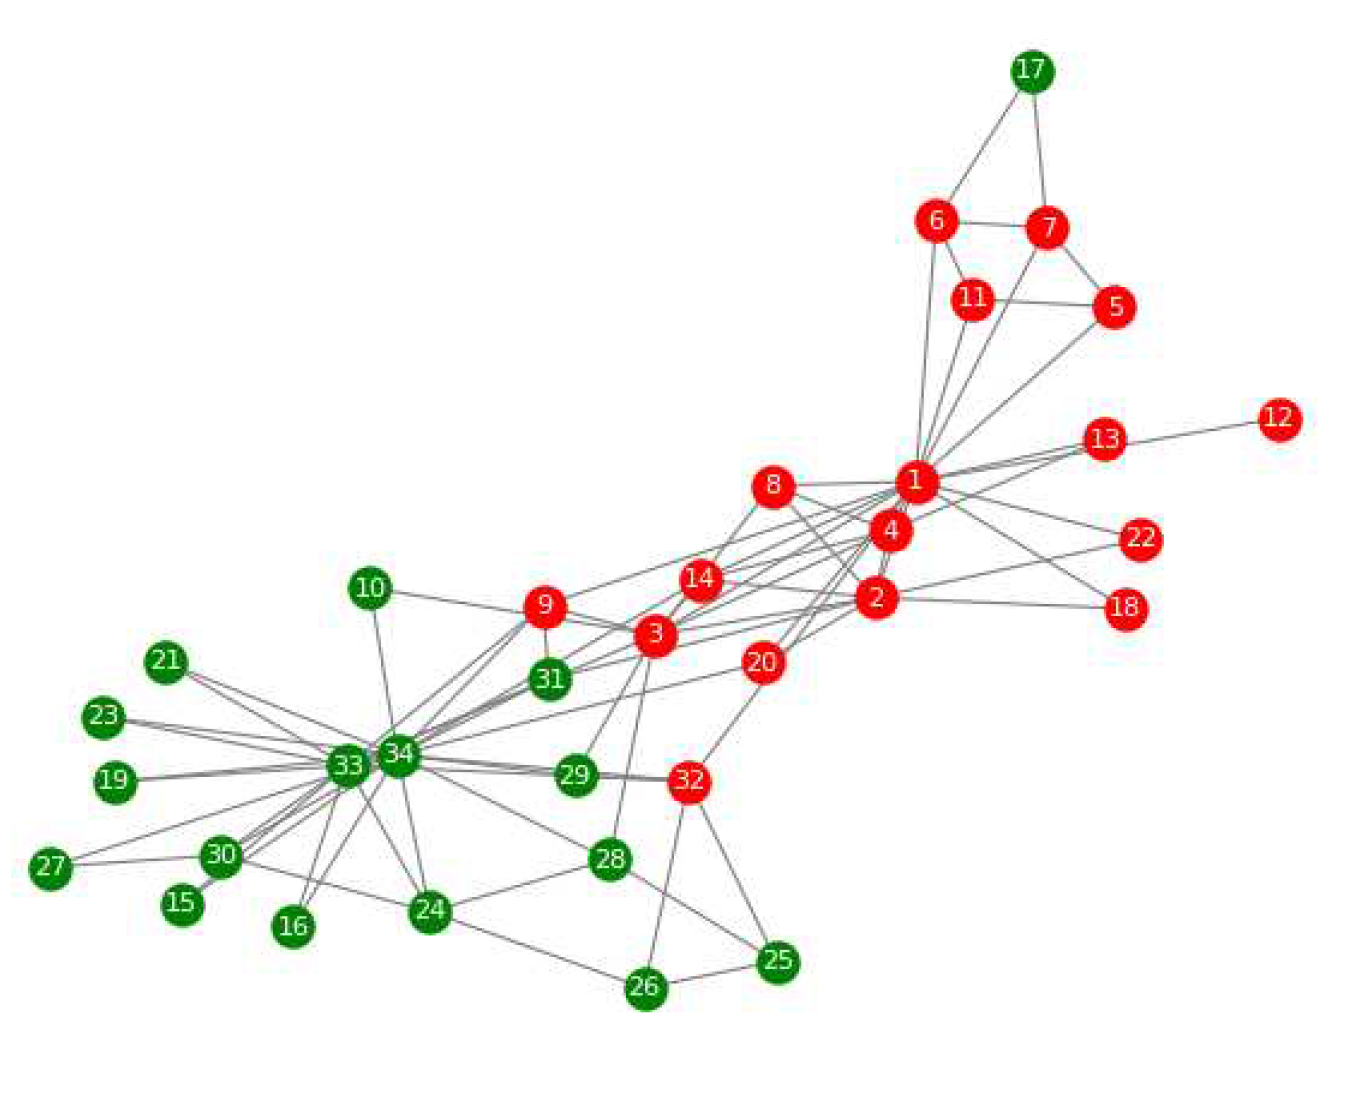
The dataset was collected from a university in the US that showed the social interactions of a karate club. It was collected during the 1970s [25]. It is divided into two well-defined same-sized groups. A graphical representation of the dataset is given in Figure 3.
2) Polbooks:
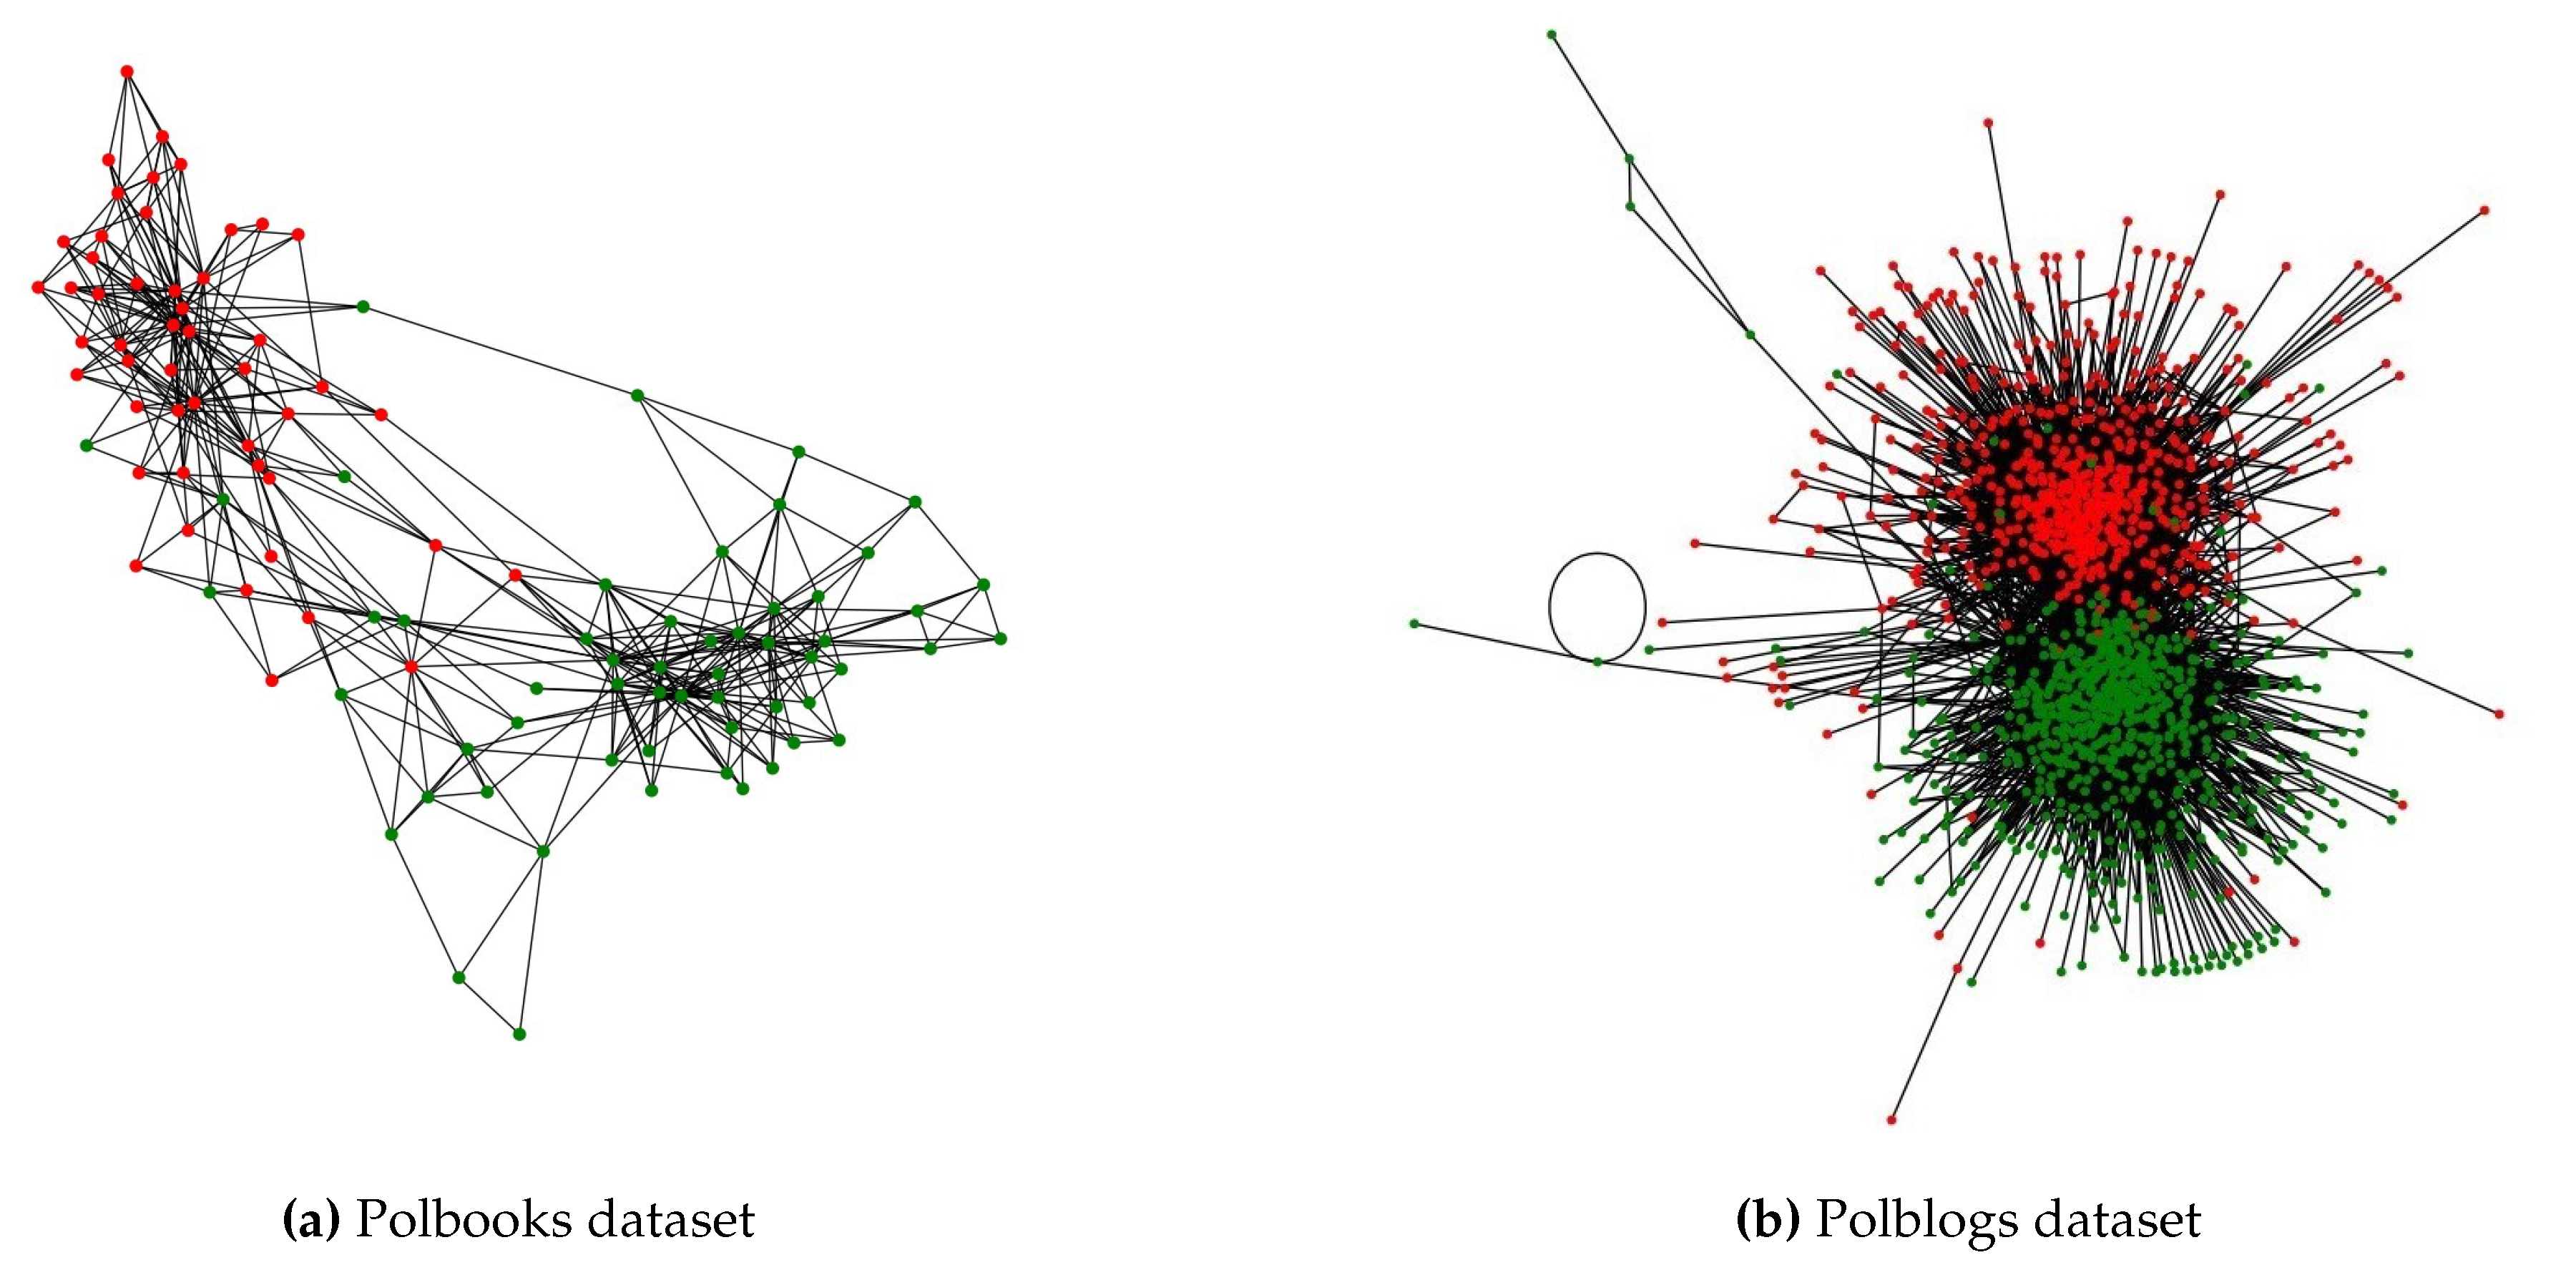
A book network related to US politics, available on "amazon.com" [26], is represented where individual books are depicted as nodes. Links between nodes indicate books that are often bought together. The categorization of these books is as follows: Liberal (43), Conservative (49), and Neutral (13). Books labeled as Neutral are arbitrarily allocated to either the Liberal or Conservative group. A plot of the network is shown in Figure 4
Polblogs:
A network showcasing links between weblogs focused on US politics from 2005 is presented [27]. These blogs are identified as either Liberal or Conservative. We overlook the direction of the links and focus on the most significant connected segment. This analysis yields two groups with 636 and 586 blogs respectively. Details about these datasets can be found in Table 1. All connections in the network are considered bidirectional, and every link is assigned a weight of 1. A plot of the network is shown in Figure 4

2. Literature Review

This research is focused on understanding and addressing the phenomenon of filter bubbles and the resulting polarization on social media platforms. As we keep increasing our dependency on these platforms as primary sources of news and communication, it has become critical to analyze the hazards of content recommendation and the resulting impacts of this algorithmic process on society at large. From what we’ve gathered, this work represents a groundbreaking approach to address to this complex issue. Previous works in this domain were limited to picking on some aspects affecting the polarization and tweaking them whereas this research explores a variety of factors and makes sure to quantify the polarization level of a network by assessing every potential and impacting factor. After that we shed light on how just making a small number of tweakings can result in a considerably less polarized network which can break through the confines of echo chambers and create a more balanced and inclusive society. In this way, this work relates to the problem of recommendation systems based on serendipity as we aim to develop a recommendation system based on aligning polarized users with each other.

2.1. Diversity Measures

Substantial amount of work has been done to quantify diversity in social networks, different research works focus on different aspects of the problem to best describe how diverse a given network is. Matakos et al. [28] consider social networks in form of a graph where nodes denote users and edges denote relationship between the nodes. Each user is also assigned an opinion value which represents their binary belief. They have assumed that the opinions are binary (i.e s i { 1 , 1 } ) and that all the edge weights and node costs are equal to 1. Essentially their diversity index is computing diversity by counting the number of edges between the two communities of people having opposite opinions. However, datasets with only binary opinions do not accurately reflect real world situations where opinions take a range of values from mild to extreme and can be neutral too.
Similar to this is the work of Morales et al. [29] in which they study the phenomenon of echo chambers on Twitter dataset from 2017 (French Elections). They assume each user has a newsfeed which contains tweets from their leaders. The tweets have been labeled. They take several factors into account like the average proportion of posts supporting a party say ’s’ on newsfeed of a particular user ’n’. This metric is calculated by computing the proportion of time the said user’s news feed contained tweets labeled as ’s’. After that they take a vector for user ’n’ that describes the distribution of its political leanings. They quantify diversity using the metric they propose which is calculated based on the proportion of posts from different parties in a user’s newsfeed. A value of 0 on their suggested metric denotes a perfect echo chamber, or polarized or non-diverse network, in which the newsfeed of ’n’ solely contains postings referring to one political party. A score of 1 on the other hand indicates that all parties are equally represented on the newsfeed with the same average proportion, indicating a newsfeed of material that is maximally balanced or diverse.

2.2. Polarization Measures

Polarization detection is mostly done using graph and network based techniques to detect clusters/communities in graph nodes. Akoglu [30] models this problem as a node classification task on edge-signed bipartite opinion networks. This work is specific only to networks that can be modelled as bipartite graphs, which might not be the most general case. The next work [31] we discuss sets up this problem of quantifying polarization level of a social network as a very interesting boundary problem. They consider a graph divided into two communities G1 and G2, and each community has a boundary. They propose that a boundary node is that node which has connection with the other community whereas, an internal node is a node that is living in its silos without having any direct connection with the other community. They then argue that the polarization can be measured as the proportion of the edges the boundary nodes have with the members of the internal nodes of its community. If the boundary nodes have more edges with the members of its own community than the members of the other community then the network will be more polarized however if the number of connections (edges) between the boundary nodes and the members of its own community are lesser than the edges the boundary nodes have with the nodes of the other community then the network will be less polarized. The measure they propose makes sure that polarization lies between -0.5 and 0.5. They argue that the concentration of high-degree nodes in the boundary can correspond to the absence of polarization which is not always true so this method can only be applied to some graphs because it doesn’t consider the structure of the network properly. For example, the case where nodes connected to internal nodes of one community are far greater in number than such nodes of other community cannot be considered through this measure.
Another work [32] introduces a term called center of gravity to find out how polarized a network is. They begin by partitioning the nodes into two sets i.e. elite and listeners. The elites have constant opinions of their own. The listeners, on the other hand, have an initial opinion of 0 and at each time step they become the average of their neighbors’ opinion. They denote the fraction of people holding a positive opinion as A + and those holding a negative opinion as A . The polarization is computed by finding out the how far the average opinion of one community is from the other community.
While the idea of calculating polarization based on distance is quite innovative, this distance metric doesn’t take into account the structure of network properly, so the work of Hohmann et al. [33] uses a more holistic Generalized Euclidean (GE) distance measure, that takes network structure into account as well and calculates the effort required to move between different opinions in the network.
This means quantitatively measuring how different people’s beliefs or opinions are on a particular subject. It addresses different components that add to the network polarization:
  • Opinion component: How the people’s ideologies diverge.
  • Structural component: How the network is structured (Person X is friends with Person Y). Connections with like-minded individuals. If there is no community structure, each individual is connected to every other individual and thus exposed to multiple views. If there are clear communities, individuals will only be exposed to ideas within that community.
  • Interplay between Opinion component and Structural Component:
    a
    Depending on the system’s meso level organization, the same communities and opinions might produce varying degrees of polarization. Communities that can openly connect with one another regardless of their political views show less polarization than those that form in increasingly severe echo chambers. The polarization measure δ G , o is modeled as a node vector distance problem. L = estimate of the effective “resistance” between two nodes in a system. This is done using a pseudo-inverse Laplacian to estimate the effective resistance. The result of this operation is then inverted (Moore-Penrose pseudo-inverse) to get L which gives us a good notion of the distance between two vectors say a and b. They divided the vector o into the vectors o+ and o in order to apply GE to estimate polarization. O- contains the absolute value of all negative opinions and 0 otherwise, while O+ contains all positive opinions After that, their δ G , o measure of polarization becomes:
    δ G , o = ( o + o ) T L ( o + o )
The average "distance" between randomly selected nodes in o+ and o, weighted by how fervently these nodes believe what they believe (for example, the distance between two nodes with opinions +1 and 1 is weighted more than if the nodes had opinions 0.1 and +0.1), can be interpreted as δ G , o .
Next we discuss another method [34] that uses a popular and classical opinion formation model called Friedkin and Johnsen (1990). Within this model, opinions are modeled as real numbers between [ 1 , 1 ] . Each user has an internal opinion S u that is given as an input (and it is fixed). This user also has an expressed opinion Z u . This expressed opinion depends on their internal opinion and opinions in the social network. Within a social network, if a user U takes a random walk, Z u will be the expected opinion the user will reach. High values of Z u means the individual is surrounded by like-minded individuals with extreme opinions and low value of Z u means the U’s social media network has moderate and diverse opinions. | Z u | is the degree of polarization of user U. We measure this by looking at the length of the vector z under the L 22 norm.
The Friedkin and Johnsen (1990) model is used to determine polarization because it makes the assumption that each person i has a persistent internal opinion S i and an expression opinion Z i that is influenced by both their internal opinion and the opinions of their neighbors.
z i = w i i s i + j ϵ N ( i ) w i j z j w i i + j ϵ N ( i ) w i j
Where W i i is the weight an individual goes to their own internal opinion. Using this, they finally converge to Z, which is the opinion vector for the whole network. Then they define the polarization index, which is:
π z = z 2 n
The weights W i j and W i i have an impact on the probability as well because they determine the likelihood that a certain edge will be followed. High W i i weight, for instance, indicates that the user is more likely to become immersed in her own opinion node than to follow a path through the network to another node. If a node v j has an equal likelihood of reaching both positive and negative opinions, or a balanced perspective of the network’s thoughts, the value | z j | for that node is minimized. The value of | z j | will be high, however, if the user is confined to a filter-bubble of friends who share their radical viewpoints.
Cinus et al. [35] investigate the role of people recommender algorithms, such as "People You May Know" or "Who to Follow" features on social media, in creating echo chambers and polarization. These algorithms typically suggest connections based on network structure and shared interests, often leading to homophilic (similar) links. The paper evaluates three such algorithms: Directed Jaccard index, Personalized PageRank, and Opinion-biased algorithm, using two opinion dynamic models, Bounded Confidence Model (BCM) and Epistemological model, to simulate opinion changes during user interactions.
BCM assumes that interactions only change opinions when they are within a certain confidence interval, while the Epistemological model assumes that one opinion is factual and the other is its negation.
The paper uses two global metrics to measure the impact of recommender systems on echo chambers and polarization: Neighbors Correlation Index (NCI) and Random Walk Controversy Score (RWC). NCI measures the correlation between a node’s opinion and the average opinion of its neighbors. A value of -1 indicates perfect anti-correlation, while a value of 1 indicates perfect correlation.
RWC measures the difference in probabilities of two events: both random walks starting and ending in the same partition, and both random walks starting and ending in different partitions. High RWC values indicate low probability of crossing partitions (high polarization), while low values indicate high probability of crossing partitions (low polarization). However, this measure does not account for the size of communities or the total degree of nodes in the partitions, which are significant factors affecting polarization.
The study [36] explores the behavior of individuals within echo chambers or filter bubbles, where users are surrounded by like-minded individuals and there is little to no difference in opinions. It examines how these communities evolve over time, considering user activity and emotions expressed. The study uses three growth models: the Gompertz model, the Logistic model, and the Log-logistic model, and finds that both science-focused and conspiracy-focused communities show similar growth patterns.
The study measures community growth using user commenting activity as a proxy for engagement. Users are classified into three groups based on their commenting frequency, and their temporal evolution is tracked. A method is developed to classify users as "Scientific" or "Conspiracy Theorist" based on their interactions with labeled data on Facebook.
The study also conducts a sentiment analysis to model users’ emotional behavior as a function of their community involvement. It uses a Machine Learning Sentiment Classifier to classify comments into positive, neutral, and negative sentiments. Three metrics are used: Mean User Sentiment, Mean negative/positive difference of comments, and User sentiment polarization.
At the community level, the study calculates the Community negative/positive difference of comments and Mean community sentiment polarization. The findings suggest that as users become more active within echo chambers, they tend to express increasingly negative sentiments. Furthermore, user sentiment polarization is generally higher for science users compared to conspiracy users. However, as activity increases, science users tend to decrease their sentiment polarization, while conspiracy users tend to increase it.
The paper [37] introduces a different approach to opinion dynamics, where changes in opinion are observed over distinct steps or time intervals. The paper uses the Friedkin-Johnsen (FJ) model, which is known to converge to a set of equilibrium opinions over time. The expressed opinion of a node is calculated as a function of its internal opinion and the weighted sum of the opinions of its neighbors, divided by the degree of the vertex. The paper defines the concept of polarization as the mean square error of the opinions in the network, with respect to the mean opinion. The polarization ranges from 0 (when all opinions are equal) to N (when half of the opinions are at -1 and the other half at 1). The paper also introduces the concept of disagreement, both at a local and global level. Local disagreement is defined for a node as the sum of the squared differences between its opinion and the opinions of its neighbors, weighted by the connection strength. Global disagreement is an aggregate measure, defined as the sum of local disagreements for all nodes, divided by two to ensure each edge is only counted once.

2.3. Controversy Measures

The paper [38] presents a unique approach to quantifying the polarization level of a network by calculating a controversy score. This score is based on edge betweenness centrality, a measure of the significance of each edge in a network, which is determined by how often an edge lies on the shortest paths between different pairs of nodes.
In this context, a graph G = ( V , E ) is divided into two communities with opposing opinions on a topic. The controversy measure is used to determine how well-separated these two communities are. The betweenness centrality of an edge is defined as the ratio of the number of shortest paths between nodes s and t that include the edge e, to the total number of shortest paths between nodes s and t.
The Kullback-Leibler (KL) divergence is then computed for the distribution of edge betweenness centrality of the crossing edges (those connecting the two communities) and the internal edges (those within a single community). The Betweenness Centrality Controversy (BCC) of the graph is defined as:
B C C = 1 e d K L
The BCC value ranges from 0 to 1. A BCC value of 0 indicates a small divergence, meaning the betweenness centrality of the crossing and internal edges are similar, suggesting a diverse graph. A BCC value of 1 indicates a large divergence, meaning the betweenness centrality of the crossing and internal edges are very different, suggesting a polarized graph.
However, this model does not consider the strength of opinions across either side and assumes that opinions take one of two possible values instead of a spectrum, which may overlook some important details.

2.4. Recommendation Systems

We relate our problem to recommendation systems that work by presenting information based on our prior choices or those of other users who share them, recommender systems have completely changed how we interact with content online. According to Mi Zhang and Neil Hurley [39] these recommendations may unintentionally create "filter bubbles" that restrict our access to a variety of content. Because of this, we frequently find ourselves in "echo chambers" where we only hear views that agree with our own, strengthening our preexisting prejudices and impeding our interaction with other viewpoints. Recognizing this situation, efforts have recently been undertaken to diversify recommendation algorithms in order to encourage the investigation of new ideas and themes [40]. The goal is to produce a more interesting and well-rounded online experience. Another body of research [41] says that user satisfaction is greatly increased by topic-diversified recommendation lists. However, as argued in another research [42] finding a balance between customization and diversity continues to be a major difficulty. Although customization adapts content to users’ tastes, it can also reinforce preexisting opinions and limit exposure to new viewpoints. The need to maintain this delicate equilibrium has given rise to numerous creative solutions. As an illustration, the idea of "serendipity-based" recommendations, as put forth by Murakami et al. [43] proposes recommendations that diverge from previous user interactions in an effort to introduce novelty and broaden users’ horizons. This strategy works particularly well when customers gravitate toward well-known or well-liked products, limiting their exposure to other possibilities.

2.5. Methods of Polarization Reduction

We have come across various methods of computing polarization, after evaluating how polarized a given network is the next step becomes to find out optimal methods that enable us to reduce this polarization. This has implications in real life as well as it has been shown that social polarization hampers the economic growth of a society [44] so reducing it is imperative to ensure a stable and smoothly running community. For this purpose, we have done a detailed review of methods that can be used to tackle this polarization problem and help us reduce it.
Garimella et al. [45] proposes an approach to add new edges to the graph in order to provide exposure to opposing points of view. Likewise, [46] adopts an information diffusion approach. It proposes an algorithm to select seed nodes such that the exposure of nodes in a graph, as a result of information propagation, is balanced. Given two opposing campaigns, it selects seed nodes such that after information is propagated through those nodes, the resulting information exposure of the graph is balanced. Moreover, Musco et al. [47] formulate the problem as selecting a set of nodes such that it minimises polarity as well as the disagreement that would occur due to linking of individuals with different opinions. It proposes an approach to find the optimal structure of a graph that would minimise both objectives. The former work focuses on setting the opinions of selected nodes to zero, corresponding to a neutral opinion and does not consider the possibility of changing the individual leaning towards the counter opinion. The latter aims to change the network topology which might not be realistic in most scenarios. All these approaches share a common objective of minimising some measure of polarization by making recommendations to a subset of the nodes.
In [28], the authors assume binary opinions such that the opinion vector s i { 1 , 1 } . Given P i i (the weighted degree of node i), b i (the cost of changing node i’s opinion), and a budget k, the authors select the nodes with the highest values of P i i / b i and flip their opinions. If all edge weights and node costs are set to 1, the problem simplifies to selecting k nodes with the highest degrees. The authors report the results of flipping the opinions of the top 0.1 n , 0.2 n , and n nodes in their study. This method seems to break filter bubbles and increase the diversity of information exposure among connected individuals in social networks. However, flipping the opinions of such a large number of people in real life is not very practical or realistic.
In [29], the authors study the phenomenon of echo chambers on a Twitter dataset from 2017 and maximize the diversity of content exposed to users using a quadratic program that finds the best recommendations to show to a user. The paper focuses on optimizing personalized content recommendation policies to maximize the average diversity of newsfeeds across the platform.
Another method [34] aims to reduce the overall polarizability of a given network by convincing people to adopt a more moderate opinion. Given a budget value K, this research focuses on identifying the best set of individuals, where moderating their opinion will reduce the polarization of the whole network the most. They further define two variants of the problem:
  • Moderate Internal: Attempt to moderate the internal opinion S u of individuals and bring it to S u = 0 (through educational interventions).
  • Moderate External: Attempt to moderate the external opinion Z u of individuals and bring it to 0 (this can be done through incentives).
Having discussed various methods to quantify and reduce polarization along with their limitations, we will now focus on devising a unique system to measure and reduce polarization. We will do so while considering all major confines of the previous works in the subsequent discussion.

3. Proposed polarization metric

In social networks, polarization is the term used to describe the emergence of separate ideological communities that are distinguished by a wide range of viewpoints. Addressing concerns associated with information segregation and echo chambers depends on understanding the fundamental causes of this phenomenon. In this study, we explore an undirected polarized social network that splits people into two communities according to their opinion values, which are measured between -1 and 1. With a particular focus on the most influential factors towards polarization, namely, distance between opinion nodes, intra-community and inter-community connection strength, and boundary edge density, our goal is to identify and analyze the key factors responsible for polarization and, as a result, quantify the polarization.

4. Methodology

We first acquire a representative dataset made up of people’s opinion values in order to better understand the components that contribute to polarization in the social network. The network’s structural characteristics are then thoroughly analyzed, with a focus on the partitioning of nodes into two distinct groups according to their viewpoints. To represent the interactions and linkages among the members, the network is modeled as an undirected graph.

4.1. Factor Analysis

We uncover numerous parameters that significantly affect polarization and echo chamber development through a thorough analysis of the network, including:
  • The distance metric: The distance metric indicates the degree of divergence or disagreement between the opinion values of nodes both within and between communities. Greater polarization and ideological division are indicated by a greater gap. Various methods have been investigated in the literature already, which measure the separation between opinion nodes. In this study, we use the "Distance Metrics" method, concentrating on the separation between the two different opinion groups’ centers of gravity, i.e.
    d = | C G 1 C G 2 |
  • Intra-Community Connection Strength: The degree of cohesion and alignment among those who hold similar views is shown by the strength of connections within each group. Communities that are more cohesive tend to develop echo chambers.
  • Inter-Community Connectivity: The information flow and potential exposure to other viewpoints are influenced by the existence of connections between persons from various communities. Greater polarization is correlated with decreased intercommunity connectivity.
Instead of relying entirely on conventional techniques, we adopted a novel strategy to quantitatively quantify the connection’s strength (s) within the social network. In this study, the opinion values of the nodes connected by an edge and the associated weight given to that edge were combined to determine the connection strength (s). By using this promising method, we can analyze polarization dynamics with greater precision while learning more about how the network coheres and how echo chambers arise. We obtain an exact measure of connection strength (s) by including both opinion values and edge weights, which follow as:
s = ( w i j · o i · o j )
4.
Density of Boundary Edges: Boundary edges, which indicate relationships between members of various communities, are very important in determining the degree of polarization. A greater density of these edges suggests a greater mingling of viewpoints, which would lessen polarization. A precise and consistent methodology is used to calculate the social network’s density of boundary edges ( ρ ) properly. The ratio of the number of actual boundary edges ( n e ) to the total number of potential boundary edges ( N e ) in the network is the definition of this statistic. The determination of ρ is crucial because it provides insight into the interaction of views among various communities within the network. It is possible to gather important knowledge about the degree of interaction and information flow between members of various ideological groups by assessing the density of boundary edges. A higher ρ value denotes a better level of community connection, which may minimize polarization, whereas a lower value denotes more splintered and polarized groupings. The inverse of ρ is utilized here, which is denoted by ( 1 ρ ) , called sparsity, to measure polarization. The sparsity of edges between groups is effectively captured by this transformation, allowing for a more accurate evaluation of the degree of polarization in the social network.
ρ = n e N e

4.2. Formulation of polarization pointer

It’s critical to comprehend the underlying principles and subtleties of our polarization quantification method now that we’ve introduced the factors affecting it. In light of this, we’re going to explain how this metric, which was created especially for social media datasets, was derived. The Polarization Pointer, designated as β , is obtained by taking into account the following key variables: the edge density ( ρ ) in the network, the distance (d) between opinion nodes, and the connection strength (s) both within and across communities.
With these essential factors identified, the formula for the Polarization Pointer is derived as follows:
β = d × ( s + ( 1 ρ ) )
where,     d = | C G + C G | 2 ,    s = ( w i · o i · o j ) w i ,     ρ = 2 . e b n ( n 1 ) n 1 ( n 1 1 ) n 2 ( n 2 1 )
Here, β stands for the Polarization Pointer, a numerical gauge of the degree of polarization in the social network. The formula takes into account the inverse of edge density ( 1 ρ ), as well as the effects of distance (d) and connection strength (s). The computation of the Polarization Pointer offers important insights into the polarization dynamics of the network and its possible sensitivity to echo chamber effects. These elements are included in the formula to enable a thorough knowledge of polarization, allowing researchers to assess the ideological differences within the network and create focused interventions to support information diversity as well as bridge ideological gaps.
The utility and reliability of the formula are improved by normalization. Each component must be normalized for the formula to generate results that are accurate and comparable. Normalization eliminates any unjustifiable dominance of particular components by guaranteeing that each component contributes equitably to the overall polarization measurement.
The normalized Polarization Pointer’s formula is as follows:
β = 1 2 d × m a x ( s + ( 1 ρ ) , 0 ) .
The three main parts of the suggested polarization formula are s, ρ , and d. Each element captures a particular feature of the polarization dynamics of the network.
Special case: The proposed metric can be expressed as follows when there are no boundary edges between the opinion groups, resulting in a network with disjoint groups:
β = 1 2 d × ( s + 1 ) .
Due to the absence of connections between the groups being studied, a high sparsity metric in this situation emphasizes the sharp division of groups.
By considering measures of connectedness, sparsity, and separation of viewpoints, the suggested formula provides an in-depth way of evaluating polarization in networks. These components aid in a better understanding of the underlying dynamics affecting polarized networks by researchers. By taking into account the uncommon situation where there are no boundary edges, the peculiar characteristics and implications of polarization in networks with disjoint groups are made clear. This formula could be a useful tool for researchers looking at polarization and its effects on various domains to better understand social dynamics in polarized environments.

4.3. Proposed Opinion Evolution Model

Opinion dynamics primarily relates to the evolution and the change in opinion that a particular user goes through after getting affected by his or her neighbors’ opinion and after spending some time dwelling over his or her own opinion. Different factors affect individual opinions such as social influence, media advertising, and cognitive biases. To make our model more realistic, we analyzed different models of opinion dynamics to propose a unique model that affects an individual’s opinion’s evolution over time.
For example, the Friedkin-Johnsen Model states that each node i maintains a fixed internal opinion s i and a publicly expressed opinion z i which is given by:
z i = w i i s i + j N ( i ) w i j z j w i i + j N ( i ) w i j
So considering this, we propose the following model of opinion evolution:
Given that each node i has a fixed innate opinion s i and an expressed opinion at time t, z i ( t ) :
z i ( t + 1 ) = α s i + ( 1 α ) j V w i j z j ( t ) j V w i j
where α is a parameter and represents the fractional weight that each node gives to its own opinion. Ideally, this can be a function of the strength of the opinion that can vary from person to person. However, we’ve taken it to be constant at 0.85. The idea behind taking it 0.85 is that humans, generally give more importance to their own opinions than those of the people they are related to. But the influence of the relatives and a person’s social circle still cannot be ignored so that is why it is also assigned some amount of weightage.

5. Results and Discussion

The proposed polarization pointer (5) was rigorously tested on numerous datasets, including both synthetic and real-world data, see Table 1, as part of a thorough validation process. We started the validation procedure with a synthetic dataset to gauge its effectiveness. A total of n = 10000 nodes were produced for this synthetic dataset, and they were clearly divided into two groups based on randomly assigned opinion values, and hence computed the polarization factor for different numbers of edges.
Table 2 displays the computed values for polarization, illustrating how polarization changes as the internal edges increase. The polarization value grows together with the internal edges. This demonstrates that the network tends to display higher levels of polarization, meaning stronger separation or clustering within the groupings, as the number of edges inside each group increases.
The polarization values in Table 3 highlight the complex interplay between the network’s structural components and its polarization dynamics. The degree of separation or clustering between the groups tends to decrease as the number of boundary edges increases in the network. This suggests that the type and pattern of edges linking the groups greatly impact the level of polarization seen in the network.
These findings highlight the significance of treating boundary edges as a key element of the network’s architecture and offer insightful information on the variables influencing polarization in complex networks. Understanding how boundary interactions affect polarization might help in the development of practical management and mitigation techniques in a variety of real-world situations.
Overall, the table sheds light on how edge and polarization are related, emphasizing the significance of comprehending network topology and its bearing on polarization dynamics.
Figure 5 displays a number of graphs using various datasets. Plots from the Karate dataset are shown in the first row. Each node in this dataset is given an opinion value, which is done in an incredibly discrete way. A value of 1 is specifically allocated to half the nodes, while a value of -1 is given to the other half. The data distribution based on these opinion values is shown in the first column of the charts. The first entry of the column displays the opinions’ distribution among the Karate dataset’s nodes. The plot in the second column shows how polarization can occur when the margins within each opinion group are widened. This makes it easier to see how the network’s polarization shifts as connections between groups increase.
Plots evaluating the Polbooks dataset are shown in the second row of Figure 5. The distribution of data is determined by the opinion scores given to each node. After discretely assigning half of the opinions a value of 1 and the other half a value of -1, the opinions are then evolved using a predetermined algorithm, see (7). Network polarization is impacted by growing edges within each opinion group demonstrating how increased relationships within the groups modify the polarization. The behavior of density and connection strength with more edges offers insights into the evolution of density and connection strength.
Following the same pattern, the third and fourth row of Figure 5 represents the plot against ploblogs and synthetic data set.

Minimization Problem: Optimal Reduction of Polarization

1. Introduction

Polarization in social networks can exacerbate conflicts and obstruct productive dialogue between various groups. To solve this problem, we put forth an optimization methodology that aims to reduce network polarization. The two main variables that affect polarization are s (segregation measure) and ρ (degree of similarity and affinity between connected nodes). In order to reduce polarization, our goal is to maximize ρ while minimizing s. In order to optimize the effect on polarization reduction while abiding by a restriction on the maximum number of additional edges, we also seek the best strategy for added edges between opinion-based split groups.

2. Variables and Definitions

s: The segregation measure, calculated as the ratio of the sum of the product of weights w i and opinion values o i and o j to the sum of indices i. This variable captures the level of separation between different groups within the social network.
ρ : The ρ , computed as the ratio of twice the number of boundary edges e b to the total possible edges n ( n 1 ) n 1 ( n 1 1 ) n 2 ( n 2 1 ) , where n 1 and n 2 represent the sizes of two separate opinion-based groups. This variable indicates the degree of similarity and affinity between connected nodes.
d: The distance measurement, which represents the size difference between the two distinct groups, divided by two. Based on the groups’ differences in opinion values, this measure sheds light on how far off they are from one another.

3. Minimization Objective

Our objective is to intentionally add edges between groups that are divided based on opinions in order to reduce the polarization measure. We concentrate on reducing the segregation measure s and raising the measure ρ in order to achieve this. The maximum number of edges that can be placed between the groups, however, sets restrictions on our ability to proceed.

4. Optimization Problem Formulation

Let E be the set of all potential edges connecting groups that have been divided based on their opinions and E added be the set of additional edges. We can formulate our optimization issue as follows:
Minimize : β = 1 2 d × max ( s + ( 1 ρ ) , 0 ) Subject to : | E added | MaxEdgesToAdd
where MaxEdgesToAdd is the maximum number of edges that can be added between the groups. The edges added must be selected optimally to maximize the reduction in polarization.

5. Solving the Optimization Problem

Due to the inclusion of the continuous variables s, ρ , and d, as well as the discrete variables MaxEdgesToAdd, the minimization problem at hand involves a challenging optimization work incorporating both discrete and continuous variables. We suggest the following methodical approach for effectively determining the best arrangement of added edges:

Node Grouping and Selection:

We first divide the nodes into groups according to how positive and negative they are. Based on the size of their opinion values, these groupings are then arranged in descending order. The best m% of nodes are carefully chosen from each group. This selection procedure’s goal is to pinpoint important nodes for potential connections.

Identifying Optimal Node Pairs:

Our focus lies on reducing the segregation measure, denoted as s, by connecting nodes from selected groups with divergent viewpoints. To achieve this, we compute the product of opinions for all possible node configurations between the chosen nodes. By ranking the products of opinions, we can determine which node pairings have the most significant impact on lowering s. In this manner, we identify node pairs that offer an optimal value of opinion products for reducing segregation.

Edge Addition Strategy:

We give priority to adding edges between the node pairs that reduce s the most based on the computed product values. We may maximize the effect of the additional edges on polarization reduction using this tactical method.
Through the application of this method, we hope to significantly lower the value of the segregation measure s within the social network. By joining nodes from opposing opinion groups where the sum of their opinions is negative, the reduction in s is achieved, helping to achieve the desired drop in polarization.
In addition to the proposed method, we make use of sophisticated optimization algorithms that effectively explore the problem space while abiding by the limitations placed on the number of additional edges that can be added. Finding a configuration that significantly reduces polarization and promotes a more cohesive and inclusive social network is the ultimate goal.
Preprints 85544 i001
To test the effectiveness of the proposed method, various datasets - both real and synthetic - were examined using the proposed approach. Figure 6 displays a comparison between well-known methods such as betweenness centrality, degree centrality, and the proposed technique. It’s clear that the proposed approach is the most suitable for reducing polarization. The graphs illustrate how the amount of boundary edges added influences the value of polarization. The following are the main findings:
Effectiveness of Polarization Reduction: When compared to betweenness centrality and degree centrality, the suggested algorithm yields the lowest polarization values, demonstrating that it is the most effective way for decreasing polarization.
Sensitivity to Boundary Edges: The suggested method responds more strongly to changes in the network structure, leading to more significant decreases in polarization. It is more sensitive to the inclusion of boundary edges.
Effectiveness in Different Network Sizes: In large networks as opposed to small networks, the suggested method is more effective at reducing polarization. This suggests that the algorithm would operate more effectively in circumstances involving more nodes or data points.
We developed a novel approach that carefully places edges between the top nodes of opposing groups in an effort to combat network polarization. This method’s effectiveness was compared to that of other well-known approaches, including edge addition based on betweenness centrality, degree centrality, and random selection.
Visual examination of the plotted results in Figure 6 revealed that our strategy outperformed the alternatives in terms of polarization reduction. Specifically:
Our Suggested Approach: Showed the greatest reduction in polarization. We more successfully overcame the inherent gaps by focusing on top nodes from each category and encouraging linkages between them.
Betweenness Centrality: Although this approach reduced polarization to some extent, it was less successful than our suggested way. This implies that while betweenness centrality can identify key nodes for information flow, it might not always be able to identify the nodes that are most effective in bridging polarized clusters.
Degree Centrality: Adding edges based on degree centrality demonstrated some polarization reduction, similar to betweenness centrality. It yet fell short of our approach, demonstrating that merely having popular nodes does not guarantee efficient polarization reduction.
Random Edge Selection: As expected, this method also couldn’t do better than our approach. The lack of a purposeful selection mechanism made it less effective overall, even though some chance contacts may have helped to heal polarized groupings.
Overall, the observations suggest that the proposed algorithm is a powerful approach for reducing polarization in different network datasets. The results emphasize the importance of network structure and the potential benefits of using the proposed algorithm in addressing polarization in social networks or similar systems. As a result of our method’s higher performance, it has the potential to be a powerful instrument for reducing polarization inside social networks, providing a more unified and harmonious network structure than those produced by other common approaches.

6. Conclusions

To engage with the polarization problem in social networks we did a detailed literature review, to understand the dynamics of this area. While a lot of work has been done in this domain, the majority of the available work was addressing only a specific factor of the polarization problem due to which the proposed solutions had limited practical implementations. A systematic approach was adapted to identify the majority of the factors that influenced polarization which were then captured in a mathematical model. This research does the following three things: 1) Predicting a person’s opinion as it changes with time 2) Wholistically measuring polarization in a network by encompassing all factors contributing to it 3) Drafting minimizing polarization as an optimization problem subject to constraint. Results on various data sets support this claim. Besides accurately measuring the polarization, the optimal solution was also proposed through which we can mitigate the issue of polarization. The effectiveness of our strategy was evaluated by comparing the levels of polarization before and after our intervention. For future work, we can look at Artificial Intelligence as a potent ally in the struggle against polarization when it comes to forecasting. We might be able to predict network polarization flare-ups by using advanced AI techniques. Then, our Polarization Pointer could intervene to evaluate the precision of these AI forecasts.

References

  1. Ko, H.; Lee, S.; Park, Y.; Choi, A. A Survey of Recommendation Systems: Recommendation Models, Techniques, and Application Fields. Electronics 2022, 11, 141. [Google Scholar] [CrossRef]
  2. Beheshti, A.; Yakhchi, S.; Mousaeirad, S.; Ghafari, S.M.; Goluguri, S.R.; Edrisi, M.A. Towards Cognitive Recommender Systems. Algorithms 2020, 13, 176. [Google Scholar] [CrossRef]
  3. Abbasi-Moud, Z.; Vahdat-Nejad, H.; Sadri, J. Tourism Recommendation System Based on Semantic Clustering and Sentiment Analysis. Expert Syst. Appl. 2021. [Google Scholar] [CrossRef]
  4. Liu, F.; Lee, H. Use of Social Network Information to Enhance Collaborative Filtering Performance. Expert Syst. Appl. 2010. [Google Scholar] [CrossRef]
  5. Yang, B.; Lei, Y.; Liu, J.; Li, W. Social Collaborative Filtering by Trust. IEEE Trans. Pattern Anal. Mach. Intell. 2017, 39. [Google Scholar] [CrossRef]
  6. Amato, F.M.V.P.A.P.F. SOS: A Multimedia Recommender System for Online Social Networks. Future Gener. Comput. Syst. 2019, 93, 914–923. [Google Scholar] [CrossRef]
  7. Capdevila, J.A.M.A.A. GeoSRS: A Hybrid Social Recommender System for Geolocated Data. Inf. Syst. 2016, 57, 111–128. [Google Scholar] [CrossRef]
  8. Tarus, J.N.Z.Y.A. A Hybrid Knowledge-Based Recommender System for e-Learning Based on Ontology and Sequential Pattern Mining. A Hybrid Knowledge-Based Recommender System for e-Learning Based on Ontology and Sequential Pattern Mining 2017, 72, 37–48. [Google Scholar] [CrossRef]
  9. Choi, S.M.K.S.K.H.Y.S. A Movie Recommendation Algorithm Based on Genre Correlations. Expert Syst. Appl. 2012, 39, 8079–8085. [Google Scholar] [CrossRef]
  10. Walek, B.F.V. A Hybrid Recommender System for Recommending Relevant Movies Using an Expert System. Expert Syst. Appl 2020, 158. [Google Scholar] [CrossRef]
  11. Pan, Y.H.F.Y.H. Learning Social Representations with Deep Autoencoder for Recommender System. World Wide Web 2020, 23, 2259–2279. [Google Scholar] [CrossRef]
  12. Aivazoglou, M.R.A.M.D.V.C.I.S.P.J.S.D. A Fine-Grained Social Network Recommender System. Soc. Netw. Anal. Min. 2020, 10, 8. [Google Scholar] [CrossRef]
  13. García-Sánchez, F.C.P.R.V.G.R. A Social-Semantic Recommender System for Advertisements. Inf. Process. Manag. 2020, 57, 102153. [Google Scholar] [CrossRef]
  14. Kaufman, E. The social media, the mass media, violence and democracy. The arena for institutional weakening and citizens lack of confidence. Political Science 2018. [Google Scholar]
  15. Gillani, N.; Yuan, A.; Saveski, M.; Vosoughi, S.; Roy, D. Me, My Echo Chamber, and I: Introspection on Social Media Polarization. WWW ’18: Proceedings of the 2018 World Wide Web Conference, 2018, p. 823–831.
  16. Donkers, T.; Ziegler, J. The Dual Echo Chamber: Modeling Social Media Polarization for Interventional Recommending. RecSys ’21: Proceedings of the 15th ACM Conference on Recommender Systems, 2021, p. 12–22.
  17. Sobkowicz, P. Social Depolarization and Diversity of Opinions—Unified ABM Framework. MDPI 2023, 25, 568. [Google Scholar] [CrossRef] [PubMed]
  18. Akçay, N.C. A Comparison Of The Cultural Diplomacy Policies Of France And The United Kingdom Towards African Countries. Master’s thesis, Hacettepe University Graduate School of Social Sciences Turkey, 2018.
  19. Sun, N. Overview of definition, evaluation, and algorithms of serendipity in recommender systems. Proceedings of the 3rd International Conference on Signal Processing and Machine Learning, 2023, Vol. 6, pp. 640–646.
  20. Kotkov, D.; Wang, S.; Veijalainen, J. A survey of serendipity in recommender systems. Knowledge-Based Systems 2016, 111, 180–192. [Google Scholar] [CrossRef]
  21. Maksai, A.; Garcin, F.; Faltings, B. Predicting Online Performance of News Recommender Systems Through Richer Evaluation Metrics. RecSys ’15: Proceedings of the 9th ACM Conference on Recommender Systems, 2015, p. 179–186.
  22. Zhang, Y.C.; Séaghdha, D.Ó.; Quercia, D.; Jambor, T. Auralist: introducing serendipity into music recommendation. WSDM ’12: Proceedings of the fifth ACM international conference on Web search and data mining, 2012, p. 13–22.
  23. Kotkov, D.; Veijalainen, J.; Wang, S. Challenges of Serendipity in Recommender Systems. WEBIST 2016 : Proceedings of the 12th International conference on web information systems and technologies, 2016, Vol. 2.
  24. Kotkov, D.; Veijalainen, J.; Wang, S. A Serendipity-Oriented Greedy Algorithm for Recommendations. WEBIST 2017 : Proceedings of the 13rd International conference on web information systems and technologies, 2017, Vol. 1, pp. 32–40.
  25. W., Z. W., Z. An information flow model for conflict and fission in small groups. Journal of Anthropological Research.
  26. Krebs, V. Books about US politics. http://www.orgnet.com/, 2004.
  27. Adamic, L.A.; Glance, N. The political blogosphere and the 2004 U.S. election: divided they blog. LinkKDD ’05: Proceedings of the 3rd international workshop on Link discovery, 2005, p. 36–43.
  28. Matakos, A.; Gionis, A. Tell me Something My Friends do not Know: Diversity Maximization in Social Networks. IEEE International Conference on Data Mining (ICDM);, 2018; pp. 327–336.
  29. Vendeville, A.; Giovanidis, A.; Papanastasiou, E.; Guedj, B. Opening up Echo Chambers via Optimal Content Recommendation. International Conference on Complex Networks and Their Applications XI. COMPLEX NETWORKS 2016 2022, 2023, Vol. 1077, p. 74–85.
  30. Akoglu, L. Quantifying political polarity based on bipartite opinion networks. Proceedings of the 8th International Conference on Weblogs and Social Media, ICWSM 2014.
  31. Guerra, P.C.; Jr, W.M.; Cardie, C.; Kleinberg, R.D. A Measure of Polarization on Social Media Networks Based on Community Boundaries. Proceedings of the International AAAI Conference on Web and Social Media, 2013.
  32. Morales, A.J.; Borondo, J.; Losada, J.C.; Benito, R.M. Measuring political polarization: Twitter shows the two sides of Venezuela. Chaos 25 2015, 25. [Google Scholar] [CrossRef] [PubMed]
  33. Hohmann, M.; Devriendt, K.; Coscia, M. Quantifying ideological polarization on a network using generalized Euclidean distance. Science Advances 2023, 9. [Google Scholar] [CrossRef] [PubMed]
  34. Matakos, A.; Terzi, E.; Tsaparas, P. Measuring and moderating opinion polarization in social networks. Data Mining and Knowledge Discovery 31, 1480. [Google Scholar]
  35. Cinus, F.; Minici, M.; Monti, C.; Bonchi, F. The Effect of People Recommenders on Echo Chambers and Polarization. Proceedings of the Sixteenth International AAAI Conference on Web and Social Media, 2022, Vol. 16.
  36. Vicario, M.D.; Vivaldo, G.; Bessi, A.; Zollo, F.; Scala, A.; Caldarelli, G.; Quattrociocchi, W. Echo Chambers: Emotional Contagion and Group Polarization on Facebook. Scientific Reports 2016, 6. [Google Scholar] [CrossRef] [PubMed]
  37. Chitra, U.; Musco, C. Analyzing the Impact of Filter Bubbles on Social Network Polarization. WSDM ’20: Proceedings of the 13th International Conference on Web Search and Data Mining, 2020, p. 115–123.
  38. Garimella, K.; Morales, G.D.F.; Gionis, A.; Mathioudakis, M. Quantifying Controversy in Social Media. CoRR, 1507. [Google Scholar]
  39. Zhang, M.; Hurley, N. Avoiding monotony: improving the diversity of recommendation lists. RecSys ’08: Proceedings of the 2008 ACM conference on Recommender systems, 2008, p. 123–130.
  40. Gao, Z.; Shen, T.; Mai, Z.; Bouadjenek, M.R.; Waller, I.; Anderson, A.; Bodkin, R.; Sanner, S. Mitigating the Filter Bubble While Maintaining Relevance: Targeted Diversification with VAE-based Recommender Systems. SIGIR ’22: Proceedings of the 45th International ACM SIGIR Conference on Research and Development in Information Retrieval, 2022, p. 2524–2531.
  41. Ziegler, C.N.; McNee, S.M.; Konstan, J.A.; Lausen, G. Improving recommendation lists through topic diversification. WWW ’05: Proceedings of the 14th international conference on World Wide Web, 2005, p. 22–32.
  42. Castells, P.; Vargas, S.; Wang, J. Novelty and diversity metrics for recommender systems: Choice, discovery and relevance. International Workshop on Diversity in Document Retrieval, 2011.
  43. Murakami, T.; Mori, K.; Orihara, R. Metrics for Evaluating the Serendipity of Recommendation Lists. New Frontiers in Artificial Intelligence, 2009, Vol. 4914, p. 40–46.
  44. Keefer, P.; Knack, S. Polarization, Politics and Property Rights: Links Between Inequality and Growth. Public Choice volume 111.
  45. Garimella, K.; De Francisci Morales, G.; Gionis, A.; Mathioudakis, M. Reducing Controversy by Connecting Opposing Views. Proceedings of the Tenth ACM International Conference on Web Search and Data Mining; ACM: New York, NY, USA, 2017. [Google Scholar] [CrossRef]
  46. Garimella, K.; Gionis, A.; Parotsidis, N.; Tatti, N. Balancing Information Exposure in Social Networks. CoRR 2017, abs/1709.01491, [1709.01491].
  47. Musco, C.; Musco, C.; Tsourakakis, C.E. Minimizing Polarization and Disagreement in Social Networks. Proceedings of the 2018 World Wide Web Conference; International World Wide Web Conferences Steering Committee: Republic and Canton of Geneva, Switzerland, 2018. [Google Scholar] [CrossRef]
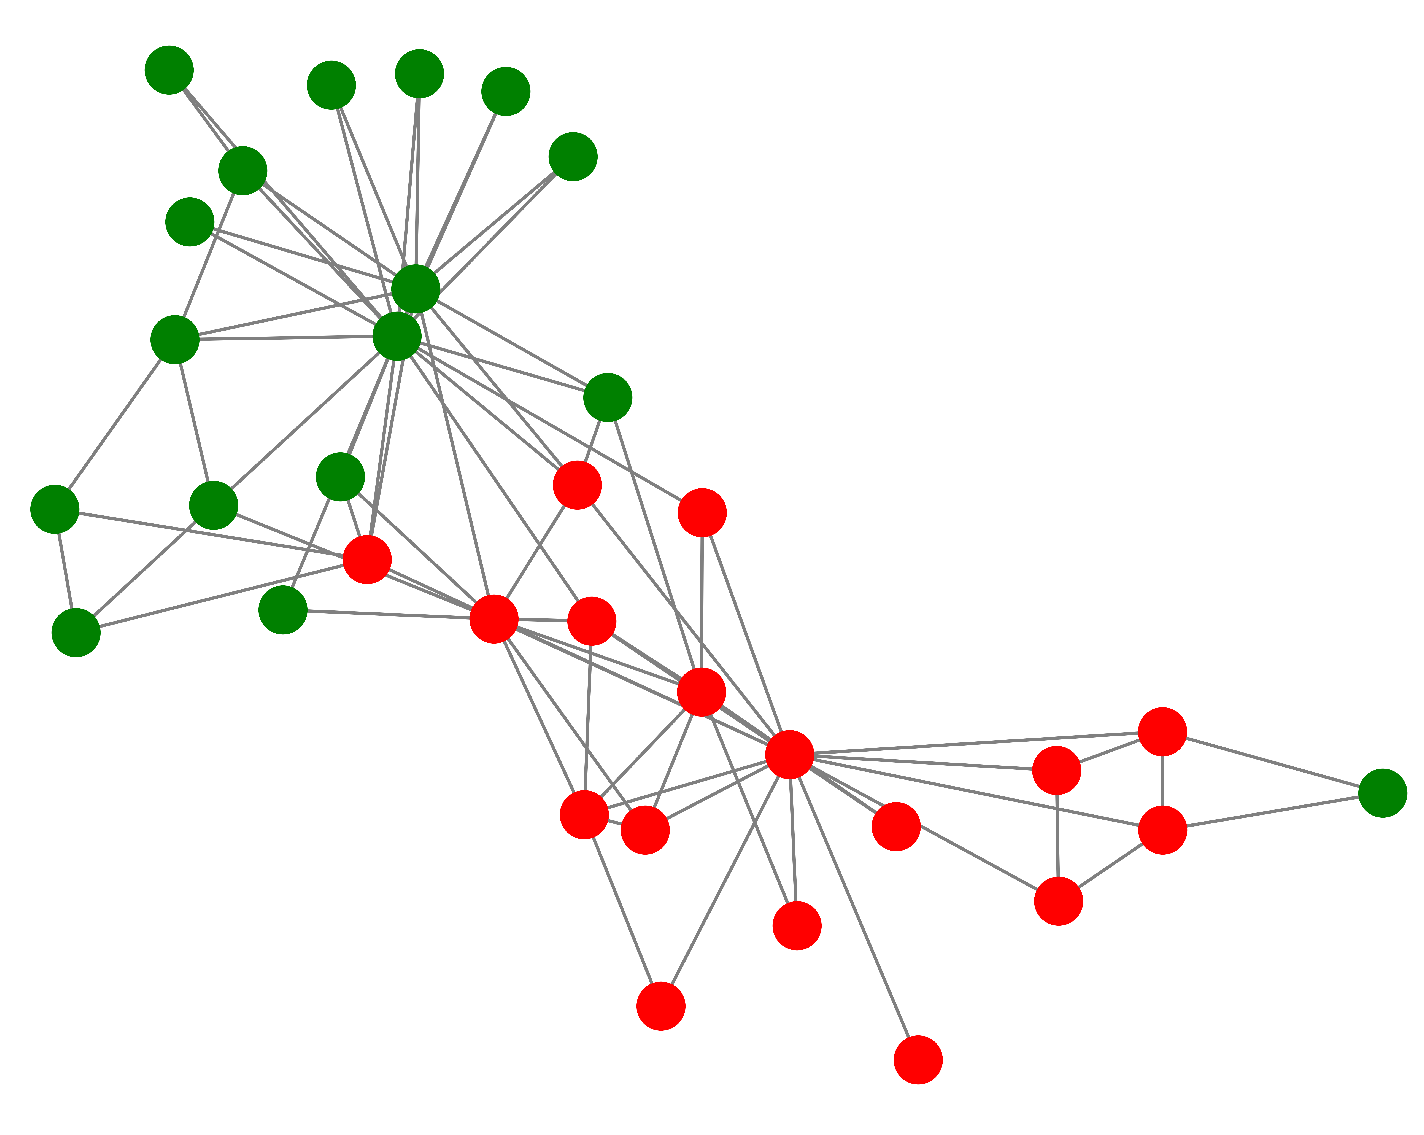
Figure 1. A polarised network.
Preprints 85544 g001
Figure 2. An unpolarized network.
Preprints 85544 g002
Figure 3. Graphical representation of Karate dataset.
Preprints 85544 g003
Figure 4. Graphical representation of Polbooks and Polblogs dataset.
Preprints 85544 g004
Figure 5. Plots of data distribution, polarization, edge strength, and density for the karate, polbook, polblog, and synthetic datasets (top to bottom).
Preprints 85544 g005
Figure 6. Comparison of Polarization Reduction Methods.
Preprints 85544 g006
Table 1. Dataset Summary Statistics.
Dataset Name Number of Nodes Number of Edges
Karate 34 78
Polbooks 105 441
Polblogs 1222 16717
Synthetic Data 6000 600000
Table 2. Effect on polarization by increasing internal edges. G1 edges, G2 edges: number of edges in group 1 and group 2, respectively. B_edges: Number of edges between the groups
G1 edges G2 edges B_edges Total edges Polarization
20000 15000 20000 55000 0.5567
50000 35000 20000 105000 0.7036
120000 115000 20000 255000 0.7947
130000 165000 20000 315000 0.8139
Table 3. Effect on polarization by increasing boundary edges
G1 edges G2 edges B_edges Total edges Polarization
130000 165000 50000 345000 0.7452
130000 165000 80000 375000 0.6906
130000 165000 110000 405000 0.6415
130000 165000 150000 445000 0.5908
Disclaimer/Publisher’s Note: The statements, opinions and data contained in all publications are solely those of the individual author(s) and contributor(s) and not of MDPI and/or the editor(s). MDPI and/or the editor(s) disclaim responsibility for any injury to people or property resulting from any ideas, methods, instructions or products referred to in the content.
Copyright: This open access article is published under a Creative Commons CC BY 4.0 license, which permit the free download, distribution, and reuse, provided that the author and preprint are cited in any reuse.
Prerpints.org logo

Preprints.org is a free preprint server supported by MDPI in Basel, Switzerland.

Subscribe

© 2024 MDPI (Basel, Switzerland) unless otherwise stated