Preprint
Article

Visualizing, Illustrating and Communicating Future Water Visions to Support Learning and Sustainability Transitions

Altmetrics

Downloads

113

Views

43

Comments

0

A peer-reviewed article of this preprint also exists.

Submitted:

19 September 2023

Posted:

20 September 2023

You are already at the latest version

Alerts
Abstract
A global existential and interlocking environmental, climate and cooperation/equity polycrisis is being faced, which increasingly impacts and is impacted by water and land systems. As a result, transformations in response are gaining increasing traction. Advances in approaches to visualising and communicating how innovations and changes in landscape features enable shifts, transformations and transitions are more crucial than ever before. Visions help focus actions, collaboration and alignment of multiple actors in working towards a common purpose, whilst also entering people’s consciousness at the deep level of values, transforming beliefs and consequently, thinking and action. They give direction on effort and pull on transformational innovation. The evidence-based ‘Water Visions Visualisation Platform’ presents an innovative and accessible way to illustrate, communicate and support future water visioning and strategizing at the landscape scale based on composite paradigms, scenarios, horizons and concepts. Plausible visions of the future are envisioned, illustrated, narratively described and qualitatively assessed, as well as connected with real-world examples and resources through the interactive Platform. This paper outlines the co-creation methodology, the architecture and the co-development of the Platform, as well as a preliminary evaluation through literature-based criteria and the sharing of the Platform with a number of audiences.
Keywords: 
Subject: Environmental and Earth Sciences  -   Environmental Science

1. Introduction

Scientific consensus suggests that the scale of global challenges faced in the current interlocking systemic polycrisis will require transformative change over a long-time scale to deliver sustainable outcomes, with different actions needed over different time horizons [1,2,3]. Global pressures have also resulted in cross-disciplinary consensus that in the water management context it is time to both critically review the effectiveness of existing policies, approaches, processes, technologies and mechanisms and take a fresh and more systematic exploration of how water management might look, cope and adapt from the present into the future [4,5,6,7,8]. This is of course not limited to water management but in depth coverage of other areas is beyond the remit of this paper, though we touch on different domains and sectors where they directly interconnect with water. Paradigm shifts and sustainability transitions for water management are key and a large volume of work exists highlighting the transformational changes required in long-term horizons, principles, approaches and strategies, as well as action, including towards more regenerative systems [9,10,11,12,13,14,15,16,17].
Consequently, to visualize and communicate these shifts, transitions and changes, it becomes necessary to collectively identify positive visions of the future. Such visioning and resultant visions provide hope, direction, gain commitment for a common cause and can lead to co-design of effective responses and programmes of action for a better future, pulling on transformational innovation, rather than dwelling on doom, gloom, catastrophe and plummeting people into eco-anxiety, despair and reactive responses. Visions can also act at the deeper level of peoples’ values and mental models; move effort away from "futures modelling" based on past trends and current system limitations; and cut through often contradictory individual and collective short-term opinions and actions. Visions provide a pathway towards long-term desired goals and a way of envisioning alternative futures [18,19,20,21,22].
However, understanding, translating, visualising and communicating the concepts, principles, innovations, layers of disciplines, scales, dimensions and actions behind paradigm shifts, sustainability transitions and transformational change are major challenges. These challenges require responses that act systemically, through circularity and across the nexus, thus requiring reframing and viewing our world as an overlapping, interconnected and interacting complex system rather than a complicated system. Sustainable and resilient adaptive water futures/catchment landscapes must therefore be viewed and visualised as complex socio-ecological-technical systems (SETS). Socio-ecological-technical systems (SETS) are defined where interactions occur across social and economic systems (socio); ecosystems, habitats and other natural systems (ecological); and infrastructure, built, engineered and technological systems (technical). This requires sectors to view these interacting systems as one integrated system rather than as separate systems. Several authors consider a false separation of these components (in conceptualisation, policy and management) to be a major reason for environmental and social decline that has reinforced a paradigm of failing attempts at protecting the ‘natural world’ from the ‘other separate’ degenerative, unsustainable, ‘human world’. This separation establishes conflicting and adversarial agendas in which nature generally loses out. Only once SETS are acknowledged and reframed across multiple domains can further effective, equitable, resilient and sustainable transformational change occur [20,21,22,23,24,25,26,27,28].
In addition, approaches to visioning and envisioning aim to enable people to suspend reality, visit a positive version of the future, bring back what they saw and shape it into something in the present that can lead back to the future. Such ‘backcasting’ methods produce visionary images of long-term futures that can motivate accelerated movement towards achieving sustainability goals. Backcasting often requires ‘generation of images of the future’, ‘construction of future visions’ or similar [29]. However, whilst visioning and backcasting is the act or process of making such mental ‘images’, what remains after this to represent that process and the futures discussed, is often not explicitly considered; artefacts remaining are often not coherent images or pictures or illustrations. Very few studies go beyond textual or diagrammatic future representations and [30] refer to these ‘images’ as being “…mental images of attainable futures…shaped by a collection of actors.” (pg. 1035); this is not to say all backcasting projects do not produce artistic depictions beyond these mental ones. Whilst artistic depictions of snapshots of the future abound for various topics and themes on the internet, they are often not tied to real-world visioning, backcasting or futures and are thus more akin to science fiction [31]. However, if future ‘images’ are to be powerful enough to capture people’s minds and imaginations and inspire exploration of challenges and opportunities, then backcasting and futures illustrations and artefacts need to creatively present what is possible through a range of media [28,31].
This brings us into the world of visualisation and communication (and to some extent e-learning), where storytelling and realistic illustrative depictions enable objects, people, nature, technology, infrastructures, systems and society to be situated in and connected across these futures, alongside the textual descriptions of the plans, goals, objectives, outcomes, feasibility, potential and consequences. The end result needs to be a way to communicate these whole-system illustrations of the future to audiences who were not party to the workshops and activities through which they were derived and whom did not formulate the textual or mental visions or images. In addition, in a fully participatory way, illustrated artefacts can be used to include people from across all walks of life in their re-interpretation and re-configuration ex-post. This can help non-scientists feel they are not excluded as opposed to always included; they can engage if and when they want rather than throughout their whole life [33]. As [23] also notes, envisioning the future with communities enables individuals and groups to bring aspects of their cultural and sub-cultural attributes into an otherwise potentially dominantly technocratic process.
From a science communication point of view, whether that be environmental science, climate change science or futures communication, the selection and use of messaging, narratives, storytelling and visual imagery has been subject to substantial research and practical guides issued from various organisations [31,32,33,34,35,36,37], [ISO 14063:2020]. Futures communication is in its early days and as [41] assert, whilst communication is noted as a crucial part of futures work, there are areas with limited or no published work and a definition of futures communication is needed. In a UK context [40] produced a list of ‘top tips’ for futures communication, synthesised from a network of over 300 Futures practitioners.
With this context and background in mind, the Environment Agency England, the Westcountry Rivers Trust and Plan Vision aimed to co-create a, proof of concept, interactive platform through which to explore illustrations and narrative visions of the future. Platform content would be underpinned with an extensive evidence synthesis [20], as well as real-world examples of the ‘art of possible’ and ‘pockets of the future in the present’. The Water Visions Visualisation Platform was co-created to achieve this aim and to act as a platform for further information collation, organisation, communication and deliberation.
The rest of this paper proceeds as follows: the next section outlines the Water Visions Visualisation Platform co-creation methodology. This is followed by a section outlining a brief ‘user journey’ through the Platform to demonstrate the illustrations and interactive elements (to undertake a full interactive journey please visit: https://wrt.org.uk/project/water-visions/). The penultimate section provides a preliminary evaluation of the Platform based on the initial monitoring and evaluation activities and contextualizes them in the literature. A final section brings all previous sections together in concluding remarks and recommendations.

2. Co-creation methodology

The Water Visions Visualisation Platform (‘Platform’) project set out to co-develop illustrations (visualisations) of future regenerative, sustainable, resilient, shared and socially just landscapes to showcase and communicate evidence-based material and the ‘art of the possible’ in relation to sustainability transitions with a focus on water. The aim was to provide accessible, inclusive visualisations and other supporting content to enable stakeholders with highly diverse levels of prior knowledge and technical skills to engage with and co-develop a shared vision for future SETS landscapes.
The illustrations and wider Platform needed to help illustrate landscape wide interventions (urban and rural) as well as coherent systemic programmes of interventions; illustrate and promote consideration of different routes to resilient, sustainable, regenerative and socially just landscapes to benefit all; depict a shift to more coherent management and governance of artificial (grey) and natural (blue/green) infrastructure, technology and processes to deliver resilient and sustainable water and environmental systems; highlight possible futures for farming/food production, land management, water service provision and waste processing, blue-green urban landscapes and the increased (but appropriate) use of nature-based solutions to support thriving communities and businesses; be flexible in terms of self-guided or pre-designed tours of the material and for updating, wider input and further co-design.
Consequently, stages of the work included:
  • a rapid scoping review and workshops on key concepts, principles and approaches identified in the science discourse, such as systems thinking and analysis; management change; circular economy principles; regenerative methods; water-energy-food-nexus; polycentric governance; co-creation; shared values; the Three Horizons Framework; scenario planning and policy mapping; Systems Innovation Approach; future visioning, future-scaping, envisioning, transition pathways, adaptive pathways and the ‘What if’ approach; forecasting and backcasting; bioregional planning; landscape frameworks and optioneering; and communication and pedagogy [17,20,23,29,31,36,42,43,44,45,46,47,48,49,50,51,52,53,54,55,56,57,58,59,60,61];
  • synthesis of this material into provisional scenarios based on axes of econo-centric to eco-centric and technology for private good to technology for public good.
  • co-development of a visualisation ‘architecture’ framework to accommodate visual and narrative description of elaborative content and synthesis;
  • co-development of conceptual and technical designs for the illustrations and supporting information;
  • co-development of interactive content with links to supporting resources;
  • delivery of initial ‘pilot-testing’ to high-level audiences and a formal launch to wider audiences.
As the visualisations represent the physical landscape with horizons, paradigms, scenarios, visions and futures playing out across them, the three detailed visualisations and one wireframe (to represent a socio-eco-centric scenario which is difficult to illustrate and poorly supported by easily accessible by literature and/or to enable stakeholder and community workshopping) are consequently referred to as:
  • Landscape 1 (L1) - ‘Unsustainable’;
  • Landscape 2 (L2) - ‘In Transition’;
  • Landscape 3 (L3) - ‘Regenerative Sustainability’;
  • Landscape 4 (L4) – Regenerative Utopia/Transformed.
In a very general sense L1 operates within an ‘econo-technical’ paradigm (economics and technology are the dominant drivers); L2 and L3 in an ‘eco-technical’ paradigm (ecology and technology are increasingly the dominant drivers) and L3 and L4 operate within a socio-ecological-(technological) paradigm (where social and ecological aspects are the dominant drivers with technology focused to support the optimisation of these). These paradigms are described further as vignettes in [20].
To fully commence the co-creation process, a reframing of the ‘desirable’ characteristics of the ‘art of the possible’ for such future water visions of the complex catchment landscape systems and sub-systems was required, which is summarised in Table 1. This was used as a starting and return point to ensure the visualisations were progressing as needed. The co-creation methodology subsequently took the following steps:
i.
Co-defining the system and timescales: sub-systems, capitals, features and actions;
ii.
Assessing and visualising system services and nexus outcomes (‘benefits’);
iii.
Co-production of illustrations, messages and narrative content.
The methodology to co-create the visualisation platform developed and evolved organically as the project participants developed an understanding of each other’s perspectives, knowledges, ideas, preferences, ways of working and requirements through meetings, workshops and other communications (e.g. emails, documents). The Theory of Change approach [62,63] was used to track the work for monitoring and evaluation.

2.1. Co-defining the system and timescales: sub-systems, capitals, features and actions

A number of online tools, such as MURAL, were used to facilitate meetings and workshops and digital workspaces, such as MS Teams, were used to share materials, resources, working documents and other files. MURAL boards covered (example in Figure 1):
  • A workshop to brainstorm visualisation of sustainable landscapes – to collate knowledge, references, examples, images, diagrams, ideas and suggestions on perspectives, approaches, frameworks, tools, innovations, features etc to include in the visualisation platform;
  • A workshop to undertake scenario and policy mapping – to map out existing policy and suggest potential future policy requirements for three scenarios/horizons/visions along a timeline out to 2050-80 (or ‘open’), covering policy, governance and society and identifying barriers to change at the micro and macro scale;
  • A workshop to determine Landscape 1 and 2 feature label allocation, messaging and narrative development tasks – agreeing on label length, content and convention was crucial to ensure consistency in the visualisation platform textual content to enable ease of recognition, association and navigation during the user experience;
  • A workshop to explore Landscape 3 features and undertake sharing, monitoring and evaluation planning – to brainstorm ideas for a landscape representing transformation/transition (i.e. including full implementation across the SETS of regenerative, circular, nexus approaches etc).
These MURAL boards were active documents that were contributed to by all participants throughout the project duration. Boards were synthesised into Excel spreadsheets using a bespoke structure based on the content and architecture needed to begin to develop and populate the elements of the visualisations. A deliberative process was undertaken [64,65] using the initial MURALs and spreadsheets to determine the elements that would form the main foci for the illustrations. The spreadsheets were also used to track all of the components required in their co-creation (images, links, resources).
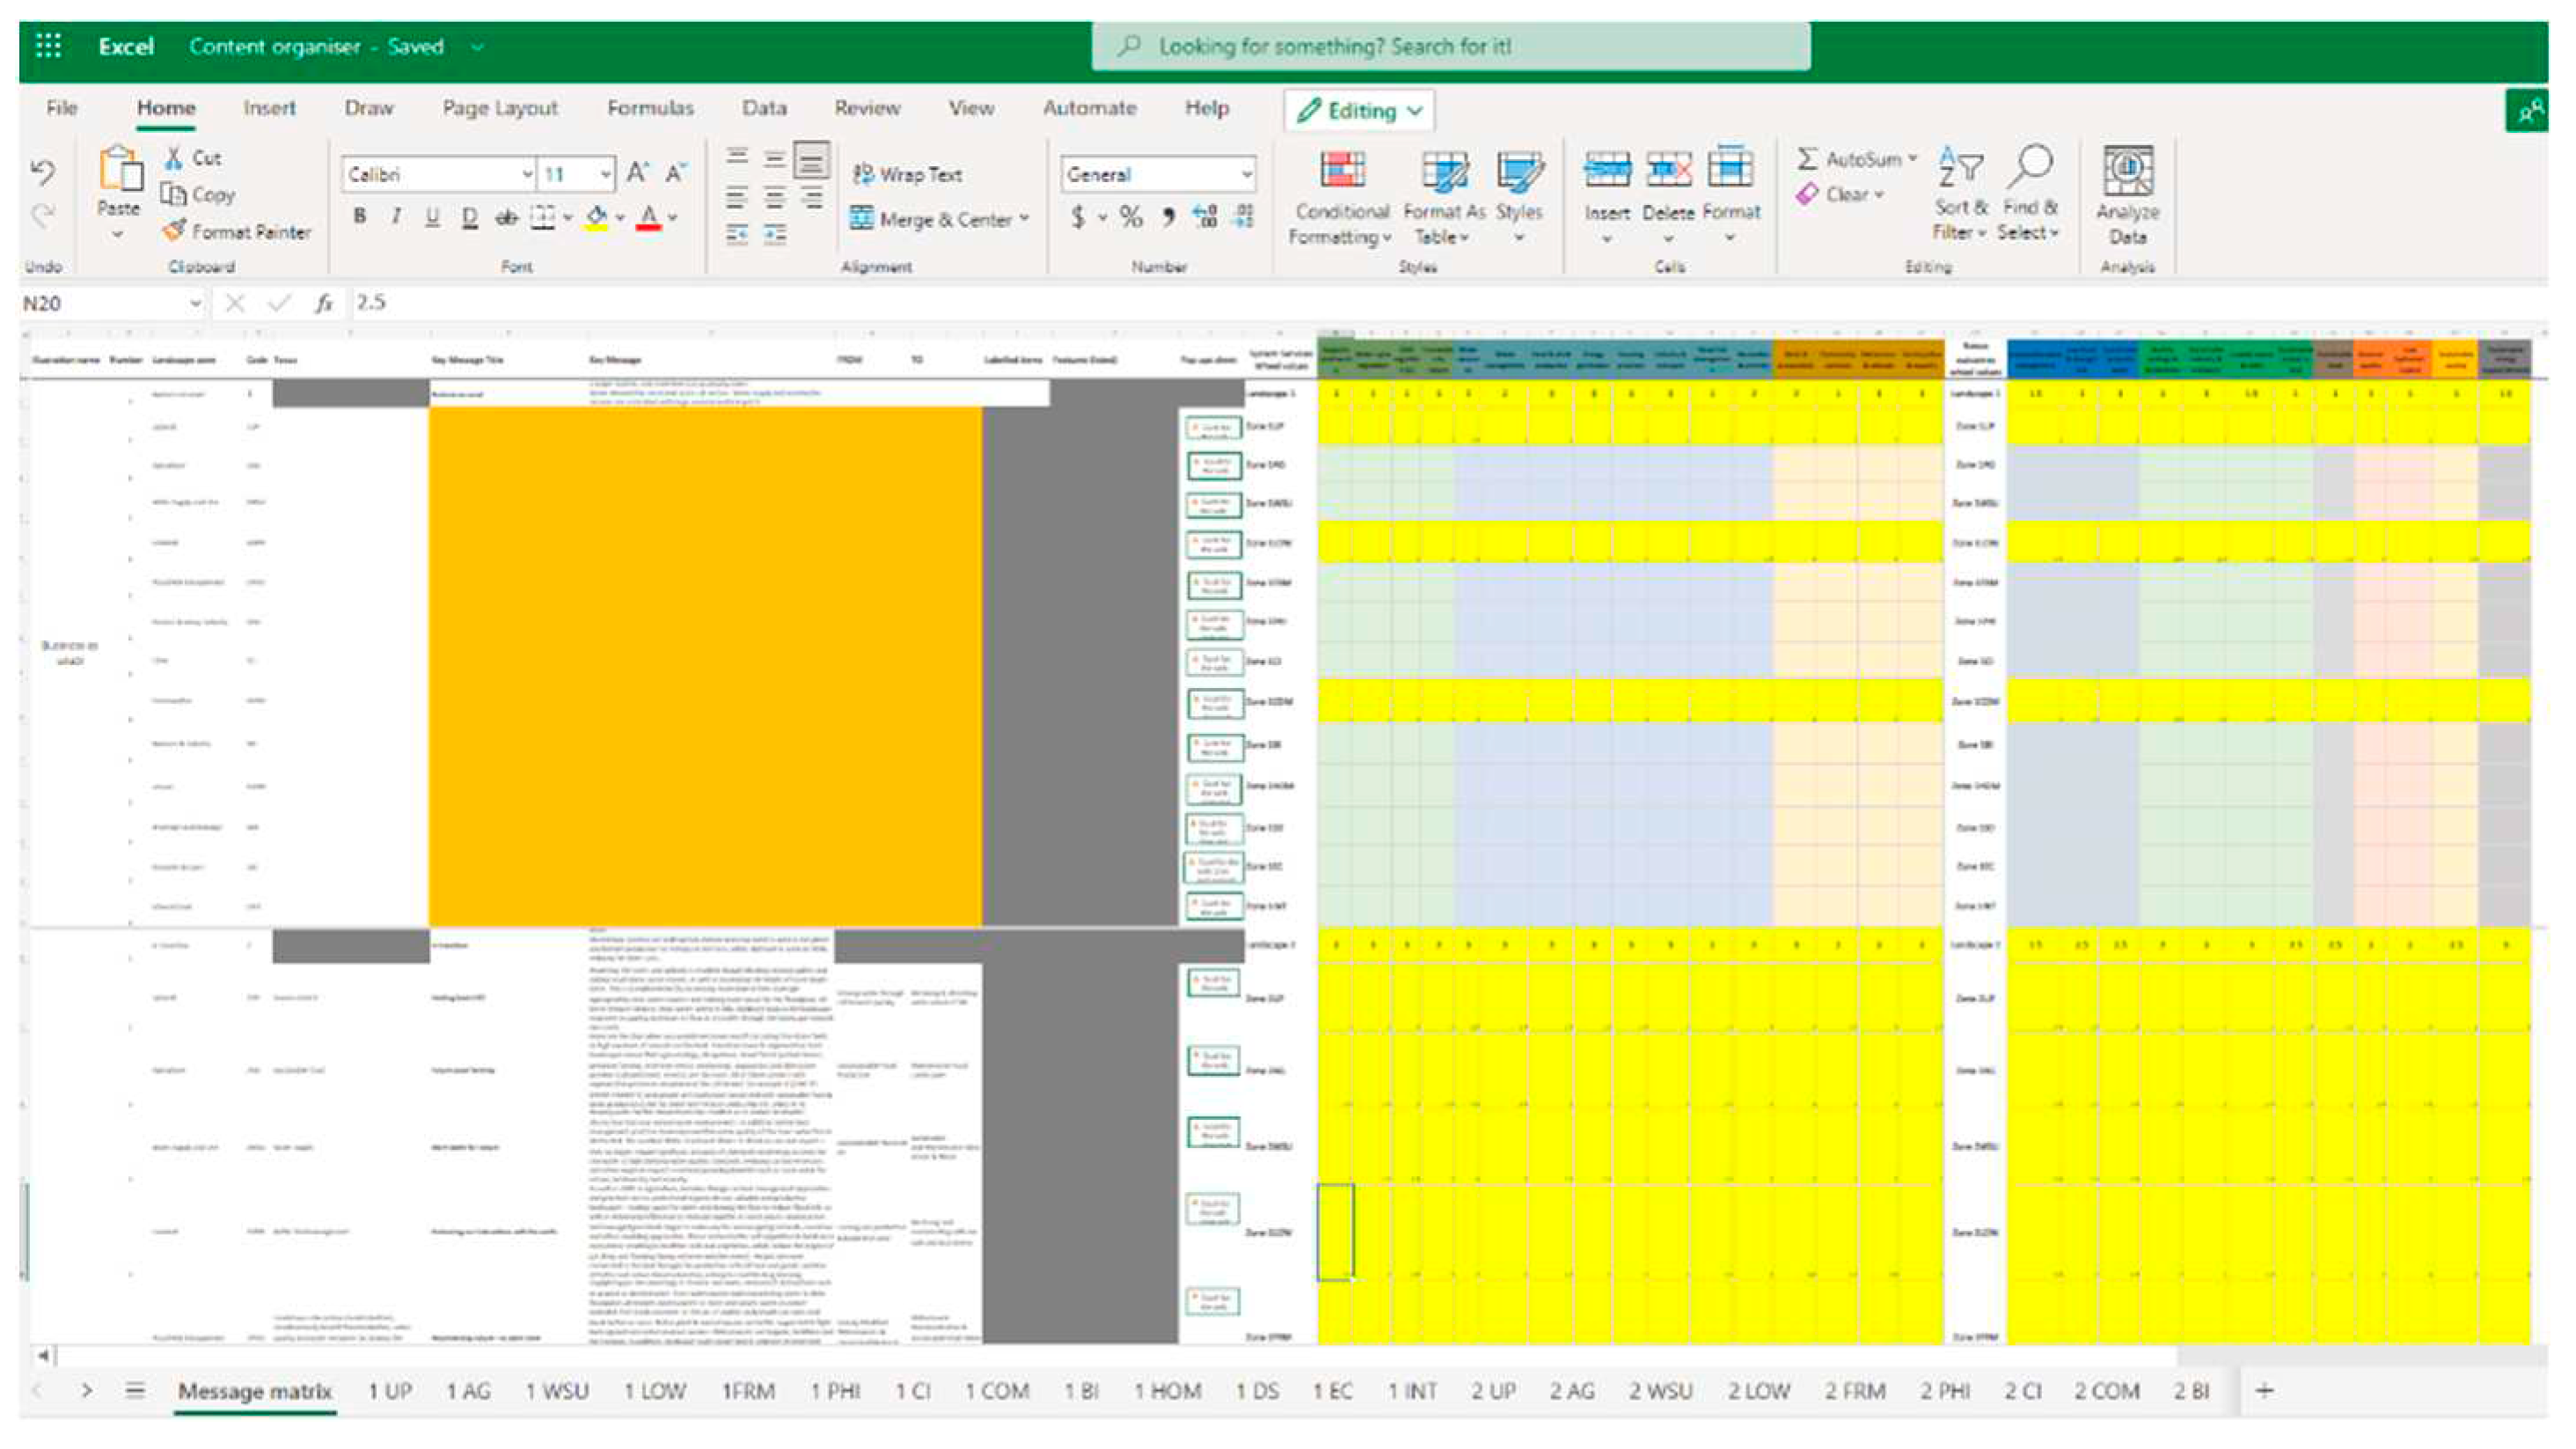
The elements represented sub-systems – water, energy, waste, transport, food; capitals – natural, built/infrastructure and socio-cultural; assets/features – individual technologies, processes, policies and transactions; actions/pathways – shifts in function and feature representing steps of change; and timescales – present, range of futures. Repositories, inventories and finally an online Content Organiser (Figure 2) were iteratively developed to dynamically collate all elements underpinning the visualisation platform architecture into one place. The creation of the repositories and inventories enabled the illustration elements to be finalised and communicated to Plan Vision (project partner illustrator) to enable the illustration work to commence. The evolution of the repositories and inventories into the Content Organiser then enabled the mapping of the elements and illustrations to a ThingLink architecture in order to begin construction of the interactive visualisation Platform. However, before this step was undertaken, ‘benefit wheels’ were developed in order to enable users to compare the ‘3 capitals’ performance of the outlined elements.

2.2. Assessing and visualising system services and nexus outcomes (‘benefits’)

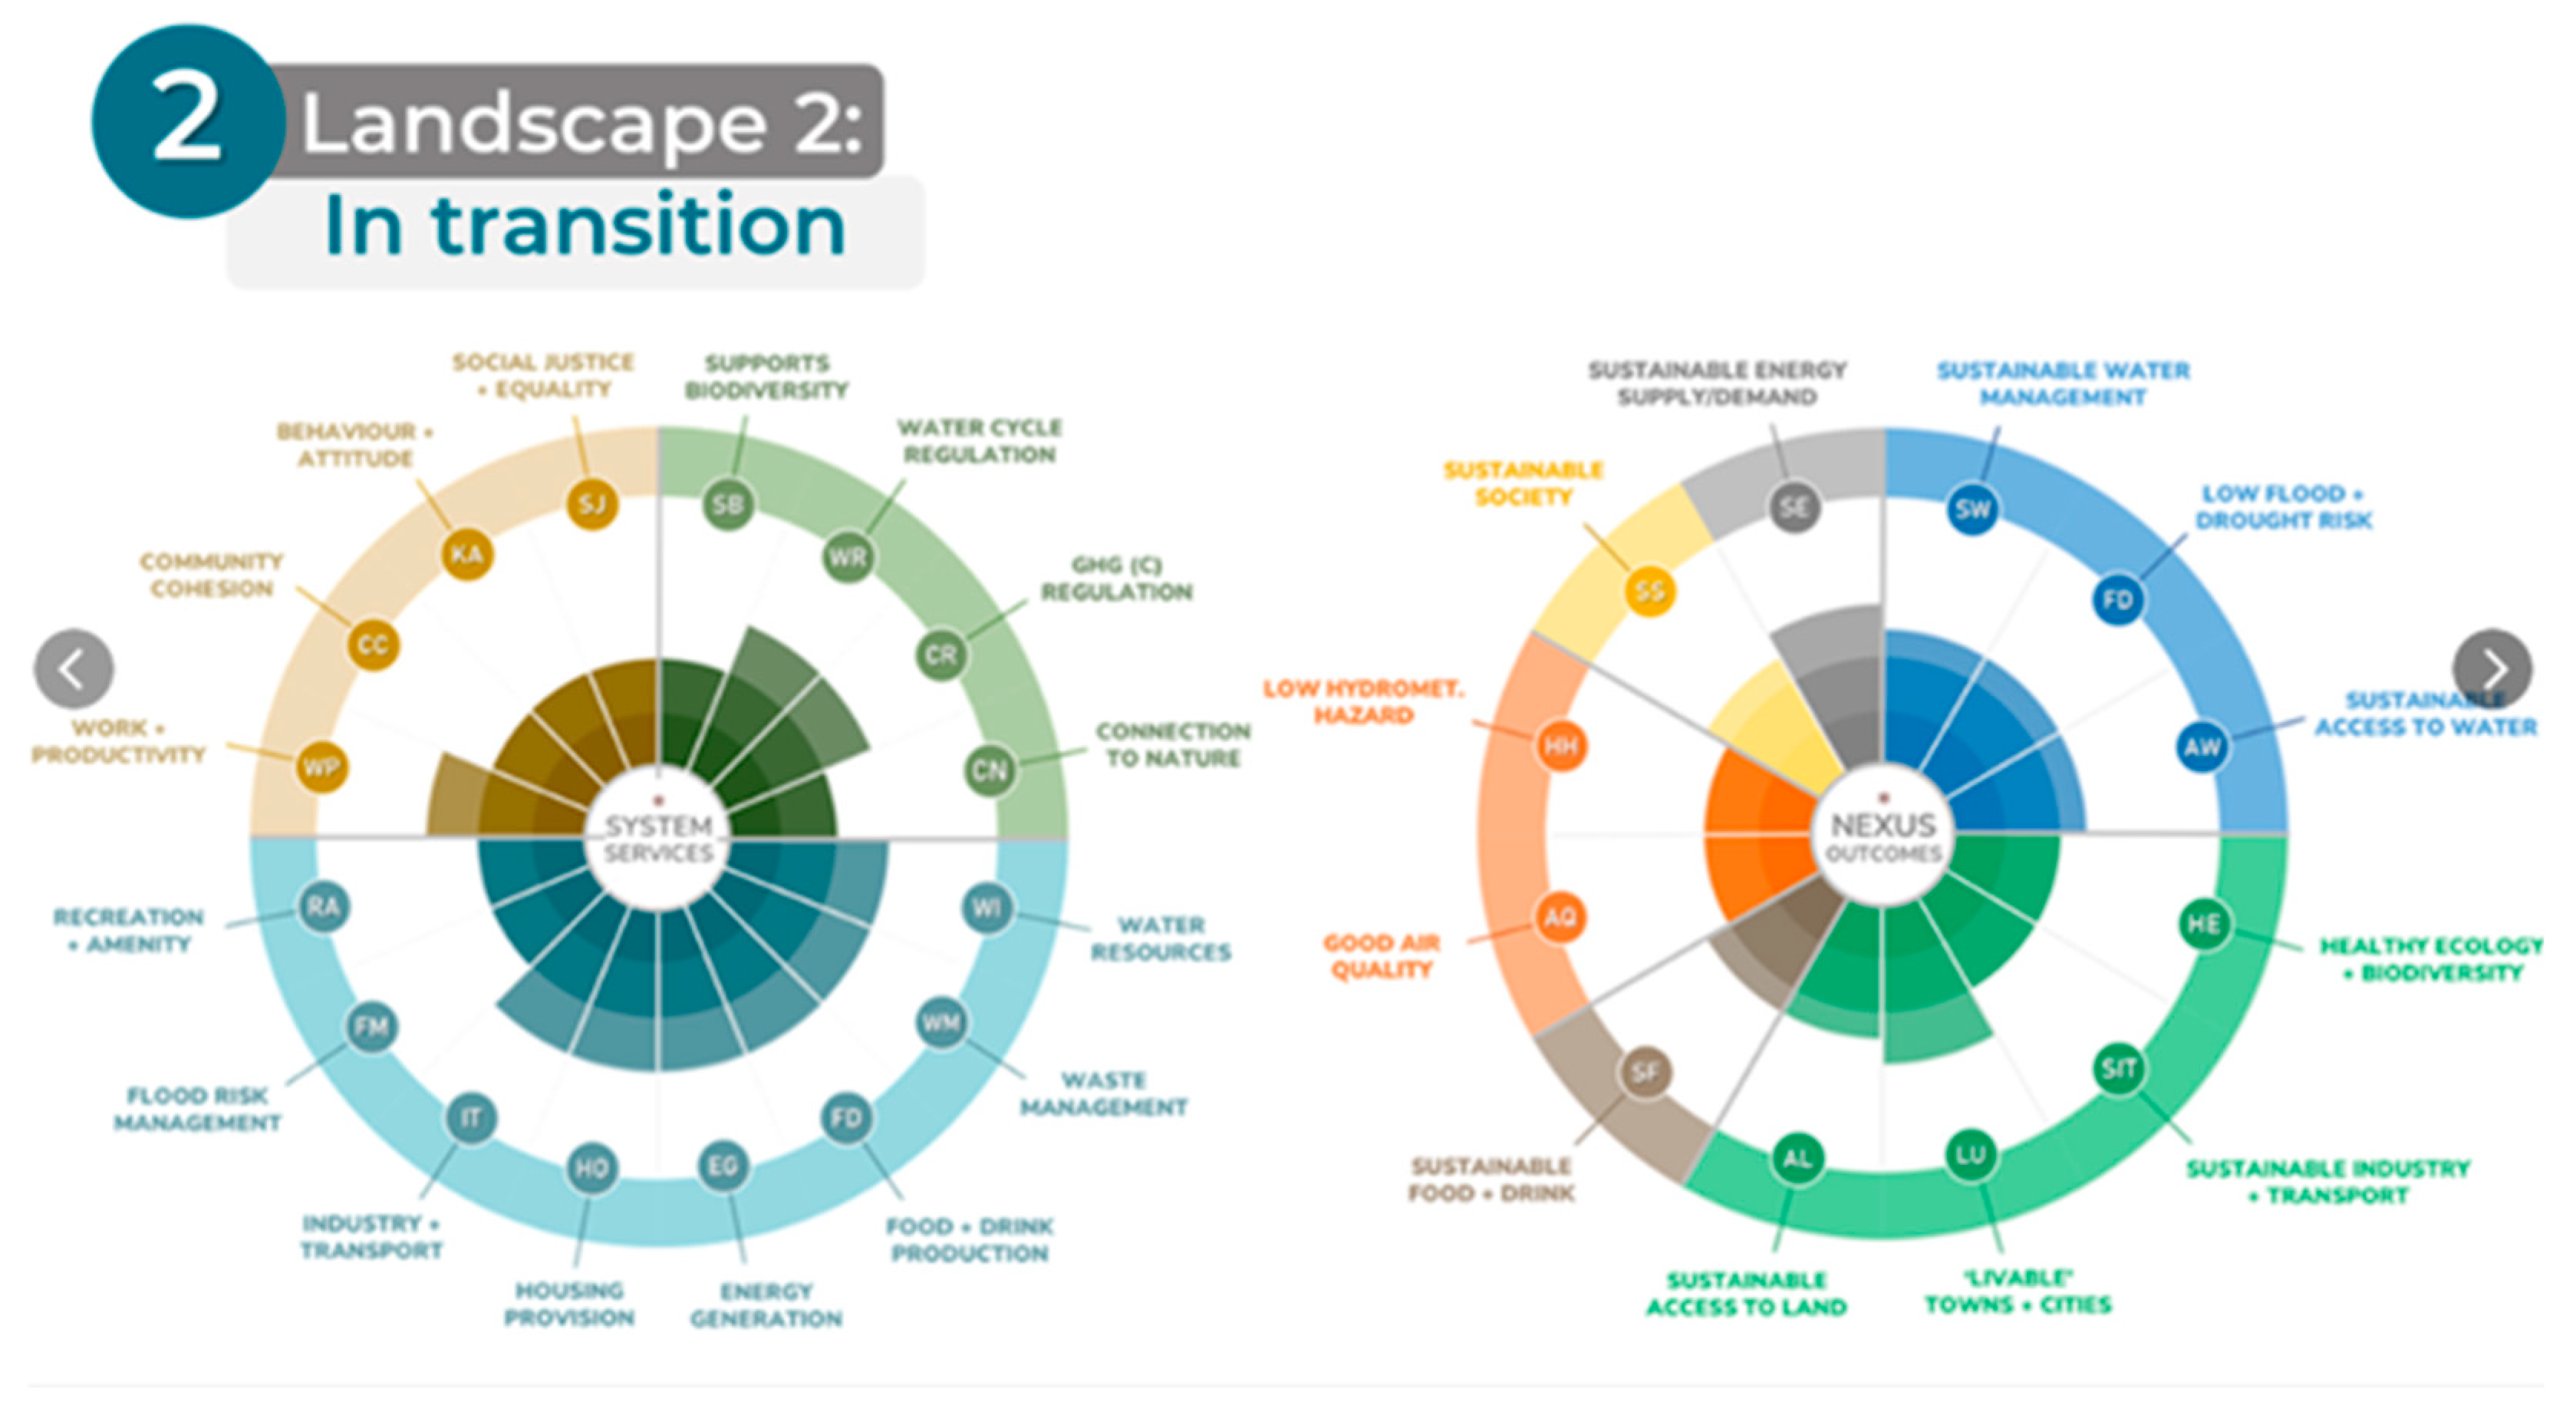
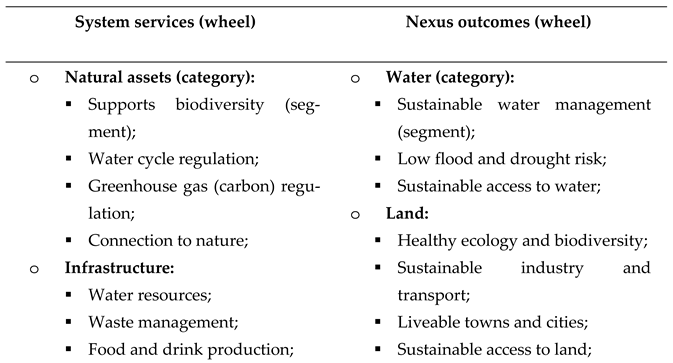
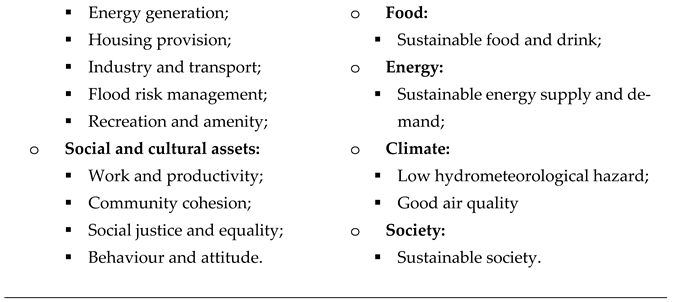
The Local Action Project’s Opportunities Assessment Method [66,67], which is used to visualise various metrics in the form of ‘wheels’, was built on and adapted for application to the visualization platform to produce wheels to embed in the Platform. The adaptations required co-defining and adding additional metrics to represent benefits provided by the landscapes, zones and features with a focus on their performance and contributions to sustainability. Additional metrics focused on resilience, sustainability and the nexus components and led to the development of two separate wheels focused on System Services and Nexus Outcomes, which are summarised in Table 2 and an example wheel illustration in Figure 3. The Content Organiser was used to collate expert opinion scores (provided by project participants) for each of the System Services and Nexus Outcomes metrics. This was undertaken at the whole landscape level, for each landscape zone and system and for all the features within each landscape zone and system. The wheels enable the performance and contribution of the different features, zones and systems to be compared across the landscapes, as well as being able to undertake a comparison at the overarching landscape level. The wheels were based on deliberation by project participants in the first instance but allow for wider participatory deliberative discussion and revision or modification through future co-development phases.

2.3. Co-production of illustrations, messages and narrative content

The completion of the Content Organiser and the initiation of the construction of the wheels, enabled the project to shift into the illustration, messaging and narrative co-production phase. During the workshops it emerged that more than illustrations would be needed to convey the concepts, principles and messages the project aimed to communicate and therefore the approach was modified so that accompanying each Landscape, Zone, System and Feature was a detailed textual narrative to provide context and depth to the illustrations. Illustrations and narratives were drawn and written iteratively in parallel to enable them to eventually be connected together within the ThingLink Platform. The Platform allows for further narrative and other information and media to be attached through embedding additional links to further better describe and illustrate concepts, principles and messages and to provide case studies of them the concepts ‘in action’.
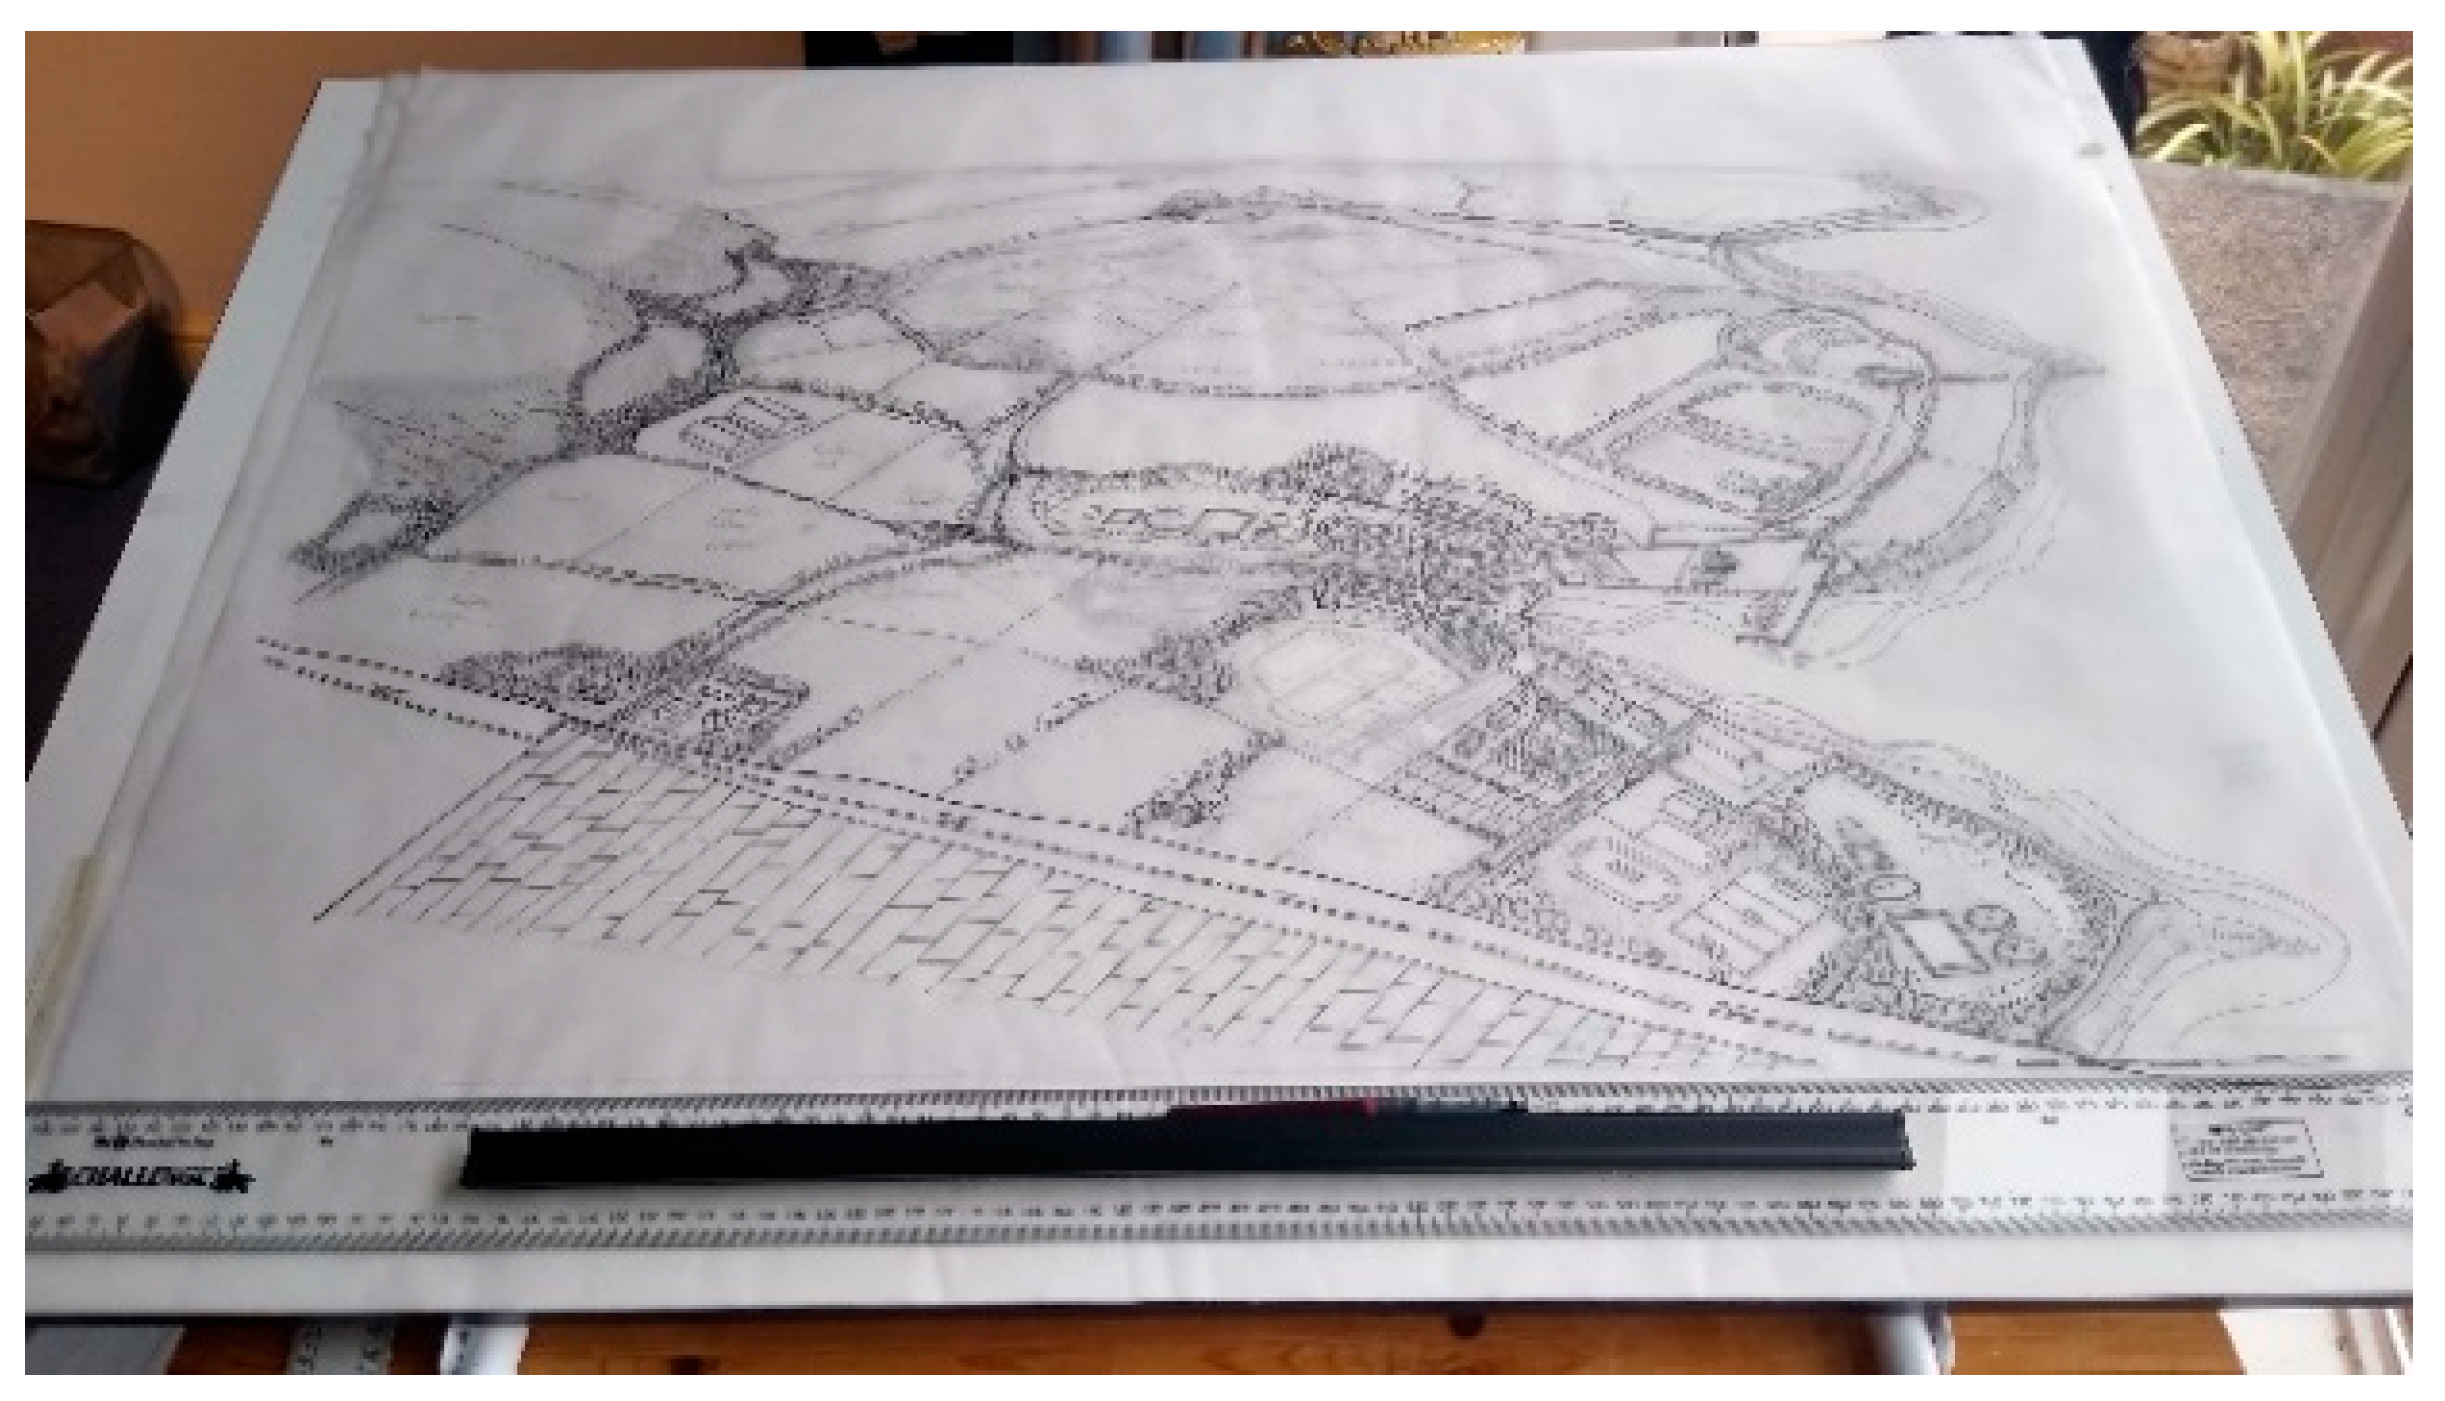
Illustrations of the main three Landscapes were sketched on layers of A0 (L1-3) tracing paper in ink as wireframes during the first iteration (Figure 4), allowing time for feedback and style and content shifts as needed. Vignettes or ‘zoomed in’ areas, which became the ‘Zones’ were also produced at this time. This style of illustration and process was consciously chosen, as it brings humanity, comfort and connection into the illustrations, which can be missing from illustrations and graphics produced through more graphic design and computer aided design (CAD) methods and processes. Following this first stage, an initial colour version of each whole Landscape and Zone containing detailed Features was produced, shared and reflected upon for Landscapes 1, 2 and 3. Minor changes, edits and updates were then made, before the final illustrations were produced.
The whole landscape colour illustrations bring the Platform user/viewer into the world of water and land management, situating them as the explorer of this world – in either a self-guided or guided way depending on journey type, which is discussed in the following section. The Zones and Systems enable users to zoom in to a more manageable and visually more ‘friendly’ vignette scale, which draws them into the detail of what is featured and what is happening in the Zone or System they have chosen to explore. As the user becomes more comfortable with what they are viewing, they may choose to explore the detail of the Features and interact with the clickable elements of the Landscapes.
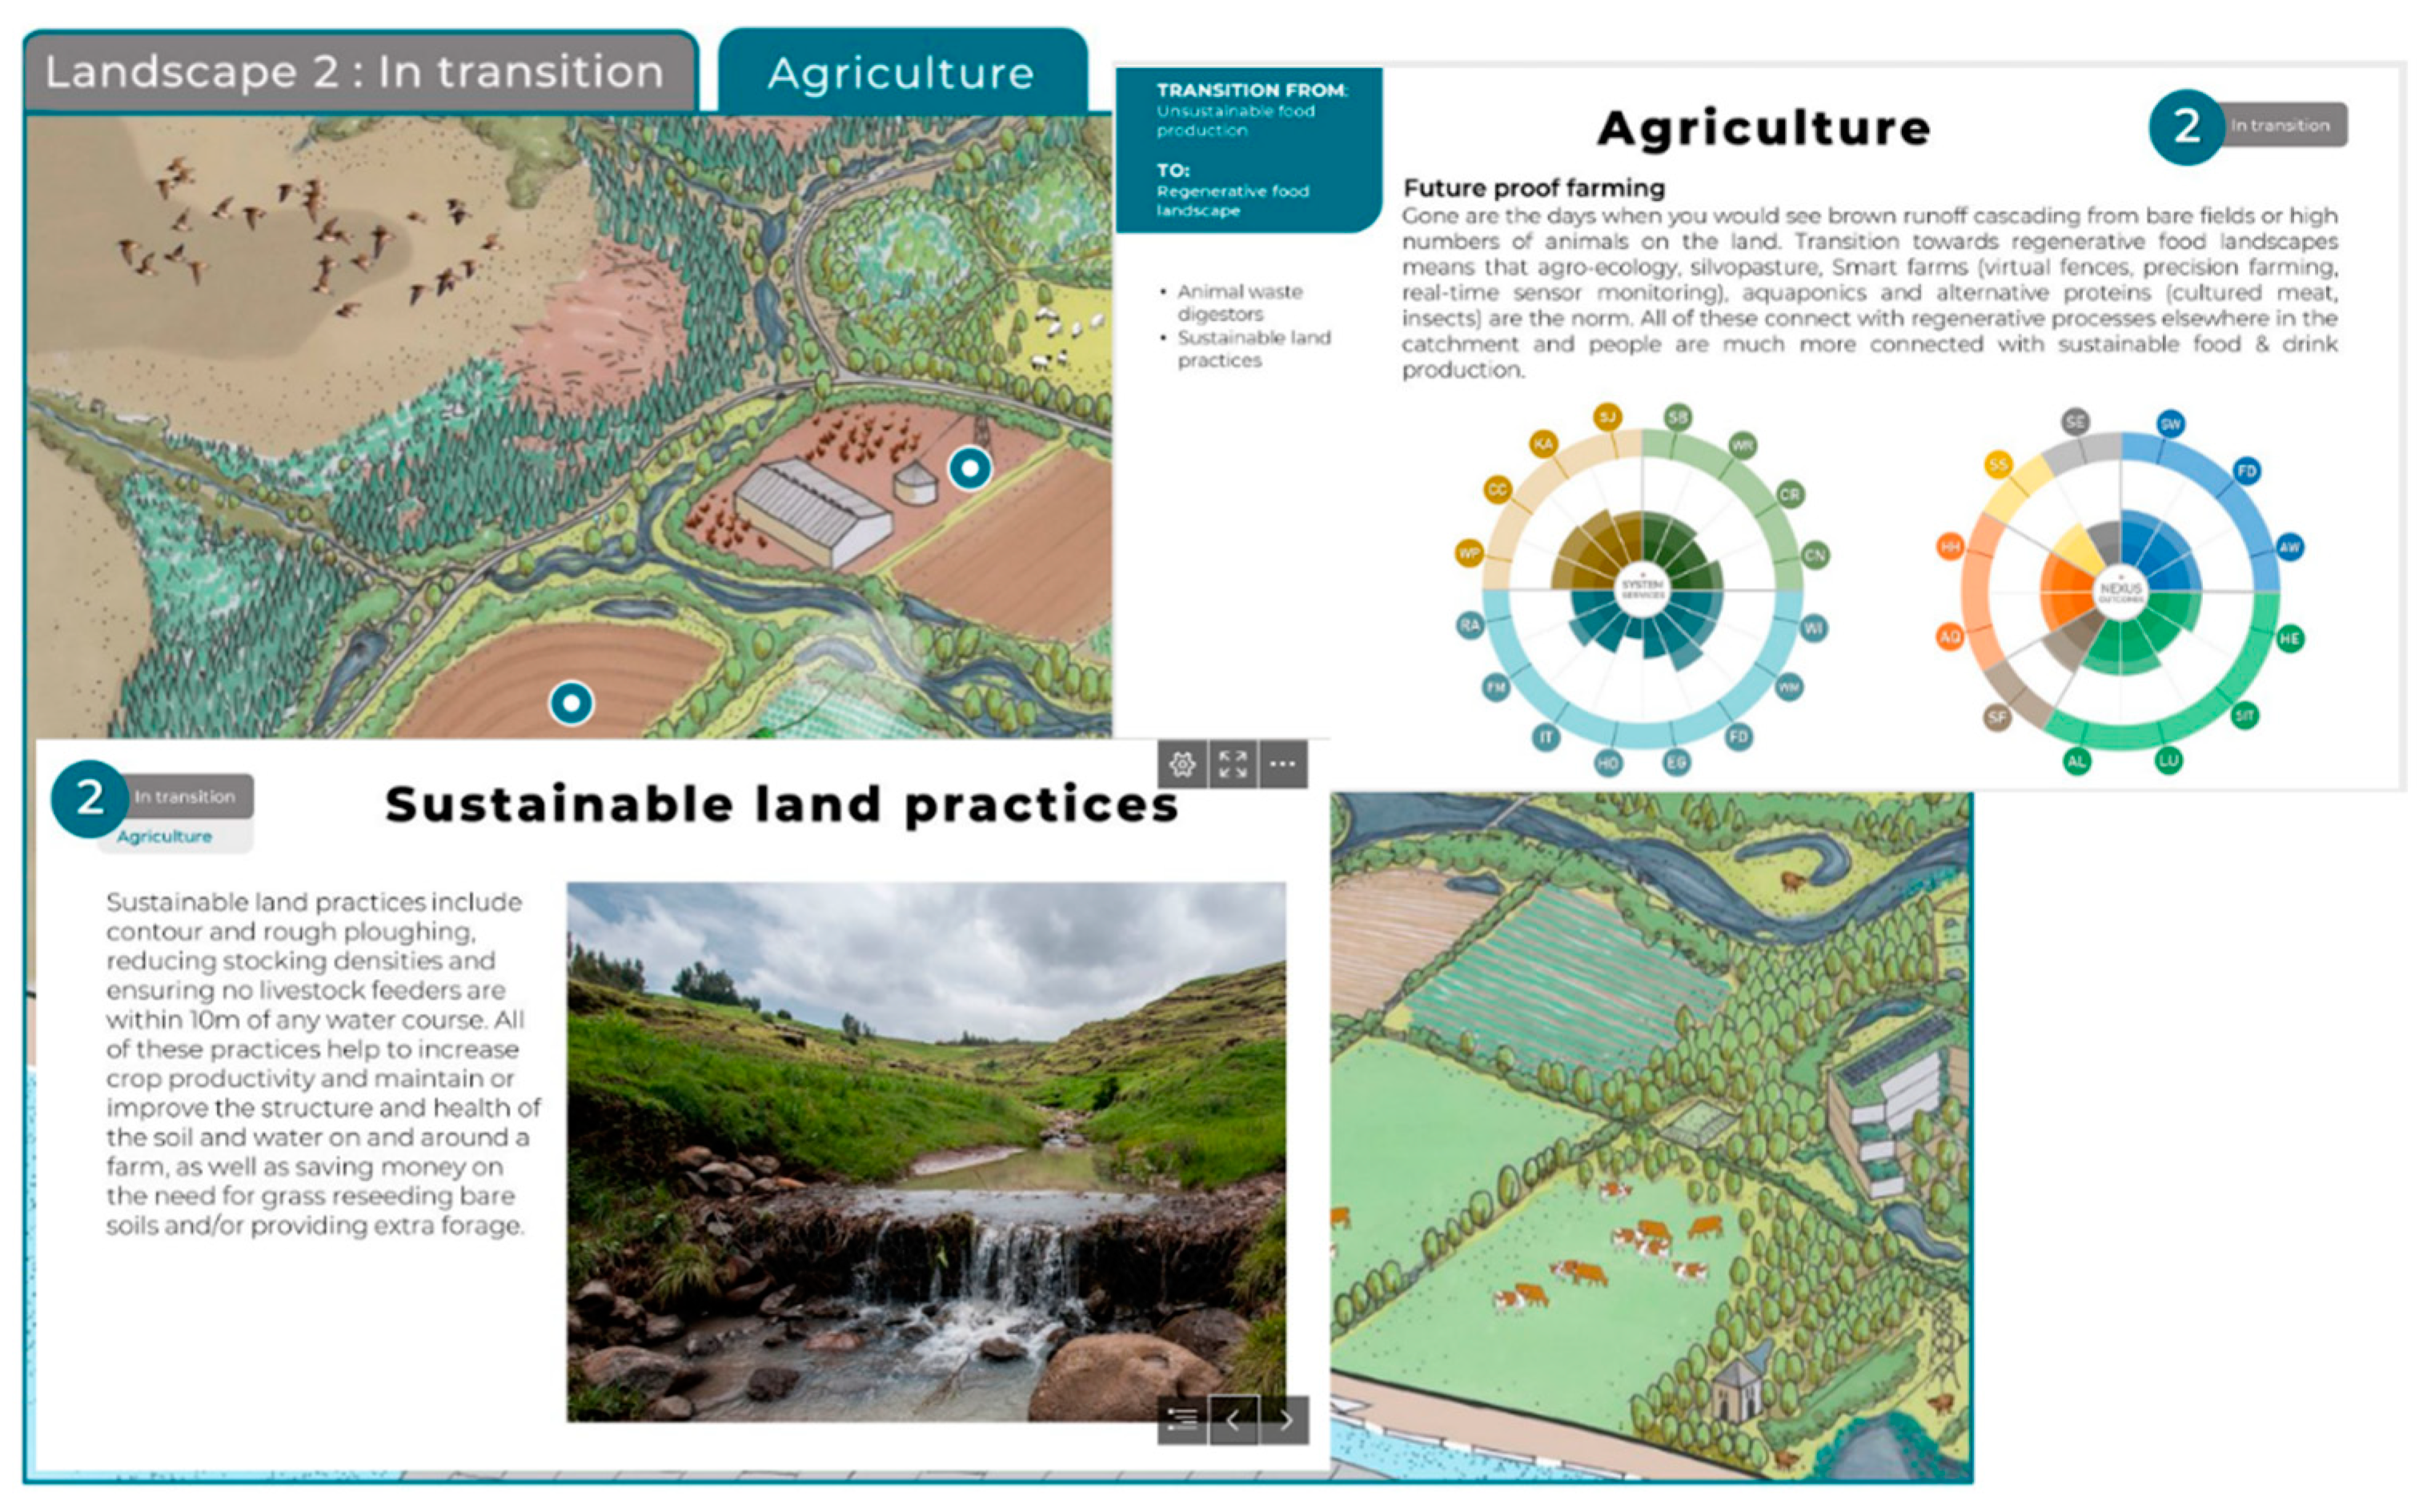
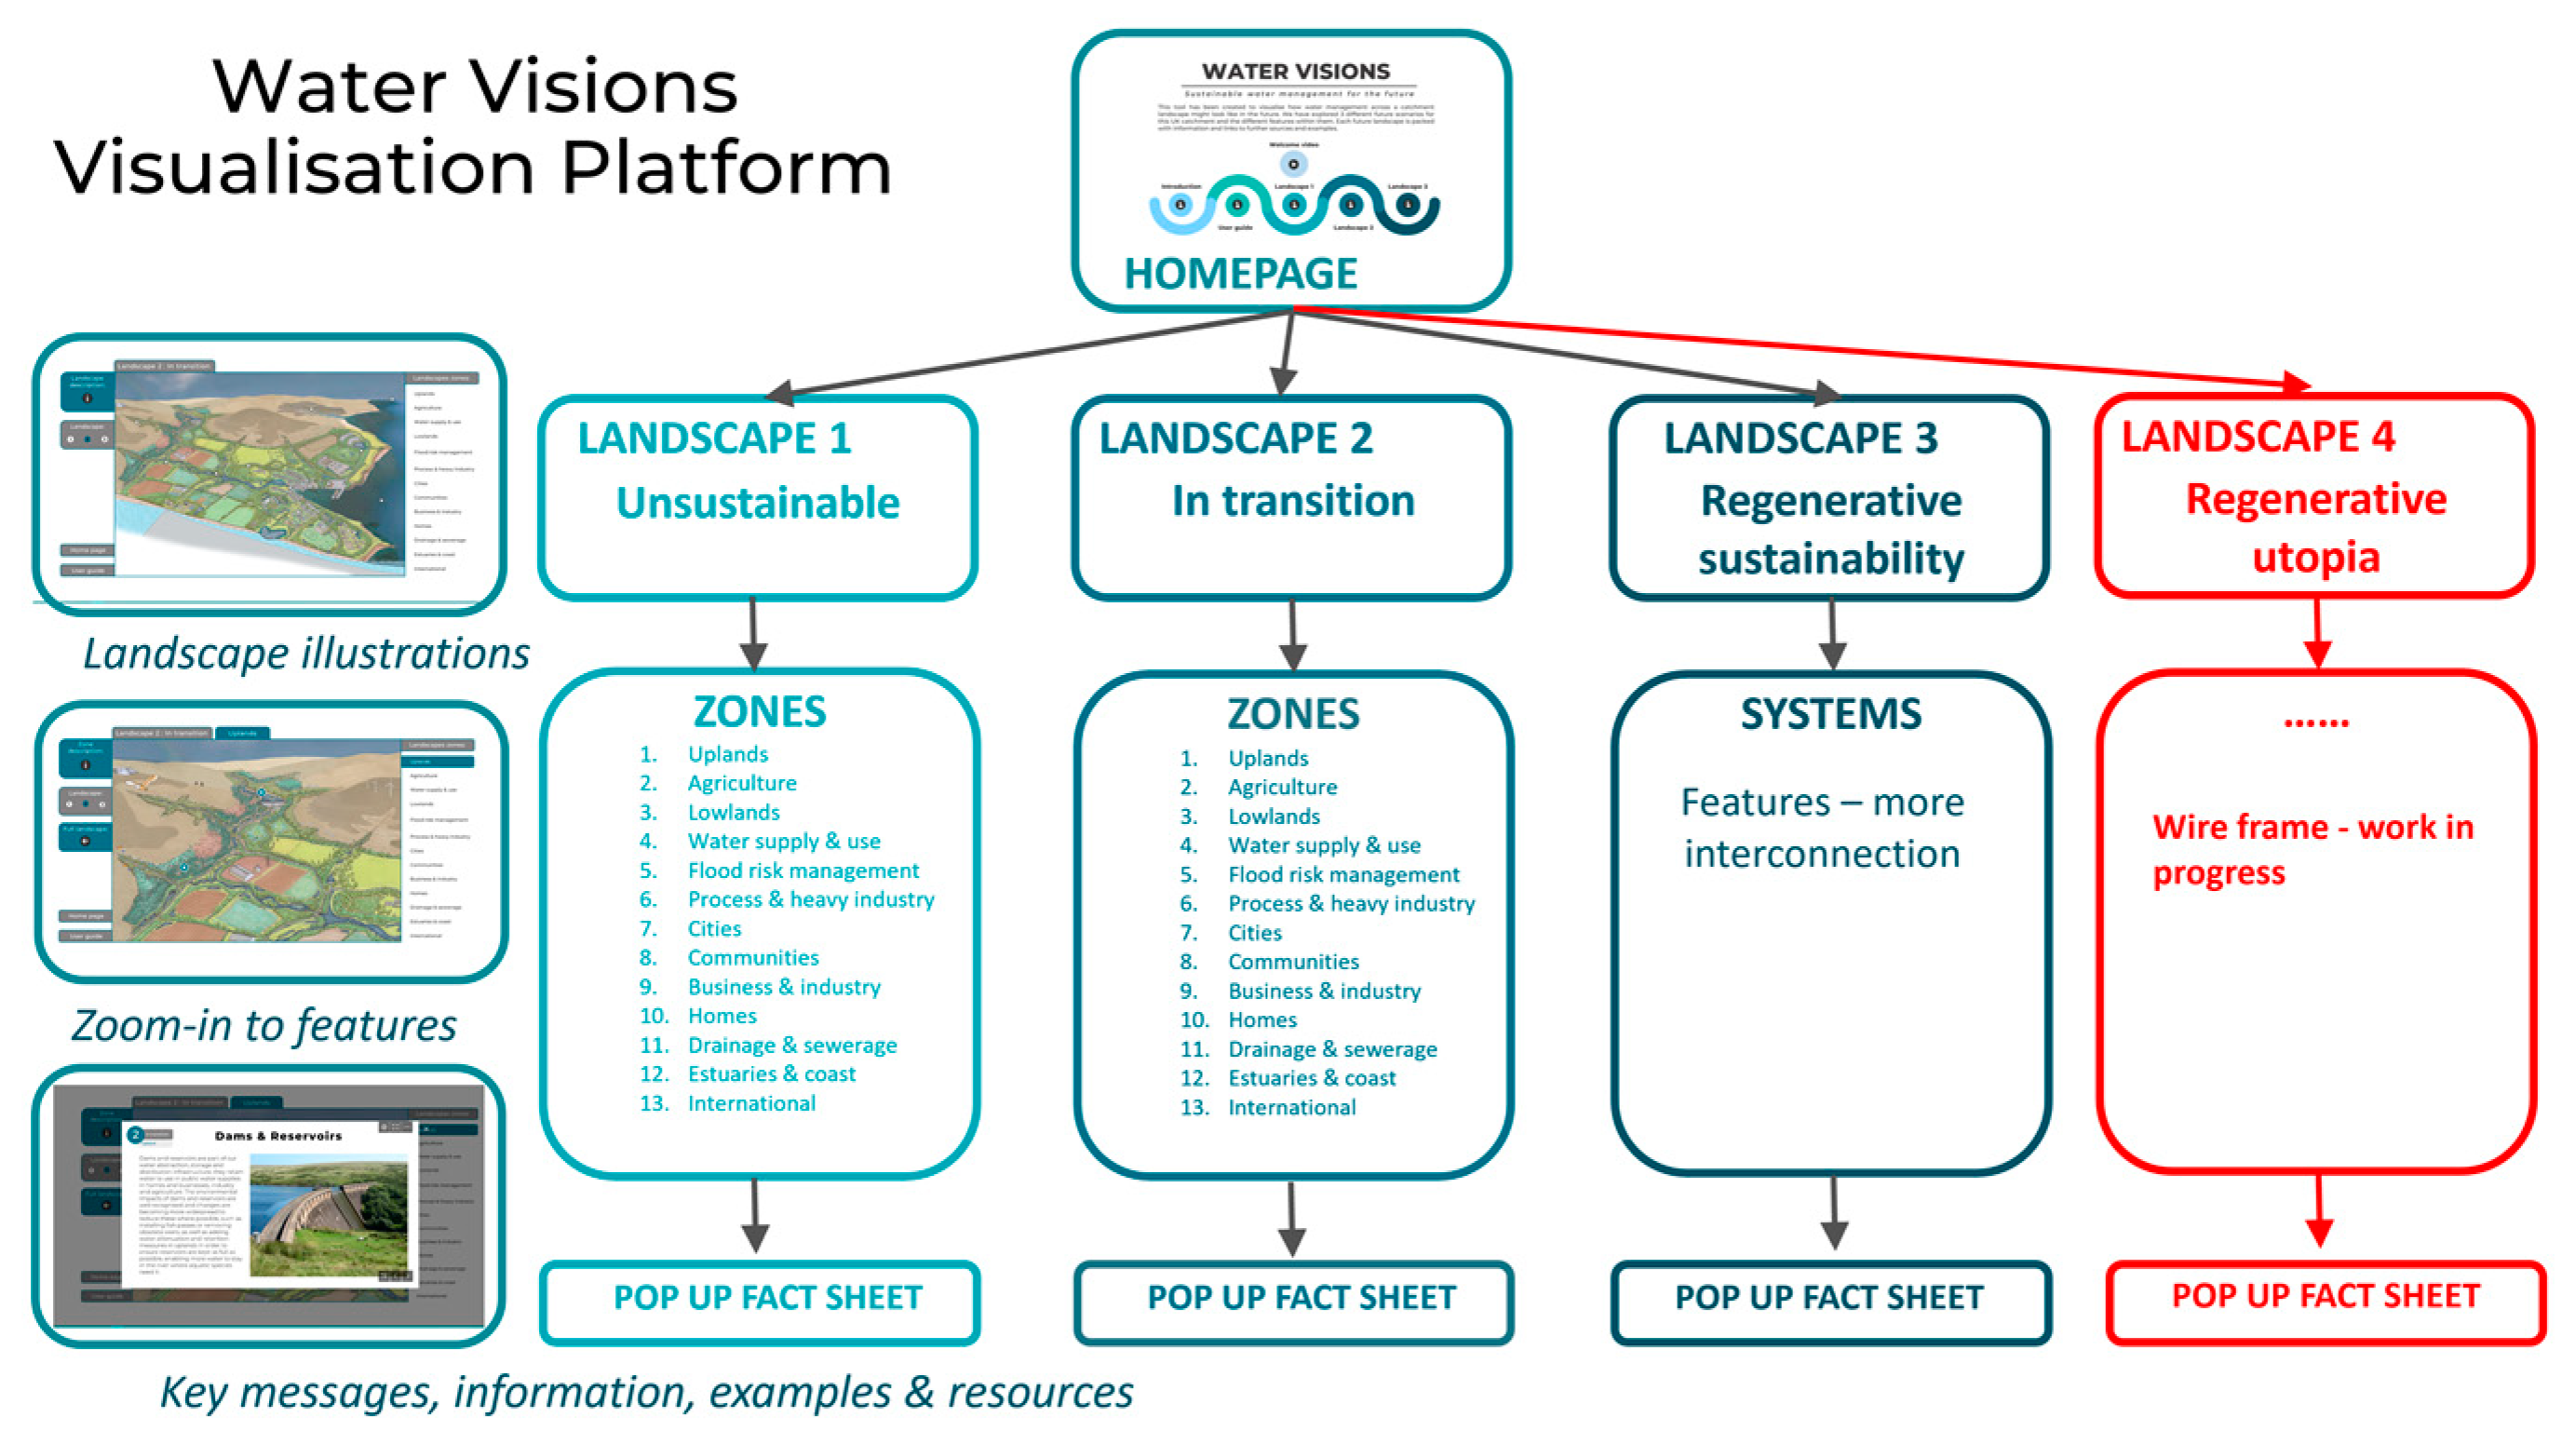
Each layer of the illustrations – Landscape, Zone/System, Feature - has clickable elements. These clickable elements contain the narrative for the element, as well as multi-media links to images, further information and resources (Figure 5). The narratives are written in an accessible, engaging language and in styles representative of what needs to be communicated through each, depending on the Landscape within which the user finds themself: Landscape 1 - providing reflection on what is not working well; Landscape 2 - providing an indication of a shift or change to what is better for the environment, society and the economy; Landscape 3 – providing insight into how the new innovations or approaches have positively influenced the Landscape; Landscape 4 – wireframe only (for use in co-visioning and co-creation workshops).
Some of the narratives were co-produced with collaborators external to the project team who are experts in their field, such as coastal and marine environments. The narratives were also required to more explicitly depict messages around the socio-cultural institutions and infrastructures that play-out across the landscapes. During the co-creation process it became apparent that depicting such features in the illustrations would require a different approach than for natural or built environment infrastructure - social and cultural capitals, ‘assets’ and services are more difficult to visualize in detail through imagery. Additionally, considering which institutions and decision-making structures will be needed in a future where citizens are more educated, knowledgeable, skilled, engaged and empowered required extra attention in the workshops. To accommodate these perspectives, additional categories were added to the Wheels previously described. Future phases of the project aim to more fully consider additional multi-media devices that could be used to better depict and explore these dimensions of the Landscapes, which highlight the complex interactions amongst changing knowledges, changing institutions and broadening imaginations (both public and institutional) that require representation. This is particularly the case for the Regenerative Utopia Landscape (4), which is potentially highly populated with more abstract socio-cultural, eco-technical, eco-economic and socio-eco-political concepts.
The previous section describes the steps in the co-creation methodology. The following section describes an example user journey to demonstrate the steps that might be taken in exploring the illustrations, narratives and multi-media resources that have been populated into the proof-of-concept Platform.

3. User Journey

Undertaking the co-creation methodology described in the previous section and bringing together all of the elements and components resulted in a Platform with the architecture outlined in Figure 6. To navigate this complex architecture a User Guide is included in the landing page. In this section an example user journey is provided to indicate how a Platform user might move in and around the architecture.
The Platform can be used as a resource in a number of ways:
  • As a resource to support fully guided webinar presentations with pre-set narratives or ‘user journeys’ through the use of slide decks.
  • As a resource to support a hybrid - part-guided, part self-exploratory - live online session.
  • As a resource to support an entirely self-guided session through a user-led journey.
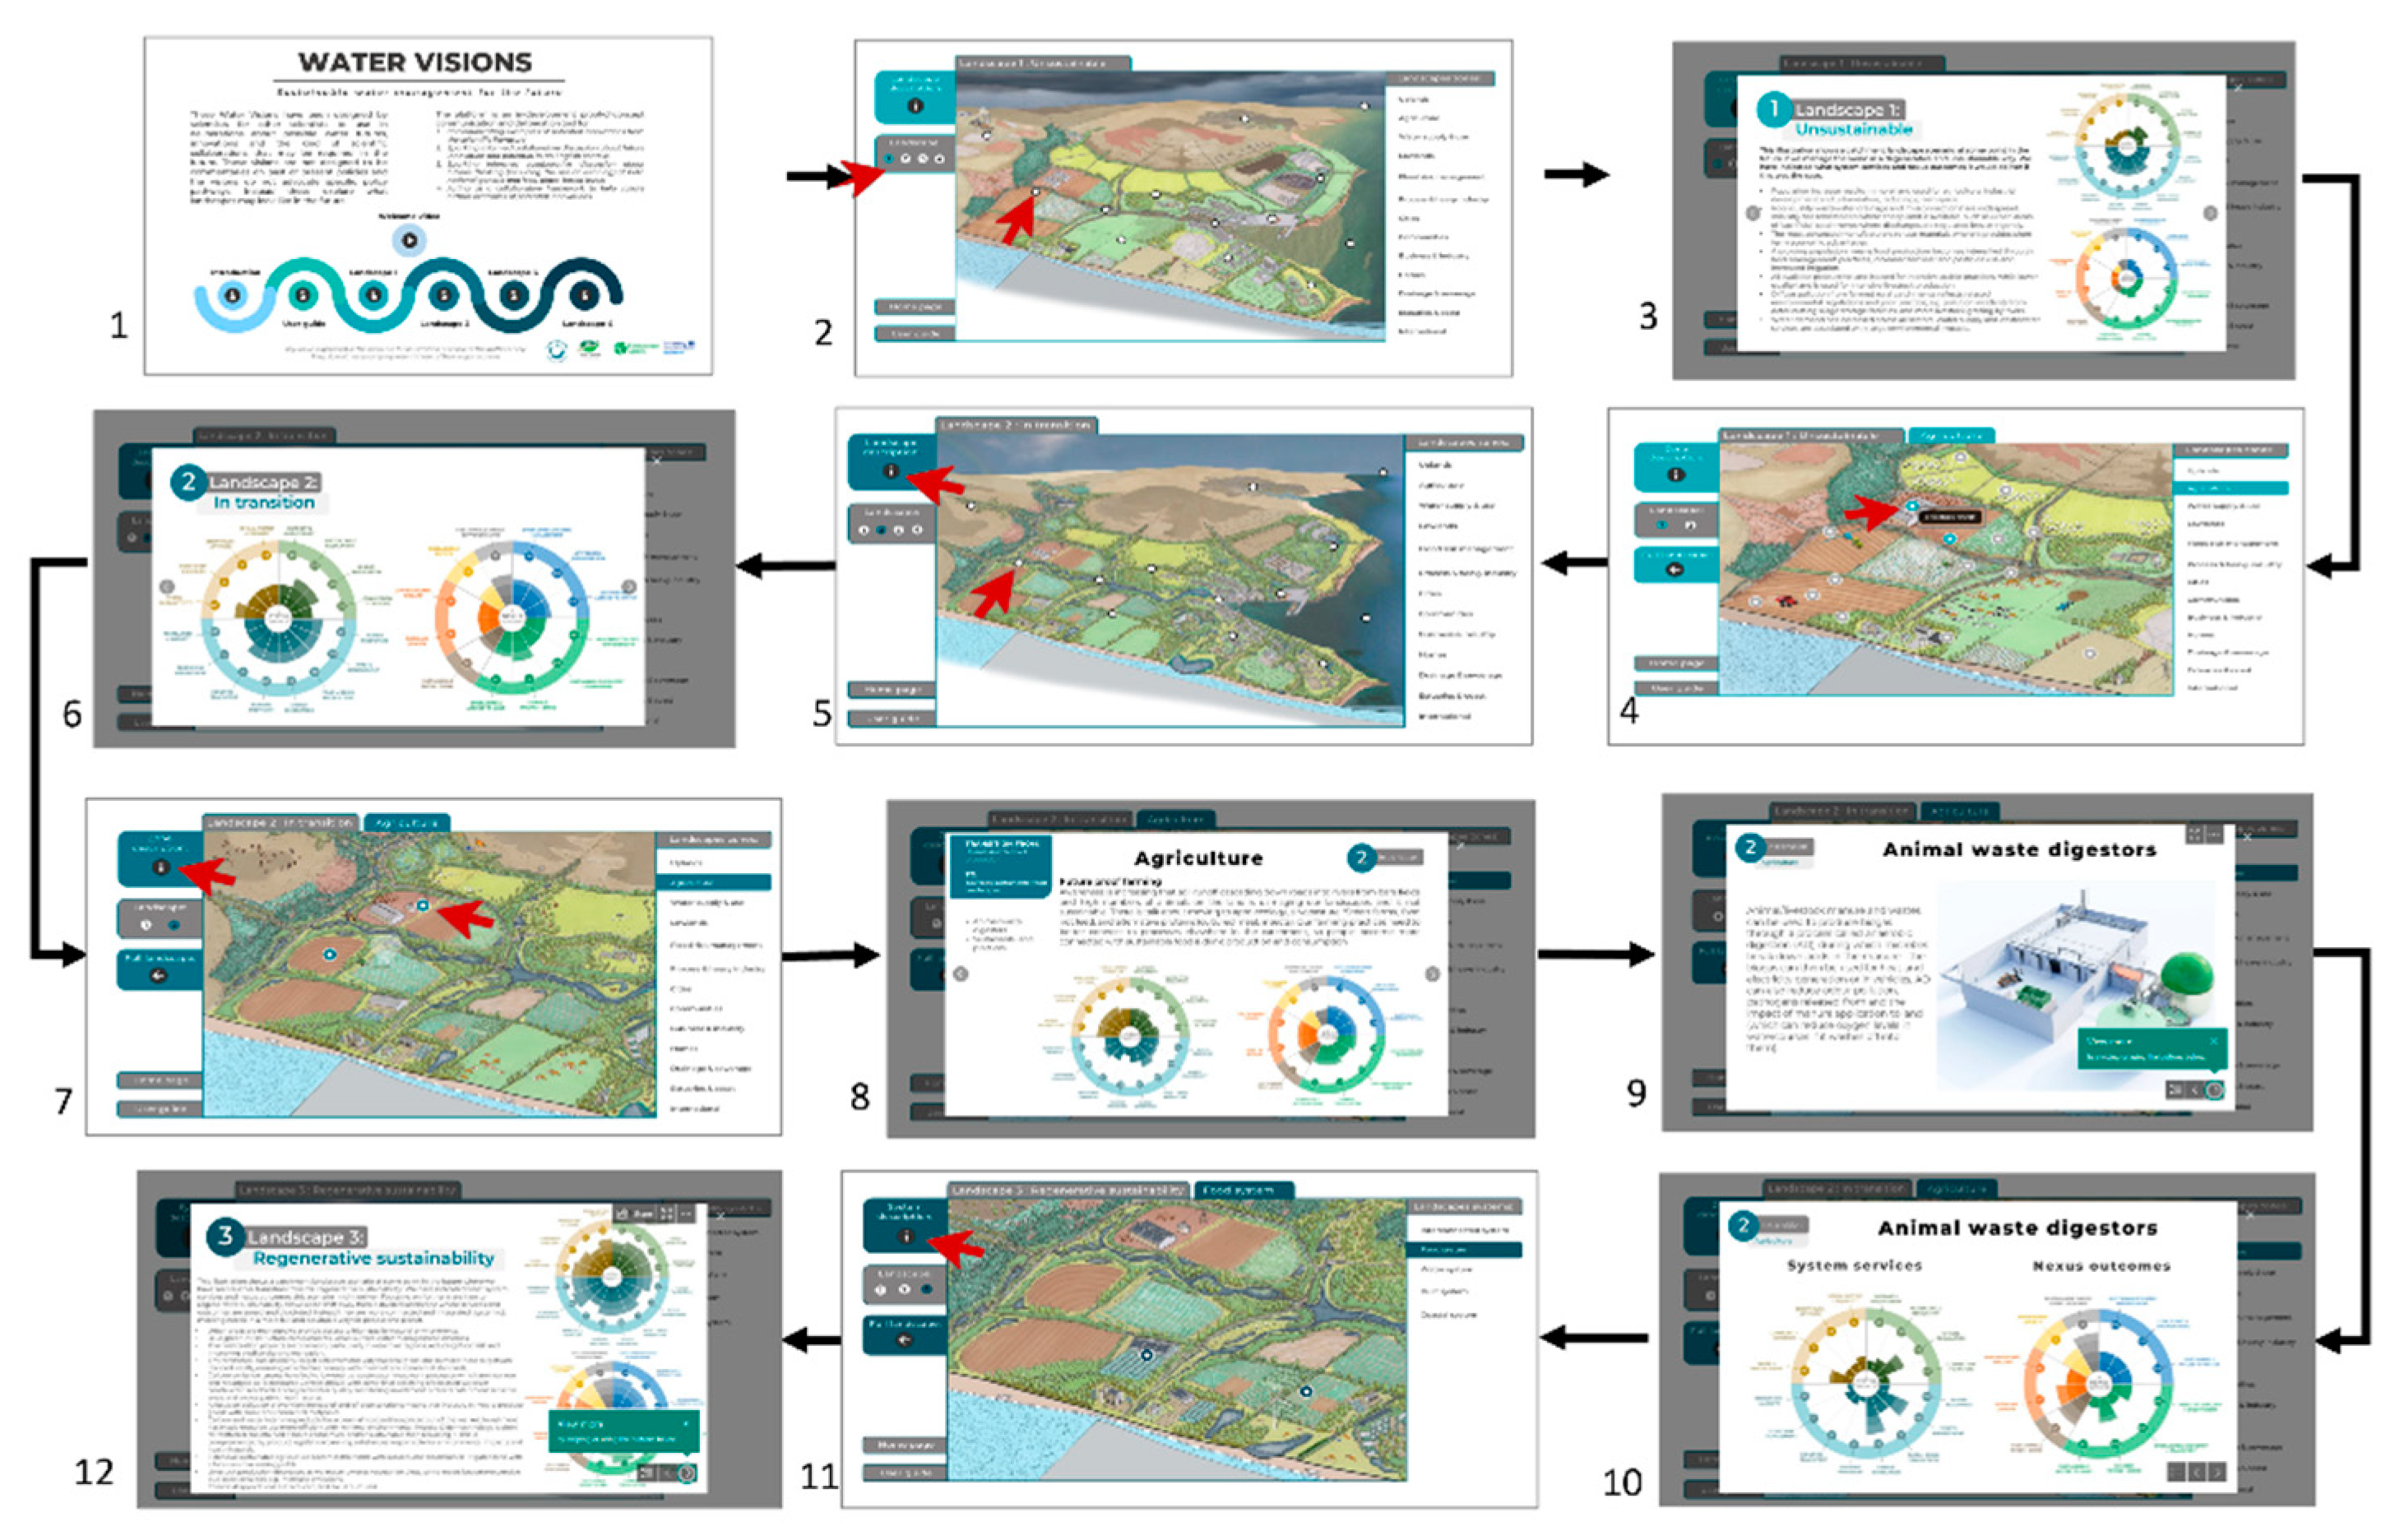
Within this paper only the first resource example is possible to demonstrate. To undertake the third option - a live, entirely self-guided session through a user-led journey – please refer to the previously provided web URL address. Figure 11 illustrates a user journey with a pre-set narrative focused on agriculture. The steps in the user journey are intended to guide the user around the Platform to maximise convenience and focus and to avoid cognitive overload:
  • Landing page – Welcome video, Introduction, User Guide, Landscapes 1-4;
  • Landscape 1 – Landscape 1: visualisation of an Unsustainable scenario landscape;
  • Landscape 1 – Overall scenario landscape description and scenario wheels;
  • Landscape 1 – Zone: Agriculture; Feature: Livestock sheds;
  • Landscape 2 - Visualisation and description for Landscape 2: In transition;
  • Landscape 2 – Landscape 2: In transition wheels;
  • Landscape 2 - Zone: Agriculture; Feature: Livestock sheds;
  • Landscape 2 - Zone: Agriculture description, list of Features and wheels;
  • Landscape 2 - Zone: Agriculture; Feature: Animal waste digestors description;
  • Landscape 2 - Zone: Agriculture; Feature: Animal waste digestors wheels;
  • Landscape 3 - Visualisation of Regenerative Sustainability;
  • Landscape 3 – Description and wheels.
  • (optional step of considering Landscape 4 wireframe)
Upon interacting with the clickable Features, the user is drawn further into the layers of information and invited to explore more about each Feature to the level to which they feel comfortable. Shown first in the pop-up factsheets are the narrative text and wheels. If the user clicks the arrows in the bottom right corner of the pop-up box, they can navigate through a range of additional links to multi-media resources, such as reports, journal papers, magazine articles, videos and other external materials, which describe the feature in action. Once finished, clicking on the cross at the top right corner of the pop-up box closes the box and the user is back in the Zone or Landscape. From there they can consider their next element to explore or can return to the home page using the navigator in the top left corner of the screen.
The Platform was demonstrated to high-level audiences during 2022 whilst in development and formally launched in April 2023. The following section summarises preliminary monitoring and evaluation undertaken after these activities.
The platform also features other functionality to encourage interest, exploration and use such as:
  • A swipe animation from Landscape 1 to Landscape 3;
  • A simple animation illustrating the reimagining of wastewater treatment plants as circular ‘bioresource centres’ operating across the nexus;
  • Downloadable illustrations, for, for instance, developing bespoke user journeys.

4. Preliminary Evaluation

Once the proof of concept demonstration Platform was completed, a preliminary evaluation was undertaken, which comprised two aspects: (i) evaluation against criteria from reviewed literature; (ii) evaluation through pilot testing and feedback forms.
Criteria for evaluation were synthesized from relevant literature and focused on implementation of a futures approach [40], effective communication of futures alternatives [68] and meaningful and effective adaptation communication [69]. The final 40 evaluation criteria are summarised in Table 3 alongside evaluation of whether or not the Platform achieved the criteria and how. The Platform achieved all 40 criteria, highlighting the importance of the intensive and extensive co-design, co-development and co-creation methodology implemented. [68] also noted the importance of improving the quality of visualisation tools and involving stakeholders in co-development, as well as ensuring tools are accompanied by dedicated community engagement capability if aiming to make landscape science more accessible and applicable to current and future users.
Whilst the Platform was co-created by participants from three different types of environmental organisation (charity, non-departmental public body, consultancy practice) with a diverse range of knowledge and expertise, pilot testing with other audiences was required to enable initial monitoring, evaluation, feedback and review activities.
Pilot testing took the form of webinar feedback, which was collected after providing two fully guided webinar presentations with pre-set user journeys through the use of slide decks to high-level audiences on 14th July 2022 and 19th January 2023. Answers to direct questions asked in feedback were answered during the webinar. Feedback received at both webinars was accommodated to enable the Platform to be revised and updated ahead of the launch of the demonstration Platform. In addition, website feedback form responses were gathered after the demonstration Platform was officially launched via the Water Visions website on 14th April 2023 alongside other feedback submitted during the launch via social media and other contact. As the evaluation is still ongoing, statistical results are not detailed here. Instead a summary of feedback questions and comments from the webinars and survey is collated in Table 4 by theme to indicate the overall impression of the Platform at the time of writing.
Feedback fell across the 10 themes of General, Navigation, Visuals/Platform, Futures, Video/animation/sound, Wheels, Technical Information, Audience/Users, Learning and Glitching. Overall the feedback was positive with some technical information queries and minor glitches experienced during use. The majority of feedback focused on visuals, futures and users, which was to be expected during pilot testing. This provided further evidence through which to verify the achievement of the evaluation criteria in Table 3. By meeting these criteria the Platform achieves the implementation of a futures approach, effective communication of futures alternatives, meaningful and effective adaptation communication, improvement in the quality of visualisation tools and co-creation with stakeholders. The only gap the Platform and project team could not address was to ensure tools are accompanied by dedicated community engagement capability as this is subject to a range of factors outside their control.
Consequently, through consideration of the evaluation criteria and collated feedback, it was determined that the Platform achieved the aim and objectives of the project, which were to:
  • co-create an interactive platform through which to explore illustrations and narrative visions of the future underpinned by an extensive evidence synthesis, as well as real-world examples of the ‘art of possible’ and ‘pockets of the future in the present’.
  • co-develop illustrations of future regenerative, sustainable, resilient, shared and socially just landscapes to showcase and communicate evidence-based material in relation to sustainability transitions with a focus on water.
  • provide accessible, inclusive visualisations and other supporting content to enable stakeholders with highly diverse levels of prior knowledge and technical skills to engage with and co-develop a shared vision for future SETS landscapes.
  • provide a robust platform for further information collation, organisation, communication and deliberation.
In summary, the preliminary evaluation highlights that a magnitude and diversity of co-benefits have been realised in the most cost-effective and efficient co-production process. Ongoing co-development and further monitoring and evaluation activities will assess the Platform in relation to the Theory of Change set for the project (beyond the scope of this paper).

5. Conclusions

The Water Visions Visualisation Platform project set out to illustrate and communicate evidence and insights for water system management in a current and future context of an interlocking systemic polycrisis. In particular, concepts, principles and interventions for water (and nexus) system transformation.. This was partly in response to comments and questions from decision-makers during the course of the literature scoping synthesis such as “those are just academic ideas aren’t they?; “but what does that look like?”; “how does x intervention relate to y intervention?”; “that is just a concept what does it look like in practice? Further, the aim was to illustrate these in the context of transition from unsustainable to sustainable, indeed more regenerative landscape-level scenarios. Evidence and literature describes many of the concepts and principles and interventions separately, so it was important to bring them together to demonstrate their interactions and how they work together as a coherent ‘set’ of changes. The Platform supports not only communication and learning about potential futures and their visualisation but also provides a basis for stimulating further collation, deliberation and ‘co-creation’ in both generic and place-based contexts. The co-creation of a, proof of concept, interactive platform comprising coherent illustrations, narrative, examples and resources of visions of the future as landscape visualisations enables such futures to be explored and interrogated through ‘wheels’. The Platform content was underpinned with an extensive evidence synthesis [19], as well as real-world examples of the ‘art of possible’ and ‘pockets of the future in the present’ to demonstrate that many of the identified changes are already happening somewhere and in some form. This is crucial for policy makers or strategy managers to increase their awareness of options beyond their operational space.. Through the presented comprehensive discussion on approaches to visualisation and alternative futures, a description of the co-creation methodology and a preliminary evaluation for the Water Visions Visualisation Platform, it is possible to make the following conclusions and recommendations.

Conclusions:

  • The co-creation process outlined provides a useful framework for further visualisatrion, illustration and communication projects;
  • Scenarios were an effective way to organize and synthesis scoping review findings into coherent landscape, ‘zone’ and ‘system’ visuals and narratives;
  • Scenarios were an effective way to demonstrate transition between unsustainable practices to more sustainable practices;
  • Visualisation of evidence was an effective engagement, communication and learning tool for these coherent scenarios for several audiences;
  • An interactive Platform supports the linking of real-world examples to the illustrated contents. This is essential to communicate to more operationally-focused decision-makers who need to see examples;
  • Not all concepts and principles are easy to visualize or illustrate in the landscapes (e.g. systems, regenerative, circularity and nexus approaches). Therefore, other means are needed such as narrative, animation and links to other resources;

Recommendations:

  • When working collaboratively on co-design and co-creation ensure significant time is allocated to workshopping and conceptual elucidation;
  • Ensure that interfaces such as the Platform are built using standard software to enable onward collaboration and updating where possible;
  • The Platform should be further tested and co-created with a wider set of audiences;
  • The Platform Landscapes L1-L3 should be further populated with new findings and examples that are in the Content Organiser but could not be included during the project duration;
  • Explanation of concepts and principles could be developed further through narrative, animation and examples;
  • The L4 wireframe should be used for (i) developing short-term acceptable / fundable generic or place-based scenario and programme of work using L3 as a ‘pull’; (ii) developing a place-based long-term ambition scenario; (iii) co-developing a more transformational scenario than L3.
The Platform is structured to evolve and is available to co-develop with various audiences’ requirements, with the benefit of reference to the principles upon which the current proof of concept demonstration version is based. Please contact the authors.

Author Contributions

Conceptualization, all authors; methodology, all authors; software, WRT authors; validation, all authors; data curation, all WRT authors; writing—original draft preparation, Ward and Forrow; writing—review and editing, Ward; visualization, all WRT, SWW and Plan Vision authors. All authors have read and agreed to the published version of the manuscript.

Funding

The research was a collaboration between the Environment Agency (England), Westcountry Rivers Trust and Plan Vision. This research received funding from The Environment Agency England and the Interreg 2 Seas Programme PROWATER project (No 2S04-027). The APC was funded by MDPI.

Data Availability Statement

No new data were created, however, new evidence organisation repositories were and access to these can be requested from the authors.

Acknowledgments

We would like to thank everyone who collaborated on or contributed to this project.

Conflicts of Interest

The authors declare no conflict of interest, though the funders (Environment Agency England) participated in the co-design of the study; in the collection, of evidence and in the writing of the manuscript.

References

  1. Secretariat of the Convention on Biological Diversity (2020) Global Biodiversity Outlook 5. Montreal.
  2. Organisation for Economic Co-operation and Development [OECD] (2015) Governance challenges and suggested tools for the implementation of the water-related Sustainable Development Goals Water and Sustainable Development. From Vision to Action. UN Water Annual International Conference 15-17 Jan. Zaragoza.https://www.un.org/waterforlifedecade/waterandsustainabledevelopment2015/pdf/Governance_OE CD_Tool_paper_final.pdf.
  3. World Economic Forum (2023) The Global Risks Report 2023 18th Edition INSIGHT REPORT. https://www3.weforum.org/docs/WEF_Global_Risks_Report_2023.pdf.
  4. Brown, R.R. and Farrelly M.A (2009) Delivering sustainable urban water management: a review of the hurdles we face. Water Science & Technology—WST, 59.5, 2009. [CrossRef]
  5. Pahl-Wostl (2007) Transitions Towards Adaptive Management of Water Facing Climate and Global Change. Water Resources Management 21(1):49-62. [CrossRef]
  6. Gleick, P.H. (2018) Transitions to freshwater sustainability. Proceedings of the National Academy of Sciences Sep 2018, 115 (36) 8863-8871; [CrossRef]
  7. Ma, X. , Xue X., González-Mejía A, Garland J. and Cashdollar J. (2015) Sustainable Water Systems for the City of Tomorrow—A Conceptual Framework. Sustainability 7, 12071-12105; [CrossRef]
  8. Southern Water (2018) Water Horizons: Southern Water’s Long-Term Asset Management Strategy TA 11.2 Water Horizons: Long Term Asset Management Strategy Technical Annex https://www.southernwater.co.uk/media/1964/ta112-water-horizons-southern-waters-long-term-assetmanagement-stra.pdf.
  9. Franco-Torres, M. (2021). The path to the new urban water paradigm – From modernity to metamodernism. Water Alternatives 14(3): 820-840.
  10. Franco-Torres, M. , Rogers B.C. & Harder R. (2020) Articulating the new urban water paradigm, Critical Reviews in Environmental Science and Technology. [CrossRef]
  11. Bell S (2020) Frameworks for urban water sustainability. WIREs Water, 7 (2), e1411. https://wires.onlinelibrary.wiley.com/doi/10.1002/wat2.1411.
  12. EEA (2019) Sustainability transitions: policy and practice EEA Report No 09/2019 https://www.eea.europa.eu/publications/sustainability-transitions-policy-and-practice.
  13. Brown, M. , Haselsteiner, E., Apro, D., Kopeva, D., Luca, E., Pulkkinen, K., Vula Rizvanolli, B., (Eds.), (2018). Sustainability, Restorative to Regenerative. COST Action CA16114 RESTORE, Working Group One Report: Restorative Sustainability. https://www.eurestore.eu/wp-content/uploads/2018/04/SustainabilityRestorative-to-Regenerative.pdf.
  14. Butler, D., Ward, S. , Sweetapple, C., Astaraie-Imani, M., Diao, K., Farmani, R. and Fu, G. (2016) Reliable, resilient and sustainabl water management: the Safe and SuRe approach. Global Challenges 1 (1). [CrossRef]
  15. Halbe J, Pahl-Wostl C, Sendzimir J, & Adamowski J (2013). Towards adaptive and integrated management paradigms to meet the challenges of water governance. Water Science & Technology. [CrossRef]
  16. Warden, J. (2021) What does Regenerative Thinking mean? RSA Journal Issue 4 2021 p27-31.
  17. International Futures Forum. (2020) Three Horizons Model. https://www.iffpraxis.com/three-horizons (Accessed 11/01/2021). 2021.
  18. Constanza, R. (2000) Visions of alternative (unpredictable) futures and their use in policy analysis. Conservation Ecology 4(1): 5. [CrossRef]
  19. Helm, R.v. D (2009) The vision phenomenon: Towards a theoretical underpinning of visions of the future and the process of envisioning Futures 41(2):96-104. [CrossRef]
  20. Environment Agency (2022) Science and Evidence Synthesis for Water Land Strategy (SES-WLS2100), June 2022. Available on request from authors.
  21. Raami, A. (2019) Towards Solving the Impossible Problems. Chap 6. In Sustainability, Human Well-Being, and the Future of Education Justin W. Cook Editor. Palgrave Macmillan, Springer Nature Switzerland AG. [CrossRef]
  22. Yankelovich, D. (1991) Coming to public judgment: making democracy work in a complex world. Syracuse University Press, Syracuse, New York, USA.
  23. Willow, A. (2022) Visions of transition: centering the future in engaged sustainability research. SN Soc Sci 2, 56. [CrossRef]
  24. Ward, S. , Paling, N. and Rogers, A. (2022) Mobilising sustainable, water resilient communities: evidence and engagement across scales. Proceedings of the Institution of Civil Engineers - Engineering Sustainability 0 0:0, 1-8 (TBC). [CrossRef]
  25. Ward, S., Staddon, C., De Vito, L., Zuniga-Teran, A., Gerlak, A. K., Schoeman, Y., Hart, A. and Booth, G. (2019) Embedding social inclusiveness and appropriateness in engineering assessment of green infrastructure to enhance urban resilience. Urban Water Journal, 16 (1), 56-67. [CrossRef]
  26. McPhearson, T. , Cook, E. M., Berbés-Blázquez, M., Cheng, C., Grimm, N. B., Andersson, E., Barbosa, O., Chandler, D. G., Chang, H., Chester, M. V., Childers, D. L., Elser, S. R., Frantzeskaki, N., Grabowski, Z., Groffman, P., Hale, R. L., Iwaniec, D. M., Kabisch, N., Kennedy, C., Markolf, S. A., Matsler, A. M., McPhillips, L. E., Miller, T. R., Muñoz-Erickson, T. A., Rosi, M. and Troxler, T. G. (2022) A social-ecological-technological systems framework for urban ecosystem services. One Earth, 5 (5), 505-518. [CrossRef]
  27. Linton, J. and Krueger T. (2020) The ontological fallacy of the Water Framework Directive: Implications and alternatives. Water Alternatives 13(3): 513-533.
  28. 28. Vining, Joanne, et al. “The Distinction between Humans and Nature: Human Perceptions of Connectedness to Nature and Elements of the Natural and Unnatural.” Human Ecology Review, vol. 15, no. 1, 2008, pp. 1–11. JSTOR. https://www.jstor.org/stable/24707479. Accessed 24 May 2023. 24 May.
  29. Bibri, S.E. (2018) Backcasting in futures studies: a synthesized scholarly and planning approach to strategic smart sustainable city development. Eur J Futures Res 6, 13 (2018). [CrossRef]
  30. Quist, J and Vergragt, P. (2006) Past and future of backcasting: The shift to stakeholder participation and a proposal for a methodological framework. Futures,38 (9). [CrossRef]
  31. Reinsborough, M. (2017). Science fiction and science futures: considering the role of fictions in public engagement and science communication work JCOM 16(04), C07. [CrossRef]
  32. Government Office for Science (2017) Futures Toolkit Tools for Futures Thinking and Foresight Across UK Government https://assets.publishing.service.gov.uk/government/uploads/system/uploads/attachment_data/file/674209/futures-toolkit-edition-1.pdf.
  33. Priest, S. H. (2009). Curiouser and curiouser. Science Communication, 31(1), Sage. [CrossRef]
  34. Corner, A. , Shaw, C. and Clarke, J. (2018). Principles for effective communication and public engagement on climate change: A Handbook for IPCC authors. Oxford: Climate Outreach.
  35. Corner, A. , Shaw, C., Clarke, J. and Wang, S. (2018). Communicating Environmental and Sustainability Science - Challenges, opportunities, and the changing political context. Oxford: Climate Outreach.
  36. Hopkins, R. (2019) From What Is to What If: unleashing the power of imagination to create the future we want. Chelsea Green Publishing, UK. ISBN-10‏1645020290, ISBN-13-978-1645020295. https://www.robhopkins.net/the-book/.
  37. Kelesidou, F. and Chabrol, E. (2021) A comprehensive guide to Science Communication. RRI Tools. https://rri-tools.eu/-/a-comprehensive-guide-to-science-communication.
  38. Government Office for Science (2021) A brief guide to futures thinking and foresight https://assets.publishing.service.gov.uk/government/uploads/system/uploads/attachment_data/file/1113574/A_Brief_Guide_to_Futures_Thinking_and_Foresight_-_2022.pdf.
  39. Government Office for Science (2022) Futures, Foresight and Horizon Scanning: tips on developing a collective futures vision with the public. https://foresightprojects.blog.gov.uk/2022/05/18/tips-on-developing-a-collective-futures-vision-with-the-public/.
  40. Government Office for Science (2022) Futures, Foresight and Horizon Scanning: effectively creating and communicating futures outputs. https://foresightprojects.blog.gov.uk/2022/03/10/effectively-creating-and-communicating-futures-outputs/.
  41. Hofvenschioeld, E. and Khodadadi, M. (2020) Communication in futures studies: a discursive analysis of the literature. Futures, 115, 102492. [CrossRef]
  42. Sharpe, B., A. Hodgson, G. Leicester, A. Lyon, and I. Fazey. 2016. Three horizons: a pathways practice for transformation. Ecology and Society 21(2):47. [CrossRef]
  43. Dockerty, T. , Lovett, A., Appleton, K., Bone, A. and Sünnenberg, G. (2006) Developing scenarios and visualisations to illustrate potential policy and climatic influences on future agricultural landscapes. Agriculture, Ecosystems & Environment, 114 (1), 103-120, ISSN 0167-8809. [CrossRef]
  44. Schmitt Olabisi, L.K.; Kapuscinski, A.R.; Johnson, K.A.; Reich, P.B.; Stenquist, B.; Draeger, K.J. (2010) Using Scenario Visioning and Participatory System Dynamics Modeling to Investigate the Future: Lessons from Minnesota 2050. Sustainability, 2, 2686-2706. [CrossRef]
  45. Edquist, C. and Hommen, L. (1999) Systems of innovation: theory and policy for the demand side. Technology in Society, 21 (1), 63-79, ISSN 0160-791X. [CrossRef]
  46. De Vicente Lopez, J. and Matti, C. (2016) Visual toolbox for system innovation. A resource book for practitioners to map, analyse and facilitate sustainability transitions. Transitions Hub Series. Climate-KIC, Brussels 2016. ISBN 978-2-9601874-0-3.
  47. ARSINOE (2022) The Project: ARSINOE at a glance. https://arsinoe-project.eu/the-project/ (Accessed 09-08-2022).
  48. Sheppard, S. R. J. (2006) Bridging the sustainability gap with landscape visualisations in community visioning hubs. The Integrated Assessment Journal Bridging Sciences and Policy, 6 (4), 79-108.
  49. Wiek, A. , Iwaniec, D. Quality criteria for visions and visioning in sustainability science. Sustain Sci 9, 497–512 (2014). [CrossRef]
  50. Gaziulusoy, A. I. and Ryan, C. (2017) Roles of design in sustainability transitions projects: A case study of Visions and Pathways 2040 project from Australia. Journal of Cleaner Production, 162, 1297-1307. ISSN 0959-6526. [CrossRef]
  51. Angheloiu, C. , Chaudhuri, G. and Sheldrick, L. (2017) Future Tense: Alternative Futures as a Design Method for Sustainability Transitions. The Design Journal, 20 (1), S3213-S3225. [CrossRef]
  52. Sadr, S. M. K., Casal-Campos, A., Fu, G., Farmani, R., Ward, S. and Butler, D. (2020) Strategic planning of the integrated urban wastewater system using adaptation pathways. Water Research, 182. [CrossRef]
  53. Werners, S. E. , Wise, R. M., Butler, J. R. A., Totin, E. and Vincent, K. (2021) Adaptation pathways: A review of approaches and a learning framework. Environmental Science & Policy, 116, 266-275, ISSN 1462-9011. [CrossRef]
  54. Bengston, D. N. , Westphal, L. M., & Dockry, M. J. (2020). Back from the Future: The Backcasting Wheel for Mapping a Pathway to a Preferred Future. World Futures Review, 12(3), 270–278. [CrossRef]
  55. Fanfani, D. and Mataran Ruiz, A. (Eds) (2020) Bioregional Planning and Design: Volume I. Perspectives on a Transitional Century. Springer Cham, Switzerland. [CrossRef]
  56. Taylor Lovell, S. and Johnston, D. M. (2008) Creating multifunctional landscapes: how can the field of ecology inform the design of the landscape? Frontiers in Ecology and the Environment, 7 (4), 212-220. [CrossRef]
  57. Bohnet, I.C. , Roebeling, P.C., Williams, K.J. et al. (2011) Landscapes Toolkit: an integrated modelling framework to assist stakeholders in exploring options for sustainable landscape development. Landscape Ecology, 26, 1179. [CrossRef]
  58. Bryan, B. A. , Crossman, N. D., King, D. and Meyer, W. S. (2011) Landscape futures analysis: Assessing the impacts of environmental targets under alternative spatial policy options and future scenarios. Environmental Modelling & Software, 26 (1), 83-91, ISSN 1364-8152. [CrossRef]
  59. Kearney, M. , Schuck, S., Burden, K., & Aubusson, P. (2012). Viewing mobile learning from a pedagogical perspective. Research in Learning Technology, 20(1). [CrossRef]
  60. Bjorke, S. A. (2014) Education for Sustainable Development: Pedagogical approaches in online education. https://ufbutv.com/2014/02/26/pedagogical-approaches-in-online-education/ (Accessed 07-11-2022).
  61. Salmon, G. (2022) The 5 Stage Model for 2022 and Beyond. https://www.gillysalmon.com/five-stage-model.html (Accessed 10-11-2022).
  62. Bours, D. , McGinn, C. and Pringle, P. (2014) Guidance note 3: Theory of Change approach to climate change adaptation programming. https://www.ukcip.org.uk/wp-content/PDFs/MandE-Guidance-Note3.pdf (Accessed 10-08-2022).
  63. UNEP (2022) Theory of Change. https://www.unep.org/evaluation-office/our-evaluation-approach/theory-change#:~:text=The%20Theory%20of%20Change%20of,can%20lead%20to%20the%20next. (Accessed 10-08-2022).
  64. Thomsen, D. C. (2015) Seeing is questioning: prompting sustainability discourses through an evocative visual agenda. Ecology and Society, 20(4). http://www.jstor.org/stable/26270309.
  65. Peterson St-Laurent, G. , Hoberg, G., Sheppard, S. R. J. and Hagerman, S. M. (2020) Designing and evaluating analytic-deliberative engagement processes for natural resources management. Elem Sci Anth, 8: 8. [CrossRef]
  66. Defra (Department for Environment, Food and Rural Affairs) (2017) Local Action Plan: Final Report WT1580 Defra London, UK. http://randd.defra.gov.uk/Document.aspx?Document=13980_WT1580_LocalActionProject_Finalreport.pdf (accessed 16/07/2022) Google Scholar.
  67. Defra (2019) Local Action Project 3: Working with Local Communities to Enhance the Value of Natural Capital in Local Landscapes to Improve People’s Lives, the Environment and Economic Prosperity Defra London UKWT1595. http://sciencesearch.defra.gov.uk/Document.aspx?Document=14617_WT1595_Local_Action_Project_3_FINAL.pdf (accessed 16/07/2022) Google Scholar.
  68. Pettit, C.J. Raymond, C. M., Bryan, B. A., and Lewis, H. Identifying strengths and weaknesses of landscape visualisation for effective communication of future alternatives. Landscape and Urban Planning. (2011). [CrossRef]
  69. Glaas, E. , Ballantyne A. G., Neset T-S., and Linnér B-O. (2017). Visualization for supporting individual climate change adaptation planning: assessment of a web-based tool. Landscape and Urban Planning, 158, 1-11. [CrossRef]
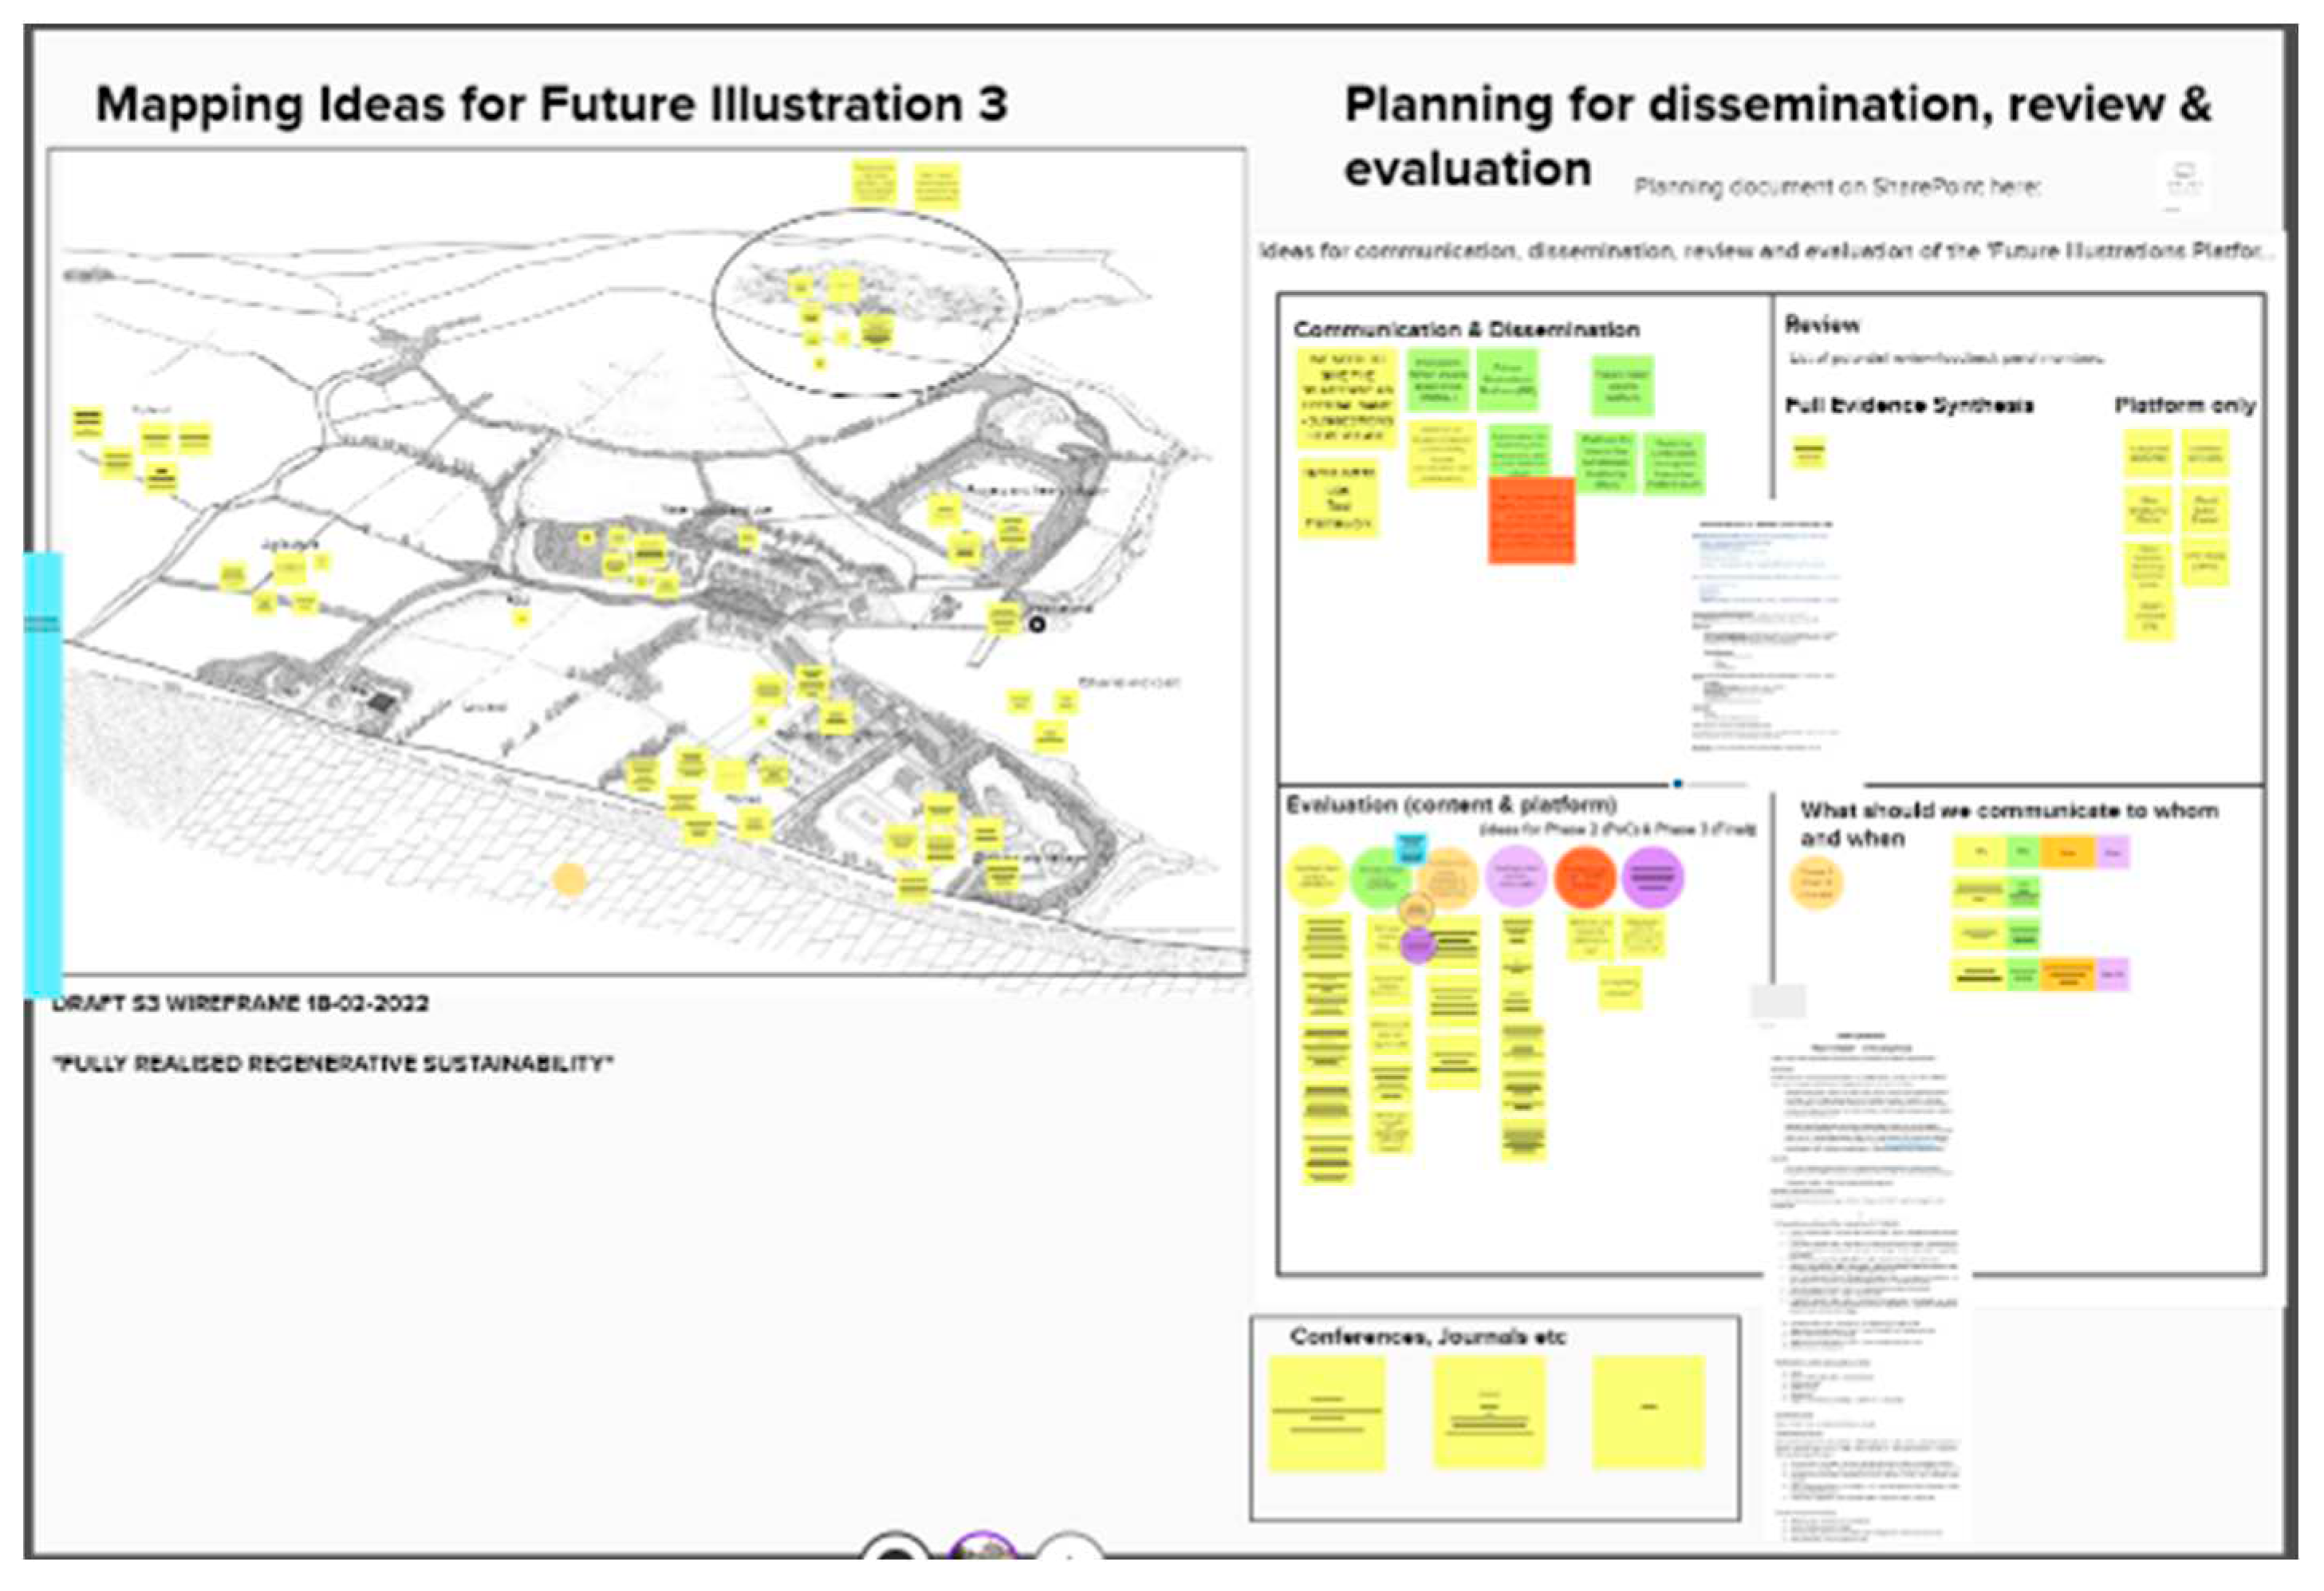
Figure 1. Example MURAL board (online work board tool) co-created during the project methodology.
Preprints 85580 g001
Figure 2. Snapshot of the Content Organiser used to collate all visualisation platform elements and content.
Preprints 85580 g002
Figure 3. Example System Services and Nexus Outcomes benefits wheels for Landscape 2: In transition.
Preprints 85580 g003
Figure 4. Example illustration production: whole landscape wireframe image on tracing paper.
Preprints 85580 g004
Figure 5. Example narrative boxes from Landscape 2 - Agriculture Zone and the Sustainable Land Practices Feature.
Preprints 85580 g005
Figure 6. The current overall architecture of the demonstration Water Visions Visualisation Platform.
Preprints 85580 g006
Figure 7. A flow chart of an example Platform user journey focused on agriculture aspects (refer to text for title of each individual numbered canvas and description 1 to 12.).
Preprints 85580 g007
Table 1. Commencing transformations – mapping out characteristics (areas, principles, ways of working, actions for potential influence) to reframe to facilitate transformational change, some ‘real world’ examples and how they are visualised in the Water Visions Visualisation Platform. H=Horizon; L=Landscape.
Framing for Compliance (Unsustainable); H1; L1 Framing for regenerative sustainability and resilience (futures); L2 and L3 Actions/Potential for influence (for existing decision makers) Real world example/s Representation in Visualisation Platform
Addresses symptoms and ecological (and some e.g. health) consequences Addresses systemic causes Co-develop more ‘upstream’ regenerative & sustainable win-win systems -focused interventions (ideally at source), including design and retrofit, generating zero-pollution/environmental & social harm (aka net zero carbon) 3 capitals/systems approach – natural systems, infrastructure systems (natural & built), social systems (social & cultural). Landscape features map onto these systems & demonstrate their interdependencies
Non-regenerative (i.e. degenerative), non-resilient, biophysical water-only system with incompletely implemented linear & siloed working & governance and competing incentives focused on mitigation, restoration & inflexible, ‘one approach fits all’ permanence Regenerative, resilient nexus-focused Socio-ecological-technological system based (SETS) with fully implemented circular & systemic working and polycentric systemic governance incentivised for sustainability focused on reuseability, adaptation & flexible, ‘fit for use’ impermanence
  • System (SETS) understanding, analysis and management
  • Adoption of multiple capitals into analysis, business practice & reporting
  • Reinforce, strengthen & enhance existing polycentric structures, interactions & enforcement
  • Co-create & coordinate coherent & effective alliances with shared governance, visions, strategies & purpose – supports full implementation across public, private & non-profits
  • Fit for purpose
  • Regenerative planning amongst sectors
  • Environmental equity & fair transitions (‘levelling up’)
  • Establish standards for better co-design of infrastructures & governance (‘better by design’)
  • ‘Instep co-transitioning’ - identify win-wins & avoid unintended consequences
  • Review & reverse perverse incentives
  • Whole water cycle management & governance/Integrated Water Resources Management (water, land & other resources)
  • Communities of practice, knowledge networks, learning alliances, citizen assemblies (all these need to be cross-institution however)
  • EU WFD implementation in Berlin & Hamburg**
  • Land use suitability mapping
  • Co-design rainwater harvesting (RWH), greywater reuse for buildings taking into account prefabricated & adaptable housing
  • Circular wastewater management
  • Nature-based solutions, blue/green cities & homes, multi-scale water sensitive urban design (house, development, city)
  • Regenerative farming
  • Sustainable land practices – multi-functional landscapes
  • Repurposed industrial landscapes & reprocessing & remanufacture facilities
  • Centralised & distributed water networks
  • Source control (RWH, SuDS) to reduce surface water volume; reed beds, constructed wetlands, sludge biodigesters & other innovative solutions to treat & reuse wastewater products & generate heat & power
Neo-liberal (private good, profit driven), technocratic & opaque with limited understanding of negative unintended consequences. Clearly unfair /unjust and consequently leading to unhappiness and poor health and wellbeing. Unhealthy food and urban systems. Social (public good, shared value driven), democratic & transparent with understanding of risk & trade-off management. Driven to be fair/just leading to happiness and improved health and wellbeing. Healthy food and urban systems.
  • Co-produce new policy approaches & tools for SETS-focused analysis & assessment of multiple capitals/services/goods (instead of cost-benefit analysis or £-based metrics only)
  • Promote corporate responsibility & participatory approaches for adoption of corporate shared value in all organisations over a certain size (see OFWAT requirement of water industry)
  • Individuals & communities visible in assessments & co-production of indicators with appropriate multi-sector professionals
  • Water bodies as legal entities – Environmental Personhood, Earth Law*
  • New business models & reconfigured supply chains e.g. Future Farming^
  • Rejection of GDP, incorporation of equity/social justice, diversity and inclusivity principles
  • Co-created ‘Performance wheels’ for System Services & Nexus Outcomes
  • Distributed ownership between, for instance, private, community and public (state)
  • Changes in social practices including behaviour change, citizen science, participatory approaches, environmental education (including different value & worldview systems), embedding equity & fairness
  • Regenerative economics – sustainable finance, green bonds
  • Socially just and eco-centric alternatives to GDP
Non-evaluative & nonadaptive, lags behind current thinking & science Evaluative & adaptive, keeps up with & drives current thinking & science (innovation)
  • Co-develop structures for enhanced evaluation & policy updating & implementation cycles
  • Co-produce updated frameworks/strategies for working with science/research organisations for timely deployment state-of-the-art knowledge (including place-based scale/actors)
  • WINEP
  • Environment Agency 25YEP
  • River Dart Charter
  • Connecting the Culm Blueprint
  • Landscape 3 provides an open interactive space for collaborative visioning, backcasting, participatory deliberative processes & iterative co-production of science communication, policy
Table 2. System Services and Nexus Outcomes benefit ‘wheels’ categories and segments.
Preprints 85580 i001a
Preprints 85580 i001b
Table 3. Water Visions Visualisation Platform evaluation criteria achievement summary.
# Criteria Achieved? How?
1 Promotes understanding of futures thinking as being imperfect and exploratory Yes Introductory, disclaimer and item description texts cover this in their narratives
2 Explores a particular question Yes The question/aim is provided in the Introduction/Welcome
3 Grounds thinking in data and trends whilst recognising creative thinking and distinguishing between objective facts and imaginative visions Yes Evidence-based [19], which underpins narratives with imaginative illustrations to support creative thinking
4 Uses ‘What? So what? Now what?’ questions to explore impacts and include next steps, time-frames, impact severity and interconnections Yes Benefits wheels provide the ‘so what’, potential impacts and interconnectivity, guiding next steps and time-frames for consideration
5 Uses narratives and storytelling for visualisation Yes Illustrated landscapes, zones, systems and features are accompanied by a textual narrative, which weaves a wider story
6 Asks the audience how they want to be communicated with. The language, content and format(s) should be audience specific and understood from the outset Yes Methodology includes co-creation to embed these aspects
7 Recognises uncertainty and tipping points Yes Narratives are framed using uncertainty and multiple illustrations indicate there is no set future
8 Clearly defined purpose, aim, objectives Yes The question/aim is provided in the Introduction/Welcome
9 Strategic and evidence-based, with links to the evidence embedded to provide accuracy and legitimacy Yes Evidence-based [19], with links to the evidence embedded in the clickable pop-ups (journal papers, reports, websites, videos, animations, images, podcasts)
10 Current and future scenarios, as well as a variety of scenarios Yes L1 – current, L2 & L3 – futures, L4 – co-creatable wireframe
11 Accessibility/easily accessible, including software used Yes Heavily Microsoft Office-biased, as this tends to be industry standard in the country of origin (UK) but could be substituted with other preferred software
12 Includes a User guide Yes User guide provided on website and landing page of Platform
13 Zoom-in ability (similar to ‘virtual globe’) Yes Illustrations decrease in scale to facilitate zooming
14 Interactive view and explore function Yes Clickable pop-ups and navigation icons provide interaction and explore functions
15 Easily navigable Yes Navigation is via click and go, which is familiar to most audiences
16 Easy to interpret/understand Yes Format follows standard protocols, content is designed to avoid cognitive overload (short text boxes etc)
17 Clear visuals (e.g. text/pixel size), assumptions, limitations and methods Yes Appropriate font sizes and image resolution
18 Includes spatial and policy aspects Yes Spatial element provided through use of landscapes, zones and systems; policy elements contained within narratives
19 Media in a variety of formats to engage users Yes Links out to journal papers, reports, websites, videos, animations, images, podcasts and others
20 Cost/benefit/trade-off/performance information Yes Benefits wheels and narrative elements in pop-ups
21 Supports stakeholder engagement Yes Co-created amongst stakeholders and can be used as a stakeholder engagement tool
22 Facilitates reflection Yes Supports ‘what if’ thinking, which is inherently reflexive
23 Enables co-development/co-creation Yes Co-created amongst stakeholders, L4 specifically included for co-creation/workshopping and Platform can be further co-developed as is fully reconfigurable
24 Supports learning (including social learning) Yes Enables users to acquire and apply new knowledge; can bring together multiple users to share and learn together
25 Supports online/workshop collaboration Yes Parallel exploration possible and L4 specifically included for co-creation/workshopping
26 Empowers decision making at a range of levels Yes Enables users to compare and consider a range of interventions and actions
27 Opportunity for face to face support (e.g. through knowledge brokers) Yes Authors can provide support or train others to provide support
28 Is useful and satisfies users’ needs Yes Indicated through co-creation process and user feedback
29 Climate change is framed as a phenomenon personally relevant to the target audience Yes Yes, includes individual-scale interventions and actions
30 Communication on risks and impacts resonates with local practices, values, concerns and previous experiences Yes Narratives are grounded in the local (though currently context-specific to UK)
31 Communication provides opportunities to explore impacts by oneself Yes Self-guided user journey option
32 Information is transparent: uncertainties are made understandable and are visualized to appear credible Yes All narratives, wheels and pop-ups are framed in this way
33 Information is not over-simplified Yes Narratives and media are clear and use explicit rather than simple language with definitions provided where needed and in a glossary and List of Features to support
34 Not only fearful messages are spread Yes Message framings and narratives are realistic but optimistic and hopeful
35 Information relates to established implementation barriers Yes Evidence-based barriers are framed appropriately
36 Communication presents clear options and lists of alternative adaptation measures to choose from Yes Clickable item menus and List of Features clearly convey options
37 Communication on actions is tailored to the needs and objectives of the target audience and relates to everyday concerns Yes Everyday concerns are articulated through Features that work less well (L1) and work better (L2, L3) at different scales for a range of audiences
38 Adaptation options are visualised Yes Illustrations, imagery and multi media
39 It is clear how individual adaptative responses can make a difference Yes Through benefits wheels and narratives
40 Communication enhances engagement and discussion among users Yes User feedback indicates the Platform is being used to communicate future water vision interventions and action within and amongst different groups
Table 4. Collated feedback on the Platform from webinars and initial website feedback forms.
Theme Comment
General Thanks everyone - great and interesting presentation
Thanks so much for sharing - great work
Excellent...thanks
Thanks, food for thought, hope we can use it in our work
Thanks all. love this work
Great presentation, many thanks
Thank you- really amazing - great to see this emergingThis is all amazing thank you so much for presentation and tour, really fascinating work.
Navigation I found that where I was to go next not always clear, but that just maybe me!
Visuals/Platform Excellent graphics, really strong navigation and great overall look and feel
Platform looks very good
Illustrations are really clear and comprehensive and underpinning text and sources are helpful; could be enhanced through additional features such as short videos/sound files; vignettes from different 'personas', etc
Illustrations were good and clear and easy to navigate between landscapes etc. Although urban areas were included overall the landscape did look quite rural although that may be representative of actual real-life proportions? There were areas that looked liked towns, but nothing that looked like a city.
How do the landscapes take into account the additional pressures/risks that climate change will place on them?
Which organisation created the platform? E.g. the drawings and assembling the interactive elements?
Noticing that the illustrations are prepared by a Landscape Architect, and encapsulate thinking and skills of that profession. Can the creative and artistic skills used here be acknowledged and promoted?
Futures Interesting alternative futures - EEA have different imaginaries to 2050 that are more generic Imagining sustainable futures for Europe — European Environment Agency (europa.eu)
The realistic descriptions of BAU are welcome
Surely there is a plausible scenario that is worse than BAU - why isnt it included
Why 2100? is this too far in the future? will people be able to engage effectively with this timescale? can there be some interim timescale?
Thank you for presenting a really positive view of our future, it certainly feels like it has achieved what is intended and gives hope. A pressure that is quite significant on the emphasis on community involvement is time availability and often this links to employment - forgive me if I missed it but is employment/how we work factored in to the model?
Approach is dominated by eco-technical scenario that may not be successful and sufficient – sorry
Video/animation/sound In the video for 'Circularity of bioresource centre' I thought it was completely silent until the sound of the toilet flushing, which then meant I was unsure if there should have been any other sounds throughout the video so turned volume up in case I was missing anything, to just have one sound seems a bit strange. The last slide in that video could do with staying up a bit longer to give people time to have a proper read of the points.
Wheels I was unsure in the scoring system of the nexus wheels if 1 or 5 was good/bad, it would maybe be useful to say this in the user guide in the relevant section.
Hi...great work....be interested to know if the scales on the wheels are qualitative or quantitative. Thanks
Technical information How are land utilisation change and functional vegetation types on these lands considered here at hydrological basin level from the perspective of soil composition and porosity change, hydraulic conductivity etc. at say, A and B horizons to understand 1) temporal and quantitative variation of run-off discharged into rivers, and 2) pollution load and carrying capacity of increased run-offs where this is observed? NB: these observations relate also to aquifer recharge time and future water quality. Apologies for the long question 😊Thank you.
Livestock sheds could/should include issues around air quality re ammonia emissiosn
What about non-coastal sewerage discharges? Is there a scenario for that?
I may have missed it but was there anything on changes to transportation, goods and people?
I think I know what green and blue skills are, but what are grey/black - assume it is not concreting and tarmacing!
Is there a vision that these features might be presented as Expected and investment opportunities suggested with planning status etc
Audience/users To what extent was the platform co-created with users to ensure it meets their needs?
Are you planning to track how the tool is used and its impacts?
Do you have a feel for who would be the principle user group? I can see a scenario where it is of more use for policy makers in its depiction of a standardised catchment but in practice it will be accessed and used more by those looking to make local environmental improvements. Does the tool have a mechanism to explore the information tailored to groupings of catchment type?
I can see this being a really useful engagement tool but as currently populated is not so relevant to a developing world context (my interest). However the approach and framework could be used to produce such a version
Learning It's a great platform and is quite fun to use with all the different landscapes and buttons. I will probably spend longer another time having a proper look around the platform and linking through to some of the articles etc. You could spend a lot of time on it which would be really worthwhile for learning.
The complex interplay of each individual issue and how they can impact upon the whole.
Importance of taking a forward-looking systems and Nexus approach; seeking systemic transformation and building underpinning competencies and capabilities to achieve sustainable futures
Glitching I just had a couple of issues. One was that I couldn't open the user guide in the sidebar of the landscape section, I had to go back to the homepage and then into the user guide (I wanted to do this to double check if the nexus wheel 1-5 scoring system said which was good or bad). The second was I had a box pop up with an error randomly, then when I came out of the landscape and back into it it did work the second time, but this could put people off from persevering with the platform.
Disclaimer/Publisher’s Note: The statements, opinions and data contained in all publications are solely those of the individual author(s) and contributor(s) and not of MDPI and/or the editor(s). MDPI and/or the editor(s) disclaim responsibility for any injury to people or property resulting from any ideas, methods, instructions or products referred to in the content.
Copyright: This open access article is published under a Creative Commons CC BY 4.0 license, which permit the free download, distribution, and reuse, provided that the author and preprint are cited in any reuse.
Prerpints.org logo

Preprints.org is a free preprint server supported by MDPI in Basel, Switzerland.

Subscribe

© 2024 MDPI (Basel, Switzerland) unless otherwise stated