1. Introduction
The need to discover new materials with improved properties is the driving force for many scientific and technological ventures. In the past decade, the area of conducting polymers has attracted enormous attention from many branches of science: physics, chemistry and several engineering disciplines. The desirable electrical, optical, chemical and electrochemical properties of conducting polymers have made their applicability in many technological areas possible [
1,
2,
3,
4,
5,
6].
Much of the research on conducting polymers, particularly polyaniline, has been focused on understanding its applicability in coatings [
7], biosensors [
8], light emitting diodes [
9], batteries [
10] and microelectronics However, despite its desirable applicability, polyaniline is insoluble in many organic solvents such as N-methyl-pyrrolidone (NMP), thereby posing a problem as far as its processing is concerned. In order to circumvent the problem of solubility, previous researchers have explored polyaniline derivatives such as poly(o-anisidine) [
12,
13,
14] and poly(
N-ethyl-aniline) [
15,
16,
17]. A tremendous research effort has also been dedicated to the study of polyaniline copolymers due to their solubility in common organic solvents such as N-methyl-pyrrolidone [
18,
19,
20,
21,
22,
23,
24,
25,
26]. Longun et al. [
18], synthesized poly(o-anisidine-co-aniline) copolymer via chemical oxidative polymerization and studied its chemical, optical and thermal properties. They reported extended UV-Vis absorption and distinctive chemical features of the copolymer compared to their respective homopolymers.
Previous researchers have studied polyimide/clay nanocomposites and reported increased tensile modulus and thermal stability as well as decreased permeability to gases [
27,
28,
29,
30,
31,
32]. In this study, montmorrilonite clay, Cloisite 30B was modified by poly(
N-ethyl-aniline-co-aniline-2-sulfonic-acid) [SPNEAC] copolymer synthesized by chemical oxidative polymerization The resultant modified-clay was used a filler material in the condensation polymerization of polyimide to determine its effect on the imidization process. Thereafter, the effect of poly(
N-ethyl-aniline-co-aniline-2-sulfonic-acid)-modified-clay [SPNEAC] on the optical, morphological, chemical, thermal, and dynamic mechanical properties of the polyimide nanocomposites was studied. This systematic study is geared towards understanding the properties of the newly created polyimide nanocomposite materials which combines desirable optical and electrical properties of polyaniline copolymers, and the superior dimensional and thermal stability of clay with the outstanding thermal stability and tensile modulus of polyimide. Incorporation of the polyaniline copolymer/clay filler into the polyimide matrix would also enable the matrix and the copolymer to interact synergistically as a result of their opposite polarity. Polyimide has been shown to be negatively charged [
33,
34,
35] while polyaniline is positively charged [
36] and the interaction between the two polymers can enable the polyimide matrix to play the role of polymeric dopant, thereby influencing the optical properties of the polyaniline copolymer. The suggested intimate interaction between polyimide and polyaniline copolymer, in the presence of clay, is also important in regard to the imidization of polyimide, which is thoroughly discussed in this study. It is believed that the intimate interaction between polyimide, clay and the polyaniline copolymer can play an important role in the cyclodehydration process which is essential for efficient and proper processing of polyimide.
2. Materials and Methods
2.1. Materials
The reagents used in this study are as follows: aniline-2-sulfonic acid (95% purity), N-ethyl-aniline (98% purity) and N-methyl-pyrrolidone (99% purity), purchased from Sigma-Aldrich Company. Oxalic acid (99% purity), Dodecyl-benzene sulfonic acid monohydrate (98% purity), 4,4-oxydianiline (99% purity), Pyromellitic dianhydride (99% purity) and Ammonium persulfate (99% purity) were also purchased from Sigma-Aldrich Company. Cloisite-30B clay was purchased from Southern Clay Inc. The Al-2024-T3 Q-panels were purchased from Q-Labs, Cleveland, Ohio. All the reagents listed above are of analytical grade; AR. Doubly distilled and de-ionized water were also used.
2.2. Synthesis of Poly(N-ethyl-aniline-co-aniline-2-sulfonic acid-clay( SPNEAC) copolymer
Synthesis of Poly(N-ethyl-aniline)-copolymer-clay was achieved via a single polymerization process. 5.41 g of aniline-2-sulfonic(A2-S), 3.94 of N-ethyl-aniline(NEA), 1.125 of Oxalic acid (OA), 4.36 of dodecyl-benzene-sulfonic acid monohydrate(DBSA) and 0.585 g of Cloisite 30B Clay were added to a beaker containing 150 ml of doubly distilled water followed by ultrasonication for 3-5 minutes. Stirring was continued for 30 minutes using a mechanical stirrer after which Cloisite-30B clay was added to the resultant mixture followed by stirring for 30 minutes. 4.36 g of ammonium persulfate (APS) was added drop-wise to the mixture followed by stirring for 24 hours. The product was dried in a vacuum oven at 120 ˚C and then stored in a desiccator.
2.3. Synthesis of poly(amic acid)/Poly(N-ethyl-aniline)-co-aniline-2-sulfonic acid)-Clay(SPNEAC-PAA)
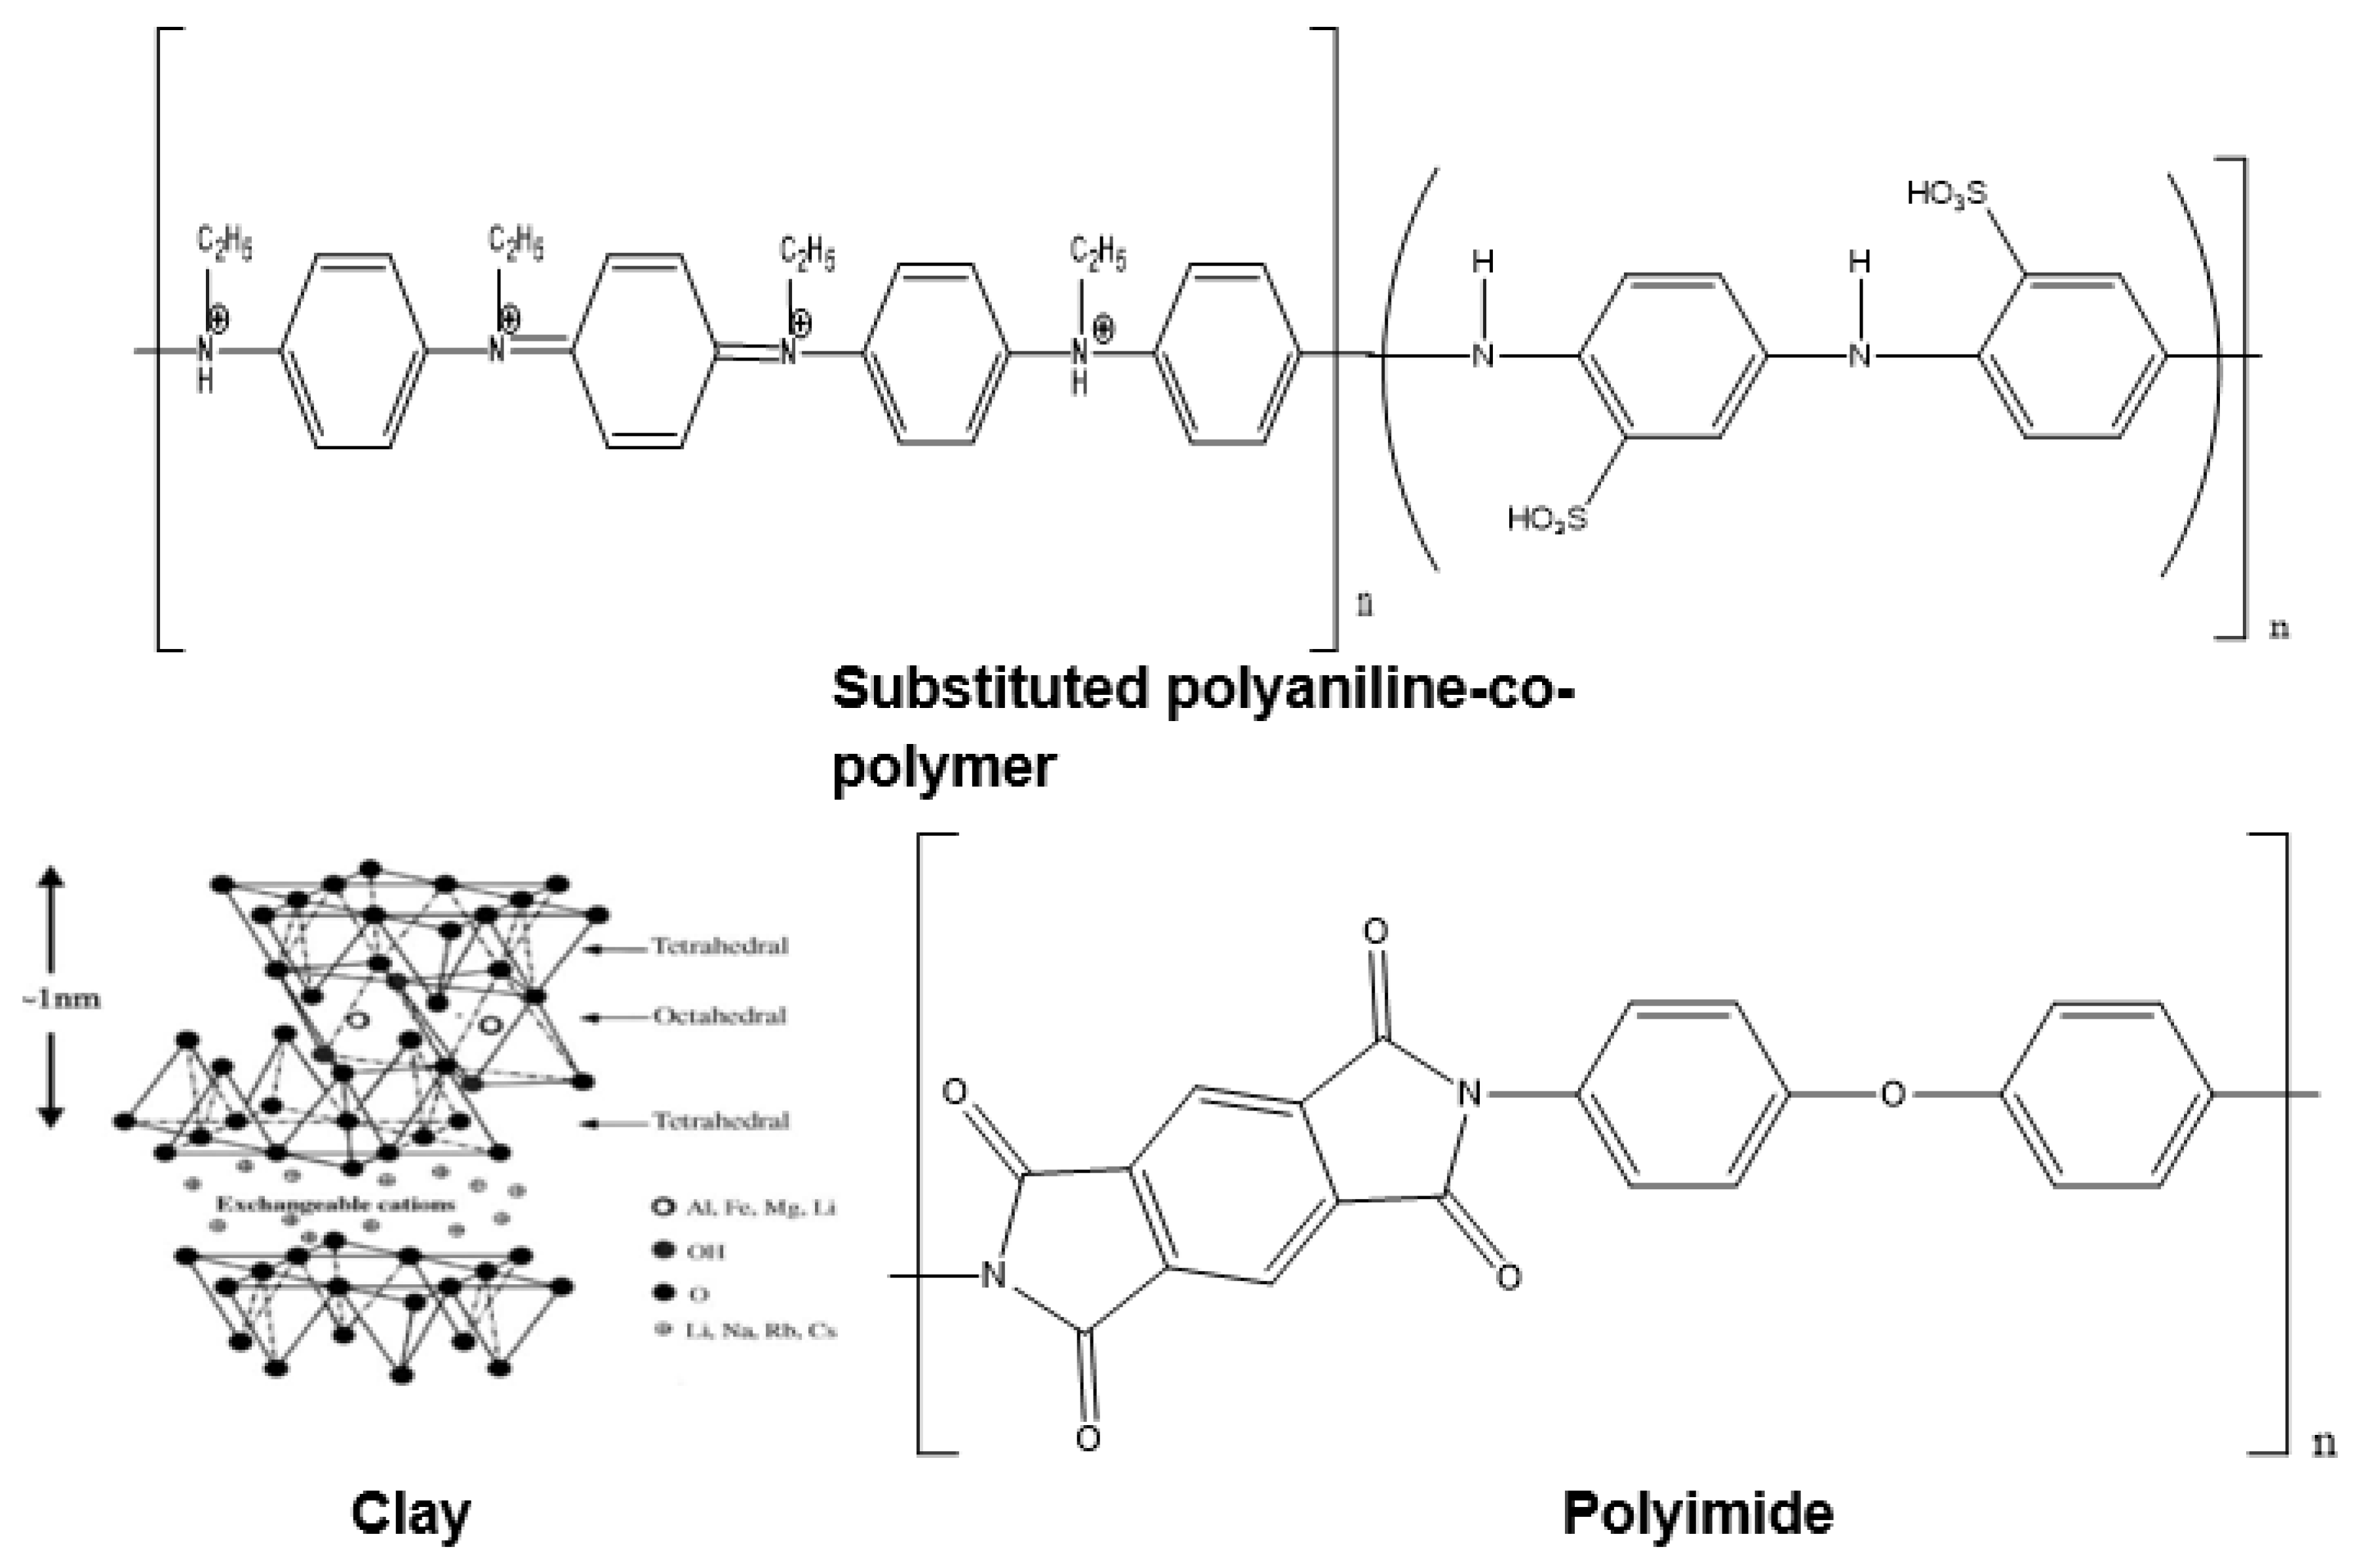
5.1608 g of 4, 4-oxydianiline (ODA was added to 100 ml of N-methyl-pyrrolidone (NMP) in a round-bottom flask and stirred for 30 minutes using a mechanical stirrer. Poly(N-ethyl-aniline-co-aniline-2-sulfonic acid)-clay [SPNEAC] (
Figure 1) prepared in the previous step was added to the ODA solution followed by vigorous stirring. After 6 h of stirring, 5.6216 g of pyrromellitic dianhydride, PMDA was added to the mixture and stirring was continued for 15 h. Suspensions were prepared using 0.25, 0.5, 1, 2, 5 and 10 wt.% SPNEAC.
2.3. Preparation of polyimide/Poly(N-ethyl-aniline-co-aniline-2-sulfonic acid)-clay(SPNEAC-PI) nanocomposite films
Polyimide/poly(N-ethyl-aniline-co-aniline-2-sulfonic acid)-clay films were prepared by casting SPNEAC-PAA suspension on glass substrate. Films were prepared by solution casting on glass plate followed by drying in a vacuum oven at120
˚C for 2 h. Final curing was done in a vacuum oven at 200
˚C for 1h to produce polyimide nanocomposites (
Figure 1 (bottom)) filled with varying amounts of the nanomaterials.
2.4. Characterization
Nicolet 6700 FT-IR instrument equipped with Smart Orbit ATR accessory with diamond crystal, was used to determine the chemical composition of the nanocomposite. ATR analysis was performed over a wavenumber range of 4000 cm-1 to 400 cm-1. UV-Visible spectroscopy was used to study the optical properties of polyimide and SPNEAC/polyimide nanocomposites. Measurements were performed by using a U-3000 series spectrometer with wavelength range of 190 nm to 900 nm. UV-Vis samples were prepared by dispersing 0.5 mg of the sample in 10 ml of N-methyl-pyrrolidone (NMP). Solid-state UV-Vis, was performed by using UV-Vis spectrophotometer. Single cell Peltier Accessories was used to measure the transparency of the SPNEAC-PI nanocomposite films. Dynamic Mechanical Spectroscopy (DMS) was used to study the viscoelastic behavior of the nanocomposites. Measurements were performed from 25 ˚C to 550 ˚C using EXSTAR6000, Seiko Instruments Inc., under tensile loading mode at a heating rate of 5˚C/min and a frequency of 1 Hz. Thermal transitions were determined by using DSC 6200; Seiko Instruments Inc. Tests were performed at a heating rate of 10 ˚C/min under a nitrogen atmosphere. Cross-sectional morphology of the films was studied using Scanning Electron Microscopy, SEM Hitachi FEG Model.
SEM samples were prepared by immersion in liquid nitrogen and then fractured using a pair of tweezers to expose the cross-sectional area. A Polaron SC7640 sputter coater was used to sputter coat the samples with silver, Ag.
3. Results
3.1. Optical properties
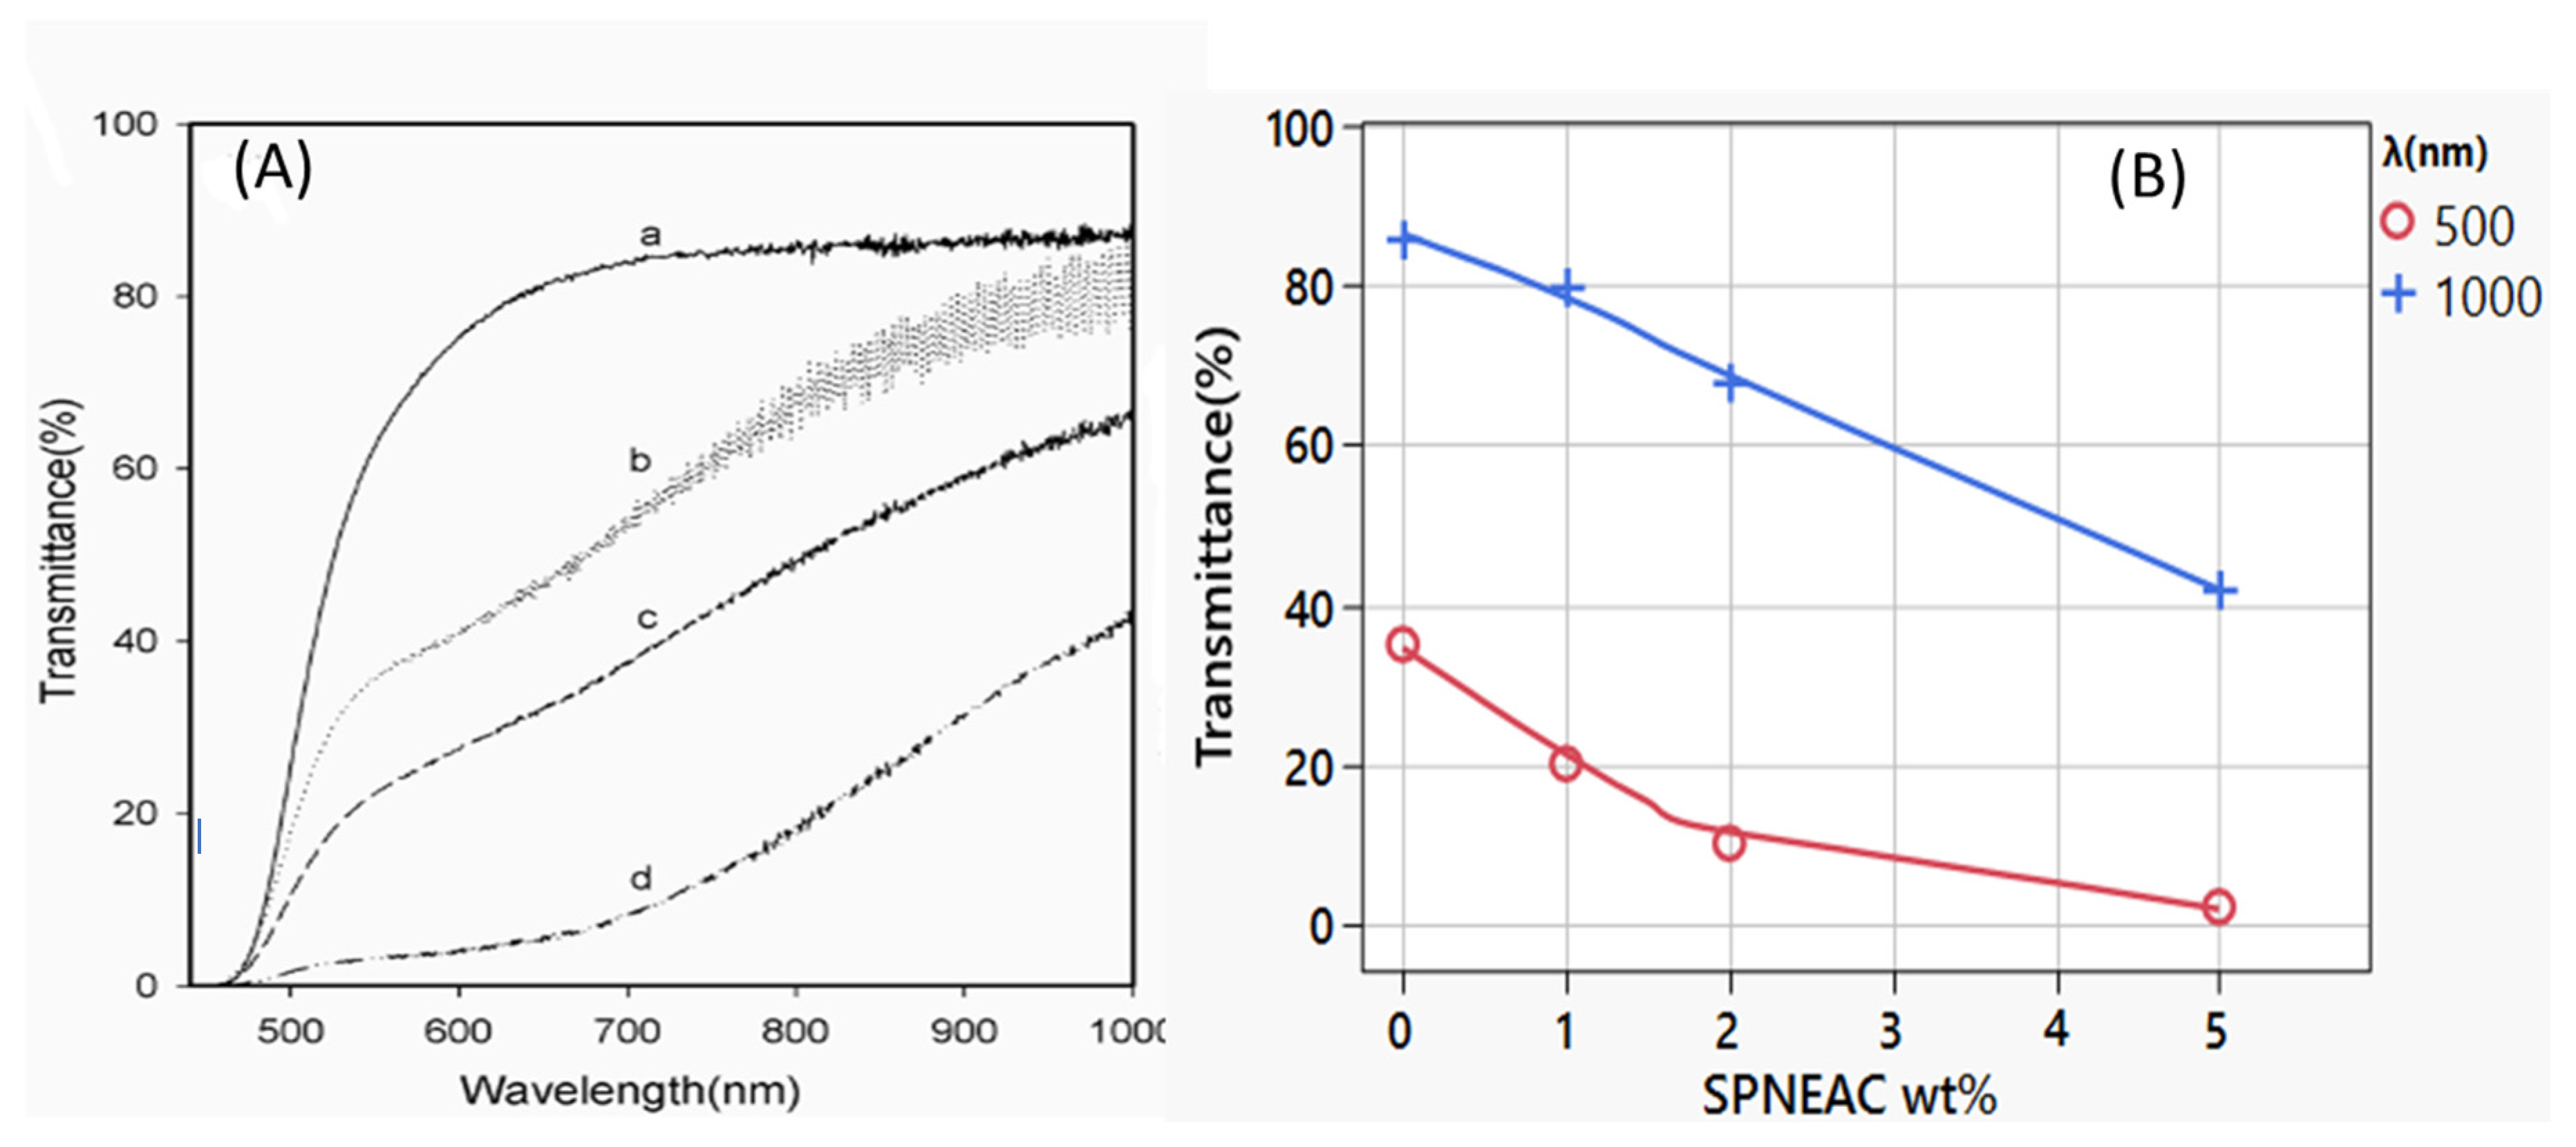
Figure 3A shows the transmittance of PI and SPNEAC-PI nanocomposite films as a function of composition and wavelength. The percent transmittance of the SPNEAC-PI nanocomposite decreases with increasing copolymer/clay (SPNEAC) loading. Percent transmittance of 85, 81, 66 and 42 % were obtained in the Visible and Near-Infrared (VIS-NIR) region at1000 nm for PI nanocomposite membranes containing 0, 1, 2 and 5 wt. % SPNEAC, respectively. The decreased transmittance in the VIS-NIR region is believed to be due to the optical activity of poly(N-ethyl-aniline-co-aniline-2-sulfonic acid) in this region. The effect of composition of SPNEAC on the optical transmittance at two frequencies (λ) of 500 and 1000 nm is shown on
Figure 2B and
Table 1. It is shown that neat PI membrane has the highest transmittance of about 62 and 82 % at 500 and 1000 nm, respectively. Interestingly, the optical transmittance for the nanocomposites shows two regimes. The first regime occurs between 450 and 600 nm and it is due mainly to the matrix (PI), while the second regime occurring between 700 and 1000 nm, is believed to be due to the contribution from both SPNEAC and the Matrix. This observation is in agreement with the data shown in
Figure 3 which indicates that the transmittance of SPNEAC decreases sharply with increasing wt.% SPNEAC at frequencies of 500 and 1000 nm (
Figure 2).
3.1. Functional group analysis and degree of imidization
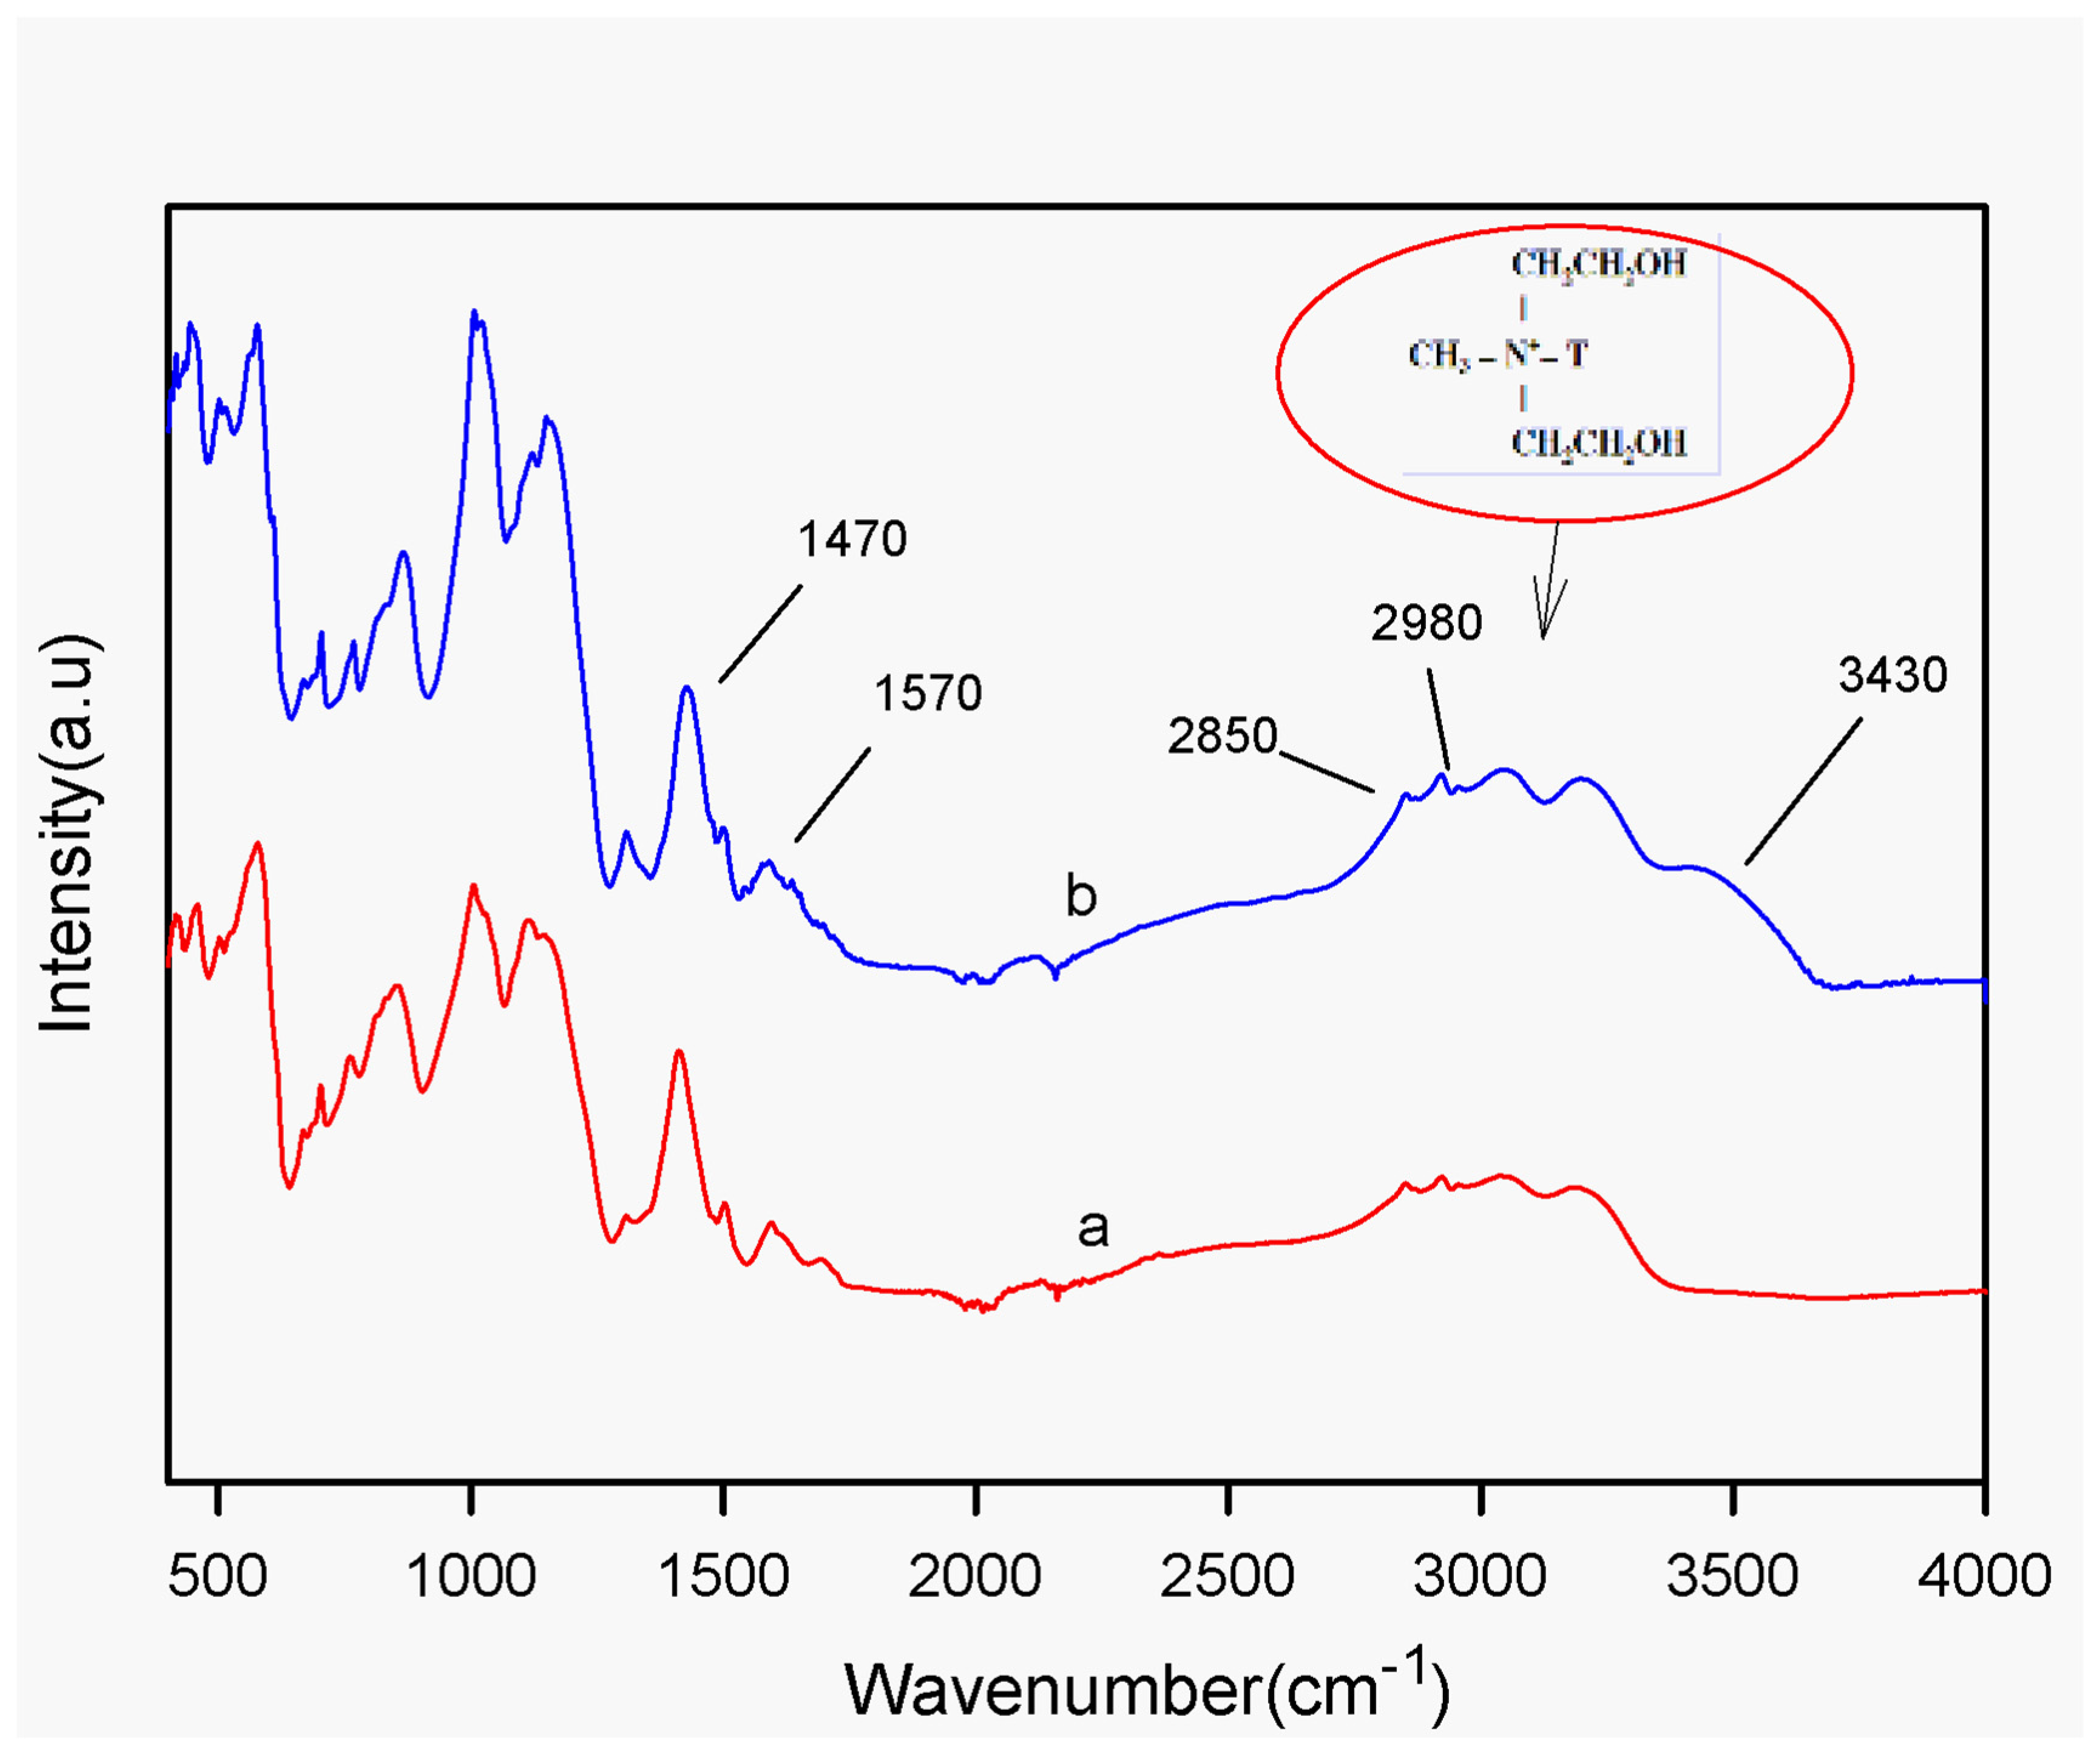
Figure 3a,b show the ATR spectra of poly(N-ethyl-aniline)-copolymer (SPNEA) and poly(N-ethyl-aniline)-copolymer-clay (SPNEAC) nanocomposite, respectively. The ATR spectrum (
Figure 3b) of SPNEAC shows an absorption band at 3430 cm
-1, which is assigned to OH stretching of surface hydroxyl groups. The absorption bands at 2980 and 2850 cm
-1 are assigned to the asymmetric and symmetric stretching of the CH
2 groups in clay. The absorption bands at 3430, 2980 and 2850 cm
-1 confirm the presence of copolymer modified-clay. Absorption bands at 1570 and 1470 cm
-1 due to the quinoid and benzenoid structures, respectively, are shown.
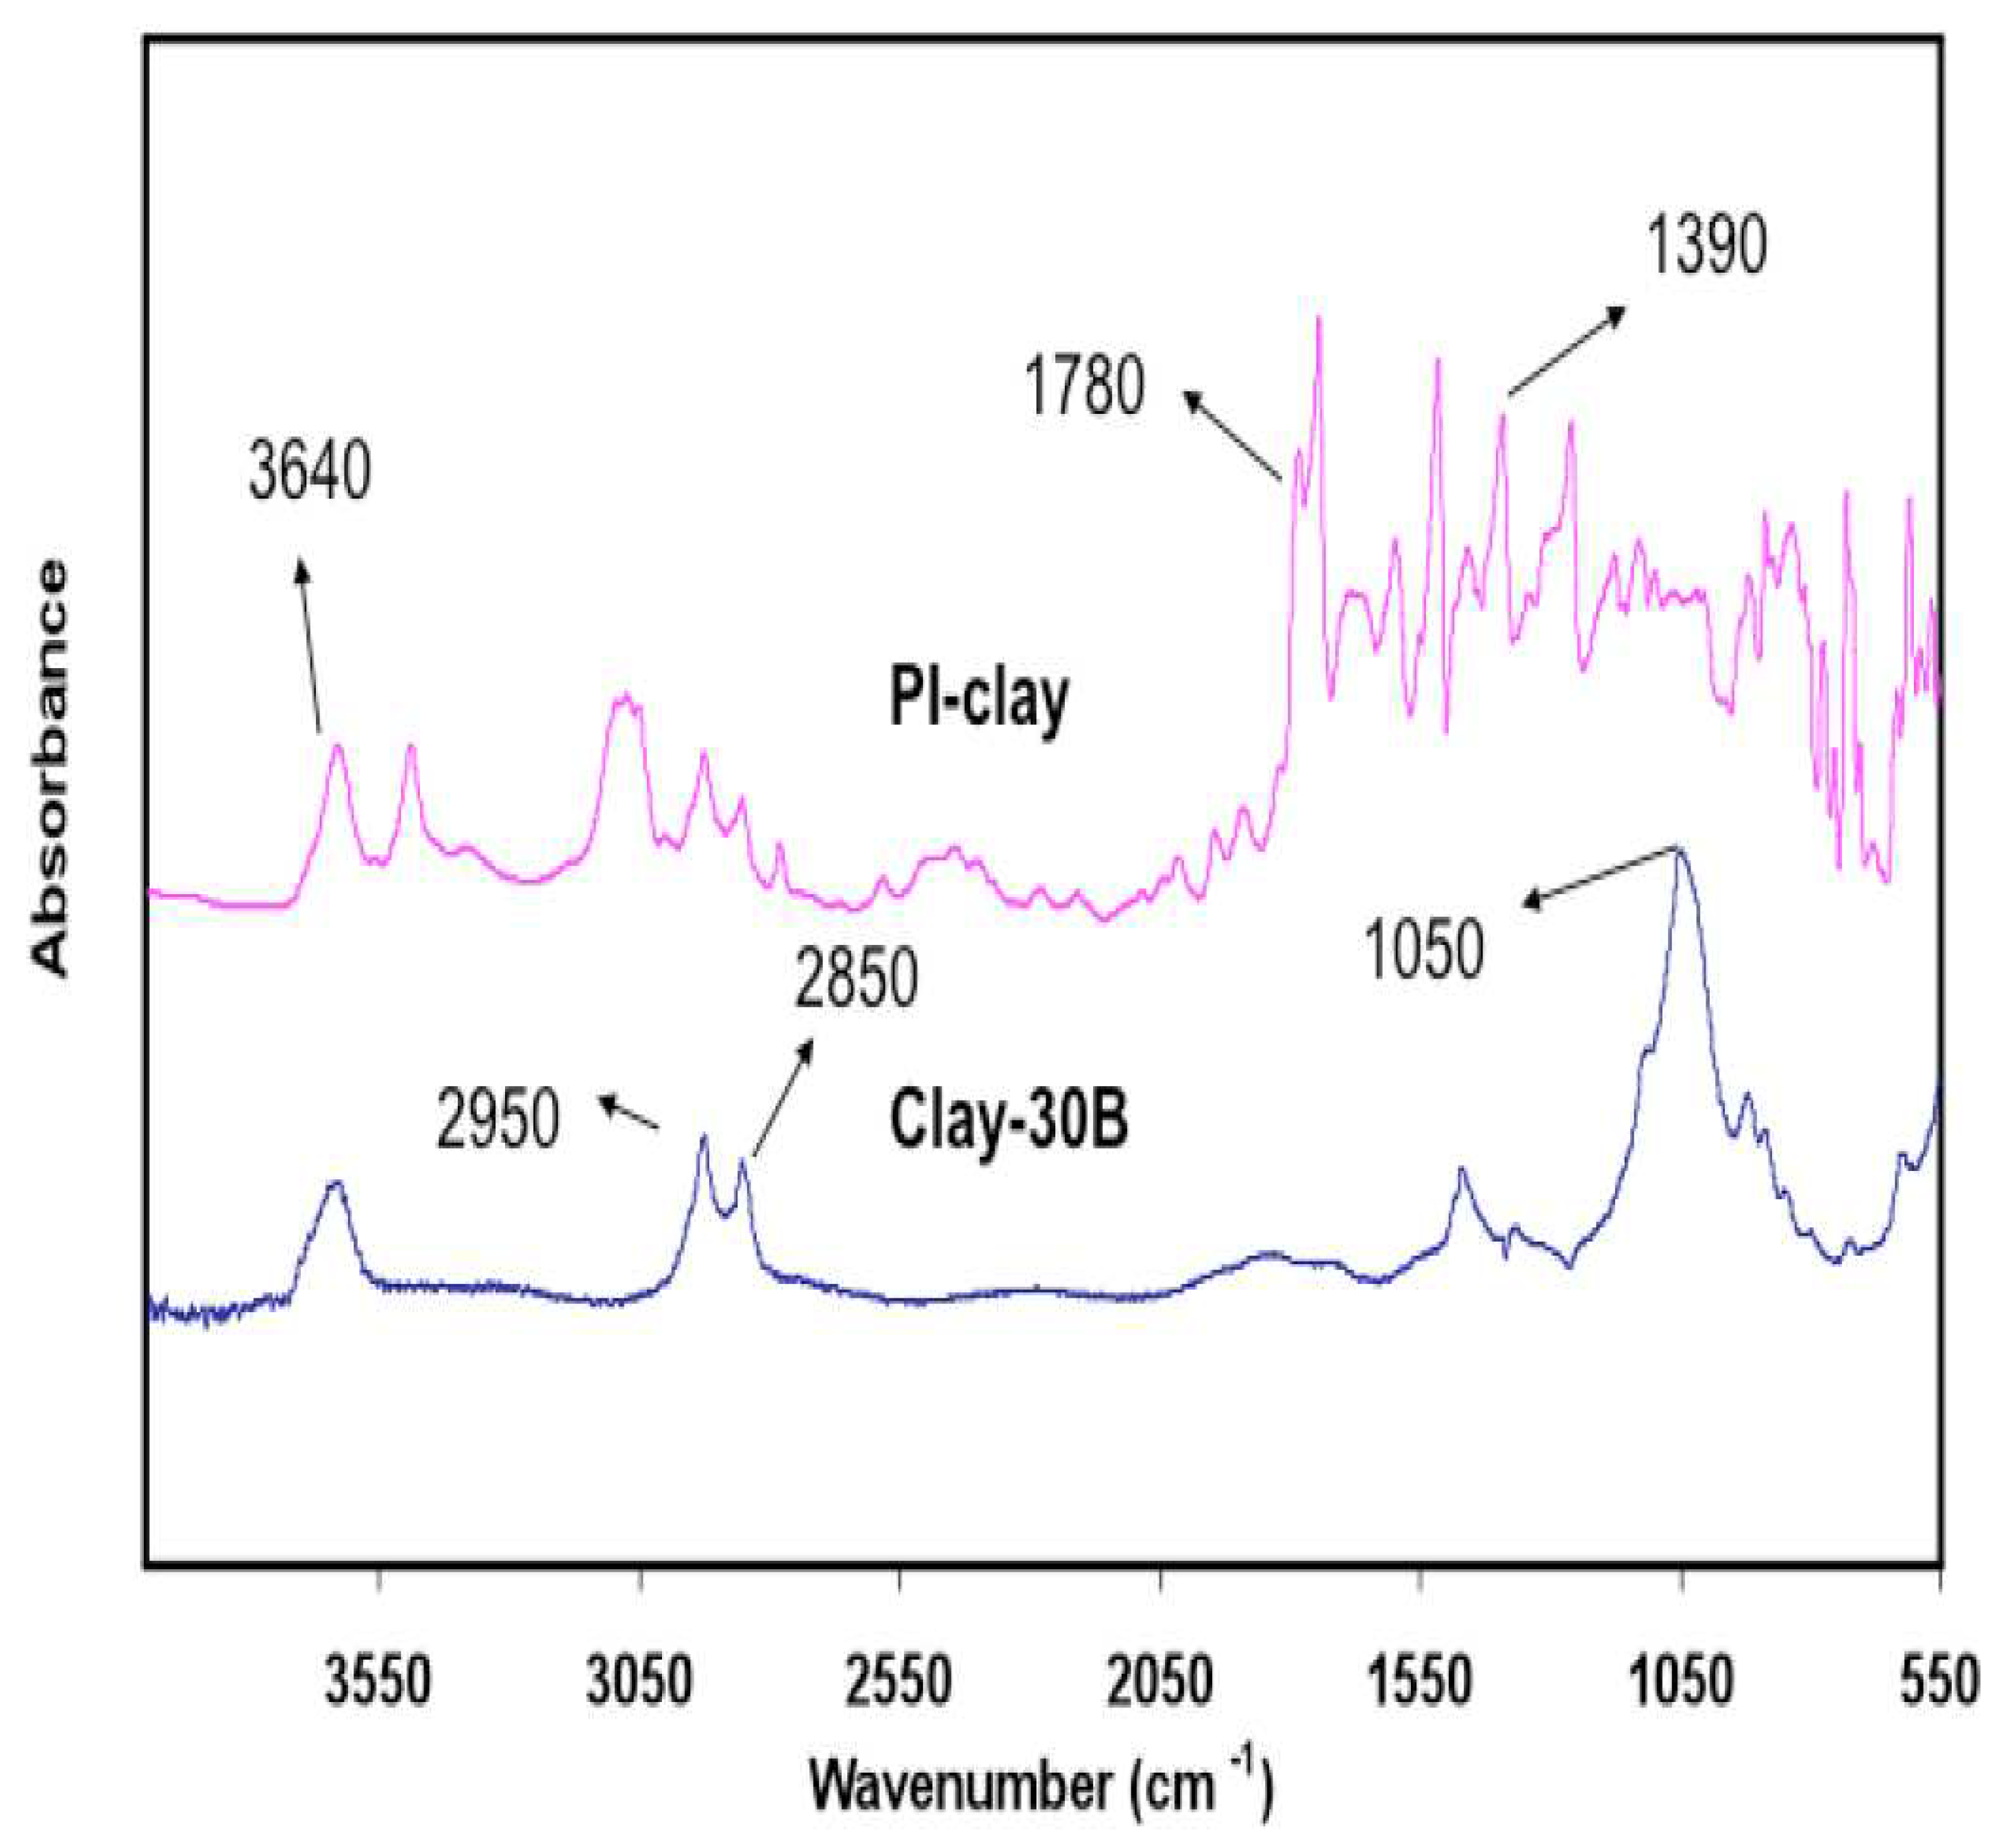
Figure 4 shows the ATR spectra of 30B clay and PI-30B clay nanocomposites. Typical clay peaks are observed at 2850 and 2950 cm
-1 due to methylene and methyl group present in organoclay, and the absorption band at 1360 cm
-1 is due to C-N stretching of the tertiary amine. The 1470 cm
-1 absorption band due to the stretching of the phenyl ring is also observed.
Figure 3 and
Figure 4 confirm the presence of clay in SPNEAC and PI-clay nanocomposites.
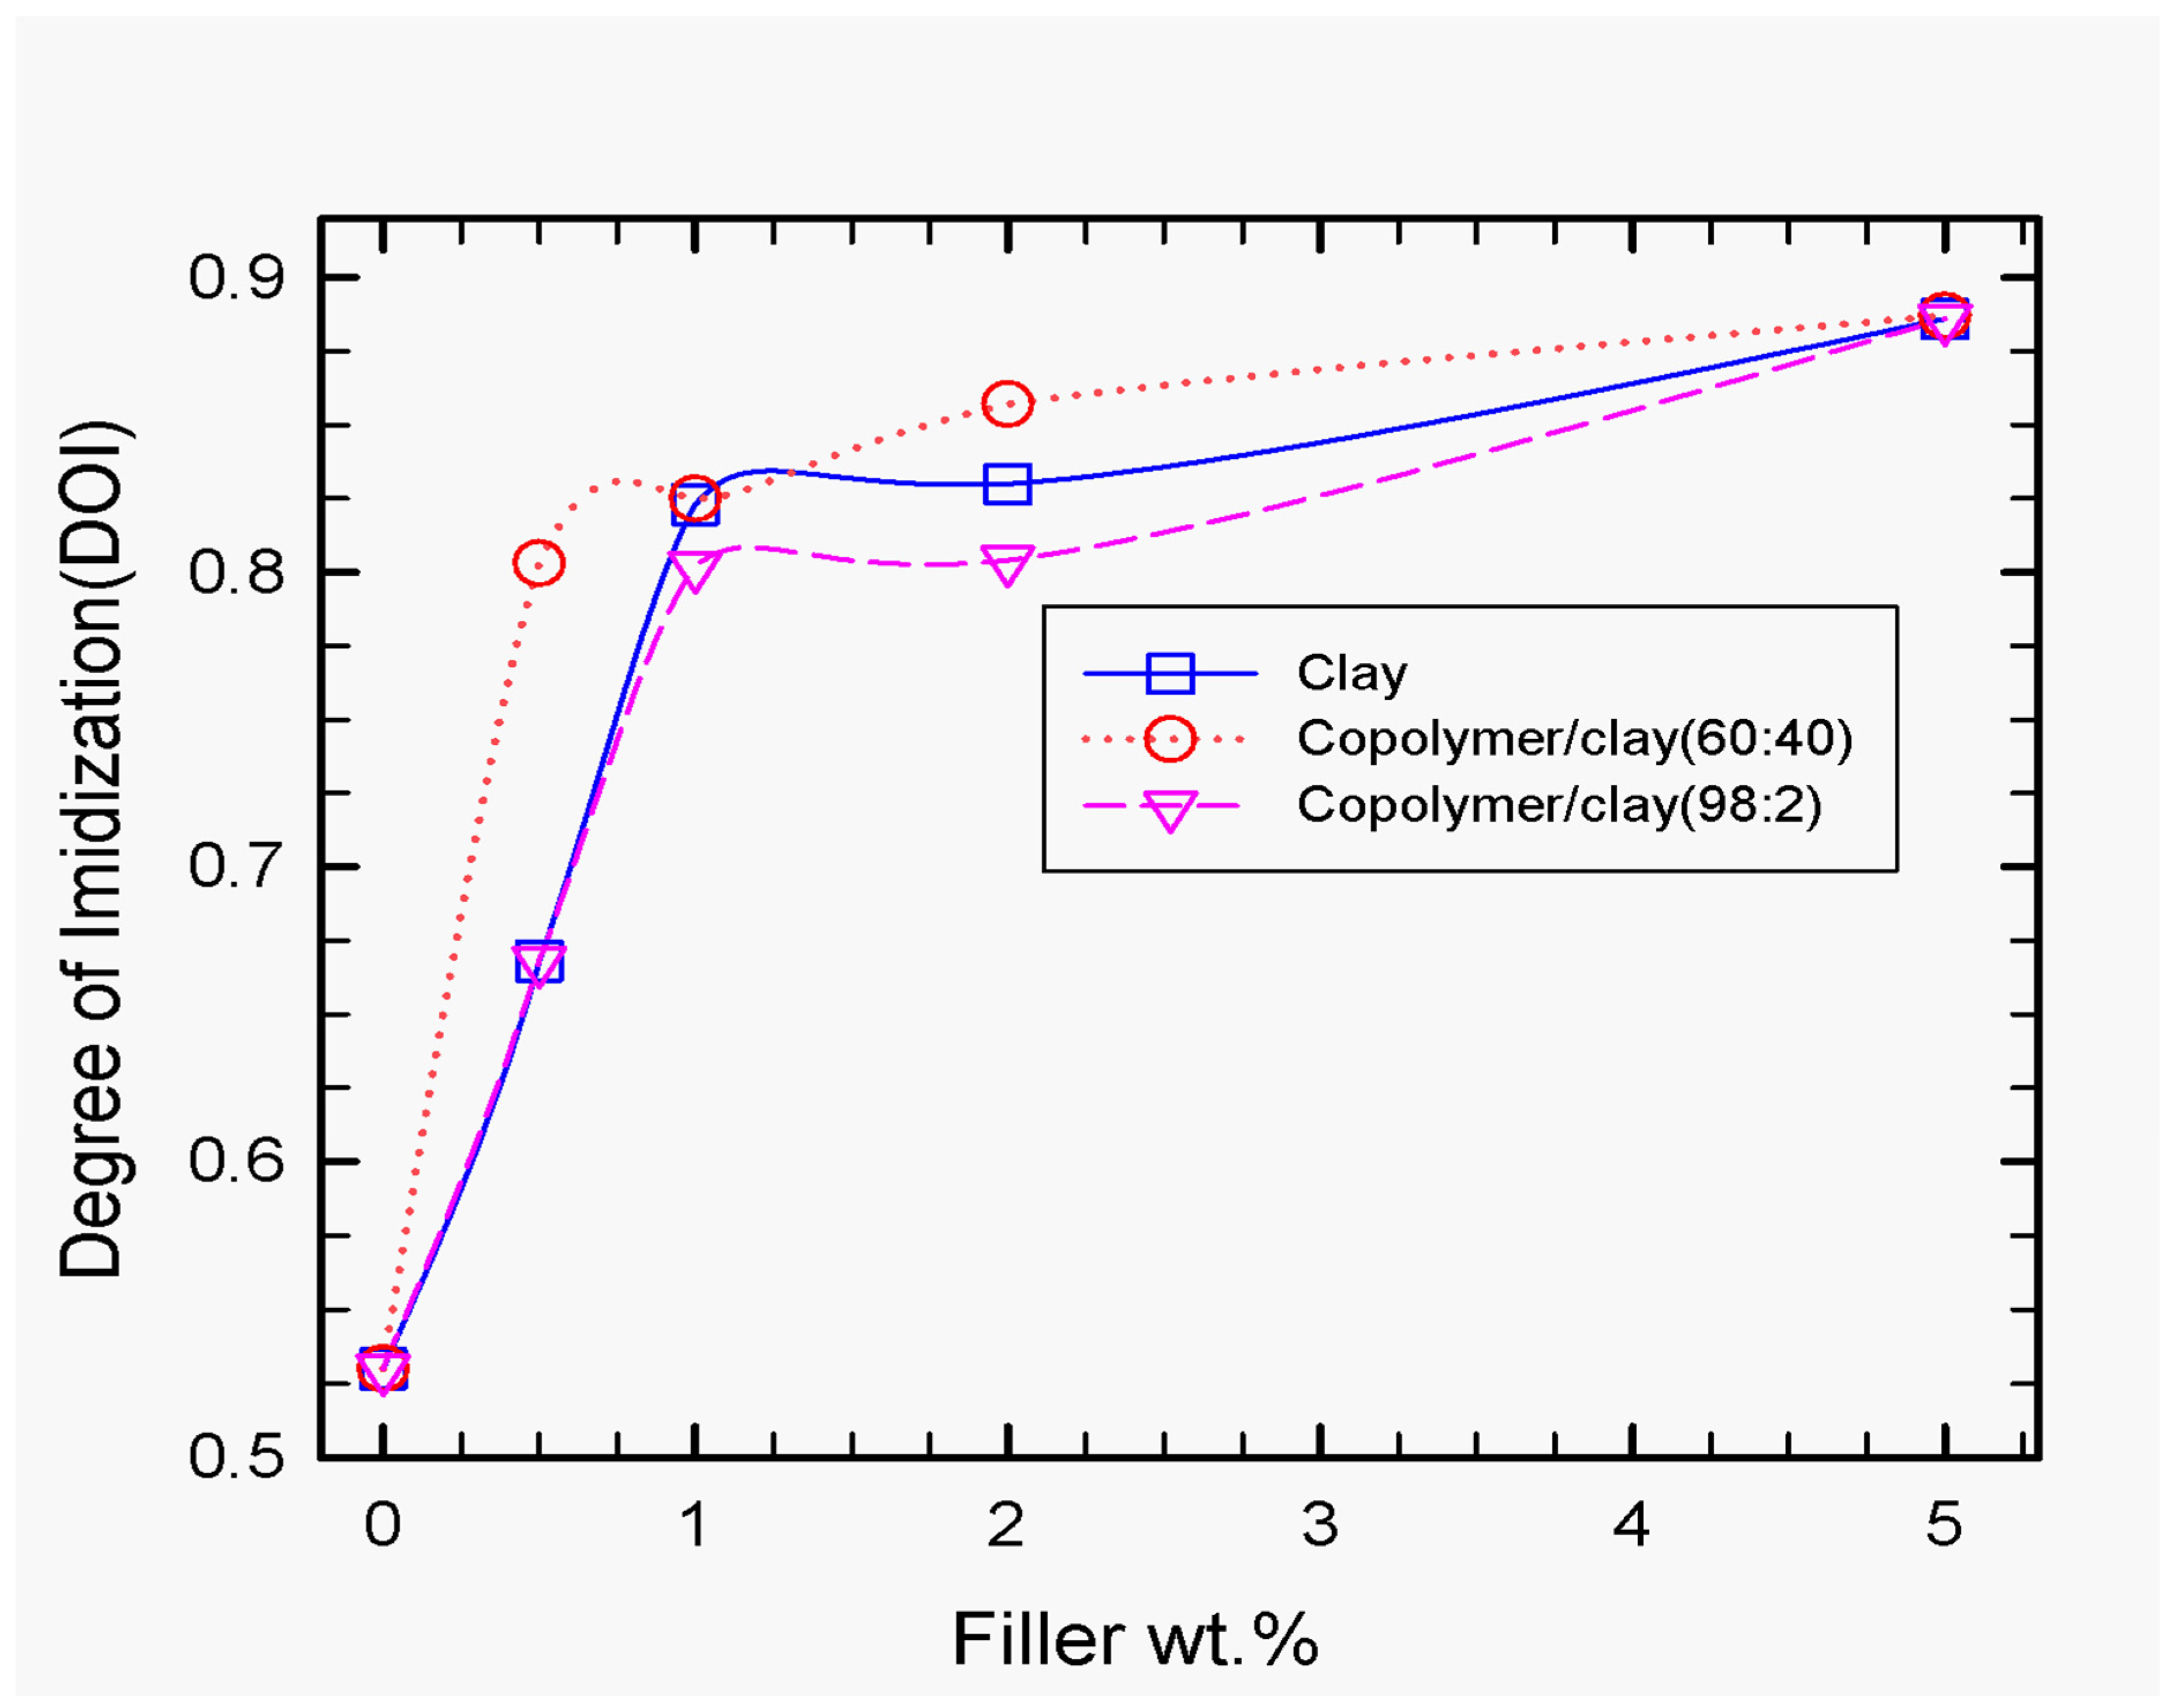
Figure 5 shows the variation of the degree of imidization (DOI) at 150
˚C with composition for neat PI and the polyimide nanocomposites membranes. The extent of imidization at 150˚C increased with increasing wt.% nanofiller. Imidization is a very important phenomenon in polyimide and polyimide-based composite processing because it directly affects the thermal and dimensional stability of the resultant material. The degree of Imidization (DOI) was calculated using the area of the imide peak at 1778 cm
-1 with respect to the area of the phenyl peak, 1500 cm
-1 as shown in eq. 1, where “A” denotes peak area and (A
1780/A
1500)
100% refers to the peak area ratio for 100% imidized polyimide.
The imidization process, which is temperature dependent, involves the formation of the cyclic imide ring followed by removal of water. One of the important aspects of imidization is the effect of curing temperature and clay weight fraction on the degree of imidization (DOI). Tyan et al. [
36] studied the effect of clay on the imidization process and they reported significant enhancement of imidization in the presence of organoclay. Tyan et al. [
36] suggested that the enhancement of imidization in the presence of clay is due to increased surface area and availability of active sites for cyclization and dehydration processes provided by clay. As shown in
Figure 5, the degree of imidization (DOI) is sensitive to concentration of clay and copolymer-modified clay. In the presence of clay, the degree of imidization (DOI), on average, increased from 53.5% at 0 wt. % to 88% at 5wt. % clay, which represents a 34.5 % improvement over the PI matrix. The degree of imidization for PI composites membranes containing copolymer/clay (60:40) [SPNEAC] is higher than of Clay/PI nanocomposites at all concentration of copolymer/clay. This significant improvement in DOI, which is due in-part to increased polarity and compatibility of the PI matrix and polyaniline copolymer, is attributed to favorable interaction between PI matrix, clay and the copolymer during imidization. The addition of the copolymer/clay (98:2) [SPNEAC2] to poly(amic acid) matrix has a similar effect on imidization as that of 30B clay especially at low concentration ( ≤ 1wt.%), however, at higher SPNEAC2 loading, the effect on imidization decreased slightly possibly due to the heterogenous nature of the nanocomposite.
3.1. Thermal transitions
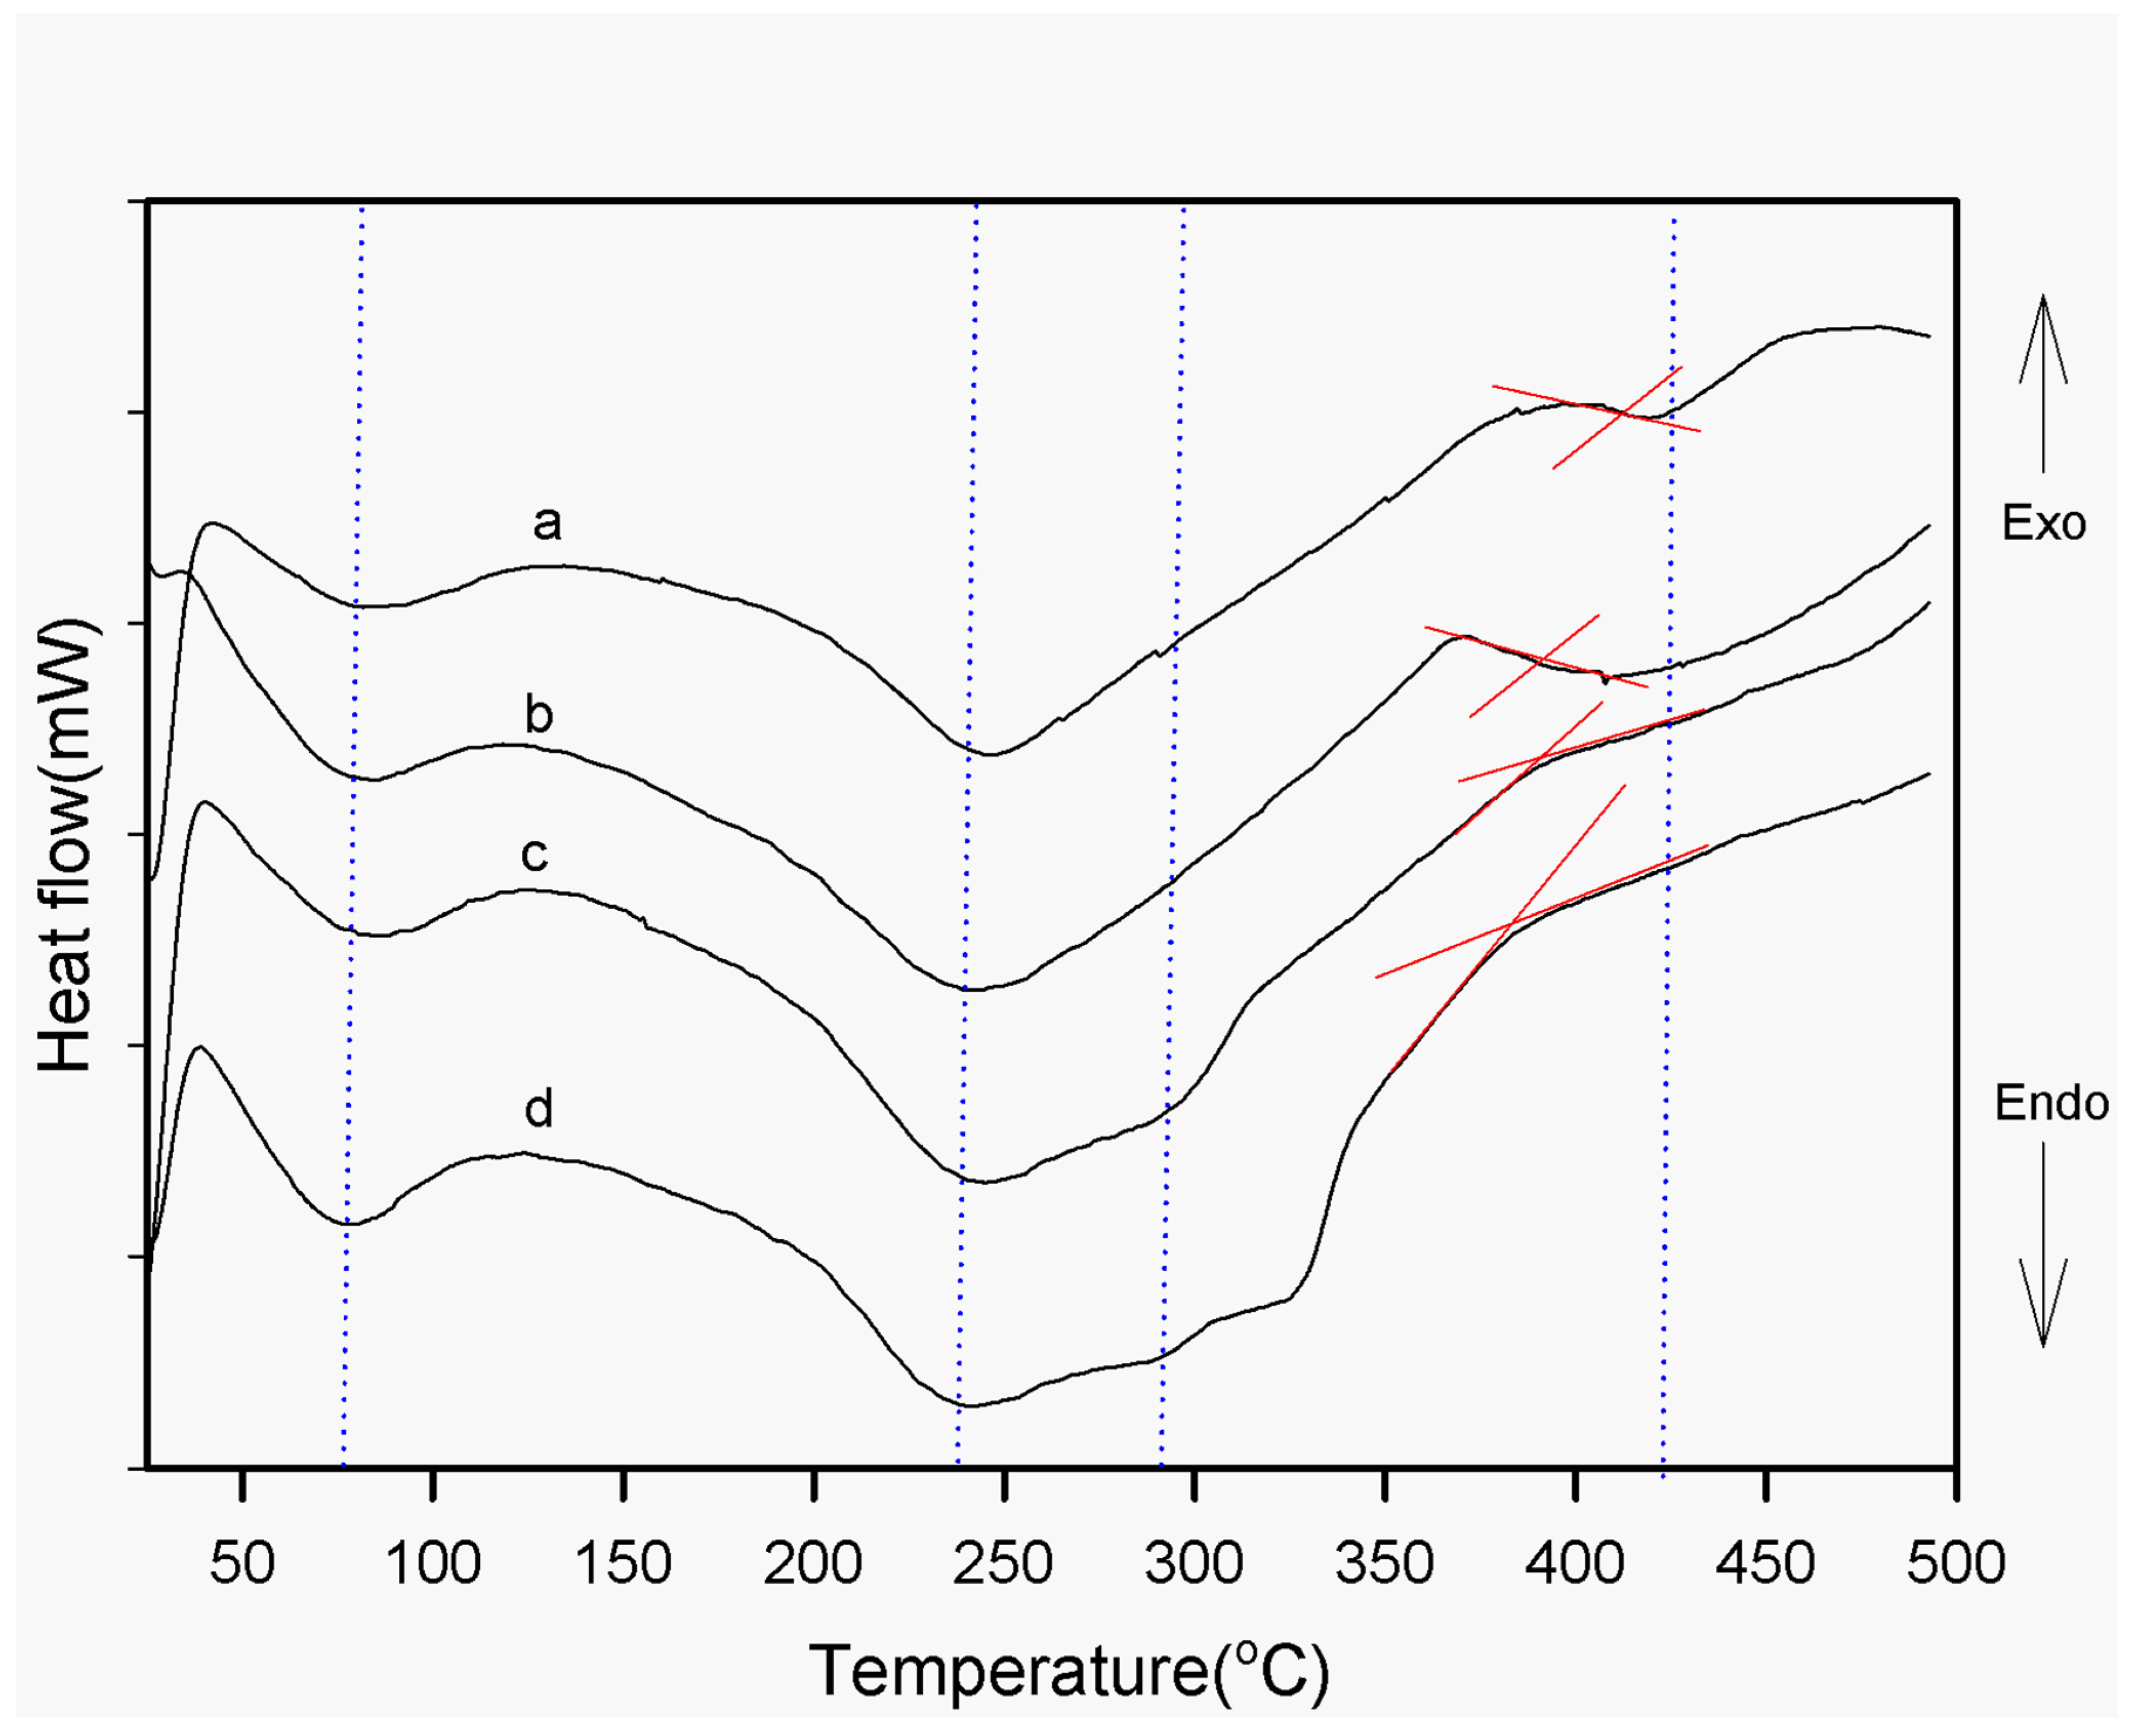
Figure 6 shows the second scan of the DSC thermograms of neat-PI and SPNEAC-PI nanocomposite, respectively. Values of the transition temperatures were obtained. Neat-PI shows endothermic peaks at ~ 80, 250 and ~415
˚C, respectively. The endotherms at 80, 250 and 415
˚C are associated with solvent removal, imidization and chain relaxation (glass transition) of polyimide, respectively. SPNEAC-PI also show endotherms in similar regions as neat-PI.
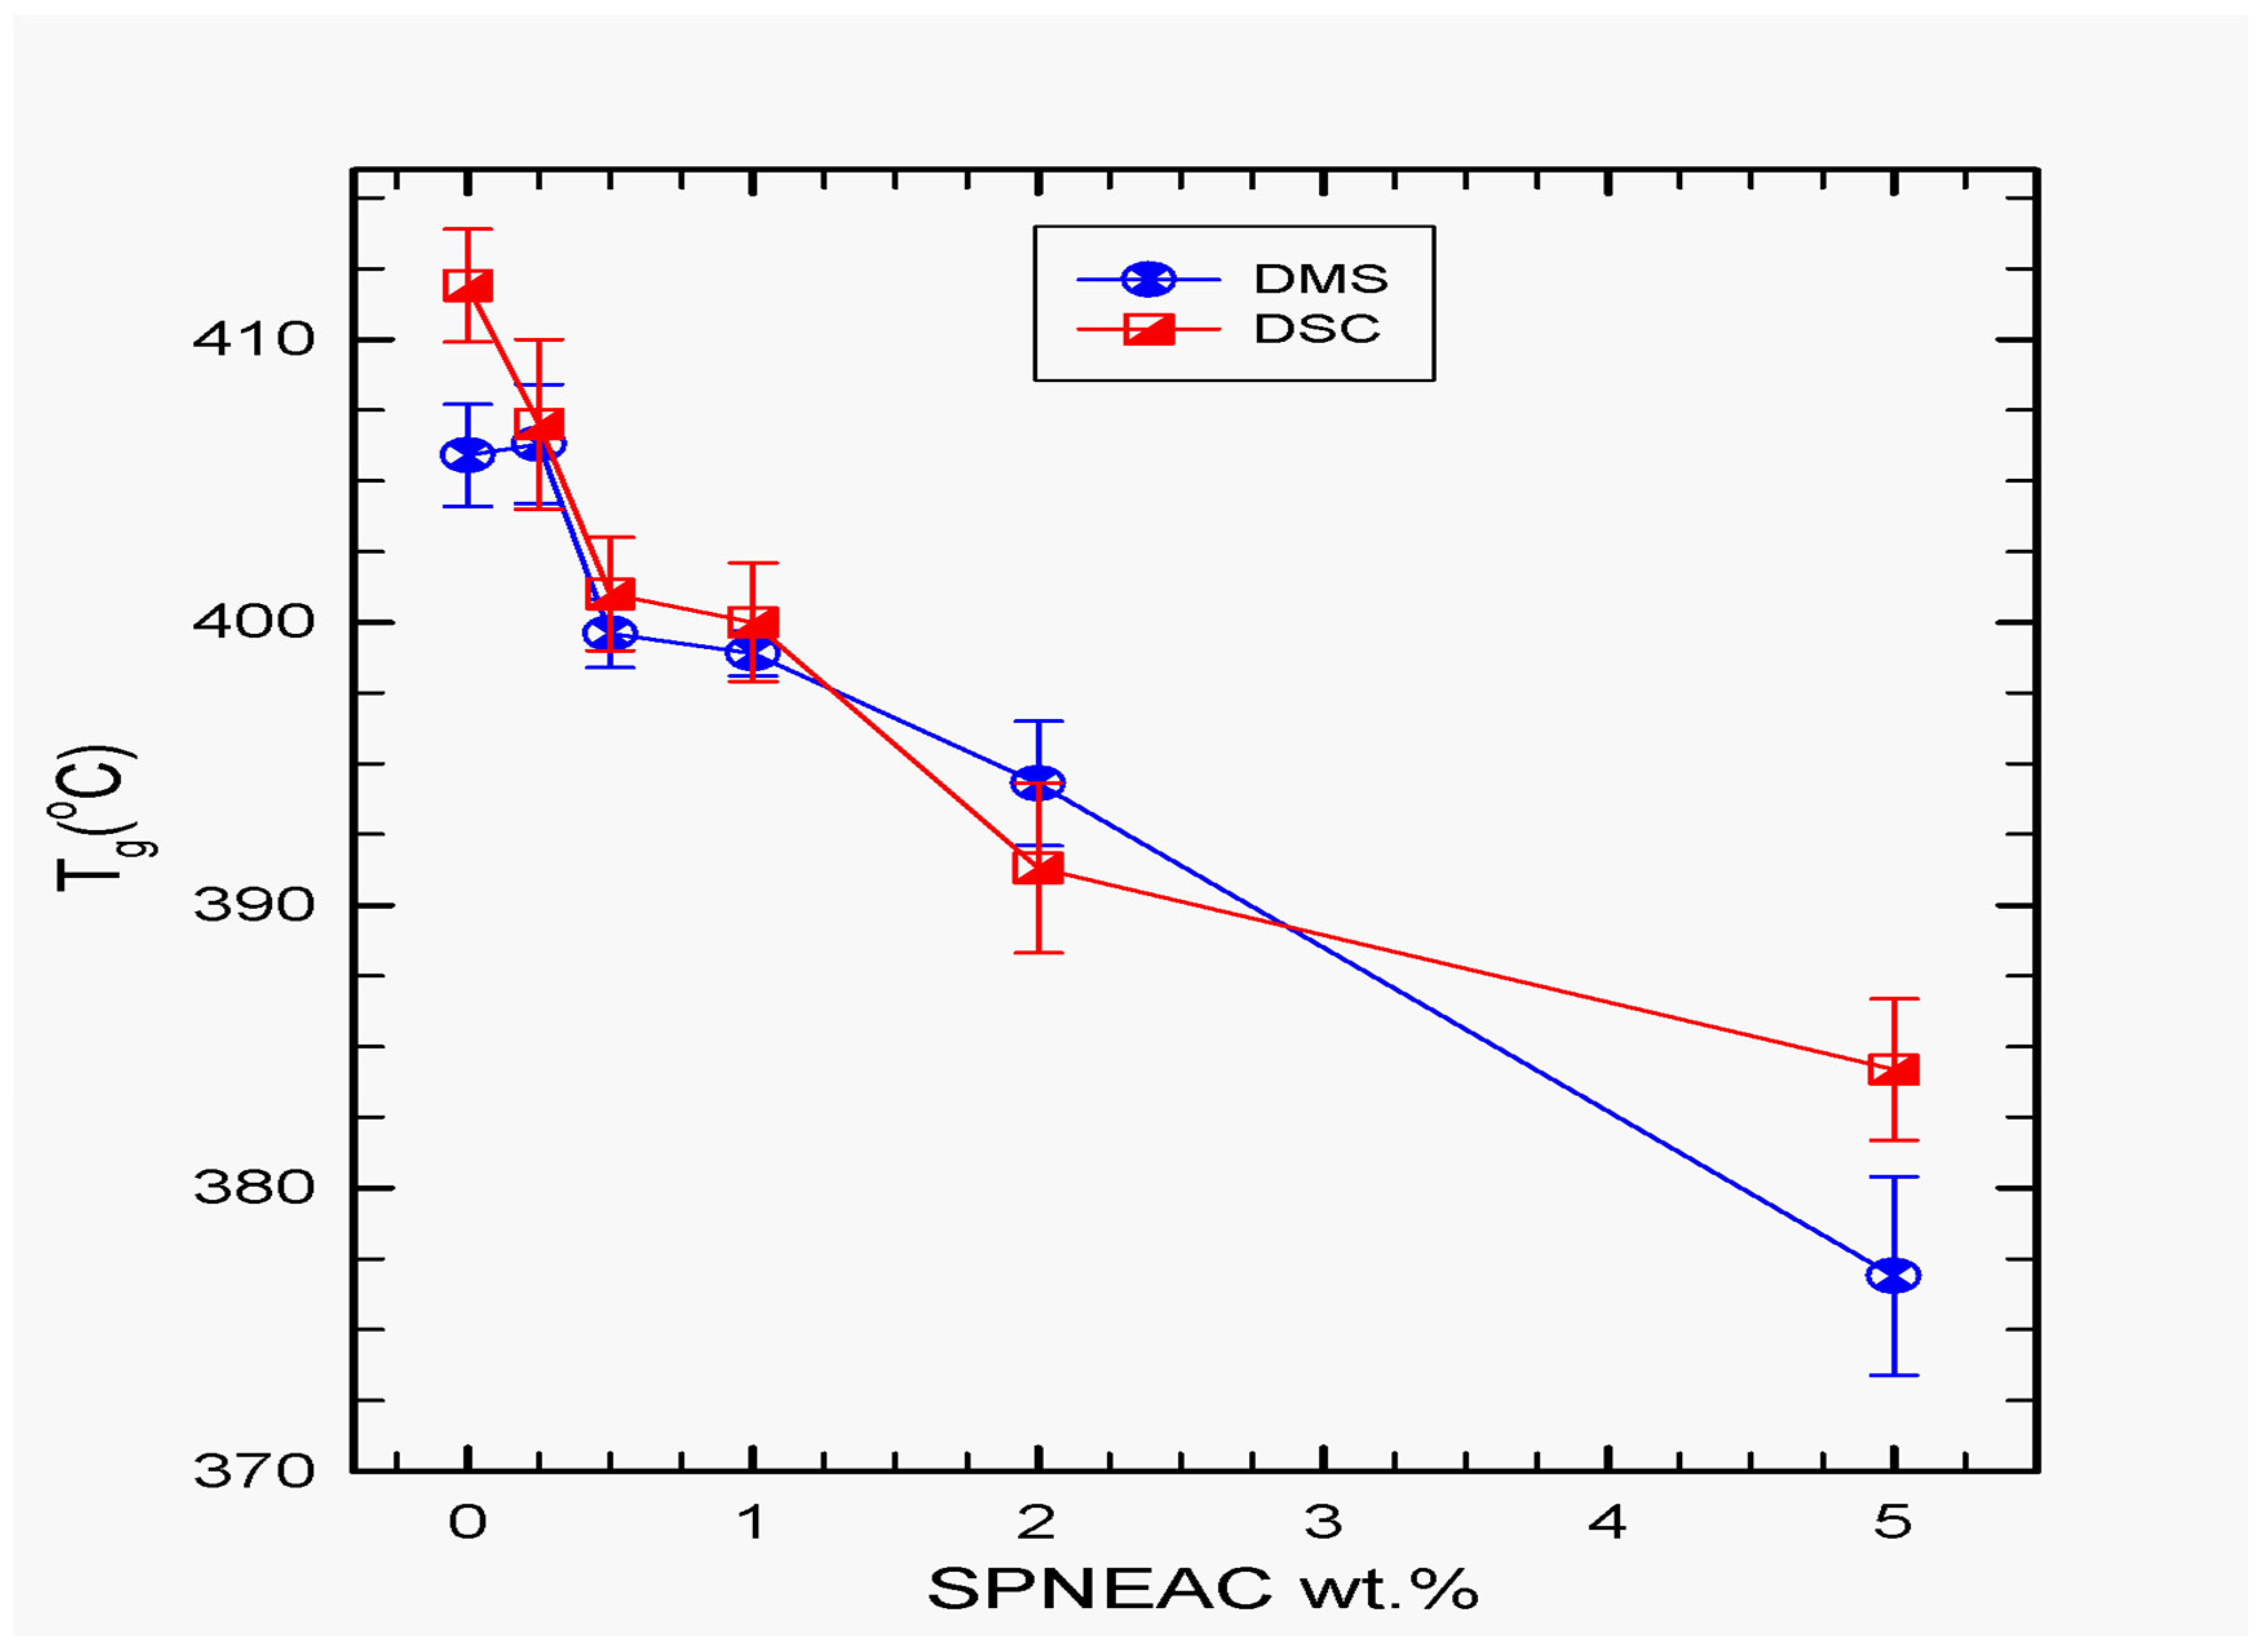
Glass transition often occurs as a step in the DSC thermogram but in this case, it is not so distinct, we therefore obtained the T
g from the change in slope in the glass-rubber transition region and plotted as a function of composition in
Figure 7. The T
g obtained using DSC is also compared to that obtained from the dynamic mechanic spectroscopy, DMS as shown in
Figure 7. There is a good agreement in the results obtained from both techniques at low filler loadings of 0.25-1.0 wt.% SPNEAC.
The glass transition temperature of SPNEAC-PI nanocomposites in general, decreased with increasing SPNEAC wt.%. DMS results shows that initially at low wt.% SPNEAC < 0.5 wt.%, a slight increase in Tg is obtained over that for neat PI. However, at higher wt.% SPNEAC, ≥ 0.5%, the Tg of the SPNEAC-PI nanocomposites show a decreasing trend. Comparison of the Tg obtained by DSC and DMS shows similar trend of decreasing Tg with increasing SPNEAC wt.%. Better agreement is shown between 0.2 and 0.5 wt.% SPNEAC. Greater disparity in the Tg for neat PI and SPNEAC-PI occurred at filler loadings > 1wt.%.
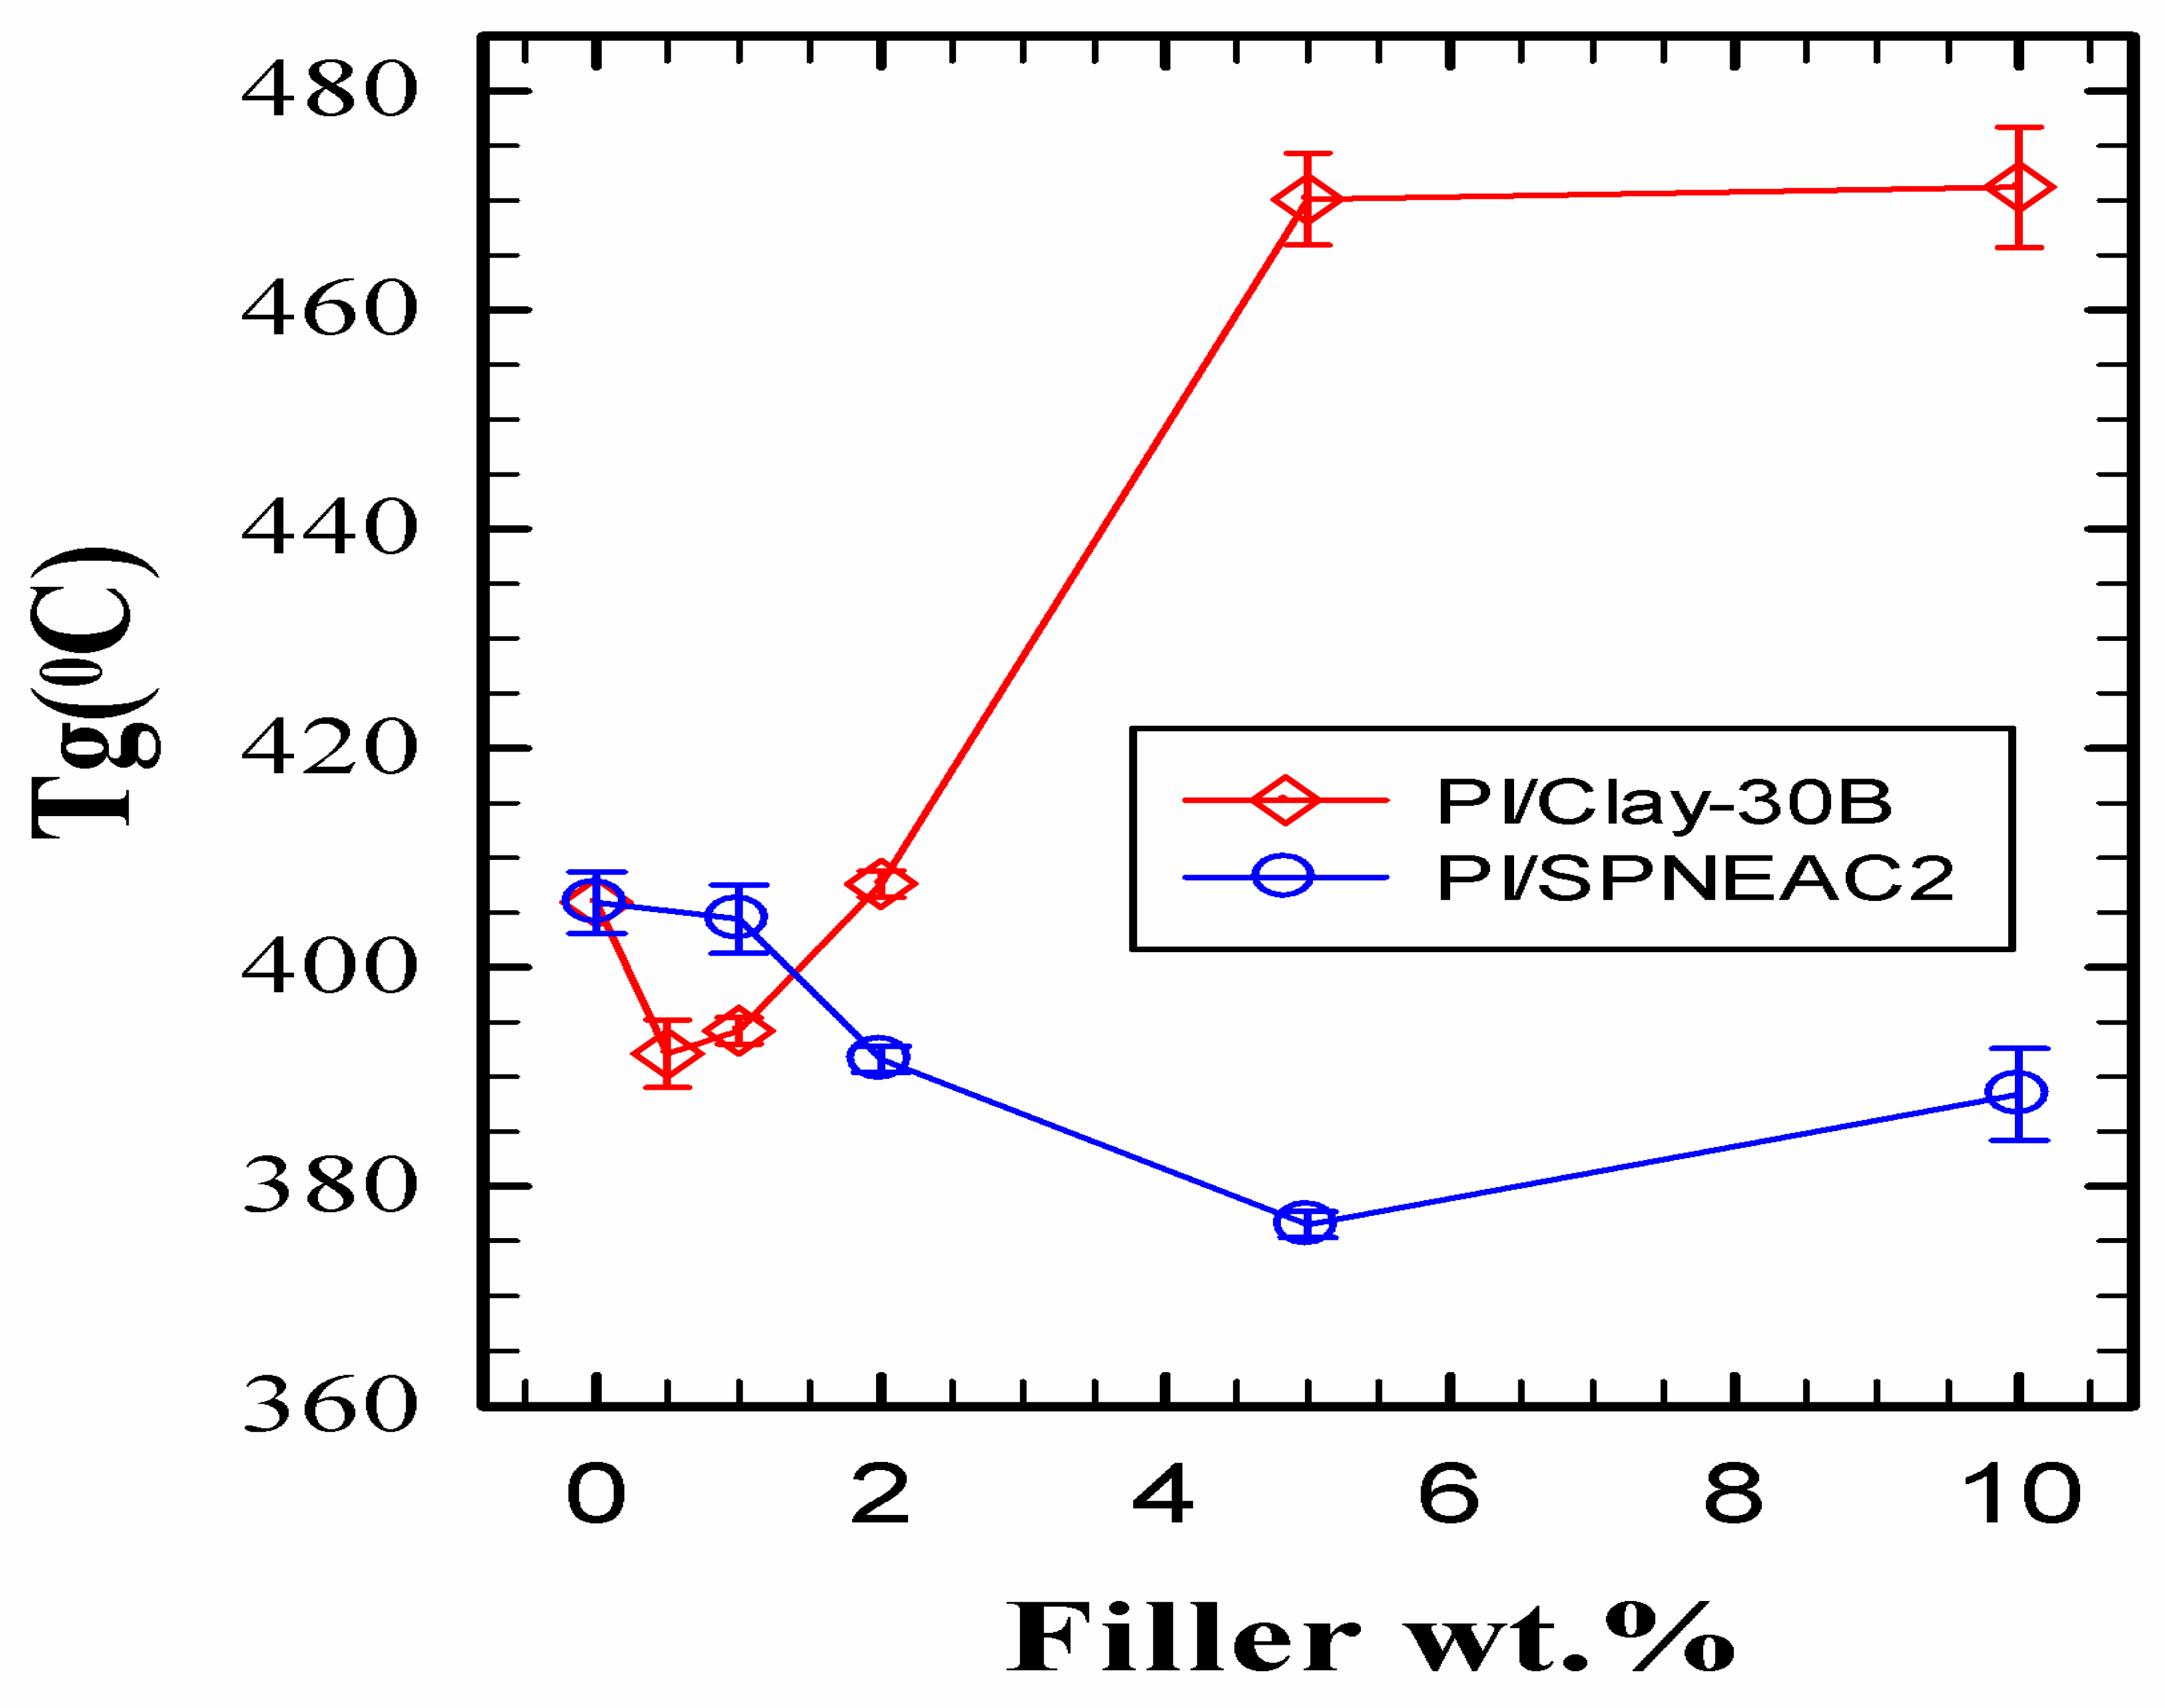
Figure 8 shows a comparison of the variation of T
g for clay-30B/PI and SPNEAC2-PI with composition. It shows two distinct regimes of behavior of the nanocomposites. At low wt.% of nanofillers <1wt.% Clay-PI shows lower T
g than the neat PI, while SPNEAC2-PI show slightly higher or similar T
g as the neat PI. At higher wt.% nanofillers, ≥ 5 wt.%, clay 30B-PI nanocomposites show a remarkably higher T
g of up to 460˚C. The SPNEAC2-PI nanocomposites, however, show slightly decreasing T
g at higher nanofiller loading ≥1 wt.%. The differences in the chain relaxation behavior of these nanocomposites can be traced to the chemical structure and morphological differences between the two systems.
3.5. Dynamic mechanical analysis
3.5.1. Storage Modulus
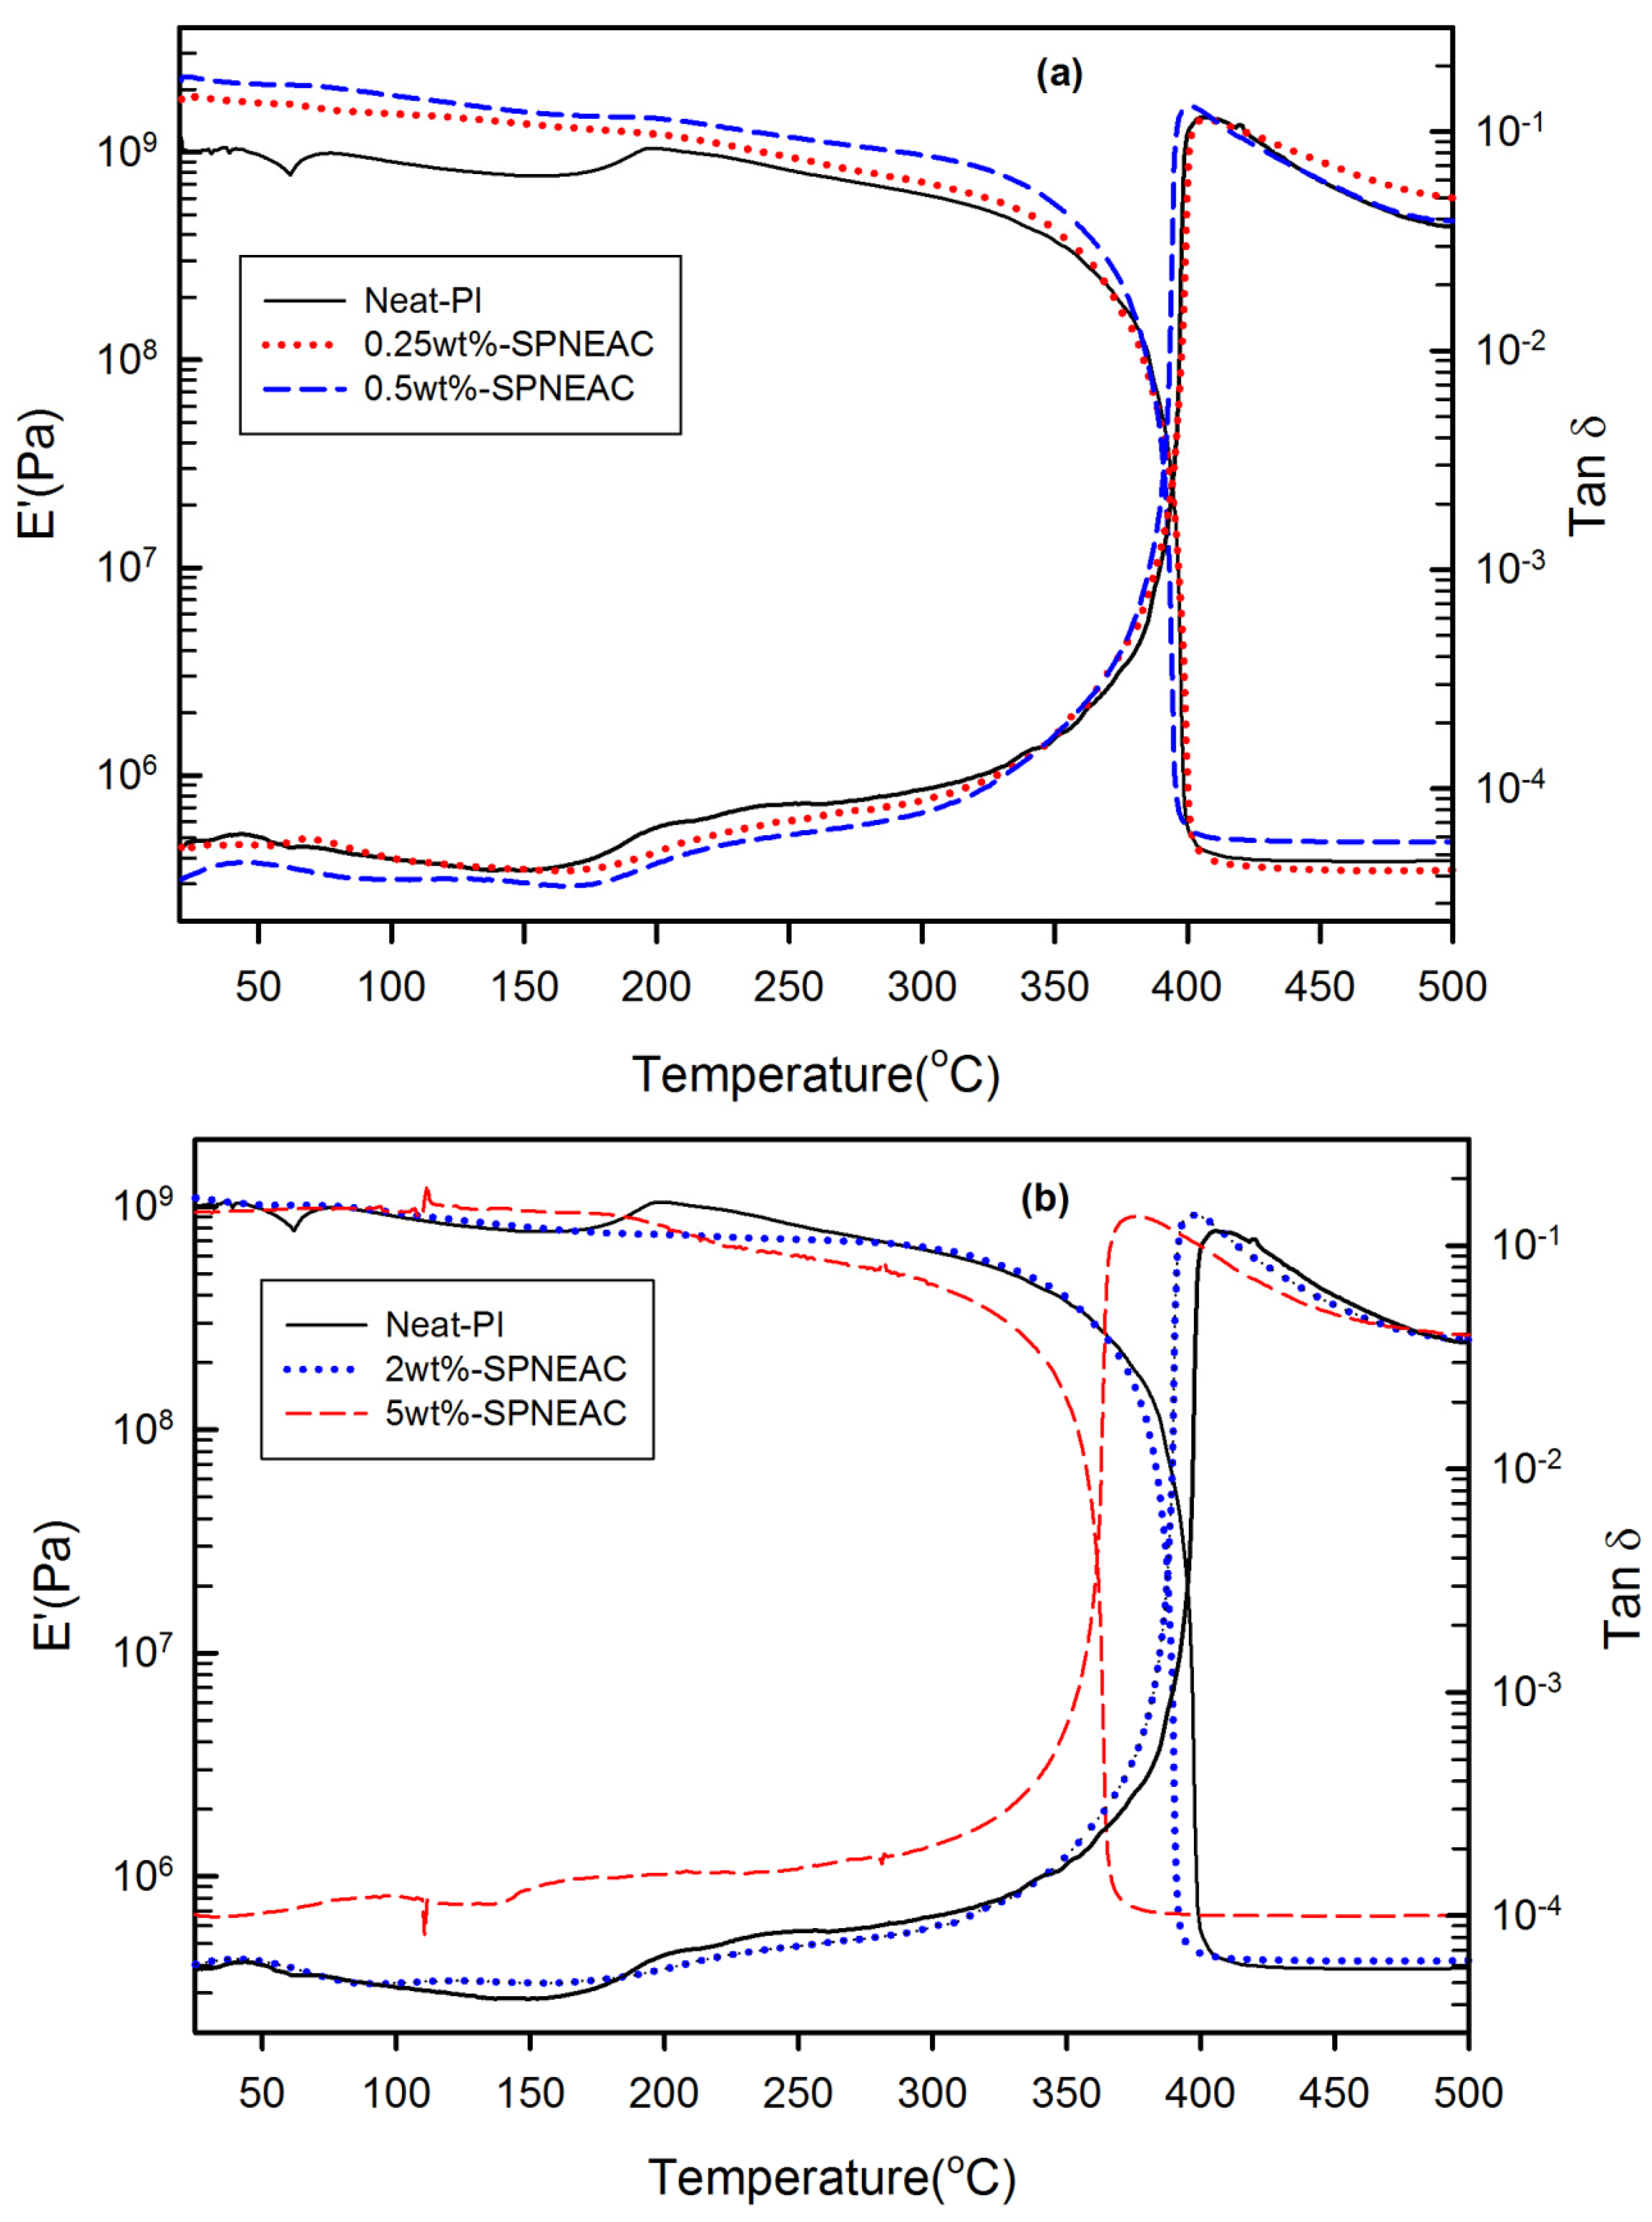
The storage modulus for SPNEAC-PI nanocomposites was plotted between 25
˚C and 400
˚C as shown in
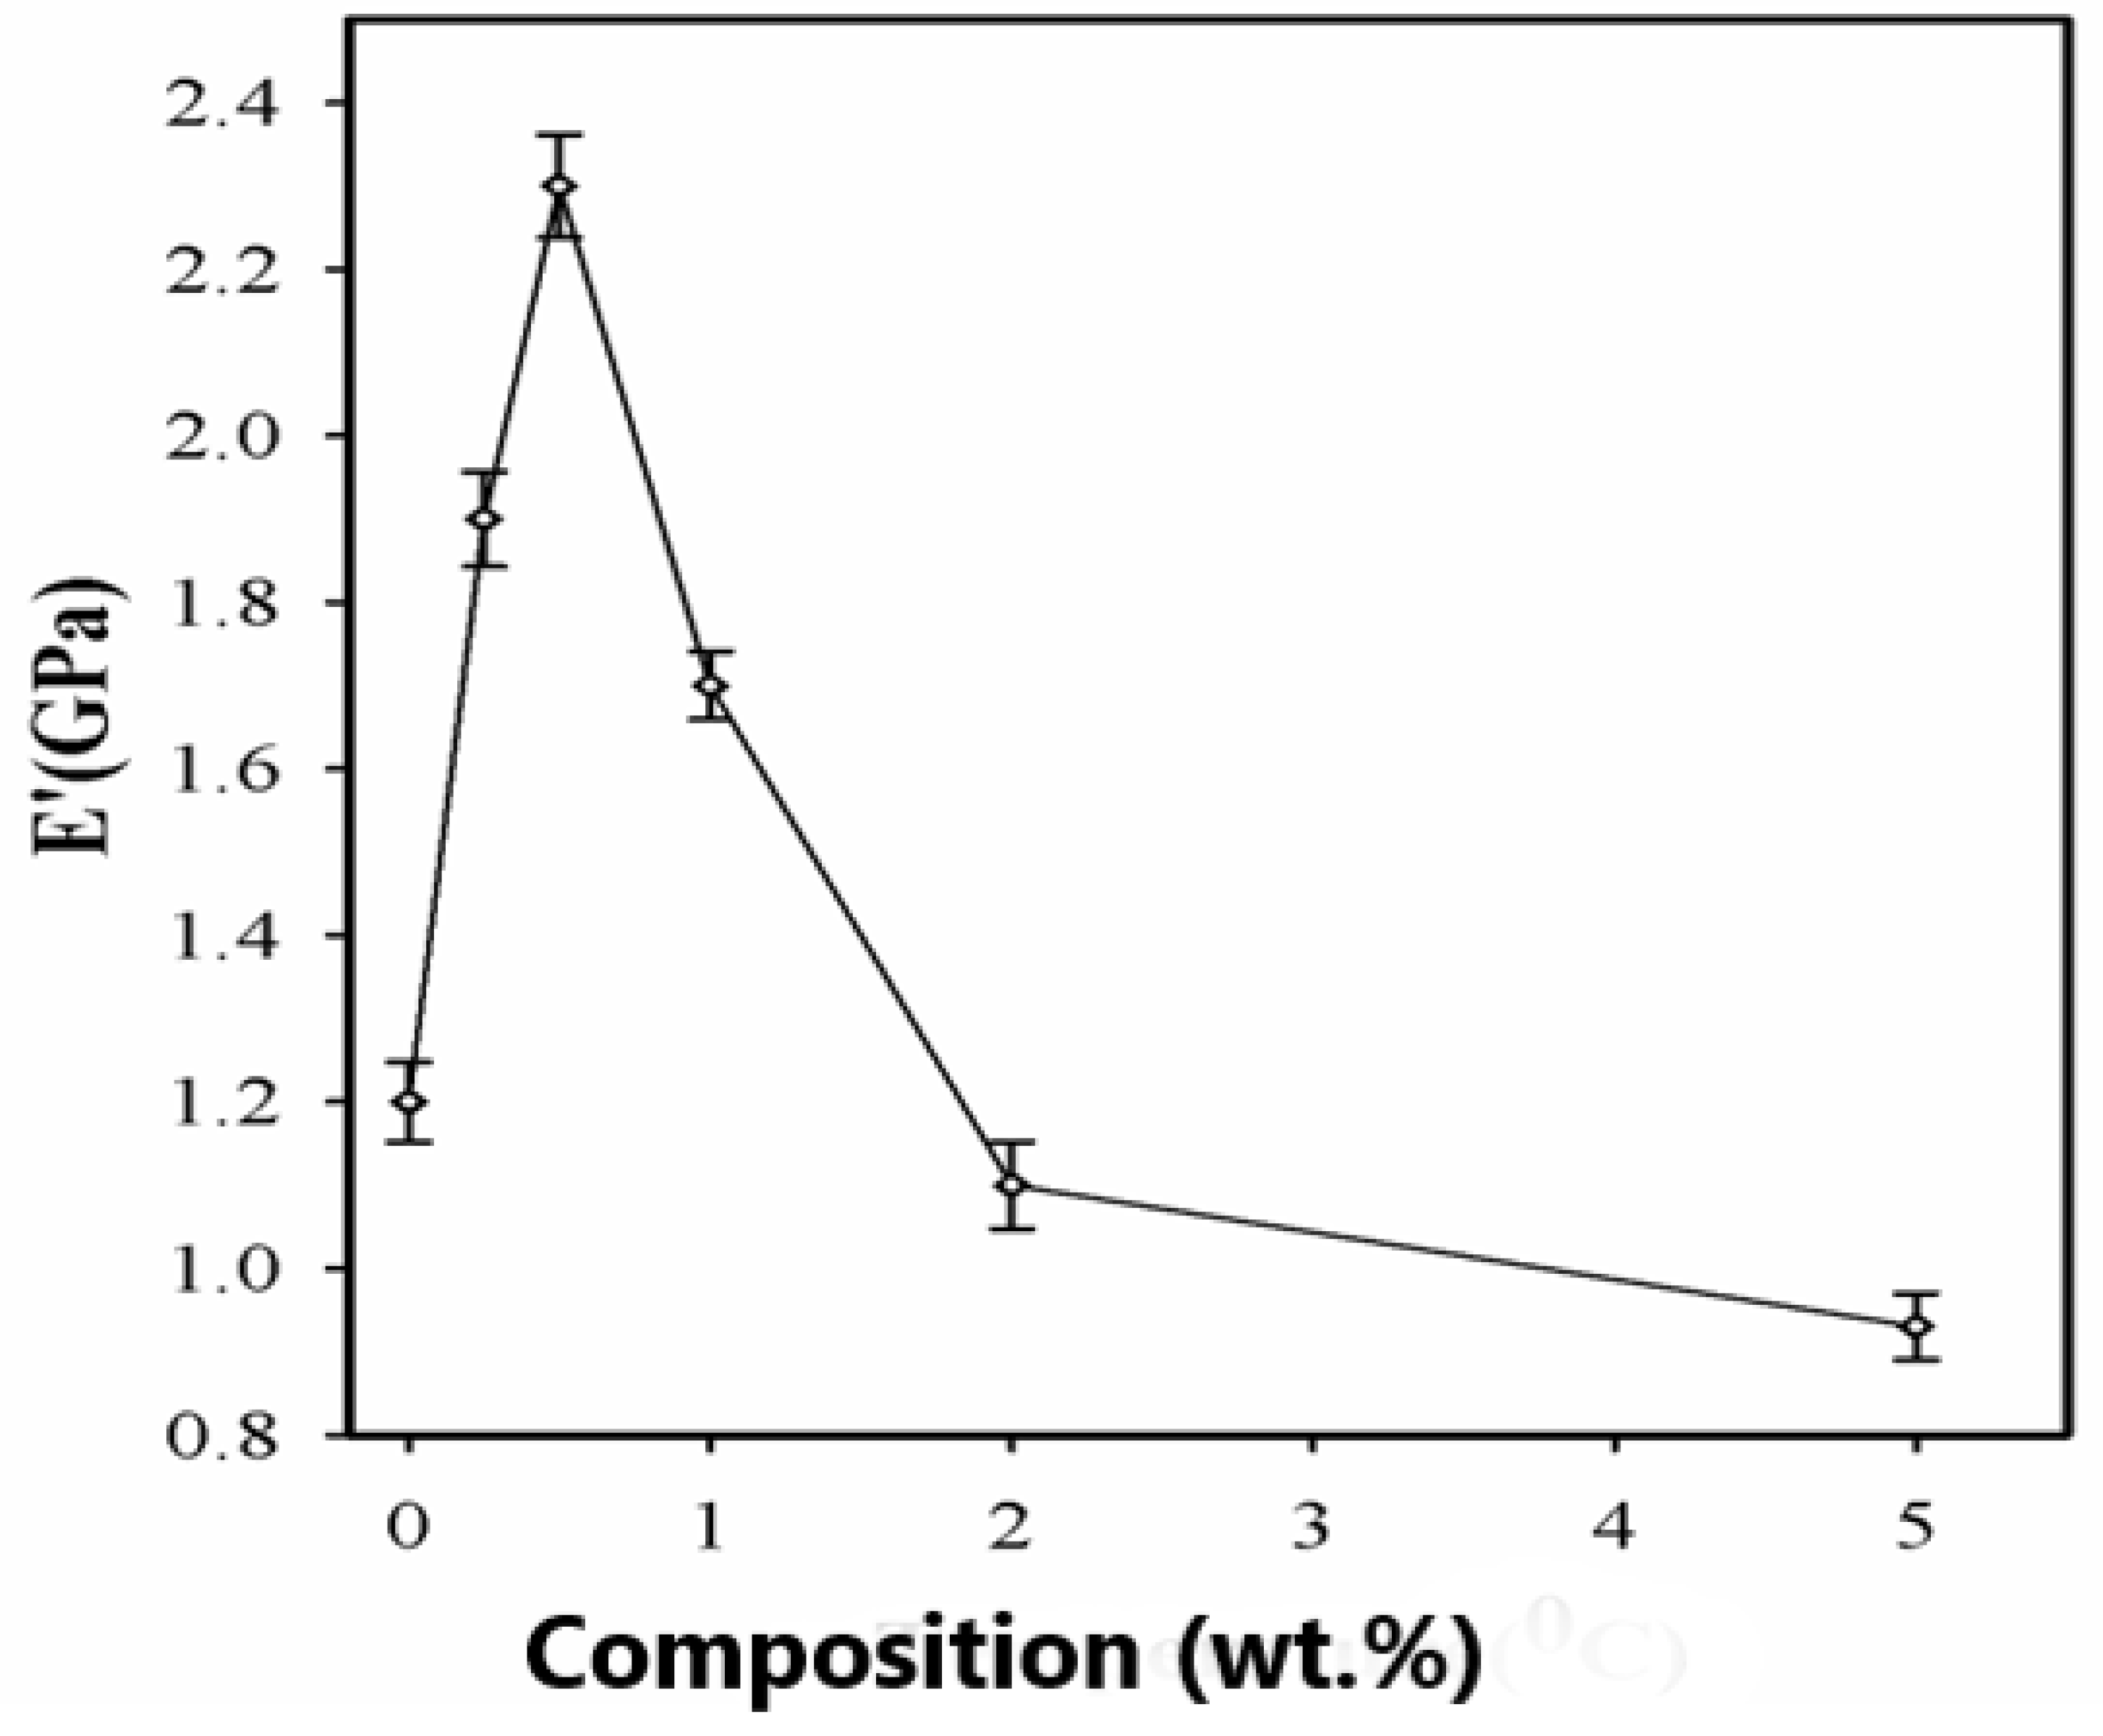
Figure 9. The plot of Storage modulus versus SPNEAC loading (Figs. 9 and 10) show slightly increased modulus with respect to SPNEAC loading between 0.25 and 0.5 wt.% where a maximum modulus of 2.3 ± 0.025 GPa was obtained. The lowest modulus of the SPNEAC-PI films was 0.93± 0.020 GPa for 5 wt.% SPNEAC. In the rubbery plateau region, there is a sharp decrease in modulus and this is often associated with the increased chain flexibility and rubber elasticity. However, the rubbery plateau modulus for SPNEAC-PI nanocomposites containing 5 wt.% SPNEAC is significantly higher that that for the neat PI.
Figure 10 chows the variation of the glassy region storage modulus with SPNEAC-PI composition. At low wt.% SPNEAC between 0.25 and 0.5 wt.%, the nanocomposites show slightly higher storage modulus of 1.8 and 2.3 GPa, respectively, which is slightly higher that the value of 1.2 GPa obtained for the neat PI. Increasing the SPNEAC loading to 5 wt.%, resulted to slightly decreased glassy region storage and increased rubbery plateau modulus. The reported increase in the rubbery plateau modulus for SPNEAC-PI containing ≥5 wt.% is due to the presence of physical crosslinks and entangled chains.
3.5.2. Comparison of the dynamic mechanical properties of clay-30B-PI and SPNEAC2-PI nanocomposites
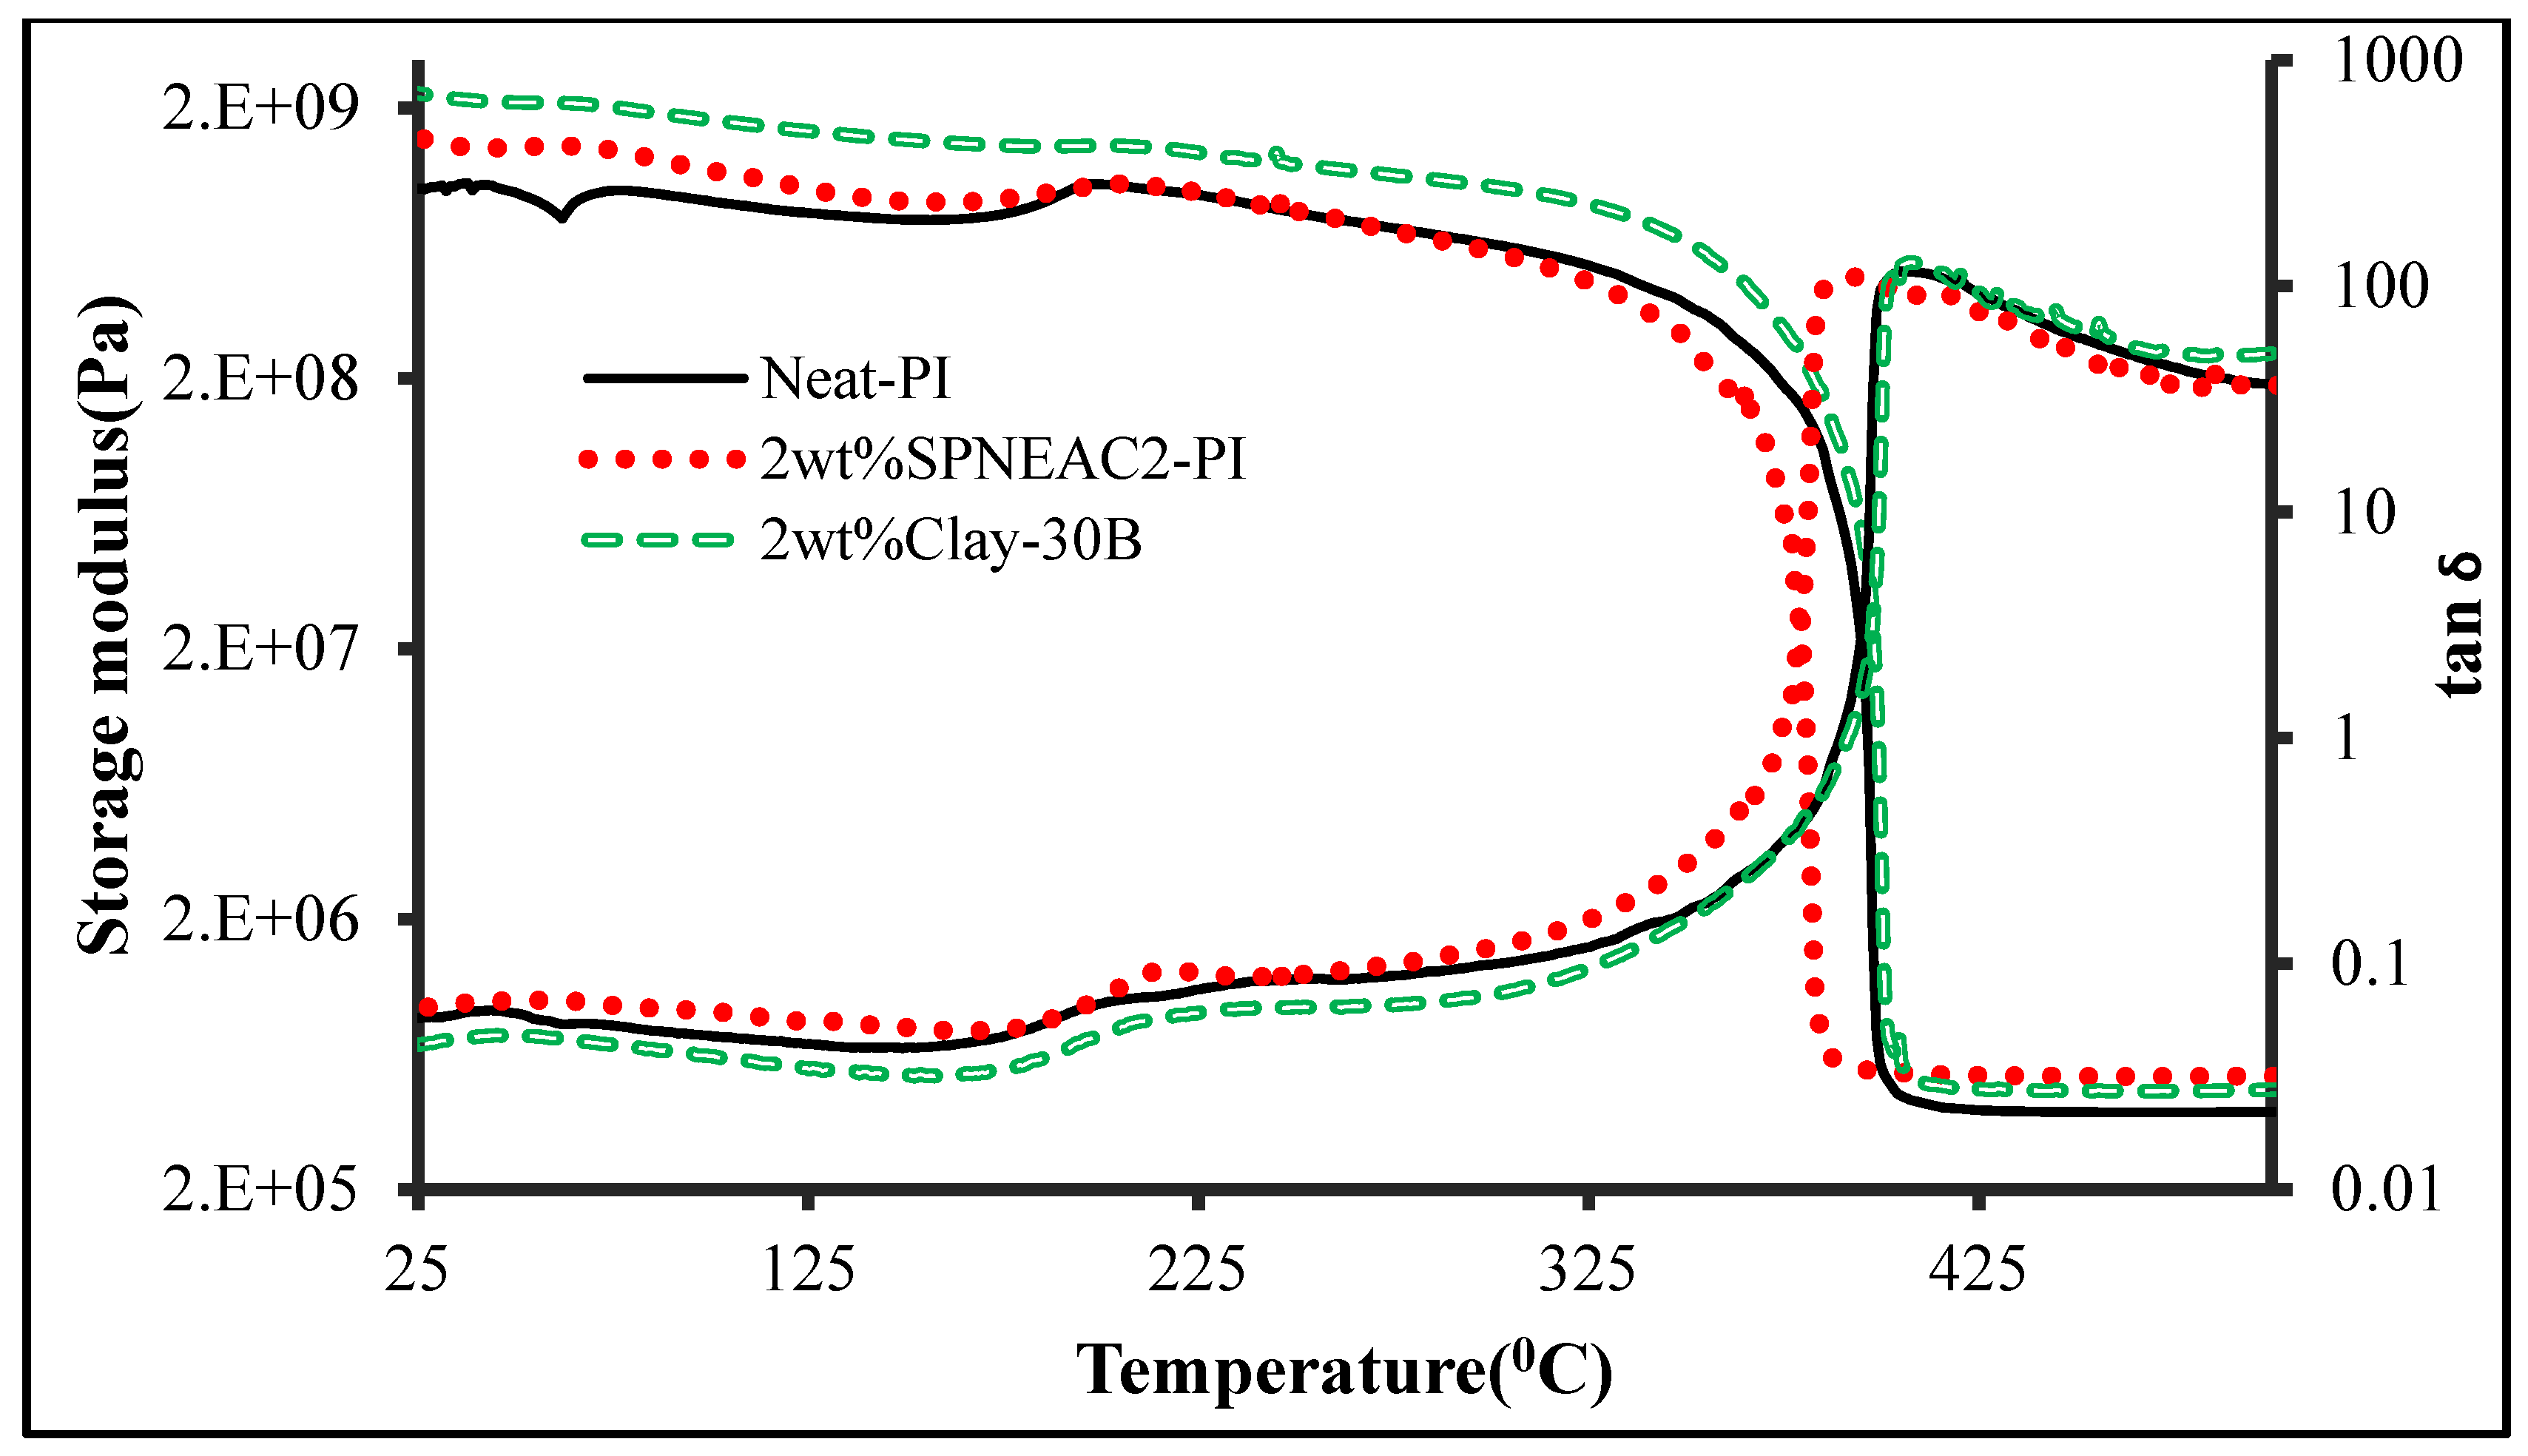
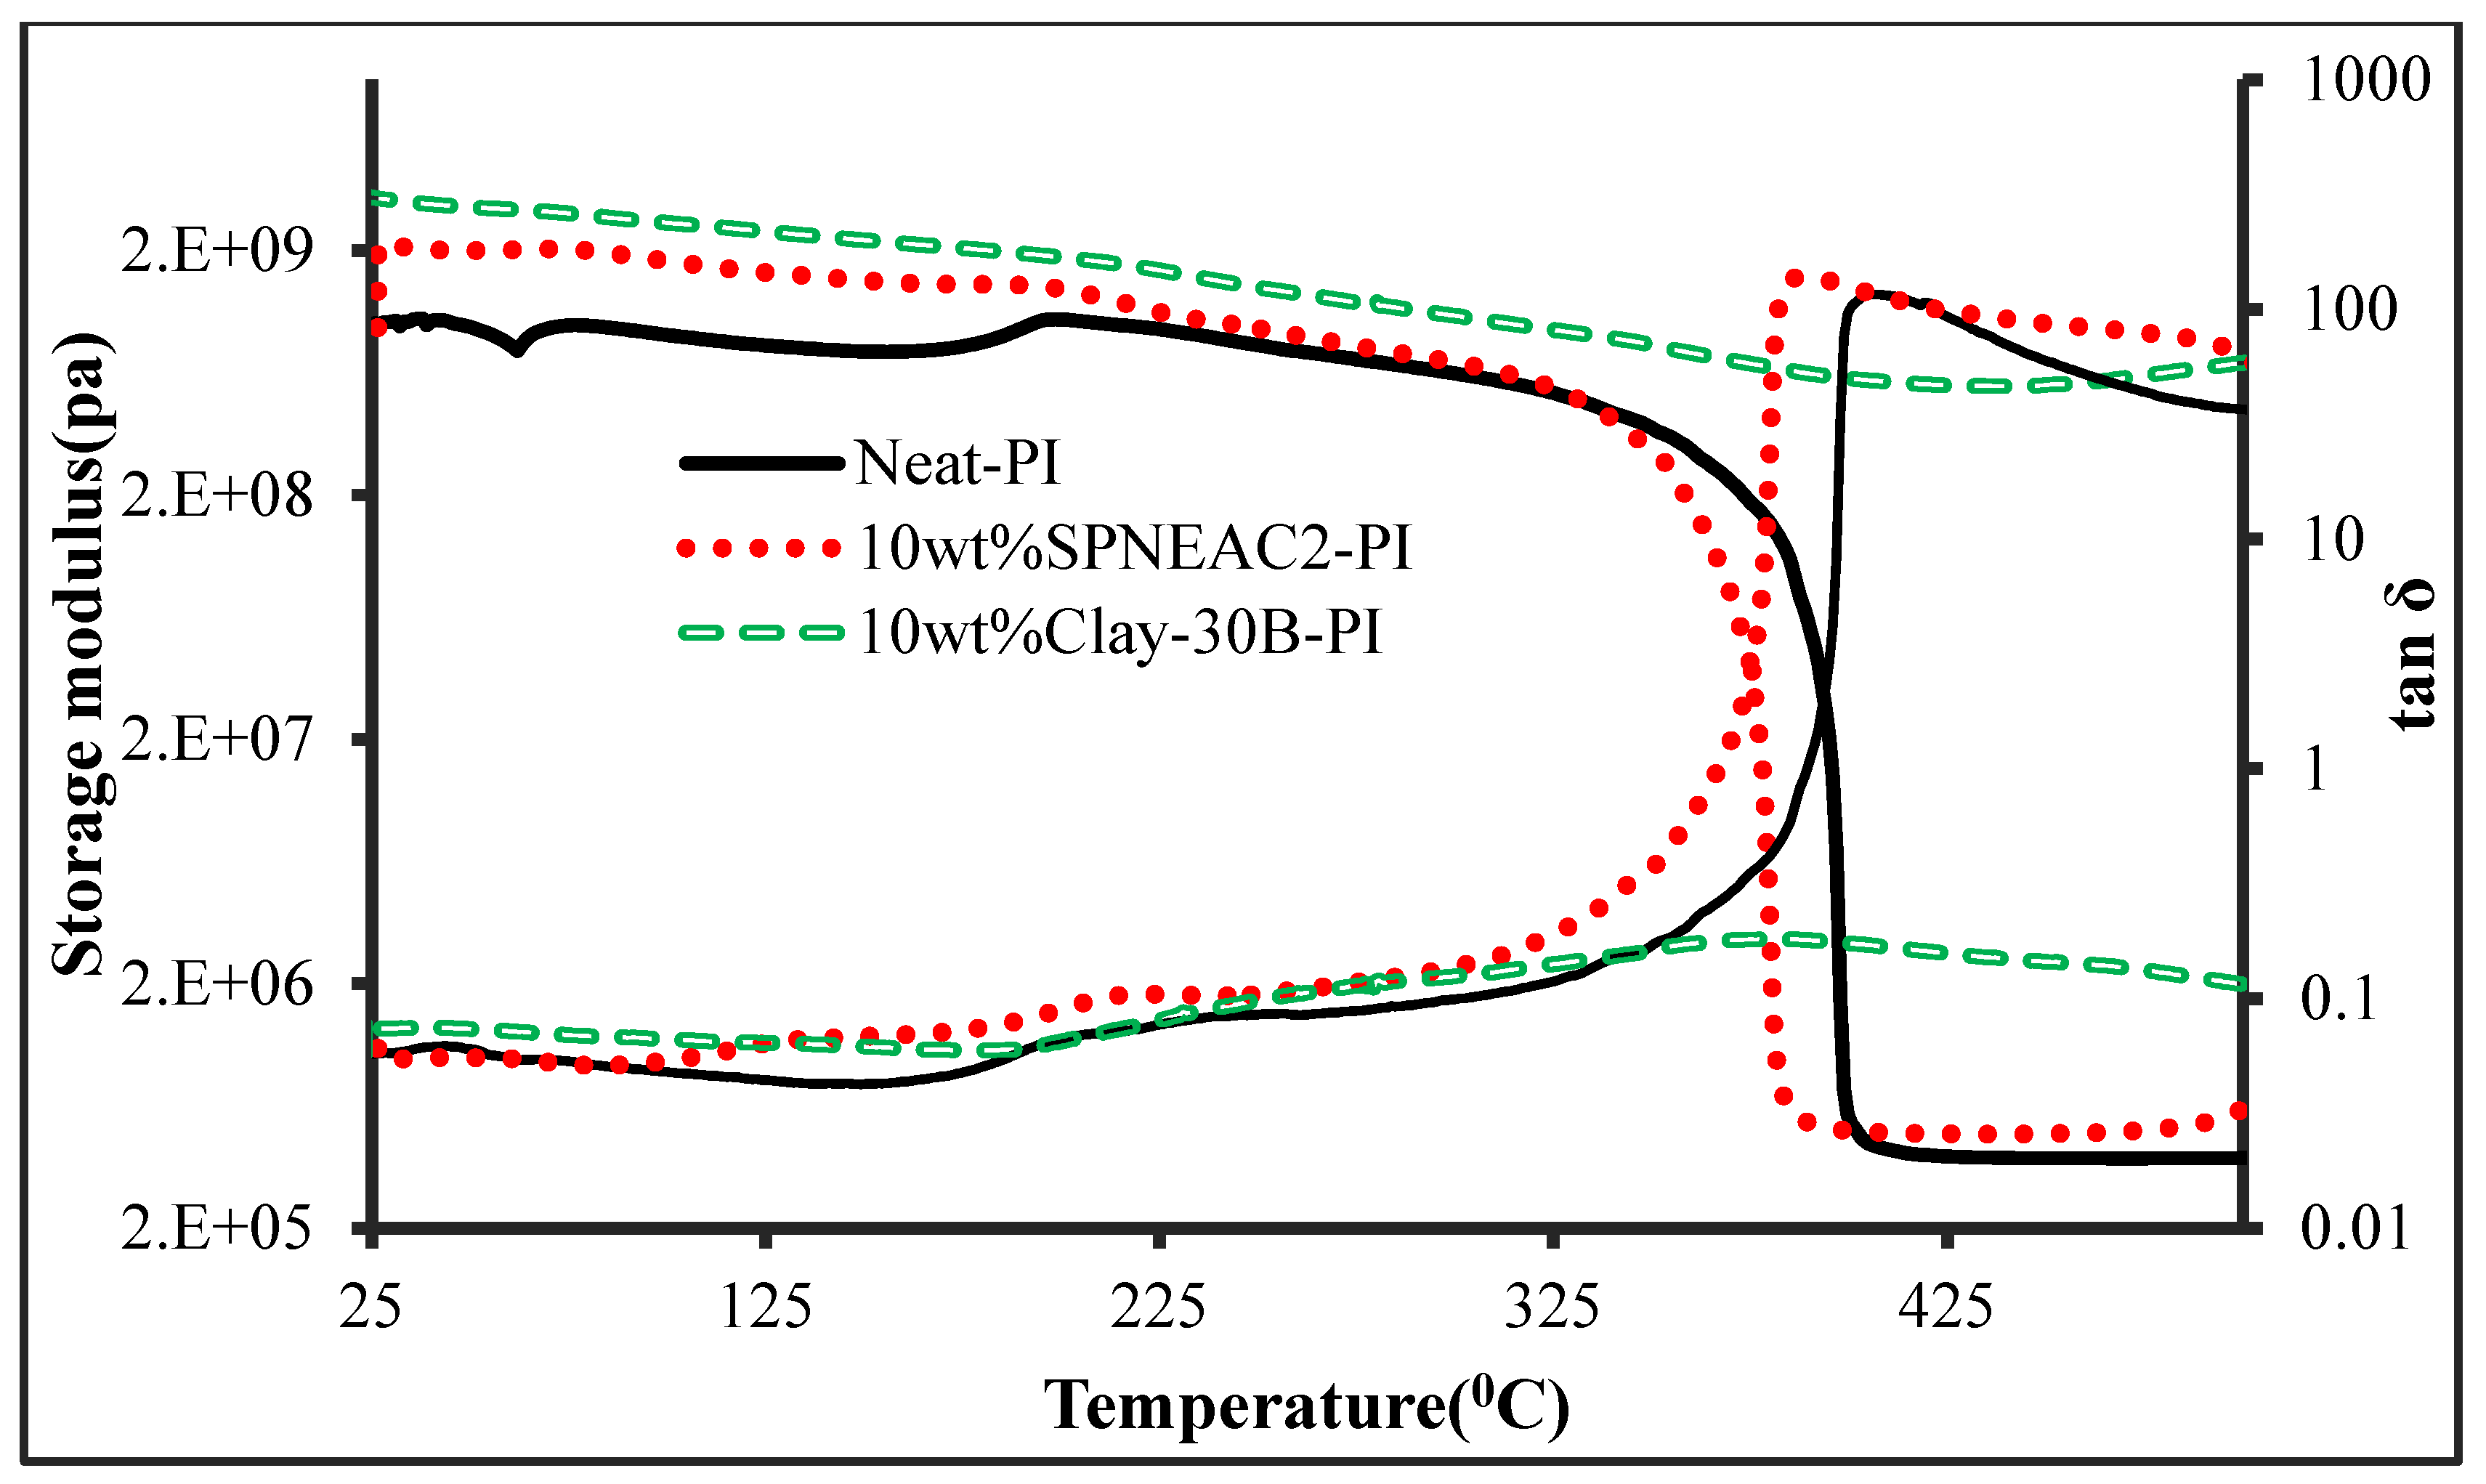
The temperature corresponding to α-transition peak (Figs. 9, 11) is the glass-transition temperature. The glass transition temperature (Figs. 9 and 11), generally decreases with increasing SPNEAC weight fraction. The decrease in T
g at higher SPNEAC loading could point to increased free-volume and chain flexibility. However, at lower SPNEAC and SPNEAC2 concentrations of 0.25 and 0.5 wt.%, a slight increase in the T
g of the nanocomposite over that for the neat PI was observed. It is also noteworthy that the damping ability of the nanocomposite containing 0.25 and 0.5 wt.% SPNEAC and SPNEAC2 are slightly higher than that for the neat PI.
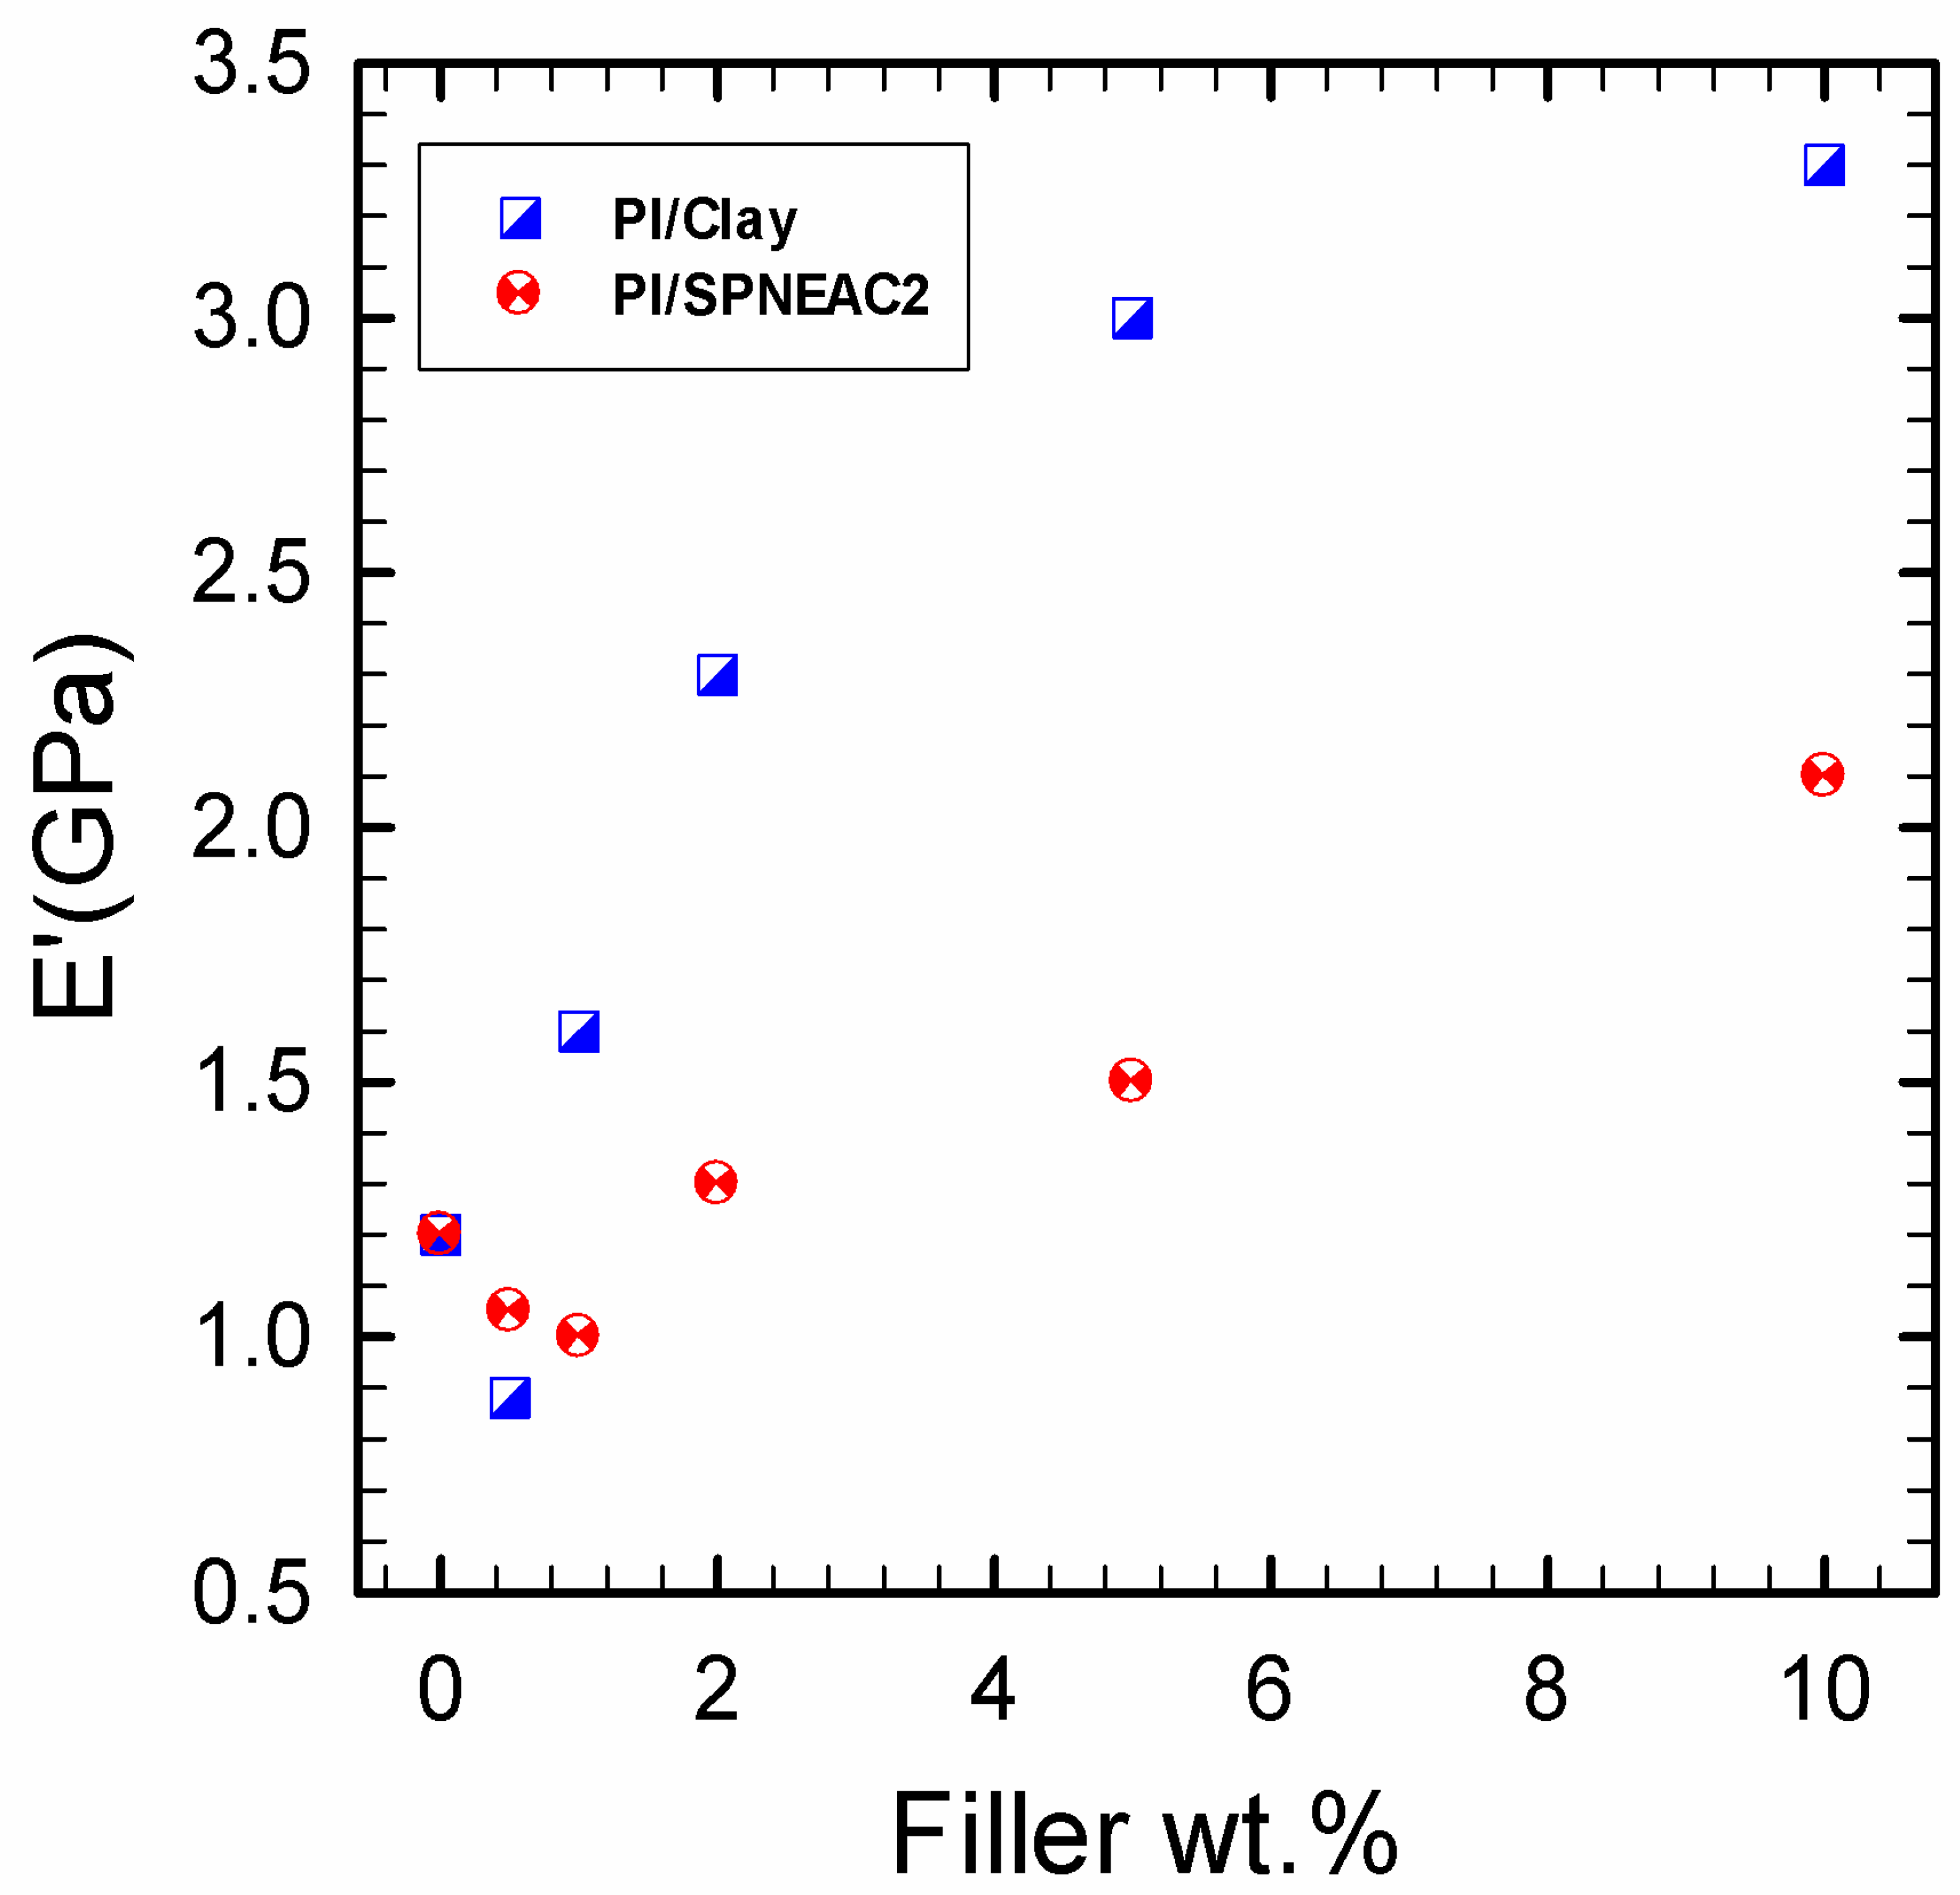
Figure 12 shows the variation of the storage modulus for clay 30B-PI and SPNEAC2-PI nanocomposites with composition. It is shown that increasing wt.% of the nanofillers resulted in increased storage modulus. Both nanocomposites show slight decrease in storage modulus, E’ for nanofiller wt.% below 2 wt.% nanofillers. However, beyond 1 wt.% 30B clay and 2 wt.% SPNEAC2, a remarkable trend of increasing storage modulus with increasing wt.% nanofillers is clearly demonstrated. SEM images of the nanocomposites (
Figure 12) show an open morphology at high SPNEAC2 loading (≥ 0.5 wt %). For the nanocomposites containing 0.5 wt.% SPNEAC2, loosely bound nano-sized spheres are evident.
3.5.3. Damping behavior and impact energy
Damping is a result of viscoelastic molecular relaxation phenomenon which is more pronounced at the glass-transition temperature. The height of tan δ peak (Figs. 9 &11), which is a measure of damping ability, increases with increasing SPNEAC loading, except for 0.25wt.%-SPNEAC-PI. The height of tan δ peak increases from 116.5 for neat-PI to a maximum of 137.28 for 2wt%-SPNEAC-PI. This increase in damping at higher SPNEAC loading can be attributed to the open and connected morphology of the nanocomposites which is believed to impact the relaxation behavior of the nanocomposite. This phenomenon also associated with the observed decreasing Tg values.
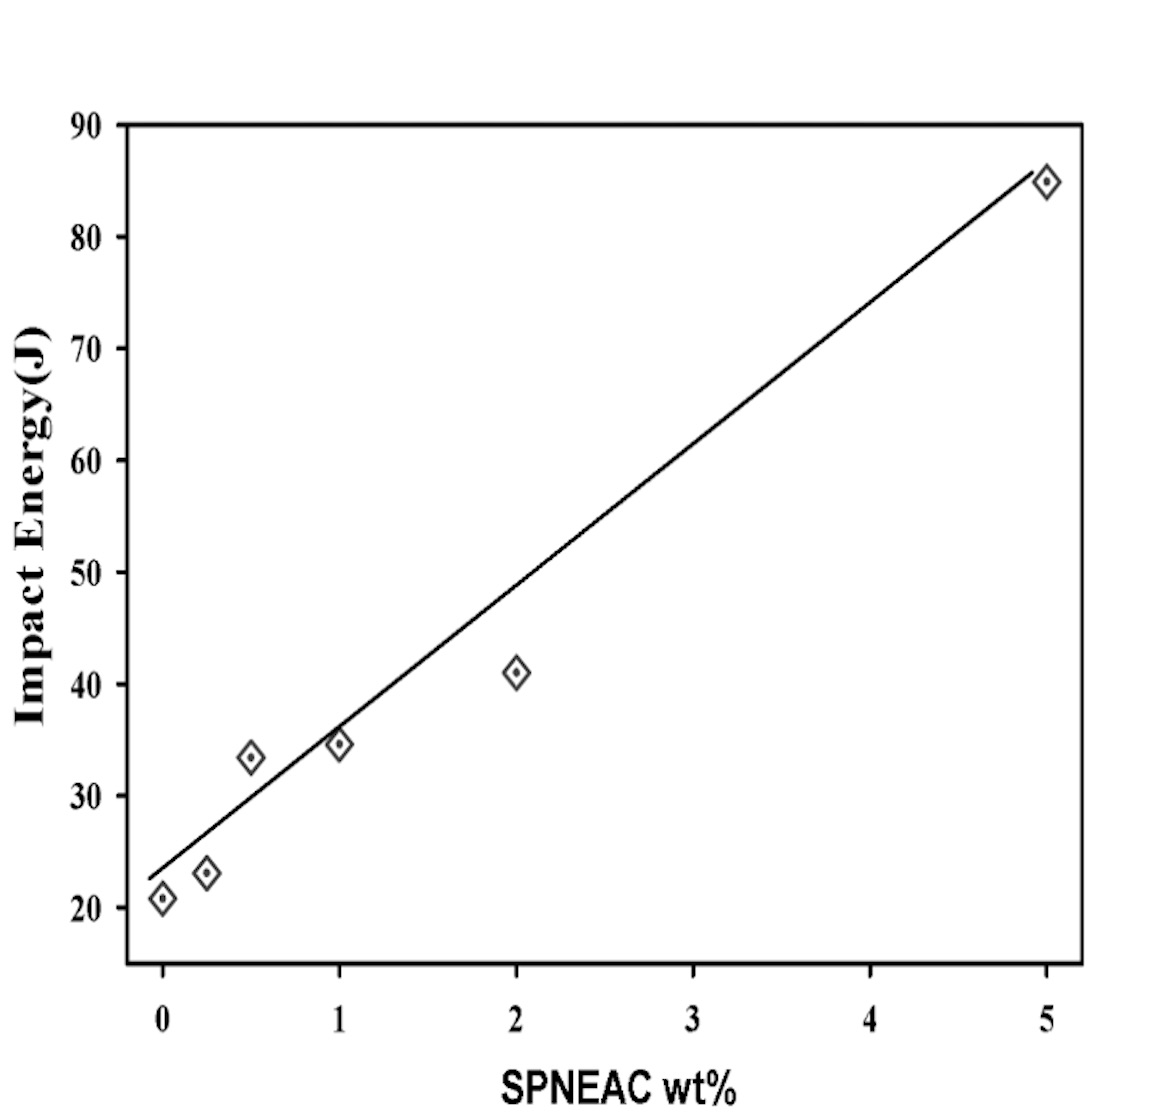
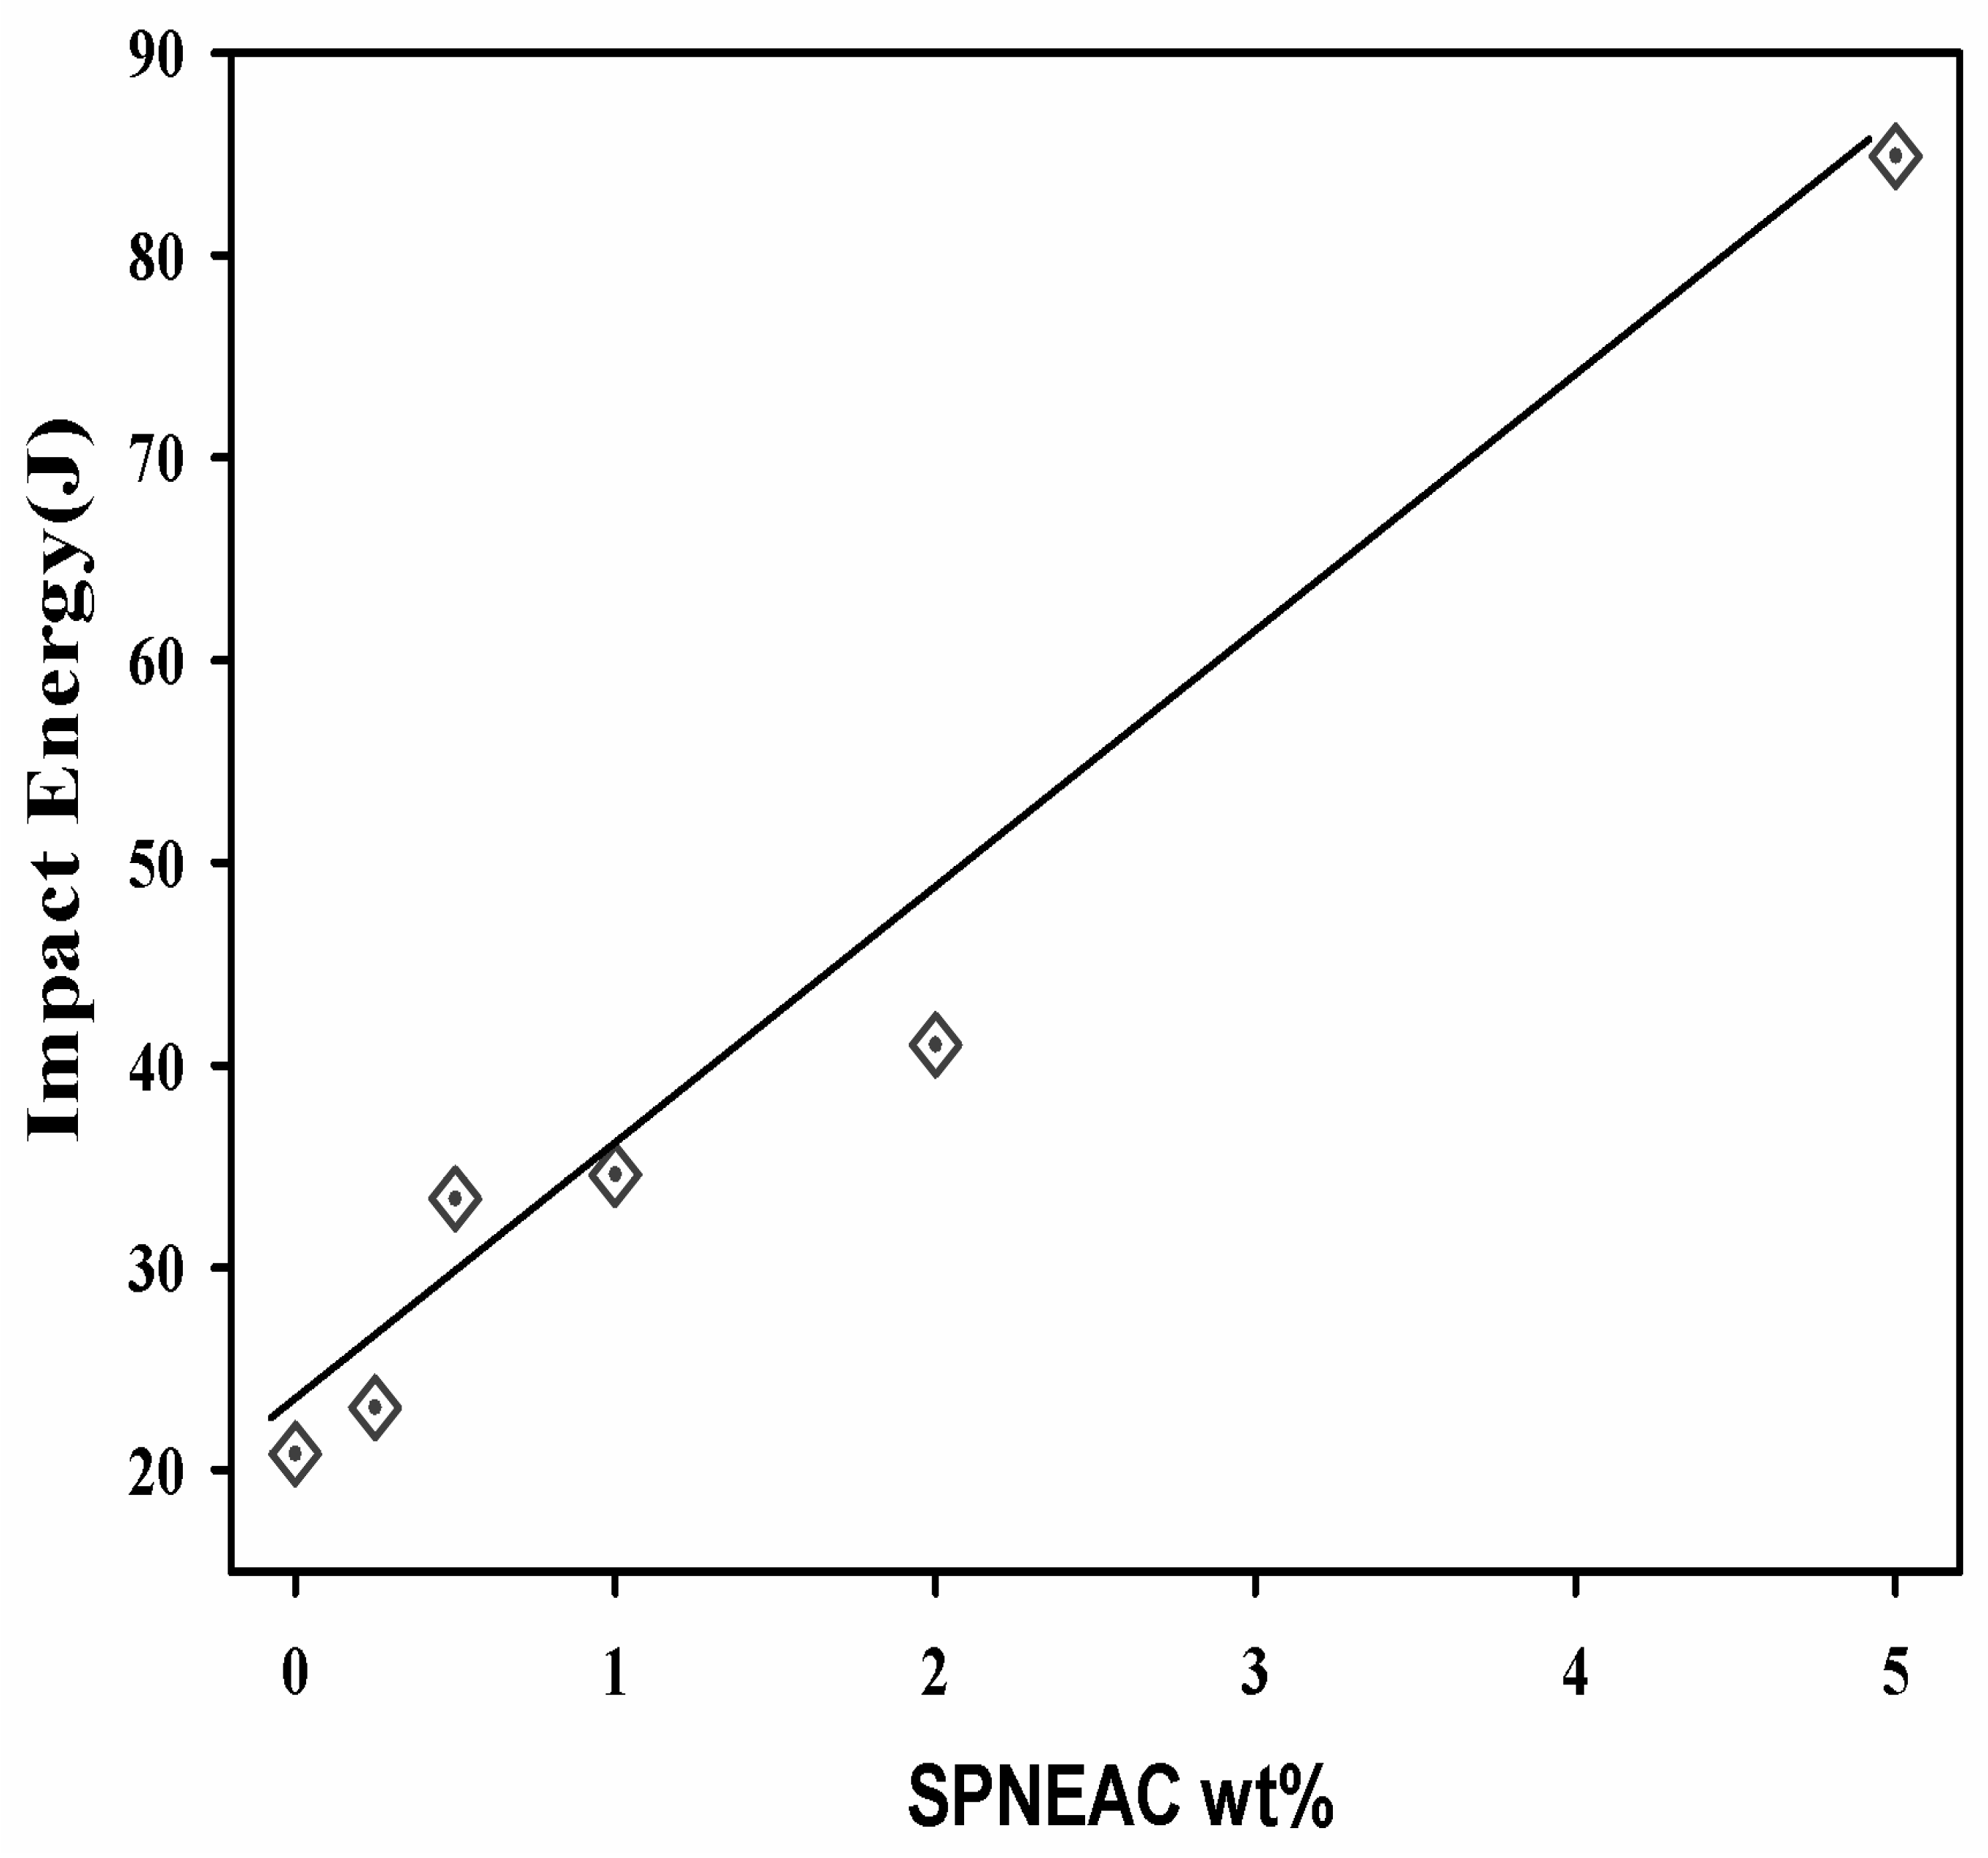
The area under tan d versus temperature curve can be related to the impact energy in accordance with Wada and Kasahara, (equation 2) (38-39). The area under the a-transition peak was calculated for the SPNEAC nanocomposites and analyzed as shown on
Figure 13 and tabulated in
Table 2. The impact energy of the nanocomposites increased with increasing wt.% SPNEAC. At 10 wt.% SPNEAC the impact energy of the nanocomposites is about 4 times that for the neat PI.
3.6. SPNEAC2-PI Nanocomposite Morphology
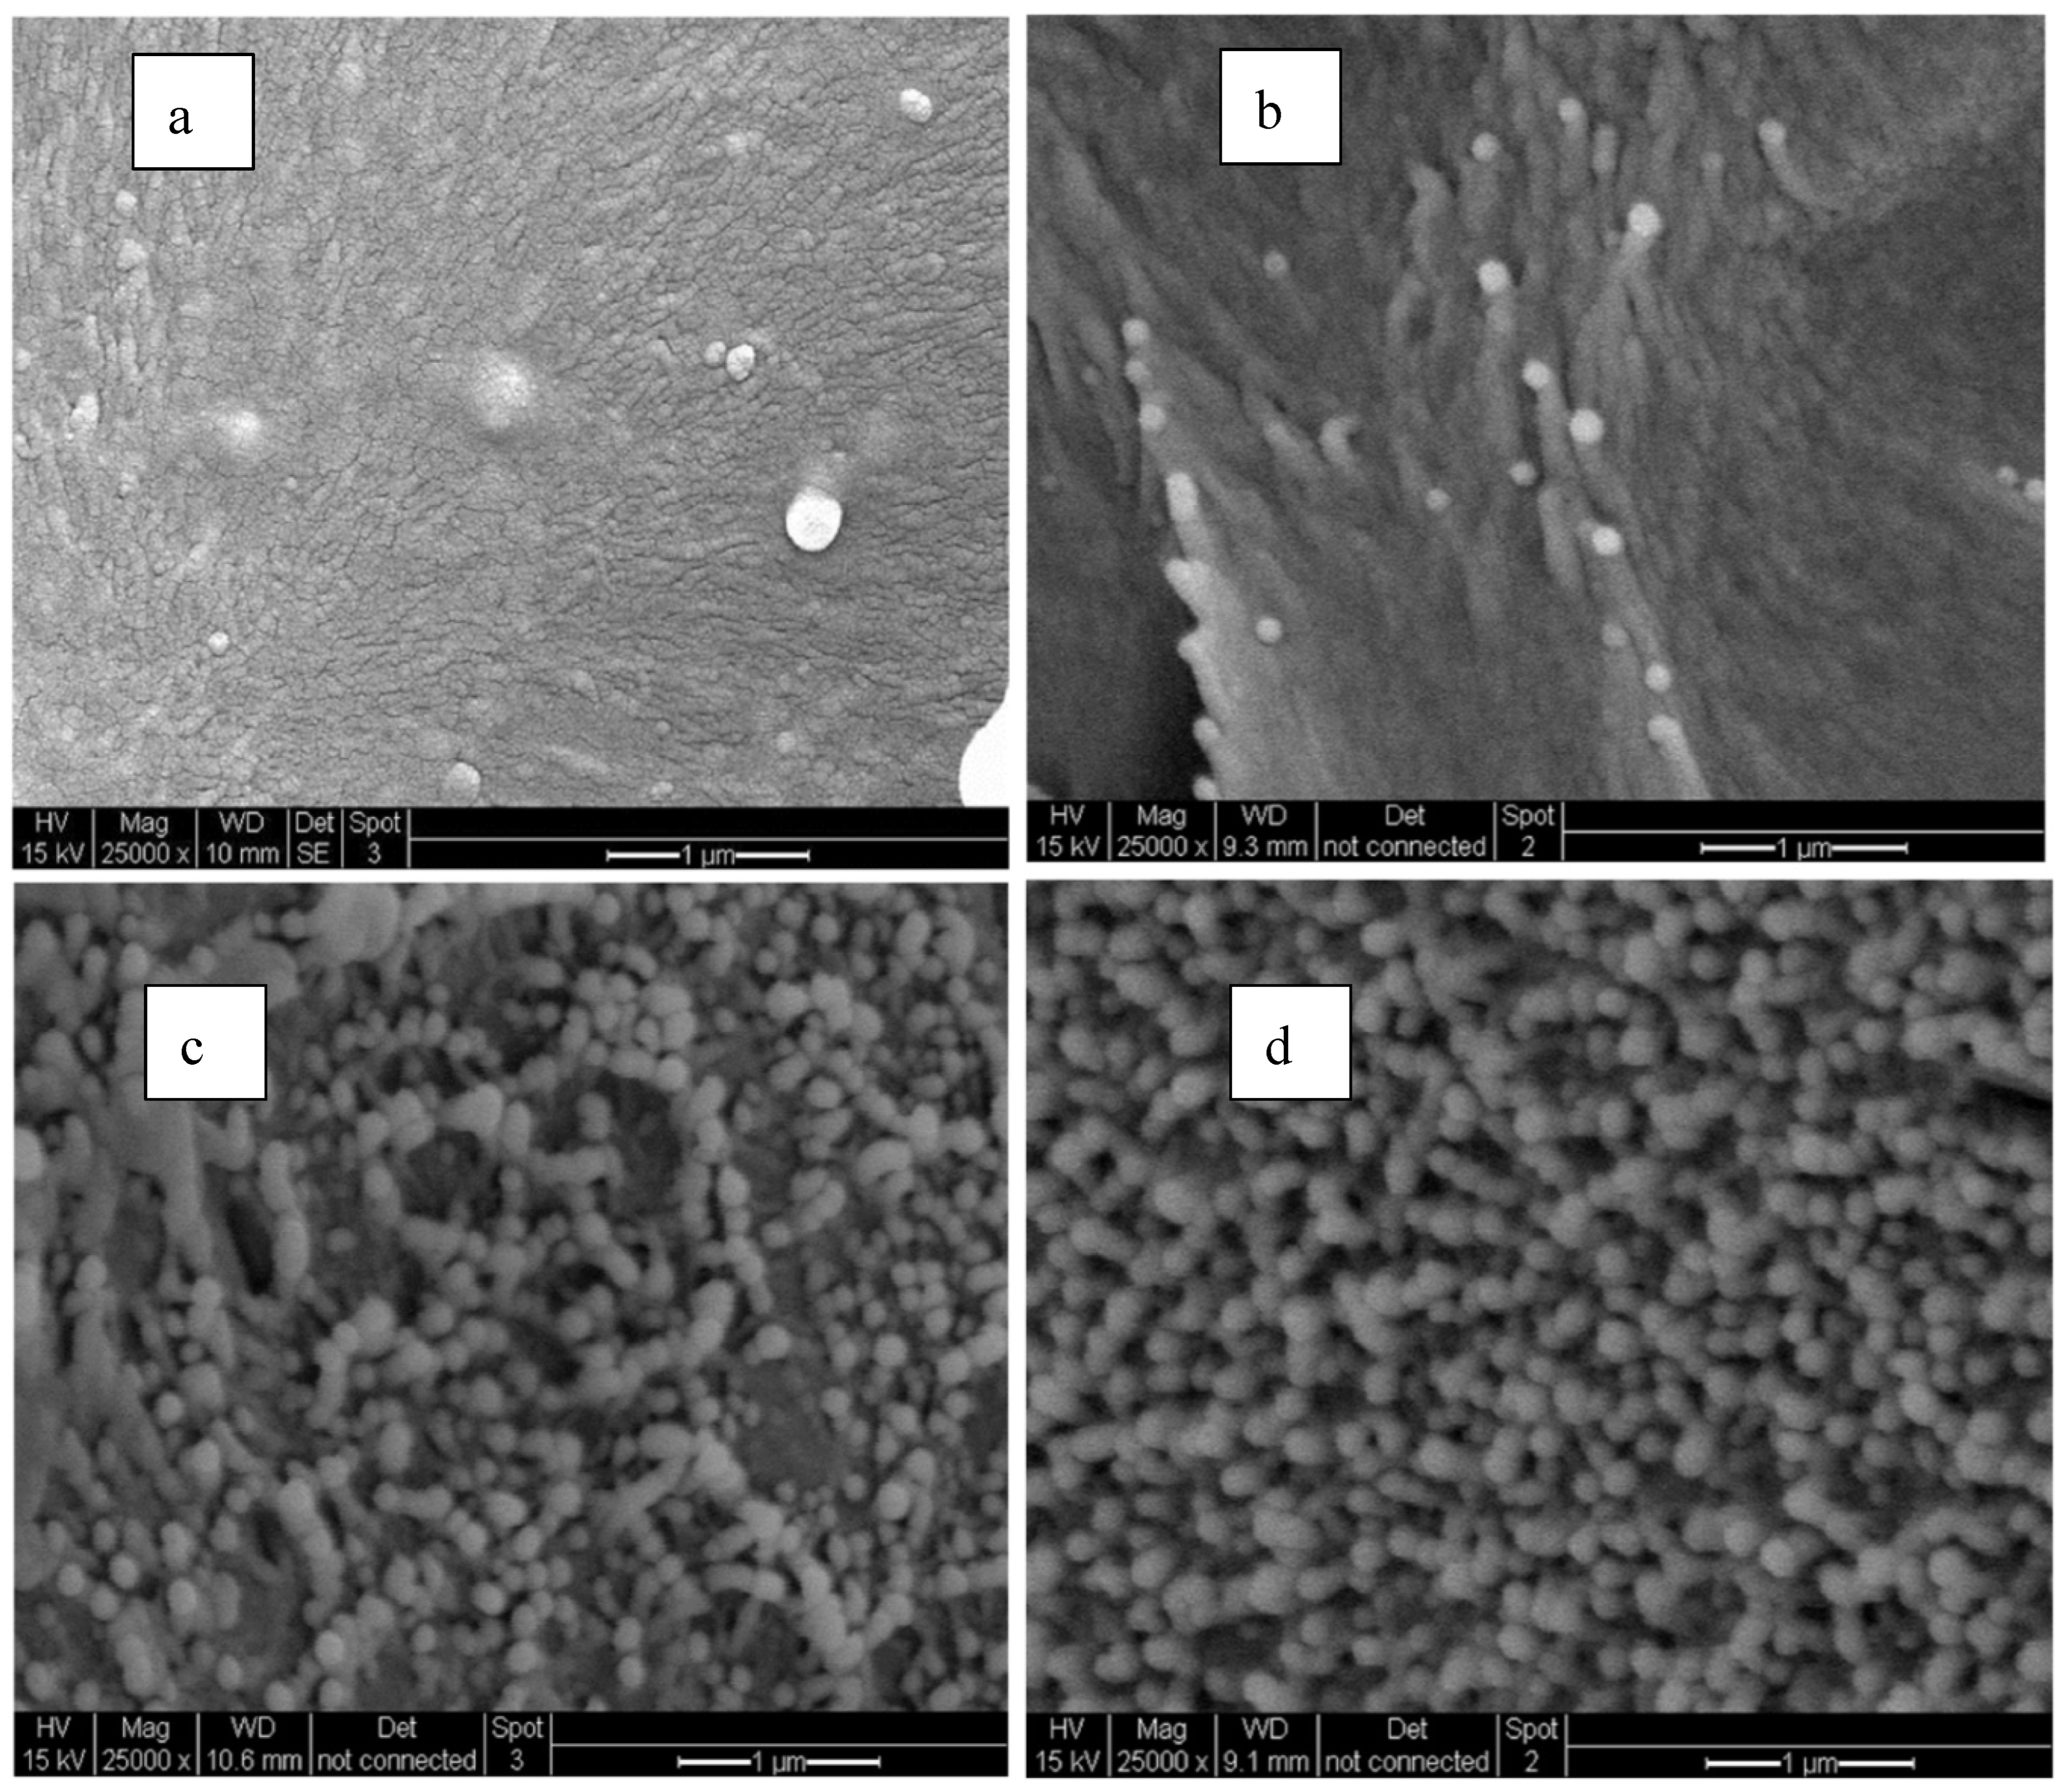
Figure 14 shows the SEM images of neat-PI, and SPNEAC2 nanocomposites containing 0.25, 0.5 and 5wt%-fillers, respectively, at 50,000 x magnification. The SPNEAC2-PI nanocomposite film has a dense fiberlike columnar morphology at lower loading of SPNEAC2 (≤ 0.5wt %), however, the morphology becomes spheroidal with increasing SPNEAC loading. For the 0.5wt%SPNEAC2-PI nanocomposite, discrete and overlapping fibroids are visible throughout the morphology. These features are closely connected, thereby resulting in dense spiky columnar morphology. At 2 and 5 wt.% SPNEAC2, the morphology becomes more spherical and connected but uniformly distributed throughout the cross-sectional area. It is suggested that these particulates contribute to the enhanced storage modulus observed at 5wt%-SPNEAC2. For the neat-PI films, an amorphous-like diffuse morphology with no distinct features is observed.
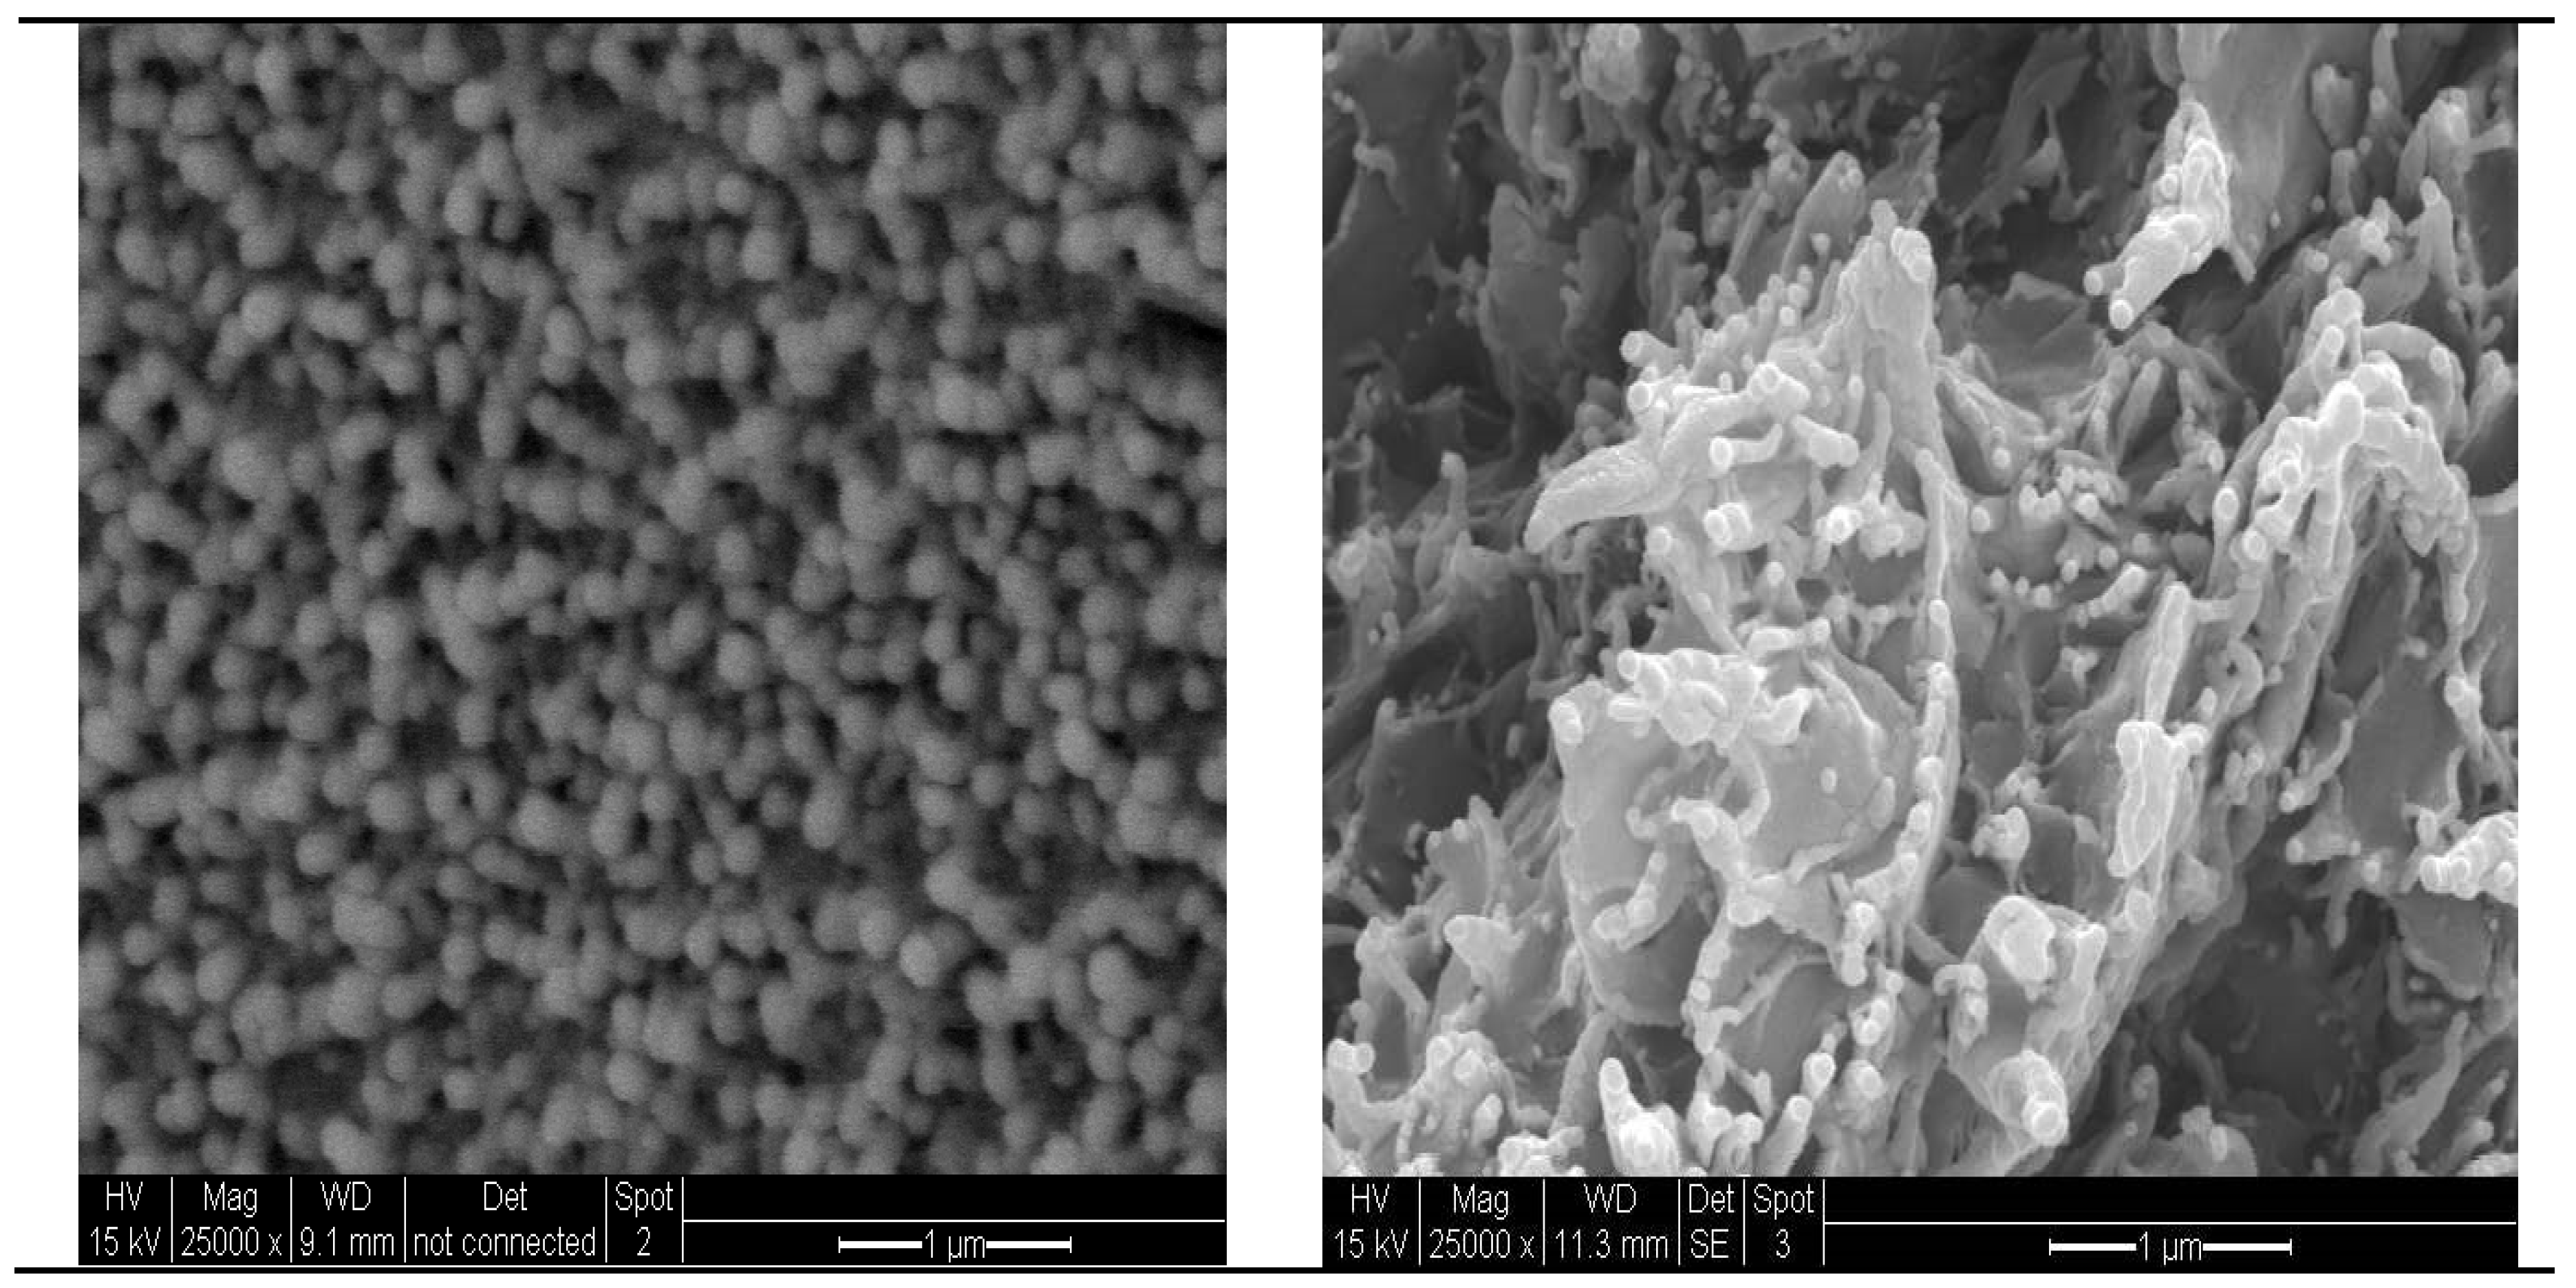
The cross-sectional morphologies of 30B-PI and SPNEAC2-PI containing 10 wt.% nanofillers are shown in
Figure 15. While the SPNEAC2-PI cross-sectional morphology shows close packed spherical particulate morphology with uniformly dispersed spheroidal, the cross-section morphology for 30B-PI shows a dense morphology with spiky edges of 30B clay sandwiching smooth continuous PI matrix.
3. Conclusion
Polyimide nanocomposites membranes containing polyaniline copolymer modified organoclay were successfully synthesized by condensation polymerization. It was observed that SPNEAC2-PI nanocomposites had nanospheroidal morphology composed of closely packed particles. The addition of copolymer/clay nano fillers decreases the transparency of the polyimide membranes mainly due to inherent coloration of polyaniline copolymer. Reinforcement of PI by either Cloisite 30B clay, SPNEAC or SPNEAC2 nanofillers, enhanced the degree of imidization (DOI) of the polyimide. The Tg of the nanocomposite, obtained from the DSC and DMS analysis, show a generally decreasing trend with increasing copolymer/clay loading. The observed decrease in Tg may be attributed to the less compact morphology of the SPNEAC2-PI nanocomposite membranes observed in the SEM micrographs. The calculated impact energy of the nanocomposites, SPNEAC-PI increased with increasing weight percent of SPNEAC.
Author Contributions
Conceptualization, J. Longun. and J. Iroh.; methodology. Longun.; software, J. Longun.; validation, J. Longun., and J. Iroh.; formal analysis, J. Longun.; investigation, J. Longun.; resources, J. Iroh.; data curationJ. Longun.; writing—original draft preparation, J. Longun.; writing—review and editing, J. Iroh.; visualization, J. Iroh.; supervision, J. Iroh.; project administration, J. Iroh.; funding acquisition, J. Iroh. All authors have read and agreed to the published version of the manuscript .
Funding
This research was funded by National Science Foundation (NSF), grant No. CMMI-0758656.
Data Availability Statement
None.
Acknowledgments
We are grateful for the financial support and opportunity for this research, funded by the National Science Foundation (NSF), grant No. CMMI-0758656.
Conflicts of Interest
The authors declare no conflict of interest.
References
- MacDiarmid, A.G. Polyaniline and polypyrrole: Where are we headed? Synth. Met. 1997, 84, 27–34. [Google Scholar] [CrossRef]
- Solheim, T.A. , Elsenbaumer, R., Reynonds, J., Eds. Handbook of Conducting Polymer, Marcel Dekker: New York, Second Edition, (1997).
- Shilare, D.J. , Gade, V. K., Gaikwad, P. D., Kharat, H. J., Kakde, K. P., Savale, P. A., Hussaini, S. S., Dhumane, N. R., Shirsat, M. D., Synthesis and Characterization of Ppy-PVS, Ppy-pTS, and Ppy-DBS Composite Films, International Journal of Polymeric Materials and Polymeric Biomaterials, Volume 56 (2), (2007). [CrossRef]
- Zhou, T. A. , Nie, L. H., Yao, S. Z., J Electroanal Chem. 291(1993) 1.
- Cooper, J. C. , Halt, E.A.H., Electroanalysis. 5(1993) 385.
- Kitani, A.; Kaya, M.; Sasaki, K. Performance Study of Aqueous Polyaniline Batteries. J. Electrochem. Soc. 1986, 133, 1069–1073. [Google Scholar] [CrossRef]
- Contractor, A.; Sureshkumar, T.; Narayanan, R.; Sukeerthi, S.; Lal, R.; Srinivasa, R. Conducting polymer-based biosensors. Electrochimica Acta 1994, 39, 1321–1324. [Google Scholar] [CrossRef]
- Sun, X.X.; Aboul-Enein, H.Y. Internal Solid Contact Electrode for the Determination of Clenbuterol in Pharmaceutical Formulations and Human Urine. Anal. Lett. 1999, 32, 1143–1156. [Google Scholar] [CrossRef]
- Xu, R.; Guan, Y.; Chen, H.; Huang, L.; Zhan, P. Preparation and electrochemical properties of Al/Pb-PANI-WC composite inert anodes. J. Chin. Adv. Mater. Soc. 2013, 1, 40–47. [Google Scholar] [CrossRef]
- Jenkins, I.H.; Salzner, U.; Pickup, P.G. Conducting Copolymers of Pyridine with Thiophene, N-Methylpyrrole, and Selenophene. Chem. Mater. 1996, 8, 2444–2450. [Google Scholar] [CrossRef]
- Yakuphanoglu, F.; Şenkal, B.F. Electronic and Thermoelectric Properties of Polyaniline Organic Semiconductor and Electrical Characterization of Al/PANI MIS Diode. J. Phys. Chem. C 2007, 111, 1840–1846. [Google Scholar] [CrossRef]
- Chaudhari, S.; Sainkar, S.R.; Patil, P.P. Anticorrosive properties of electrosynthesized poly(o-anisidine) coatings on copper from aqueous salicylate medium. J. Phys. D: Appl. Phys. 2007, 40, 520–533. [Google Scholar] [CrossRef]
- Savale, P.; Shirale, D.; Datta, K.; Ghosh, P. ; Shirsat Synthesis and characterization of poly (O-anisidine) films under galvanostatic conditions by using ECP technique. Int. J. Electrochem. Sci. 2007, 2, 595–606. [Google Scholar] [CrossRef]
- Iroh, J.O.; Su, W. Characterization of the passive inorganic interphase and polypyrrole coatings formed on steel by the aqueous electrochemical process. J. Appl. Polym. Sci. 1999, 71, 2075–2086. [Google Scholar] [CrossRef]
- Kulkarni, M.V.; Viswanath, A.K.; Aiyer, R.C.; Khanna, P.K. Synthesis, characterization, and morphology ofp-toluene sulfonic acid-doped polyaniline: A material for humidity sensing application. J. Polym. Sci. Part B: Polym. Phys. 2005, 43, 2161–2169. [Google Scholar] [CrossRef]
- Wei, D.; Lindfors, T.; Kvarnström, C.; Kronberg, L.; Sjöholm, R.; Ivaska, A. Electrosynthesis and characterisation of poly(N-methylaniline) in organic solvents. J. Electroanal. Chem. 2005, 575, 19–26. [Google Scholar] [CrossRef]
- Shah, K.; Iroh, J. Poly(O-anisidine) coatings electrodeposited onto AL-2024: Synthesis, characterization, and corrosion protection evaluation. Adv. Polym. Technol. 2004, 23, 291–297. [Google Scholar] [CrossRef]
- Longun, J., Buschle, B., Nguyen, N., Lo, M., Iroh, J. O., Comparison of poly(o-anisidine) and poly(o-anisidine-co-aniline) copolymer synthesized by chemical oxidative method. J. Appl. Polym. Sci. 2010, 118, 3123–3130. [CrossRef]
- Longun, J. , Processing and evaluation of multifunctional polyimide composite coatings and membranes, Ph.D., Dissertation, University of Cincinnati, 2013.
- Peters, E. M., van Dyke, J. D., J Polym Sci: Polym Chem Ed. 29(1991) 1379. [CrossRef]
- Wei, Y. , Focke, W. W., Wnek, G. E., Macdiarmid, A. G., Synthesis and electrochemistry of alkyl ring-substituted polyanilines J. Physical Chemistry, 93(1989) 495. [CrossRef]
- Wei, Y.; Hariharan, R.; Patel, S.A. Chemical and electrochemical copolymerization of aniline with alkyl ring-substituted anilines. Macromolecules 1990, 23, 758–764. [Google Scholar] [CrossRef]
- Zhu, Y.; Iroh, J.O.; Rajagopolan, R.; Aykanat, A.; Vaia, R. Optimizing the Synthesis and Thermal Properties of Conducting Polymer–Montmorillonite Clay Nanocomposites. Energies 2022, 15, 1291. [Google Scholar] [CrossRef]
- Langer, J. J. , (1990) Nsubstituted polyanilines: I. Poly(Nmethylaniline) and related copolymers. Synth Met 35:295–301(1990). [CrossRef]
- Motheo, A.J.; Pantoja, M.F.; Venancio, E.C. Effect of monomer ratio in the electrochemical synthesis of poly(aniline-co-o-methoxyaniline). Solid State Ionics 2004, 171, 91–98. [Google Scholar] [CrossRef]
- Kulkarni, M.V.; Viswanath, A.K.; Khanna, P.K. Synthesis and characterization of poly(N-methyl aniline) doped with sulphonic acids: Their application as humidity sensors. J. Appl. Polym. Sci. 2005, 99, 812–820. [Google Scholar] [CrossRef]
- Huang, J. C. , Zhu, Z. K., Yin, J., Qian, X. F., Sun, Y. Y., Poly(ether imide)/montmorillonite nanocomposites prepared by melt intercalation: morphology, solvent resistance properties and thermal properties, Polymer. 42(2001) 873-877. [CrossRef]
- Tyan, H.-L.; Liu, Y.-C.; Wei, K.-H. Thermally and Mechanically Enhanced Clay/Polyimide Nanocomposite via Reactive Organoclay. Chem. Mater. 1999, 11, 1942–1947. [Google Scholar] [CrossRef]
- Morgan, A.B.; Gilman, J.W.; Jackson, C.L. Characterization of the Dispersion of Clay in a Polyetherimide Nanocomposite. Macromolecules 2001, 34, 2735–2738. [Google Scholar] [CrossRef]
- Agag, T.; Koga, T.; Takeichi, T. Studies on thermal and mechanical properties of polyimide–clay nanocomposites. Polymer 2001, 42, 3399–3408. [Google Scholar] [CrossRef]
- Gu, A. , Kuo, S. W., Chang, F. C., Syntheses and properties of PI/clay hybrids, J. Appl. Polym. Sci., 2001, 79: 1902-1910. [CrossRef]
- Kim, J.S.; Lee, M.J.; Kang, M.-S.; Yoo, K.-P.; Kwon, K.-H.; Singh, V.; Min, N.K. Fabrication of high-speed polyimide-based humidity sensor using anisotropic and isotropic etching with ICP. Thin Solid Films 2009, 517, 3879–3882. [Google Scholar] [CrossRef]
- Iwamoto, M.; Fukuda, A.; Itoh, E. Spatial distribution of charges in ultrathin polyimide Langmuir–Blodgett films. J. Appl. Phys. 1994, 75, 1607–1610. [Google Scholar] [CrossRef]
- Itoh, E.; Iwamoto, M. Electronic density of state in metal/polyimide Langmuir–Blodgett film interface and its temperature dependence. J. Appl. Phys. 1997, 81, 1790–1797. [Google Scholar] [CrossRef]
- Itoh, E.; Iwamoto, M. Electronic density of state at metal/polyimide Langmuir-Blodgett film interface. Appl. Phys. Lett. 1996, 68, 2714–2716. [Google Scholar] [CrossRef]
- Kang, E.; Neoh, K.; Khor, S.; Tan, K.; Tan, B. X.p.s. studies of charge transfer interactions in some polyaniline complexes. Polymer 1990, 31, 202–207. [Google Scholar] [CrossRef]
- Tyan, H. , Liu, Y., Wei, K., Enhancement of imidization of poly(amic acid) through forming poly(amic acid)/organoclay nanocomposites, Polymer, 1999, 40(17), 4877-4886. [CrossRef]
- Wada, Y.; Kasahara, T. Relation between impact strength and dynamic mechanical properties of plastics. J. Appl. Polym. Sci. 1967, 11, 1661–1665. [Google Scholar] [CrossRef]
- Longun, J.; Iroh, J.O. Polyimide/substituted polyaniline–copolymer–nanoclay composite thin films with high damping abilities. J. Appl. Polym. Sci. 2012, 128, 1425–1435. [Google Scholar] [CrossRef]
Figure 1.
Structure of substituted, (top) polyaniline copolymer, (bottom left) clay, (bottom right) polyimide.
Figure 1.
Structure of substituted, (top) polyaniline copolymer, (bottom left) clay, (bottom right) polyimide.
Figure 2.
(A) Solid State UV-Vis spectra of (a) Neat-PI and PI containing, (b) 1, (c) 2, and (d) 5wt% copolymer/clay [SPNEAC], (B) dependence of transmittance on the nanocomposite loading at 500 and 1000 nm wavelength, respectively. Transmittance decreases from 85 for the neat PI to 42 % for the nanocomposite containing 5 wt.% SPNEAC in the Visible and Near-Infrared region.
Figure 3.
Attenuate Total Reflectance (ATR) spectra of (a) poly(N-ethyl-aniline)[PNEA] and (b) poly(N-ethyl-aniline-co-aniline-2-sulfonic acid)-copolymer-clay[SPNEAC] nanocomposite. Characteristic clay peaks are observed in SPNEAC spectrum.
Figure 3.
Attenuate Total Reflectance (ATR) spectra of (a) poly(N-ethyl-aniline)[PNEA] and (b) poly(N-ethyl-aniline-co-aniline-2-sulfonic acid)-copolymer-clay[SPNEAC] nanocomposite. Characteristic clay peaks are observed in SPNEAC spectrum.
Figure 4.
Attenuated Total Reflectance (ATR) spectra of (top) PI-clay nanocomposite and (bottom) Cloisite clay-30B.
Figure 4.
Attenuated Total Reflectance (ATR) spectra of (top) PI-clay nanocomposite and (bottom) Cloisite clay-30B.
Figure 5.
Effect of clay and copolymer/clay (SPNEAC (60:40) and SPNEAC2 (98:2)) wt.% on imidization of PI. The nanocomposite membranes were cured at 150 ˚C.
Figure 5.
Effect of clay and copolymer/clay (SPNEAC (60:40) and SPNEAC2 (98:2)) wt.% on imidization of PI. The nanocomposite membranes were cured at 150 ˚C.
Figure 6.
Second trace of DSC thermograms of neat-PI and PI nanocomposite membranes containing 0.5, 2 and 5wt% copolymer/clay [SPNEAC]. The thermal transitions corresponding to solvent removal, imidization and chain relaxation are shown.
Figure 6.
Second trace of DSC thermograms of neat-PI and PI nanocomposite membranes containing 0.5, 2 and 5wt% copolymer/clay [SPNEAC]. The thermal transitions corresponding to solvent removal, imidization and chain relaxation are shown.
Figure 7.
Dependence of the Tg of SPNEAC-PI nanocomposites membranes obtained from DSC and DMS tests, on the wt.% SPNEAC, showing decreasing Tg with increasing SPNEAC loading. DMS data show comparable Tg for both PI/SPNEAC containing 0.25 wt.% and the neat PI.
Figure 7.
Dependence of the Tg of SPNEAC-PI nanocomposites membranes obtained from DSC and DMS tests, on the wt.% SPNEAC, showing decreasing Tg with increasing SPNEAC loading. DMS data show comparable Tg for both PI/SPNEAC containing 0.25 wt.% and the neat PI.
Figure 8.
Dependence of the Tg of the nanocomposites on the wt.% nanofiller for (top) Clay 30B-PI and (bottom) SPNEAC2-PI nanocomposites, measured by DMS operated in tensile Mode.
Figure 8.
Dependence of the Tg of the nanocomposites on the wt.% nanofiller for (top) Clay 30B-PI and (bottom) SPNEAC2-PI nanocomposites, measured by DMS operated in tensile Mode.
Figure 9.
Plot of storage modulus and tan δ against temperature for, (a) neat-PI, and SPNEAC-PI containing 0.25, 0.5 wt.% SPNEAC, (b) neat-PI and SPNEAC-PI containing 2 and 5 wt.% SPNEAC.
Figure 9.
Plot of storage modulus and tan δ against temperature for, (a) neat-PI, and SPNEAC-PI containing 0.25, 0.5 wt.% SPNEAC, (b) neat-PI and SPNEAC-PI containing 2 and 5 wt.% SPNEAC.
Figure 10.
Dependence of the storage modulus of SPNEAC-PI nanocomposites with wt.% SPNEAC, showing higher Tg at low SPNEAC wt.% and subsequently, a decreasing trend of Tg with increasing filler wt.% above 0.5 wt.% SPNEAC.
Figure 10.
Dependence of the storage modulus of SPNEAC-PI nanocomposites with wt.% SPNEAC, showing higher Tg at low SPNEAC wt.% and subsequently, a decreasing trend of Tg with increasing filler wt.% above 0.5 wt.% SPNEAC.
Figure 11.
Plot of storage modulus and tan δ versus temperature for, (top) neat-PI, SPNEAC2-PI and 30B-PI with 2 wt.%, SPNEAC2, and 30B-PI and (bottom) neat-PI, SPNEAC2-PI and 30B-PI with 10wt.% nanofillers, respectively.
Figure 11.
Plot of storage modulus and tan δ versus temperature for, (top) neat-PI, SPNEAC2-PI and 30B-PI with 2 wt.%, SPNEAC2, and 30B-PI and (bottom) neat-PI, SPNEAC2-PI and 30B-PI with 10wt.% nanofillers, respectively.
Figure 12.
Comparison Clay-PI with SPNEAC2-PI nanocomposites: Effect of the wt.% nanofillers on storage modulus, for (top) clay/PI and (bottom) SPNEAC-PI nanocomposites.
Figure 12.
Comparison Clay-PI with SPNEAC2-PI nanocomposites: Effect of the wt.% nanofillers on storage modulus, for (top) clay/PI and (bottom) SPNEAC-PI nanocomposites.
Figure 13.
Dependence of the impact strength of SPNEAC-PI nanocomposites on the SPNEAC wt.%.
Figure 13.
Dependence of the impact strength of SPNEAC-PI nanocomposites on the SPNEAC wt.%.
Figure 14.
SEM images of (a) Neat-PI (b) 0.5%SPNEAC2-PI (c) 2 wt%SPNEAC2-PI and (d) 5wt%SPNEAC2-PI nanocomposite films showing cross-sectional morphology.
Figure 14.
SEM images of (a) Neat-PI (b) 0.5%SPNEAC2-PI (c) 2 wt%SPNEAC2-PI and (d) 5wt%SPNEAC2-PI nanocomposite films showing cross-sectional morphology.
Figure 15.
Cross-sectional SEM images of (left) SPNEAC2-PI and (b) 30B Clay-PI nanocomposites containing 10 wt.% nanofillers.
Figure 15.
Cross-sectional SEM images of (left) SPNEAC2-PI and (b) 30B Clay-PI nanocomposites containing 10 wt.% nanofillers.
Table 1.
Effect of wt.% SPNEAC on transmittance.
Table 1.
Effect of wt.% SPNEAC on transmittance.
| Composition (wt.%) |
Transmittance (%) @ l = 500 nm |
Transmittance (%) @ l = 1000 nm |
| 0 |
36 |
85 |
| 1 |
20 |
80 |
| 2 |
12 |
66 |
| 5 |
3 |
42 |
Table 2.
Impact energy of PI and SPNEAC-PI nanocomposites from
Figure 13.
Table 2.
Impact energy of PI and SPNEAC-PI nanocomposites from
Figure 13.
| Sample |
Impact energy(J) |
| Neat-PI |
20.8 |
| 0.25wt% |
23.1 |
| 0.5wt% |
33.4 |
| 1wt% |
34.6 |
| 2wt% |
41.0 |
| 5wt% |
84.9 |
|
Disclaimer/Publisher’s Note: The statements, opinions and data contained in all publications are solely those of the individual author(s) and contributor(s) and not of MDPI and/or the editor(s). MDPI and/or the editor(s) disclaim responsibility for any injury to people or property resulting from any ideas, methods, instructions or products referred to in the content. |
© 2023 by the authors. Licensee MDPI, Basel, Switzerland. This article is an open access article distributed under the terms and conditions of the Creative Commons Attribution (CC BY) license (https://creativecommons.org/licenses/by/4.0/).
