1. Introduction
Biodiesel fuel is a renewable and environmentally friendly alternative to fossil fuels due to their renewability, sustainability, and carbon neutrality [
1,
2,
3,
4]. Biodiesel can be divided into three main categories: solid, liquid and gas. Liquid biofuels are attracting attention and are being studied because of their high use value as a major fuel for internal combustion engines. Among the various biofuels tested, algae are one of the most promising energy sources [
5]. They offer fast growth rates, high yields, the viability of living in a variety of environments, the vastness of arable land, and many competitive advantages over ground energy sources [
6,
7,
8,
9]. Algae can be classified into Micro- and Macro- depending on their size [
10]. Macroalgae, known as seaweed, are multicellular plants and making their harvesting more easily than that of microalgae [
11]. Also, they are promising sources of oil for biodiesel production due to their high fatty acids [
12,
13]. Fatty acid analysis is an essential step in evaluating the potential of macroalgae for biodiesel production. Fatty acids are actively analyzed using GC-FID and GC-MS [
14,
15,
16,
17,
18]. In addition, there are many analysis papers on the fatty acid content in algae using GC [
19,
20,
21]. However, GC has a problem that the vaporization efficiency of Analyte decreases as the molecular weight of fatty acids increases. The direct analysis of fatty acids in macroalgae using LC-MS is challenging due to their poor ionization efficiency.
In this study, we developed a method for the simultaneous analysis of seven fatty acids related to biodiesel fuel (Myristic acid, cis-Palmitvaccenic acid, Palmitic acid, Palmitic-9,9-d2 acid, Oleic acid, Stearic acid and Stearic-2,2-d2 acid) in macroalgae using LC-MS with trimethyl aminoethyl (TMAE) derivatization. The introduction of TMAE derivatives into the hydroxyl group (-OH) functional group of the analyte improved ionization and resulted in high sensitivity.
We optimized the mobile phase composition and flow rate for the separation of five derived fatty acids using LC. The optimized mobile phase consisted of methanol and water with 0.1% formic acid, and the flow rate was 0.3 mL/min. The LC-MS method was validated using several macroalgae samples and showed excellent linearity, sensitivity, accuracy, and precision.
To the best of our knowledge, this is the first report on the simultaneous determination of these seven fatty acids related to biodiesel fuel in large algae using LC-MS with TMAE derivatization. The proposed method offers a reliable and sensitive tool for the analysis of large algae samples for their potential use in biodiesel production.
2. Materials and Methods
2.1. Chemicals and reagents
As the fatty acid Standard (STD), palmitic acid (PA, C16:0), stearic acid (SA, C18:0), myristic acid (MA, C14:0), and oleic acid (OA, C18:1) used reagents from Sigma-Aldrich (St. Louis, MO, USA), and cis-palmitvaccenic acid (cis-PA, C16:1) were purchased from AccuStandard (St. Market, NH, USA). Palmitic acid-9,9-d2 and stearic acid-2,2-d2 used Internal standard (IS) were obtained from C/D/N Isotope (St. Leacock, Quebec, Canada).
Acetonitrile and Methanol were purchased from J. T. Baker Ind. (Phillipsburg, NJ, USA), and Ammonium acetate, used as a mobile phase additive for LC, were purchased from Sigma-Alrich (St. Louis, MO, USA).
For the optimization experiment of the solid phase extraction, Hexane used as a loading solvent was purchased form J. T. Baker Ind. (Phillipsburg, NJ, USA). In addition, ethyl acetate, dichloromethane, chloroform, 1-propanol, ethanol and N,N-dimethylformamide were obtained from Sigma-Alrich (St. Louis, MO, USA) as washing solvents. Diethylether and acetic acid (Sigma-Alrich, MO, USA) were used as eluents for fatty acids.
All solvents for analysis were of HPLC grade or higher, and all standard solutions were stored under refrigeration.
Iodomethane, 2-dimethylaminoethanol, and oxalyl chloride were purchased from Sigma-Aldrich (St. Louis, MO, USA), which were used in derivatives of fatty acids.
The Native standard solution was prepared with a standard stock solution of 1 mg/mL and diluted with seven level points range from 0.2 to 500 μg/mL.
Blank sample was a species of Gigartina tenella (Marine Natural Product 186; MNP 186) supported by the Gangneung branch of Korea Institute of Science and Technology (Gangneung, Korea), and an extraction experiment was conducted by spiking standards.
2.2. Lyophilization
Lyophilization was performed for the efficient extraction of fatty acids from macroalgae. Macroalgae samples were washed with double distilled water. These samples were frozen at -20 °C for 3 hours and then dried for 24 hours using a freeze drier (FD-1000, EYELA, Tokyo, Japan). Completely dried samples were made into powder form using a pestle and mortar, and kept refrigerated at 2 °C until analysis.
2.3. Solid Phase Extraction
In this study, a solid phase extraction (SPE) method was used to extract fatty acids from macroalgae. SPE was carried out by using amino-propyl columns Mega BE-NH2 (500 mg, 6 ml, Agilent Technologies, CA, USA) and 24 port SPE vacuum manifold (Honeywell Burdick & Jackson, NJ, USA) used for macroalgae samples extractions. The SPE sorbents were activated with 3 mL of chloroform. To prepare a loading solution to be used for SPE, 30 mg of lyophilized macroalgae was added to 6 mL of a chloroform and hexane mixed solution (5:5, v/v) and vortexed at 1,500 rpm for 1 min (Vortex-Genie® 2, Scientific Industries, New York, USA). 6 mL of the prepared loading solution was injected into the SPE columns using a 0.5 μm hydrophobic syringe filter (Advantec Co., Tokyo, Japan) to remove impurities. SPE columns with loading solution were removed with 4 mL of 1-propanol to remove interfering substances other than fatty acids. A mixed solution of diethylether and acetic acid (98:2, v/v) was used as an eluent for fatty acids, and the extract was dried at 45 °C and 30 kPa for 20 min under a nitrogen stream using a TurboVap LV (Caliper Life Sciences, MA, USA).
2.4. Derivatization
For quantitative analysis of fatty acids using LC/ESI-MS/MS, target analytes must be sufficiently ionized and proper collision energy must be established to generate fragment ions effective for quantitative analysis. Fatty acids usually exhibit low analytical sensitivity because of their low ionization. [
22] Consequently, derivatization steps should be applied to overcome such problems. [
23]
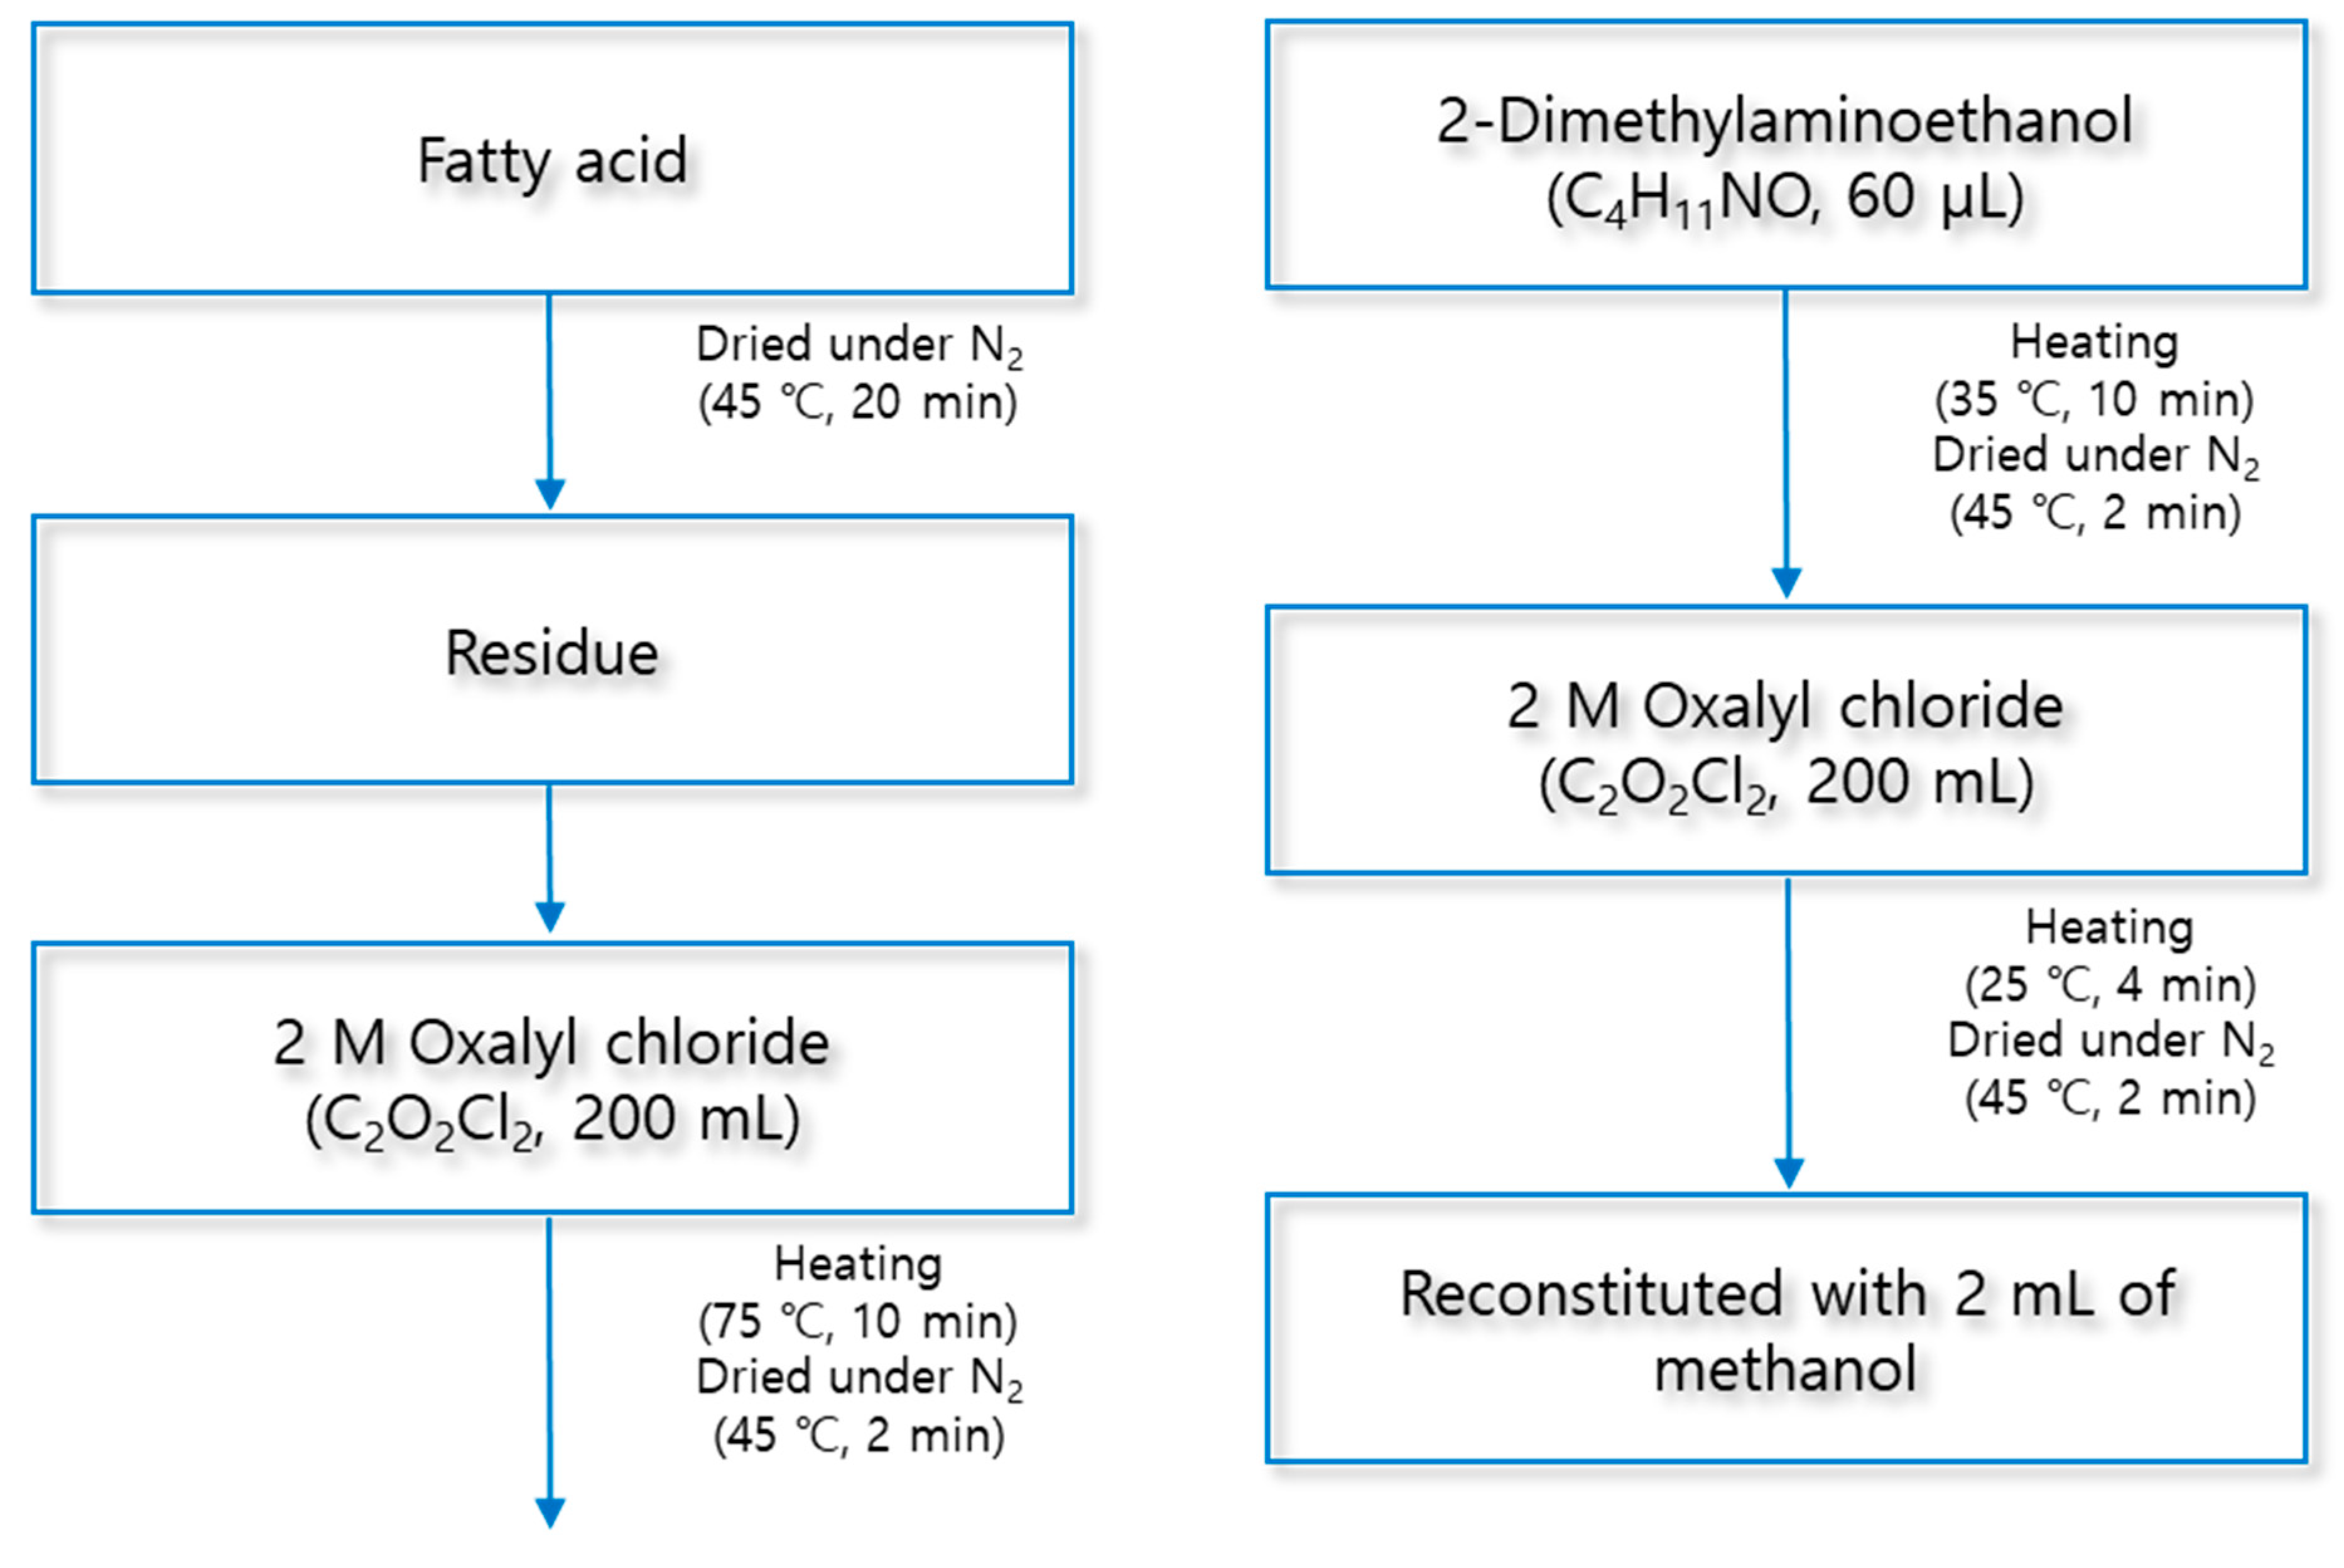
The derivatization of fatty acids was carried out in three steps using trimethylaminoethyl (TMAE) functional group. First, 200 μL of 2 M oxalyl chloride was added to the residue from which the solvent was removed for derivatization of fatty acids. After closing the lid of the test tube, the mixture was reacted for 10 min at 75 °C using a block heater (QBD4, Grant Instruments, Cambridge, UK). Second, the mixture was dried by injecting nitrogen gas at 45° C for 2 min using an evaporator to obtain a residue again. To the resulting residue, 60 µL of 2-dimethylaminoethanol was added and the reaction was carried out at 35 °C for 10 min. Finally, the mixture was dried under a nitrogen stream at 45 ° C for 2 min. Then, 100 μL of Iodomethane was added, the reaction was carried out at 25 ° C for 4 min, and the residue was produced through solvent drying. The derivatized analytes were reconstituted with 2 mL of methanol, and 10 μL was injected into LC/ESI-MS/MS for analysis. The structural diagram of this method is shown in
Figure 1 and
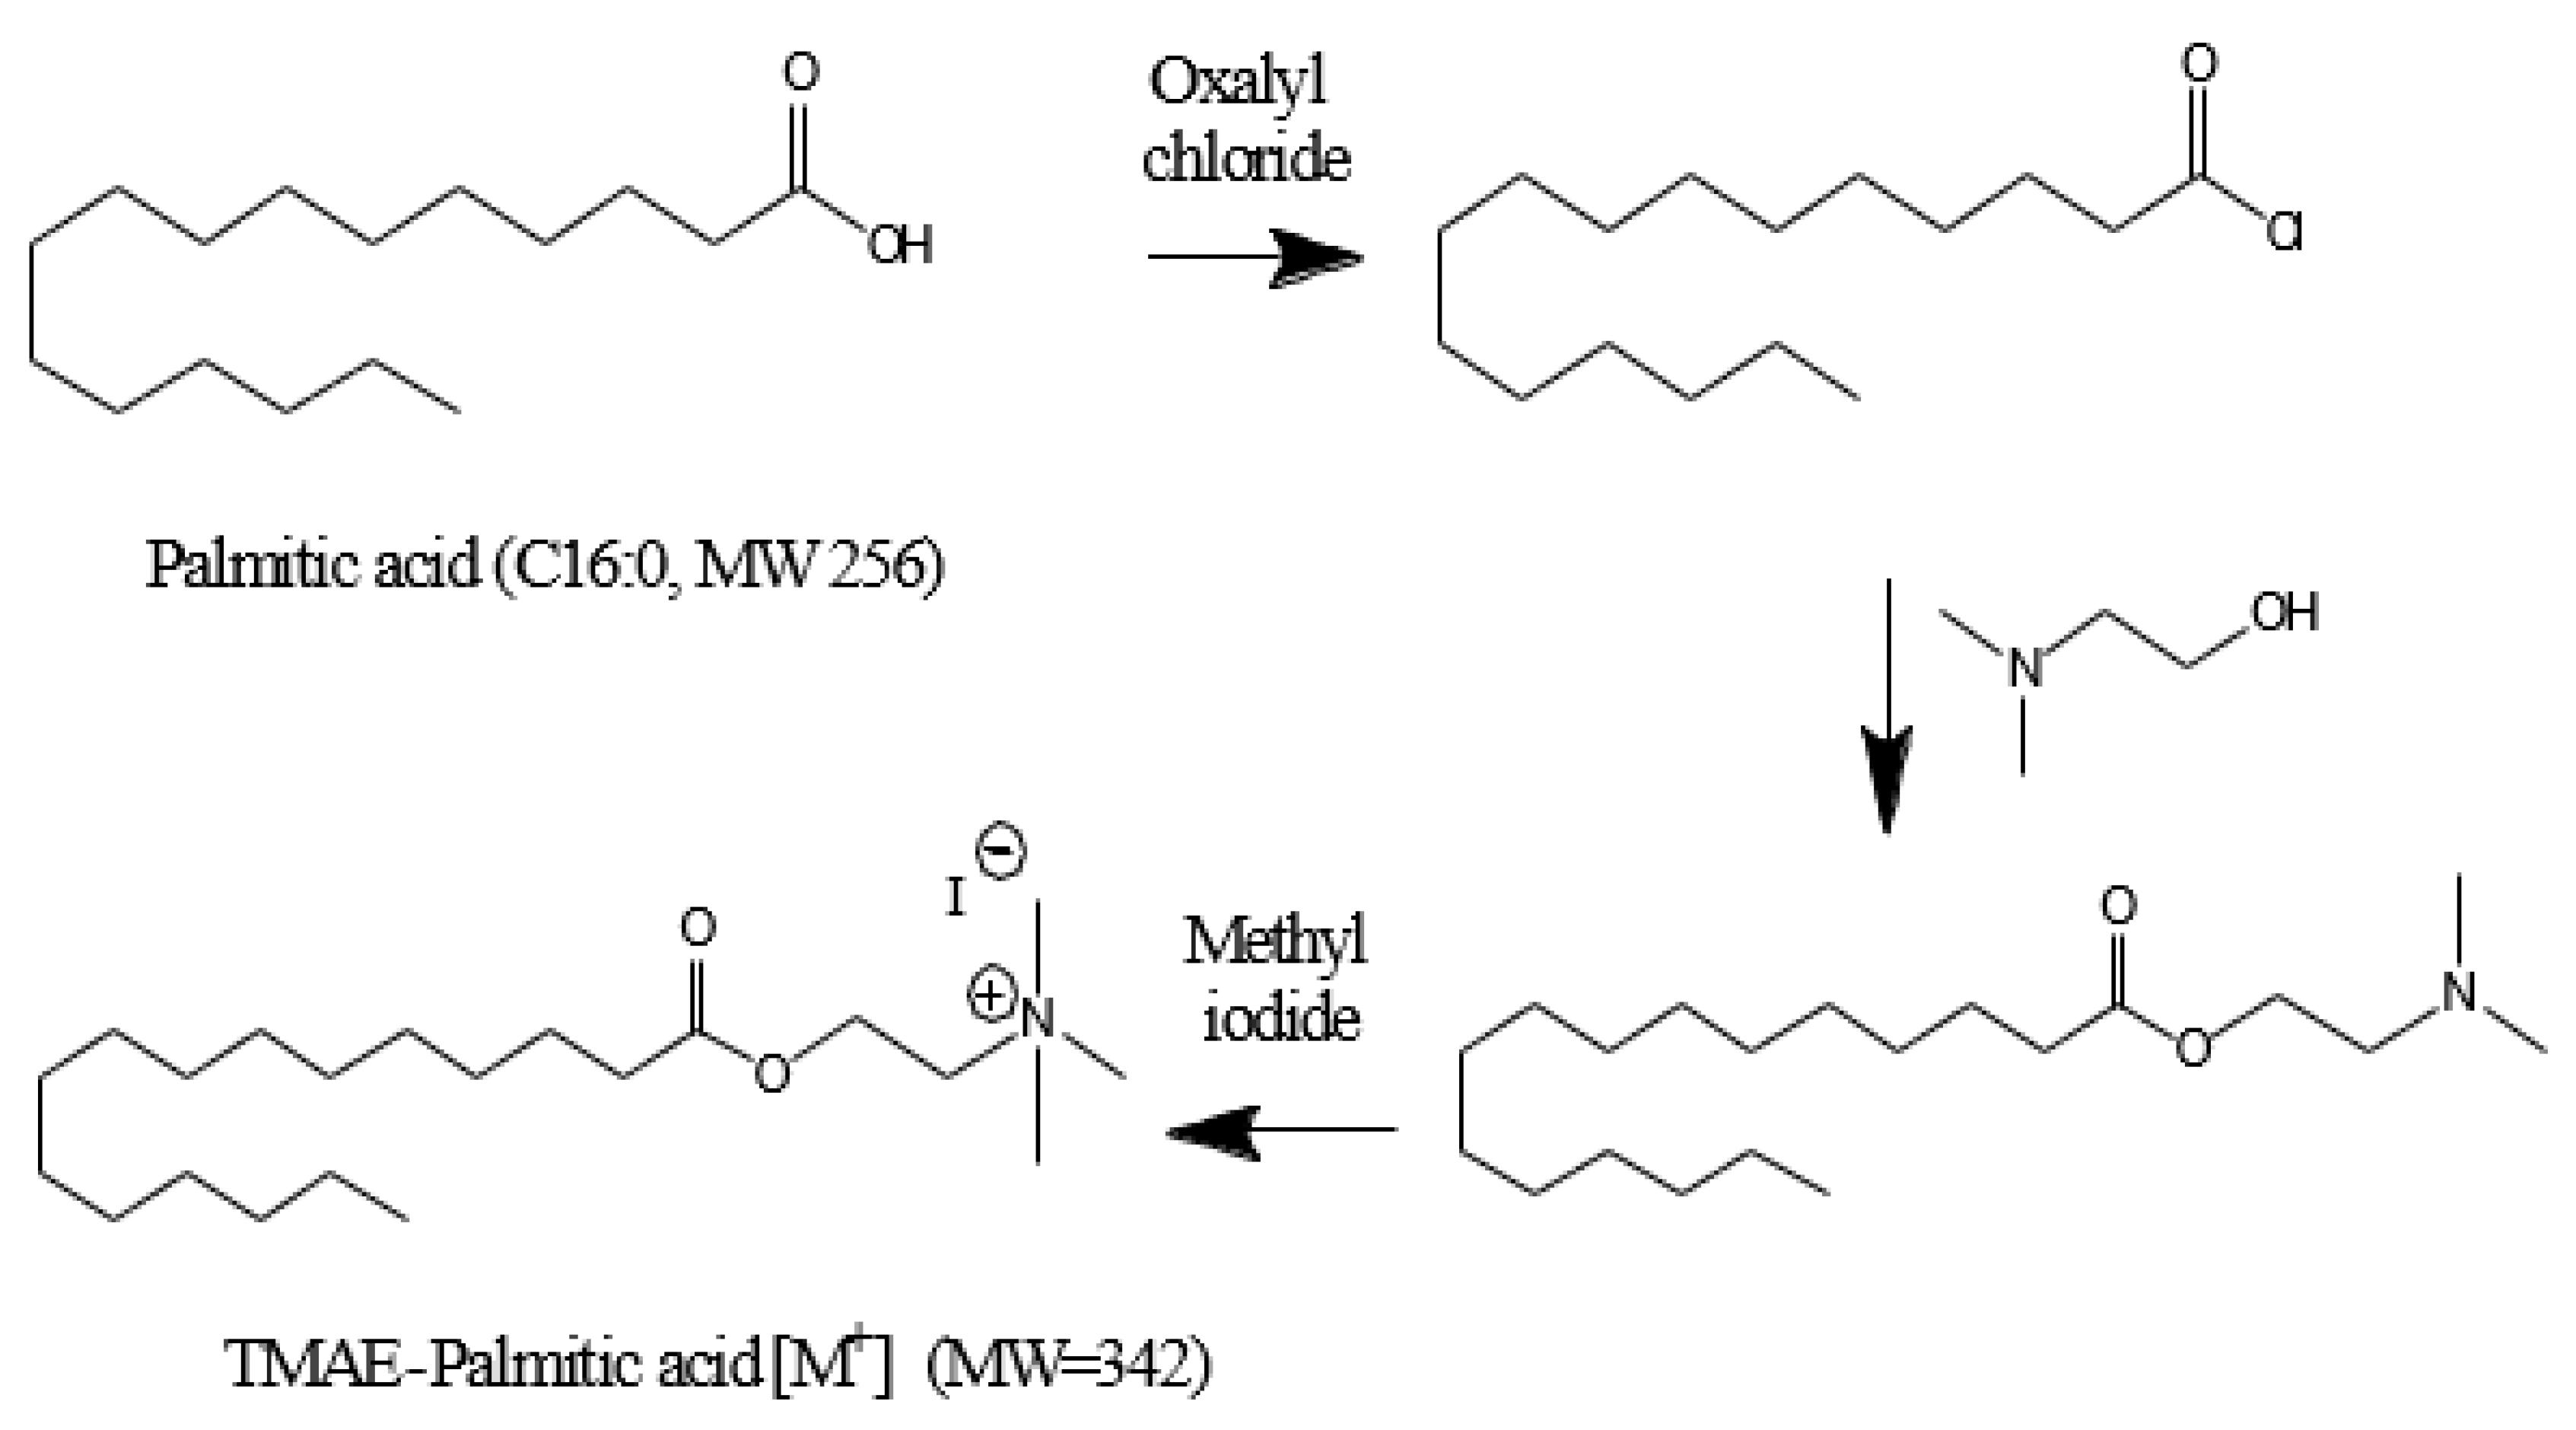
Figure 2 shows an example of derivatization of palmitic acid.
2.5. Liquid Chromatogram
Liquid chromatography was performed using an Accela® HPLC system from Thermo Scientific (San Jose, CA, USA) and the target analytes were separated using a SHISEIDO CO. (Ginza, Tokyo, Japan) CAPCELL PAK C18 MG Ⅱ S3 (100 mm × 2.0 mm I.D., 3 um). The mobile phase consisted of distilled water (mobile phase A) and acetonitrile (ACN, mobile phase B) added with 5 mM ammonium acetate, and the flow rate was maintained at 300 μL/min.
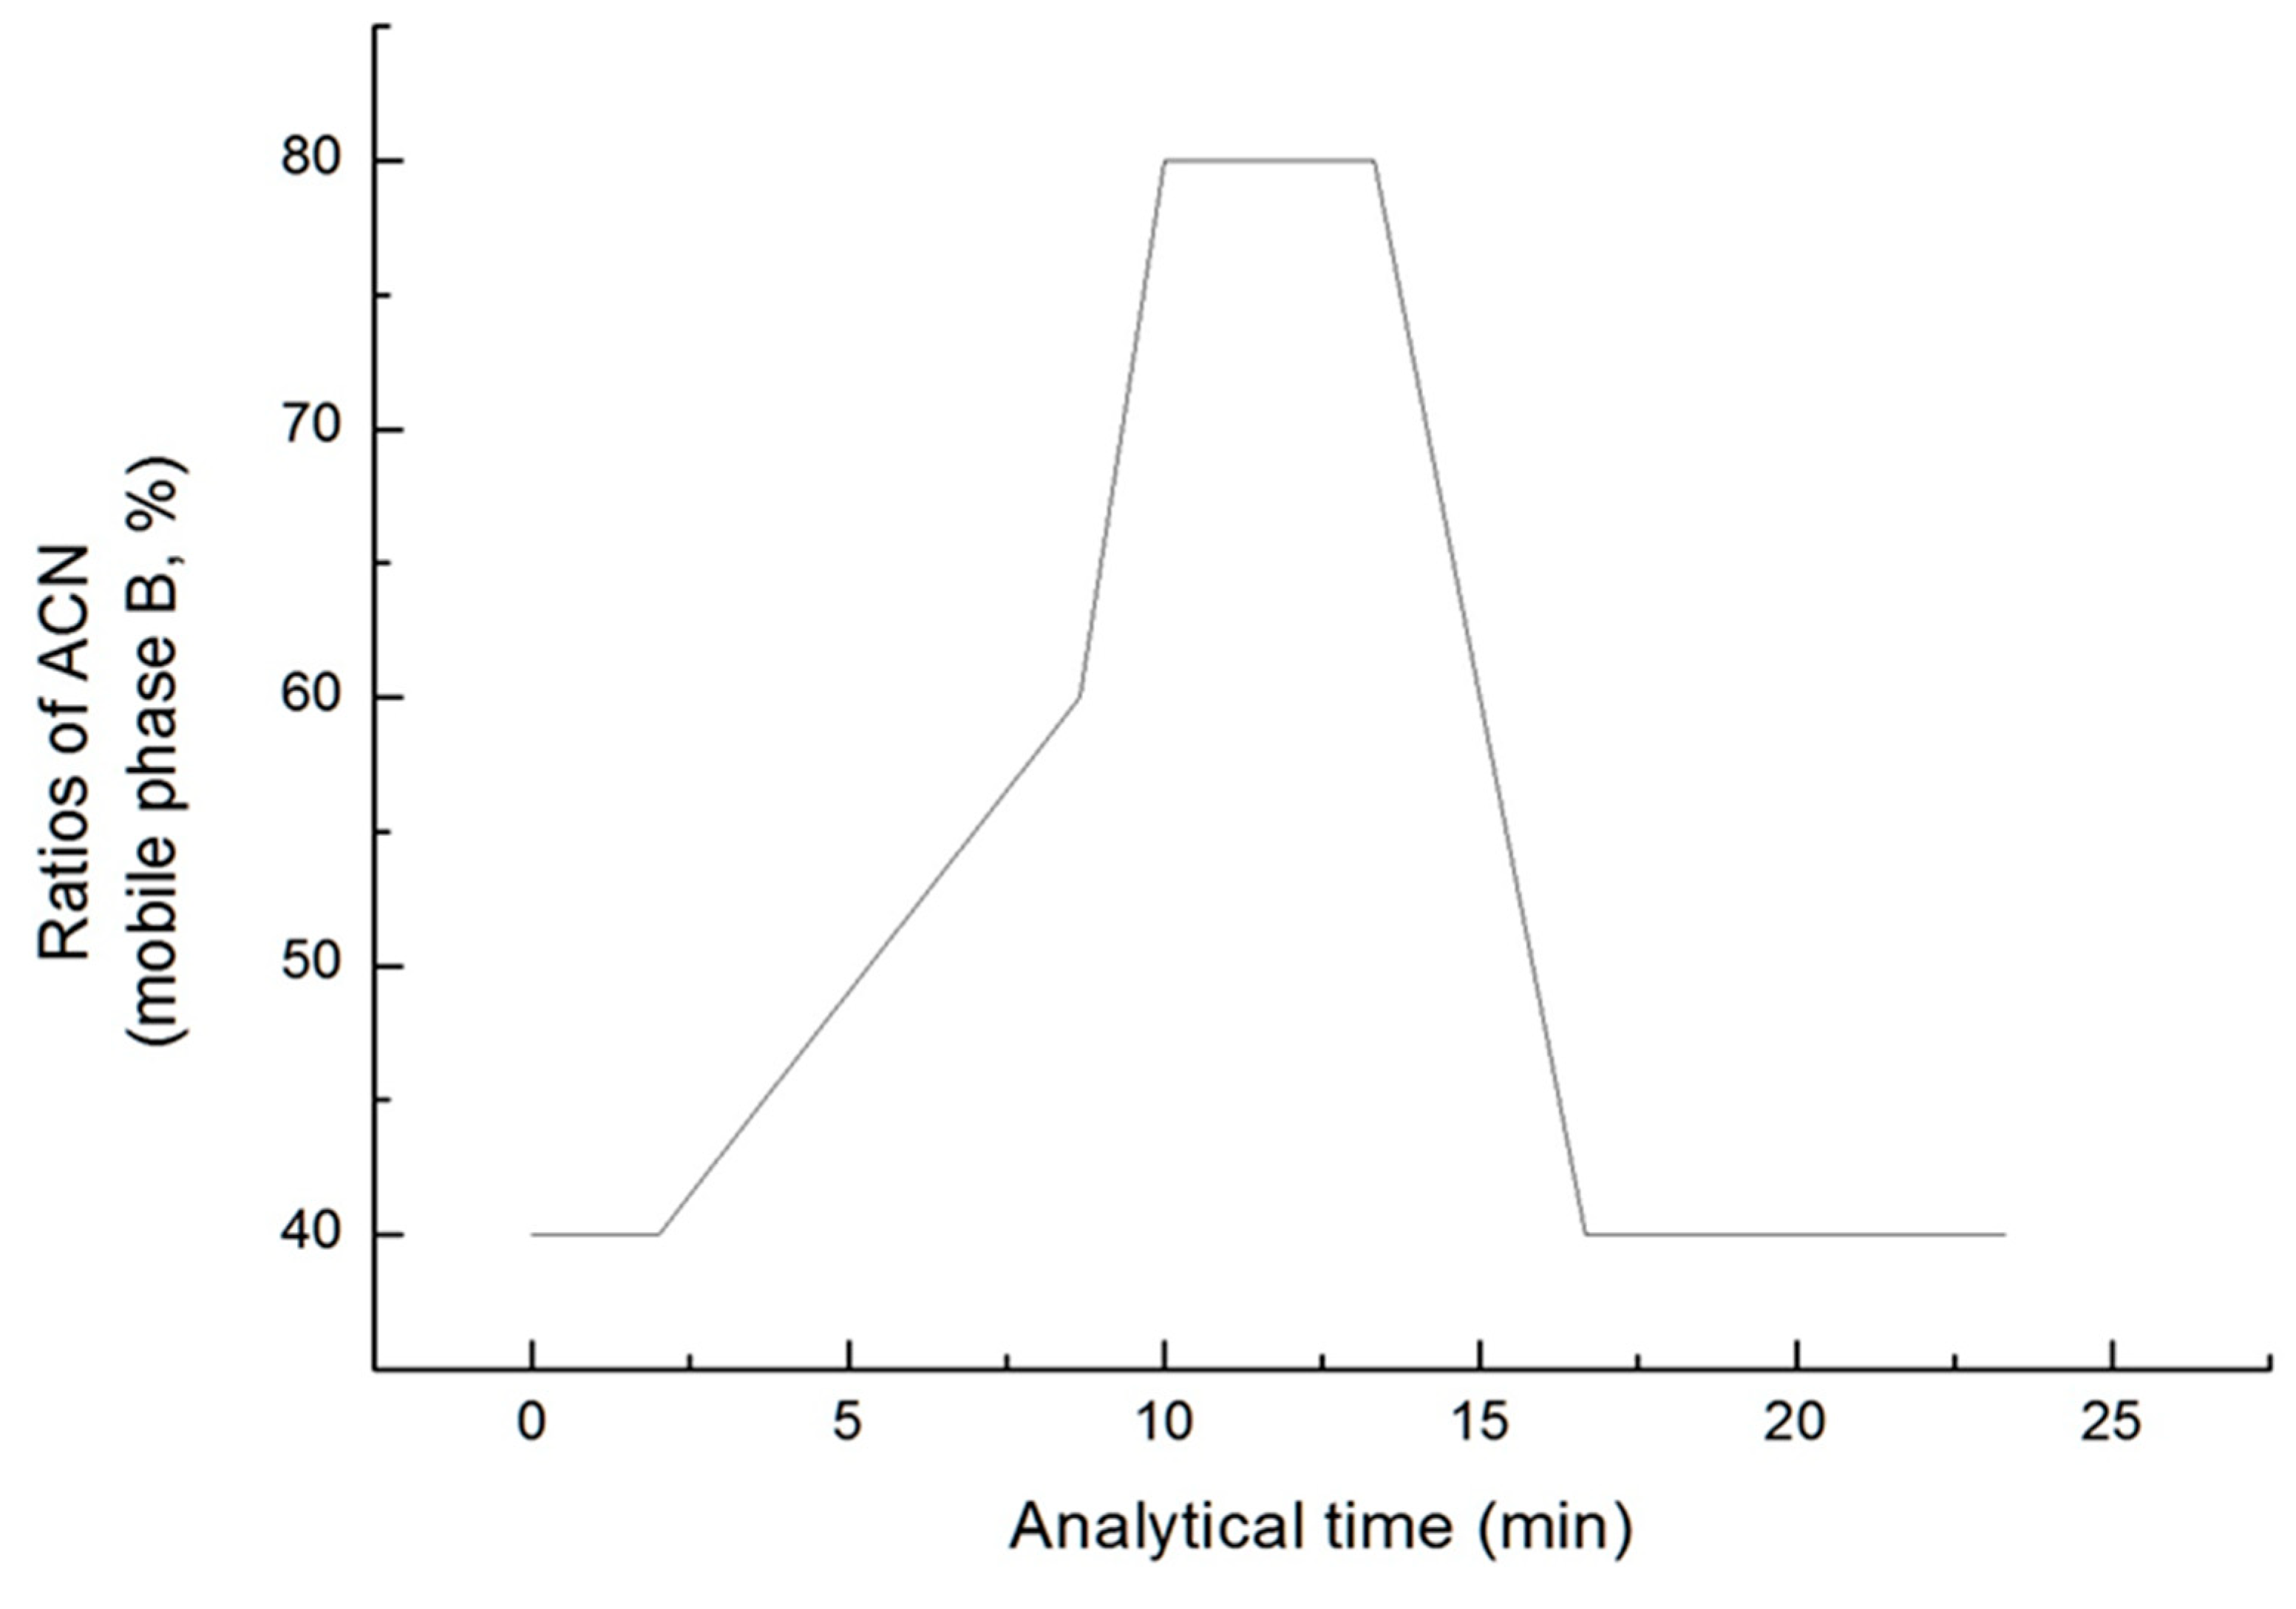
The conditions under which the five fatty acids are separated were selected by varying the composition ratio of the two mobile phases. The gradient condition of mobile phase B was maintained at a rate of 40% from 0 min to 2 min, and increased to a rate of 60% until 8.67 min. Then, it increased at a rate of 80% by 10 min and remained until 13.33 min. It was set under the condition that it was reduced by 40% until 16.67 min and maintain it until 23.33 min (
Figure 3). The total analysis time was 23.33 min and the injection volume was 10 μL.
2.6. Electrospray Ionization-Tandem Mass Spectrometry
The Mass spectrometer used was LCQ Fleet from Thermo Scientific (San Jose, CA, USA). The positive ion mode of electrospray ionization (ESI) was applied as the ionization method, and the mass analyzer used an ion trap. He gas was used as the collision gas, capillary temperature was 275 ℃, capillary voltage was 28 V, and ion spray voltage was 6.0 KV. The conditions of Liquid chromatography-mass spectrometry are summarized in
Table 1 as follows.
2.7. Optimization of ionization method
In order to compare the efficiency of effective ionization methods of fatty acids, 20 g/mL of TMAE-induced fatty acids was directly infused using electro spray ionization (ESI) and atmospheric pressure chemical ionization APCI. The sensitivity of m/z was compared and analyzed through
3. Results and Discussion
3.1. Performance of the derivatization
All five types of fatty acids, which are standard substances, react through all the same mechanisms, and [M]
+ ion is observed at an m/z of 89 Da, which is the molecular weight of fatty acid plus the TMAE group. During MS/MS analysis, it has an m/z value of [M-59]
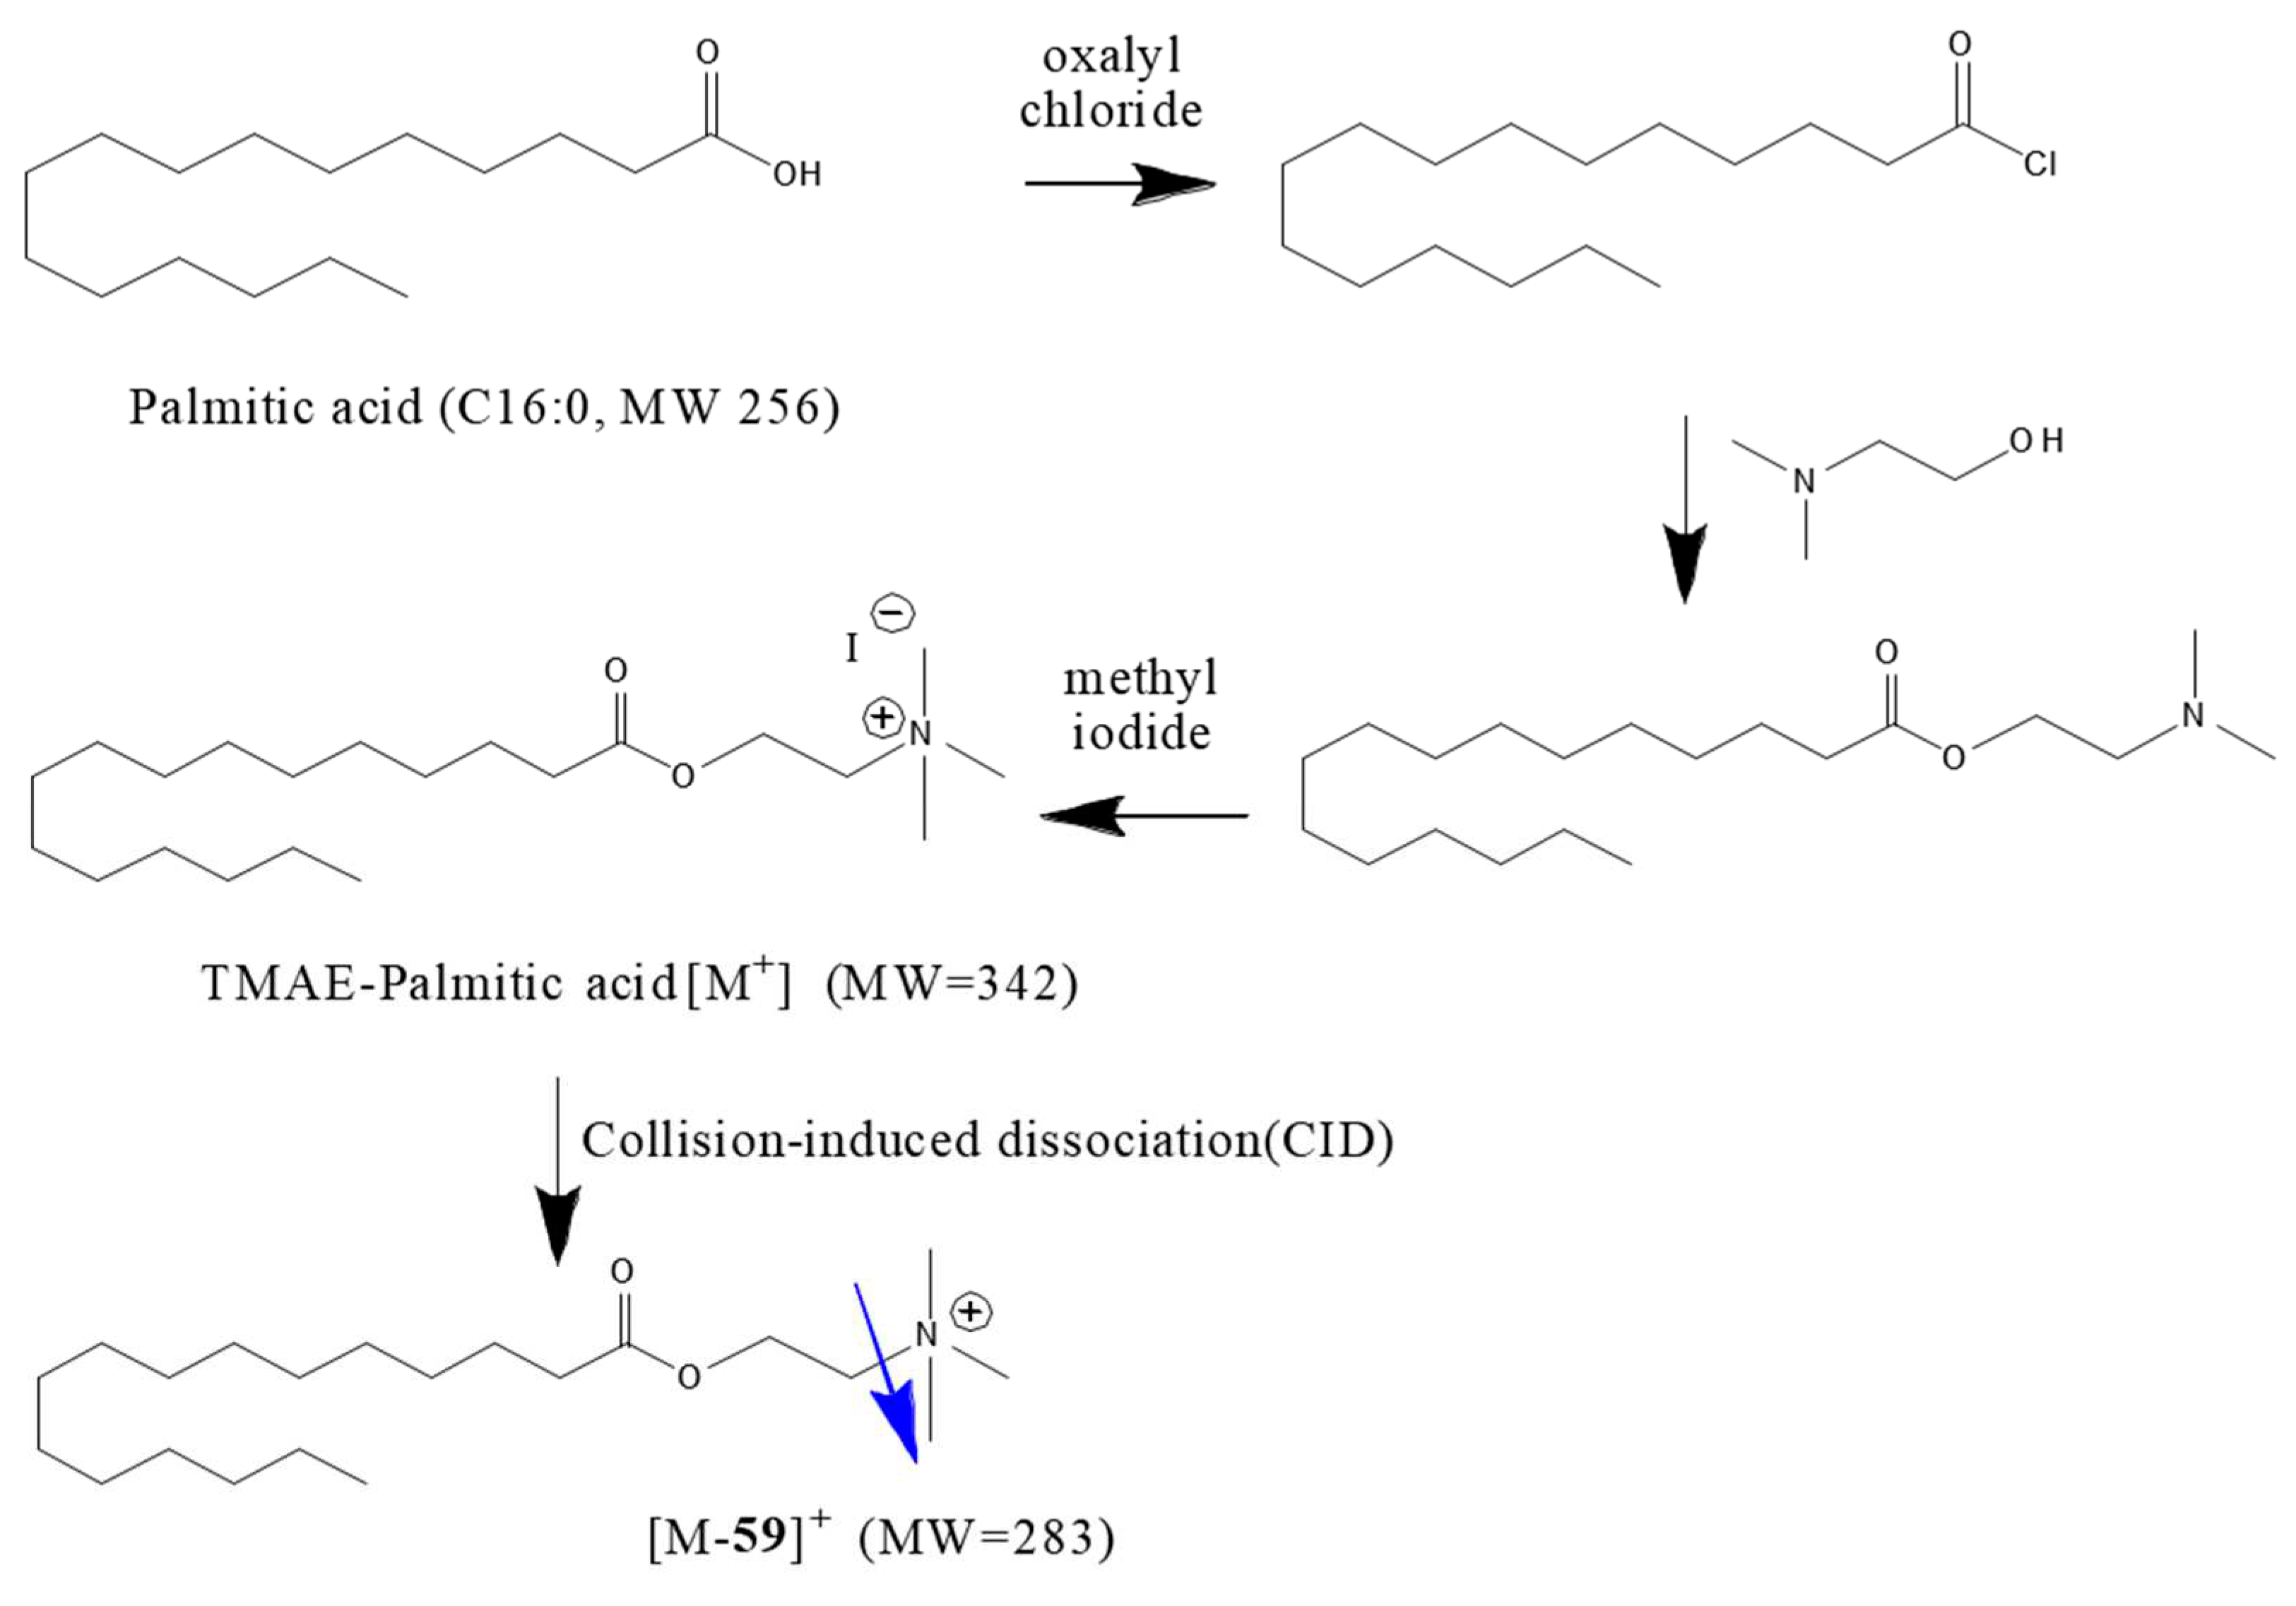
+ where the trimethylamine group is split due to collision energy, enabling useful quantitative analysis.
Figure 4 shows the derivatization reaction scheme of PA.
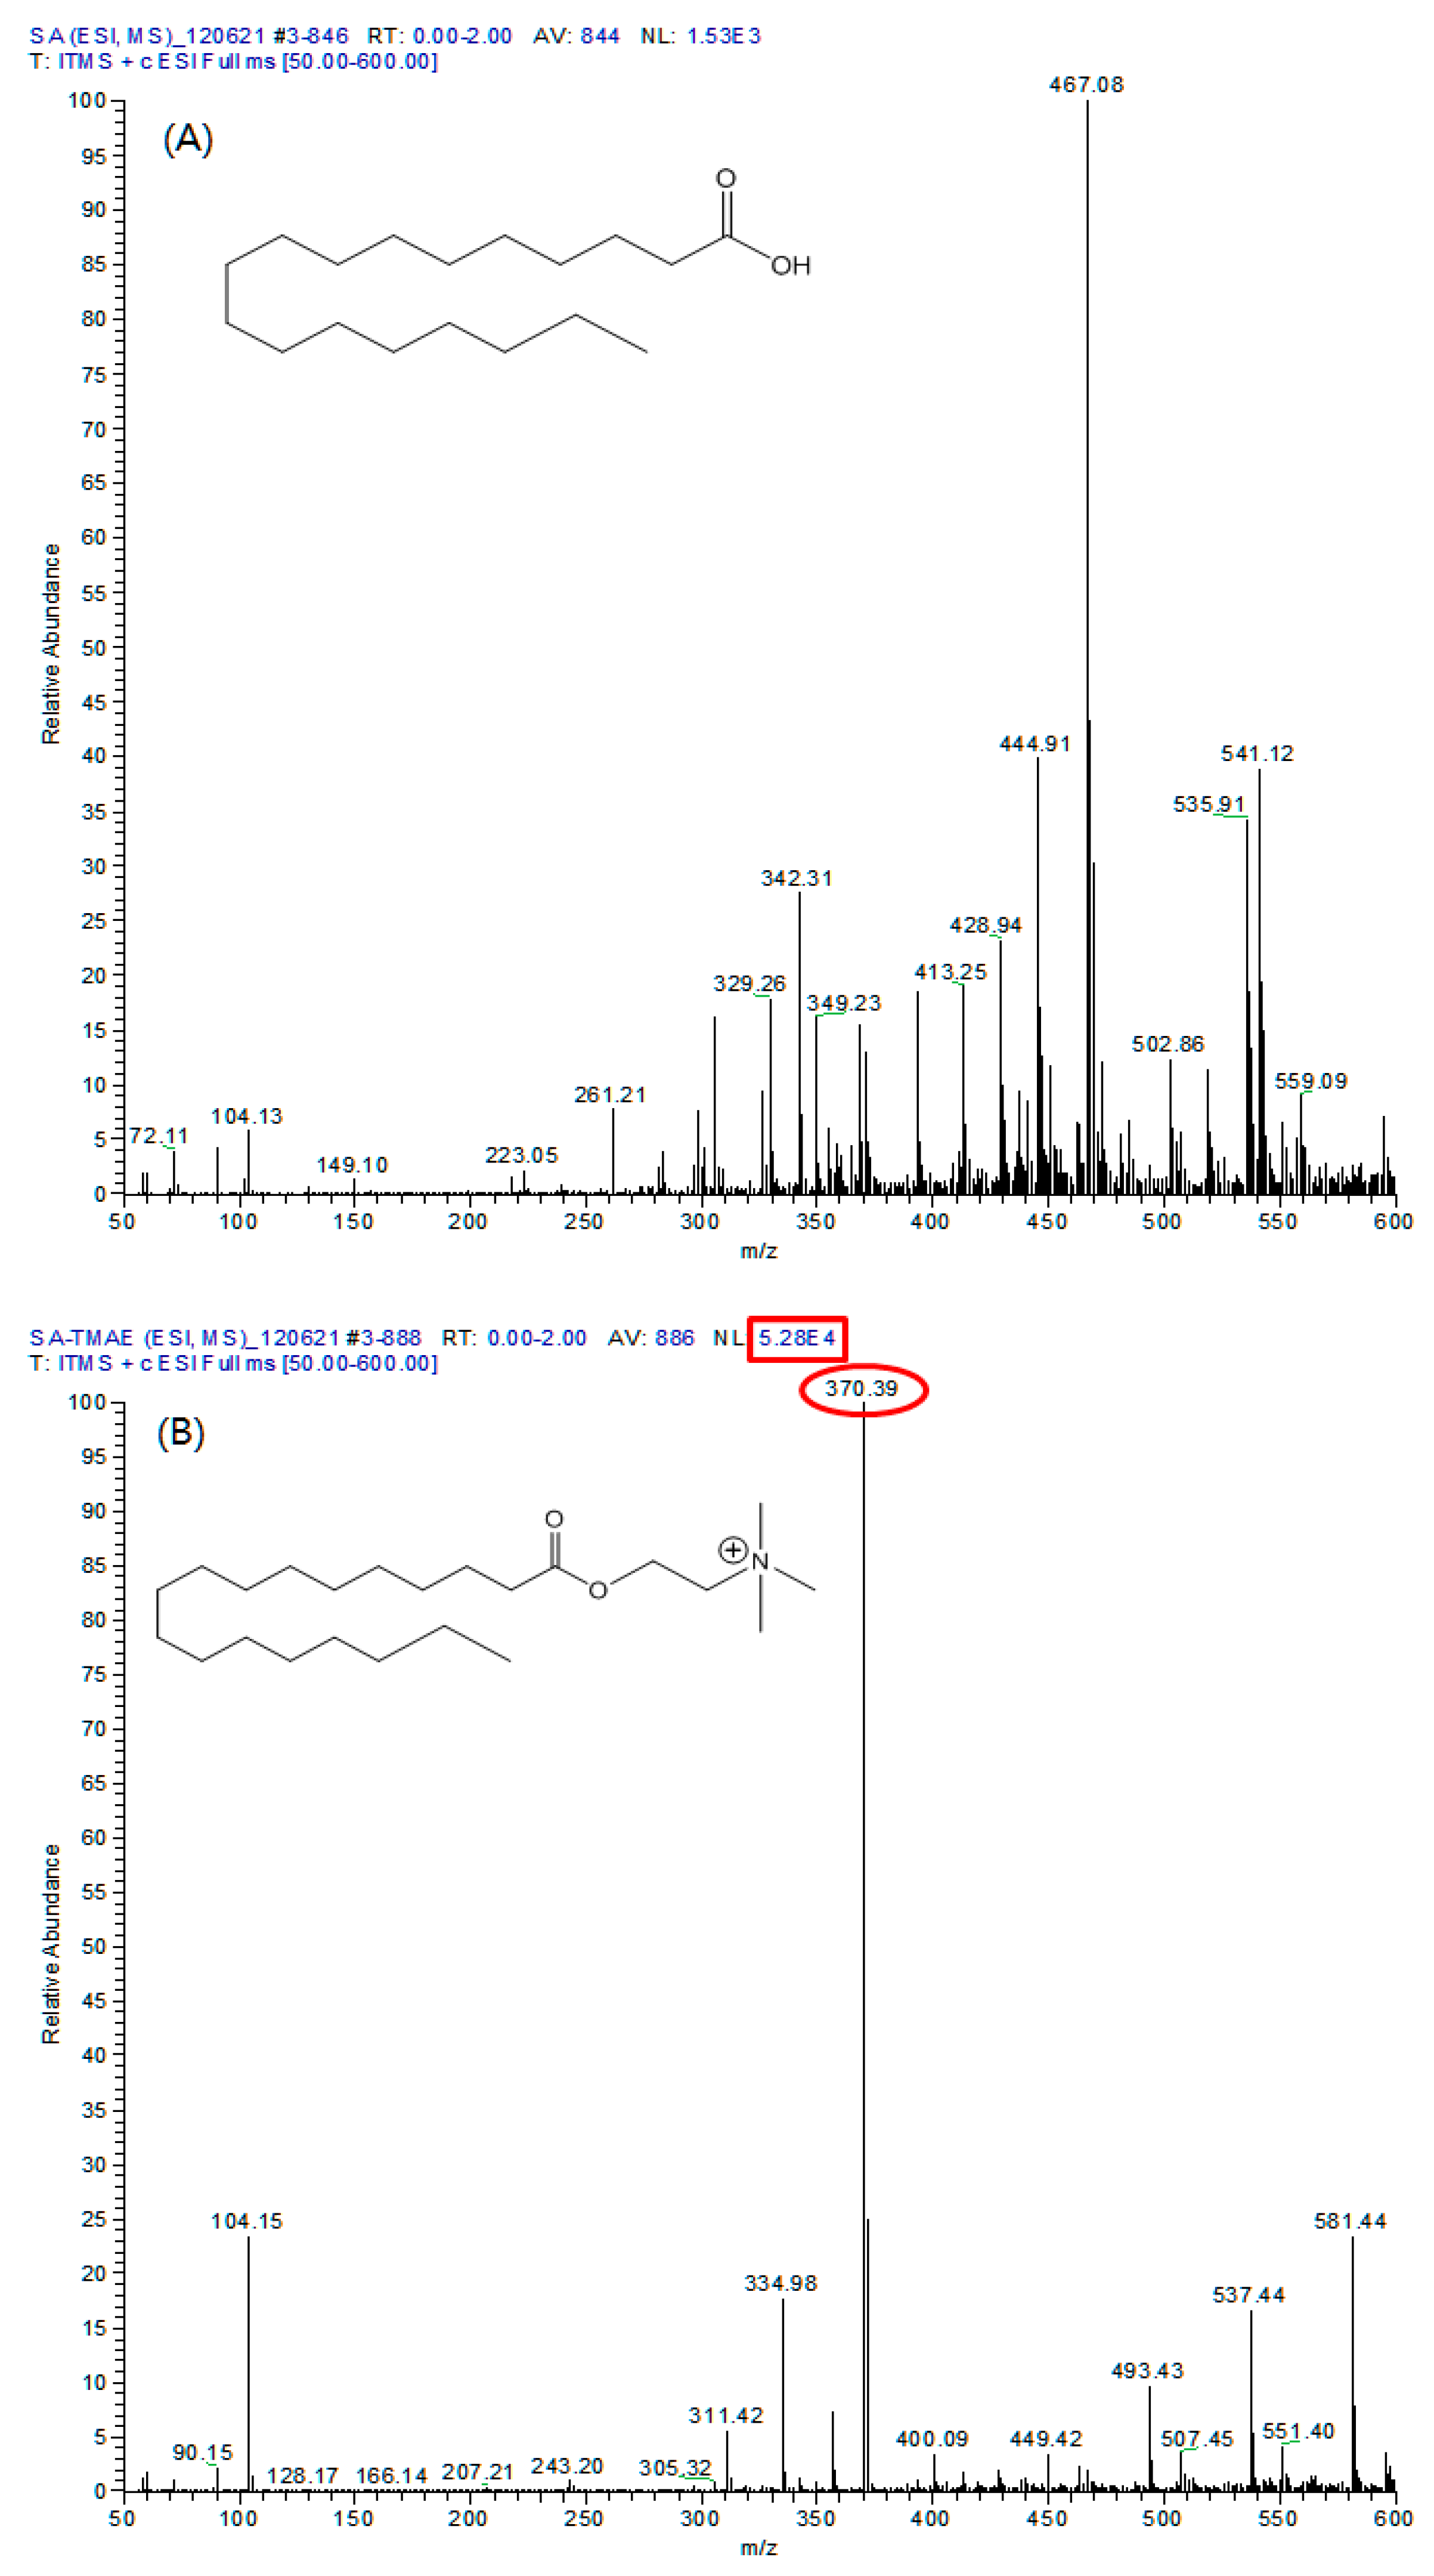
As a result of comparing the full mass of 20 μg/mL SA standard material and the derived TMAE-SA using ESI, the [M+H]
+ ion of SA at m/z 285, and addition ions such as [M+Na]
+ and [M+K]
+ at m/z 307 and 323 were also not observed (
Figure 5A).
However, in the full mass spectrum of TMAE-SA, m/z 370, the [M+H]+ of TMAE-SA was confirmed, and the relative abundance of ions also showed a high signal of 5.28 x 10⁴. The same results were confirmed for fatty acids other than SA, and fatty acid analysis using LC/ESI-MS/MS could secure signals sufficient for quantitative analysis through this derivatization process.
3.2. Optimization of ionization method – ESI versus APCI
In this study, electrospray ionization (ESI) and atmospheric pressure chemical ionization (APCI) were used to compare the ionization pattern and highest intensity of molecular ions of TMAE-SA according to the ionization methods.
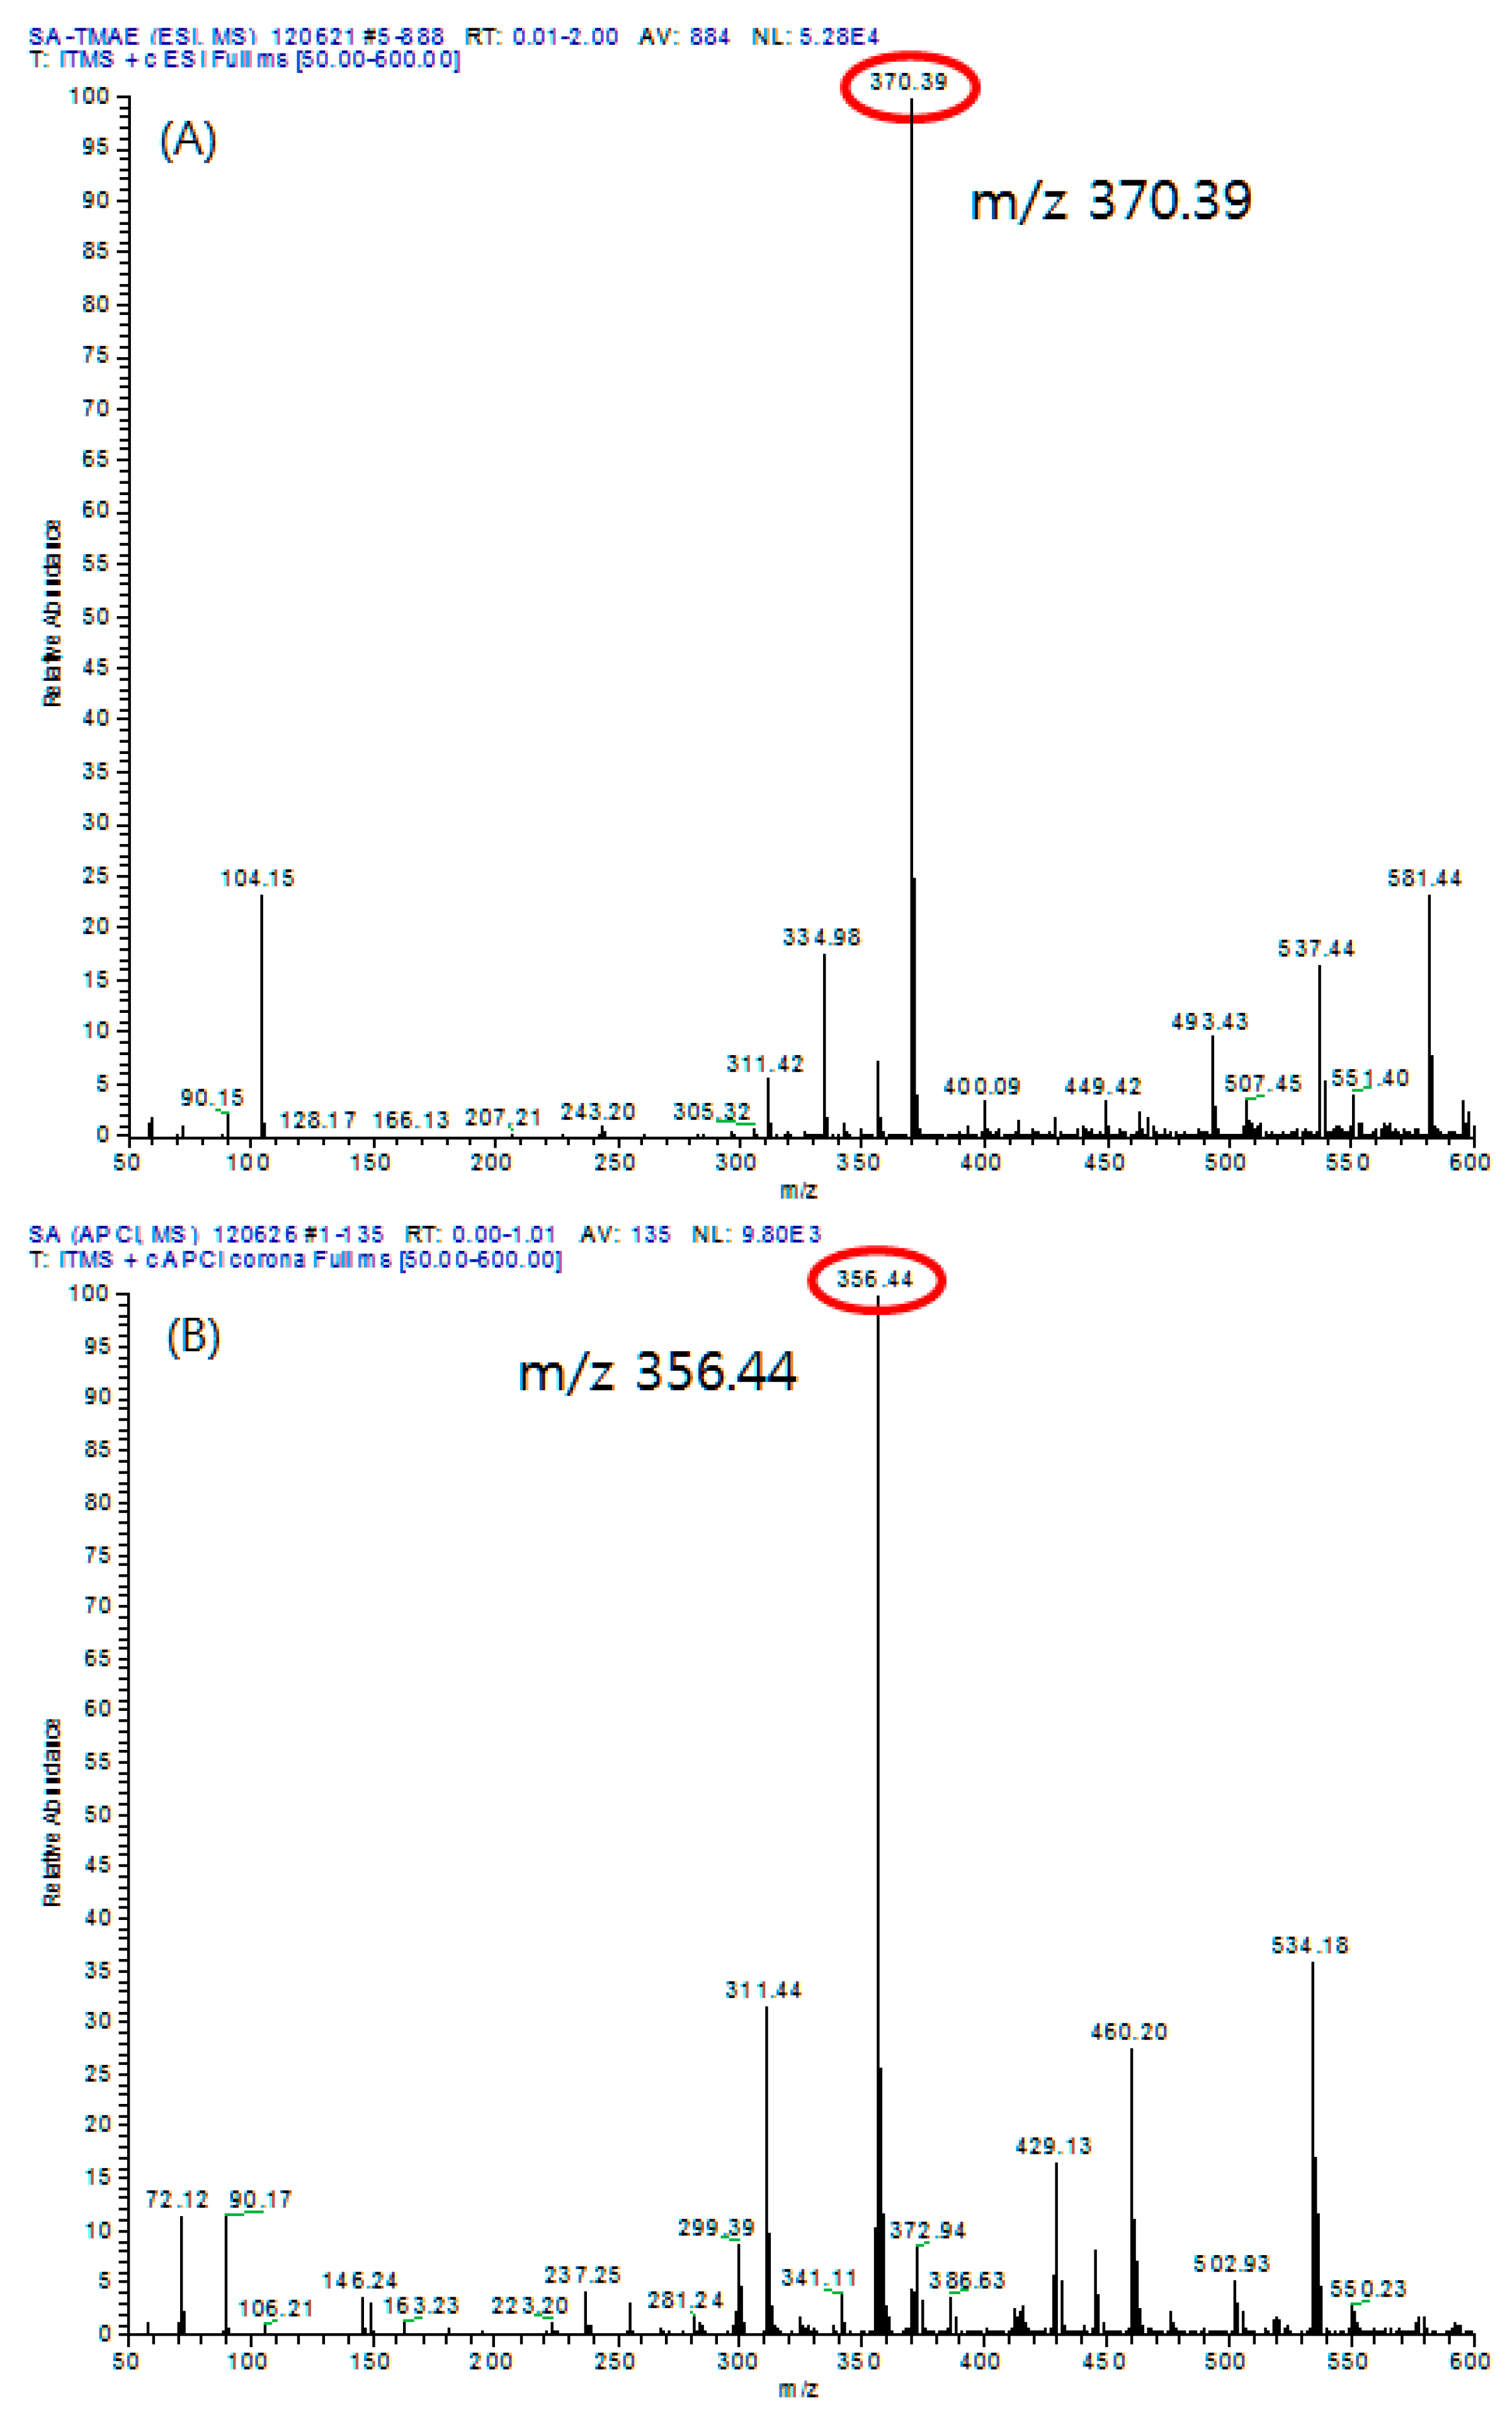
As a result of analyzing 20 μg/mL of derived TMAE-SA with APCI, no molecular ions were observed and the higher intensity showed a relative abundance of 9.80×10
3. On the other hand, analyzing TMAE-SA of the same concentration with ESI showed that molecular ions were observed and relative abundance showed a sensitivity of 5.28 × 10
4, indicating that the ESI method was more useful (
Figure 6).
Therefore, in this study, ESI was chosen as the ionization method for fatty acid analysis.
3.3. Optimized conditions of mass spectrometry
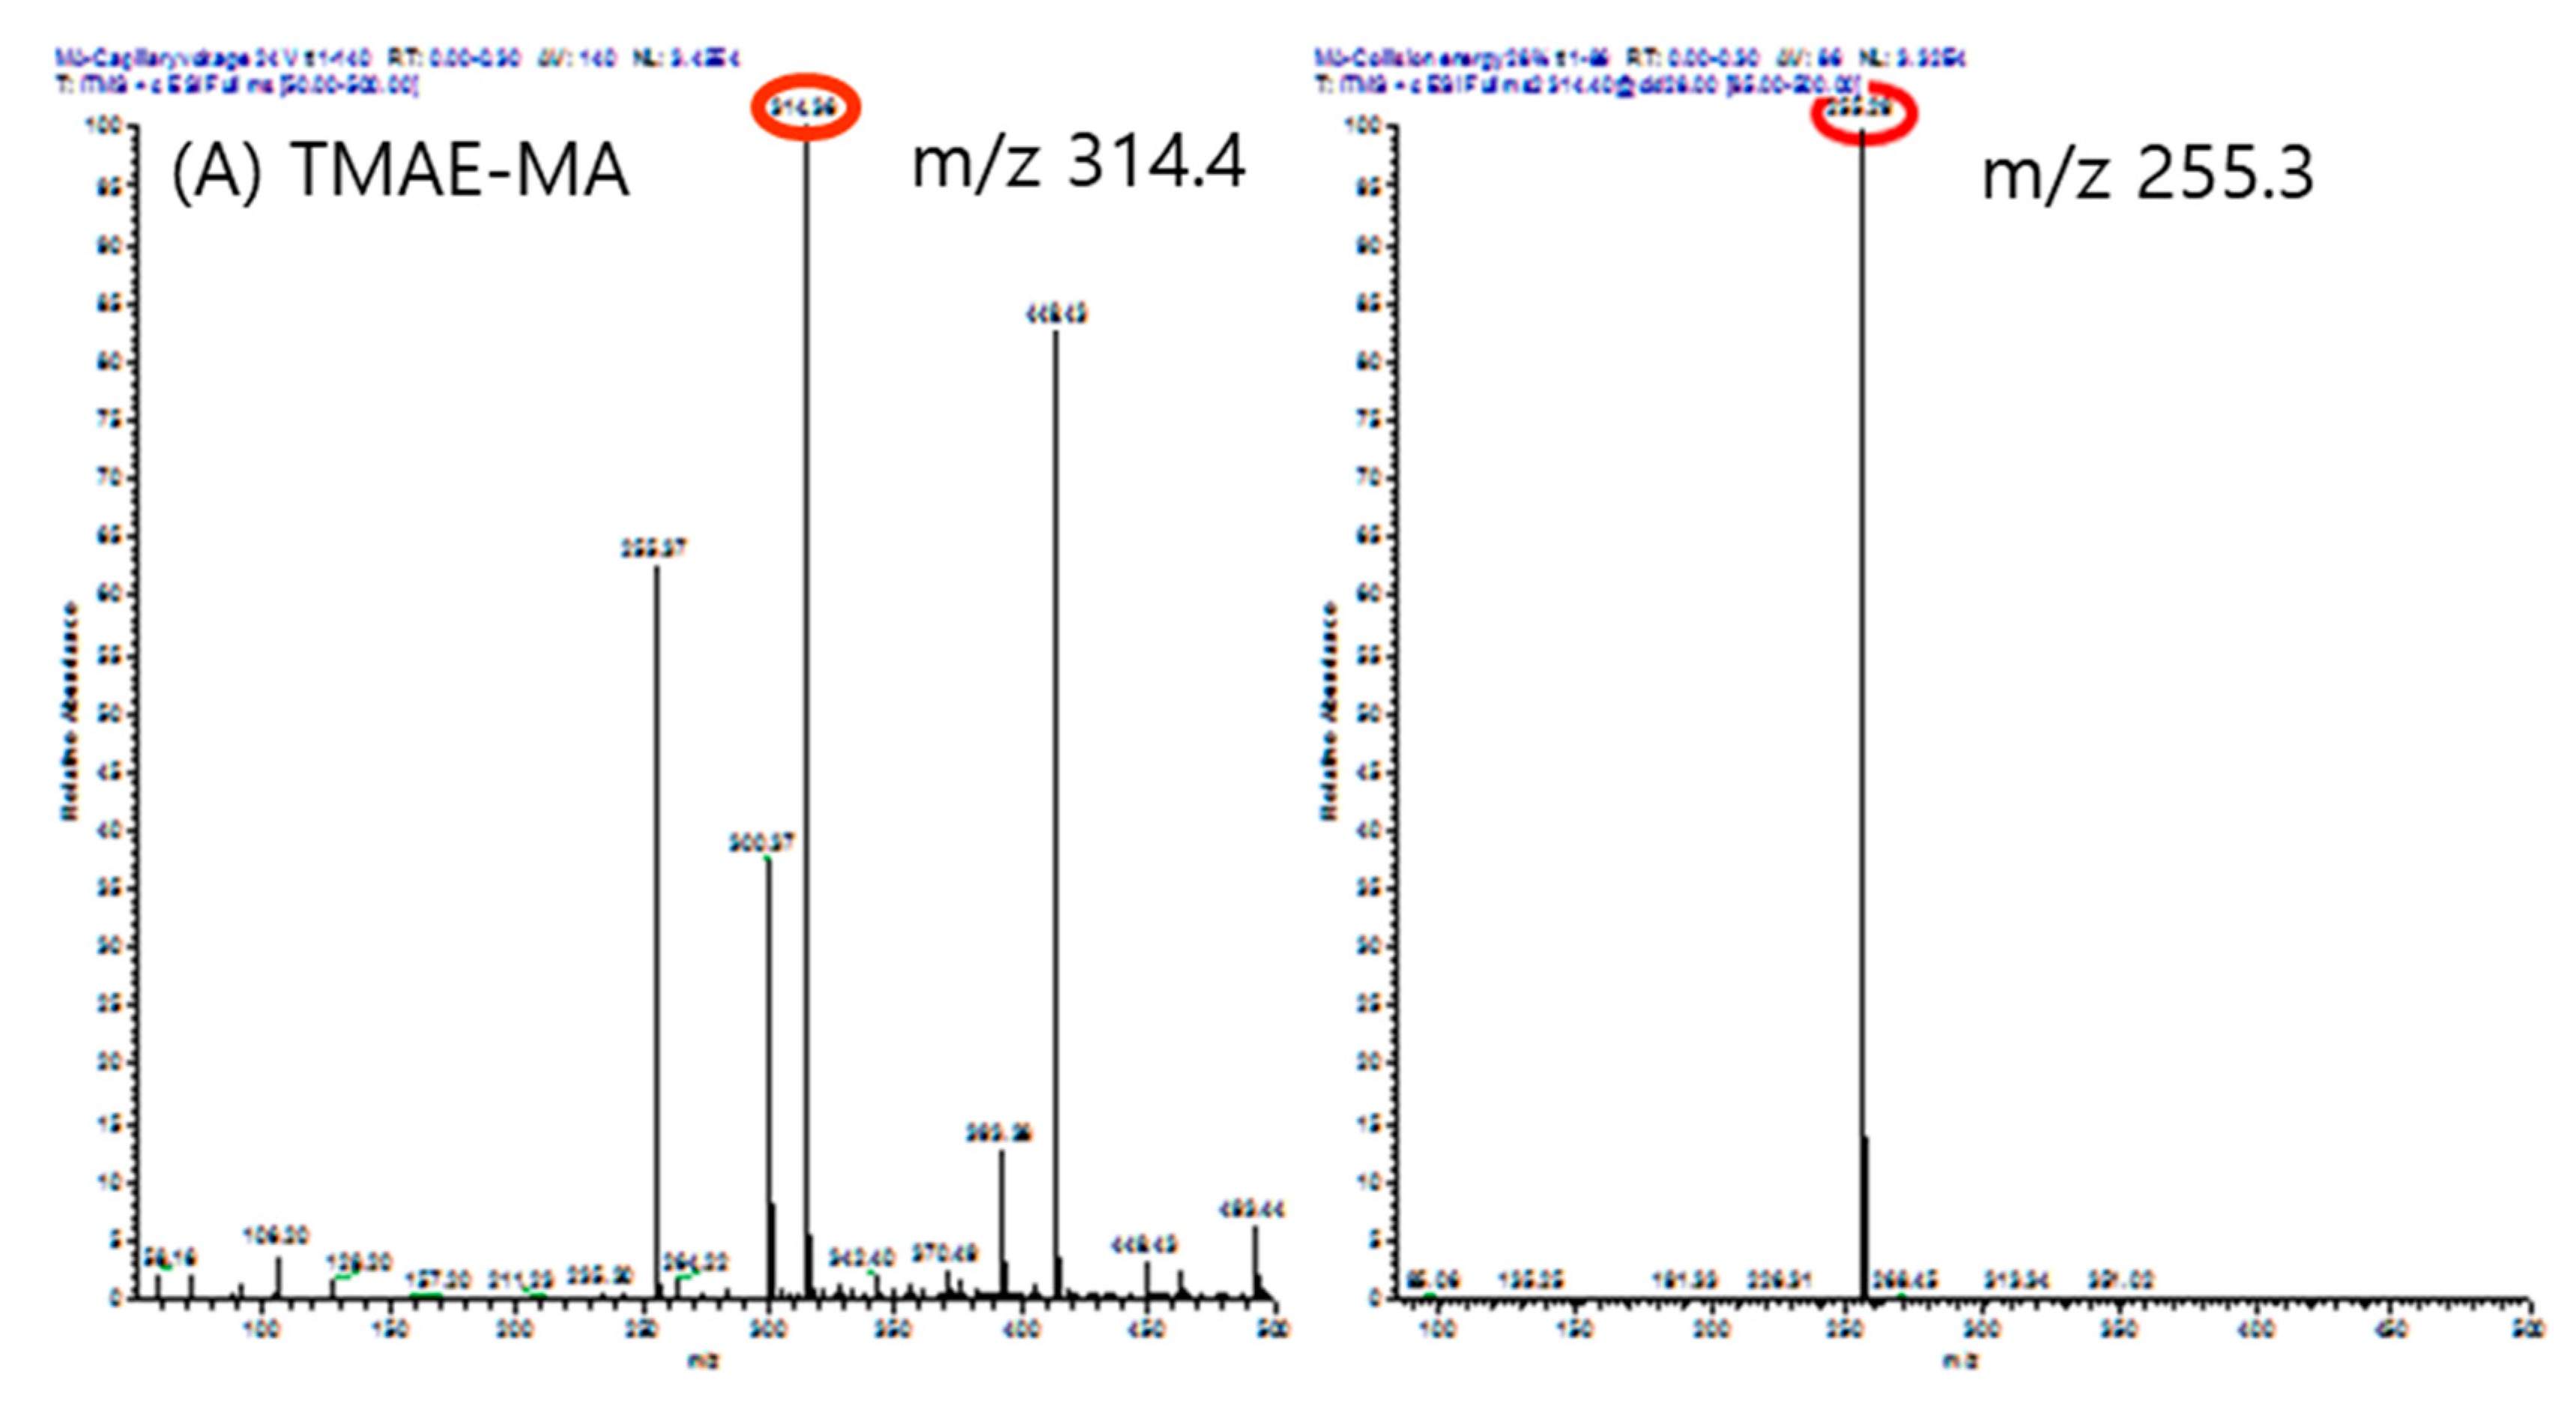
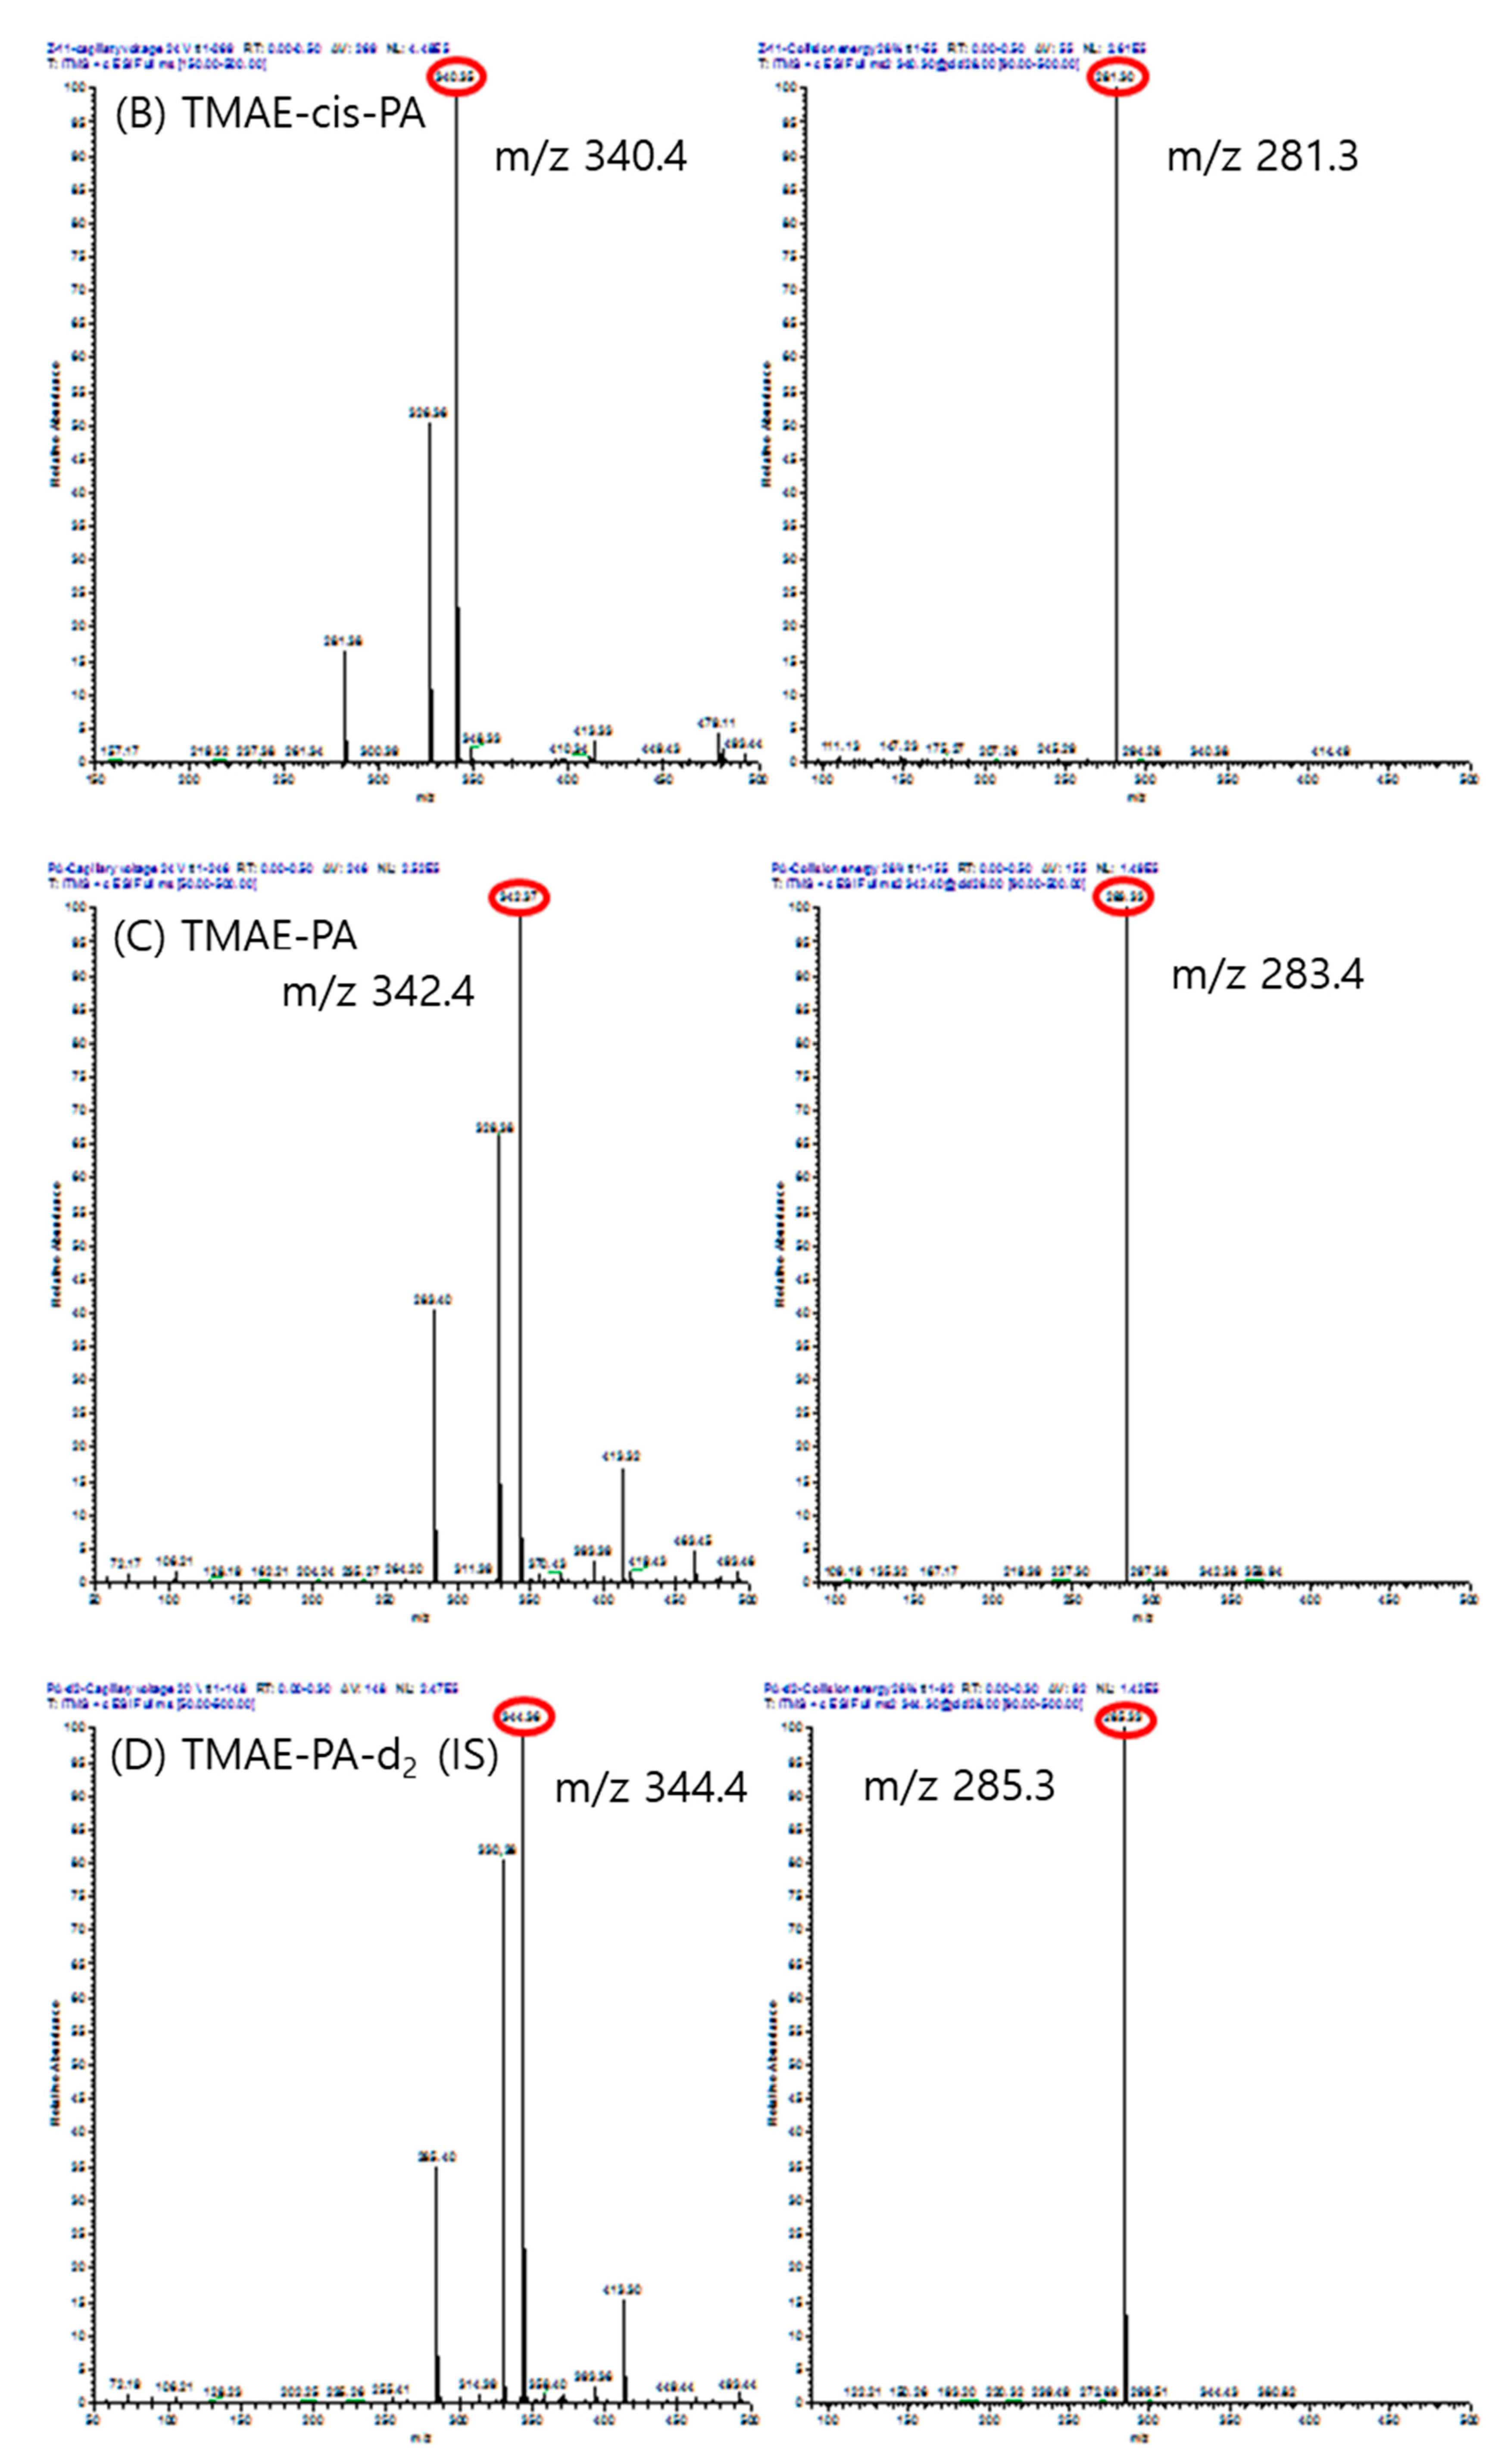
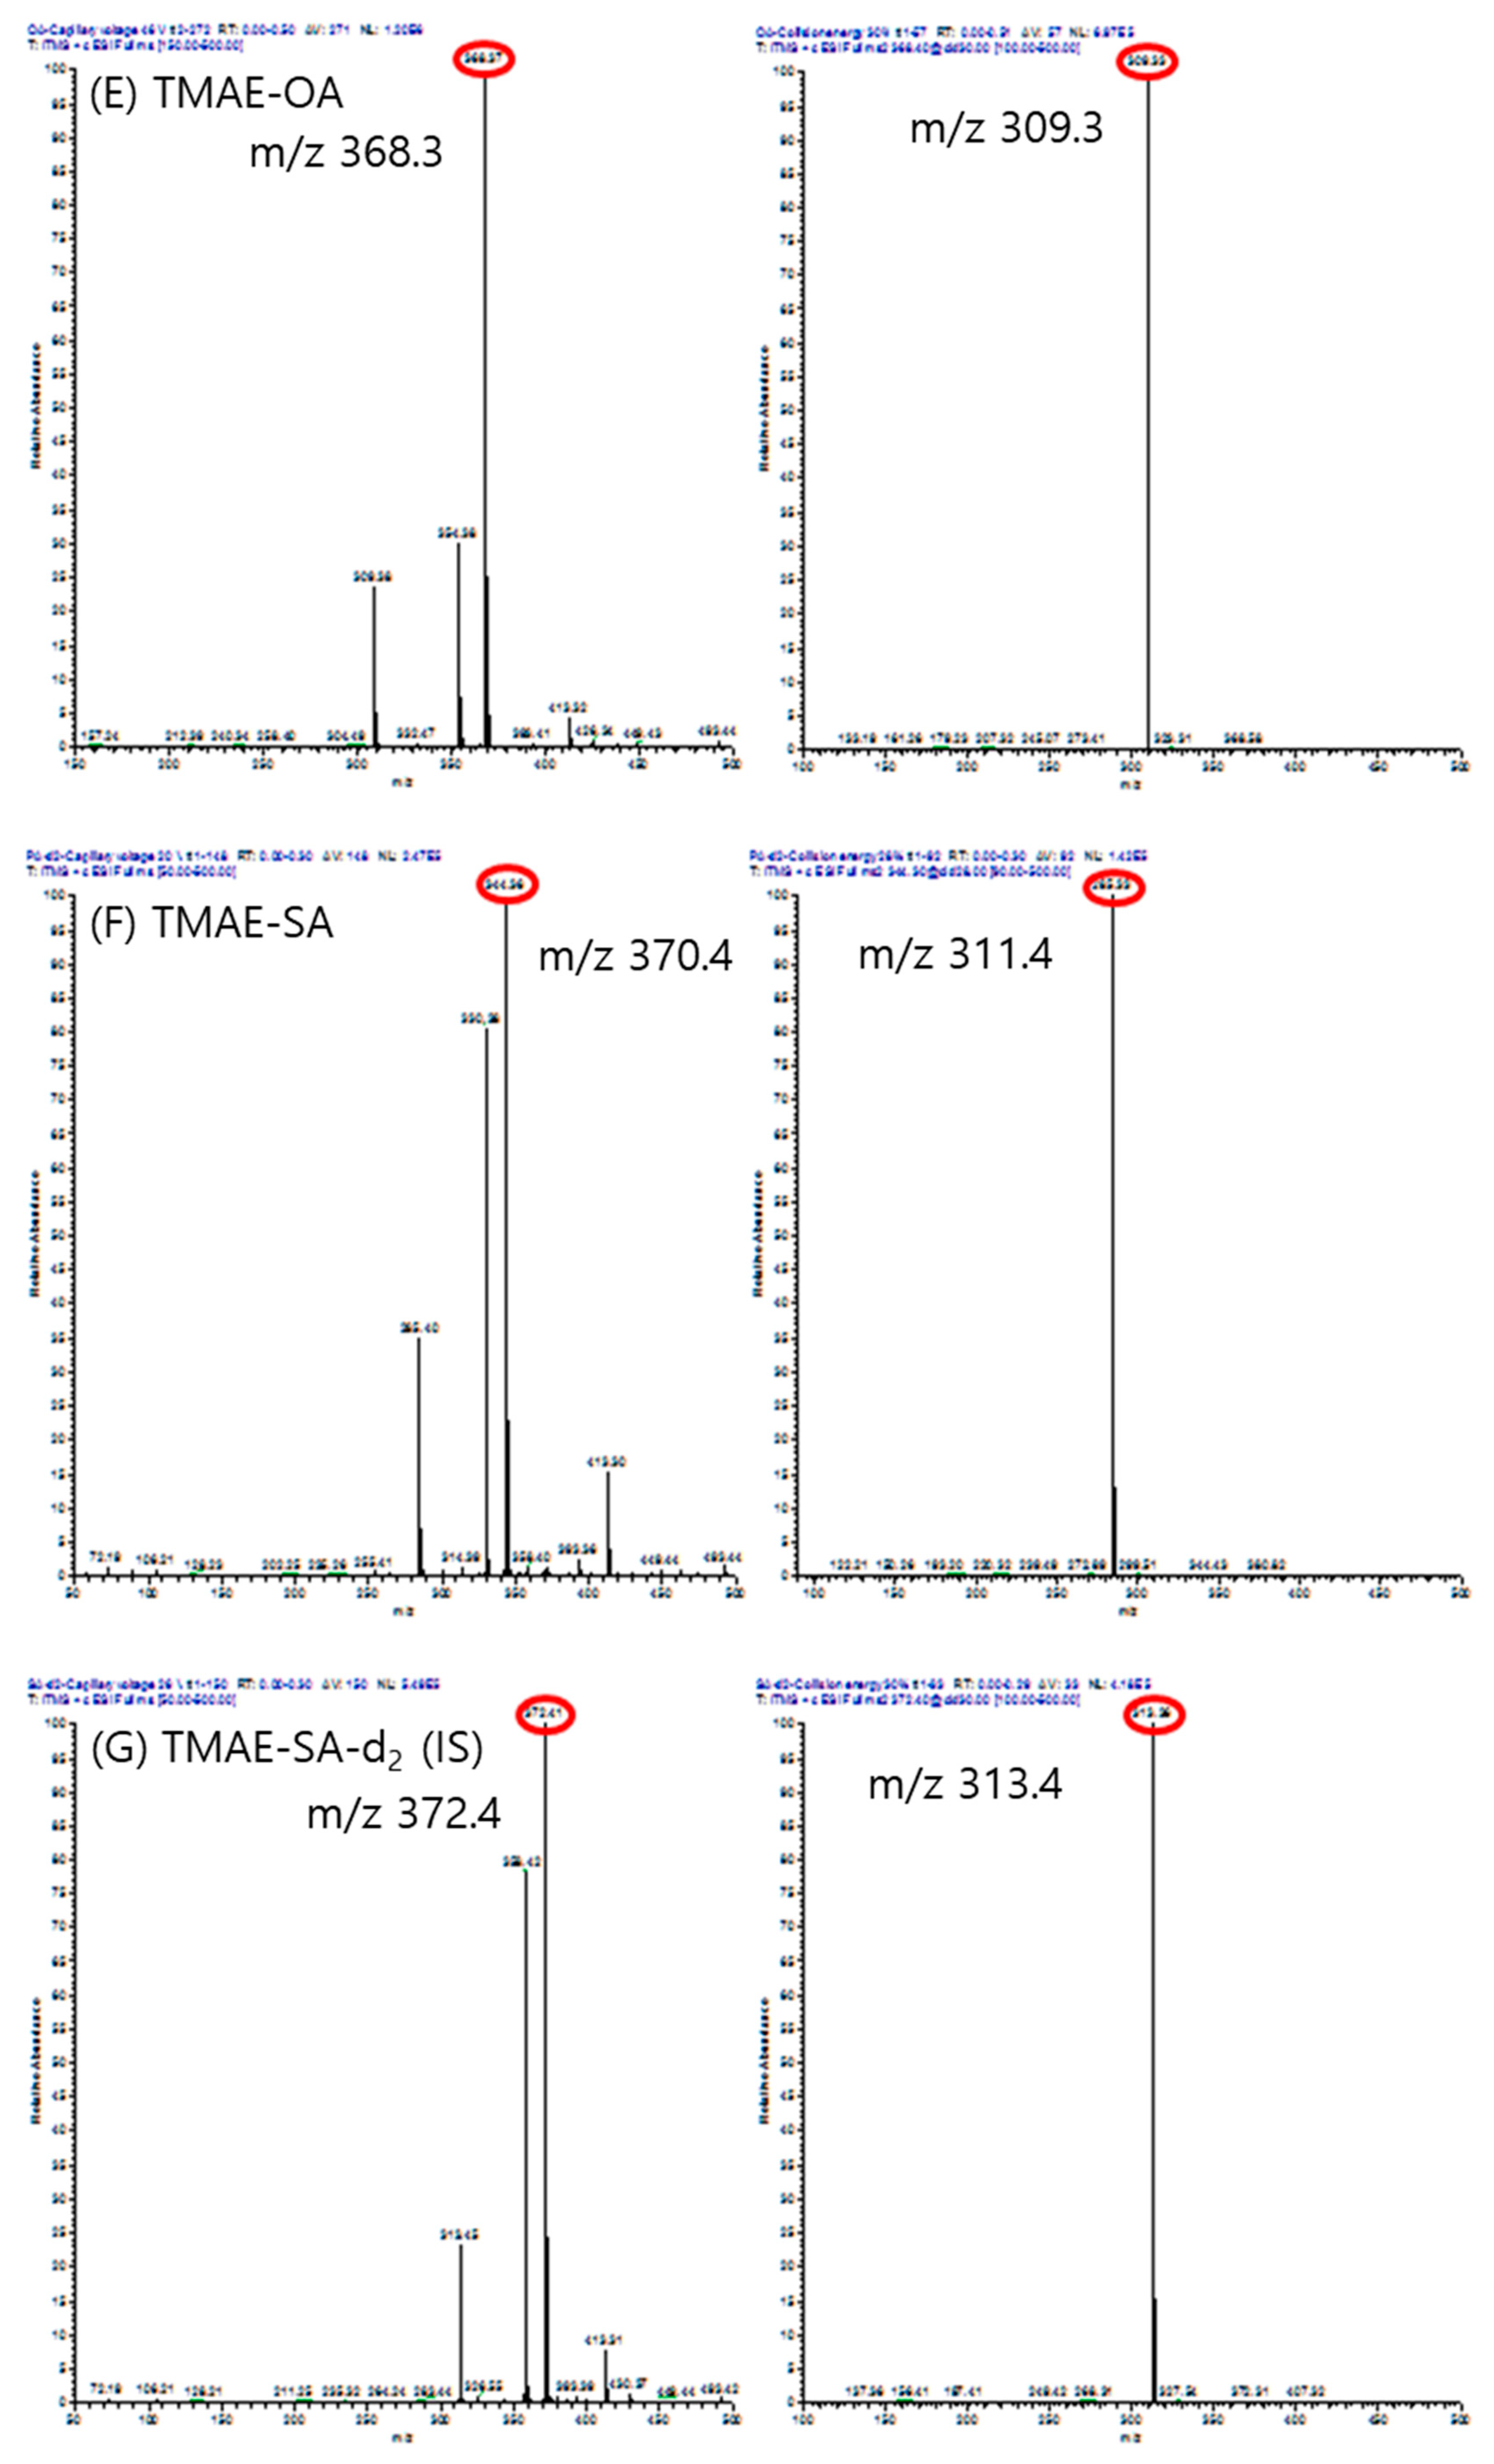
Table 2 shows the multiple reaction monitoring (MRM) conditions that set conditions to have optimized mass values of five types of TMAE-derivatized standards and internal standards. Ion spray voltage and capillary voltage of precursor ions with the highest intensity of each TMAE derivatized fatty acid were determined.
After going through the derivatization step using the 20 μg/mL standard solution of each substance using the method mentioned above, the full scan spectrum of each chemical substance was obtained to determine the m/z of the precursor ion. After fixing one of the ion spray voltage or capillary voltage, by changing another parameter, the conditions under which the precursor ion of the analyte showed the highest intensity were determined.
In order to determine the fragment pattern and collision energy of each chemical substance, the m/z of the product ion is determined from the m/z of the selected precursor ion through the full scan spectrum, and the collision energy with the most optimized value of the m/z of the product ion was optimized.
MRM conditions are shown in
Table 2. In addition, the peak of molecular ions and fragment ions obtained as a result of analyzing the mass spectrum of the standard materials and the internal standard under the MRM conditions below is shown in
Figure 7.
3.4. Optimized conditions of liquid chromatography
The separation conditions of LC were optimized so that all peaks had good separation and sensitivity under the optimized MRM conditions. Using a 2 μg/mL mixed standard solution (Cocktail solution), the mobile phase condition was set up with various gradient elution changes to HPLC-grade acetonitrile containing 5 mM ammonium acetate and HPLC-grade water.
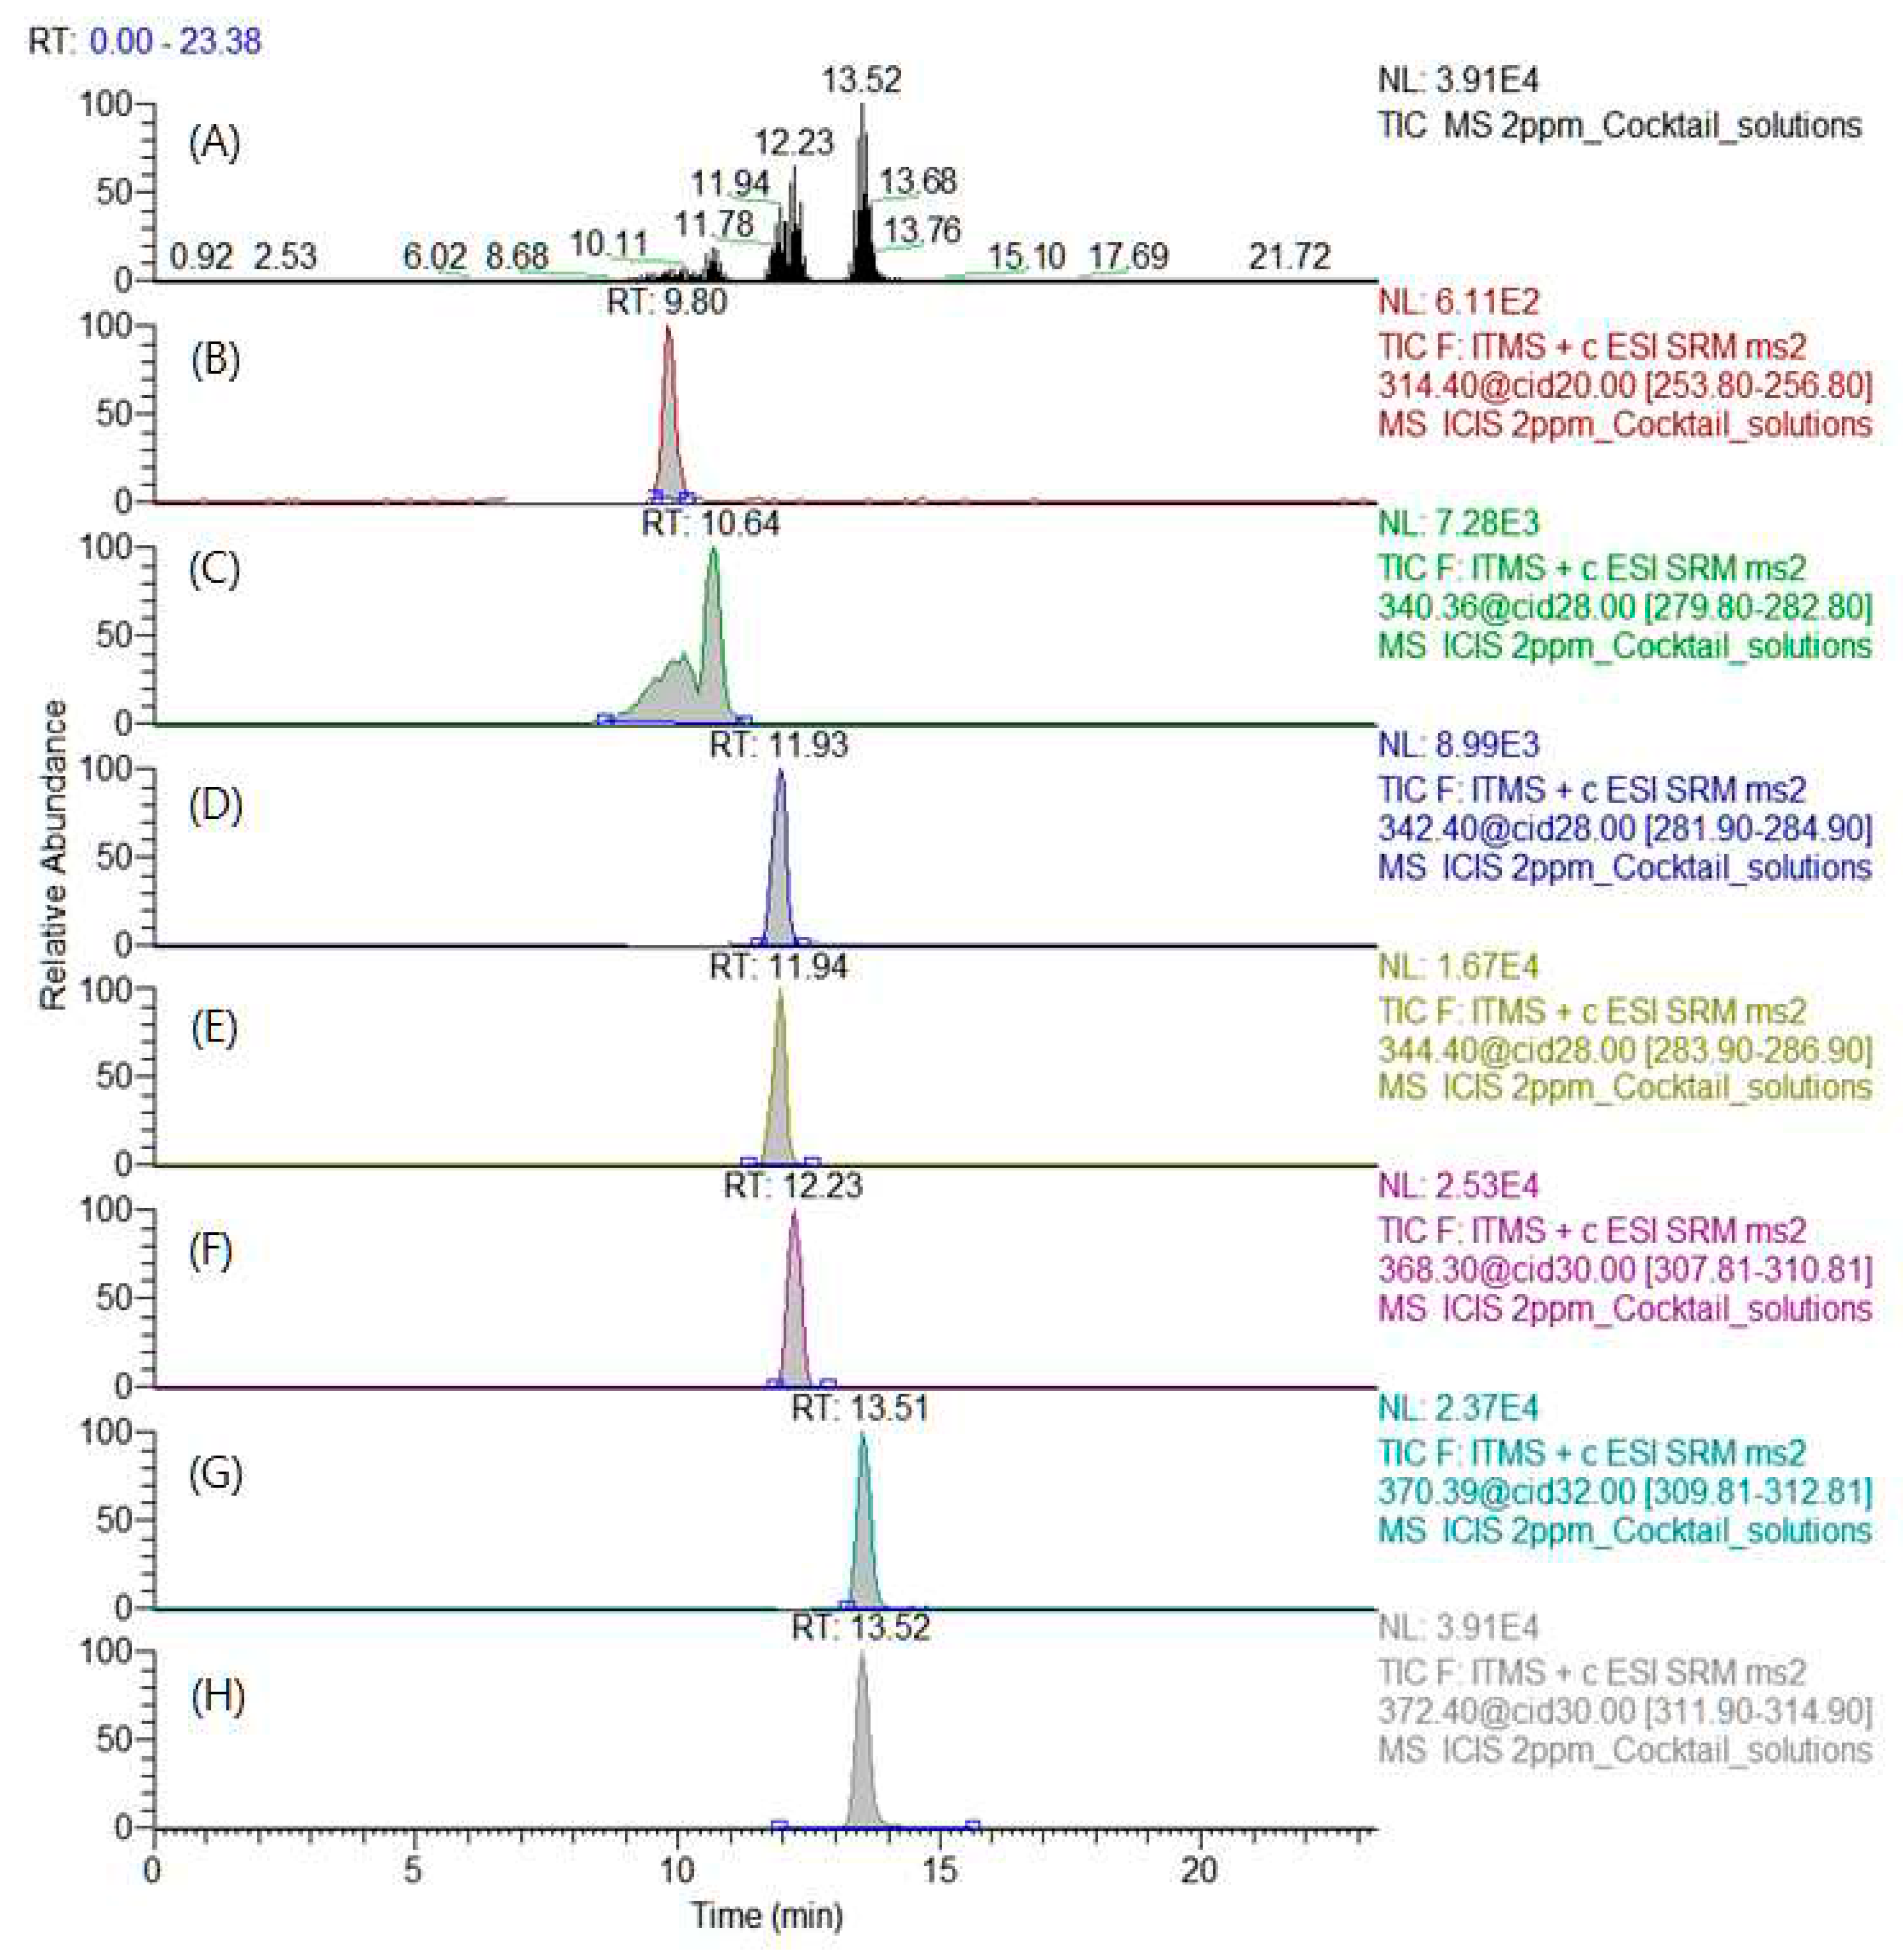
The mobile phase solvent composition was selected to maximize the difference in the retention time between the two substances, because the overlap of MA and cis-PA and the retention time of PA and OA were not completely separated. In this way, even if the retention time is not completely separated, the possibility of quantitative analysis was confirmed by obtaining an MRM chromatogram using the MRM transition pattern of mass spectrometry. The total ion chromatogram and MRM chromatogram of derivatized standards and internal standard are shown in
Figure 8.
3.5. Optimization of derivatization depending on reaction conditions
In this study, a cocktail solution containing 20 μg/mL of fatty acid standards and internal standard was used to find the conditions that maximize the efficiency of TMAE derivatization of fatty acids. The TMAE-fatty acid derivatization step consists of a three-step reaction as shown in the experimental section.
In the first reaction, the hydroxyl group (-OH) of the carboxyl group (-COOH) of fatty acid is replaced with chlorine (-Cl) using oxalyl chloride.
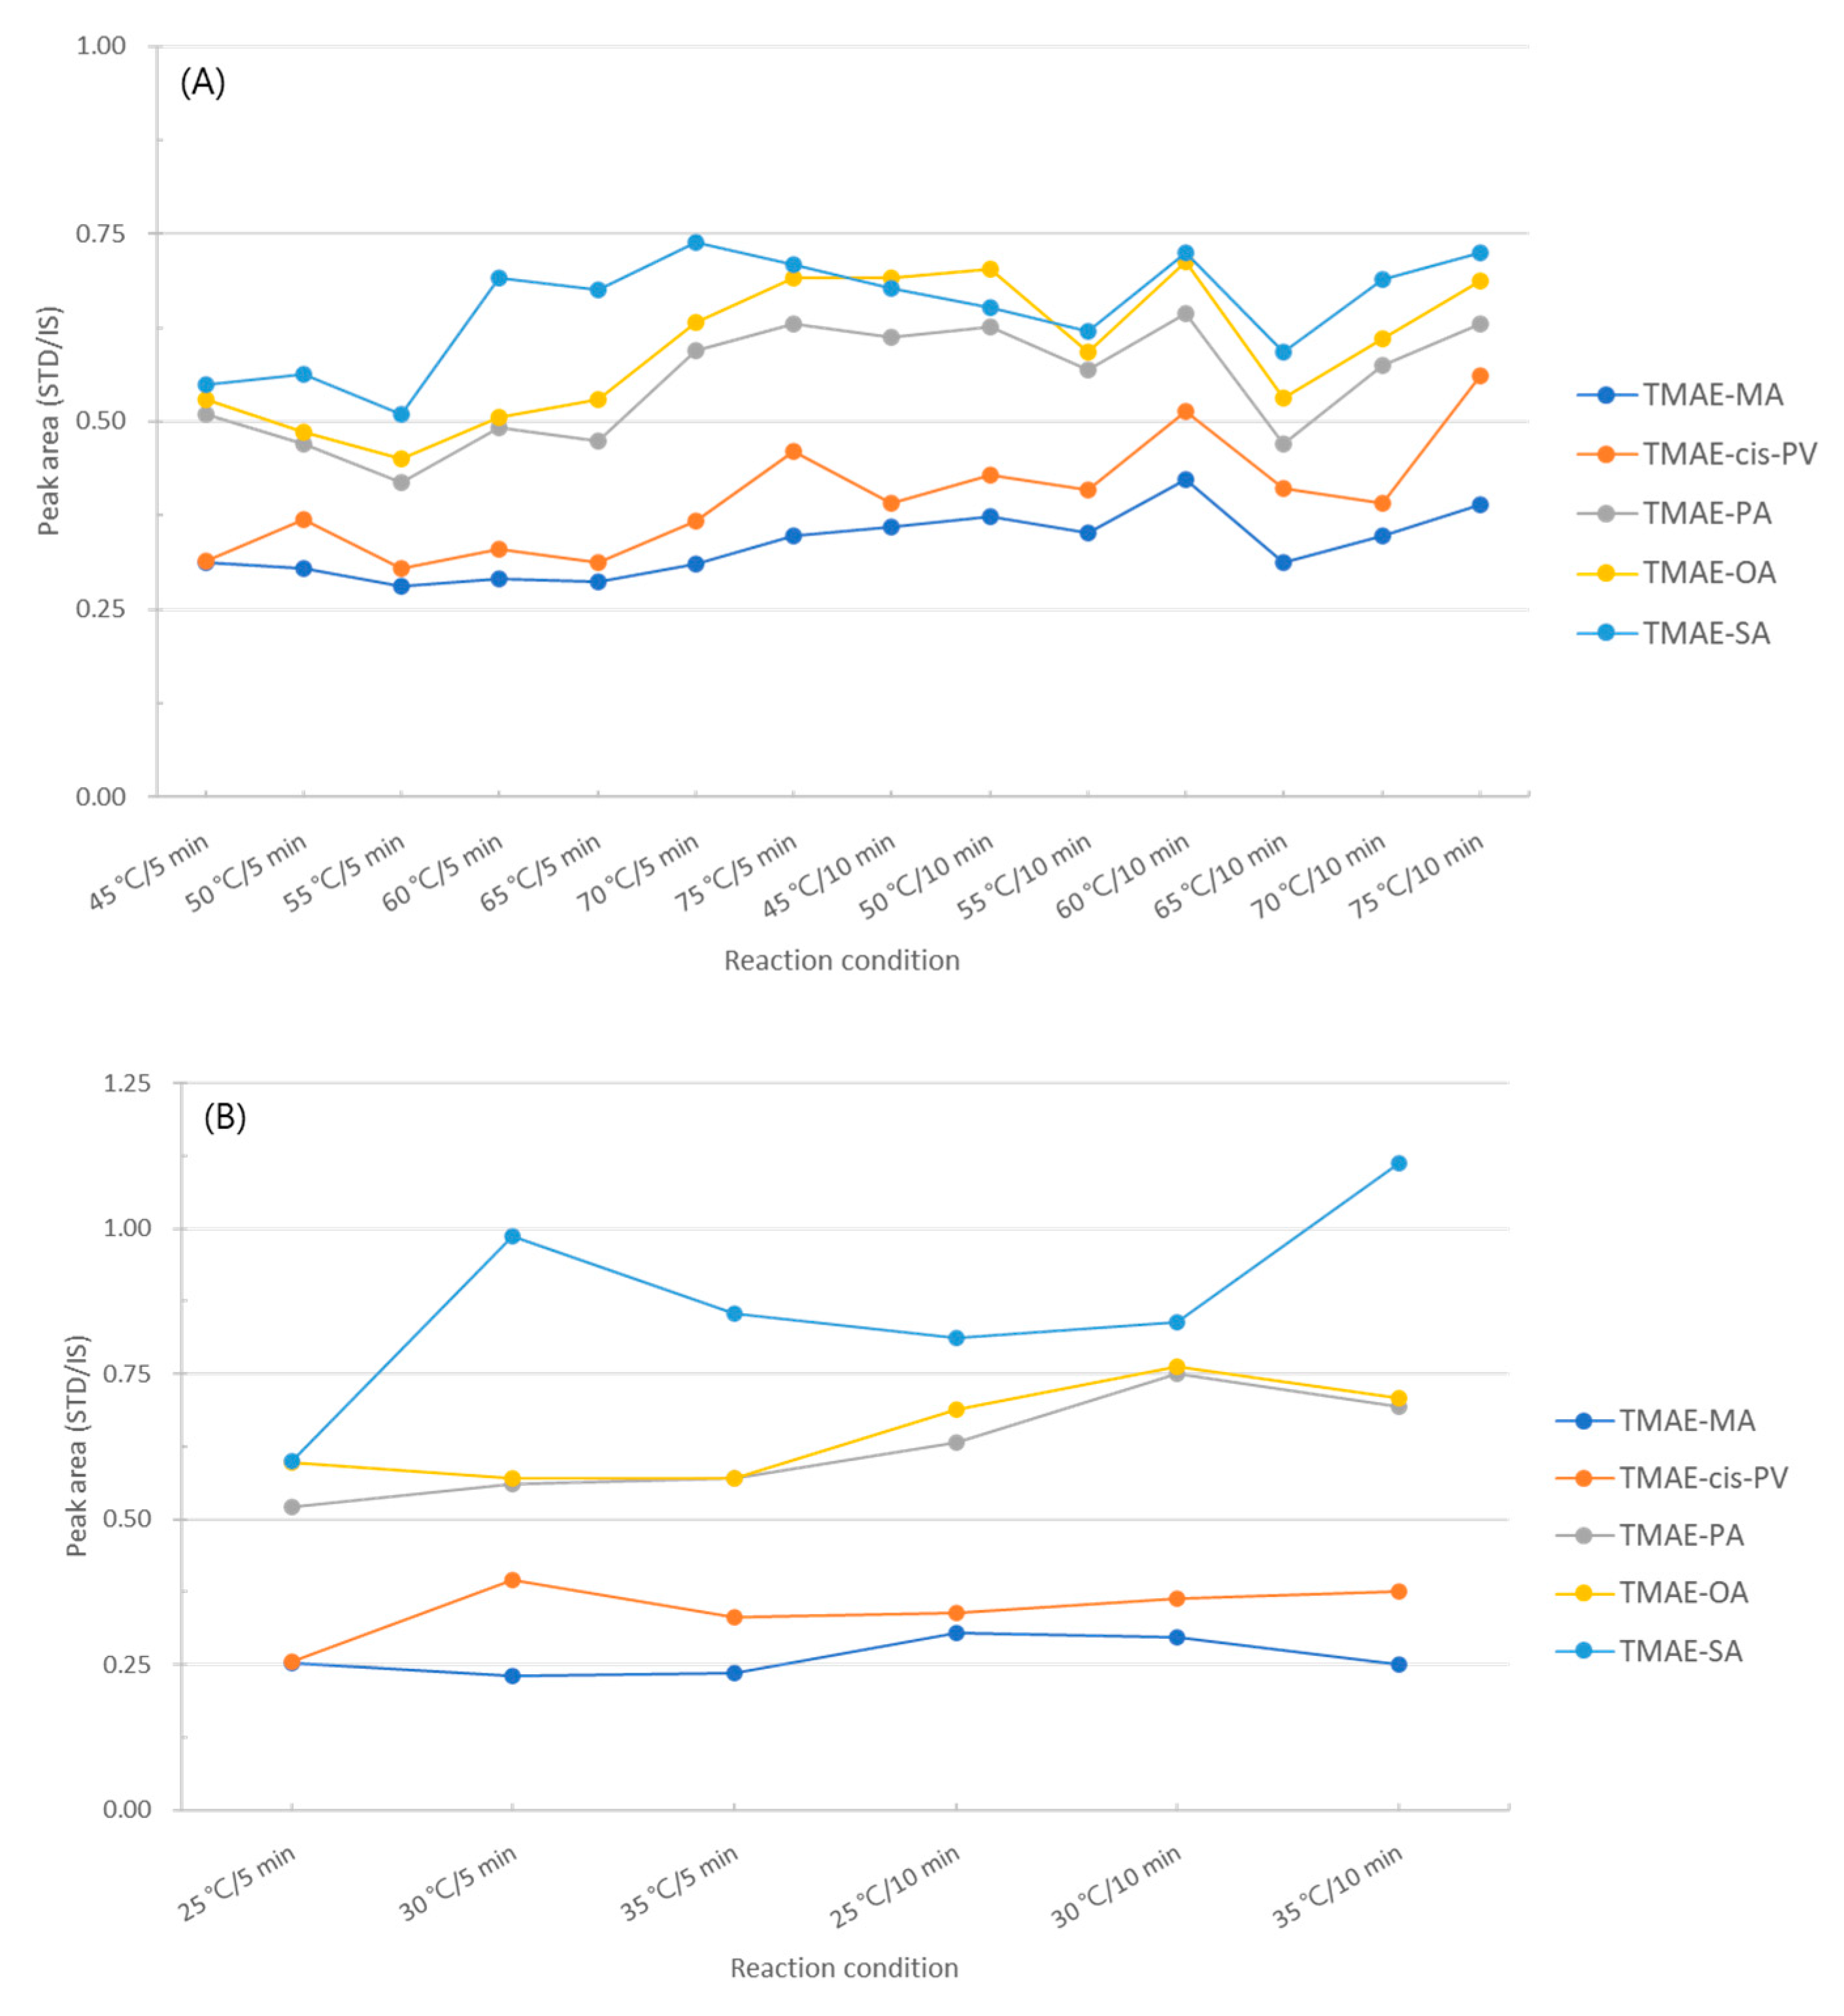
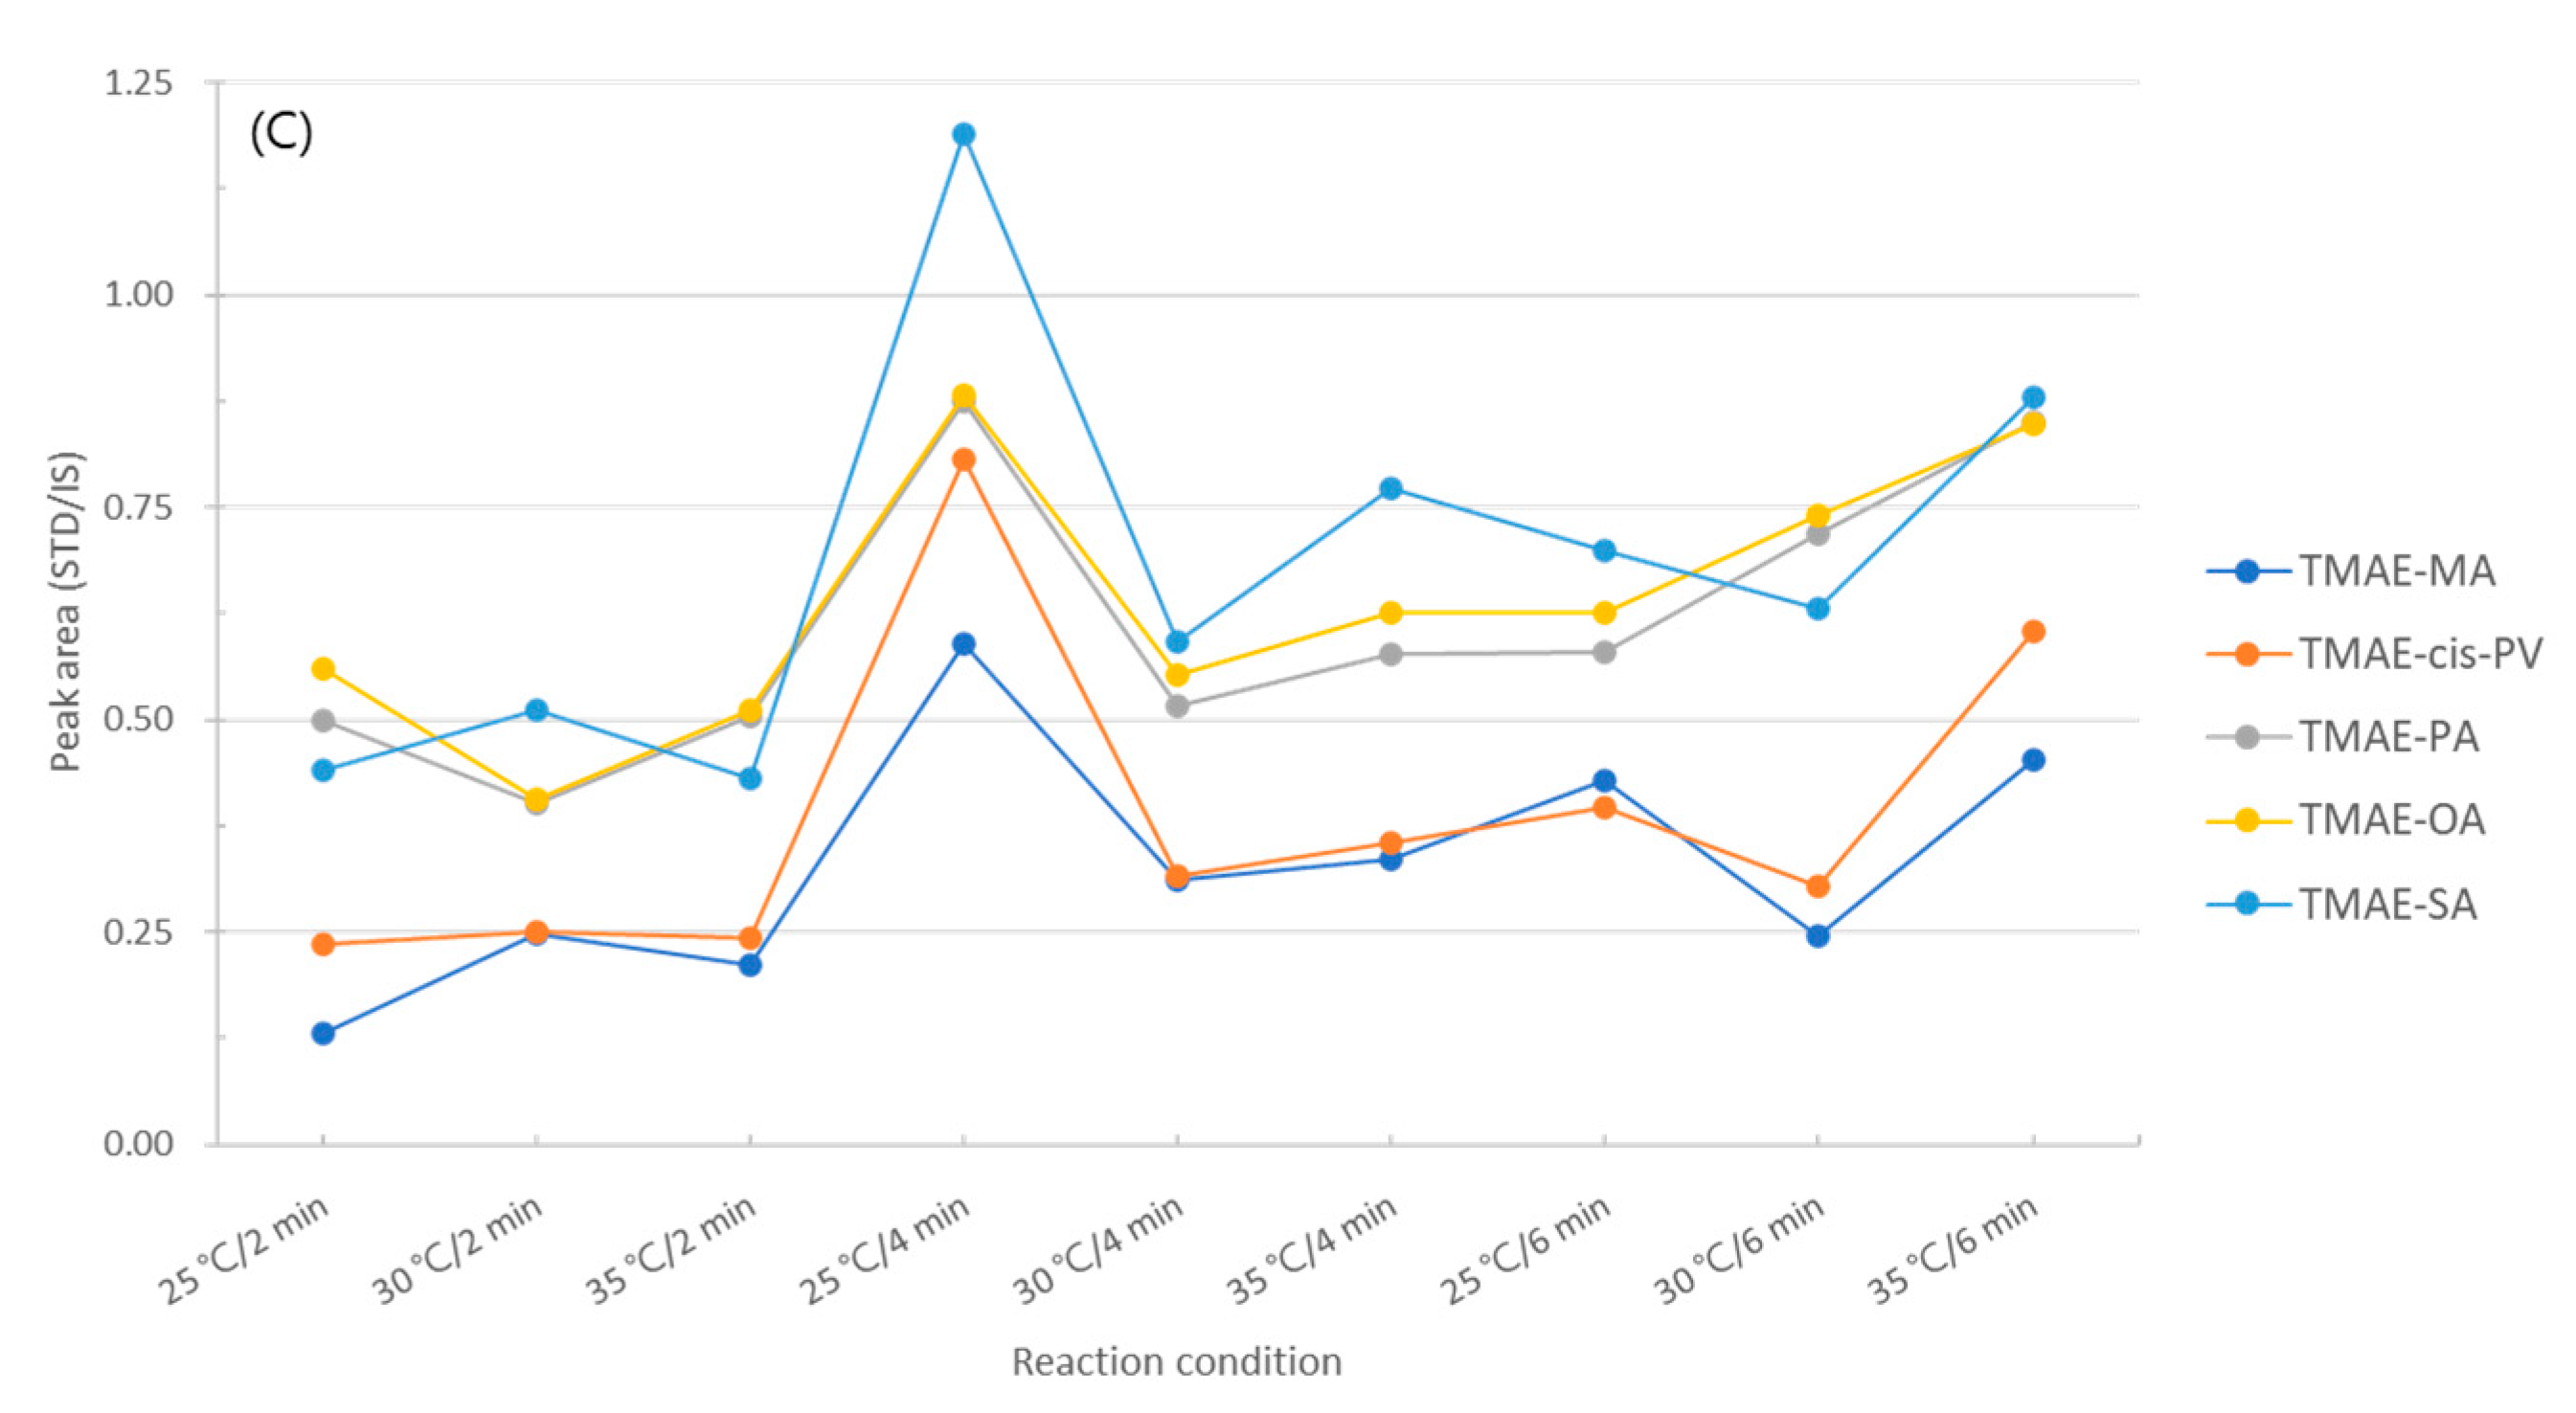
To determine the derivatization efficiency according to the reaction temperature and time, the reaction time was selected as 5 min and 10 min at intervals of 5 °C from 45 °C to 75 °C. The experimental results were compared with the area ratio of standards and internal standard derivatized by TMAE, and although there was a slight difference, the optimal conditions were 75°C and 10 min, which gave the best area values for the five fatty acids overall (
Figure 9A).
The second reaction is to replace chlorine (-Cl), a good leaving group, with dimethylaminoethyl using 2-dimethylaminoethanol, a derivatization reagent. The experiment was conducted at reaction temperatures of 25, 30, and 35 °C, and reaction times of 5 and 10 min. As a result of comparing the reaction conditions, it was confirmed that derivatization was most effective when reacted at 35 °C for 10 min (
Figure 9 B).
The final reaction is an addition of a methyl group for giving cationic properties to the amine of dimethylaminoethyl using iodomethane. The temperature conditions of this reaction were 25, 30, and 35°C, and the reaction time was 2, 4, and 6 min. As a result of the experiment, the highest efficiency was shown at 25℃ for 4 min, and the area ratio more than doubled from the 2 min at 30℃, which showed the lowest efficiency (
Figure 9 C). The optimization of the derivatization conditions of the five types of fatty acids according to the reaction temperature and reaction time is found in
Figure 9.
3.6. Optimization of solid phase extraction conditions
In this study, to find the solvent ratio that maximizes the SPE extraction efficiency of five types of fatty acids, 200 μL of 50 μg/mL standard was added to the blank sample, and 200 μL of 20 μg/mL internal standard was added as post-spiking.
‘Optimization of loading solvent’
Since the background sample and real sample are powders made by freeze-drying large algae and do not dissolve in organic solvents, it is necessary to extract the material to be analyzed first with loading solvent. Previously reported [
24], the most efficient loading solvent used to extract fatty acids from muscle food was hexane: chloroform: methanol mixed solution (95:3:2, v/v/v). However, since the target material in this study is macroalgae, the composition and efficiency of the loading solvent will be different, so the loading solvent must be optimized. Therefore, the solvent composition was selected as a mixture of hexane, chloroform, and methanol, and the extraction efficiency was compared with various solvent ratios.
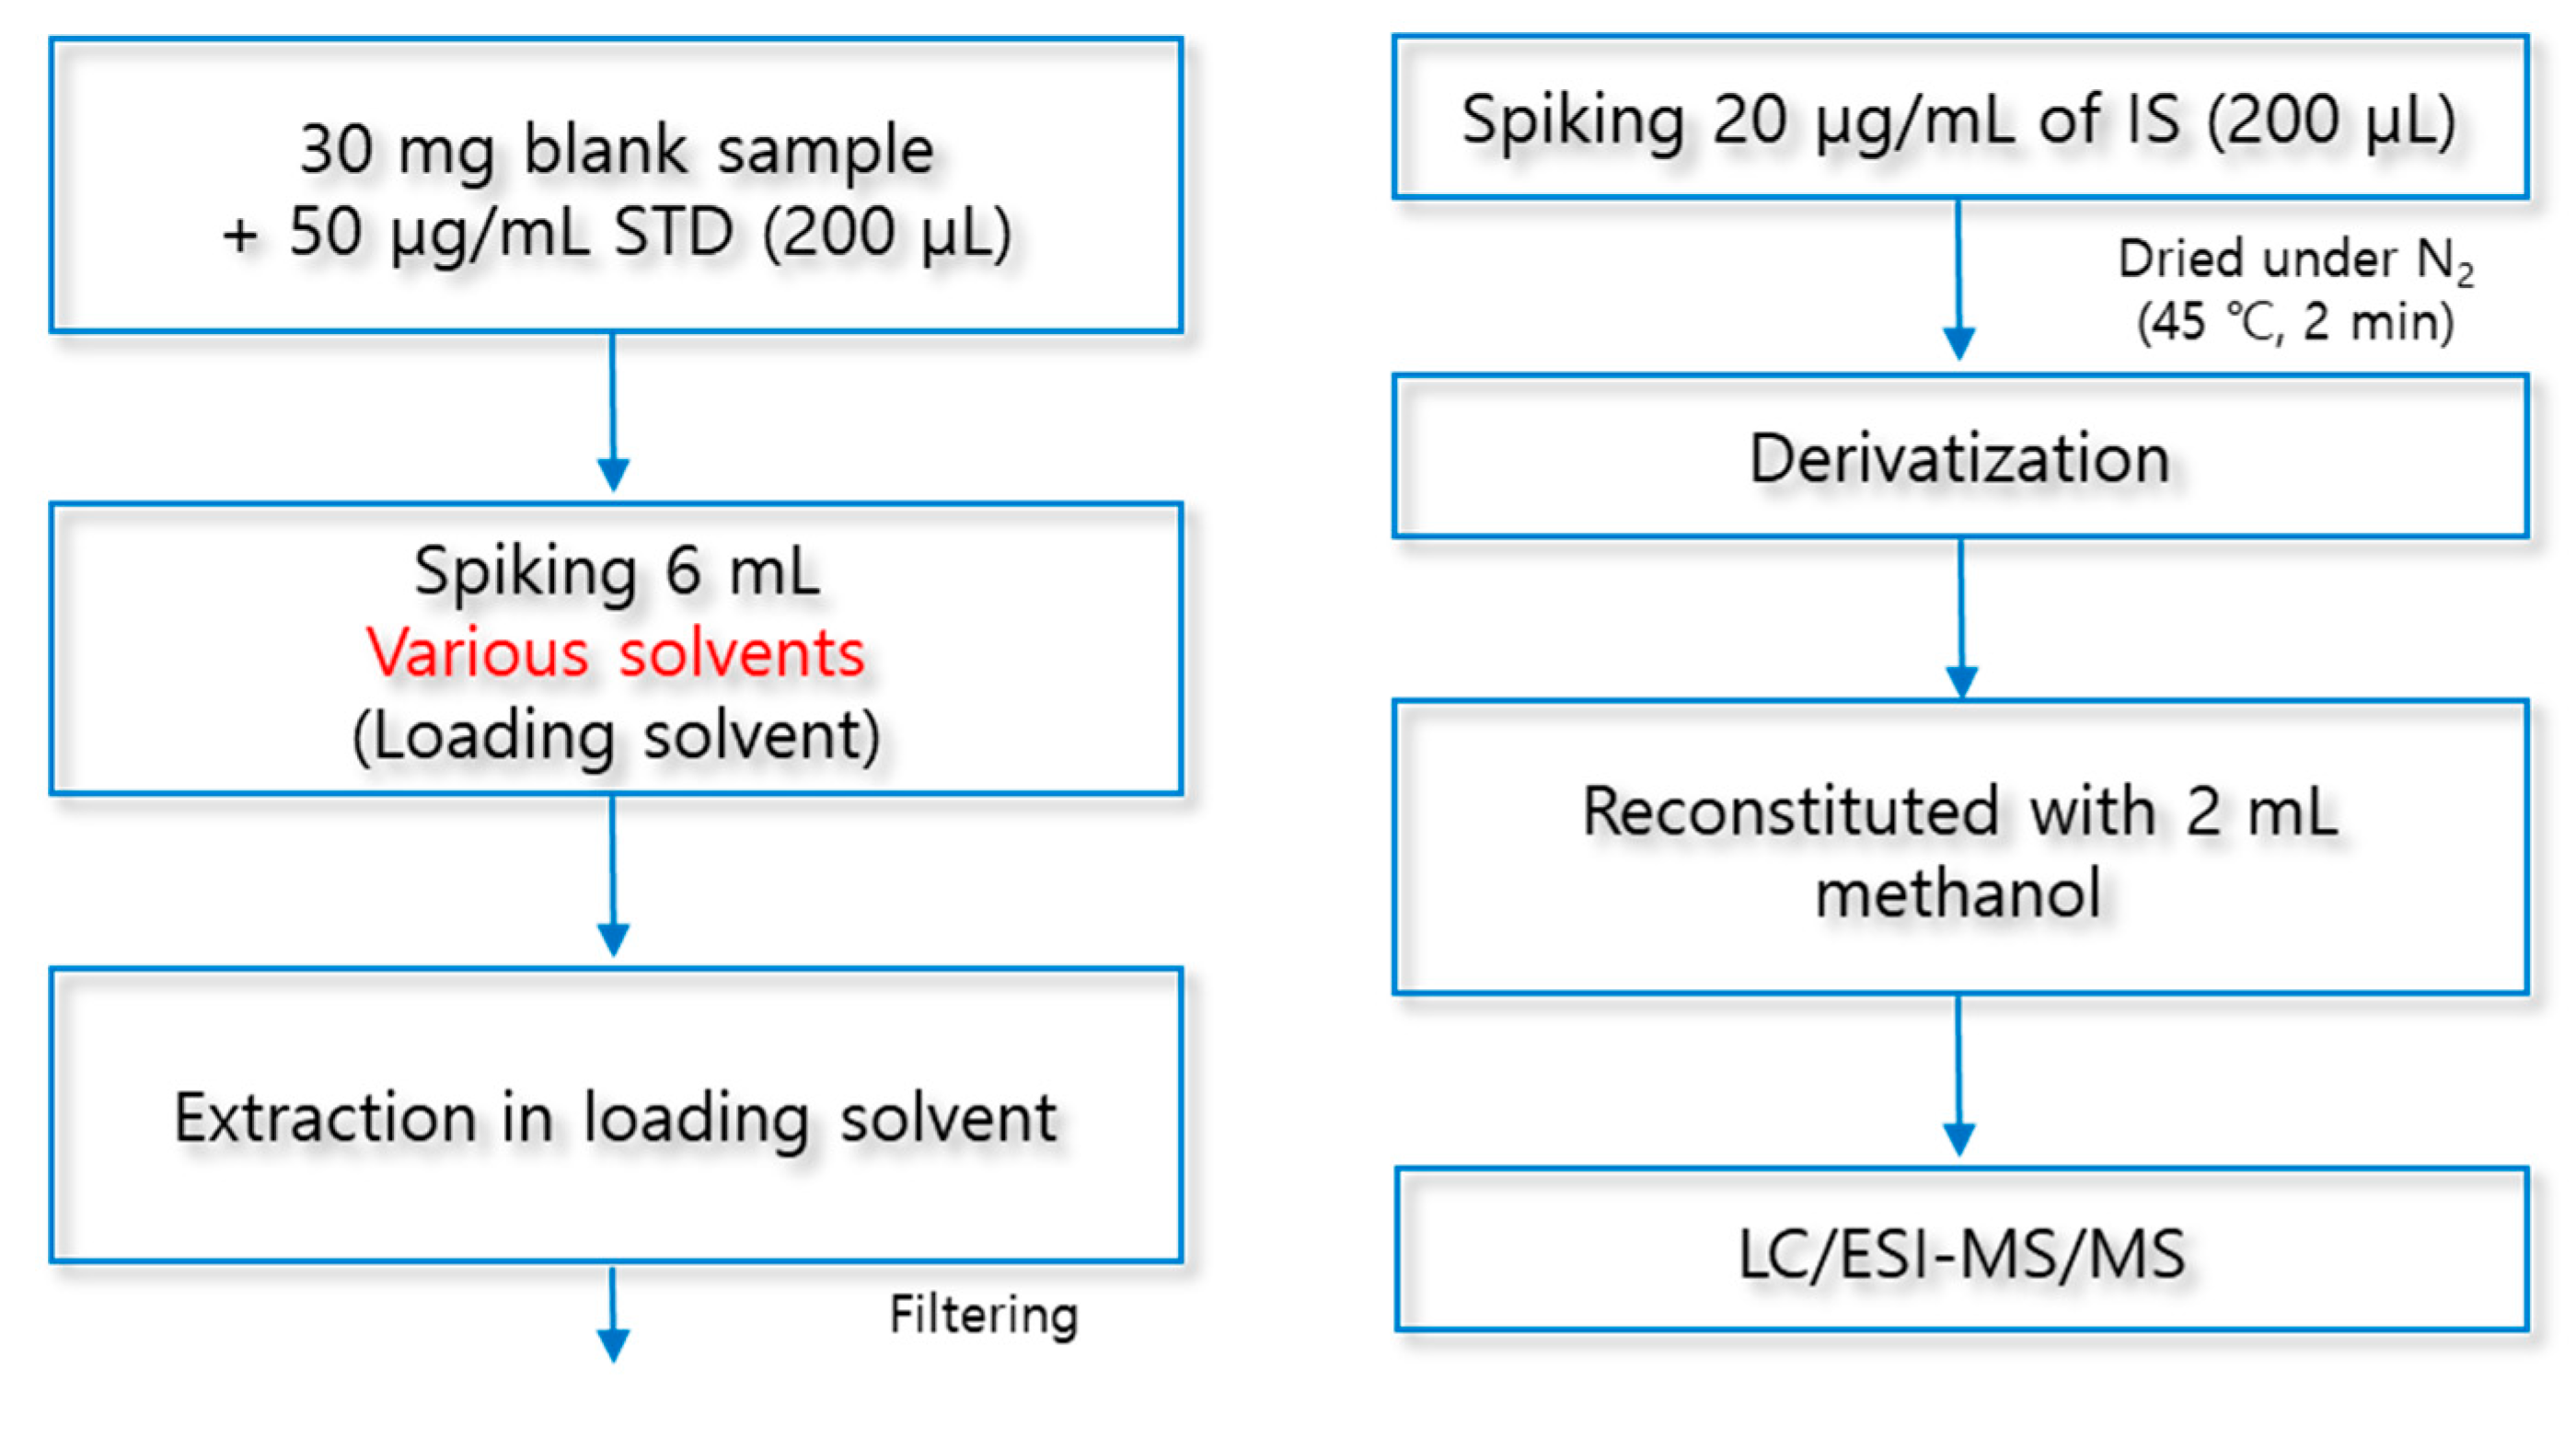
Add 50 μg/mL of fatty acid standard (200 μL) to a 30 mg background sample, 6 mL of various loading solvents to be optimized were added, and stirred for 1 min. After taking an extraction solution using Pasteur pipette, the organic solvent was evaporated and dried under nitrogen gas. The obtained residue was subjected to an aforementioned optimized derivative reaction. The experimental process of the loading extraction solvent is shown in detail in
Figure 10.
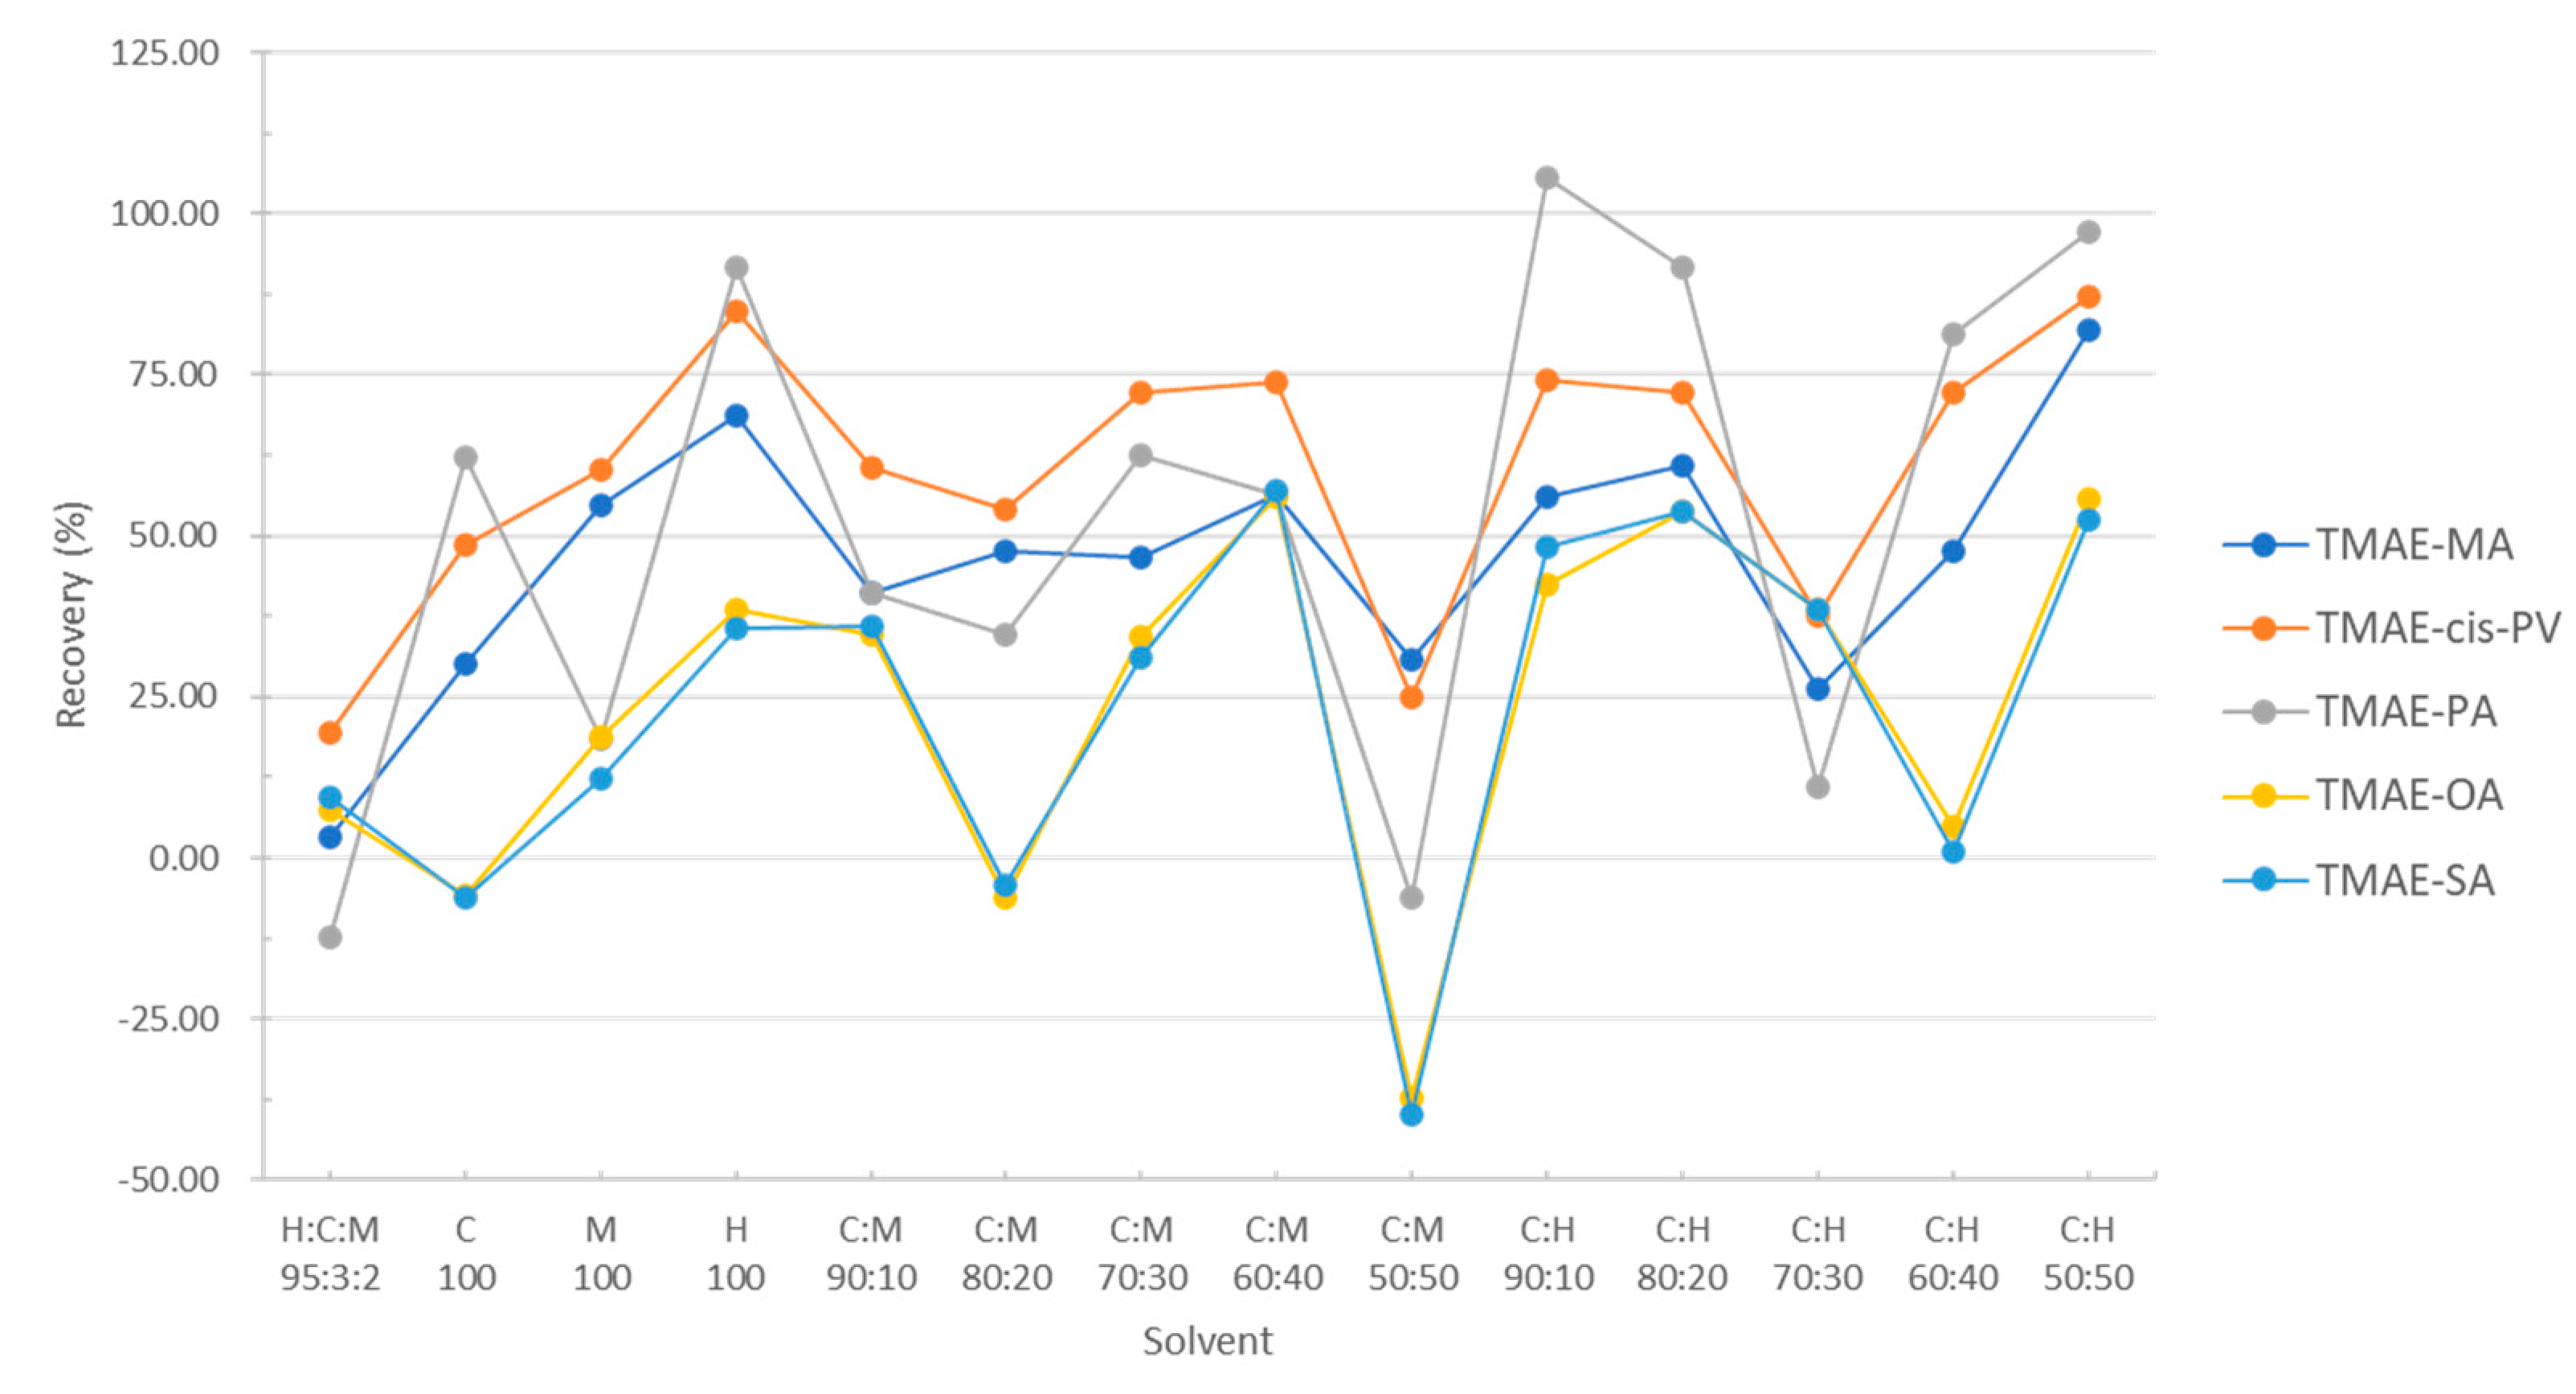
According to the analysis results, the previously reported hexane: chloroform: methanol mixed solution (95:3:2, v/v) showed the lowest extraction efficiency, and the highest recovery rate was found in chloroform: hexane (50:50, v/v). Except for TMAE-OA and TMAE-SA, the rest of the fatty acids had a recovery rate of more than 80%. However, while TMAE-OA and TMAE-SA secure low extraction efficiency in the composition ratio of all the tested solvents, the loading solvent was determined as a mixed solution of chloroform: hexane (50:50, v/v) which showed a better result. (
Figure 11).
‘Optimization of washing solvent’
When the solid sample is loaded, various impurities are stored and maintained at the same time. Therefore, in the washing step, it is important to remove impurities so as not to affect the analysis and not to lose the material to be analyzed. In general [
25], a mixture of chloroform and 2-propanol (2:1, v/v) was used in the washing step, thus dichloromethane and ethyl acetate, which are solvents with a polarity similar to chloroform, were selected in this experiment. In addition, experiments were conducted by selecting methanol, 1-propanol, and ethanol, which are alcohols like 2-propanol, as washing solvents. Additionally, when the two solvents were mixed, acetonitrile and N,N-dimethylformamide, which are solvents with similar polarity, were selected as washing solvents. So we conducted an experiment.
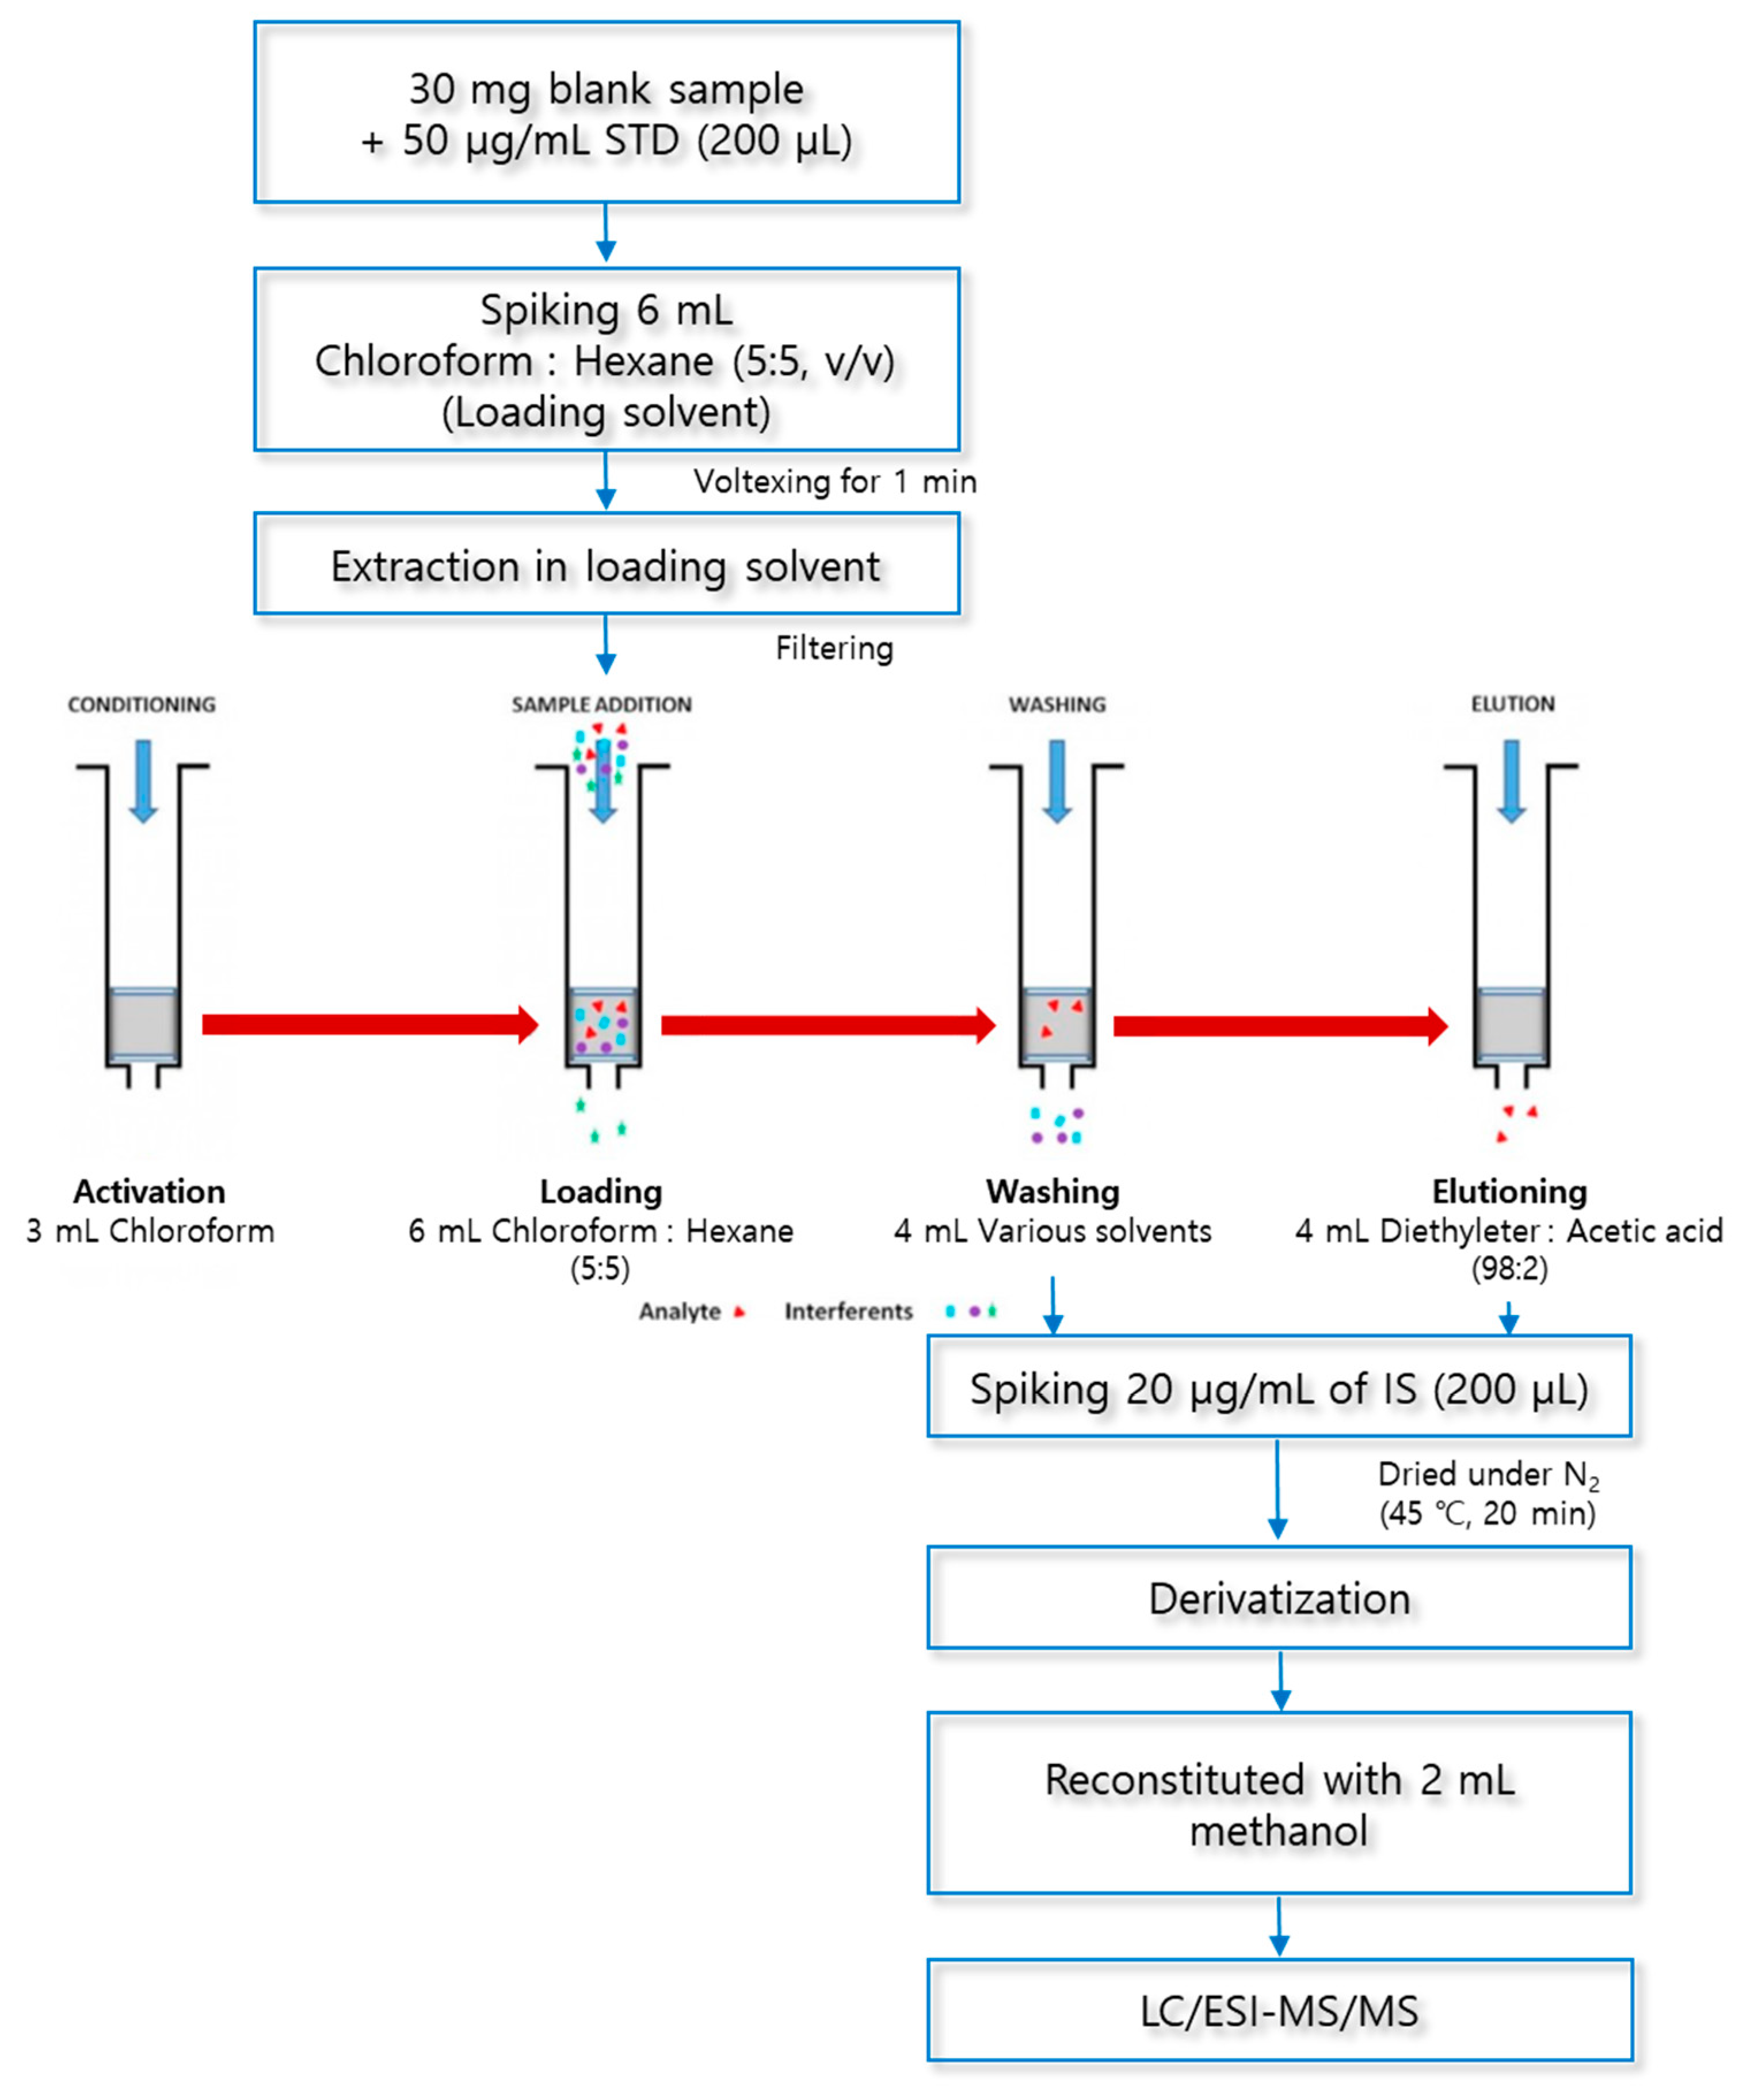
The experimental sequence of the washing solvent is to load the previously extracted loading solvent onto the SPE column activated with 3 mL of chloroform. Add 4 mL of washing solvents to be optimized to remove impurities, and elute fatty acid by using a mixed solution of 4 mL of diethylether and acetic acid (98:2, v/v). (
Figure 12). Recover the washing solvent and the elution solvent, add 20 μg/mL IS (200 μL), and evaporate and dry the organic solvent under nitrogen gas.
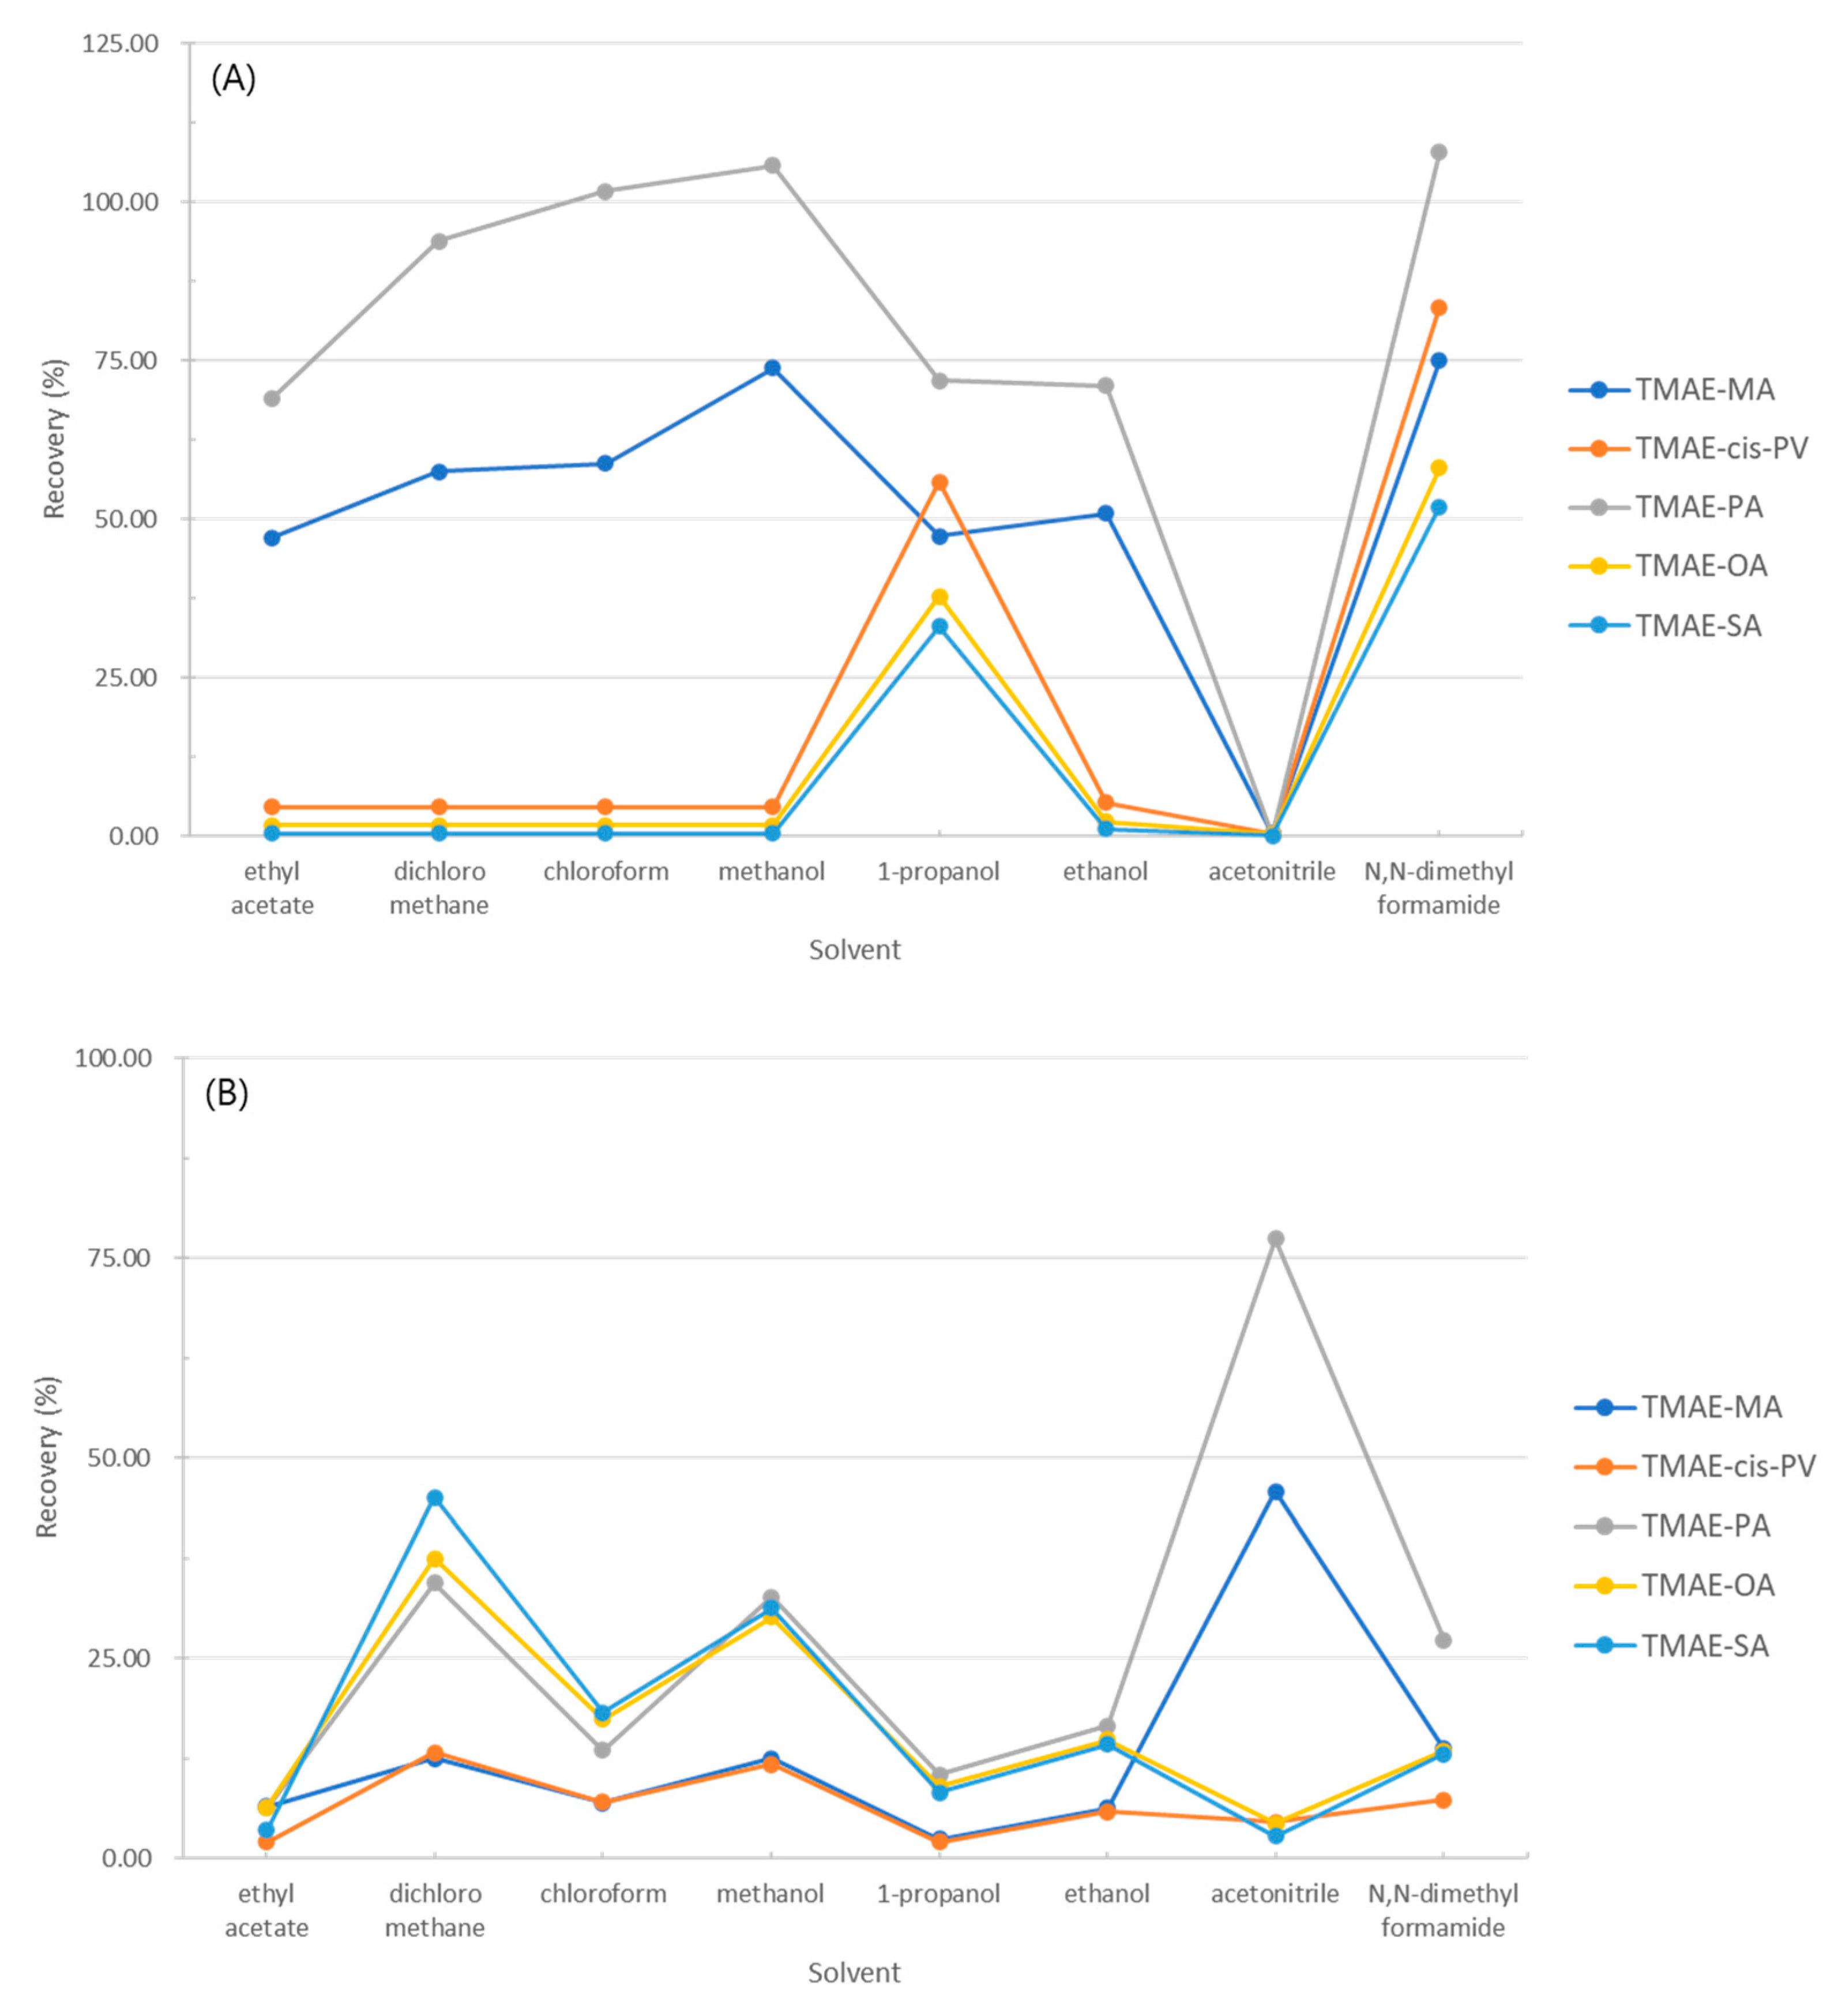
Optimization according to the solvent was calculated as the recovery rate through the control group and the experimental group, and the experimental results were shown in
Figure 13. Fig 13 (A) shows the recovery rate of fatty acids eluted in the elution step, and (B) shows the recovery rate of fatty acids eluted in the washing step.
As a result of the experiment, the recovery rate in the 1-propanol washing step was 2-10% and the recovery rate in the elution step was 33-72%, and N,N-dimethylformamide showed a high recovery rate of 52-108%, but due to its low volatility, it was not selected as a washing solvent. Therefore, the cleaning solvent of the solid phase extraction method was chosen to be 1-propanol.
‘Optimization of elution solvent’
A mixed solution of diethylether and acetic acid (98:2, v/v) was used as an elution solvent for fatty acid extraction in this solid phase extraction method. Recover the washing solvent and the elution solvent, add 20 μg/mL internal standard (200 μL), and evaporate and dry the organic solvent under nitrogen gas. The obtained residue was subjected to an optimized derivatization reaction, reconstituted with 2 mL of methanol, and then analyzed by LC/ESI-MS/MS.
4. Conclusions
The purpose of this study is to develop an extraction method for simultaneous analysis of fatty acids (myristic acid, cis-palmitvaccenic acid, palmitic acid, palmitic acid-9,9-d2, oleic acid, stearic acid) usable in biodiesel fuel in macroalgae were determined using SPE-LC/ESI-MS/MS with trimethylaminoethyl- (TMAE) derivatization.
As the ionization method of the analyte was compared between electrospray ionization (ESI) and Atmospheric Pressure Chemical Ionization (APCI), it was found that higher sensitivity could be obtained with ESI.
The m/z of the parent ion optimized for the determination of the five TMAE derivatives was selected in positive mode, and the parent ion was fragment-ionized at the appropriate ion spray voltage and capillary voltage, and an MRM transition table was prepared for quantitative analysis.
In addition, the optimal gradient elution mobile phase composition conditions for liquid chromatography (LC) to separate five types of TMAE-fatty acids were determined. However, because the structures and splitting mass patterns of fatty acids are similar and their retention times overlap, tandem mass (MS/MS) method was used for accurate quantification.
By introducing TMAE derivatization into the hydroxyl group (-OH) of five types of fatty acids, ionization was improved and high sensitivity was obtained, and the reaction conditions (reaction temperature and retention time) of the three steps of derivatization were optimized.
In this study, a solid phase extraction (SPE) column was introduced for efficient extraction of fatty acids, and the optimal conditions for SPE were set by comparing the recovery rate according to the solvent for each step (loading, washing, and elution) of SPE from macroalgae.
Author Contributions
conceptualization. T. Yum, Y. Kim and K.-J. Paeng; extraction methodology, E. Kim and Y. Kim; separation methodology, E. Kim and S. Choi; writing—original draft preparation, Y. Yum., and K.-J. Paeng; writing—review and editing, T. Yum, E. Kim and K.-J. Paeng; supervision, K.-J. Paeng.
Funding
This research received no external funding.
Conflicts of Interest
The authors have no conflict of interest to declare.
References
- Sheehan, J.; Dunabay, T.; Benemann, J.; Roessler, P. A look back at the US Department of Energy Acquatyic species program: biodiesel from algae. Nat. Renew Energy Lab. 1998, 326. [Google Scholar]
- Ragauskas, A.J.; Williams, C.K.; Davison, B.H.; Britovsek, G.; Cairney, J.; Eckert, C.A.; Frederick, W.J.; Hallett, J.P.; Leak, D.J.; Liotta, C.L.; Mielenz, J.R.; Murphy, R.; Templer, R.; Tschaplinski, T. The Path Forward for Biofuels and Biomaterials. Science 2006, 311, 484–489. [Google Scholar] [CrossRef]
- Sims, R.E.H.; Mabee, W.; Saddler, J.N.; Taylor, M. An overview of second generation biofuel technologies. Bioresour. Technol. 2010, 101, 1570–1580. [Google Scholar] [CrossRef]
- John, R.P.; Anisha, G.S.; Nampoothiri, K.M.; Pandey, A. Micro and macroalgal biomass: a renewable source for bioethanol. Bioresour. Technol. 2011, 102, 186–193. [Google Scholar] [CrossRef]
- Jin, B.; Duan, P.; Xu, Y.; Wang, F.; Fan, Y. Co-liquefaction of micro- and macroalgae in subcritical water. Bioresour. Technol. 2013, 149, 103–110. [Google Scholar] [CrossRef]
- Chisti, Y. Biodiesel from microalgae. Biotechnol. Adv. 2007, 25, 294–306. [Google Scholar] [CrossRef]
- Brennan, L.; Owende, P. Biofuels from microalgae-A review of technologies for production, processing, and extractions of biofuels and co-products. Renew. Sust. Energy Rev. 2010, 14, 557–577. [Google Scholar] [CrossRef]
- Mata, T.M.; Martins, A.A.; Caetano, N.S. Microalgae for biodiesel production and other applications: a review. Renew. Sust. Energy Rev. 2010, 14, 217–232. [Google Scholar] [CrossRef]
- Leite, G.B.; Abdelaziz, A.E.M.; Hallenbeck, P.C. Algal biofuels: challenges and opportunities. Bioresour. Technol. 2013, 145, 134–141. [Google Scholar] [CrossRef] [PubMed]
- Samarakoon, K.; Jeon, Y.J. Bio-functionalities of proteins derived from marine algae – a review. Food Res. Int. 2012, 48, 948–960. [Google Scholar] [CrossRef]
- Maceiras, R.; Rodríguez, M.; Cancela, A.; Urrejola, S.; Sanchez, A. Macroalgae: raw material for biodiesel production. Appl. Energy 2011, 88, 3318–3323. [Google Scholar] [CrossRef]
- Dawczynski, C.; Schubert, R.; Jahreis, G. ; Amino acids, fatty acids, and dietary fibre in edible seaweed products. Food Chem. 2007, 103, 891–899. [Google Scholar] [CrossRef]
- Schlotterbeck, J.; Kolb, A.; Lämmerhofer, M. Free fatty acid profiling in marine algae extract by LC-MS/MS and isolation as well as quantification of the ω-3 fatty acid hexadeca-4,7,10,13-tetraenoic acid. J. Sep. Sci. 2018, 41, 4286–4295. [Google Scholar] [CrossRef] [PubMed]
- Angers, P.; Arul, J. A simple method for regiospecific analysis of triacylglycerols by gas chromatography. J. Am. Oil Chem. Soc. 1999, 76, 481–484. [Google Scholar] [CrossRef]
- Torres, A.; Fuentes, B.; Rodríguez, K.E.; Brito, A.; Díaz, L. Analysis of the Content of Fatty Acid Methyl Esters in Biodiesel by Fourier-Transform Infrared Spectroscopy: Method and Comparison with Gas Chromatography. J. Am. Oil Chem. Soc. 2020, 97, 651–661. [Google Scholar] [CrossRef]
- Ichihara, K.; Masumura, T.; Kohsaka, C.; Yamamoto, Y. Simultaneous Determination of Free Fatty Acids and Esterified Fatty Acids in Rice Oil by Gas Chromatography. J. Am. Oil Chem. Soc. 2021, 98, 149–155. [Google Scholar] [CrossRef]
- Hazmi, B.; Beygisangchin, M.; Rashid, U.; Mokhtar, W.N.A.W.; Tsubota, T.; Alsalme, A.; Ngamcharussrivichai, C. Glycerol-Based Retrievable Heterogeneous Catalysts for Single-Pot Esterification of Palm Fatty Acid Distillate to Biodiesel. Molecules 2022, 27, 7142. [Google Scholar] [CrossRef]
- Konieczna, M.; Olzog, M.; Heipieper, H.J.; Naether, D.J.; Chrzanowski, L. Membrane fatty acid composition and cell surface hydrophobicity of marine hydrocarbonoclastic alcanivorax borkumensis SK2 grown on diesel, biodiesel and rapeseed oil as carbon sources. Molecules 2018, 23, 1432. [Google Scholar] [CrossRef]
- Guihéneuf, F.; Schmid, M.; Stengel, D.B. Lipids and Fatty Acids in Algae: Extraction, Fractionation into Lipid Classes, and Analysis by Gas Chromatography Coupled with Flame Ionization Detector (GC-FID). Natural Products From Marine Algae: Methods and Protocols, Natural Products From Marine Algae 2015, 1308, 173–190. [Google Scholar]
- Hira, K.; Farhat, H.; Sohail, N.; Ansari, M.; Ara, J.; Ehteshamul-Haque, S. Hepatoprotective activity against acetaminophen-induced liver dysfunction and GC-MS profiling of a brown algae Sargassum ilicifolium. Clinical Phytoscience 2021, 7, 40. [Google Scholar] [CrossRef]
- Yamamoto, M.; Watanabe, N.; Baldermann, S.; Yoshikawa, K.; Fujita, A.; Mase, N. Determination of volatile compounds in four commercial samples of japanese green algae using solid phase microextraction gas chromatography mass spectrometry. The Scientific World Journal 2014, 8. [Google Scholar] [CrossRef] [PubMed]
- Brondz, I. Development of fatty acid analysis by high-performance liquid chromatography, gas chromatography, and related techniques. Analytica Chimica Acta 2001, 465, 1–37. [Google Scholar] [CrossRef]
- Mantzourani, C.; Kokotou, M.G. Liquid Chromatography-Mass Spectrometry (LC-MS) Derivatization-Based Methods for the Determination of Fatty Acids in Biological Samples. Molecules 2022, 27, 5717. [Google Scholar] [CrossRef] [PubMed]
- Ruiz, J.; Antequera, T.; Andres, A.I.; Petron, M.J.; Muriel, E. Improvement of a solid phase extraction method for analysis of lipid fractions in muscle foods. Analytica Chimica Acta 2004, 500, 201–205. [Google Scholar] [CrossRef]
- Kim, H.Y.; Salem, N., Jr. Separation of lipid classes by solid phase extraction. J. Lipid Res. 1990, 31, 2285–2289. [Google Scholar] [CrossRef] [PubMed]
Figure 1.
Structural diagram of derivatization method.
Figure 1.
Structural diagram of derivatization method.
Figure 2.
Derivatization of palmitic acid.
Figure 2.
Derivatization of palmitic acid.
Figure 3.
Gradient conditions of mobile phase B (ACN).
Figure 3.
Gradient conditions of mobile phase B (ACN).
Figure 4.
TMAE iodide derivatization of Palmitic acid and its fragmentation on MS/MS analysis.
Figure 4.
TMAE iodide derivatization of Palmitic acid and its fragmentation on MS/MS analysis.
Figure 5.
Full mass spectrum of positive ion mode electrospray ionization (ESI) of (A) stearic acid, (B) TMAE–stearic acid.
Figure 5.
Full mass spectrum of positive ion mode electrospray ionization (ESI) of (A) stearic acid, (B) TMAE–stearic acid.
Figure 6.
Mass spectrum of TMAE-SA using (A) electrospray ionization and (B) atmospheric pressure chemical ionization.
Figure 6.
Mass spectrum of TMAE-SA using (A) electrospray ionization and (B) atmospheric pressure chemical ionization.
Figure 7.
Mass spectrums of precursor ion(left) and product ion(right) of each analytes. (A) TMAE-myristic acid, (B) TMAE-cis-palmitvaccenic acid, (C) TMAE-palmitic acid, (D) TMAE-palmitic acid-9,9-d2, (E) TMAE-oleic acid, (F) TMAE-stearic acid, and (G) TMAE-stearic acid-2,2-d2.
Figure 7.
Mass spectrums of precursor ion(left) and product ion(right) of each analytes. (A) TMAE-myristic acid, (B) TMAE-cis-palmitvaccenic acid, (C) TMAE-palmitic acid, (D) TMAE-palmitic acid-9,9-d2, (E) TMAE-oleic acid, (F) TMAE-stearic acid, and (G) TMAE-stearic acid-2,2-d2.
Figure 8.
(A) Total Ion Chromatogram and SRM Chromatogram of (B) TMAE-myristic acid, (C) TMAE-cis-palmitvaccenic acid, (D) TMAE-palmitic acid, (E) TMAE-palmitic acid-9,9-d2, (F) TMAE-oleic acid, (G) TMAE-stearic acid and (H) TMAE-stearic acid-2,2-d2 of 2 μg/mL cocktail solution.
Figure 8.
(A) Total Ion Chromatogram and SRM Chromatogram of (B) TMAE-myristic acid, (C) TMAE-cis-palmitvaccenic acid, (D) TMAE-palmitic acid, (E) TMAE-palmitic acid-9,9-d2, (F) TMAE-oleic acid, (G) TMAE-stearic acid and (H) TMAE-stearic acid-2,2-d2 of 2 μg/mL cocktail solution.
Figure 9.
Optimization of derivatization conditions (A) oxalyl chloride, (B) 2-dimethylaminoethanol, (C) iodomethane.
Figure 9.
Optimization of derivatization conditions (A) oxalyl chloride, (B) 2-dimethylaminoethanol, (C) iodomethane.
Figure 10.
Experimental procedure for optimized loading solvent.
Figure 10.
Experimental procedure for optimized loading solvent.
Figure 11.
Optimization of loading solvents and mixing ratio.
Figure 11.
Optimization of loading solvents and mixing ratio.
Figure 12.
Experimental procedure for optimized washing solvent.
Figure 12.
Experimental procedure for optimized washing solvent.
Figure 13.
Optimization of washing solvents. Fatty acid recovered from the (A) elution step, and (B) the washing step.
Figure 13.
Optimization of washing solvents. Fatty acid recovered from the (A) elution step, and (B) the washing step.
Table 1.
Operation conditions of liquid chromatography and tandem mass spectrometry for full scan mode and selected ion mode.
Table 1.
Operation conditions of liquid chromatography and tandem mass spectrometry for full scan mode and selected ion mode.
| LC condition |
Mobile phase A : HPLC water (5 mM ammonium acetate)
Mobile phase B : HPLC ACN (5 mM ammonium acetate) |
| Flow rate : 300 μL/min |
| Total run time : 23.33 min |
| Injection volume : 10 μL |
| ESI-MS/MS condition |
| Ion source type : Electospray ionization (ESI) |
| Ionization mode : positive ion mode |
| Scan range : m/z 50 - 500 |
| Capillary Temperature (℃) : 275.0 |
| Sheath gas flow rate(arb) : 35 |
| Aux gas flow rate (arb) : 5 |
| Ion spray voltage (KV) : 6.00 |
| Capillary voltage (V) : 28 |
| Tube lens (V) : 110.0 |
Table 2.
Optimized MRM transition for TMAE–fatty acid standards and Internal standards.
Table 2.
Optimized MRM transition for TMAE–fatty acid standards and Internal standards.
| |
Precursor Mass (m/z) |
Product Mass (m/z) |
Ion spray voltage (KV) |
Capillary voltage (V) |
Collision Energy (%) |
| TMAE-Myristic acid |
314.40 |
255.3 |
6.0 |
22.00 |
28.00 |
| TMAE-cis-Palmitvaccenic acid |
340.4 |
281.3 |
6.0 |
24.00 |
28.00 |
| TMAE-Palmitic acid |
342.4 |
283.4 |
6.0 |
24.00 |
28.00 |
| TMAE-Palmitic acid-9,9-d2
|
344.4 |
285.3 |
6.0 |
20.00 |
28.00 |
| TMAE-Oleic acid |
368.3 |
309.3 |
6.0 |
46.00 |
30.00 |
| TMAE-Stearic acid |
370.4 |
311.4 |
6.0 |
34.00 |
32.00 |
| TMAE-Stearic-2,2-d2 acid |
372.4 |
313.4 |
6.0 |
26.00 |
30.00 |
|
Disclaimer/Publisher’s Note: The statements, opinions and data contained in all publications are solely those of the individual author(s) and contributor(s) and not of MDPI and/or the editor(s). MDPI and/or the editor(s) disclaim responsibility for any injury to people or property resulting from any ideas, methods, instructions or products referred to in the content. |
© 2023 by the authors. Licensee MDPI, Basel, Switzerland. This article is an open access article distributed under the terms and conditions of the Creative Commons Attribution (CC BY) license (http://creativecommons.org/licenses/by/4.0/).
